Disclaimer. This presentation may not be directly or indirectly distributed to or within the United States of America, Australia, Canada or Japan.
|
|
|
- Bonnie West
- 5 years ago
- Views:
Transcription


1 Investor Presentation (addressing 2Q 2014 results) 6 th of August 2014
2 Disclaimer This presentation does not constitute or form any part of any offer or invitation or inducement to sell or issue, or any solicitation of any offer to purchase or subscribe for, any securities of Ronson Europe N.V. (the Company ), nor shall it or any part thereof or the fact of its distribution form the basis of, or be relied on in connection with, any contract therefore. The information in this presentation is subject to change without notice, its accuracy is not guaranteed and it does not contain all material information concerning the Company. Any forecasts and forward-looking statements contained in this presentation are, by necessity, based upon a number of assumptions and estimates that, while considered reasonable by the Company, are inherently subject to significant business, operational, economic and competitive uncertainties and contingencies, many of which are beyond the Company s control, and also upon assumptions with respect to future business decisions that are subject to change. Actual results may differ materially from those projected. Certain numerical information and other amounts and percentages set forth in this presentation may not sum due to rounding. In addition, certain figures herein have been rounded to the nearest whole number. This presentation may not be directly or indirectly distributed to or within the United States of America, Australia, Canada or Japan.
3 Company Overview


 19 further projects (Warsaw, Poznań, Wrocław and")

4 COMPANY SUMMARY Experienced residential real estate developer well established in Poland Present in Poland since 2000 Focused on mid-class residential projects Adequate project mix and size enabling accelerated Company growth Internationally recognized shareholders with decades-worth of sector knowledge Current operations include: 9 projects ongoing and 10 completed projects offered for sale (as at 30 June 2014 Ronson s offer includes 1,010 units) 19 further projects (Warsaw, Poznań, Wrocław and Szczecin) in preparation for nearly 4,500 units Very attractive land bank is Ronson s main advantage deciding about huge growth potential. Very well prepared medium size projects are prepared to start. 1
5 COMPANY SUMMARY, cont. Company highlights in charts (based on Company s financials as at 30 June 2014) Net profit (PLN million) 416 units sold during 1-6/ / ,4 Q ,9 Q2 35,3 93 Q ,4 Q ,6 Q ,6 Q ,2 Q ,4 Q ,9 Q ,7 Q Value of signed contracts (PLN m) Number of units 50% 45% 40% 35% 30% 25% 20% 15% 10% 5% 0% Strong margins record (%) 44% 35% 20% 26% 25% 23% 18% 15% 16% 21% 19% 7% 9% 5% /2014 Gross Margin Net Margin Maximum number of ongoing projects in parallel /2014 2


 Verdis III")

6 ONGOING PROJECTS 1,303 units under preparation with 74,700 m 2, of which 879 units are in Warsaw Sakura III and IV Commenced Q3 and Q Expected completion Q and Q Stage III:145 apartments aggregate area 7,300 m 2 Stage IV:108 apartments and 6 commercial units Aggregate area 6,600 m 2 Location: Warsaw, Mokotów Espresso II Commenced Q3 Expected completion Q apartments and 10 commercial units Aggregate area 7,600 m 2 Location: Warsaw, Wola Moko Commenced Q Expected completion Q apartments and 15 commercial units Aggregate area 11,200 m 2 Location: Warsaw, Mokotów Tamka Commenced Q4 Expected completion Q apartments and 5 commercial units Aggregate area 5,500 m 2 Location: Warsaw, Śródmieście (city center) Verdis III and IV Commenced in Q4 and Q Expected completion Q and Q Verdis III: 140 apartments and 6 commercial units Aggregate area 7,700 m 2 Verdis IV: 78 apartments aggregate area 4,000 m 2 Location: Warsaw, Wola 3


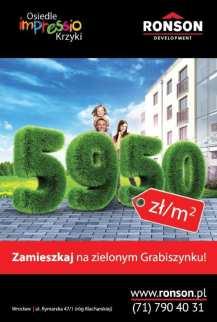
7 ONGOING PROJECTS, cont. 1,303 units under preparation with 74,700 m 2, of which 424 are in Poznań, Wrocław and Szczecin Chilli III Commenced Q3 Expected completion Q units Aggregate area 2,300 m 2 Location: Tulce near Poznań Młody Grunwald II Commenced in Q Expected completion Q apartments and 5 commercial units Aggregate area 8,200 m 2 Location: Poznań, Grunwald Impressio II Commenced in 4Q Expected completion Q apartments Aggregate area 8,400 m 2 Location: Wrocław, Grabiszyn Panoramika II Commenced in 2Q 2014 Expected completion Q apartments Aggregate area 5,900 m 2 Location: Szczecin, Duńska Street 4
 Verdis I and II")


 Location: Konstancin Jeziorna")
8 COMPLETED PROJECTS OFFERED FOR SALE As of 30 June 108 completed units with 8,100 m 2 were offered for sale in 10 projects (4 cities) Verdis I and II As at 30 June, 9 units offered for sale In total 206 apartments and 11 commercial units Location: Warsaw, Wola Espresso I As at 30 June, 3 units offered for sale In total 202 apartments and 8 commercial units Location: Warsaw, Wola Sakura I and II As at 30 June, 11 units offered for sale In total 235 apartments and 21commercial units Location: Warsaw, Mokotów Naturalis I, II and III As at 30 June, 52 units offered for sale In total 172 apartments Location: Łomianki near Warsaw Gemini II As at 30 June, 2 units offered for sale In total 167 apartments and 15 commercial units Location: Warsaw, Ursynów Constans As at 30 June, 1 unit offered for sale In total 34 houses (17 two-family buildings) Location: Konstancin Jeziorna near Warsaw 5


9 COMPLETED PROJECTS OFFERED FOR SALE, cont. As of 30 June 108 completed units with 8,100 m 2 were offered for sale in 10 projects (4 cities) Impressio I As at 30 June, 1 unit offered for sale In total 70 apartments Location: Wrocław, Grabiszyn Chilli II As at 30 June, 2 units offered for sale In total 30 units Location: Tulce near Poznań Panoramika I As at 30 June, 3 units offered for sale In total 90 apartments Location: Szczecin, Duńska Street Młody Grunwald I As at 30 June, 24 units offered for sale In total 136 apartments and 12 commercial units Location: Poznań, Grunwald 6

 Warsaw, Gwiaździsta St 1318 sqm (area")
10 PROJECTS IN PREPARATION Selective geographic diversification in Poland: 7 Cities with strong economic and demographic growth Sales office Completed project: 1 Projects pipeline: - under construction: 1 - addtional land bank: 2 plots Sales office Completed project: 3 Projects pipeline: - under construction: 2 - addtional land bank: 2 plots Sales office Completed project: 1 Projects pipeline: - under construction: 1 - addtional land bank: 5 plots Szczecin Zielona Góra Tri-city Poznań Wrocław Bydgoszcz Łódź Katowice Kraków Olsztyn Warsaw Białystok Lublin Rzeszów Company s Polish head office Completed projects: 20 Projects pipeline: - under construction: 5 - additional land bank: 4 plots Warsaw, KEN Avenue 864 sqm (area used by Ronson head office) Warsaw, Gwiaździsta St 1318 sqm (area leased out) Office for rent: Land Bank*: units; PUM Warsaw: 2,007; 151,500 Poznań: 683; 38,900 Wrocław: 1,007; 67,500 Szczecin: 844; 64,700 Total: 4,541; 322,600 * Projects in preparation, excluding projects (stages) under construction, projects offered for sale that the construction work has not commenced and finished projects.
11 PROJECTS IN PREPARATION, cont. Projects in preparation - Ronson land bank Project name Location Total no. of units PUM (m²) 1 Naturalis - stages in preparation Warsaw ,600 2 Panoramika - stages in preparation Szczecin ,500 3 Chilli - stages in preparation Poznań ,000 4 Espresso - stages in preparation (*) Warsaw ,500 5 Młody Grunwald - stages in preparation Poznań 140 8,000 6 Moko Warsaw ,600 Subtotal - remaining stages of the projects currently under construction/ on sale 1,510 91,200 1 Skierniewicka (**) Warsaw ,900 2 Copernicus Poznań ,200 3 Jasminowa Warsaw ,600 4 Chopin Szczecin ,000 5 Matisse I Wrocław ,400 6 Matisse II Wrocław 100 6,000 7 Falenty Warsaw ,500 8 Picasso Wrocław 158 8,000 9 Renaissance Warsaw , Sadków Wrocław 84 12, Van Gogh Wrocław , Bełchatowska 28 Poznań 50 3, Vivaldi Szczecin 75 11,200 Subtotal - remaining projects, still in preparation 3, ,400 Total 4, ,600 (*) Ronson holds 82% of the project (**) Ronson holds 50% of the project 8
12 Financial Results Review For the six months ended 30 June 2014
13 Financial Results Review six months ended 30 June 2014 Six months ended 30 June 2014, P&L highlights: 339 units delivered to the customers; revenues PLN 113m, Gross margin of 18.7% and net margin of 4.9%, Net profit of PLN 5.5m (PLN 4.2m after minority int.), Admin expenses increased due to costs of sharebased payment plan and increased sales department bonuses. Financial results (PLN m) HY2014 HY % change 2Q2014 2Q % change Y Y Revenues % % % % change Cost of sales (91.9) (84.5) 9% (39.3) (45.4) -13% (164.5) (148.4) 11% Gross profit % % % Changes in the value of investment property - - 0% - - 0% 0.8 (1.0) 0% Selling and marketing expenses (3.7) (3.1) 19% (1.8) (1.6) 13% (6.8) (6.2) 10% Administrative expenses (9.1) (8.1) 12% (4.0) (4.0) 0% (15.9) (16.0) -1% Net other income/(expense) (1.3) (1.1) 18% (0.6) (0.5) 20% (1.9) (0.9) 111% Operating profit % % % Net finance income/(expense) (0.7) (0.7) 0% (0.4) (0.8) -50% (0.3) % Share of profit/(loss) from joint ventures (0.6) (0.6) 0% (0.3) (0.3) 0% (1.3) (0.4) 225% Profit/(loss) before tax % % % Income tax benefit (0.2) % Net profit/(loss) % % % Gross margin 18.7% 23.7% 16.6% 19.6% 20.5% 25.4% Net Margin 4.9% 11.6% 1.7% 6.9% 8.7% 15.7% EPS (PLN) % % % 9
14 Financial Results Review six months ended 30 June 2014, cont. Six months ended 30 June 2014, P&L highlights, cont.: While the IQ results were driven mainly by well-profitable Espresso I and Verdis II projects (gross margin over 20%), the IIQ results were still mainly driven by Espresso I (88 units delivered) and by first stage of Mlody Grunwald project completed in Poznan. Gross margin in Mlody Grunwald I amounted to 7%. Average (net) price of apartments delivered during 1H 2014 amounted to PLN 333 thousand (net of VAT) while during entire it amounted to PLN 437 thousand (net of VAT). Significant decrease in average price of delivered units results from relatively high number of units delivered in Espresso project, which distinguishes by very small average usable area of apartments. Units delivered 1Q2014 2Q /2014 Project Units PLN million Units PLN million Units PLN million G. Margin Espresso I % Verdis I & II % Młody Grunwald I % Sakura I & II % Impressio I % Constans % Naturalis I, II & III % Panoramika I % Chilli I & II % Gemini II % Other N.A 0.6 N.A 0.1 N.A % Total % 10
15 Financial Results Review six months ended 30 June 2014, cont. Balance Sheet / CF data: After positive Q1 operating CF during Q turned negative, mainly due purchase of Jasminowa plot (expense of PLN 44.8 in May 2014 financed with new bonds issue), Stable Net Debt position, Land bank loans gradually replaced by construction project loans and bonds; overall level of banking debt gradually decreasing since Balance Sheet data (PLN m) As of 30 Jun 2014 As of 31 Dec As of 31 Dec Equity Banking debt Floating rate bond Loans from third parties (net) Cash and cash equivalents Inventory Total Assets Net Debt Net debt / Equity 29.9% 24.1% 34.1% Net debt / Total Assets 17.9% 15.0% 19.9% Net assets per share (PLN)
16 Financial Results Review six months ended 30 June 2014, cont. Inventory as of 30 June 2014 PLN million Finished goods 82.3 Ongoing projects Land bank* Total * Including all costs capitalized, i.e. purchase price, transaction costs, land preparation costs, architect planning, financial costs and other. Finished projects of which finished apartments / houses amount to PLN 72.1m, comprising: 225 units 14.7 thousand PUM Attractive bank of lands (4,541 units, 322,600 PUM) Categorised by city: Warsaw 2,007 units; 151,500 PUM Poznań 683 units; 38,900 PUM Wrocław 1,007 units; 67,500 PUM Szczecin 844 units; 64,700 PUM Ongoing projects, of which: Under construction and /or on sale: Sakura III, Sakura IV, Verdis III, Verdis IV, Espresso II, Chilli III, Impressio II, Młody Grunwald II, Tamka, Panoramika II and Moko I. Categorised by book value per PUM: Below PLN 1, ,700 PUM (34%) PLN 1,000 2, ,600 PUM (48%) Over PLN 2,000 57,300 PUM (18%) 12
17 Financial Results Review six months ended 30 June 2014, cont. Debt position as of 30 June 2014 PLN million Loans from third parties (net) 2.7 Floating rate bond Banking debt - Projects under construction and Finished goods 13.2 Banking debt - Projects under preparation 24.6 Total Banking debt Projects under construction Maturity of loans tailored to construction cycle of the projects. Interest expense with respect to projects under construction are capitalized into inventory. Floating rate bonds The amount comprising a loan principal amount of: - PLN 83.5 million tranche C (exp. June 2017) - PLN 23.5 million tranche D (exp. June 2016) - PLN 9.2 million tranche E (exp. July 2016) - PLN 28 million tranche F (exp. May 2018) - PLN 12 million tranche G (exp. January 2018) - PLN 5 million tranche H (exp. February 2018) - plus accrued interest minus one-time costs directly attributed to the bond issuance which are amortized based on the effective interest method. The tranche C bonds and tranche F bonds are secured with the mortgage. Interest expense with respect to the bonds are capitalized into inventory, based on the requirements of IAS 23 as indirect borrowing expenses. Banking debt Projects under preparation Interest expense with respect to non-running projects are capitalized into inventory. 13
18 Financial Results Review six months ended 30 June 2014, cont. 416 units sold during 1-6/ , ,9 35, ,4 50, , , , ,9 76, Company s sales have continued to increase for the past 2 years. 416 units sold during first six months of 2014 with aggregated value close to PLN 162m is the Company s best semi-annual result Q1 Q2 Q3 Q4 Q1 Q2 Q3 Q4 Q Q Value of signed contracts (PLN m) Number of units Number of units sold during 1-6/2014 (416 in total) Completed projects Projects under construction Impressio I 2 Sakura III 48 Chilli I + II 1 Sakura IV 18 Naturalis I + II + III 14 Verdis III 62 Panoramika I 7 Verdis IV 14 Verdis I + II 5 Espresso II 63 Espresso I 16 Impressio II 13 Młody Grunwald I 55 Chilli III 12 Constans 1 Tamka 19 Old projects 2 Młody Grunwald II 10 Panoramika II 6 Moko I 48 Total 103 Total
19 Financial Results Review six months ended 30 June 2014, cont Units offered for sale as end of quarter Since the offer was enlarged in 2Q, the Company continued introducing new projects keeping between 800 to 900 units in its offer. As end of 2Q 2014 the Company s offer exceeded (for the first time) 1000 units. Simultaneously the proportion of completed units in the Company s offer goes down and accounts now for 11%. - Q1 Q2 Q3 Q4 Q1 Q2 Q3 Q4 Q Q Number of units PUM (m2) 15 Units offered for sale 1,010 in total) Completed projects Projects under construction Impressio I 1 Sakura III 68 Chilli I + II 2 Sakura IV 96 Naturalis I + II + III 52 Verdis III 63 Panoramika I 3 Verdis IV 64 Verdis I + II 9 Espresso II 60 Espresso I 7 Impressio II 128 Młody Grunwald I 24 Chilli III 24 Constans 1 Tamka 36 Sakura I + II 11 Młody Grunwald II 127 Gemini II 2 Panoramika II 101 Moko I 131 Total 112 Total 898
20 Financial Results Review six months ended 30 June 2014, cont. Quarterly deliveries (revenues recognized in P&L) , Q ,6 31,0 7,3 Q2 Q3 125,9 Q ,2 56,5 57,3 Q1 Q2 Q ,0 Q ,9 Q ,1 Q ,0 160,0 140,0 120,0 100,0 80,0 60,0 40,0 20,0 - Delivery of 142 units during 2Q 2014 and recognition of revenues in the amount of PLN 47.1 million in line with the Company s plans. As end of June 2014, there were over 500 units sold by the Company not delivered to the customers, of which over 100 were already completed. Number of units PLN (million) Units sold but not delivered (518 units and PLN million in total) Completed projects Units PLN million Projects under construction Units PLN million Chilli I + II Sakura III Naturalis I + II + III Sakura IV Panoramika I Verdis III Verdis I + II Verdis IV Espresso I Espresso II Młody Grunwald I Impressio II Constans Chilli III Sakura I + II Tamka Młody Grunwald II Panoramika II Moko I Total Total
21 Brief summary of Company s achievements during six months 2014 & Outlook for the remainder of 2014 and 2015
22 Company s achievements during six months ended 30 June 2014 and the most recent developments The Company s achievements during six months ended 30 June 2014 include: Record high pre-sales of 416 units, i.e. over 41% yoy increase; Delivery of 339 units to the customers and recognition of revenues in the amount of PLN million; Commencement of construction and sales of 3 projects (Sakura IV, Młody Grunwald II and Verdis IV) including 329 units; Commencement of sales in 2 new projects (Moko I and Panoramika II in Szczecin) including 286 units; Completion of first stage of Espresso project (occupancy permit) including 212 units and first stage of Młody Grunwald including 148 units; Positive operating cash-flow during IQ 2014 turned negative during IIQ 2014 due to purchase of land at Jaminowa Street in Warsaw (expense of PLN 44.8m); Purchase of Jasminowa project was financed by bonds issued in total amount of PLN 45m (all maturing in 2018); Stable net debt position; No write-offs. 17
23 Outlook for the remainder of 2014 The Company s plans for the remainder of 2014 include: Further acceleration of pre-sales to over 650 units during entire 2014 (the plan may be revised as soon as the building permits for Moko I and Espresso II are validated); Delivery of over 500 units to our customers during entire 2014; Preparation and commencement of sales and construction of over 600 units (5 projects, of which 3 are new locations); Completion of construction works in Chili III project comprising 38 units with 2,300 m2 (Poznań); Further strengthening of Ronson s brand name. 18
: Copernicus I, Poznan")
, 134 units, PUM 6,100 m 2 Moreover the")
 Chilli IV: 38 units, PUM 2,300 m")
24 Projects planned for commencement during the remainder of 2014: 603 units in total Three new, attractive locations (including 399 units): Copernicus I, Poznan (JeŜyce), 149 units, PUM 7,800 m 2 Jaśminowa I, Warsaw (Mokotów), 116 units, PUM 10,600 m 2 Skierniewicka I, Warsaw (Wola), 134 units, PUM 6,100 m 2 Moreover the Company prepares further stages of ongoing projects (including 204 units): Espresso III: 166 units, PUM 9,100 m 2 (Warsaw) Chilli IV: 38 units, PUM 2,300 m 2 (Poznań) 19
25 Financial Results Review Outlook for the remainder of 2014 During the next quarters of 2014 the Company may deliver from 150 to 200 units to its customers: total number of units completed but not delivered to customers, as of 30 June 2014, amounted to 225, of which 113 were sold and 112 were available for sale; moreover the Company plans completion of construction of 38 units during remainder of 2014, of which as of end of June 2014, 14 units were already sold and 24 were available for sale. Name of project Projects that may contribute to P&L during the remainder of 2014 Completion Date Signed contracts (PLN million) Units sold (no.) Units for sale (no.) Units in total (no.) Gross margin ( % ) Gemini II Completed % Verdis I and II Completed % Sakura I and II Completed % Naturalis I, II and III Completed % Panoramika I Completed % Constans Completed % Impressio I Completed % Chilli I and II Completed % Espresso I Completed % Młody Grunwald I Completed % Chilli III 2014 Q n/a Total
26 Financial Results Review Outlook for 2015: 1,000 units to be delivered to the customers Construction companies involved in Ronson projects are obliged to receive occupancy permits for over 900 units by end of October Projects that may contribute to P&L during 2015 Name of project Commencement Date Completion Date Units sold (no.) Units for sale (no.) Units in total (no.) Sakura III Q Q Verdis III Q Q Impressio II Q Q Espresso II Q Q Tamka Q Q Młody Grunwald II 2014 Q Q Sakura IV 2014 Q Q Verdis IV 2014 Q Q Chilli IV 2014 Q Q Total ,017 Commencement of construction of Panoramika II, Moko I and of the new projects, including Copernicus I, Jaśminowa I, Skierniewicka I and III stage of Espresso is scheduled for the third and fourth quarter of 2014 and these projects will contribute to the Company s financial results during

27 Appendix

28 SHAREHOLDERS STRUCTURE real estate company with nearly 50 six monthss experience in various housing and commercial projects, listed in Tel-Aviv 11,000 apartments, 400,000 sq. m. of offices, 350,000 sq. m. of shopping centres and 1,700 hotel rooms built in the last decade since April 2011, controlled by Gazit Globe One of the largest owners and operators of supermarketanchored shopping centers in the world. Global City Holdings N.V. ( GCH, previously known as Cinema City International N.V.) as a result of contribution of the cinema operations of Cinema City International N.V. to Cineworld Group Plc, GCH became 24.9 shareholder in Cineworld Group Plc, which currently is the 2nd largest cinema operator in Europe, holding leading market position in Great Britain and CEE region, substantial expertise in development of commercial real estate projects in Poland and in Bulgaria, developer of successful own large standalone cinema projects. Public investors include two Polish pension funds: Amplico OFE (holding 5 10%) ING OFE (holding 5 10%) Public Investors ITR Dori B.V. ITR B.V % 32.1 % General Partnership of ITR Dori and ITR controlling 64.2% of votes in Ronson Europe N.V. 50 % 50 % RN Development Holding B.V. GE Real Estate Residential B.V % 64.2 % 20.5 % In December, I.T.R. B.V. and I.T.R. Dori B.V. entered into a partnership, the ITRD Partnership, which holds the voting rights attached to 174,898,374 shares in the Company representing 64.2% of the total number of shares in the Company, which voting rights were previously held by I.T.R. Dori B.V.. I.T.R. B.V. is a subsidiary of Global City Holdings N.V. (formerly known as Cinema City International N.V.) and I.T.R. Dori B.V. is a subsidiary of U. Dori Group Ltd. On 14 November, the shares in GE Real Estate CE Residential B.V. were (indirectly, through the acquisition of the shares of RN Development Holding B.V.) acquired by I.T.R. B.V. and U. Dori Group Ltd., which due to this transaction increased indirect shareholding in Ronson by 7.67% each. As a result of this transaction Global City Holdings N.V. indirectly controls 39.78% of the Company s shares and U. Dori Group Ltd. indirectly controls also 39.78% of the Company s shares.

 1998 2000 Central Europe Trust (consulting) Andrzej Gutowski (44) Sales and Marketing Director 2003 present")
; Director of Primary Markets; member of the management board Peter Dudolenski (36) Member of the Management Board Chief Executive Director")

 Member of the Management Board CEO of Gazit Globe Israel Development Ltd Previously co-owner of Rokah Ashkenazi Engineers,")
29 MANAGEMENT BOARD Shraga Weisman (63) CEO, President of the Management Board Ashdar Building Company LTD; CEO of the one of largest real-estate development companies in Israel focusing on residential and commercial projects, hotels and protected accommodation projects CEO of the company focusing on residential projects in Natanya Tomasz Lapinski (38) Chief Financial Officer investment banking division of UniCredit Group (formerly CA IB) Central Europe Trust (consulting) Andrzej Gutowski (44) Sales and Marketing Director 2003 present Ronson Europe N.V. (Sales and Marketing Manager) Emmerson Sp. z o.o. (leading real estate agency & advisory company in the Polish market); Director of Primary Markets; member of the management board Peter Dudolenski (36) Member of the Management Board Chief Executive Director of Global City Holdings NV Has been the chief executive officer and president of the management board of Global Parks Poland Sp. z o.o. since From 2006 to 2011, he was the chief executive officer of Real Estate Services Bulgaria EOOD, where he was involved in the development of the Mall of Plovdiv, which opened in 2009, the Mall of Ruse, which opened in 2011 and the Malls of Stara Zagora and Park Tower. Ronen Ashkenazi (52) Member of the Management Board CEO of Gazit Globe Israel Development Ltd Previously co-owner of Rokah Ashkenazi Engineers, Structural Engineering and Project Management Company
Investor Presentation (addressing 4Q 2016 results) 16 th of February 2017
 16 th of February 2017") Investor Presentation (addressing 4Q results) 16 th of February 2017 Disclaimer This presentation does not constitute or form any part of any offer or invitation or inducement to sell or issue, or any
Investor Presentation (addressing 4Q results) 16 th of February 2017 Disclaimer This presentation does not constitute or form any part of any offer or invitation or inducement to sell or issue, or any
Ronson Development SE. Interim Financial Report for the three months ended 31 March 2018
 Interim Financial Report for the three months ended 31 March 2018 Interim Financial Report for the three months ended 31 March 2018 CONTENTS Page Directors report 1 Interim Condensed Consolidated Financial
Ronson Development SE. Interim Financial Report for the six months ended 30 June 2018
 Interim Financial Report for the six months ended 30 June 2018 Interim Financial Report for the six months ended 30 June 2018 CONTENTS Page Directors report 1 Interim Condensed Consolidated Financial Statements
Ronson Europe N.V. Interim Financial Report for the three months ended 31 March 2016
 Interim Financial Report for the three months ended 31 March 2016 Interim Financial Report for the three months ended 31 March 2016 CONTENTS Page Directors report 1 Interim Condensed Consolidated Financial
Ronson Europe N.V. Interim Financial Report for the nine months ended 30 September 2015
 Interim Financial Report for the nine months ended 30 September 2015 Interim Financial Report for the nine months ended 30 September 2015 CONTENTS Page Directors report 1 Interim Condensed Consolidated
Ronson Europe N.V. Interim Financial Report for the six months ended 30 June 2017
 Interim Financial Report for the six months ended 30 June 2017 Interim Financial Report for the six months ended 30 June 2017 CONTENTS Page Directors report 1 Interim Condensed Consolidated Financial Statements
Ronson Europe N.V. Interim Financial Report
 Interim Financial Report for the three months ended 31 March 2010 Consolidated Quarterly Report for the three months ended 31 March 2010 CONTENTS Page Directors report 1 Interim Condensed Consolidated
Ronson Europe N.V. Consolidated Quarterly Report
 Consolidated Quarterly Report for the nine months ended 30 2008 Consolidated Quarterly Report for the nine months ended 30 2008 CONTENTS Page Directors report 1 Condensed Consolidated Financial Statements
Ronson Europe N.V. Semi-annual Report for the six months ended 30 June 2008
 Semi-annual Report for the six months ended 30 June 2008 GENERAL INFORMATION Management Board Dror Kerem Ariel Bouskila (resigned on 23 June 2008) Tomasz Łapiński (as of 23 June 2008) Karim Habra (resigned
Q2 & H Results. 20 August 2013
 Q2 & H1 2013 Results 20 August 2013 AGENDA Sections 1. Q2 & H1 13 highlights 3 2. Portfolio overview 7 3. Key financial results 9 4. Update on ongoing projects 17 2 Q2 & H1 13 HIGHLIGHTS Q2 & H1 13 FINANCIAL
Page 2 of the cover. The last paragraph is changed to read as follows:
 Appendix 4 approved by the Polish Financial Supervision Authority on September 7th 2010, to the Base Prospectus of BRE Bank Hipoteczny S.A., approved by the Polish Financial Supervision Authority on October
Ronson Europe N.V. Annual Report for the year ended 31 December 2008
 Annual Report for the year ended 31 December 2008 GENERAL INFORMATION Management Board Shraga Weisman Tomasz Łapiński Andrzej Gutowski Karol Pilniewicz David Katz Amos Weltsch Supervisory Board Uri Dori
2013 RESULTS INVESTORS PRESENTATION. 20 March 2014
 2013 RESULTS INVESTORS PRESENTATION 20 March 2014 AGENDA 1. 2013 highlights 3 2. Strategy 7 3. Market overview 9 4. Portfolio overview 12 5. Key financial results 17 6. Additional materials 29 2 2013 HIGHLIGHTS
Ronson Europe N.V. Annual Report for the year ended 31 December 2007
 Annual Report for the year ended 31 December 2007 GENERAL INFORMATION Management Board Dror Kerem Ariel Bouskila Karim Habra David Katz Amos Weltsch Supervisory Board Uri Dori Thierry Leleu Mark Segall
Second quarter & half year results
 Second quarter & half year results 22 August 2011 Platinium Business Park, Warsaw, Poland Highlights Galleria Stara Zagora, Bulgaria 2 Main events 19 Avenue, Belgrade, Serbia Sale of Galeria Mokotów Sale
RONSON EUROPE N.V. Please see Risk Factors
 PROSPECTUS RONSON EUROPE N.V. (a limited liability company ( naamloze vennootschap ) incorporated under the laws of the Netherlands, with its corporate seat in Rotterdam) Public Offering of up to 40,000,000
PRESENTATION FOR INVESTORS. September 2018
 PRESENTATION FOR INVESTORS 1 September 2018 1 2 LC CORP GROUP SUMMARY 3Q 2018 Housing sector 1397 units sold 1653 units delivered 889 units in the offer Commercialisation sector Increase in the fair value
DOM DEVELOPMENT S.A. CONSOLIDATED FINANCIAL STATEMENTS FOR THE PERIOD OF 12 MONTHS ENDED ON 31 DECEMBER
 DOM DEVELOPMENT S.A. CONSOLIDATED FINANCIAL STATEMENTS FOR THE PERIOD OF 12 MONTHS ENDED ON 31 DECEMBER 2007 PREPARED IN ACCORDANCE WITH INTERNATIONAL FINANCIAL REPORTING STANDARDS Introduction to the
mbank Hipoteczny S.A.
 Supplement Supplement dated 25 November 2014 mbank Hipoteczny S.A. Issue of Mortgage Covered Bonds for a total amount of EUR 50,000,000 Series HPE9 under the Covered Bond Issue Programme of up to PLN 6,000,000,000
mbank Hipoteczny S.A.
 Supplement Supplement dated 30 July 2014 mbank Hipoteczny S.A. Issue of Mortgage Covered Bonds for a total amount of PLN 200,000,000 Series HPA23 under the Covered Bond Issue Programme of up to PLN 6,000,000,000
mbank Hipoteczny S.A.
 Supplement Supplement dated 30 November 2015 mbank Hipoteczny S.A. Issue of Mortgage Covered Bonds for a total amount of PLN 255,000,000 Series HPA27 under the Covered Bond Issue Programme of up to PLN
Q3&9M 2015 RESULTS INVESTOR PRESENTATION 13 NOVEMBER 2015
 Q3&9M 2015 RESULTS 1 INVESTOR PRESENTATION 13 NOVEMBER 2015 TABLE OF CONTENT 1 Key Highlights Q3 2015 2 Portfolio 3 Operations and Financials 2 1 KEY HIGHLIGHTS Q3 2015 Portfolio and operations Property
DOM DEVELOPMENT S.A. CONDENSED CONSOLIDATED FINANCIAL STATEMENTS FOR THE PERIOD OF THREE MONTHS ENDED ON 31 DECEMBER
 DOM DEVELOPMENT S.A. CONDENSED CONSOLIDATED FINANCIAL STATEMENTS FOR THE PERIOD OF THREE MONTHS ENDED ON 31 DECEMBER 2007 PREPARED IN ACCORDANCE WITH INTERNATIONAL FINANCIAL REPORTING STANDARDS Introduction
PRESENTATION FOR INVESTORS. March 2018r.
 PRESENTATION FOR INVESTORS 1 March 2018r. 1 2 LC CORP GROUP SUMMARY 2017 Housing sector 2029 units sold 1801 units delivered 2154 units added to the offer Commercialisation sector The first fair value
GROSS MARGIN FROM RENTAL ACTIVITY 86M +10%
 ANNUAL RESULTS FOR THE YEAR ENDED 31 DECEMBER 2016 HIGHLIGHTS EPRA NAV/SHARE TOTAL PROPERTY GROSS MARGIN FROM RENTAL ACTIVITY FFO I PROFIT FOR THE PERIOD PLN 8.62 1,624m 86M 43M 160M +20% +23% +10% +13%
STRONG GROWTH MOMENTUM 65M +10% 71M +220% 33M +14% 837M +8% 1,544m +17% 9M 2016 RESULTS NOI PROFIT BEFORE TAX FFO EPRA NAV TOTAL PROPERTY
 9M 2016 RESULTS STRONG GROWTH MOMENTUM NOI PROFIT BEFORE TAX FFO EPRA NAV TOTAL PROPERTY 65M +10% 71M +220% 33M +14% 837M +8% 1,544m +17% 9M 2016 HIGHLIGHTS NOI increased by 10% to 65m ( 59m in 9M 2015)
ANALYSIS OF TRANSACTION PRICES AND FORECASTS FOR THE RESIDENTIAL MARKET IN POLAND - PRIMARY AND SECONDARY MARKETS WARSAW, FEBRUARY 2015
 ANALYSIS OF TRANSACTION PRICES AND FORECASTS FOR THE RESIDENTIAL MARKET IN POLAND - PRIMARY AND SECONDARY MARKETS WARSAW, FEBRUARY 2015 INTRODUCTION Dear Readers, We are pleased to present the second edition
COMPANY PRESENTATION. November 2018 ATRIUM PROMENADA WARSAW
 COMPANY PRESENTATION November 2018 ATRIUM PROMENADA WARSAW ATRIUM A UNIQUE INVESTMENT OPPORTUNITY Dominant, high quality urban assets in Poland and Czech In Oct. 2018, Atrium acquired Wars Sawa Junior
PRESENTATION FOR INVESTORS. May 2018
 PRESENTATION FOR INVESTORS 1 May 2018 1 2 AGENDA Market environment Financials Residential projects Commercial property Attachments 3 UPWARD TREND ON HOUSING MARKET MAINTAINED Flats for sale and sold yearly
Results presentation H1 2017
 Results presentation H1 2017 DISCLAIMER Neither this presentation (the Presentation ), nor any copy of it, nor the information contained herein is being issued or may be distributed directly or indirectly
STRONG OPERATING PERFOMANCE ALLOWS TO PROPOSE DIVIDEND OF PLN 0.27 PER SHARE 86M
 2016 RESULTS STRONG OPERATING PERFOMANCE ALLOWS TO PROPOSE DIVIDEND OF PLN 0.27 PER SHARE EPRA NAV/SHARE PLN 8.62 +20% TOTAL PROPERTY 1,624m +23% GROSS MARGIN FROM RENTAL ACTIVITY 86M +10% FFO I 43M +13%
NOI MARGIN FFO EPRA NAV NET DEBT NET LTV 779M +27%
 2015 RESULTS GTC EXECUTES ITS GROWTH STRATEGY NOI MARGIN FFO EPRA NAV NET DEBT NET LTV 75% 38M 779M 522M 39% +100bps +38% +27% -25% -146bps EXECUTION OF THE GROWTH STRATEGY Restructuring and repositioning
GTC AUGMENTS ACCOMPLISHMENTS THROUGH ACQUISITIONS, DEVELOPMENTS AND ACTIVE ASSET MANAGEMENT 797M
 Q1 2016 RESULTS GTC AUGMENTS ACCOMPLISHMENTS THROUGH ACQUISITIONS, DEVELOPMENTS AND ACTIVE ASSET MANAGEMENT NOI MARGIN FFO EPRA NAV NET DEBT NET LTV 76% 11M 797M 600M 43% +200bps +27% +2% +15% +380bps
GTC EXPANDS COMPANY S OPERATIONS AND DEVELOPMENT AND CONTINUE TO SECURE LONG TERM FINANCING THROUGH NEW BONDS, FINANCING AND REFINANCING ACTIVITY 0.
 H1 2017 RESULTS GTC EXPANDS COMPANY S OPERATIONS AND DEVELOPMENT AND CONTINUE TO SECURE LONG TERM FINANCING THROUGH NEW BONDS, FINANCING AND REFINANCING ACTIVITY EPRA NAV/SHARE FFO I/SHARE EARNINGS/ SHARE
Financial and operating results Q November 2018
 Financial and operating results Q3 2018 29 November 2018 AGENDA Executive summary Operating data Financial data Attachments 2 EXECUTIVESUMMARY 3 Executive summary PLN 185.1 million sales revenue for the
Q RESULTS FOR THE THREE-MONTH PERIOD ENDED 31 MARCH 2017
 Q1 2017 RESULTS FOR THE THREE-MONTH PERIOD ENDED 31 MARCH 2017 HIGHLIGHTS EPRA NAV/SHARE FFO I/SHARE EARNINGS/ SHARE 2.03 +4% Q1 2017 HIGHLIGHTS 0.026 +18% PORTFOLIO UPDATE 0.07 +96% Development profit
MIRLAND DEVELOPMENT CORPORATION PLC ( MirLand / Company ) UNAUDITED INTERIM CONSOLIDATED REPORT FOR THE NINE MONTHS ENDED 30 SEPTEMBER 2010
 UNAUDITED INTERIM CONSOLIDATED REPORT FOR THE NINE MONTHS ENDED 30 SEPTEMBER 2010") 17 November 2010 MIRLAND DEVELOPMENT CORPORATION PLC ( MirLand / Company ) UNAUDITED INTERIM CONSOLIDATED REPORT FOR THE NINE MONTHS ENDED 30 SEPTEMBER 2010 MIRLAND CONTINUES TO GROW INCOME AS RUSSIAN
17 November 2010 MIRLAND DEVELOPMENT CORPORATION PLC ( MirLand / Company ) UNAUDITED INTERIM CONSOLIDATED REPORT FOR THE NINE MONTHS ENDED 30 SEPTEMBER 2010 MIRLAND CONTINUES TO GROW INCOME AS RUSSIAN
HIGHLIGHTS 46M 828M 41M 1,455 22M +310% +5% +10% +14% +6% TOTAL PROPERTY NOI PROFIT BEFORE TAX FFO EPRA NAV H HIGHLIGHTS PORTFOLIO UPDATE
 INTERIM RESULTS FOR THE SIX MONTHS PERIOD ENDED 30 JUNE 2016 HIGHLIGHTS NOI PROFIT BEFORE TAX FFO EPRA NAV TOTAL PROPERTY 41M 46M 22M 828M 1,455 +5% +310% +14% +6% +10% H1 2016 HIGHLIGHTS NOI increased
THE POLSKI HOLDING NIERUCHOMOŚCI SPÓŁKA AKCYJNA GROUP
 THE POLSKI HOLDING NIERUCHOMOŚCI SPÓŁKA AKCYJNA GROUP Selected financial data Wybrane skonsolidowane dane finansowe Period ended in PLN million Period ended Period ended in EUR million Period ended I.
SEPARATE ANNUAL REPORT OF ECHO INVESTMENT S.A.
 2017 SEPARATE ANNUAL REPORT OF ECHO INVESTMENT S.A. CONTENTS Message from CEO 3 CHAPTER 1 5 Separate financial report of Echo Investment S.A. for 2017 5 CHAPTER 2 12 Explanatory notes 12 Explanatory notes
CONSOLIDATED INTERIM REPORT OF GLOBE TRADE CENTRE S.A. CAPITAL GROUP FOR THE SIX-MONTH PERIOD ENDED 30 JUNE 2016
 CONSOLIDATED INTERIM REPORT OF GLOBE TRADE CENTRE S.A. CAPITAL GROUP FOR THE SIX-MONTH PERIOD ENDED 30 JUNE 2016 Place and date of publication: Warsaw, 24 August 2016 GLOBE TRADE CENTRE S.A. MANAGEMENT
Chapter II. Section 1. The following text is added at the beginning:
 Appendix 26 approved by the Polish Financial Supervision Authority on September 2nd 2015, to the Base Prospectus of of mbank Hipoteczny S.A. (formerly BRE Bank Hipoteczny S.A.), approved by the Polish
MANAGEMENT BOARD REPORT ON THE OPERATIONS OF ROBYG S.A. FOR THE YEAR ENDED 31 DECEMBER 2013
 MANAGEMENT BOARD REPORT ON THE OPERATIONS OF ROBYG S.A. FOR THE YEAR ENDED 31 DECEMBER 2013 Warsaw, 19 March 2014 1 1. BASIC INFORMATION ABOUT THE COMPANY ROBYG S.A., a joint-stock company (the Company
Chapter II. Section 1. The following text is added at the beginning:
 Appendix 21 approved by the Polish Financial Supervision Authority on September 4th 2014, to the Base Prospectus of mbank Hipoteczny S.A. (formerly BRE Bank Hipoteczny S.A.), approved by the Polish Financial
This document is a translation of a document originally issued in Polish. The only binding version is the original Polish version.
 PKO Bank Hipoteczny SA Directors Report for the year ended 31 December 2017 Table of Contents 1. INTRODUCTION... 3 2. EXTERNAL OPERATING CONDITIONS... 4 The macroeconomic environment... 4 Residential real
Q RESULTS. WARSAW, 15th of NOVEMBER 2017
 Q3 2017 RESULTS WARSAW, 15th of NOVEMBER 2017 1 AGENDA Q1-Q3 2017 OVERVIEW Review of Real Estate Portfolio Financial results for Q3 2017 Strategy review 2 Q1-Q3 2017 OVERVIEW Issue of bonds in total amount
QI 2013 FINANCIAL RESULTS
 Warsaw, May 22 nd 2013 INVESTOR PRESENTATION QI 2013 FINANCIAL RESULTS POLNORD SA CAPITAL GROUP DISCLAIMER This report has been prepared solely for information purposes and is not intended to incite to
Condensed Consolidated Interim Financial Information
 Condensed Consolidated Interim Financial Information For the six month period ended June 30, 2009 Condensed Consolidated Interim Financial Information June 30, 2009 Contents Page Independent report on
Transformational 692m Retail Portfolio Acquisition. December 2017
 Transformational 692m Retail Portfolio Acquisition December 2017 EPP Mission Building a national retail champion that leverages both its scale and relationships to provide a leading and cash-generating
ATLAS ESTATES LIMITED CONDENSED CONSOLIDATED QUARTERLY REPORT FIRST QUARTER 2017
 CONDENSED CONSOLIDATED QUARTERLY REPORT FIRST QUARTER 2017 Atlas Estates Limited Martello Court Admiral Park St Peter Port Guernsey GY1 3HB Company number: 44284 Contents Page 3 Financial Highlights 4
CONSOLIDATED QUARTERLY REPORT OF GLOBE TRADE CENTRE S.A. CAPITAL GROUP FOR THE THREE AND NINE-MONTH PERIODS ENDED 30 SEPTEMBER 2017
 CONSOLIDATED QUARTERLY REPORT OF GLOBE TRADE CENTRE S.A. CAPITAL GROUP FOR THE THREE AND NINE-MONTH PERIODS ENDED 30 SEPTEMBER 2017 Place and date of publication: Warsaw, 13 November 2017 GLOBE TRADE CENTRE
ATLAS ESTATES LIMITED CONDENSED CONSOLIDATED QUARTERLY REPORT THIRD QUARTER 2016
 CONDENSED CONSOLIDATED QUARTERLY REPORT THIRD QUARTER Atlas Estates Limited Martello Court Admiral Park St Peter Port Guernsey GY1 3HB Company number: 44284 Contents Page 3 Financial Highlights 4 Chairman
SEMI-ANNUAL REPORT, JANUARY 1 JUNE 30, 2012
 SEMI-ANNUAL REPORT, JANUARY 1 JUNE 30, 2012 1 Second Quarter, April June 2012 Net sales amounted to 260 645 Euro Operating loss amounted to 277 361 Euro Losses after taxes amounted to 812 866 Euro Losses
Presentation for Bondholders Meeting. 28 August 2018
 Presentation for Bondholders Meeting 28 August 2018 1 DISCLAIMER The information detailed in this presentation is subject to the general reservations and the risk factors detailed herein. This presentation
Summary of Makuliński Moczydłowski Rostafiński Włodawiec Kancelaria Radców Prawnych i Adwokatów Prokurent sp.p.
 Summary of 2017 Makuliński Moczydłowski Rostafiński Włodawiec Kancelaria Radców Prawnych i Adwokatów Prokurent sp.p. 1 Our clients receive comprehensive advice across a range of different branches of law
RESEARCH POLAND OFFICE AND INVESTMENT MARKET Q1 2018
 POLAND OFFICE AND INVESTMENT MARKET Q1 OFFICE MARKET IN WARSAW Take-up (): 202,000 Strong developer activity is still being observed in the Warsaw office market. Since the beginning of 2018, three developments
MLP Group S.A. Capital Group
 Consolidated Annual Report FOR THE YEAR ENDED 31 DECEMBER 2017 This document is a translation. Polish version prevails. www.mlp.pl Published pursuant to 82 sec. 1 point 1 of the Decree of the Ministry
GTC Ready for Expansion. Investors Presentation January 2011
 GTC Ready for Expansion Investors Presentation January 2011 GTC at a Glance Leading real estate developer and manager ("build to own") of institutional quality real estate in key CEE/SEE markets; Poland
Q3 & 9M 2017 RESULTS FOR THE THREE AND NINE-MONTH PERIOD ENDED 30 SEPTEMBER 2017
 GLOBE TRADE CENTRE SA (Incorporated and registered in Poland with KRS No. 61500) (Share code on the WSE: GTC) (Share code on the JSE: GTC ISIN: PLGTC0000037) ("GTC" or "the Company") Q3 & 9M 2017 RESULTS
Granbero Holdings Ltd Half year results
 Granbero Holdings Ltd Half year results 30.06.2012 Sustained growth and results from continued development, construction and marketing efforts in core Polish market segments - Net profit for the period
Polish Real Estate Market Recovery after Financial Crisis
 , Warsaw University of Technology 1. FINANCIAL CRISIS IN POLAND - MACROECONOMY Effects of the global financial crisis has reached the Eastern-European countries, including Poland. However, financial crisis
GN GROUP REAL ESTATE. Central-Eastern Europe INVESTORS. Become our partner
 GN GROUP REAL ESTATE Central-Eastern Europe INVESTORS Become our partner GN GROUP WHO WE ARE LAND ACQUISITION STRUCTURING AND ADMINISTRATION GN Group was established over 20 years ago and is part of Gosch
LC CORP S.A. SHORT INTERIM FINANCIAL STATEMENTS FOR A PERIOD OF 6 MONTHS ENDED ON 30 JUNE 2016 INCLUDING THE AUDITOR'S REVIEW REPORT
 LC CORP S.A. SHORT INTERIM FINANCIAL STATEMENTS FOR A PERIOD OF 6 MONTHS ENDED ON 30 JUNE 2016 INCLUDING THE AUDITOR'S REVIEW REPORT Short interim statement of financial position 3 Short interim statement
Company Overview. Financial Performance
 Dec-14 Jan-15 Feb-15 Mar-15 Apr-15 May-15 Jun-15 Jul-15 Aug-15 Sep-15 Oct-15 Nov-15 Nimbus Projects Limited CMP: 34. December 4, 15 Stock Details BSE code 511714 BSE ID NIMBSPROJ Face value ( ) 1 No of
COMPANY / INDUSTRY NEWS
 June 27, 2016 Company background. Shun Tak Holdings, which was listed on the main board in 1973, is a conglomerate with businesses including property, transportation, hospitality and investment. Most of
ATLAS ESTATES LIMITED INTERIM CONDENSED CONSOLIDATED FINANCIAL INFORMATION HALF YEAR 2017
 INTERIM CONDENSED CONSOLIDATED FINANCIAL INFORMATION HALF YEAR 2017 Atlas Estates Limited Martello Court Admiral Park St Peter Port Guernsey GY1 3HB Company number: 44284 Contents Page 3 Financial Highlights
raport roczny 2011 annual report Separate annual report of Echo lnvestment S.A. for 2011
 Separate of Echo lnvestment S.A. for 1 Separate of Echo Investment S.A. for CONTENTS I. LETTER TO SHAREHOLDERS, PARTNERS AND CUSTOMERS... 4 II. SEPARATE FINANCIAL STATEMENTS OF ECHO INVESTMENT S.A. FOR...
MLP Group S.A. Separate. Annual Report FOR THE YEAR ENDED 31 DECEMBER This document is a translation. Polish version prevails.
 Separate Annual Report FOR THE YEAR ENDED 31 DECEMBER 2016 This document is a translation. Polish version prevails. www.mlp.pl Published pursuant to 82 sec. 1 point 1 of the Regulation of the Minister
CONSOLIDATED ANNUAL REPORT OF ECHO INVESTMENT GROUP
 2017 CONSOLIDATED ANNUAL REPORT OF ECHO INVESTMENT GROUP CONTENTS Message from CEO 3 CHAPTER 1 Consolidated financial statement of Echo Investment Group for 2017 5 CHAPTER 2 Explanatory notes 13 Explanatory
Presentation for Bondholders Meeting. 18 June 2017
 Presentation for Bondholders Meeting 18 June 2017 1 DISCLAIMER The information detailed in this presentation is subject to the general reservations and the risk factors detailed herein. This presentation
Condensed Interim Consolidated Financial Statements. For the 13-week and 39-week periods ended October 29, 2017 and October 30, 2016
 Condensed Interim Consolidated Financial Statements For the 13-week and 39-week periods ended and (Unaudited, expressed in thousands of Canadian dollars, unless otherwise noted) Interim Consolidated Statement
SEPARATE ANNUAL REPORT OF SUMMA LINGUAE S.A. FOR 2017
 SEPARATE ANNUAL REPORT OF SUMMA LINGUAE S.A. FOR 2017 TABLE OF CONTENTS I. LETTER OF THE PRESIDENT OF THE MANAGEMENT BOARD... 3 II. INTRODUCTION... 4 III. KEY INFORMATION ABOUT THE ISSUER... 5 IV. FINANCIAL
ROBYG S.A. GROUP Management Board Report on the activities of ROBYG S.A. and ROBYG S.A. Group for the period of 6 months ended 30 June 2017
 MANAGEMENT BOARD REPORT ON THE ACTIVITIES OF ROBYG S.A. AND ROBYG S.A. CAPITAL GROUP FOR THE PERIOD OF 6 MONTHS ENDED 30 JUNE 2017 TABLE OF CONTENTS 1. GENERAL INFORMATION ABOUT THE CAPITAL GROUP... 3
Report of the Management Board on the activities of Dom Development S.A. in 2007
 Report of the Management Board on the activities Warsaw, 10 March 2008 INTRODUCTION A joint stock company Dom Development S.A. ( the Company ) is the holding company of Capital Group Dom Development S.A
Consolidated quarterly statement of the capital group of Apator for four quarters in 2012 with concise quarterly report of Apator S.A.
 Consolidated quarterly statement of the capital group of Apator for four quarters in with concise quarterly report of Apator S.A. Contents: 1. Description of the organization of capital group of the issuer
MLP Group S.A. Capital Group Consolidated Annual Report FOR THE YEAR ENDED 31 DECEMBER 2014
 MLP Group S.A. Capital Group Consolidated Annual Report FOR THE YEAR ENDED 31 DECEMBER 2014 This document is a translation. Polish version prevails. www.mlp.pl Published pursuant to 82 sec. 1 point 1 of
Q3&9M 2018 RESULTS 14 NOVEMBER
 Q3&9M 2018 RESULTS 14 NOVEMBER 2018 1 CONTENTS Key highlights Q3&9M 2018 Portfolio Operations and financials Additional materials 2 DELIVERY OF INCREASING FFO CONTINUES FFO I increased 37% to 46m In 9M
Consolidated annual report for the year ended 31 December (data in thousands of PLN, unless otherwise stated) Contents of Consolidated Annual Report:
 Contents of Consolidated Annual Report:") Consolidated Annual Report FOR THE YEAR ENDED 31 DECEMBER This document is a translation. Polish version prevails. www.mlp.pl Published pursuant to 82 sec. 1 point 1 of the Decree of the Ministry of Finance
Consolidated Annual Report FOR THE YEAR ENDED 31 DECEMBER This document is a translation. Polish version prevails. www.mlp.pl Published pursuant to 82 sec. 1 point 1 of the Decree of the Ministry of Finance
Monday Development SA Consolidated Annual Report
 Monday Development SA Consolidated Annual Report 2012 CONTENTS I. LETTER TO SHAREHOLDERS, INVESTORS AND PARTNERS... 3 II. SELECTED FINANCIAL DATA... 4 III. FINANCIAL STATEMENTS... 5 IV. MANAGEMENT REPORT
Lead pic. Report on the first half of 2018
 Lead pic. Report on the first half of 2018! Operational Highlights Purchase and sale of properties in Budapest - Acquisition of B52 Office - Sale of Ülloi land plot Early redemption of convertible bonds
CONDENSED CONSOLIDATED FINANCIAL STATEMENTS. for the three months ended 31 March 2018
 CONDENSED CONSOLIDATED FINANCIAL STATEMENTS for the three months ended 2018 EPP N.V. (previously Echo Polska Properties N.V.) (Incorporated in The Netherlands) (Company number 64965945) JSE share code:
ITI: COOPERATION ON STRATEGIC PLANNING IN THE WARSAW METROPOLITAN AREA
 Delivering cohesion more effectively Integrated urban and territorial development in cohesion policy post- 2020 ITI: COOPERATION ON STRATEGIC PLANNING IN THE WARSAW METROPOLITAN AREA Brussels 14th May,
DOM DEVELOPMENT S.A. Management Board s Report of Activities of. in the first half of 2015
 Management Board s Report of Activities of DOM DEVELOPMENT S.A. Warsaw, 25 August 2015 CONTENTS APPROVAL BY THE MANAGEMENT BOARD OF THE MANAGEMENT BOARD S REPORT OF ACTIVITIES OF DOM DEVELOPMENT S.A. IN
DOM DEVELOPMENT S.A. MANAGEMENT BOARD S REPORT OF ACTIVITIES OF IN THE FIRST HALF OF 2011
 MANAGEMENT BOARD S REPORT OF ACTIVITIES OF DOM DEVELOPMENT S.A. IN THE FIRST HALF OF 2011 Warsaw, 23 August 2011 CONTENTS APPROVAL BY THE MANAGEMENT BOARD OF THE MANAGEMENT BOARD S REPORT OF ACTIVITIES
DOM DEVELOPMENT S.A. CAPITAL GROUP
 Management Board s Report of Activities of DOM DEVELOPMENT S.A. CAPITAL GROUP Warsaw, 20 August 2014 CONTENTS APPROVAL BY THE MANAGEMENT BOARD OF THE MANAGEMENT BOARD S REPORT OF ACTIVITIES OF DOM DEVELOPMENT
IQ 2018 RESULTS PRESENTATION
 IQ 2018 RESULTS PRESENTATION 10 MAY 2018 AGENDA Financial data Operational data Market environment Regulatory environment Appendix 2 FINANCIAL DATA FINANCIAL DATA Financial consolidated highlights (in
REPORT ON THE FIRST QUARTER OF 2011
 REPORT ON THE FIRST QUARTER OF 2011 1 REPORT ON THE FIRST QUARTER OF 2011 KEY FIGURES OF THE WARIMPEX GROUP EUR 000 1 3/2011 Change 1 3/2010 Revenues from the Hotels & Resorts segment 19,650 13% 17,395
Influence of the exhibition industry in Poland on the economy
 Influence of the exhibition industry in Poland on the economy At the request of Polish Chamber of Exhibition Industry (PCEI), Centrum Ekspertyz Gospodarczych (Economic Research Center) at Poznań University
REPORT ON THE FIRST QUARTER OF 2012
 REPORT ON THE FIRST QUARTER OF 2012 Zwischenbericht Q1/2012 1 KEY FIGURES OF THE WARIMPEX GROUP Retrospectively adjusted 1 EUR 000 1 3/2012 Change 1 3/2011 Revenues from the Hotels & Resorts segment 12,238
DOM DEVELOPMENT S.A. FINANCIAL STATEMENTS FOR THE YEAR ENDED 31 DECEMBER 2011
 Financial statements DOM DEVELOPMENT S.A. FINANCIAL STATEMENTS FOR THE YEAR ENDED 31 DECEMBER 2011 Prepared in accordance with the International Financial Reporting Standards Warsaw, 29 February 2012 Financial
Half-Year Report for the period January 1st June 30th 2015 The KRUK Group
 for the period January 1st June 30th 2015 2 Table of contents TABLE OF CONTENTS... 2 I. FINANCIAL HIGHLIGHTS... 5 1. Consolidated financial data... 5 2. Separate financial data of KRUK S.A.... 6 II. INTERIM
GLOBE TRADE CENTRE S.A. Record 2017 results pave the way for future substantial growth
 GLOBE TRADE CENTRE S.A. Record 2017 results pave the way for future substantial growth Annual Report 2017 SELECTED KEY NUMBERS Operating in CEE & SEE markets for Retail and office properties in 24 years
TOWER INVESTMENTS GROUP DEVELOPMENT STRATEGY
 TOWER INVESTMENTS GROUP 2017 2022 DEVELOPMENT STRATEGY WHO WE ARE Market presence since 2005 We are providing END-TO-END REAL PROPERTY DEVELOPMENT SERVICES for retail and service chains Between 2012 and
NETIA S.A. CONDENSED CONSOLIDATED FINANCIAL STATEMENTS September 30, 2004
 CONDENSED CONSOLIDATED FINANCIAL STATEMENTS REPORT OF INDEPENDENT ACCOUNTANTS To the Supervisory Board and Shareholders of Netia S.A. We have reviewed the accompanying condensed consolidated balance sheet
Poland. First Quarter April 28, 2015
 1 Poland First Quarter 2015 April 28, 2015 Disclaimer 2 Bank Zachodni WBK S.A. ("BZ WBK") cautions that this presentation contains forward-looking statements. These forward-looking statements are found
Condensed Interim Consolidated Financial Statements. For the 13-week periods ended April 30, 2017 and May 1, 2016
 Condensed Interim Consolidated Financial Statements For the 13-week periods ended and May 1, 2016 (Unaudited, expressed in thousands of Canadian dollars, unless otherwise noted) Consolidated Interim Statement
EPP IN A SNAPSHOT CITY POPULATION PLN AVERAGE MONTHLY WAGE. Warsaw AGGLOMERATION POPULATION ANNUAL PURCHASING POWER PER CAPITA
 01 EPP IN A SNAPSHOT 1 753 977 CITY POPULATION 2 596 761 AGGLOMERATION POPULATION Warsaw EPP properties: Galeria Młociny retail development Towarowa mixed use development Park Rozwoju (Stage I & II) Key
Operational highlights
 WARIMPEX Report on the First Three Quarters of 2018 2 warimpex Report on the First Three Quarters of 2018 Warimpex Group Key Figures in EUR 000 1 9/2018 Change 1 9/2017 Hotels revenues 9,681-61% 24,551
Tender Offer Offeror Act on Public Offering
 This Tender Offer for the sale of shares of Zespół Elektrociepłowni Wrocławskich KOGENERACJA Spółka Akcyjna with the registered office in Wrocław ("Tender Offer") is hereby announced by PGE Polska Grupa
Poland. First Quarter April 29, 2014
 1 Poland First Quarter 2014 April 29, 2014 Disclaimer 2 Bank Zachodni WBK S.A. ("BZ WBK") cautions that this presentation contains forward-looking statements. These forward-looking statements are found