The SKF Group. SKF Investor Relations
|
|
|
- Darren Gilmore
- 5 years ago
- Views:
Transcription


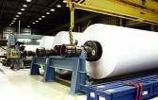
1 The SKF Group SKF Investor Relations July 2014
2 SKF - A truly global company Established: 1907 Sales 2013: SEK 63,597 million Employees 2013: 48,401 Production sites: SKF presence: Distributors/dealers: around 165 in 28 countries in over 130 countries 15,000 locations Global certificates: ISO OHSAS certification Slide 1
3 Net sales Industrial distribution Vehicle aftermarket 29% 11% 5% 10% Cars and light trucks 14% 11% 6% 4% 3% 5% 2% Aerospace Railway Off-highway Trucks Two-wheelers and Electrical Asia/Pacific Eastern Europe 5% 24% Middle East & Africa 3% 35% 24% North America 7% 3% Latin America Sweden Energy Industrial, 9% heavy and special Industrial, general Western Europe * Previously published shares have been restated in February 2013 Slide 2
 (3) (5) (14) (12) (5) (12) (15) (3) (9) (3) (3) (9) (3) (3) (2) (0) (2) (2) (0) North America Latin America Western Europe Sweden Eastern Europe Middle East and Africa Asia/Pacific Slide")
4 SKF 2013 (25)(14)(19) (26)(13)(18) (2002) (1998) (48) (44) (53) (47) (46) (53) % of group total Net sales Average number of employees Tangible asset (10) (12) (9) (13)(14)(8) (6) (5) (4) (4) (4) (3) (5) (14) (12) (5) (12) (15) (3) (9) (3) (3) (9) (3) (3) (2) (0) (2) (2) (0) North America Latin America Western Europe Sweden Eastern Europe Middle East and Africa Asia/Pacific Slide 3
5 Operating margin as reported % Slide 4
6 Return on capital employed % Slide 5
7 Growth in local currencies % Slide 6
8 Financial targets 15% Operating margin 8% Changes in sales in local currency incl. structure 20% Return on capital employed Q Q Q114 One-time items -20 One-time items for the individual year Slide 7

9 SKF s priorities Sustainable profitable growth Expand the platform concept Exploit the asset life cycle approach Develop new products and grow SKF BeyondZero portfolio Extend and grow second brands Acquisitions Capital efficiency Fixed capital Net working capital Investments & Innovation New and existing facilities Research and development IT systems and mobility Slide 8 Cost reduction Business Excellence Consolidation of manufacturing Optimization and productivity improvements Reduction in purchasing costs


10 SKF Group Vision To equip the world with SKF knowledge Slide 9


11 SKF BeyondZero SKF launched the BeyondZero TM portfolio with products and solutions, which will both improve energy efficiency and reduce the environmental impact. SKF revised targets for its climate strategy and also partnered with the WWF in their Climate Savers Programme. SKF s climate targets: Increase revenue from SKF BeyondZero portfolio from SEK 2.5 billion to SEK 10 billion by 2016 Reduce total annual energy use by 5% below the 2006 level by 2016 Reduce energy use per production output by 5% y-o-y from 2012 to 2016 Reduce CO 2 emissions per tonne-kilometre by 30% 2016 vs 2011 for transports managed by SKF Logistics Services Major suppliers certified according to ISO by 2016 Slide 10


12 28 SKF Solution Factory June 2014 Australia Brazil Canada Canada Columbia China China China Perth Cajamar Edmonton Toronto Bogota Shanghai Tianjin Urumqi France Montigny Germany Schweinfurt India Pune India Manesar Italy Turin Mexico Monterrey Netherlands Ridderkerk Netherlands Nieuwegein Poland Romania Russia United Arab Emirats South Africa Spain Sweden Katowice Bucharest Moscow Abu Dhabi Witfield Madrid Gothenburg Taiwan Turkey UK USA USA Taichung Istanbul Luton Cleveland Houston Slide 11

13 SKF Solution Factory Segments & Application Knowledge Platforms & Technology Competence SKF Solution Factory Capabilities Sealing Solutions Mechanical Services Lubrication Solutions Bearing Service Workshop Condition Monitoring Services Remote Monitoring Center MaPro/CoMo Product Repair A & MC Training Center Slide 12
 and centralized lubrication system for roll lines SKF Caster Analyst System for roll lines")
14 Slab continuous caster metal industry Telescopic actuators for mould adjustment SKF ConRo Compact roll line units SKF ConRo Top roll line units SKF ConRo Low roll line units SKF DryLube Bearings and SNL Housings for roll out table SKF sealed selfaligning bearing system (CARB and spherical roller bearings) and centralized lubrication system for roll lines SKF Caster Analyst System for roll lines Slide 13


15 Wheel-loader Construction Central gear Hybrid pinion units Chassis lubrication Centralized lubrication systems Slide 14 Wheel end Integrated smart wheel bearing units with sensors SKF Mudblock cassette seals Motor hood Electromechanical actuators


16 Wind turbine - Energy New CRB-design with extra-high carrying capacity for wind-gearboxes. New pitch bearing design with improved corrosion protection SKF WindCon 3.0/Webcon Intranet supervised condition monitoring DRTRB-unit SKF Nautilus with segmented cage for minimized friction XL Hybrid bearings with ceramic balls for superior insulation Automatic centralized lubrication kits for reduced maintenance cost Slide 15


17 SKF s environmentally positive customer solutions SKF s solutions which realize significant environmental benefits Designed for environment E2-30% less energy compared to a standard bearing Stop-start system SKF sensor bearing Applied for environment Up to 15% better fuel economy of the car A solution that is primarily designed to improve environmental performance by itself A solution that enables improved environmental performance in a specific application Slide 16
18 SKF energy efficient (E2) bearings China India Peru Indonesia Conveyors used in mining industry. 130,000 E2 bearing Sangam Group Industria Textil Piura 60,000 E2 deep groove ball bearing Leuwijaya Textile 30,000 E2 bearing potential 325,000 for 3 different customers Slide 17


19 What is SKF knowledge? Slide 18
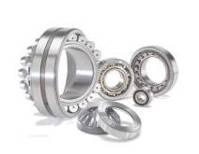


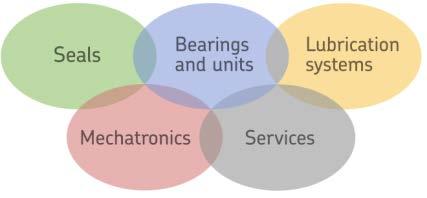
20 SKF technology platforms Bearings and units Slide 19


21 SKF technology platforms Seals Slide 20

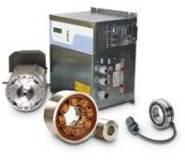


22 SKF technology platforms Mechatronic Slide 21

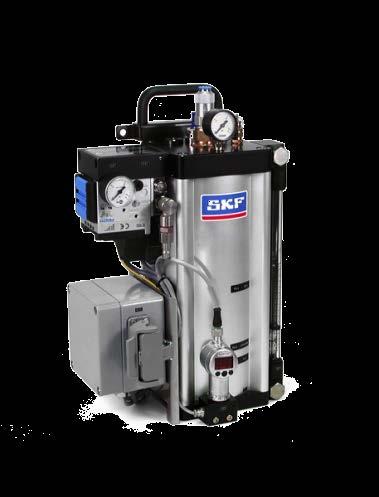


23 SKF technology platforms Lubrication systems Slide 22


24 SKF technology platforms Service Slide 23
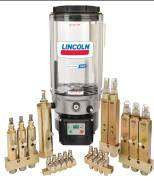
25 Acquisition Identifying gaps and opportunities in all platforms Bearings and units Seals Services Lubrication systems Mechatronics Products SNFA (2006) Economos (2006) Baker (2007) Safematic (2006) ABBA (2007) GLO (2008) S2M (2007) Macrotech (2006) Macrotech (2009) Jaeger (2005) Kaydon (2013) Technologies Vogel (2004) Lincoln Industrial (2010) Geographies QPM (2008) PMCI (2007) ALS (2007) TCM (2003) Scandrive (2003) PB&A (2006) Sommers (2005) Monitek (2006) Cirval (2008) Industries Peer (2008) BVI (2013) GBC (2012) Slide 24


26 SKF Half-year results 2014 Tom Johnstone, President and CEO


27 Examples of new business Envision Energy, China Strategic long-term partnership A customer in the automation industry Roller screw electromechanical cylinder Dongfang Electric New Energy Equipment Main shaft bearings Aurizon, Australia Service contract A customer in the oil and gas industry Asset management services Bosch Service, Brazil SKF s vehicle aftermarket product range Slide 26


28 Highlights Inauguration of SKF Campus and SKF North East Asia Distribution Centre in Shanghai. New SKF Solution Factory in Nieuwegein in the Netherlands. Events during the quarter: - SKF Wind Farm Management Conference in Berlin - SKF Life Cycle Management Conference in Buenos Aires - SKF Asset Management Conference in Prague Slide 27
29 Customer awards Best Technical and Service Award 2013 Envision Energy, China Supplier Excellence Award 2013 National Oilwell Varco (NOV), USA Premium Supplier Award Joy Global Underground Mining LLC, USA Marine Supplier of the year Award 2014 Rolls-Royce Marine Excellent Supplier Award ABB Marine, China Supplier Certification of Appreciation Nissan, China Quality Gold Award 2013 Yamaha Motor Company The Qualitas Award Fiat/Chrysler, Argentina Slide 28


30 New products and solutions SKF Gear Bearing Unit Floating piston SKF Tachometer SKF Shaft Alignment Tool Low torque operator valve solution Electric grease transfer pump SKF Wireless MicroVibe Low friction grease for hub bearing units Slide 29 SKF Wireless Machine Condition Sensor Turbulo BlueMon emission monitoring system Connect
31 SKF Group Q Financial performance (SEKm) Net sales 17,955 16,392 Operating profit 2,096 1,837 Operating margin, % Operating margin excl. one-time items, % Profit before tax 1,761 1,627 Basic earnings per share, SEK Cash flow after investments before financing excl. EU payment 1,423 1,147 Cash flow after investments before financing -1,402 1,147 Organic sales growth in local currency: SKF Group 4.6% Europe 1% Strategic Industries 11.1% North America 3% Regional Sales and Service 2.0% Asia 14% Automotive 1.3% Latin America 2% Middle East and Africa 14% Key points Sales volumes up by 3.6% y-o-y. Manufacturing was slightly higher compared to last year. Slide 30
32 SKF Group Half year 2014 Financial performance (SEKm) Net sales 34,689 31,544 Operating profit 4,120 3,317 Operating margin, % Operating margin excl. one-time items, % Profit before tax 3,548 2,864 Basic earnings per share, SEK Cash flow after investments before financing excl. EU payment 1, Cash flow after investments before financing -1, Organic sales growth in local currency: SKF Group 5.2% Europe 3% Strategic Industries 9.0% North America 3% Regional Sales and Service 2.2% Asia 13% Automotive 4.5% Latin America 1% Middle East and Africa 18% Key points Sales volumes up by 5.0% y-o-y. Manufacturing was higher compared to last year. Slide 31
33 Organic sales growth in local currency % change y-o-y Slide 32
34 Organic sales growth in local currency % y-o-y % % -2.5% YTD 2014 Slide 33 Structure in 2012: 0.4% Structure in 2013: 2.5% Structure in 2014: 4.2%
35 Sales development by geography Organic growth in local currency Q vs Q Europe 1% North America 3% Asia/Pacific 14% Latin America 2% Middle East & Africa 14% Slide 34

36 Sales development by geography Organic growth in local currency YTD 2014 vs YTD 2013 Europe 3% North America 3% Asia/Pacific 13% Latin America 1% Middle East & Africa 18% Slide 35
37 Components in net sales Percent y-o-y Q1 Q2 Q3 Q4 Q1 Q2 Q3 Q4 Q1 Q2 Volume Structure Price/mix Sales in local currency Currency Net sales Slide 36
38 Operating profit as reported SEKm Slide 37
39 Operating profit excluding one-time items SEKm Slide 38
40 Operating margin % * 11.9* One-time items * Excluding one-time items 11.9* YTD 2014 Slide 39
41 Operating margin per business area as reported % Specialty Business Strategic Industries Regional Sales and Service Automotive 0-3 Q1 Q2 Q3 Q4 Q1 Q2 Q3 Q4 Q1 Q Slide 40
42 Operating margin per business area excl. one-time items % Specialty Business Strategic Industries Regional Sales and Service Automotive Q1 Q2 Q3 Q4 Q1 Q2 Q3 Q4 Q1 Q Slide 41
43 SKF s programme to improve efficiency and reduce cost Restructuring, SEKm: Q4/12 Q1/13 Q2/13 Q3/13 Q4/ Q1/14 Q2/14 Total Cost taken People affected ,560 Giving future gross savings, SEKm: Full year gross saving Realized gross savings from total programme, SEKm: vs 2012 vs 2013 Q1/13 Q2/13 Q3/13 Q4/ Q1/14 Q2/ Restructuring S&A Purchasing Total Slide 42 Note: Run rate Q SEK 1,340 million vs 2012.
44 Operating profit bridge, Q SEKm , , Q Volumes Price/mix Specialty Savings One-time Currencies R&D, Q excl. Specialty Business Business items inflation etc. Slide 43
45 Operating profit bridge, half year 2014 SEKm , ,120 Q Volumes Price/mix Specialty Savings One-time Currencies R&D, Q excl. Specialty Business Business items inflation etc. Slide 44
46 Net working capital as % of annual sales % Q1 Q2 Q3 Q4 Q1 Q2 Q3 Q4 Q1 Q Target: 27% Slide 45
47 Return on capital employed % One-time items * Excluding one-time items * * 14.6* YTD 2014 ROCE: Operating profit plus interest income, as a percentage of twelve months rolling average of total assets less the average of non-interest bearing liabilities. Slide 46
48 Cash flow, after investments before financing SEKm ) 3) 4) 5) 0 2) Slide 47 Excl. acq. and div.: 1) Q SEK 1,707 million 2) Q SEK -69 million 3) Q SEK 871 million 4) Q SEK 1,170 million Excl. EU payment 5) Q SEK 1,423 million
49 Net debt SEKm AB SKF, dividend paid (SEKm): 2012 Q2 2, Q2 2, Q2 2,530 Cash out from acquisitions (SEKm): 2012 Q Q Q4 7,900 EU payment (SEKm): 2014 Q2 2,825 Net debt: Loans and net provisions for post-employment benefits less short-term financial assets excluding derivatives. Slide 48
50 Debt structure, maturity years EURm Slide 49 Available credit facilities: EUR 500 million 2019 SEK 3,000 million 2016 SEK 3,000 million 2017 No financial covenants nor material adverse change clause
51 July 2014: SKF demand outlook Q Demand compared to the third quarter 2013 The demand for SKF s products and services is expected to be slightly higher for the Group and North America, higher for Asia, relatively unchanged for Europe and slightly lower for Latin America. It is expected to be higher for Strategic Industries and relatively unchanged for Regional Sales and Service and Automotive. Demand compared to the second quarter 2014 The demand for SKF s products and services is expected to be relatively unchanged for the Group and Europe. It is expected to be slightly higher for North America and Asia and slightly lower for Latin America. For Strategic Industries it is expected to be slightly higher and for Regional Sales and Service and Automotive it is expected to be relatively unchanged. Manufacturing Manufacturing is expected to be slightly higher year over year and relatively unchanged compared to the second quarter. Slide 50
52 SKF demand outlook Q3 2014, main regions Share of net sales 2013 Europe 42% Asia Pacific 24% North America 24% Latin America 7% Total Sequential trend for Q Q vs Q / Slide 51
53 SKF demand outlook Q3 2014, main business areas Share of net sales 2013 Sequential trend for Q Q vs Q Strategic Industries Regional Sales and Service 29% 39% ++ +/- Automotive 27% Total +/- + Slide 52
54 SKF sequential volume trend Q3 2014, Industries Share of net sales % Aerospace 5% Energy 4% Railway 2% Two-wheelers and Electrical 29% Industrial distribution 14% Cars and light vehicles 13% Industrial, heavy, special and off-highway 11% Vehicle service market 11% Industrial, general 5% Trucks Slide 53
55 Guidance for the third quarter 2014* Tax level: around 30% Financial net for the third quarter: Around SEK -230 million Currency impact on operating profit versus 2013 Q3: SEK +50 million Full year: SEK -70 million Additions to PPE: Around SEK 1.6 billion for 2014 * Guidance is approximate and based on current assumptions and exchange rates. Slide 54
56 SKF s priorities Sustainable profitable growth Expand the platform concept Exploit the asset life cycle approach Develop new products and grow SKF BeyondZero portfolio Extend and grow second brands Acquisitions Capital efficiency Fixed capital Net working capital Investments & Innovation New and existing facilities Research and development IT systems and mobility Slide 55 Cost reduction Business Excellence Consolidation of manufacturing Optimization and productivity improvements Reduction in purchasing costs
57 Cautionary statement This presentation contains forward-looking statements that are based on the current expectations of the management of SKF. Although management believes that the expectations reflected in such forward-looking statements are reasonable, no assurance can be given that such expectations will prove to have been correct. Accordingly, results could differ materially from those implied in the forward-looking statements as a result of, among other factors, changes in economic, market and competitive conditions, changes in the regulatory environment and other government actions, fluctuations in exchange rates and other factors mentioned in SKF's latest annual report (available on under the Administration Report; Important factors influencing the financial results", "Financial risks" and "Sensitivity analysis. Slide 56


58 Welcome to the IR website > Investors Investor Relations function: Head: Marita Björk Tel: Mobile: Slide 57 Investor Relations: Anna Alte Tel: Mobile: Event and road shows coordinator: Helena Karlsson Tel: Mobile:


59 Slide 58
The SKF Group. SKF Investor Relations
 The SKF Group SKF Investor Relations April 2012 SKF - A truly global company 1 Established: 1907 Sales 2011: SEK 66,216 million Employees 2011: 46,039 Production sites: SKF presence: Distributors/dealers:
The SKF Group. SKF Investor Relations
 The SKF Group SKF Investor Relations October 2012 SKF - A truly global company Established: 1907 Sales 2011: SEK 66,216 million Employees 2011: 46,039 Production sites: SKF presence: Distributors/dealers:
Henrik Lange Executive Vice President and CFO
 Henrik Lange Executive Vice President and CFO SKF Capital Markets Day 10 September 2014 Agenda Financial development Cash flow, working capital Financial position Acquisitions Second brand Key business
Capital Market Day 10th May 2007 Tom Johnstone President and CEO
 SKF Group Capital Market Day 10th May 2007 Tom Johnstone President and CEO The SKF vision To equip the world with SKF knowledge SKF's Platforms Bearings and units - recent activities Acquisitions: New
SKF Group Presented by Tom Johnstone President and CFO
 SKF Group Presented by Tom Johnstone President and CFO SKF Capital Markets Day 2008 SKF Group Vision To equip the world with SKF knowledge SKF Group financial targets Operating margin, level 12 % Growth
SKF Year-end report 2006
 SKF Year-end report 2006 SKF reports record profits and record sales for the full year and for the fourth quarter of 2006. The Board proposes a 12.5% increase in the dividend to SEK 4.50 per share and
SKF Half-year report 2006
 SKF Half- report The SKF Group reports record profits and record sales for the second quarter of. Operating profit increased by 22.6% and sales were up 5.0%. Basic earnings per share increased by 17.9%
Year-end report Press release 29 January
 Year-end report 2018 Press release 29 January Excellent result, strong cash flow; a record 2018 2018 was an excellent year for SKF, with record results and a significantly strengthened balance sheet. In
Press release 2 February
 Year-end report 2016 Press release 2 February In 2016 we have seen market conditions gradually improve and SKF is now growing again. In the fourth quarter, organic sales increased by 1.2% compared to last
SKF SEB Industrial & Technology seminar Stockholm August 23, 2018 Patrik Stenberg, IR
 SKF 2018 SEB Industrial & Technology seminar Stockholm August 23, 2018 Patrik Stenberg, IR A record second quarter Record-high sales of 22,620 M, organic growth 9.0% 9.0% Organic sales growth Record-high
SKF Q1 results Alrik Danielson, President and CEO. SKF Group
 SKF Q1 results 2016 Alrik Danielson, President and CEO Q1 Summary Alrik Danielson, CEO Q1 summary Net sales and earnings affected by lower demand in China and the US Sales SEK 17 720 M, -8.9% yoy Organic
SKF Q2 results Alrik Danielson, President and CEO
 SKF Q2 results 2017 Alrik Danielson, President and CEO High pace in transformation Q2 activities Digitalisation and connectivity Collaboration in place with Honeywell Enlight Centre for Marine launched
SKF Year-end report 2012
 Press release 30 January 2013 SKF Year-end report We saw a weak development in our sales in the fourth quarter and particularly in December due to the uncertain macro situation and inventory reductions
SKF Q3 results Alrik Danielson, President and CEO. Picture: Evolution
 SKF Q3 results 2018 Alrik Danielson, President and CEO Picture: Evolution Record result and strong cash flow Net sales of 21,341 M, organic growth 6.9% 6.9% Organic sales growth Operating profit 2,597
SKF First-quarter report 2014
 Press release 15 April SKF First-quarter report Sales developed well in the first quarter compared to the low first quarter last year and were relatively unchanged compared to the fourth quarter. We continued
SKF Q4 results Alrik Danielson, President and CEO
 SKF Q4 results 2018 Alrik Danielson, President and CEO Q4 excellent result and strong cash flow Net sales of 21,192 M, organic growth 5.0% 5.0% Organic sales growth Operating profit 2,902 M (2,017) Operating
Year-end report Press release 1 February
 Year-end report 2017 Press release 1 February We have had a strong finish to 2017, a year characterized by strong demand in most markets. In the fourth quarter, net sales, at SEK 19.5 billion, grew organically
SKF Q2 results Alrik Danielson, President and CEO
 SKF Q2 results 2018 Alrik Danielson, President and CEO A record second quarter Record-high sales of 22,620 M, organic growth 9.0% 9.0% Organic sales growth Record-high reported operating profit 2,925 M
Nine-month report Press release 25 October
 Nine-month report 2018 Press release 25 October Record third-quarter result and continued strong cash flow The third quarter developed as anticipated, with continued growth in both our industrial and automotive
Continued improvement in the Group's sales volume is expected during the remainder of the year.
 Press release SKF Half-year report 2000 Steady improvement The operating margin for the first half of 2000 amounted to 9.3% (5.3). Excluding the capital gain made in the first quarter the operating margin
Nine-month report 2017
 Nine-month report 2017 Press release 31 October The third quarter was characterized by continued organic growth and operating margin improvement. Net sales, at SEK 18.6 billion, increased organically by
Half-year report Press release 19 July
 Half-year report 2018 Press release 19 July SKF Half-year report 2018 1 A record second quarter Our record start to 2018 has continued. Sales grew by 9% organically, to SEK 22.6 billion and our operating
FUCHS PETROLUB AG The leading independent lubricants manufacturer of the world
 The leading independent lubricants manufacturer of the world Dr. Alexander Selent, Vice Chairman & CFO Dagmar Steinert, Head of Investor Relations April 2013 FUCHS the leading independent lubricants manufacturer
SKF Q4 results Alrik Danielson, President and CEO
 SKF Q4 results 2017 Alrik Danielson, President and CEO Key events in the fourth quarter Digitalisation and connectivity SKF Enlight Centre a first-of-its-kind, asset based machine health monitoring system,
FUCHS PETROLUB SE The leading independent lubricants manufacturer of the world
 The leading independent lubricants manufacturer of the world Dr. Alexander Selent, Vice Chairman & CFO Dagmar Steinert, Head of Investor Relations September 2014 The leading independent lubricants manufacturer
FUCHS PETROLUB SE The leading independent lubricants manufacturer of the world
 The leading independent lubricants manufacturer of the world Dr. Alexander Selent, Vice Chairman & CFO Dagmar Steinert, Head of Investor Relations January 2015 The leading independent lubricants manufacturer
FUCHS PETROLUB SE The leading independent lubricants manufacturer of the world
 The leading independent lubricants manufacturer of the world Dr. Alexander Selent, Vice Chairman & CFO Dagmar Steinert, Head of Investor Relations Main First Bank, Zurich, 5 June 2014 The leading independent
Annual Report. Aktiebolaget SKF, SE- Göteborg, Sweden Telephone + - -, fax + - -
 Financial information and reporting AB SKF will publish the following financial reports in 2000 Year-end Report for 1999......................January 26 Annual Report 1999...............................March
Contents. Everything we do begins with our customers. Alrik Danielson, CEO
 A world of reliable rotation Annual Report 2016 Contents SKF overview 2016 in brief... 1 The SKF Group... 4 President s letter... 6 Value creation and strategic priorities How SKF creates value... 8 Create
Global Construction 2030 Expo EDIFICA 2017 Santiago Chile. 4-6 October 2017
 Global Construction 2030 Expo EDIFICA 2017 Santiago Chile 4-6 October 2017 Graham Robinson Global Construction Perspectives Global Construction 2030 is the fourth in a series of global studies of the construction
Scania Interim Report January June 2007
 26 July Scania Interim Report January June Scania reports strong volume and revenue growth Order bookings continue to be strong, up 39 percent in the first six months Sharp increase in earnings, operating
Report on Finnish Technology Industry Exports
 Report on Finnish Technology Industry Exports Last observation October 2018, 2.1.2019 Goods Export of Technology Industry from Finland Goods Export of Technology Industry from Finland by Branches Source:
SKF BEARINGS THROUGH THE SOUND BARRIER
 SKF BEARINGS THROUGH THE SOUND BARRIER The British Thrust SSC is the first car to pass through the sound barrier. It reached a speed of 1 229.7 km/h (10 km/h faster than sound) in the Black Rock Desert
SCANIA INTERIM REPORT JANUARY MARCH 2004
 27 April 2004 SCANIA INTERIM REPORT JANUARY MARCH 2004 The year has started better than expected. Scania launched the new R-series at the end of March and the reception in our sales organisation has been
Interim announcement 1 st quarter 2016
 Interim announcement 1 st quarter 2016 Danfoss at a glance Danfoss engineers technologies that enable the world of tomorrow to do more with less. We meet the growing need for infrastructure, food supply,
SCANIA INTERIM REPORT JANUARY SEPTEMBER 2004
 1 November 2004 The first nine months of 2004 turned out well, and volume rose in practically all markets. The new truck range has been well received by customers and the trade press. The changeover of
Scania Interim Report January June 2017
 28 July 2017 Scania Interim Report January June 2017 Summary of the first six months of 2017 Operating income rose to SEK 6,464 m. (1,316) Operating income, excluding items affecting comparability, amounts
Alfa Laval Slide 3.
 Report for Q2 2012 - Key figures - Orders received and margins - Development per segment - Geographical development - Financials - Outlook Mr. Lars Renström President and CEO Alfa Laval Group Key figures
Interim announcement 1 st Half-year 2015
 Interim announcement 1 st Half-year 2015 Danfoss at a glance Danfoss engineers technologies that enable the world of tomorrow to do more with less. We meet the growing need for infrastructure, food supply,
Report for Q Mr. Lars Renström President and CEO Alfa Laval Group
 Report for Q1 2015 - Key figures - Orders received and margins - Highlights - Development per segment - Geographical development - Financials - Outlook Mr. Lars Renström President and CEO Alfa Laval Group
ASSA ABLOY is the global leader in door opening solutions, dedicated to satisfying end-user needs for security, safety and convenience.
 ASSA ABLOY is the global leader in door opening solutions, dedicated to satisfying end-user needs for security, safety and convenience Q3 Report 20 Q3 20 in brief Organic growth in all divisions Strong
SCANIA SIX-MONTH REPORT JANUARY JUNE 2004
 26 July 2004 SCANIA SIX-MONTH REPORT JANUARY JUNE 2004 The first half of this year turned out well. The new Scania R-series has been well received by customers and the trade press. Changeovers of production
ASSA ABLOY is the global leader in door opening solutions, dedicated to satisfying end-user needs for security, safety and convenience.
 ASSA ABLOY is the global leader in door opening solutions, dedicated to satisfying end-user needs for security, safety and convenience Q4 Report 20 Q4 20 in brief Organic growth in all divisions Strong
Schaeffler Group back to profitable growth
 Schaeffler Group back to profitable growth Full Year Results 2010 Analyst Conference March 29 th, 2011 Disclaimer This presentation contains forward-looking statements. The words "anticipate", "assume",
Global Helicopter Forecast
 Global Helicopter Forecast C&P untapped demand is rising Key world economies are still underequipped TOP 10 Countries in 2016 ( H/C fleet in service) U.S.A. Russia Canada Brazil Australia United Kingdom
SCANIA INTERIM REPORT JANUARY SEPTEMBER 2005
 1 November 2005 SCANIA INTERIM REPORT JANUARY SEPTEMBER 2005 Based on Scania s order bookings during the second and third quarter, and given the current production rate, our assessment is that this year
Financial wealth of private households worldwide
 Economic Research Financial wealth of private households worldwide Munich, October 217 Recovery in turbulent times Assets and liabilities of private households worldwide in EUR trillion and annualrate
First quarter Δ. Sales, SEK M 15,891 18,142 14%
 Sales increased by 14% to SEK 18,142 M (15,891), with organic growth of 6% (3). Acquisitions contributed 3% Strong growth was shown by Global Technologies, Entrance Systems, Americas and EMEA, and good
Global Economy is Expected to Grow by 3.4 % in 2016 GDP growth in 2016, %
 Russia Brazil Mexico Rest of Latin America Rest of Eastern Europe Middle East and Africa Global Economy is Expected to Grow by 3.4 % in 216 GDP growth in 216, % 9 8 7 6 5 4 3 2 1-1 -2-3 -4 North America
THIRD QUARTER OCTOBER 2018
 THIRD QUARTER 2018 18 OCTOBER 2018 DISCLAIMER Certain information contained in this document, other than historical information, may constitute forward-looking statements or unaudited financial forecasts.
Travel Insurance and Assistance in the Asia-Pacific Region
 Travel Insurance and Assistance in the Asia-Pacific Region Report Prospectus October 2013 Web: www.finaccord.com. E-mail: info@finaccord.com 1 Prospectus contents Page What is the research? What methodology
Second quarter Vestas Wind Systems A/S. Copenhagen, 17 August Classification: Public
 Second quarter Vestas Wind Systems A/S Copenhagen, 17 August Classification: Public Disclaimer and cautionary statement This document contains forward-looking statements concerning Vestas financial condition,
Investor Presentation Q Results. 8 November 2017
 Investor Presentation Q3 2017 Results 8 November 2017 Forward-looking statements This presentation contains forward-looking statements, including, but not limited to, the statements and expectations contained
Annual Report Financial, environmental and social performance
 Annual Report 2013 Financial, environmental and social performance Contents n n 2 This is SKF 4 President s letter n n 8 Administration report 20 Report on the business Business Care 21 Performance 2013
Results Q Schaeffler AG. Conference Call November 8, 2017 Herzogenaurach
 Results 2017 Schaeffler AG Conference Call Herzogenaurach Disclaimer This presentation contains forward-looking statements. The words "anticipate", "assume", "believe", "estimate", "expect", "intend",
2012 Results and Strategy Review
 Results and Strategy Review Results - Review Ken Hanna Chairman 3 Results - Review Angus Cockburn Chief Financial Officer 4 Results Pre-Exceptional Movement As reported Underlying Revenue 1,583 1,396 13
Scania Interim Report January-March 2017
 5 May 2017 Scania Interim Report January-March 2017 Summary of the first three months of 2017 Operating income rose by 35 percent to SEK 3,081 m. (2,275) Net sales increased by 23 percent to SEK 28,411
Interim Results 2008/2009. Significant events Financial statements Strategy and outlook
 Interim Results 2008/2009 Significant events Financial statements Strategy and outlook Key figures 1 st semester 2008/2009 Change from 1 st semester 2007/2008 Sales 383.7M + 21.3% Percentage of sales outside
Volvo Group FOURTH QUARTER 2015 MARTIN LUNDSTEDT. Volvo Group Headquarters Fourth quarter
 Volvo Group FOURTH QUARTER 2015 MARTIN LUNDSTEDT 1 VOLVO GROUP Fourth quarter highlights CONTINUED IMPROVED PROFITABILITY ON FLAT VOLUMES UNDERLYING OPERATING MARGIN AT 5.7% OPERATING CASH FLOW OF SEK
Alfa Laval Slide 3.
 Report for Q4 2011 - Orders received and margins - Highlights - Development per segment - Geographical development - Financials - Outlook Mr. Lars Renström President and CEO Alfa Laval Group Key figures
Solid underlying development in the fourth quarter
 Interim Report Q4 2016 Full-year summary 2016 2 February 2017 The global leader in door opening solutions Solid underlying development in the fourth quarter Fourth quarter Sales increased by 6% to SEK
Q3 Report 2006 Johan Molin President & CEO
 Q3 Report 2006 Johan Molin President & CEO Financial Highlights Q3 Continued high growth pace High stable demand in Europe and North America Fargo developing very well Sales SEK 7 736 M +10% +8% organic,
THIRD QUARTER 2017 OCTOBER 2017
 THIRD QUARTER 2017 OCTOBER 2017 DISCLAIMER Certain information contained in this document, other than historical information, may constitute forward-looking statements or unaudited financial forecasts.
As close as you need, as far as you go
 As close as you need, as far as you go BBVA, a global group For more than 150 years our clients have been the centre of our business. Now as a highly solvent international financial group we offer clients
Third quarter Vestas Wind Systems A/S. Copenhagen, 7 November 2018
 Third quarter Vestas Wind Systems A/S Copenhagen, 7 November Disclaimer and cautionary statement This document contains forward-looking statements concerning Vestas financial condition, results of operations
3 rd Quarter Revenue. October 20, 2011
 3 rd Quarter Revenue October 20, 2011 DISCLAIMER This presentation contains forward-looking statements. The use of the words "aim(s)," "expect(s)," "feel(s)," "will," "may," "believe(s)," "anticipate(s)"
Second quarter Vestas Wind Systems A/S. Copenhagen, 18 August Classification: Public
 Second quarter Vestas Wind Systems A/S Copenhagen, 18 August Disclaimer and cautionary statement This presentation contains forward-looking statements concerning Vestas' financial condition, results of
Scania Interim Report January September 2013
 23 October 2013 Scania Interim Report January September 2013 Summary of the first nine months of 2013 Operating income fell to SEK 5,939 m. (6,135), and earnings per share fell to SEK 5.30 (5.94) Net sales
Positive trend in earnings and strong cash flow
 Positive trend in earnings and strong cash flow Presentation of the Q3/2017 result Martin Lindqvist, President & CEO Håkan Folin, CFO October 25, 2017 Agenda Q3/2017 and performance by division Financials
Q in brief. Strong sales growth. One-off costs in China. Stable operating margin* Strong cash flow
 Q2 Report 2018 Q2 2018 in brief Strong sales growth Strong growth in Americas, Global Technologies and Entrance Systems Stable growth in EMEA and APAC Strong development for smart door locks and electro-mechanical
Analysts Conference Full Year Results 2004 Frankfurt, March 22, pm
 Analysts Conference Full Year Results 2004 Frankfurt, March 22, 2005 3.00pm Page 4 Page 17 Page 32 Presentation of Dr Wolfgang Reitzle President & CEO, Linde AG Presentation of Dr Peter Diesch CFO, Linde
PRELIMINARY RESULTS February 2016
 25 February 2016 Nicandro Durante Chief Executive A strong performance driven by market share growth Excellent underlying performance, despite significant FX headwinds Outstanding quality share performance,
SIX MONTHS REPORT, JANUARY JUNE 2014
 SIX MONTHS REPORT, JANUARY JUNE 2014 TELEPHONE CONFERENCE 11 JULY, 2014 TOMMY ANDERSSON, PRESIDENT AND CEO TO PARTICIPATE, PLEASE CALL 5 MINUTES BEFORE THE OPENING OF THE CONFERENCE CALL TO SWEDEN +46
Interim announcement 1st to 3rd quarter 2015
 Interim announcement 1st to 3rd quarter 2015 Danfoss at a glance Danfoss engineers technologies that enable the world of tomorrow to do more with less. We meet the growing need for infrastructure, food
Alfa Laval 04/02/2009
 Alfa Laval 04/02/2009 Report for Q4 and full year 2008 - Orders received and margins - Highlights - Development per segment - Geographical development - Financials - Outlook Mr. Lars Renström President
Q in brief. Strong organic sales development. Electromechanical products up 30% Strong EBIT growth of 12%
 Q4 Report 20 Q4 20 in brief Strong organic sales development Very strong growth in Americas and APAC Strong growth in Global Technologies Good growth in EMEA Growth in Entrance Systems Electromechanical
3Q 2017 Earnings Investor Presentation
 3Q 2017 Earnings Investor Presentation OCTOBER 25, 2017 Delivering Next-Level Performance Agenda Introduction - Jason Hershiser Manager, Investor Relations Overview and Business Update - Rich Kyle President
Scania Interim Report January September 2017
 30 October 2017 Scania Interim Report January September 2017 Summary of the first nine months of 2017 Operating income, excluding items affecting comparability, amounted to SEK 9,080 m. (7,492) Operating
Sandvik Q3. PRESS RELEASE 3 November 2005 Interim report third quarter % +38% +4%
 PRESS RELEASE 3 November 25 Interim report third quarter 25 CONTINUED GROWTH AND INCREASED PROFIT Profit after financial items rose 26% to SEK 2,126 M, 38% adjusted for nonrecurring items 24 (SEK 153 M).
Scania Year-end Report January December 2016
 17 March 2017 Scania Year-end Report January December 2016 Summary of the full year 2016 Operating income excluding items affecting comparability rose by 6 percent to SEK 10,184 m. (9,641), resulting in
1 st Quarter, 2014 Danfoss delivers strong first quarter
 1 st Quarter, 2014 Danfoss delivers strong first quarter www.danfoss.com www.danfoss.com Danfoss at a glance Danfoss is a world-leading supplier of technologies that meet the growing need for food supply,
ASSA ABLOY is the global leader in door opening solutions, dedicated to satisfying end-user needs for security, safety and convenience.
 ASSA ABLOY is the global leader in door opening solutions, dedicated to satisfying end-user needs for security, safety and convenience Q2 Report 2017 ASSA ABLOY overview January June 2017 Financials (SEK
Franklin Templeton Investments Our Global Perspective
 Greg Johnson Chief Executive Officer Franklin Resources, Inc. Franklin Templeton Investments Our Global Perspective Dealer Use Only / Not for Distribution to the Public World-Class Investment Management
ASSA ABLOY REPORTS STRONG SALES
 25 April 2006 25 April 2006 no: 8/06 ASSA ABLOY REPORTS STRONG SALES Sales for the first quarter increased organically by 12% to SEK 7,653 M (6,269). The operating margin (EBIT) for the first quarter amounted
First Quarter Interim Management Statement. 11 April 2011
 First Quarter Interim Management Statement 11 April 211 Michael Page International First Quarter Interim Management Statement 2 Group Gross profit +29% with growth in every geography Growth Rates Group
H & M Hennes & Mauritz AB
 H & M Hennes & Mauritz AB Three-month report 1 December 2013 28 February 2014 First quarter The H&M Group s sales including VAT increased in local currencies by 12 percent during the first quarter. Converted
PRELIMINARY RESULTS rd February 2012
 23 rd February 2012 Nicandro Durante Chief Executive Proven strategy continues to deliver Superior shareholder returns Daily Relative performance to FTSE100 Price GBp 2,800 2,600 2,400 2,200 2,000 1,800
2Q 2015 FIXED INCOME REVIEW
 Go Further 2Q 2015 FIXED INCOME REVIEW JULY 28, 2015 FORD CREDIT 2Q 2015 OPERATING HIGHLIGHTS* Another strong performance with pre-tax profit of $506 million and net income of $340 million Launched a car-sharing
FINANCIAL CONFERENCE. Consolidated Business Results and Forecast. May 14, 2018 NSK Ltd.
 FINANCIAL CONFERENCE Consolidated Business Results and Forecast May 14, 2018 NSK Ltd. Cautionary Statements with Respect to Forward-Looking Statements Statements made in this report with respect to plans,
Scania Interim Report January September 2016
 28 October 2016 Scania Interim Report January September 2016 Summary of the first nine months of 2016 Operating income amounted to SEK 3,733 m. (7,046), and was negatively impacted by a provision of SEK
SCANIA 2000 INTERIM REPORT JANUARY JUNE
 SCANIA 2000 INTERIM REPORT JANUARY JUNE RESULTS First half of 2000, compared to first half of 1999 Number of trucks and buses sold: 27,647 (24,869), an increase of 11 percent. Sales of service-related
Q2 Report Johan Molin President & CEO
 Q2 Report 2009 Johan Molin President & CEO 1 Financial Highlights Q2 2009 Strong performance despite recessionary market Construction in recession throughout the world All divisions affected and declining
Alfa Laval Slide 3.
 Report for Q4 2012 - Key figures -Orders received and margins -Highlights - Development per segment - Geographical development - Financials - Outlook Mr. Lars Renström President and CEO Alfa Laval Group
Hans Wijers, CEO, Keith Nichols, CFO February 16, 2012 Press conference Q4 and FY 2011 results
 Hans Wijers, CEO, Keith Nichols, CFO February 16, 2012 Agenda Q4 and full year 2011 value and values highlights Performance improvement program, conclusion and outlook Q&A 2 Highlights 2011 revenue up
Retain. Joe Hinrichs 2014 FIRST QUARTER EARNINGS REVIEW. Executive Vice President, Ford Motor Company President, The Americas APRIL 25, 2014
 Retain LANE-KEEPING AID Joe Hinrichs 2014 FIRST QUARTER EARNINGS REVIEW Executive Vice President, Ford Motor Company President, The Americas APRIL 25, 2014 Deutsche Bank Conference (PRELIMINARY June 4,
Q4 Report Johan Molin President & CEO
 Q4 Report 2013 Johan Molin President & CEO 1 Financial highlights Q4 2013 Strong ending of the year Strong growth in Global Tech and Americas Good growth in APAC and ESD EMEA bottoming Important gains
Conference Call Q Results
 Conference Call Q1 2010 Results Bodo Uebber Member of the Board of Management Finance & Controlling and Daimler Financial Services April 27, 2010 27.04.2010 1 Highlights Q1 2010 World economy continued
Quarterly Report Q1 2018
 Quarterly Report Q1 2018 26 April 2018 The global leader in door opening solutions A good start to the year First quarter Net sales increased by 2% to SEK 18,550 M (18,142), with organic growth of 4% (6)
Baird Industrial Conference
 Baird Industrial Conference Randy Baker, President & CEO Rick Dillon, EVP & CFO November 6, 2018 Safe Harbor Statements in this presentation that are not historical are considered forwardlooking statements
ABB results continue to improve in Q2. EBIT more than doubles, net income at $86 million
 ABB results continue to improve in Q2 EBIT more than doubles, net income at $86 million Improved demand in most markets Solid increases in core division orders, revenues, EBIT Step change productivity