INDUS business model We are passionate about SMEs
|
|
|
- Sharleen Farmer
- 5 years ago
- Views:
Transcription


1
2 2


3 INDUS business model We are passionate about SMEs * As of 1 October 2017, the Group has 45 instead of 46 investments. This is the result of the integration of the FICHTHORN investment in the SELZER Group. 3


4 INDUS business model Broad portfolio as a core strategic element
5 INDUS business model Long-term oriented company model Short to medium-term return-driven investments Large Caps: Apax, Blackstone, KKR Mid Caps: DBAG, 3i, Odewald Small Caps: MBB Industries BUY and SELL TURN- AROUND BUY and HOLD Long-term investments without exit orientation INDUS Holding Aalberts Industries Gesco Greiffenberger MAX Automation Phoenix Mecano Haniel Possehl SKion Investments in companies in special situations with no long-term intention Aurelius Bavaria Industriekapital Gigaset Mutares Orlando Management 5


6 INDUS business model Investment criteria of INDUS Holding Double digit operating profit margin Broadly diversified customer base Niche position Own industrial added value Equity rate >30% Growth perspectives, also internationally EBIT EUR 2-10 million Cash flow orientation Sales of EUR million Low level/ no liabilities to banks 6


7 INDUS business model External growth in our industries of the future * Two examples for growth acquisitions in FY


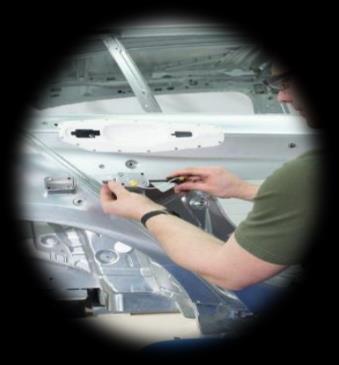
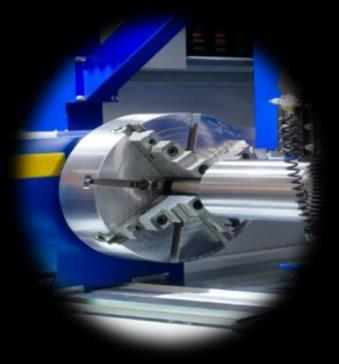
8 INDUS business model Accompanying SME hidden champions in the long term Property, plant and equipment Investments Development Innovation Acquisitions Know-how Strategic sparring Networking Knowledge transfer Financing tasks in shareholder management Accounting, taxation and law at the holding level 8
9 9


10 Strategic report Strategic growth with COMPASS

 OFA: Trading company for")


11 Strategic report Taking stock of Q AURORA: EE Electronic Equiment, Weert (NL) OFA: Trading company for medical aids (DE) Increased drawdown of development bank s offer Currently 15 development bank projects Thereof 3 new projects in Q Intensification of the support offered to the portfolio companies (cooperations and network) AURORA now also has a presence in NL through strategic addition EE Electronic Equipment SCHÄFER started operations with US subsidiary SELZER and SMA have started building up a joint production site in Romania 11


12 Growth acquisitions Strengthening of portfolio Strategic report Investments Portfolio further strengthened in 2018 TR Metalltechnik WIESAUPLAST- PMC de México* OFA acquires trading company for medical aids * Acquisition of the remaining shares (55%) 12


13 Strategic report Innovation Focus remains on innovation in Q


14 Strategic report Internationalization Strengthening the portfolio through internationalization 14


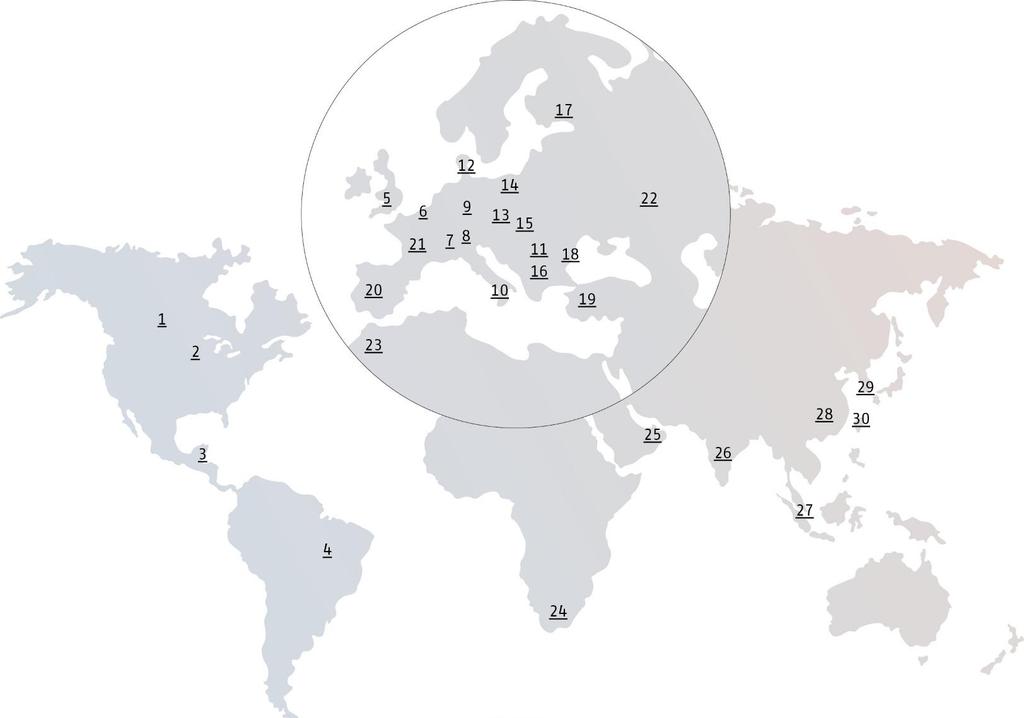


15 Strategic report Internationalization Portfolio companies meanwhile have a presence in 30 countries million 7, million 1, million 1,312 Sales and employee figures as at 12/2017, locations as at 05/2018, Europe = EU and Switzerland 15
16 16


 Porfolio companies continue")


17 INDUS in figures A look back at Q Portfolio companies continue to benefit from good economic situation Operating result adversely affected by growing cost of e energy, materials and personnel expenses, among other factors One strategic addition each for AURORA and OFA (closing in Q2 2018) Porfolio companies continue expanding internationally Both repositionings proceeding to plan; first successes of the measures taken are visible in the Metals Technology segment Guidance for 2018 confirmed 17
 8.7 9.1-0.4 pp Total assets 1,691.7 1,653.2 2.3 Equity capital 694.")
 38.0 38.0 0.0 EBIT margin adj. (in %) 9.3 10.0-0.7 pp EBT 30.")
 0.81 0.")
 45 45 0 Cash flow from investing activity -14.5-27.1-46.")
18 INDUS in figures Q at a glance Sales EBITDA EBIT EBIT margin (in %) pp Total assets 1, , Equity capital Equity ratio (in %) pp Net debt EBIT adj. (after acquisition effects) EBIT margin adj. (in %) pp EBT Earnings after taxes Operating cashflow >100 Cash flow from operating activity Earnings per share (in EUR) Employees (on average) 10,529 9, Beteiligungen (number) Cash flow from investing activity Cash flow from financing activity Cash and cash equivalents
19 INDUS in figures Income statement from Revenues again at record level EBIT margin: 8.7% Adjusted EBIT margin: 9.3% incl. repositionings, depreciation/ amortization, increased cost of materials and personnel expenses Reduced interest expenses Slightly lower tax rate +0.0% (in EUR millions) 19
20 INDUS in figures Reconciliation to adjusted operating result (adj. EBIT) (in EUR milions) * Depreciation/Amortization from fair value adjustments relate to identified assets at fair value in connection with acquisitions made by the INDUS Group. ** Impacts of fair value adjustments in inventory assets/order backlog relate to identified added value, included in the purchase price allocation and recognized after initial consolidation. 20
21 INDUS in figures Consolidated statement of cash flows Working capital increased to effectively build up inventories (due to rising materials purchasing prices) Almost halved on quarterly basis (Q incl. acquisition of M+P); investments in property, plant and equipment as well as intangible assets slightly below comparable period Moderate increase, incl. cash received from borrowings, cash paid for redemption of loans and of contingent purchase price liabilities (in EUR millions) 21


22 INDUS in figures Segments: Overview Q Sales with external third parties EBITDA Depr./Amortization EBIT EBIT margin (in %) Capital expenditure Employees 1,764 3,549 1,966 1,650 1,564 22
 slightly below prior year level Sales with external third")
23 INDUS in figures Construction/Infrastructure Q Sales revenues and earnings stay at very high level as economic activity remains good Exclusively organic revenue growth Digital infrastructure is a strong section Slightly disproportionate increase in operating result Capital expenditure (exclusively for property, plant and equipment) slightly below prior year level Sales with external third parties EBITDA Depr./Amortization EBIT EBIT margin (in %) pp Capital expenditure
 Target margin of 5-7% remains")
24 INDUS in figures Automotive Technology Q Revenue growth in line with expectations Operating result clearly below previous year; result adversely affected by expected operating losses of the portfolio company undergoing a repositioning exercise, unfavourable seasonal sales of carbide studs, increased prices in steel sector (increased cost of materials) Target margin of 5-7% remains challenging Capital expenditure incl. acquisition of EE Electronic Equipment for AURORA Sales with external third parties EBITDA Depr./Amortization EBIT EBIT margin (in %) pp Capital expenditure

25 INDUS in figures Engineering Q Strong increase in sales revenues Mostly inorganic growth due to new acquisitions M+P and PEISELER (fully consolidated for first time in Q1 2018) Operating result increases at only slightly disproportionately lower rate for billing-related reasons Capital expenditure exclusively for property, plant and equipment (Q incl. M+P acquisition) Sales with external third parties EBITDA Depr./Amortization EBIT EBIT margin (in %) pp Capital expenditure

26 INDUS in figures Medical Engineering/Life Science Q Segment is on an even keel Moderate increase in sales revenues Operating result on a par with comparable quarter Experience has shown that margin tends to improve in the course of the fiscal year Capital expenditure on a par with comparable quarter Sales with external third parties EBITDA Depr./Amortization EBIT EBIT margin (in %) pp Capital expenditure
 Capital expenditure still below previous year Sales with external third parties 105.7 96.9 9.")
27 INDUS in figures Metals Technology Q Increase in revenues mainly driven by carbide tools and mining (chisel production) First successes of the ongoing repositioning are visible Clearly disproportionate increase in operating result; EBIT margin thus back on track for full year (8-10%) Capital expenditure still below previous year Sales with external third parties EBITDA Depr./Amortization EBIT EBIT margin (in %) pp Capital expenditure


28 Outlook 2018 The world economy While growth will be slightly less dynamic, the economic environment remains generally positive in the current fiscal year. Geopolitical hotspots, the threat of a trade war and the potential risk of a hard Brexit are putting a damper on the German economy. But economic data and indicators confirm solid growth for German companies. 28


 Moderately positive underlying trend; rising energy, material and wage costs have a")
29 Outlook 2018 INDUS sectors Economic framework remains very good; capacities restricted by shortage of skilled labour; construction and security technology are sectors of the future for INDUS OEMs increase their investment budgets again; pre-series suppliers remain under margin pressure; rising steel prices put margins under additional pressure Situation remains positive; hard Brexit is a risk factor; development potential for logistics sector; targeting growth through acquisitions Environment remains positive in spite of increasing regulation; prospects in demographic area; acquisitions desired (but not at excessive prices) Moderately positive underlying trend; rising energy, material and wage costs have a limiting effect 29
 Further acquisitions planned (planned investment volume of EUR 50 million)")
30 Outlook 2018 INDUS Group COMPASS 2020 strategy to be continued in 2018 Continued sharpening of strategic priorities such as innovation and digitization Continuation of the investment drive (EUR 88 million planned for property, plant and equipment and intangible assets) Further acquisitions planned (planned investment volume of EUR 50 million) 30


31 Outlook 2018 Guidance for the Group confirmed Sales EUR 1,640.6 million EUR billion EBIT EUR million EUR million Acquisitions 2 growth acquisitions 2 growth acquisitions Investments in property, plant, EUR 79.0 million EUR 88 million and equipment and intangible assets Equity ratio 40,8% >40% Ratio of net debt to EBITDA 1.9 years years 31
32 32
33 Share and dividend Reliable participation in success Dividend of EUR 1.50 per share proposed for FY 2017 (EUR 1.35 in previous year). INDUS Holding AG s profit distribution would thus total EUR 36.7 million, which would be equivalent to 43.9% of the distributable profit (42.7% in previous year). The remaining amount is to be reinvested to strengthen the Group. 33

 Tradegate Exchange, Berlin, Hamburg, Hanover, Munich, Stuttgart (open market) SDAX Bankhaus Lampe, Commerzbank, HSBC")
34 Share and dividend Very stable shareholder base WKN/ISIN /DE Established/IPO 1986/1995 Fiscal year Capital stock Number of shares EUR 63,6 milion Last capital increase Free float approx. 72% Stock exchanges Index Designated Sponsors 24,450,509 no-name bearer shares XETRA, Düsseldorf, Frankfurt (regulated market) Tradegate Exchange, Berlin, Hamburg, Hanover, Munich, Stuttgart (open market) SDAX Bankhaus Lampe, Commerzbank, HSBC Trinkaus & Burkhardt 34


35 Share and dividend Analysts estimates and target prices INDUS share currently covered by eight banks and investment firms. Most recently, Equinet Bank started equity research on INDUS again in August The average target price currently stands at EUR

36 Share and dividend Price performance Jul-12 Jan-13 Jul-13 Jan-14 Jul-14 Jan-15 Jul-15 Jan-16 Jul-16 Jan-17 Jul-17 Jan-18 INDUS Holding AG DAX Index SDAX Performance Index INDUS Holding AG DAX Index SDAX Performance Index 36

37 37


38 INDUS in figures Performance in the past five years 1, , , , , % 10.1% 9.8% 10.0% 9.3% % 18.0% 16.0% 14.0% 12.0% 10.0% 8.0% 6.0% 4.0% 2.0% 0.0%
39 INDUS in figures Performance of the segments in the past five years 39


40 Financial calendar Publication and capital market dates in May 2018 Interim Report on Q Publication 24 May 2018 Annual Shareholders' Meeting Cologne 29 May 2018 Roadshow Zurich 12 July 2018 Roadshow Rhineland 14 August 2018 Interim Report on H1/Q Publication 16 August 2018 Roadshow Frankfurt am Main 29 August 2018 Commerzbank Sector Conference Frankfurt am Main 5 September 2018 Zurich Capital Market Conference Zurich 20 September 2018 Roadshow Paris 10 October 2018 Roadshow Stuttgart 18 October 2018 Roadshow London 14 November 2018 Interim Report on 9M/Q Publication 21 November 2018 Roadshow Munich 27 November 2018 Deutsches Eigenkapitalforum Frankfurt am Main 40
INTERIM REPORT I N D U S Holding AG
 INTERIM REPORT 2018 H1 I N D U S Holding AG HIGHLIGHTS CONTENTS INDUS continues positive trend Revenues climb 5.1% based on strong organic growth Earnings per share up disproportionately to EUR 1.76 [1]
From melting steel to 3D-printing: investing in the technology-driven German Mittelstand. as at 31 October 2016
 From melting steel to 3D-printing: investing in the technology-driven German Mittelstand as at 31 October 2016 1. The business model GESCO an association of industrial SMEs including market and technology
Preliminary results February 21, 2019
 Preliminary results 2018 February 21, 2019 Q4 2018: TAKKT Group Sales (in EUR million) EBITDA (in EUR million) and margin (in %) 270.7 303.1 30.6 39.8 11.3% 13.1% Q4/17 Q4/18 Sales increase by 12.0% Organic
RELAUNCH. Presentation November as at 14 Nov. 2017
 RELAUNCH Presentation November 2017 as at 14 Nov. 2017 1989 Founding LONG TERM Investor 4 GROUP SEGMENTS GESCO PROFILE 17 PORTFOLIO COMPANIES 01 IN BRIEF ~ 500 million GROUP SALES 100% TAKEOVER UP TO 3
RELAUNCH. Presentation January as at 8Jan. 2018
 RELAUNCH Presentation January 2018 as at 8Jan. 2018 1989 Founding LONG TERM Investor 4 GROUP SEGMENTS GESCO PROFILE 17 PORTFOLIO COMPANIES 01 IN BRIEF ~ 500 million GROUP SALES 100% TAKEOVER UP TO 3 Acquisitions
Nine-Month 2008 Results Analysts Conference Call. November 11, 2008
 Nine-Month 28 Results Analysts Conference Call November 11, 28 HIGHLIGHTS Highlights in the first nine months 28 Good operating results in Q3 Total revenues for the first nine months increase by 17% to
Engelskirchen 30 June Annual accounts press conference / analysts meeting
 Engelskirchen 30 June 2016 Annual accounts press conference / analysts meeting Overview 1. Business model 2. Financial year 2015/2016 3. Financial year 2016/2017 4. Capital market and M&A 5. Portfolio
RELAUNCH ODDO BHF GERMAN CONFERENCE. Frankfurt/Main, 21/22 Feb. 2018
 RELAUNCH ODDO BHF GERMAN CONFERENCE Frankfurt/Main, 21/22 Feb. 2018 1989 Founding LONG TERM Investor 4 GROUP SEGMENTS GESCO PROFILE 17 PORTFOLIO COMPANIES 01 IN BRIEF > 500 million GROUP SALES 100% TAKEOVER
technology-driven German Mittelstand
 From melting steel to 3D-printing: investing in the technology-driven German Mittelstand as at 9 October 2015 1. Business model GESCO Group an association of industrial SMEs with market and technology
Driving Innovation. Developing Potential. Quarterly Statement as of March 31, 2018
 Driving Innovation. Developing Potential. Quarterly Statement as of March 31, 2018 Werdohl, April 26, 2018 Disclaimer Note: This presentation contains statements concerning the future business performance
Q Stable business performance
 Q3 2014 Stable business performance January 1 to September 30, 2014 key figures (in EUR millions) 1.1. 30.9.2014 1.1. 30.9.2013* Sales 926.9 880.9 EBITDA 124.5 119.2 EBIT 91.5 88.1 Net result for the period
as at 9 October 2018 Company Presentation
 as at 9 October 2018 Company Presentation Overview 1. Business Model 2. Current financial year 2018/2019 3. M&A 4. GESCO on the stockmarket 2 1. Business Model GESCO an association of industrial SMEs including
TRANSFORMATION VALUE SUCCESS
 Increased maneuverability More efficient IT organization Optimal Business Support Managing Change In IT TRANSFORMATION VALUE SUCCESS Henry Göttler COO SNP Schneider-Neureither & Partner AG Eigenkapitalforum
AURELIUS GROUP Conference Call
 xxx 16 November 2015 2015 AURELIUS GROUP Conference Call 1 AGENDA AURELIUS acquires Valora Trade AURELIUS acquires Colt Managed Cloud Business Performance YTD & Outlook 2 AURELIUS acquires from Swiss Valora
HSBC Real Estate Conference. Frankfurt, 27 February 2008
 HSBC Real Estate Conference Frankfurt, 27 February 2008 Contents Company Shopping Centers Financials Shopping Center Share Appendix 2 Equity Story Deutsche EuroShop is Germany s only public company that
with unique access to hidden champions of the German Mittelstand creating value for shareholders and delivering strong returns
 M E E T I N G E X P E C T A T I O N S. K E E P I N G P R O M I S E S. C R E A T I N G V A L U E T H R O U G H E X P E R I E N C E A N D P E R S E V E R A N C E G E R M A N E Q U I T Y F O R U M 2 7 N O
CONFERENCE CALL. 9M 2015 Results
 CONFERENCE CALL 9M 2015 Results 13.11.2015 9M 2015 SHOPPING CENTERS Retail turnover 9M 2015 1) Retail sector % change rent-to-sales ratio in % % of sales % of space Department stores -2.3 6.0 7.8 13.5
CORESTATE Capital Group
 CORESTATE Capital Group Q3 2017 Earnings Presentation November 2017 Disclaimer This presentation contains forward-looking statements that involve a number of risks and uncertainties. Such statements are
The Art of Shopping. Interim Report H1 2005
 The Art of Shopping Interim Report H1 2005 Key Figures Key Group Figures 1 Jan.- 1 Jan.- E million 30 June 2005 30 June 2004 Change Revenue 35.2 30.7 14% EBIT 28.4 24.3 17% Net finance costs -13.9-12.2-14%
CONSOLIDATED INTERIM FINANCIAL STATEMENTS
 CONSOLIDATED INTERIM FINANCIAL STATEMENTS 30 JUNE 2018 2 UNAUDITED CONSOLIDATED STATEMENT OF PROFIT AND LOSS. 30 JUNE 2018 30 JUNE 2017 Revenue 257,231 126,707 Costs of sales 210,803 99,490 Gross profit
9M 2018 RESULTS 09 NOVEMBER 2018 TLG IMMOBILIEN AG 9M 2018 RESULTS
 TLG IMMOBILIEN AG 9M 208 RESULTS DISCLAIMER This presentation includes statements, estimates, opinions and projections with respect to anticipated future performance of TLG IMMOBILIEN ("Forward-Looking
From melting steel to 3D-printing: investing in the technology-driven German Mittelstand. as at 22 March 2017
 From melting steel to 3D-printing: investing in the technology-driven German Mittelstand as at 22 March 2017 1. Business model highlights 1 holding company 28 years of experience 4 divisions ~500 m sales
Half-Year Interim Report report
 Half-Year Interim Report 2018 report Consolidated Key Figures Q2 2018 Q2 2017 Half-yearly report 2018 Half-yearly report 2017 Incoming orders (EUR million) 23.3 17.8 44.4 39.5 Revenue (EUR million) 21.4
Think digital, act digital. Analysts Conference Frankfurt, March 21, 2018
 Think digital, act digital Analysts Conference Frankfurt, March 21, 2018 Agenda 1. Business model 2. Strategy 3. Key performance figures and indicators 4. Financial year 2017 5. Outlook 2018 6. TAKKT share
Wacker Neuson SE H1/18 Conference Call. Martin Lehner (CEO), Wilfried Trepels (CFO) August 7, 2018
, Wilfried Trepels (CFO) August 7, 2018") Wacker Neuson SE H1/18 Conference Call Martin Lehner (CEO), Wilfried Trepels (CFO) August 7, 218 Agenda H1/18 Overview Financials Outlook 2 Key Figures Q2/18 H1/18 Revenue yoy EBIT yoy Adj. EBIT yoy Revenue
Wacker Neuson SE H1/18 Conference Call Martin Lehner (CEO), Wilfried Trepels (CFO) August 7, 218 Agenda H1/18 Overview Financials Outlook 2 Key Figures Q2/18 H1/18 Revenue yoy EBIT yoy Adj. EBIT yoy Revenue
Earnings per share (basic) in EUR Earnings per share (diluted) in EUR Number of employees at end of period
 in EUR Earnings per share (diluted) in EUR Number of employees at end of period") At a glance January 1 until September, 30, 2018 in EUR k September 30, 2018 September 30, 2017 Sales 123,306 102,219 Gross profits 63,655 57,360 EBITDA 6,927 8,634 Operating returns (EBIT) 4,731 6,926
At a glance January 1 until September, 30, 2018 in EUR k September 30, 2018 September 30, 2017 Sales 123,306 102,219 Gross profits 63,655 57,360 EBITDA 6,927 8,634 Operating returns (EBIT) 4,731 6,926
Shaping digital transformation. Unicredit & Kepler Cheuvreux GCC, Frankfurt
 Shaping digital transformation Unicredit & Kepler Cheuvreux GCC, Frankfurt Business model January 2018 Unicredit & Kepler Cheuvreux GCC 2 TAKKT is a portfolio of B2B direct marketing specialists January
Conference Call OHB SE Q2/Six-month results 2018
 August 9, 218 Conference Call OHB SE Q2/Six-month results 218 Marco Fuchs, Chairman of the Management Board Kurt Melching, Member of the Management Board OHB AG Corporate news OHB SE Kurt Melching (Finance)
Company Presentation. Mr. Claus-Matthias Böge, CEO. German Equity Forum Frankfurt am Main, 22 November The Art of Shopping
 1 The Art of Shopping Company Presentation Mr. Claus-Matthias Böge, CEO German Equity Forum Frankfurt am Main, 22 November 2005 The Art of Shopping Company 3 Equity Story Pure Player Deutsche EuroShop
Rolling Up German Real Estate
 Rolling Up German Real Estate Initiative Immobilien-Aktie Frankfurt / Main Frank Schaich, CEO Page 1 1. Snapshot 2. Fair Value s strategy 3. Real estate portfolio 4. Direct investments 5. Participations
Think digital, act digital. Spring Roadshow April 2018
 Think digital, act digital Spring Roadshow April 2018 Agenda 1. Business model 2. Strategy 3. Key performance indicators 4. Financial year 2017 5. Outlook 2018 6. TAKKT share and dividend policy 7. TAKKT
HIGHLIGHTS AT A GLANCE
 1 HIGHLIGHTS AT A GLANCE M.A.X. Automation Group with a strong third quarter and a positive development in the first nine months of 2015 Consolidated sales rise by 5.3 % to EUR 266.3 million after nine
On track! Results for Q1 Q3 2017
 On track! Results for Q1 Q3 2017 Technology-based financial services Investment highlights in Q1 Q3 2017 and forecast for 2017 Key figures for Q1 Q3 2017 (yoy) Revenue: 143.7 million (+27%) EBIT: 18.6
M.A.X. AUTOMATION AG QUARTERLY STATEMENT I.2016
 M.A.X. AUTOMATION AG QUARTERLY STATEMENT I.2016 Key share data Q1 2016 LETTER FROM THE MANAGEMENT BOARD Ticker / ISIN MXH / DE0006580905 Dear shareholders, Registered capital Closing price (March 31, 2016)*
11% 10% Operating result (EBIT) EBIT margin in % Equity and equity ratio in EUR millions and in % % 56% 39% Equity Equity ratio in %
 EBIT margin in % Equity and equity ratio in EUR millions and in % % 56% 39% Equity Equity ratio in %") 2017 Interim Report Kardex Group at a glance Net revenues 1.1.-30.6. in EUR millions Operating result (EBIT) and EBIT margin 1.1.-30.6. in EUR millions and in % 200 25 160 20 11% 11% 120 80 15 10 7% 8%
2017 Interim Report Kardex Group at a glance Net revenues 1.1.-30.6. in EUR millions Operating result (EBIT) and EBIT margin 1.1.-30.6. in EUR millions and in % 200 25 160 20 11% 11% 120 80 15 10 7% 8%
HIGHLIGHTS AT A GLANCE
 1 HIGHLIGHTS AT A GLANCE M.A.X. Group achieved extraordinarily high order intake of EUR 129.3 million in the second quarter of 2016 - Order backlog reached EUR 177.4 million at the end of June Group sales
Press Release May 31, 2017
 ISRA VISION AG: 1st half year 2016 / 2017 A further step to 150 +: Revenues and EBT each grow by +11% Double-digit growth in the first six months ISRA continues growth path with high order backlog Revenues
H PRODUCED BY: OBJEKT: INTERIM REPORT BUILDING BUSINESS
 OBJEKT: INTERIM REPORT H1 2006 PRODUCED BY: BUILDING BUSINESS 24.8 KEY FIGURES KEY GROUP FIGURES 1 Jan. 1 Jan. million 30 June 2006 30 June 2005 Change Revenue 45.9 35.2 30% EBIT 39.0 28.2 38% Net finance
key figures net SaLeS and ebit margin BaLance Sheet Structure net SaLeS and ebit margin By region ratio of operating income to financial income
 q108 interim report per 03/31/2008 key figures FIG. 1, PAGE 1 net SaLeS and ebit margin IN KEUR 8,000 6,000 4,589 5,006 5,207 5,511 5,488 6,707 7,512 7,644 7,200 20 % 15 % 4,000 10 % 2,000 5 % q1 q2 q3
Deutsche Wohnen SE.» 9M 2017 results. Conference Call, 14 November 2017
 Deutsche Wohnen SE» 9M 2017 results Conference Call, 14 November 2017 1 » Agenda 1 Highlights 9M 2017 2 Portfolio 3 Financials 4 Appendix 2 » Highlights 9M 2017 Strong operating business L-f-l rental growth
OSRAM holding its ground in a difficult market environment
 www.osram.com OSRAM holding its ground in a difficult market environment Q3 FY18 Earnings Release (unaudited figures) August 1, 2018 Light is OSRAM Disclaimer This presentation may contain forward-looking
UNTERNEHMEN UND AKTIONÄRE CHAP. 1 FAST AND RESPONSIVE AROUND THE WORLD
 UNTERNEHMEN UND AKTIONÄRE 1 CHAP. 1 FAST AND RESPONSIVE AROUND THE WORLD INDUS ANNUAL REPORT 2014 2 INDUS ANNUAL REPORT 2014 SCHNELL UND BEWEGLICH IN DIE WELT PROFILE As the leading specialist in the field
INVESTOR AND ANALYST PRESENTATION Deutsches Eigenkapitalforum Speaker: Florian Seubert, Vorstand / CFO
 INVESTOR AND ANALYST PRESENTATION Deutsches Eigenkapitalforum 2010 Speaker: Florian Seubert, Vorstand / CFO AGENDA zooplus in a nutshell Key strategic initiatives Summary 9M 2010 Profit & Loss Balance
Group quarterly report as per September 30, November 21, 2017
 Group quarterly report as per September 3, 217 November 21, 217 Outline 1) Performance Summary 9M/Q3 217 2) Order Intake and Revenue 3) EBIT 4) Balance Sheet 5) Cash Flow 6) Segments 7) Priorities until
COMPANY PRESENTATION. Deutsches Eigenkapitalforum 2012 Dr. Cornelius Patt, CEO
 COMPANY PRESENTATION Deutsches Eigenkapitalforum 2012 Dr. Cornelius Patt, CEO SAFE HARBOR STATEMENT This document includes supplemental financial measures that are or may be non-gaap financial measures.
The Art of Shopping. Interim Report Q1 2005
 The Art of Shopping Interim Report Q1 2005 Key Figures Key Group Figures 1 Jan. 1 Jan. E million 31 Mar. 2005 31 Mar. 2004 Change Revenue 17.4 14.9 17% EBIT 13.8 13.2 5% Net finance costs -6.8-5.0-36%
Results of the first nine months October 25, 2018
 Results of the first nine months 2018 October 25, 2018 Q3 2018: TAKKT Group Sales (in EUR million) 280.4 310.7 EBITDA (in EUR million) and margin (in %) 37.7 41.2 13.4% 13.3% Q3/17 Q3/18 Sales increase
Half-Year Interim Report report. optimize!
 Half-Year Interim Report 2017 report optimize! Consolidated Key Figures Q2 2017 Q2 2016 Half-yearly report 2017 Half-yearly report 2016 Incoming orders (EUR million) 17.8 21.9 39.5 39.6 Revenue (EUR million)
MAX Automation AG. 6M Report 2017
 MAX Automation AG 6M Report 2017 HIGHLIGHTS AT A GLANCE MAX Group posts strong business performance in the first half of 2017 fully in line with expectations Order backlog as of June 30 at a high level
Preliminary results February 15, 2018
 Preliminary results 2017 February 15, 2018 Q4 2017: TAKKT Group Sales (in EUR million) EBITDA (in EUR million) and margin (in %) 283.3 270.7 33.9 30.6 12.0% 11.3% Q4/16 Q4/17 Sales decrease by 4.4% mainly
Investor Meeting Presentation
 Investor Meeting Presentation November 2014 Investor Meeting Presentation HUGO BOSS November 2014 2 / 54 Agenda Update on Key Strategic Initiatives Nine Months Results 2014 Outlook Investor Meeting Presentation
Quarterly Financial Report 30 September 2017
 Quarterly Financial Report 30 September 2017 Aumann AG, Beelen Welcome Note from the Managing Board Dear fellow shareholders, After a highly successful first half of the year, the third quarter of 2017
IR presentation. for 3. quarter 2015
 IR presentation for 3. quarter 2015 November 6th, 2015 Agenda 1 2 3 4 technotrans business model technotrans strategy technotrans finances and outlook technotrans share page 2 technotrans group of companies
AHLERS AG, HERFORD Interim Report Q3 2013/14
 AHLERS AG, HERFORD Interim Report Q3 2013/14 2 INTERIM REPORT Q3 2013/14 AHLERS AG INTERIM REPORT Q3 2013/14 (December 1, 2013 to August 31, 2014) BUSINESS PERFORMANCE IN THE FIRST NINE MONTHS OF FISCAL
Forum in Frankfurt / Main
 6-month report 2009 / 2010 Key figures at a glance (IFRS) 6 month 2009 / 2010 (Jul 1, 2009 Dec 31, 2009) Comparable period (Jul 1, 2008 Dec 31, 2008) Revenues 15,261 20,216 Earnings before interest and
Private equity an attractive asset class
 26 shares Shares Private equity an attractive asset class Private equity is a highly attractive investment option that, compared with other equity investments, especially stock investments, frequently
QUARTERLY REPORT. For the first half of >> Profit for first half considerably higher than previous year Second quarter confirms positive outlook
 QUARTERLY REPORT For the first half of 2007 >> Profit for first half considerably higher than previous year Second quarter confirms positive outlook FUCHS PETROLUB AG THE FIRST HALF 2007 AT A GLANCE [in
Q1/2016 Results Analyst and Investor Conference Call. 28 April 2016
 Q1/2016 Results Analyst and Investor Conference Call 28 April 2016 Deutsche Börse Group 1 Highlights Q1/2016 Results Presentation First quarter 2016 results were driven by Eurex s best quarter ever; strong
Mixed picture, Focus on Execution Q2 FY 2013, Analyst Conference London, May 2, 2013
 Peter Löscher, President and CEO Joe Kaeser, CFO Mixed picture, Focus on Execution siemens.com/answers Safe Harbour Statement This document contains statements related to our future business and financial
Financial Results FY 2009 VTG AG On a safe track to a sustainable future
 Financial Results FY 2009 VTG AG On a safe track to a sustainable future Hamburg, April 20 th 2010 Speakers: Dr. Heiko Fischer, CEO Dr. Kai Kleeberg, CFO Table of content 1 Executive Summary 2 Top Priorities
2011 feelestate.de CONFERENCE CALL INTERIM REPORT H August 2011
 2011 feelestate.de CONFERENCE CALL INTERIM REPORT H1 2011 11 August 2011 H1 2011 Highlights H1 2011 January: Increase of the shareholding in Stadt-Galerie Hameln to 100% March: Opening of the Extension
Bernstein Strategic Decisions Conference // London
 Bernstein Strategic Decisions Conference // London HUGO BOSS Company Handout September 17, 2014 Dennis Weber, Head of Investor Relations Bernstein Strategic Decisions Conference // London HUGO BOSS September
Strong start to the year. Financial results for the first quarter of 2016
 Strong start to the year Financial results for the first quarter of 2016 Mission: financial services supported by technology Investment highlights of Q1 2016 Earnings: up by 42 per cent to 5.4 million
CORESTATE Capital. Company Presentation. February 2018
 CORESTATE Capital Company Presentation February 2018 Disclaimer This presentation contains forward-looking statements that involve a number of risks and uncertainties. Such statements are based on a number
Loys New Year Reception. Oldenburg, 22 January IMPULSES How we drive development
 Loys New Year Reception Oldenburg, 22 January 2015 IMPULSES How we drive development INDUS a successful mid-market player About Jürgen Abromeit Jürgen Abromeit born 1960 Member of the Board of Management
CONFERENCE CALL HALF-YEAR FINANCIAL REPORT AUGUST 2017
 CONFERENCE CALL HALF-YEAR FINANCIAL REPORT 207 6 AUGUST 207 RETAIL TURNOVER H 207 RETAILERS Retail sector % change to 206 rent-to-sales ratio in % % of sales % of space Department stores -.4 6.3 7.3 3.0
ANALYSTS CONFERENCE 2011
 ANALYSTS CONFERENCE 2011 Metzingen March 29, 2011 Analysts Conference 2011 HUGO BOSS March 29, 2011 2 / 48 AGENDA 2010 HIGHLIGHTS GROWTH STRATEGY 2010 FINANCIAL YEAR OUTLOOK Analysts Conference 2011 HUGO
Quarterly Report Q3 Financial Year 2016 / Touching the Future of Vision Automation
 Quarterly Report Q3 Financial Year 2016 / 2017 Touching the Future of Vision Automation 150 ISRA VISION Quarterly Report Q3 Financial Year 2016 / 2017 2 rd ISRA VISION AG: 3 quarter 2016 / 2017 revenues
BofAML Global Consumer & Retail Conference // London
 BofAML Global Consumer & Retail Conference // London HUGO BOSS Company Handout September 18, 2014 Mark Langer, CFO I Dennis Weber, Head of Investor Relations BofAML Global Consumer & Retail Conference
J.P. Morgan Investor Conference // Milan
 J.P. Morgan Investor Conference // Milan HUGO BOSS Company Handout September 30, 2014 Dennis Weber, Head of Investor Relations J.P. Morgan Investor Conference // Milan HUGO BOSS September 30, 2014 2 /
Quarterly Report Q1 Financial Year 2015 / Innovating vision. Powering growth.
 Quarterly Report Q1 Financial Year 2015 / 2016 Innovating vision. Powering growth. 150 ISRA VISION Quarterly Report Q1 Financial Year 2015 / 2016 2 ISRA VISION AG: First Quarter of 2015/2016 Revenues grown
MANZ AG WEBCAST FINANCIAL FIGURES 6M/2016 AUGUST 11, 2016 / DIETER MANZ, MARTIN HIPP
 MANZ AG WEBCAST FINANCIAL FIGURES 6M/2016 AUGUST 11, 2016 / DIETER MANZ, MARTIN HIPP SUMMARY Revenues of EUR 124.0m slightly above previous year (6M/2015: EUR 121.9m) Order stop on short notice in Energy
The Art of Shopping. Interim Report Q
 The Art of Shopping Interim Report Q1 3 2005 Key Figures Key Group Figures 1 Jan. 1 Jan. E million 30 Sept. 2005 30 Sept. 2004 Change Revenue 53,3 45,3 18% EBIT 42,9 39,7 8% Net finance costs -20,8-17,7-18%
Interim Report 1 January to 30 September Interim Group Management Report FOCUS ON EFFICIENCY
 Interim Report 1 January to 30 September 2016 Interim Group Management Report 1 FOCUS ON EFFICIENCY 2 SHW AG Interim Report for the Period from 1 January to 30 September 2016 Contents Company profile...
Interim report as per March 31, 2017
 Interim report as per March 31, 2017 Key financial figures Sales (in keur) Operating income (in keur) Financial income (in keur) 2013 7,978 2014 11,063 2015 13,659 2016 14,425 2017 14,795 3M 2017 14,795
Results FY 2017 Schaeffler AG. Conference Call March 7, 2018 Munich
 Results FY 2017 Schaeffler AG Conference Call Munich Disclaimer This presentation contains forward-looking statements. The words "anticipate", "assume", "believe", "estimate", "expect", "intend", "may",
A tradition of achievement. Interim report 1st to 3rd quarter 2014
 A tradition of achievement Interim report 1st to 3rd quarter 2014 FIRST TO THIRD QUARTER AT A GLANCE DEUTZ Group: Overview 7 9/2014 7 9/2013 1 9/2014 1 9/2013 DEUTZ Group: Segments 7 9/2014 7 9/2013 1
OVERVIEW, GROUP RESULTS Q1/2017: KEY FIGURES BUSINESS DEVELOPMENT. ¼¼Incoming orders: 60.4 million (previous year: 23.
 3-MONTH REPORT 2017 GROUP KEY FIGURES JANUARY - MARCH 2015/2016/2017 KEY FIGURES in m* QI 2015 QI 2016 QI 2017 Changes to previous year Sales revenues 22.3 22.4 36.3 62 % Incoming orders 21.0 23.5 60.4
GERRY WEBER International AG Interim report Q2 2010/2011. Report on the six-month period ended 30 April 2011 WKN: ISIN: DE
 GERRY WEBER International AG Interim report Q2 2010/2011 Report on the six-month period ended 30 April 2011 WKN: 330 410 ISIN: DE0003304101 The GERRY WEBER share Gaining roughly 27 percent, the GERRY WEBER
Press Release December 15, 2017
 ISRA VISION AG: 2016 / 2017 financial year Revenues and EBT +11 %, cash flow significantly stronger ISRA again matches full year guidance: Heading for the next revenue level with double-digit growth rates
FINANCIAL REPORT 30 NOVEMBER ST HALF OF FISCAL YEAR 2017/2018
 FINANCIAL REPORT 30 NOVEMBER 2017 1ST HALF OF FISCAL YEAR 2017/2018 CONTENTS 03 KEY PERFORMANCE INDICATORS 04 HIGHLIGHTS 05 HELLA ON THE CAPITAL MARKET 07 INTERIM GROUP MANAGEMENT REPORT 07 Economic development
feelestate.de Key Group Data Key Share Data Dear Shareholders, Dear Readers, 3 million million, up from million in 2007.
 Key Group Data Letter from the Executive Board 2007 2008 3 million 01.01.-30.06. 2008 01.01.-30.06. 2007 Change Revenue 55.2 45.6 21% EBIT 46.0 37.8 22% Net finance costs -24.1-19.7-22% EBT 26.3 18.2 45%
Welcome to the conference call Dürr AG. Results January-March 2007 Dürr Group
 Welcome to the conference call Dürr AG Results January-March 2007 Dürr Group Stuttgart, May 10, 2007 Disclaimer This presentation has been prepared independently by Dürr AG ( Dürr ). The presentation contains
Annual Press Conference
 Annual Press Conference Düsseldorf, 12 April 2016 1. INDUS Passionate about SMEs 2. Overview 2015 3. Financial development 4. Dividend and share 5. Outlook 2016 6. Appendix AGENDA 2 1. INDUS Passionate
MAX AUTOMATION AG QUARTERLY STATEMENT III.2016
 MAX AUTOMATION AG QUARTERLY STATEMENT III.2016 Key share data Q3 2016 LETTER FROM THE MANAGEMENT BOARD Ticker / ISIN MXH / DE0006580905 Dear shareholders, Number of shares Closing price (30 / 9 / 2016)*
Quarterly Statement for Q Metzingen, November 2, HUGO BOSS increases pace of growth in own retail
 Quarterly Statement for Q3 2017 Metzingen, November 2, 2017 HUGO BOSS increases pace of growth in own retail Currency-adjusted sales up 3% in the third quarter Retail comp store sales up 5% EBITDA before
2 CARLO GAVAZZI GROUP
 2 CARLO GAVAZZI GROUP At a Glance Reported figures (CHF million ) 1.4. - 30.9.17 1.4. - 30.9.16 % Bookings 73.1 67.8 7.8 Operating revenue 70.4 66.2 6.3 EBITDA 8.2 9.6-14.6 EBIT 6.4 7.9-19.0 Net income
Bilfinger Berger: Entering new growth phase
 Bilfinger Berger: Entering new growth phase Roadshow London, Roland Koch, CEO Andreas Müller, Head of Corporate Accounting and Investor Relations Agenda 1. Bilfinger Berger Overview 2. Preliminary figures
Nordex SE Conference Call H Hamburg, 14/08/2012
 Nordex SE Conference Call H1 2012 Hamburg, 14/08/2012 AGENDA 1. Highlights H1 2012 Dr. J. Zeschky 2. Market development and order intake Dr. J. Zeschky 3. Financials B. Schäferbarthold 4. Guidance 2012
Quarterly Report Q1 Financial Year 2017 / Vision Competence For Automation Excellence INDUSTRIE 4.0
 Quarterly Report Q1 Financial Year 2017 / 2018 Vision Competence For Automation Excellence 200+ 150 INDUSTRIE 4.0 ISRA VISION Quarterly Report Q1 Financial Year 2017 / 2018 2 ISRA VISION AG: First quarter
Analyst and Investor Conference Call Q2 2018
 Analyst and Investor Conference Call Q2 2018 Ulrik Svensson CFO and Member of the Executive Board Frankfurt, 31 July 2018 Disclaimer The information herein is based on publicly available information. It
BUILDING THE FUTURE TOGETHER HALF YEAR REPORT AS OF JUNE 30, 2017
 HALF YEAR REPORT AS OF JUNE 30, 2017 BUILDING THE FUTURE TOGETHER To our shareholders Patrik Heider, Spokesman of the Executive Board and CFOO The Nemetschek Group has continued on its course of dynamic
Fiscal year 2011 off to a strong start
 Fiscal year 2011 off to a strong start Peter Löscher, President and CEO Joe Kaeser, CFO Q1 FY 11 Analyst call January 25, 2011 Copyright Siemens AG 2011. All rights reserved. Safe Harbour Statement This
Investor Presentation
 Investor Presentation Deutsches Eigenkapitalforum, Frankfurt Dr. Cornelius Patt, CEO Andreas Grandinger, CFO November 11-13th, 2013 Safe Harbor Statement This document includes supplemental financial measures
Annual Report 2017 W&W Group. Analyst Conference Call March, 28 th 2018
 Annual Report W&W Group Analyst Conference Call March, 28 th 2018 Agenda 1 Overview Group Financial Results 2 Segment Details 3 Group Strategy and Outlook Page 2 Overview Group Financial Results Highlights
Zwei Antriebswelten. Eine Strategie Embracing both worlds combustion and electric
 ElringKlinger Group Zwei Antriebswelten. Eine Strategie Embracing both worlds combustion and electric A Conference Call Preliminary Results Business Year 2010 March 14, 2011 1 Business year 2010: Key developments
Annual Press Conference. Düsseldorf March 27, 2017
 Annual Press Conference Düsseldorf March 27, 2017 1. 2. 3. 4. 5. Strategic report New paths to tomorrow Fiscal year 2016 Dividend and share Outlook 2017 Appendix 2 Strategic report We are passionate about
INTERIM STATEMENT Q1 2018
 INTERIM STATEMENT Q1 2018 DERMAPHARM AT A GLANCE Group results at a glance Q1 / 2018 Q1 / 2017 Revenue EUR million 137.5 118.1 Adjusted EBITDA* EUR million 36.2 28.9 Adjusted EBITDA margin* % 26.3 24.5
6-Month Report Investor Relations: Tel Fax:
 CENIT AG Industriestraße 52-54 70565 Stuttgart Tel. +49 7 11 78 25-30 Fax: +49 7 11 78 25-40 00 ISIN: DE0005407100 Internet: www.cenit.de Investor Relations: Tel. +49 7 11 78 25-3320 Fax: +49 7 11 78 25
Company Release Fiscal Year 2016/17
 Company Release Fiscal Year 2016/17 October 1, 2016 to September 30, 2017 At a Glance Key Aurubis Group figures Q4 Fiscal year 2016/17 2015/16 Change 2016/17 2015/16 Change Revenues m 2,851 2,399 19 %