HIGHLIGHTS AT A GLANCE
|
|
|
- Lee Blake
- 5 years ago
- Views:
Transcription
1 1
2 HIGHLIGHTS AT A GLANCE M.A.X. Group achieved extraordinarily high order intake of EUR million in the second quarter of Order backlog reached EUR million at the end of June Group sales adjusted for portfolio effects of EUR million 1.9% lower than the previous year after six months EBIT before PPA amortization of EUR 5.0 million after six months thus below expectations Positive interest effects from the reorganization of group financing Significant improvement in sales and earnings expected in the second half Management Board confirms outlook for the full year 2016 CONSOLIDATED RESULTS AT A GLANCE (IFRS) in EUR mill. Jan-June 2016 Jan-June 2015 Change New order intake % Order book position * % Revenue % EBITDA % EBIT before PPA 5,0 7,6-34,6 % EBIT after PPA 2,8 5,3-46,4 % Earnings for the period 0,4 2,3-84,0 % EBIT per share before PPA (in EUR) 0,18 0,28-34,6 % Earnings per share (in EUR) 0,01 0,09-84,0 % * Date June 30, 2016, compared to June 30, 2015 in EUR mill Change Equity 106, % Equity ratio (in %) pp Gross financial debt % Cash and cash equivalents % Net debt % Employees (by headcount)* - of which trainees* * Date June 30, 2016, compared to June 30, , , % -9.6% 2
3 TO OUR SHAREHOLDERS Letter from the Management Board Dear shareholders, M.A.X. Automation AG recorded by far the highest order intake in a single quarter in the second quarter of Orders rose by 52.0% in the months April to June to EUR million compared with the same period of last year. The positive development resulted from a vibrant business development in the Industrial Automation segment. In particular, new orders from the automotive industry meant that new orders nearly doubled in this segment in the second quarter. We consider this successful development to be a confirmation of the strategic direction and performance of our Group companies. By contrast, new orders in the recycling business of Environmental Technology declined as a result of persistently low oil prices in the second quarter. The Group's order backlog increased significantly and was at EUR million at the end of June, EUR 13.9 million higher than in the previous year. This is the highest backlog that M.A.X. Automation has ever recorded. We are very happy with order backlog, not only with regard to the volume, but also in terms of the product and project mix. A share of the orders were received with a time delay in the second quarter and therefore have no effect on revenues and earnings in this reporting period. Subsequently, the sales and earnings development in the first half generally fell short of our expectations. Consolidated revenues adjusted for portfolio changes decreased by 1.9% to EUR million in the first six months compared to the same period of last year. Last year s figure included the revenue contribution from the operational business of altmayerbtd, which was sold in December Excluding the adjustment, sales were 6.2% lower. Consolidated earnings before interest and taxes (EBIT) and before amortization of purchase price allocations amounted to EUR 5.0 million in the first half. The decrease of EUR 2.6 million was mainly due to the previously mentioned decline in the recycling business in the Environmental Technology segment and lower capacity utilization as a result of late order intake and thus idle capacity costs caused by moderate capacity building in the Industrial Automation segment. In addition, the exchange rate result decreased by EUR 0.9 million compared to the same period of last year. In contrast, the effects of the realignment of our Group financing were encouraging. Thanks to the syndicated loan we took out with five well-known banks last year, net interest decreased in the first half of 2016 by EUR 0.4 million and was thus about a quarter lower than the prior-year figure. We are thus well on our way to reducing our interest expenses as predicted by approximately EUR 1 million per year on an annualized basis. 3
4 Considering the good development of order intake and order backlog and the resulting significant increase in capacity utilization, we expect to see a significant improvement in the sales and earnings situation of the Group over the course of the year and particularly in the fourth quarter of 2016 compared to the first half of the year. Assuming a continued good order situation in the area of Industrial Automation, we continue to expect that we will be able to achieve our forecast for the full year We are confident that we will be able to compensate for the more modest figures in Environmental Technology. Group sales are expected to be in the range of EUR 370 million to EUR 390 million, associated with a consolidated EBIT before PPA amortization of at least EUR 24 million. The transformation of the M.A.X. Group into a decentrally managed high-tech industrial Group continues to progress. In this context, we started working on our long-term Strategy 2021 : Our goal is to align M.A.X. Automation to focus even more closely on attractive growth markets. We are working hard to adapt our organizational structure to suit the increasingly international orientation of our Group companies. We also intend to take advantage of existing synergy potential more consistently and thus increase the value of the Group. M.A.X. Automation will increasingly benefit from global market drivers such as connectivity and mobility, population growth and demography, and sustainability and resource management, with this strategy. Thanks to these excellent prospects, we consider the M.A.X. Automation share to be an interesting and promising long-term investment. Düsseldorf, August 2016 Daniel Fink Chairman of the Management Board Fabian Spilker Management Board 4
5 M.A.X. AUTOMATION AG SHARE The share of M.A.X. Automation AG has been listed in the Prime Standard of the Frankfurt Stock Exchange since Price performance The share of M.A.X. Automation AG developed positively in the first six months of 2016 and, in particular, significantly better than the price index SDAX in the second quarter. Following a price of EUR 5.53 at the beginning of the year, the share initially recorded a negative development in line with the overall market and reached its lowest level of EUR 4.77 on February 9, It continued to recover from March on and reached a peak price of EUR 6.20 on May 2, Afterwards the share developed slightly weaker in a market environment influenced by the outcome of the referendum on the United Kingdom s membership in the European Union and closed the reporting period at EUR This represents a slight decline of 0.3% compared to the closing price for 2015 of EUR The SDAX lost 1.8% of its value in the same period. After the end of the reporting period, the share of M.A.X. Automation experienced a positive development again and was priced at EUR 6.00 on July 29, Key data for the M.A.X. share German Securities Identification Number (WKN) ISIN Ticker symbol Trading segment DE MHX Regulated Market (Prime Standard) Par value ordinary bearer shares with no par value (no-par Share class shares) with a proportionate amount of the share capital of EUR 1.00 respectively Registered capital 26,794,415 Share price on December 30, 2015 EUR 5.75 Share price on June 30, 2016 EUR 5.73 Percentage change -0.3% High for the reporting period EUR 6.20 Low for the reporting period EUR 4.77 Market capitalization on January 1, 2016 EUR million Market capitalization on June 30, 2016 EUR million Each closing prices on the XETRA trading system of Deutsche Börse AG 5
6 Performance of the M.A.X. Automation share and the benchmark index SDAX Shareholder Structure The Günther Group based in Hamburg, Germany, continues to be M.A.X. Automation AG s largest single shareholder with a 31.4% voting rights interest. Other large shareholders based on voting rights notifications submitted to the company included Baden-Württembergische Versorgungsanstalt with 8.9%, Stüber & Co. KG with 6.0% and Universal Investment Gesellschaft mbh with 4.2%. This means that around 49.5% of the voting rights are held by free float private and institutional investors Financial calendar Date August 26, 2016 Annual General Meeting 2016 November 14, 2016 Publishing of Third Quarter Financial Report 2016 November 21 23, 2016 German Equity Forum
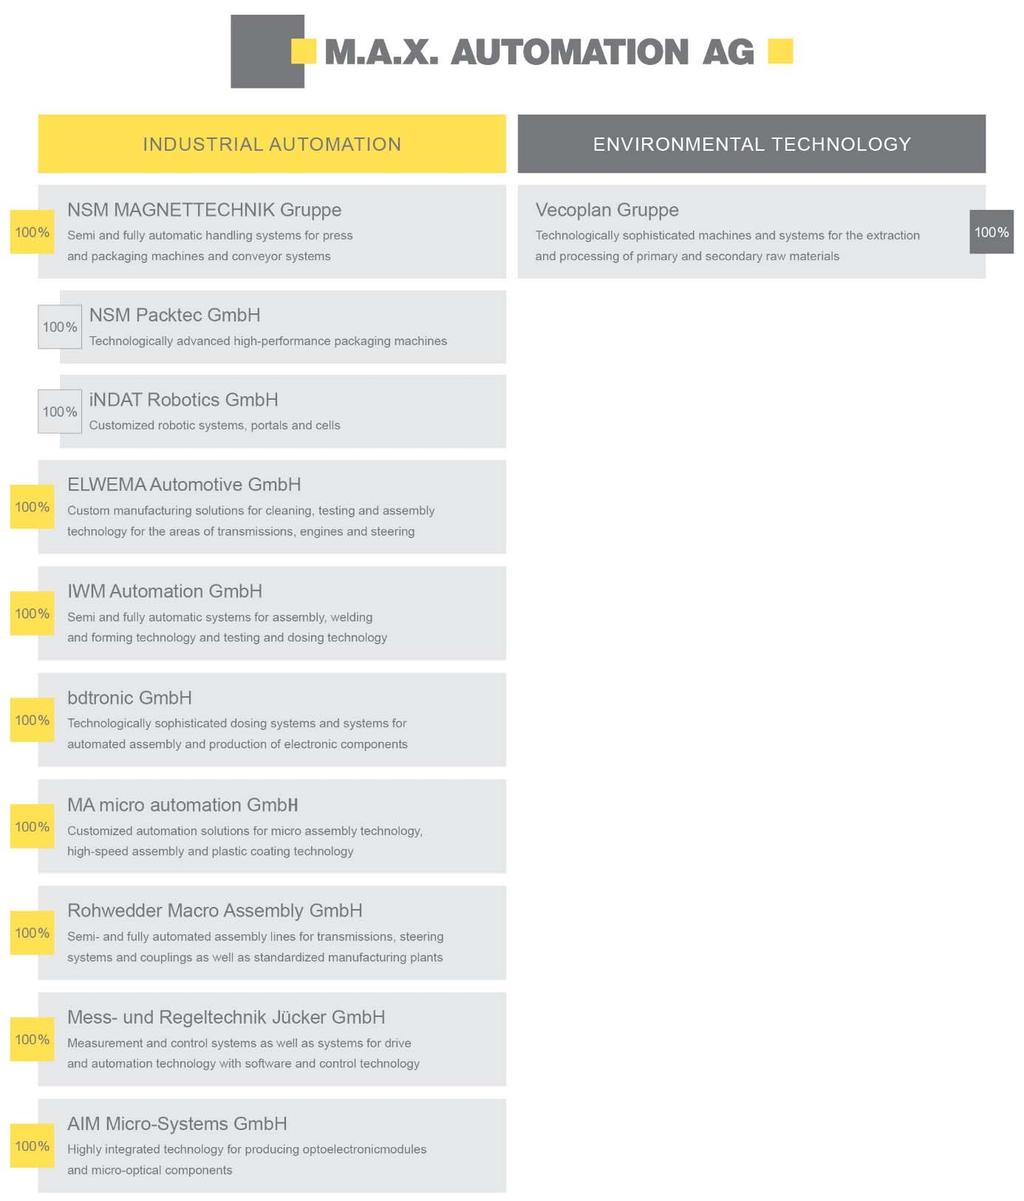
7 INTERIM MANAGEMENT REPORT PRINCIPLES OF THE GROUP Business model M.A.X. Automation AG with its headquarters in Düsseldorf is an internationally active high-tech mechanical engineering Group and a leading full-service supplier of integrated and sophisticated system and component solutions. Its operational business is divided into two segments. In the Industrial Automation segment, the Group is considered to be a trendsetter in the development and manufacturing of integrated and proprietary solutions for use in manufacturing and assembly in the automotive industry, medical technology, packaging machines and the electronics industry due to its comprehensive technological know-how. In the Environmental Technology segment, M.A.X. Automation develops and installs innovative systems for use by the recycling, energy and raw materials industries. Group structure and locations The Group companies of M.A.X. Automation develop and produce high-tech automation solutions primarily in Germany and also at selected locations abroad. The international service subsidiaries of the Group companies offer customers worldwide contacts for comprehensive care. 7
8 8
9 EMPLOYEE DEVELOPMENT M.A.X. Automation Group employed 1,747 people on the reporting date June 30, of these were trainees. This is a decrease of 32 employees compared to the value on the same date in 2015 (1,779, of which 136 were trainees). The 123 employees of altmayerbtd GmbH & Co. KG GmbH, the company that was sold in December 2015, are included in the previous year s figures. The average employee capacity in the Industrial Automation segment was increased by 8.9%. This capacity build up is due to the expected and in the meantime realized order intakes. 9
10 ECONOMIC REPORT Macroeconomic environment The global economy developed positively in the first half of 2016, whereby the economic momentum slowed down in the reporting period. The International Monetary Fund (IMF) identified the turbulences on the capital markets, which had a negative impact on investor confidence and led to cash outflows from emerging markets, as a main reason. The continuing geopolitical crises, particularly in Syria, and the resulting refugee flows to Europe and the increasing threat of terrorist activities are also said to be serious factors. In addition, the IMF considers the continuing low oil prices to be an obstacle to economic development because the positive effects for the importing countries cannot compensate for the negative effects on the exporting countries. According to the IMF, the consequences of the United Kingdom s referendum on leaving the European Union represent a significant risk for the global economy. The IMF expects economic and political uncertainties, which could have a negative effect on the mood in the global markets and on investment activity. The IMF lowered its expectations for global economic growth in 2016 by 0.1 percentage points to 3.1% in July. The forecasts for China were increased by 0.1 percentage points to 6.6%, while they were reduced by 0.2 percentage points to 2.2% for the United States. The IMF expects economic growth of 1.6% after 1.5% for the euro zone. The economic development in Germany gained momentum at the beginning of According to the Federal Statistics Office, the gross domestic product (GDP) grew by 0.7% in the first quarter compared to the last quarter of The main reasons were claimed to be private consumption and increasing investment in the construction industry as well as in equipment. The ifo Institute raised its growth prospects for the full year by 0.2 percentage points to 1.8% in light of the positive trend and expects a decrease in the unemployment rate. The IMF raised its forecast for economic growth in Germany by 0.1 percentage points to 1.6% in July. Business environment The German Engineering Federation (VDMA) reported an overall positive performance in the first six months of 2016 for its member companies. Total order intake increased by 3% compared to the same period of last year. During the months of April to June, orders were 2% higher than last year, whereby domestic orders increased by 8% and orders from abroad declined by 1%. 10
11 The IMF warned in view of the United Kingdom leaving the European Union. The effects of Britain s planned withdrawal from the European Union cannot be estimated accurately yet. Nevertheless, the referendum will lead to uncertainty, which will affect the investment activity of the economy. With respect to manufacturing in the area of mechanical engineering, the withdrawal of the United Kingdom from the EU is expected to have a negative impact. The VDMA confirmed its forecast for the full year 2016 that calls for production to stagnate compared with the previous year. The members of the VDMA trade association Waste and Recycling Technology Companies are cautious for the year Sales growth in the sector will be reduced by half compared with the previous year to 1%, according to the association s annual economic survey. The importance of foreign business will continue to grow. For example, the international share of new business of the companies surveyed was already 79% at the beginning of 2016 after 76% the previous year. Here, demand from the US, Mexico and Asia was particularly strong. After record sales of EUR 12.2 billion in 2015, the VDMA trade association Robotics and Automation expects a further increase by 2% to EUR 12.5 billion for its member companies in the current year. The International Federation of Robotics (IFR) is optimistic for the industry s development in the medium term. By the year 2018, it expects average annual growth of the global robot inventory of 12%. The global automotive markets continued their generally positive development from the previous year in the first half of This growth was carried by the three major automobile markets, according to the Association of the Automotive Industry (VDA). In Western Europe, there was a 9% increase in new registrations over the same period of last year, a 1% increase in the US and a 12% increase in China. The markets developed negatively in Russia (-14%) and Brazil (-25%), however. German medical technology companies are generally optimistic for the current year. After an 8.5% increase in turnover to EUR 27.6 billion in 2015, they expect to see weaker business momentum in the current year, however. Growth is projected to result mainly from international business, whereby the developments of the markets in China and North America, in particular, are believed to be promising. 11
12 SIGNIFICANT EVENTS IN THE REPORTING PERIOD Daniel Fink new CEO of M.A.X. Automation AG Mr. Daniel Fink was named Chief Executive Officer (CEO) of M.A.X. Automation AG with effect from April 1, Mr. Fink manages the business together with Fabian Spilker, who has been active as a Management Board member since 2013 and continues to serve as Chief Financial Officer (CFO). Mr. Fink has been appointed for a three-year period and succeeds the former CEO, Bernd Priske, who left the company in March Daniel Fink draws on many years of management experience in various industrial sectors, especially in the project business and plant engineering areas, and has acquired extensive experience in tenures abroad. Control and profit transfer agreement between M.A.X. Automation AG and Mess- und Regeltechnik Jücker terminated M.A.X. Automation AG terminated the control and profit transfer agreement with Mess- und Regeltechnik Jücker GmbH on June 23, 2016, with effect from December 31,
13 INCOME, ASSETS AND FINANCIAL POSITION Orders received by the Group Incoming orders in EUR mill. Jan-June 2016 Jan-June 2015 Change in % Q Q Change in % Industrial Automation segment Environmental Technology segment Group Order intake for the M.A.X. Group reached the high level of EUR 203 million in the first six months of This represents a substantial increase of EUR 27.0 million or 15.3% compared to the figure for the same period of last year (EUR 176 million EUR). The book-to-bill ratio for the first half of the year amounted to 1.3 after 1.0 the previous year. EUR million can be attributed to the second quarter, by far the highest order intake in a single quarter. The growth of EUR 44.2 million or 52.0% compared to the same quarter of the previous year (EUR 85.1 million) resulted from the many orders envisaged in the first quarter from international vehicle manufacturers and suppliers in the Industrial Automation segment, where the orders nearly doubled during the period April to June compared with the same period of last year. Incoming orders were realized primarily in the areas of cleaning, testing and assembling of engine components, dosing, impregnating systems for electric engines, press automation and robotics solutions. The increased demands with respect to CO2 emissions, the great variety in the area of automobile production, the sustainable trend toward driver assistance and comfort systems, and the development of electric mobility, which is leading to more active investment activity in the automotive industry, are proving to be the growth drivers. In the Industrial Automation segment, orders increased by 45.7% to EUR million in the first half of 2016 (previous year s period: EUR million). The framework agreements that were concluded with key customers in the automotive sector in the last financial year also had a positive impact. In Environmental Technology, orders adjusted for the divested operations of altmayerbtd in December 2015 fell by 28.7% to EUR 41.0 million (previous year s period: EUR 57.6 million). This decline resulted from the generally subdued recycling business as a result of persistently low oil prices. 13
14 Order backlog The Group s order backlog increased by 8.5% to the record level of EUR million as of June 30, 2016 (June 30, 2015: EUR million). Thus, the capacity in the Industrial Automation segment will be utilized very effectively in the months to come. The order backlog in the Industrial Automation segment increased by 26.0% to EUR million as a result of the lively order intake (June 30, 2015: EUR million). In Environmental Technology, the order backlog declined to EUR 23.2 million as of June 30, 2016 (previous year: EUR 41.2 million). Group sales development Group sales in EUR mill. Jan-June 2016 Jan-June 2015 Change in % Q Q Change in % Industrial Automation segment Environmental Technology segment Group In accordance with changes in commercial law, other operating income, which is related to products, goods or services, qualifies as revenue. The adjustment made to the previous year amounted to EUR 0.1 million. Group sales of M.A.X. Automation declined by EUR 10.5 million or 6.2% to EUR million in the first half of 2016 (first half of 2015: EUR million) due to the decline in revenues in Environmental Technology. Furthermore, it should be noted that several major orders received by the Industrial Automation segment in the second quarter are not yet included in sales. Furthermore, the consolidated revenues in the first half of 2015 still included the revenue contribution of the operational business of altmayerbtd, which was sold in December Adjusted for portfolio effects, net sales declined by 1.9%. In the second quarter, revenue amounted to EUR 84.5 million, EUR 10.5 million or 11.1% lower than in the same quarter of last year (EUR 95.0 million). The Industrial Automation segment posted sales of EUR million for the period January to June 2016, a 3.3% increase over the same period of last year (EUR million). The Environmental Technology segment recorded a drop in sales to EUR 49.4 million (prior year period: EUR 63.4 million; -22.2%) due to the developments mentioned earlier. The sale of altmayerbtd and general market conditions each accounted for roughly half of the decline. 14
15 The overall performance of M.A.X. Group decreased by EUR 13.1 million or 7.4% to EUR million (previous year: EUR million). This includes EUR 3.4 million in changes in inventories (prior year period: EUR 6.1 million). Consolidated results of operations Earnings figures in EUR mill. EBIT before PPA Industrial Automation segment EBIT before PPA Environmental Technology segment Jan-June 2016 Jan-June 2015 Change in % Q Q Change in % ,3 2,3-86,8 0,6 0,3 +78,0 EBIT before PPA Group 5,0 7,6-34,6 3,5 5,8-39,6 EBIT after PPA Group 2,8 5,3-46,4 2,5 4,6-46,9 Consolidated net profit 0,4 2,3-84,0 0,7 2,5-72,3 Other operating income declined to EUR 3.8 million in the first six months of 2016 after EUR 6.9 million in the same period of the previous year. This was due to lower income from foreign exchange differences. This decreased to EUR 0.9 million after EUR 4.8 million the previous year. Correspondingly, expenses related to exchange rate differences were also lower (see item Other operating expenses ). The cost of materials increased from EUR 91.8 million to EUR 84.7 million (-7.7%) due to lower total revenue. Based on overall performance, the cost of materials ratio improved slightly from 51.6% to 51.4%. Personnel expenses fell by 2.6% from EUR 55.0 million to EUR 53.5 million. This can be attributed to the lower number of employees due to the sale of the operating business of altmayerbtd. Adjusted for portfolio effects, personnel expenses in the Group increased by 2.5% due to general salary increases and an increase in capacity in the Industrial Automation segment. The personnel expense ratio based on total revenue was 32.5% after 30.9%. At EUR 3.3 million, depreciation was a 2.9% lower than the level of the prior year period. Other operating expenses decreased from EUR 27.5 million to EUR 22.1 million (-19.5%). The main reason was the EUR 4.1 million decrease in expenses from foreign exchange differences to EUR 1.1 million in the reporting period. The balance of currency effects thus amounted to EUR -0.2 million after income of EUR 0.7 million the previous year and the reduction in sales that was accompanied by lower selling expenses (outgoing freight and sales commissions). 15
16 Consolidated earnings before interest, taxes, depreciation and amortization (EBITDA) fell by EUR 2.7 million to EUR 8.3 million in the first six months of 2016 (prior year period: EUR 11.0 million). The M.A.X. Group reported operating earnings before interest and taxes (EBIT) and before amortization of purchase price allocations of EUR 5.0 million for the first half of 2016 (first half of 2015: EUR 7.6 million). The EBIT margin in relation to total output was 3.0% after 4.3% for the same period of last year. Earnings per share before PPA amortization amounted to EUR 0.18 after EUR 0.28 in the first six months of Group EBIT before PPA fell to EUR 3.5 million in the second quarter (Q2 2015: EUR 5.8 million). The EBIT margin was 4.0% (Q2 2015: 5.8%). PPA amortization decreased from EUR 2.3 million to EUR 2.1 million in the first half of This primarily resulted from the acquisition of Elwema Automotive GmbH and MA micro automation GmbH in late 2013 and indat Robotics GmbH in February EBIT after amortization arising from PPA amounted to EUR 2.8 million in the first six months (same period in 2015: EUR 5.3 million). Of this amount, EUR 2.5 million was incurred in the second quarter (Q2 2015: EUR 4.6 million). Net interest income improved by 24.5% to EUR -1.4 million after six months (previous year: EUR 1.8 million). In this case, effects from the reorganization of Group financing last year had a positive impact as planned. Consolidated earnings before taxes (EBT) amounted to EUR 1.4 million (first half of 2015: EUR 3.5 million). The net result for the first six months of 2016 amounted to EUR 0.4 million (prior year period: EUR 2.3 million). This corresponds to earnings per share of EUR 0.01 (previous year: EUR 0.09). Net income in the second quarter amounted to EUR 0.7 million (Q2 2015: EUR 2.5 million). The quarterly earnings per share were EUR 0.03 (Q2 2015: EUR 0.09). The Group s earnings in the first half of 2016 declined in both segments. In Industrial Automation, EBIT before PPA decreased to EUR 6.1 million after EUR 7.0 million in the same period of last year (- 12.6%). In the Environmental Technology segment, EBIT before PPA of EUR 0.3 million was posted (prior year period: EUR 2.3 million). 16
17 Group assets The M.A.X. Group had total assets of EUR million as of the June 30, 2016, reporting date which were thus roughly at the same level as on December 31, 2015 (EUR million). Non-current assets amounted to EUR million and were thus also close to the level of the previous year (December 31, 2015: EUR million). Here, intangible assets increased by 8.2% to EUR 17.3 million mainly due to the current PPA amortization (December 31, 2015: EUR 18.8 million). Deferred tax assets increased from EUR 6.6 million to EUR 7.6 million. Current assets increased slightly by 1.6% in total to EUR million (December 31, 2015: EUR million). Inventories increased by 10.8% to EUR 43.9 million (December 31, 2015: EUR 39.7 million) in view of the projects just starting at the Group companies. Cash and cash equivalents decreased by 22.3% from EUR 21.4 million to EUR 16.6 million. The decline in funds served interestoptimized reduction of financial liabilities. Working capital increased to EUR 96.5 million (December 31, 2015: EUR 85.1 million; +13.4%). Group financial position The equity of M.A.X. Group amounted to EUR million on June 30, 2016, which is slightly higher than on December 31, 2015 (EUR million; 0.4%). The equity ratio reached 37.4%, which is still well above the desired minimum value of 30% (December 31, 2015: 37.5%). The equity ratio improved by 0.4 percentage points compared to June 30 of the previous year. Non-current liabilities amounted to EUR 83.9 million and were thus 16.2% higher than at the end of 2015 (EUR 72.2 million). Non-current liabilities to banks consisting of the syndicated loan that M.A.X. Automation AG took out increased from EUR 48.7 million to EUR 62.5 million. The loan is reported as non-current due to its term to maturity. The higher resource requirements resulted from the financing of the operations of Group companies, in particular the pre-financing of inventories as a result of the strong increase in new orders. In addition, tax payments for the successful financial years 2014 and 2015 as well as a performance-related purchase price component from the acquisition of indat Robotics had effects. The other non-current financial liabilities declined from EUR 3.6 million to EUR 2.4 million, among other things due to the now short-term liability from the purchase price payment for indat Robotics. Current liabilities fell be 9.7% in total to EUR 94.6 million (December 31, 2015: EUR million). Trade payables declined from EUR 54.3 million to EUR 47.3 million (-12.9%) due to lower advance payments received from customers for construction orders. Current liabilities to banks increased by EUR 8.9 million to EUR 21.2 million (December 31, 2015: EUR 12.3 million) due to the mentioned prefinancing of orders. Current financial liabilities decreased by EUR 8.7 million or 40.9% to EUR 12.7 million (December 31, 2015: EUR 21.4 million), partly due to reduced liabilities from escrowed funds and paid purchase price liabilities from the acquisition of indat Robotics. Tax provisions increased 17
18 from EUR 7.5 million to EUR 4.3 million due to payments for the successful financial years 2014 and The Group s gross debt (short and long term) amounted to EUR 83.8 million after six months (December 31, 2015: EUR 61.1 million; +37.2%). Net debt totaled EUR 67.2 million after the six months, which was higher than at the end of last year (December 31, 2015: EUR 39.7 million; +69.2%), as is quite common in the industry. Net debt amounted to EUR 52.4 million on the same date of the previous year. LIQUIDITY DEVELOPMENT OF THE GROUP The M.A.X. Group posted operating cash outflow of EUR 22.1 million in the first six months of 2016 after a cash inflow of EUR 7.9 million in the same period of last year. This reflects the pre-financing of orders, among other items. Furthermore, the decrease in current liabilities also had an impact. Investing activities resulted in a cash outflow of EUR 4.8 million (previous year: cash outflow of EUR 11.6 million). This included the construction of a production hall and the administration building of bdtronic GmbH as well as another performance-related purchase price payment for the acquisition of indat Robotics GmbH. Cash inflow of EUR 22.3 million resulted from pre-financing of orders after an outflow of EUR 12.5 million in the same period of last year. Last year, the purchase of the minority interests in Vecoplan LLC were included in the amount of USD 2.0 million and the reduction in liabilities to banks after the restructuring of Group financing in the amount of EUR 10.8 million. A reduction in cash and cash equivalents to EUR 16.6 million at the end of the first six months of 2016 from EUR 21.4 million at the beginning of the reporting period can be calculated from the sum of the cash flows. SUPPLEMENTARY REPORT On July 8, 2016, the Management Board of M.A.X. Automation AG announced in the Federal Gazette that BTD Behältertechnik Dettenhausen Verwaltungs GmbH that has its headquarters in Dettenhausen, a 100% subsidiary of M.A.X. Automation AG, would be merged with M.A.X. Automation AG. A corresponding merger agreement was concluded on June 30, BTD Behältertechnik Dettenhausen Verwaltungs GmbH is the General Partner of altmayerbtd GmbH & Co. KG. As a result of the merger, the KG becomes part of M.A.X. Automation AG due to the withdrawal of the General Partner. On August 26, 2016, the General Meeting of M.A.X. Automation AG will pass a resolution on the appropriation of profits for financial year The Management Board and Supervisory Board have 18
19 proposed a dividend of EUR 0.15 per share. This would mean that EUR 4.0 million would be paid out at the end of August. No other events of particular significance for the assets, financial and earnings position occurred after the reporting period. OPPORTUNITY AND RISK REPORT The opportunity and risk profile of the M.A.X. Group has not changed significantly compared to the detailed information contained in the management report as of December 31, For this reason, no additional risks or opportunities need to be addressed in this interim report. FORECAST REPORT The Management Board expects the Industrial Automation segment to record a significant increase in revenues in the remaining course of the year, especially in the fourth quarter of This is based on the many orders received in the second quarter and additional orders that have been given notice of by renowned customers from the automotive sector in the following quarters. The Industrial Automation segment will continue to focus on forward-looking industry trends. Among these are new applications as part of networked production under the heading of the 4th Industrial Revolution, miniaturization and micro-assembly, the use of high-performance robotics and the development of control software solutions that are becoming increasingly important in the industry. In the Environmental Technology segment, we expect to see a more subdued development in the full year. Pressure on prices and margins can be expected in the recycling business due to the persistently low oil prices. The segment will continue to focus on the development and manufacture of high-quality individual components and complex system solutions for the recycling and treatment industries. M.A.X. Automation will make further progress with its transformation into a decentrally organized hightech industrial Group in 2016 and the following years. As part of the Strategy 2021, the Group will focus more on attractive growth markets. In addition, the organizational structure will be adjusted to suit the increasingly international focus of the Group companies. Furthermore, existing synergy potential will be harnessed more consistently to increase the value of the Group. M.A.X. Automation will seek to benefit from global market drivers such as connectivity and mobility, population growth and demography, sustainability and resource management, through these measures. Assuming that the good order situation remains intact, the Management Board continues to believe that Group sales in the range of EUR 370 million to EUR 390 million and Group earnings before interest and taxes (EBIT) and before PPA amortization of at least EUR 24 million 19
20 can be achieved in
21 FORWARD-LOOKING STATEMENTS This report contains forward-looking statements based on current assumptions and forecasts made by the management of M.A.X. Automation AG. Such statements are subject to risks and uncertainties. These and other factors can cause the actual results, financial situation, development or performance of the company to differ materially from the estimates given here. The company assumes no obligation to update such forward-looking statements or to adjust them to future events or developments. 21
22 CONSOLIDATED INTERIM FINANCIAL STATEMENTS CONSOLIDATED BALANCE SHEET of M.A.X. Automation AG, Düsseldorf, as of June 30, ASSETS Notes in TEUR in TEUR Non-current assets Intangible assets (1) 17,296 18,847 Goodwill (2) 53,119 53,126 Property, plant and equipment (3) 32,212 32,534 Investment property (4) 3,835 3,966 Financial investments accounted for using the equity method (5) 0 0 Other financial investments (6) 2,345 1,992 Deferred tax (7) 7,555 6,592 Other non-current assets (8) Total non-current assets 116, ,466 Current assets Inventories (9) 43,939 39,652 Trade receivables (10) 99,873 99,770 Receivables due from related companies (11) Prepayments, accrued income and other current assets (12) 7,950 4,855 Cash and cash equivalents (13) 16,600 21,358 Total current assets 168, ,721 Total assets 285, ,187 22
23 EQUITY AND LIABILITIES in TEUR in TEUR Equity Subscribed capital (14) 26,794 26,794 Capital reserves (15) 3,055 3,055 Revenue reserve (15) 20,757 20,746 Equity difference resulting from currency translation Retained earnings (16) 55,327 54,958 Total equity 106, ,241 Non-current liabilities Non-current loans less current portion (17) 62,545 48,736 Pension provisions (18) 1,069 1,082 Other provisions (24) 1,333 1,439 Deferred tax (7) 16,619 17,346 Other non-current liabilities (17) 2,362 3,619 Total non-current liabilities 83,928 72,222 Current liabilities Trade payables (19) 47,304 54,336 Short-term borrowings and current portion of long-term loans (20) 21,236 12,338 Current liabilities arising from minority shareholder settlement claim (22) Other current financial liabilities (23) 12,664 21,433 Income tax provisions and liabilities (24) 4,277 7,468 Other provisions (25) 6,289 6,929 Other current liabilities (26) 2,418 1,602 Total current liabilities 94, Total equity and liabilities 285, ,187 The attached Notes form an integral part of the consolidated financial statements. 23
24 CONSOLIDATED STATEMENT OF COMPREHENSIVE INCOME of M.A.X. Automation AG, Düsseldorf, for the period from January 1 to June 30, in TEUR in TEUR in TEUR in TEUR Revenue 160, ,610 84,491 94,985 Change in finished goods and work in progress 3,428 6,143 1,772 4,557 Work performed by the company and capitalized 1,350 1,270 1, Total output 164, ,023 87, ,356 Other operating revenue 3,758 6,910 1,760 3,201 Income from equity valuation Cost of materials -84,746-91,838-45,857-53,532 Personnel expenses -53,536-54,973-26,568-28,055 Depreciation and amortization -3,305-3,405-1,720-1,840 Other operating expenses -22,102-27,467-11,461-14,620 Operating profit 4,957 7,581 3,527 5,841 PPA depreciation and amortization -2,117-2,288-1,058-1,193 Operating profit after PPA depreciation and amortization 2,840 5,293 2,469 4,648 Other investment income Net interest result -1,357-1, ,021 Earnings before tax 1,434 3,495 1,645 3,627 Income tax -1,065-1, ,137 Net income Other comprehensive income that is never recycled to the income statement Actuarial gains and losses from employee benefits Income tax on actuarial gains and losses Change in settlement obligations to minority shareholders Other comprehensive income that can be recycled to the income statement Change arising from currency translation Total comprehensive income 408 2, ,343 Earnings per share (diluted and undiluted) in EUR The attached Notes form an integral part of the consolidated financial statements.
25 CONSOLIDATED STATEMENT OF CHANGES IN EQUITY of M.A.X. Automation AG, Düsseldorf, as of June 30, 2016 Subscribed capital Capital reserves Revenue reserve Currency translation difference Unappropriated retained earnings Total in TEUR in TEUR in TEUR in TEUR in TEUR in TEUR As of January 1, ,794 3,055 21, ,389 99,797 Dividend payments ,019-4,019 Transfer to retained earnings Total comprehensive income ,315 2,503 As of June 30, ,794 3,055 21, ,685 98,281 As of January 1, ,794 3,055 20, , ,241 Dividend payments Transfer to retained earnings Total comprehensive income As of June 30, , ,649 The attached Notes form an integral part of the consolidated financial statements. 25
26 CONSOLIDATED STATEMENT OF CASH FLOWS of M.A.X. Automation AG, Düsseldorf, for the period from January 1 to June 30, in TEUR in TEUR Consolidated net income Adjustments relating to the reconciliation of consolidated net income for the year to cash flow from operating activities: Amortization of intangible assets 3,166 3,310 Depreciation/impairment of property, plant and equipment 2,125 2,383 Depreciation of investment property Profit ( ) loss (+) arising from the disposal of intangible assets -1 0 Profit ( ) loss (+) arising from the disposal of property, plant and equipment Deferred tax changes carried through P&L -1,690-1,125 Other non-cash expenses and income 1, Changes in assets and liabilities Increase (-) / decrease (+) in other non-current assets Increase (-) / decrease (+) in inventories -5,102-9,966 Increase (-) / decrease (+) in trade receivables Increase (-) / decrease (+) in receivables due from related companies Increase (-) / decrease (+) in prepayments, accrued income and other assets -3, Increase (+) decrease (-) in other non-current liabilities Increase (+) decrease (-) in pension provisions Increase (+) decrease (-) in other provisions and liabilities -7,541 2,806 Increase (+) decrease (-) in trade payables -7,064 6,379 Increase (+) decrease (-) in liabilities to related companies 0-74 Increase (+) decrease (-) in liabilities and provisions arising from income taxes -3,191 1,668 = Cash flow from operating activities -22,077 7,899 26
27 in TEUR in TEUR Outgoing payments for investments in intangible assets -1,577-1,549 Outgoing payments for investments in property, plant and equipment -2,702-2,643 Outgoing payments for investments in financial assets Incoming payments from the sale of intangible assets 2 0 Incoming payments from disposals of property, plant and equipment Outgoing payments for the acquisition of subsidiaries less cash -1,082-7,574 = Cash flow from investing activities -4,764-11,581 Outgoing payments for dividends 0 0 Change in long-term financial loans 13,529 20,925 Change in current financial debt 8,902-31,755 Increase (-) / decrease (+) in restricted cash and cash equivalents Payments arising from settlement claims for minority interests ,958 = Cash flow from financing activities 22,267-12,463 Increase/decrease in cash and cash equivalents -4,574-16,145 Effect of changes in exchange rates Cash and cash equivalents at the start of the financial year 21,358 52,377 Cash and cash equivalents at the end of the financial year 16,600 36,450 Composition of cash and cash equivalents = Cash and cash equivalents 16,600 36,450 Income tax paid -7,830-1,619 Income tax reimbursed Interest paid ,524 Interest received The attached Notes form an integral part of the consolidated financial statements. 27
28 Additional information in TEUR in TEUR Acquisition of subsidiaries Goodwill 0 7,663 Intangible assets 0 3,759 Property, plant and equipment 0 97 Other non-current assets Inventories 0 1,520 Trade receivables 0 4,180 Prepayments, accrued income and other current assets Cash and cash equivalents 0 1,456 Deferred tax 0-1,277 Trade payables 0-4,097 Other current financial liabilities Tax provisions and liabilities Other provisions Other current liabilities Purchase price 0 12,524 Purchase price payment outstanding 0-3,524 Cash and cash equivalents acquired 0-1,546 Purchase price paid less cash and cash equivalents acquired 0 7,544 28
29 SEGMENT REPORTING FOR THE FINANCIAL REPORT of M.A.X. Automation AG, Düsseldorf, as of June 30, 2016 Industrial Automation Environmental Technology Reporting period Q1- Q1- Q1- Q1- Q Q Q Q in TEUR in TEUR in TEUR in TEUR New order intake 161, ,102 41,046 64,881 Order book position 154, ,353 23,228 41,183 Segment revenue 110, ,294 49,360 63,450 - with external customers 110, ,160 49,360 63,450 - of which Germany 44,355 53,197 3,273 12,990 - of which other EU countries 28,328 23,986 20,099 14,338 - of which North America 11,487 14,302 21,470 30,261 - of which China 15,706 13, of which rest of the world 10,874 2,686 4,518 5,861 - Inter-segment revenue EBITDA 8,326 8,787 1,389 3,874 Segment operating profit (EBIT before PPA depreciation and amortization) 6,129 7, ,260 Including: - Depreciation/amortization -2,197-1,775-1,091-1,614 - Additions to other provisions and pension provisions -1,130-1, Result from at-equity valuation Segment operating profit after PPA depreciation and amortization 4,174 4, ,169 Including: - PPA depreciation and amortization -1,955-2, Segment result for ordinary activities (EBT) 3,223 3, ,799 Including: - Interest and similar income Interest and similar expenses Income tax 1,817 1, Additions to income tax provisions Net profit/loss for the period 5,040 5, Non-current segment assets (excluding deferred taxes) 48,518 49,387 21,160 25,139 - of which Germany 48,074 48,963 18,141 21,990 - of which other EU countries of which North America ,916 2,974 - of which rest of the world Investments in non-current segment assets 29 3,718 14, Working capital 71,076 56,542 25,691 26,913 Average number of employees excluding trainees 1,115 1,
30 Segment reporting is included in the Notes. SEGMENT REPORTING FOR THE FINANCIAL REPORT of M.A.X. Automation AG, Düsseldorf, as of June 30, 2016 Reconciliation Total Reporting period Q1- Q1- Q1- Q1- Q Q Q Q in TEUR in TEUR in TEUR in TEUR New order intake , ,983 Order book position , ,536 Segment revenue , ,610 - with external customers , ,610 - of which Germany ,628 66,169 - of which other EU countries ,427 38,324 - of which North America ,957 44,536 - of which China ,706 13,007 - of which rest of the world ,392 8,547 - Inter-segment revenue EBITDA -1,453-1,675 8,262 10,986 Segment operating profit (EBIT before PPA depreciation and amortization) -1,470-1,691 4,957 7,581 Including: - Depreciation/amortization ,305-3,405 - Additions to other provisions and pension provisions ,394-2,194 - Result from at-equity valuation Segment operating profit after PPA depreciation and amortization -1,571-1,792 2,840 5,293 Including: - PPA depreciation and amortization ,117-2,288 Segment result for ordinary activities (EBT) -1,706-2,246 1,434 3,495 Including: - Interest and similar income Interest and similar expenses ,373-1,866 Income tax -2,705-2,330-1,065-1,180 - Additions to income tax provisions -2,473-1,618-2,562-2,121 Net profit/loss for the period -4,411-4, ,315 Non-current segment assets (excluding deferred taxes) 39,463 39, , ,484 - of which Germany 39,463 39, , ,911 - of which other EU countries of which North America 0 0 3,116 3,140 - of which rest of the world Investments in non-current segment assets ,279 15,713 Working capital ,508 83,375 Average number of employees excluding trainees 6 4 1,542 1,545 30
31 NOTES TO THE CONSOLIDATED FINANCIAL STATEMENTS Accounting policies The accounting and valuation contained in this quarterly Group financial report by M.A.X. Automation AG published as of June 30, 2016, were prepared in accordance with the International Financial Reporting Standards (IFRS) of the International Accounting Standards Board, London (IASB), that were valid on the balance sheet date taking the interpretations of the Standing Interpretations Committee (SIC) and the International Financial Reporting Interpretations Committee (IFRIC) into account. The respective comparative figures for the previous year were determined on the basis of the same principles. Accordingly, these consolidated interim financial statements were prepared in accordance with IAS 34. Taking into account the purpose of quarterly financial reporting as an information tool that builds on the consolidated financial statements, we refer you to the Notes to the consolidated financial statements dated December 31, 2015, in which the accounting, valuation and consolidation methods as well as the exercise of the options included in the IFRSs are explained in detail. The same accounting policies and consolidation principles have been applied as in the most recent annual consolidated financial statements. Income tax is determined on the basis of current legislation. To ensure accurate and appropriate presentation of income taxes, these taxes are not calculated on the basis of estimated average annual income tax rates, but rather calculated exactly. 31
32 Scope of consolidation All of the Group s active subsidiaries are included in its scope of consolidation. Besides M.A.X. Automation AG, this comprised 27 subsidiaries on December 31, As of June 30, 2016, the scope of consolidation remained unchanged compared to December 31, 2015, and is comprised as follows: Number of companies included Industrial Automation Environmental Technology 9 9 Group Events of major importance Events of major importance are listed in the quarterly financial report under important events in the reporting period. 32
33 Earnings per share Calculation of earnings per share is based on the following data: Q1- Q Q1- Q Basis for undiluted earnings per share in EUR thousands Number of shares 26,794,415 26,794,415 Earnings per share No dilution in the share according to IAS 33 took place in the years 2015 and Related party transactions The value of related party transactions amounted to EUR 1 thousand (previous year: EUR 7 thousand). These pertain to travel expenses for Supervisory Board members in connection with their duties. There were no transactions with related parties in the first half of The gratuitous consulting contract that was signed with Günther Holding GmbH on September 1, 2014, still exists. Events after the reporting date, June 30, 2016 On July 8, 2016, the Management Board of M.A.X. Automation AG announced in the Federal Gazette that BTD Behältertechnik Dettenhausen Verwaltungs GmbH, a 100% subsidiary of M.A.X. Automation AG with its headquarters in Dettenhausen, would merge with M.A.X. Automation AG. A corresponding merger agreement was concluded on June 30, BTD Behältertechnik Dettenhausen Verwaltungs GmbH is the General Partner of altmayerbtd GmbH & Co. KG. Through the merger, the KG becomes part of M.A.X. Automation AG due to the withdrawal of its General Partner. The Annual General Meeting will be held on August 26, 2016, at which the appropriation of profits from 2015 will be voted on. Otherwise, there were no events of special importance that had a significant impact on the Group s assets, financial and earnings situation. 33
HIGHLIGHTS AT A GLANCE
 1 HIGHLIGHTS AT A GLANCE M.A.X. Automation Group with a strong third quarter and a positive development in the first nine months of 2015 Consolidated sales rise by 5.3 % to EUR 266.3 million after nine
M.A.X. AUTOMATION AG QUARTERLY STATEMENT I.2016
 M.A.X. AUTOMATION AG QUARTERLY STATEMENT I.2016 Key share data Q1 2016 LETTER FROM THE MANAGEMENT BOARD Ticker / ISIN MXH / DE0006580905 Dear shareholders, Registered capital Closing price (March 31, 2016)*
MAX AUTOMATION AG QUARTERLY STATEMENT III.2016
 MAX AUTOMATION AG QUARTERLY STATEMENT III.2016 Key share data Q3 2016 LETTER FROM THE MANAGEMENT BOARD Ticker / ISIN MXH / DE0006580905 Dear shareholders, Number of shares Closing price (30 / 9 / 2016)*
MAX Automation AG. 6M Report 2017
 MAX Automation AG 6M Report 2017 HIGHLIGHTS AT A GLANCE MAX Group posts strong business performance in the first half of 2017 fully in line with expectations Order backlog as of June 30 at a high level
NEW SUCCESSES FINANCIAL REPORT FOR THE 2016 FINANCIAL YEAR
 NEW SUCCESSES FINANCIAL REPORT FOR THE 2016 FINANCIAL YEAR GROUP MANAGEMENT REPORT Combined management report for MAX Automation AG for the 2016 financial year 1. Basis of the parent company and the Group
FINANCIAL REPORT 30 NOVEMBER ST HALF OF FISCAL YEAR 2017/2018
 FINANCIAL REPORT 30 NOVEMBER 2017 1ST HALF OF FISCAL YEAR 2017/2018 CONTENTS 03 KEY PERFORMANCE INDICATORS 04 HIGHLIGHTS 05 HELLA ON THE CAPITAL MARKET 07 INTERIM GROUP MANAGEMENT REPORT 07 Economic development
Consolidated Statement of Comprehensive Income Consolidated Statement of Cash Flows Consolidated Statement of Shareholders Equity...
 Group Management Report For The Three Months Ended March 31, 2009 Contents Group Management Report... 3 Overall Economy and Industry... 3 Revenue Development... 3 Earnings Development... 4 Research and
Half-yearly Financial Report. 1 January - 30 June 2018
 Half-yearly Financial Report 1 January - 30 June 2018 Quarterly Financial Report Table of contents Table of contents LPKF Laser & Electronics AG at a glance... 3 Chairman's Statement... 4 Interim Management
N O R M A G R O U P S E
 NORMA GROUP SE Overview of Key Figures Q3 2017 1 Q3 2016 1 Q1 Q3 2017 1 Q1 Q3 2016 1 Order situation Oder book (Sep 30) EUR millions 322.7 282.7 Income statement Revenue EUR millions 244.4 216.6 763.4
Forum in Frankfurt / Main
 6-month report 2009 / 2010 Key figures at a glance (IFRS) 6 month 2009 / 2010 (Jul 1, 2009 Dec 31, 2009) Comparable period (Jul 1, 2008 Dec 31, 2008) Revenues 15,261 20,216 Earnings before interest and
OPEN INNOVATIVE FOCUSED SOLID
 OPEN INNOVATIVE FOCUSED SOLID QUARTERLY STATEMENT AS OF MARCH 31, 2018 To our shareholders Patrik Heider, Spokesman of the Executive Board and CFOO The Nemetschek Group began the 2018 fiscal year according
societas europaea Report for the first 1 January to 30 September
 societas europaea Report for the first Three Quarters 2017 1 January to 30 September overview surteco group million Sales revenues of which - Germany - Foreign EBITDA EBITDA margin in % EBIT EBIT margin
FINANCIAL REPORT NOVEMBER 30, ST HALF OF FISCAL YEAR 2018/2019
 FINANCIAL REPORT NOVEMBER 30, 2018 1ST HALF OF FISCAL YEAR 2018/2019 H1 CONTENTS 03 KEY PERFORMANCE INDICATORS 04 HIGHLIGHTS 05 HELLA ON THE CAPITAL MARKET 07 INTERIM GROUP MANAGEMENT REPORT 07 Economic
Quarterly Financial Report 30 September 2017
 Quarterly Financial Report 30 September 2017 Aumann AG, Beelen Welcome Note from the Managing Board Dear fellow shareholders, After a highly successful first half of the year, the third quarter of 2017
Herford Interim Report Q1 2014/15
 AHLERS AG Herford Interim Report Q1 2014/15 AHLERS AG INTERIM REPORT Q1 2014/15 (December 1, 2014 to February 28, 2015) BUSINESS PERFORMANCE IN THE FIRST THREE MONTHS OF FISCAL 2014/15 -- 7 percent decline
INDUS Holding AG in Figures
 I N T E R I M R E P O R T JANUARY 1 TO MARCH 31, 2005 INDUS Holding AG in Figures Mar. 31, 2005 Mar. 31, 2004 Parent Company Income from investments EUR million 16.5 19.2 Earnings before taxes EUR million
ANNUAL REPORT
 ANNUAL REPORT 2014 1 M.A.X. AUTOMATION AG M.A.X. Automation is a globally active group of companies operating in the industrial automation and environmental technology segments. The company focuses on
German Equity Forum in Frankfurt / Main
 3-month report 2013 / 2014 Key figures at a glance (IFRS) 3 months 2012 / 2013 (Jul 1, 2013 Sep 31, 2013) Comparable period (Jul 1, 2012 Sep 31, 2012) Revenue 14,535 13,409 Earnings before interest and
FINANCIAL REPORT 30 SEPTEMBER 2014
 FINANCIAL REPORT 30 SEPTEMBER 2014 Dear shareholder, The financial report of the Einhell Group as at 30 September 2014 meets the requirements under the Securities Trading Act (WpHG) for preparing interim
2011QUARTERLY STATEMENT AS OF MARCH 31
 2011QUARTERLY STATEMENT AS OF MARCH 31 To our Shareholders Ernst Homolka, CEO Dear shareholders, ladies and gentlemen, The new fiscal year has started well. The Nemetschek Group grew by 10 percent in the
PHOENIX Pharmahandel GmbH & Co KG Pfingstweidstraße Mannheim Germany PHOENIX group
 PHOENIX Pharmahandel GmbH & Co KG Pfingstweidstraße 10-12 68199 Mannheim Germany www.phoenixgroup.eu PHOENIX group WE GO FORWARD Half-year report February to July 2014 PHOENIX group We deliver health.
INTERIM STATEMENT Q1 2018
 INTERIM STATEMENT Q1 2018 DERMAPHARM AT A GLANCE Group results at a glance Q1 / 2018 Q1 / 2017 Revenue EUR million 137.5 118.1 Adjusted EBITDA* EUR million 36.2 28.9 Adjusted EBITDA margin* % 26.3 24.5
Consolidated Balance Sheet Consolidated Income Statement Consolidated Statement of Cash Flows...10
 Group Management Report For The Three Months Ended March 31, 2008 Inhalt Group Management Report... 4 Overall Economy and Industry... 4 Revenue Development... 4 Earnings Development... 5 Research and
Earnings per share (basic) in EUR Earnings per share (diluted) in EUR Number of employees at end of period
 in EUR Earnings per share (diluted) in EUR Number of employees at end of period") At a glance January 1 until September, 30, 2018 in EUR k September 30, 2018 September 30, 2017 Sales 123,306 102,219 Gross profits 63,655 57,360 EBITDA 6,927 8,634 Operating returns (EBIT) 4,731 6,926
At a glance January 1 until September, 30, 2018 in EUR k September 30, 2018 September 30, 2017 Sales 123,306 102,219 Gross profits 63,655 57,360 EBITDA 6,927 8,634 Operating returns (EBIT) 4,731 6,926
BUILDING THE FUTURE TOGETHER HALF YEAR REPORT AS OF JUNE 30, 2017
 HALF YEAR REPORT AS OF JUNE 30, 2017 BUILDING THE FUTURE TOGETHER To our shareholders Patrik Heider, Spokesman of the Executive Board and CFOO The Nemetschek Group has continued on its course of dynamic
QUARTERLY REPORT. For the first half of >> Profit for first half considerably higher than previous year Second quarter confirms positive outlook
 QUARTERLY REPORT For the first half of 2007 >> Profit for first half considerably higher than previous year Second quarter confirms positive outlook FUCHS PETROLUB AG THE FIRST HALF 2007 AT A GLANCE [in
Half-Year Interim Report report. optimize!
 Half-Year Interim Report 2017 report optimize! Consolidated Key Figures Q2 2017 Q2 2016 Half-yearly report 2017 Half-yearly report 2016 Incoming orders (EUR million) 17.8 21.9 39.5 39.6 Revenue (EUR million)
INTERIM REPORT 2ND QUARTER 2017 Q.2 A TRADITION OF INNOVATION
 INTERIM REPORT 2ND QUARTER 2017 Q.2 A TRADITION OF INNOVATION R. STAHL Q2 2017 1 INTERIM REPORT of R. Stahl Aktiengesellschaft for the period 1 January to 30 June 2017 CONTENTS 02 Key figures 03 Group
HALF-YEAR REPORT Bobst Group SA
 HALF-YEAR REPORT 2017 Bobst Group SA Bobst Group SA Half-year report 2017 KEY FIGURES In million CHF June 2017 June 2016 June 2015 Sales 643.2 600.4 524.7 Operating result (EBIT) 39.8 18.0 14.7 In % of
2011QUARTERLY STATEMENT AS OF SEPTEMBER 30
 2011QUARTERLY STATEMENT AS OF SEPTEMBER 30 To our Shareholders Ernst Homolka, CEO Dear shareholders, ladies and gentlemen, The Nemetschek Group continues its profitable growth course. In the first nine
GEA announces figures for the first quarter
 Quarterly Statement January 1 to March 31, GEA announces figures for the first quarter Thanks to robust growth in small and mid-sized orders, GEA s order intake in the first quarter of almost matched the
Q30 Third 8 QuarTer Trading update 2008
 Q308 Third Quarter Trading UPDATE 2008 key figures FIG. 1, PAGE 6/7 net sales and ebit margin IN KEUR 8,000 6,000 4,589 5,006 5,207 5,511 5,488 6,707 7,512 7,644 7,200 7,635 8,329 20 % 15 % 4,000 10 %
Semiannual Financial Report. H1 i 2014 Rheinmetall AG
 Semiannual Financial Report H1 i 2014 Rheinmetall AG Rheinmetall in figures Rheinmetall Group key figures million H1/2014 H1/2013 Change Order situation (continuing operations) Order intake 1) million
INTERIM REPORT 3RD QUARTER 2017 Q.3 A TRADITION OF INNOVATION
 INTERIM REPORT 3RD QUARTER 2017 Q.3 A TRADITION OF INNOVATION R. STAHL Q1 3 2017 1 INTERIM STATEMENT of R. Stahl Aktiengesellschaft for the period 1 January to 30 September 2017 CONTENTS 02 Key figures
9-Month Report of FJA AG
 www.fja.com 9-Month Report of FJA AG 01.01.2008-30.09.2008 Contact FJA AG Elsenheimerstrasse 65 80687 Munich GERMANY Investor Relations Phone: + 49 89 76901-274 or -7002 Fax: + 49 89 7698813 Email: investor.relations@fja.com
Interim report January 1 to March 31, 2012
 Interim report January 1 to March 31, 2012 The first three months of 2012 at a glance Highlights Dynamic start into the year 2012 Sales growth of 11.8 % to EUR 18.9 million Earnings margins at the 2011
Logwin AG. Interim Financial Report as of 30 June 2018
 Logwin AG Interim Financial Report as of 30 June 2018 Key Figures 1 January 30 June 2018 Earnings position In thousand EUR 2018 2017 Revenues Group 540,104 541,383 Change on 2017-0.2 % Air + Ocean 361,316
Schaffner Group. Half-Year Report 2013/14
 Schaffner Group Half-Year Report 2013/14 To our shareholders 1 Considerable improvement of net sales and profits The Schaffner Group made significant progress in implementing its strategy in the first
for the 1st Quarter from January 1 to March 31, 2017
 Quarterly STATEMENT for the 1st Quarter from January 1 to March 31, 2017 Wherever you go. gigaset 1 st Quarterly statement 2017 key figures millions 01/01/-03/31/2017 01/01/-03/31/2016 1 Consolidated revenues
SMART SYSTEMS FOR TRUCKS AND TRAILERS JOST Werke AG
 H1 INTERIM REPORT H1 2018 SMART SYSTEMS FOR TRUCKS AND TRAILERS JOST Werke AG JOST AT A GLANCE in million H1 2018 H1 2017 % yoy Q2 2018 Q2 2017 % yoy Sales Europe 242.8 228.6 6% 118.9 112.9 5% Sales North
FINANCIAL REPORT 3RD QUARTER ST NINE MONTHS 2017
 QUARTERLY FINANCIAL REPORT 3RD QUARTER 2017 1ST NINE MONTHS 2017 Positive earnings trend continued in the third quarter Outlook specified 3rd quarter Organic sales growth driven by higher volumes (4 percent)
key figures net SaLeS and ebit margin BaLance Sheet Structure net SaLeS and ebit margin By region ratio of operating income to financial income
 q108 interim report per 03/31/2008 key figures FIG. 1, PAGE 1 net SaLeS and ebit margin IN KEUR 8,000 6,000 4,589 5,006 5,207 5,511 5,488 6,707 7,512 7,644 7,200 20 % 15 % 4,000 10 % 2,000 5 % q1 q2 q3
Geratherm Medical AG Half-yearly report Jan.-June 2010
 Geratherm Medical AG Half-yearly report 2010 2 GERATHERM AT A GLANCE Group financial ratio Jan.-June 2010 Jan.-June 2009 Change Turnover 7,997 keur 6,345 keur 26.0% Including export share 6,946 keur 5,086
Company Release Fiscal Year 2016/17
 Company Release Fiscal Year 2016/17 October 1, 2016 to September 30, 2017 At a Glance Key Aurubis Group figures Q4 Fiscal year 2016/17 2015/16 Change 2016/17 2015/16 Change Revenues m 2,851 2,399 19 %
EXPLOITING OPPORTUNITIES EFFICIENTLY
 EXPLOITING OPPORTUNITIES EFFICIENTLY INTERIM REPORT Q2 2018 R. STAHL Interim Report Q2 2018 1010 This report is available in German and English. Both versions can also be found online on our corporate
9-month report 2017 / 2018
 9-month report 2017/2018 Key share data 9M 2017 / 2018 Ticker / ISIN K1R / DE000AOKFUJ5 Number of shares 4,124,900 Closing price (31/3/2018)* EUR 12.20 High / low* EUR 15.00 / EUR 11.70 Market capitalisation
KSB Group. Half-year Financial Report 2016
 KSB Group Half-year Financial Report 2016 3 CONTENTS 4 Interim Management Report 10 Interim Consolidated Financial Statements 10 Balance Sheet 11 Statement of Comprehensive Income 12 Statement of Changes
Interim Report as of March 31, 2008 Q MAN AG E N G I N E E R I N G T H E F U T U R E S I N C E
 Interim Report as of March 31, 2008 Q1 2008 MAN AG E N G I N E E R I N G T H E F U T U R E S I N C E 17 5 8 MAN AG 1 MAN Group in 1st quarter 2008: Further growth amid much improved performance Order intake
Half-yearly Financial Report. 1 January - 30 June 2017
 Half-yearly Financial Report 1 January - 30 June 2017 Half-yearly Financial Report Table of contents Table of contents LPKF Laser & Electronics AG at a glance... 3 Chairman's statement... 4 Interim Management
Schaeffler on the capital markets
 Schaeffler on the capital markets Capital market trends In 2015, the global capital markets were characterized by debate over the change in the Fed s low-interest policy, the bond purchasing program of
Well prepared 9M Report 2017
 Well prepared 9M Report 2017 Key share data Ticker / ISIN AM3D / DE000A111338 Letter from the CEO Dear shareholders, customers, business partners and colleagues, Number of shares 17,980,867 Closing price
Figures in millions Q1 to Q3 Q3. Incoming orders 1,780 1, Net sales 1,552 1,
 Interim Financial Report Third Quarter 2015/2016 Heidelberg Group Interim Financial Report Q3 2015 / 2016 Sales for the first nine months increase 1,802 million Growth in incoming orders 1,904 million
Quarterly Statement January 1 to September 30, 2017 Dräger Group
 Quarterly Statement January 1 to September 30, 2017 Dräger Group THE DRÄGER GROUP OVER THE PAST FIVE YEARS 2013 2014 2015 2016 2017 Order intake million 1,756.7 1,743.4 1,895.1 1,849.1 1,928.3 Net sales
Report. on the First Half of 2006
 Report on the First Half of 2006 2 The first six month at a glance Notes on business development 3 This quarterly report has been prepared in accordance with the same accounting principles of the International
GEA announces figures for the third quarter
 Quarterly Statement July 1 to September 30, GEA announces figures for the third quarter GEA s order intake in the third quarter of was EUR 1,084 million. The development was impacted by delays in the awarding
Quarterly Report January 1 to September 30, 2012 Dräger Group
 Quarterly Report January 1 to September 30, Dräger Group THE DRÄGER GROUP OVER THE PAST FIVE YEARS Nine months 2008 Nine months 2009 Nine months 2010 Nine months Nine months Change on in % Order intake
Key figures for the Group in million Q2/2018 Q2/2017 ± % H1/2018 H1/2017 ± %
 02 STADA Key Figures STADA KEY FIGURES Key figures for the Group in million Q2/2018 Q2/2017 ± % H1/2018 H1/2017 ± % Group sales 579.4 576.9 0% 1,137.5 1,143.2-1% Generics 345.5 348.5-1% 672.4 674.4 0%
Interim Report January 1 to June 30, 2012
 Interim Report January 1 to June 30, 2012 paragon Half-year Report Jan. 1, 2012 June 30, 2012 Highlights of the First Half of 2012 Sharp rise in sales by 12.8% Earnings margins on track Targeted investments
QUARTERLY- REPORT FEBRUARY OCTOBER
 QUARTERLY- REPORT FEBRUARY OCTOBER 2018 CONTENT 2 THE FIRST NINE MONTHS AT A GLANCE 3 INTERIM GROUP MANAGEMENT REPORT 3 Business and economic environment 6 Risks and opportunities 6 Forecast 7 INTERIM
Interim Report Q3 2018
 Interim Report Q3 2018 4 A KEY FIGURES Q3 Key Figures Group amounts in millions Q3 2018 Q3 2017 % change Revenue 40,211 40,745 2-1 1 Europe 16,151 16,682-3 thereof Germany 5,931 5,803 +2 NAFTA 11,743 11,525
3-month report 2017 / 2018
 Key share data 3M 2017 / 2018 Ticker / ISIN K1R / DE000AOKFUJ5 Number of shares 4,124,900 Closing price (September 30, 2017)* EUR 14.01 High / low* EUR 19.91 / EUR 11.25 Market capitalisation (September
Half year financial report
 Half year financial report Six-month period ended June 30, 2016 Condensed Consolidated Financial Statements Management Report CEO Attestation Statutory Auditors Review Report Table of contents Condensed
Half-yearly financial report January 1 to June 30, 2012 Dräger Group
 Half-yearly financial report January 1 to June 30, Dräger Group THE DRÄGER GROUP OVER THE PAST FIVE YEARS Six months 2008 Six months 2009 Six months 2010 Six months Six months Change on in % Order intake
Half-year financial report
 2018 Half-year financial report 2 Semperit Group I Half-year financial report 2018 Key figures Semperit Group Key performance figures in EUR million H1 2018 Change H1 2017 Q2 2018 Change Q2 2017 2017 Revenue
CENIT AG Systemhaus. Industriestraße D Stuttgart Tel: Fax: Internet:
 3 Months Report 2008 CENIT AG Systemhaus Industriestraße 52-54 D-70565 Stuttgart Tel: + 49 711 7825-30 Fax: + 49 711 7825-4000 Internet: http://www.cenit.de Investor Relations: ISIN:DE0005407100 Fabian
Quarterly Financial Report. Q1 i 2014 Rheinmetall AG
 Quarterly Financial Report Q1 i 2014 Rheinmetall AG Rheinmetall in figures Rheinmetall Group key figures million Q1/2014 Q1/2013 Change Order situation Order intake 1) million 1.361 1.018 343 Order backlog
AHLERS AG, HERFORD Interim Report Q3 2013/14
 AHLERS AG, HERFORD Interim Report Q3 2013/14 2 INTERIM REPORT Q3 2013/14 AHLERS AG INTERIM REPORT Q3 2013/14 (December 1, 2013 to August 31, 2014) BUSINESS PERFORMANCE IN THE FIRST NINE MONTHS OF FISCAL
Financial report as at 30 June Condensed Group Management Report of Einhell Germany AG. Overview of January - June 2017
 P I D I O N N W R W R R F C L R Ü R V K C T A A S H L R A N T G L A T K U. K U N D G A R T N. Dear shareholder, The financial report of the inhell Group as at 30 June 2017 meets the requirements under
INTERIM STATEMENT FIRST QUARTER
 FIRST QUARTER Overview of Q1 2018 1 Q1 2017 1 Change in % Order situation Order book (Mar 31) EUR millions 356.5 312.1 14.3 statement Revenue EUR millions 272.6 254.9 6.9 (Adjusted) gross profit EUR millions
Financial report to 31 March 2010
 Dear shareholder, After the crisis year 2009, which tipped Germany and the entire global economy into the deepest recession in the post-war period, the effects are still being felt by the Einhell Group.
Quarterly Financial Report Logwin AG
 Quarterly Financial Report 2008 Logwin AG Key Figures January 1 March 31, 2008 in thousand 2 3 Months Group 2008 2007 in % Sales 523,180 507,462 3.1 Gross profit 40,909 42,277 3.2 Margin 7.8 % 8.3 % Earnings
Quarterly Statement 1 st quarter 2018
 Quarterly Statement 1 st quarter 2018 Selected figures (unaudited) Sales and result 01/01-03/31/2018 01/01-03/31/2017 Change Sales (KEUR) 2,782 3,095-10% EBITDA (KEUR) -1,588-1,665 +5% EBIT (KEUR) -1,998-2,151
QUARTERLY REPORT I 2017
 QUARTERLY REPORT I 2017 2 KEY DATA ECKERT & ZIEGLER 1 3/2017 1 3/2016 Change Sales million 37.6 35.8 + 5 % Return on revenue before tax % 15 11 + 32 % EBITDA million 7.7 6.3 + 21 % EBIT million 5.5 4.3
N O R M A G R O U P S E
 NORMA GROUP SE Overview of Key Figures 1 Q2 2017 Q2 2016 H1 2017 H1 2016 Order situation Order book (June 30) EUR millions 310.7 283.8 Income statement Revenue EUR millions 264.1 236.2 519.0 462.8 Gross
Quarterly Financial Report 2014 Logwin AG
 Quarterly Financial Report 2014 Logwin AG Key Figures 1 January 31 March 2014 Group In thousands of EUR 2014 2013 Revenues 278,533 320,696 Change on 2013-13.1% Operating result (EBIT) 8,048 8,016 Margin
HALF YEAR REPORT January 1 June 30, 2007
 HALF YEAR REPORT January 1 June 30, 2007 CONTENTS Summary 3 Interim Management Report / Results and Core Data 4 Deutsche Wohnen Shares 7 Merger with the GEHAG Group 8 Outlook 11 Key Figures 12 Consolidated
INTERIM REPORT BY THE EXECUTIVE BOARD FIRST QUARTER 14/15
 INTERIM REPORT BY THE EXECUTIVE BOARD FIRST QUARTER 14/15 2 3 FOREWORD BY THE EXECUTIVE BOARD Dear shareholders, The Bene Group has consistently implemented restructuring measures and realised impressive
ERSTEN QUARTALS +4.1 % REVENUES climbs to EUR million 12.7EUR MILLION EBITDA 6.7 EUR MILLION. Sound adjusted free cash flow
 HALF-YEARLY FINANCIAL REPORT 2017 KENNZAHLEN KEY FIGURES DES ERSTEN QUARTALS +4.1 % REVENUES climbs to EUR 104.4 million 12.7EUR MILLION EBITDA 6.7 EUR MILLION Sound adjusted free cash flow Revenue grows
QUARTERLY REPORT FEBRUARY TO APRIL
 QUARTERLY REPORT FEBRUARY TO APRIL 2018 CONTENTS 2 THE FIRST QUARTER AT A GLANCE 3 INTERIM GROUP MANAGEMENT REPORT 3 Business and economic environment 6 Risks and opportunities 6 Forecast 7 INTERIM CONDENSED
Half-Yearly Report 2016
 Half-Yearly Report 2016 Revenue expanded 5 % to EUR 38.3 million in first six months Orders on hand up 15 % to EUR 11.8 million Marked upturn in the second quarter report optimize! Half-yearly report 2016
SHAPING THE FUTURE Q1 Report 2018
 SHAPING THE FUTURE Q1 Report 2018 Key share data Ticker / ISIN AM3D / DE000A111338 Letter from the Board Dear shareholders, customers, business partners and employees, Number of shares 17,980,867 Closing
TECHNOTRANS AT A GLANCE
 Quarterly Communication January 1 March 31, 2016 TECHNOTRANS AT A GLANCE Δ previous year 1/1/ 31/3/2016 1/1/ 31/3/2015 2015 2014 `000 `000 `000 `000 Earnings 0.5 % 30,403 30,570 122,838 112,371 of which
Driving profitable growth
 Mid-Year Report 2017 Driving profitable growth Key figures as of 30 June 2017 Sales in CHF million 1 992 EBIT in CHF million Net profit in CHF million 1 863 1 802 168 42% GF Piping Systems 826 CHF million
Report on the first three quarters of 2016 Solid development in a challenging market environment
 Report on the first three quarters of 2016 Solid development in a challenging market environment Revenue at EUR 647.6 million slightly below prior-year level Improved EBITDA margin at 11.1% and EBIT margin
Nine-Month Financial Report September 30, 2007 Thiel Logistik AG
 Nine-Month Financial Report September 30, 2007 Thiel Logistik AG Key Figures January 1 - September 30, 2007 9 Months 3rd Quarter Group in thousand 2007 2006 in % 2007 2006 in % Sales 1,527,892 1,406,318
Interim Report. First Quarter of Fiscal siemens.com. Energy efficiency. Intelligent infrastructure solutions. Next-generation healthcare
 Energy efficiency Next-generation healthcare Industrial productivity Intelligent infrastructure solutions Interim Report First Quarter of Fiscal 2014 siemens.com Key to references REFERENCE WITHIN THE
Interim report 9M InTiCa Systems moved back into profit as scheduled in the third quarter. Innovation for the future
 Interim report 9M 29 InTiCa Systems moved back into profit as scheduled in the third quarter Innovation for the future The first nine months of 29 in figures The Group Q3 28 Q3 29 9M 28 9M 29 Change to
FOR THE FIRST QUARTER OF
 Fall in demand continues As expected the profit after tax of 16.2 million remained at the level of the fourth quarter of 2008 Cost-cutting measures are taking effect Free cash flow rose to 39 million Group
Interim Statement for the 1 st Quarter 2016 of H&R AG
 Interim Statement for the 1 st Quarter 2016 of H&R AG 2 H&R AG INTERIM STATEMENT FOR THE 1 ST QUARTER 2016 Overview Positive developments from previous quarters continue in Q1 2016 Strong demand leads
INTERIM REPORT Q3/2016
 INTERIM Q3/2016 02 KEY INCOME FIGURES KEY INCOME FIGURES of the euromicron Group at September 30, 2016 Key figures 2016 2015 thou. thou. Sales 226,567 242,708 EBITDA (operating) * 1,428 5,761 EBITDA margin
INTERIM STATEMENT THIRD QUARTER
 THIRD QUARTER Overview of Order situation Q3 2018 1 Q3 2017 1 2018 1 2017 1 Order book (Sep 30) EUR millions 358.7 322.7 statement Revenue EUR millions 268.1 244.4 817.1 763.4 Adjusted gross profit EUR
Interim Report January March 2016
 Q1 Interim Report January March 2016 Published on April 28, 2016 WACKER is one of the world s largest producers of hyperpure polycrystalline silicon, which is the key raw material for solar cells and semiconductors.
Jan.-March Result per share pursuant to DVFA* 0.18 EUR 0.02 EUR >100.0 %
 Geratherm Medical AG Interim Report 1 st Quarter of 2010 2 GERATHERM AT A GLANCE Group financial ratio Jan.-March 2009 Jan.-March 2008 Change Turnover 3,958 3,113 27.2 % Including export share 3,417 2,386
Group Interim Report H1 2016
 Group Interim Report H1 2016 Half-yearly financial statements of Hoftex Group AG for the period from January 1 to June 30, 2016 1 HIGHLIGHTS H1 2016 Group figures H1 / 2016 H1 / 2015 Change in EUR thousand
THREE-MONTH REPORT 2018: BUSINESS DEVELOPMENT. Key Figures. Product Launches
 3-MONTH REPORT 2018 GROUP KEY FIGURES JANUARY - MARCH 2016/2017/2018 Key Figures in m* OI 2016 QI 2017 QI 2018 Changes to previous year Sales revenues 22.4 36.3 44.9 24 % Incoming orders 23.5 60.4 46.1-24
Quarterly Financial Report. 1 January 31 March 2016
 1 January 31 March 2016 Table of Contents TABLE OF CONTENTS LPKF LASER & ELECTRONICS AG AT A GLANCE... 3... 4 Interim Management Report As of 31 March 2016... 5 1 Fundamental information about the Group...
Key figures for the Group in million Q1/2018 Q1/2017 ± %
 02 STADA Key Figures STADA KEY FIGURES Key figures for the Group in million Q1/2018 Q1/2017 ± % Group sales 558.1 566.3-1% Generics 326.8 325.9 0% Branded Products 231.3 240.4-4% Operating profit 87.9
Half-yearly Financial Report. 1 January - 30 June 2016
 Half-yearly Financial Report 1 January - 30 June 2016 Half-yearly Financial Report Table of contents Table of contents LPKF LASER & ELECTRONICS at a glance... 3 Chairman's statement... 4 Interim Management
Quarterly Financial Report. 31 March Aumann AG, Beelen
 Quarterly Financial Report 31 March 2017 Aumann AG, Beelen Welcome Note from the Management Board Welcome Note from the Managing Board Dear Shareholders, In the first quarter of 2017, Aumann AG made a
Comments on the business review and on the consolidated financial statements 3
 2014 Annual results CONTENTS Key figures 1 1 Comments on the business review and on the consolidated financial statements 3 1.1. Business review 4 1.2. Results of operations 9 1.3. Financial structure