Consolidated Financial Results of the LOTOS Group Q (IFRS)
|
|
|
- Carmella Stephens
- 5 years ago
- Views:
Transcription


")

1 Consolidated Financial Results of the LOTOS Group Q (IFRS) Management Board of Grupa LOTOS 11th May 2011
2 Summary and key achievements Main investments update Market Conditions Upstream Downstream Overall financial results Management Board 2/30


 Strong")

3 KEY Q ACHIEVEMENTS First results of 10+ Programme significantly influenced downstream segment result Record high EBIT at PLN 413m (+213% yoy) Strong net profit at PLN 636m Gaining full control over AB Geonafta Management Board 3/30
 Crude oil throughput amounted to 2,223k tonnes Consolidated sales at the level of 2,485k tonnes EBITDA at PLN 533.")
 Brent/Ural differential increased from 1.")
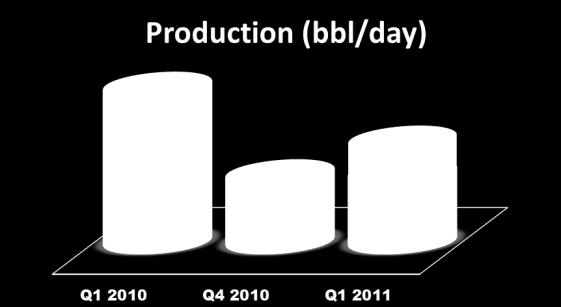
4 Q1 11 OVERALL FIGURES Crude oil production amounted to 4,325 bbl/d (50.3k tonnes) Crude oil throughput amounted to 2,223k tonnes Consolidated sales at the level of 2,485k tonnes EBITDA at PLN 533.8m due to growing depreciation and amortization and high EBIT Average benchmark refining margin decreased by 36.4% yoy from 2.61 to 1.66 USD/bbl Average Brent dtd price amounted to USD/bbl (+38.1% yoy) Brent/Ural differential increased from 1.05 USD/bbl to 2.88 USD/bbl (+174.3% yoy) Management Board 4/30
5 1 Summary and key achievements 2 Main investments update Market Conditions Upstream Downstream Overall financial results Management Board 5/30
 The price of acqusition (as already mentioned) of UAB Meditus, which owns 59.41% stake of AB Geonafta consists of: (i) EUR 56.")
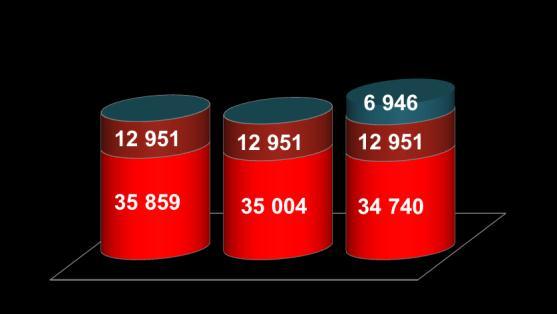
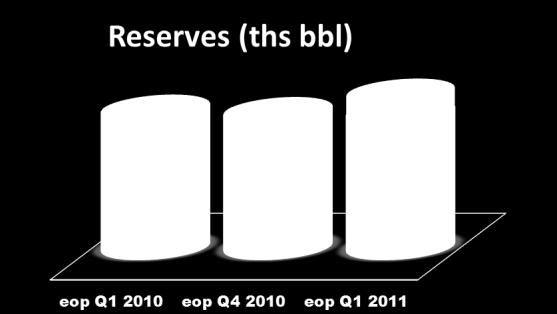
6 MAIN INVESTMENTS UPDATE FINALISATION OF GEONAFTA ACQUSITION On February 3rd LOTOS has gained full control of AB Geonafta acquiring the remaining stake in the company (previously an equity shareholding of 40.59%) The price of acqusition (as already mentioned) of UAB Meditus, which owns 59.41% stake of AB Geonafta consists of: (i) EUR 56.8m, (ii) adjustment on net debt, (iii) part of potential former shareholder s obligations Settlement of the deal triggered revaluation of the previously held 40.59% stake in Geonafta. Additonal goodwill value of PLN 123.9m has been included in the financial revenues Fixed assets increase of PLN 317.4m, representing the exploration licenses granted to AB Geonafta and it s subsidiaries UAB Genciu Nafta, UAB Minijos Nafta oraz UAB Manifoldas. The licences shall be amortised naturally Crude oil sales for the first quarter of 2011 amounted to 133 ths bbl (17.4 ths tonnes) Management Board 6/30


7 MAIN INVESTMENTS UPDATE 10+ PROGRAMME At the end of Q first products from ROSE instalation were obtained Ongoing process of analysing, integrating and optimisation of the logistical assets in order to achieve top quality of the processes maintained within the refinery after 10+ Programme Management Board 7/30

8 Summary and key achievements Main investments update Market Conditions Upstream Downstream Overall financial results Management Board 8/30
9 MARKET CONDITIONS KEY FACTORS Refining margin Crude oil prices Positive impact of increase in Brent/Ural differential in comparison with Q4 10 and Q1 10 Negative impact of decrease in refining margin qoq and yoy Increase in crude oil prices qoq and yoy Management Board 9/30

10 MARKET CONDITIONS KEY FACTORS FX rate LIBOR 3M USD The EUR/USD FX rate slightly increased qoq, while the USD/PLN rate decreased Downward trend of 3M USD LIBOR rate from beginning of October 2008 Management Board 10/30
11 Summary and key achievements Main investments update Market conditions Upstream Downstream Overall financial results Management Board 11/30

12 UPSTREAM GEOGRAPHICAL COVERAGE OF LOTOS UPSTREAM OPERATIONS Helsinki Oslo Stockholm Vilnius Warsaw Management Board 12/29
 -15% EBIT (PLN m) -40% Net sales yoy")


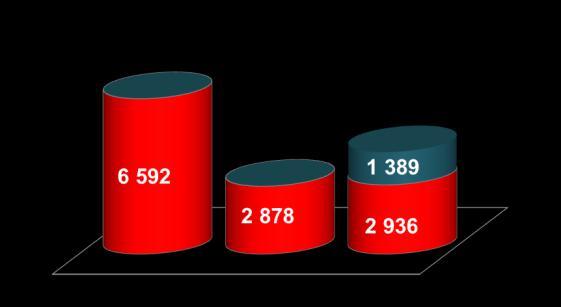
13 UPSTREAM FINANCIAL RESULTS QUARTERLY VIEW Net sales (PLN m) -23% EBITDA (PLN m) -15% EBIT (PLN m) -40% Net sales yoy lower due to decreased volume of Rozewie crude; qoq net sales higher due to AB Geonafta sales EBIT decreased yoy mainly due to lower sales volume EBIT increase qoq mainly due to higher crude oil prices and impairments in Q4 of 2010 Management Board 13/30
14 Summary and key achievements Main investments update Market conditions Upstream Downstream Overall financial results Management Board 14/30


15 DOWNSTREAM CRUDE OIL THROUGHPUT +38% Q09* 2Q09* 3Q09 4Q09 1Q10 2Q10 3Q10 4Q10 1Q11 * Lower throughput in Q1 and Q2 09 due to maintenance shutdown Significant increase in crude oil throughput yoy due to operating new units Stable crude oil throughput qoq Management Board 15/30
 In Q1 2011 sales volumes were significantly higher (+30% yoy), due to refinery production growth Management Board 16/30")
16 DOWNSTREAM PRODUCTION AND SALES OF PRODUCTS AND GOODS PRODUCTION Q ( 000 t) SALES Q ( 000 t) In Q total production reached 2,481 thousand tonnes (+28% yoy) In Q sales volumes were significantly higher (+30% yoy), due to refinery production growth Management Board 16/30


17 DOWNSTREAM MARKET SHARE AND RETAIL NETWORK Total market share Retail Network Total Polish fuel market share higher by 2.5 pp. vs. end of 2010, significant growth in middle distillates market share The number of CODO and DOFO stations increased by 2 and 3 respectively, whereas 13 DODO cooperation contracts has expired as a consequence of LOTOS retail network restructuring activities 116 franchise agreements signed as of March 31th 2011 Management Board 17/30
 Retai")


18 DOWNSTREAM RETAIL AREA Retail Sales (PLN m) Retail EBIT (PLN m) +27% n.a. Retail sales higher by 27% yoy 12.8m PLN retail operating loss due to unfavourable market conditions and pressure on margins Management Board 18/30

, growing sales volumes and high Brent Ural differential Management")
19 DOWNSTREAM FINANCIAL RESULTS QUARTERLY VIEW Net sales (PLN m) EBITDA (PLN m) EBIT (PLN m) +66% +202% +295% 391 Financial results of the downstream segment are positively impacted by sales volume boost due to enhanced throughput capacity of Gdańsk refinery EBIT increase follows growing crude oil prices in Q1 11 (LIFO effect), growing sales volumes and high Brent Ural differential Management Board 19/30

20 DOWNSTREAM DOWNSTREAM OPERATING PROFIT ACCORDING TO LIFO INVENTORY VALUATION QUARTERLY VIEW LIFO effect = -278 LIFO effect = -69 As a result of growing crude oil prices the LIFO effect was negative and amounted to -278 m PLN Management Board 20/30
21 Summary and key achievements Main investments update Market conditions Upstream Downstream 6 Downstream Overall financial results Management Board 21/30

22 ONE-OFFS AND CHANGES IN REPORTING AND PRESENTATION METHODOLOGY Fixed assets increase of PLN 317.4m, representing the exploration licenses granted to AB Geonafta and it s subsidiaries UAB Genciu Nafta, UAB Minijos Nafta oraz UAB Manifoldas. The licences shall be amortised naturally PLN 123.9m positive impact on financial revenues goodwill one-off related to AB Geonafta acquisition Hedge accounting has been introduced starting from January 1st 2011 with respect to cash flow hedges, applicable for the 10+ programme investment loan facility Operational result has been restated by using average FX rates for booking of oil purchases (previously the result could have been different due to e.g. bank FX spread)* * Effective for q and q For following quarters similar excercise shall be done, which will lead to restatement of 2010 results. Management Board 22/30

23 OVERALL FINANCIAL RESULTS Q1 11 FINANCIAL RESULTS 1Q11 1Q10 Management Board 23/30


24 OVERALL FINANCIAL RESULTS OPERATING PROFIT ACCORDING TO LIFO INVENTORY VALUATION QUARTERLY VIEW LIFO effect = -278 LIFO effect = -69 As a result of growing crude oil prices the LIFO effect was negative and amounted to -278 m PLN Q EBIT for total company reached 413m PLN and was higher by 281m PLN compared to Q Management Board 24/30

25 OVERALL FINANCIAL RESULTS Q1 11 RESULT ON HEDGING Positive impact of hedging transactions on the results at the level of over PLN 93m Management Board 25/30

26 OVERALL FINANCIAL RESULTS Q1 11 RATIOS EBITDA margin EBIT margin Net margin Management Board 26/30
 +794m Management Board")
27 OVERALL FINANCIAL RESULTS BALANCE SHEET EVOLUTION OF LIABILITIES STRUCTURE +428m Increase of short term liabilities by +428m PLN resulting from purchase of higher volume of crude oil at an increased price Higher equity by +794m due to retained earnings (by +638m) +794m Management Board 27/30
 Management Board")
28 OVERALL FINANCIAL RESULTS BALANCE SHEET EVOLUTION OF ASSETS STRUCTURE +500m +235m Increase of short term receivables by 26% (+500 m PLN) following higher product prices in the market Higher mandatory reserves volume triggering increase in the level of inventories (+235m PLN) Management Board 28/30

29 OVERALL FINANCIAL RESULTS FINANCIAL DEBT Financial Debt Net debt Gearing ratio -2% -5% -10.9pp Strong cash flow in Q and favorable development of USD/PLN FX rate improving the level of indebtness of the company Management Board 29/30
30 APPENDIX INTRODUCTION OF HEDGE ACCOUNTING Hedge accounting has been introduced starting from January 1st 2011 with respect to cash flow hedges, applicable for the investment loan facility For 80% of the investment loan an effective hedging transaction can be established (remaining 20% stand for the balloon rate) 80% out of 10+ investment loan (~ USD 1 120m) i.e. +10 gr FX rate change FX loans ~ USD 1 400m + ~USD 600m 20% out of 10+ investment loan (~ USD 280m) i.e. +10 gr Fx rate change Other FX loans ~USD 600m Hence, FX USD/PLN changes on 80% of the loan shall be recognized in other comprehensive income (separate component of EQUITY) Settlement of FX changes recognized in EQUITY shall be effected by applying the hedged FX rate to company s FX revenues corresponding with loan repayment for the respective periods BS impact 10gr * = PLN 112 P&L impact 10gr * ( ) = PLN 88 Example of settlement of a respective hedging transaction: 1) FX rate hedged: ) Sample FX rate for the sale hedged with a respective hedging transaction : ) Loan repayment for the quarter = FX sale: USD 20m Revenues from sales at a sample FX rate : PLN 56m Revenues booked including Hedging transaction: PLN 60m Capital change from revaluation: PLN (4)m Management Board 30/30
Consolidated Financial Results of the LOTOS Group Q (IFRS)
") Consolidated Financial Results of the LOTOS Group Q4 2010 (IFRS) Management Board of Grupa LOTOS 15th February 2011 1 2 3 4 5 6 Summary and key achievements Main investments update Market Conditions Upstream
Consolidated Financial Results of the LOTOS Group Q4 2010 (IFRS) Management Board of Grupa LOTOS 15th February 2011 1 2 3 4 5 6 Summary and key achievements Main investments update Market Conditions Upstream
THE LOTOS GROUP. Contents MANAGEMENT S DISCUSSION AND ANALYSIS OF THE FINANCIAL PERFORMANCE IN Q3 2011
 THE LOTOS GROUP MANAGEMENT S DISCUSSION AND ANALYSIS OF THE FINANCIAL PERFORMANCE IN This is a translation of a document originally issued in Polish. Contents 1 Market environment... 2 2 Upstream segment...
Consolidated Financial Results of LOTOS Group 3Q 2013
 Consolidated Financial Results of LOTOS Group 3Q 2013 Management Board of Grupa LOTOS S.A. 29th October 2013 1 2 3 4 5 Key highlights Market conditions Market Upstream Conditions Upstream Downstream Downstream
THE LOTOS GROUP. Contents MANAGEMENT S DISCUSSION AND ANALYSIS OF THE FINANCIAL PERFORMANCE IN Q4 2010
 THE LOTOS GROUP MANAGEMENT S DISCUSSION AND ANALYSIS OF THE FINANCIAL PERFORMANCE IN (This is a translation of a document originally issued in Polish) Contents 1 Market Environment... 2 2 Upstream Segment...
Consolidated Financial Results Q (IFRS)
") Consolidated Financial Results of the LOTOS Group Q4 2008 (IFRS) Paweł Olechnowicz President of the Management Board March, 2 nd 2009 Agenda Financial Results in Q4 2008 Summary Major Events Operational
Consolidated Financial Results of the LOTOS Group Q4 2008 (IFRS) Paweł Olechnowicz President of the Management Board March, 2 nd 2009 Agenda Financial Results in Q4 2008 Summary Major Events Operational
MANAGEMENT S DISCUSSION AND ANALYSIS OF Q CONSOLIDATED FINANCIAL RESULTS
 MANAGEMENT S DISCUSSION AND ANALYSIS OF Q4 2014 CONSOLIDATED FINANCIAL RESULTS GRUPA LOTOS S.A. ISIN Stock Exchange Thomson Reuters Bloomberg PLLOTOS00025 LTS LTSP.WA LTS PW 1 Market environment... 3 2
MANAGEMENT S DISCUSSION AND ANALYSIS OF Q CONSOLIDATED FINANCIAL RESULTS
 MANAGEMENT S DISCUSSION AND ANALYSIS OF Q1 2014 CONSOLIDATED FINANCIAL RESULTS GRUPA LOTOS S.A. ISIN Warsaw Stock Exchange Thomson Reuters Bloomberg PLLOTOS00025 LTS LTOS.WA LTS PW Contents 1 Market environment...
GRUPA LOTOS MANAGEMENT S DISCUSSION AND ANALYSIS OF Q CONSOLIDATED FINANCIAL RESULTS
 This is the translated version of a document originally issued in Polish GRUPA LOTOS MANAGEMENT S DISCUSSION AND ANALYSIS OF Q1 2015 CONSOLIDATED FINANCIAL RESULTS GRUPA LOTOS S.A. ISIN Stock Exchange
This is a translation of a document originally issued in Polish MANAGEMENT S DISCUSSION AND ANALYSIS OF Q CONSOLIDATED FINANCIAL PERFORMANCE
 This is a translation of a document originally issued in Polish MANAGEMENT S DISCUSSION AND ANALYSIS OF Q3 2013 CONSOLIDATED FINANCIAL PERFORMANCE GRUPA LOTOS S.A. ISIN Warsaw Stock Exchange Thomson Reuters
LOTOS Group 2Q 2015 consolidated financial results
 LOTOS Group 2Q 2015 consolidated financial results August 11th, 2015 1 Key highlights 3-4 2 EFRA Programme milestones 5-9 3 External environment 10-13 4 Upstream 14-17 5 Downstream 18-22 6 Consolidated
This is the translation of a document originally issued in Polish MANAGEMENT S DISCUSSION AND ANALYSIS OF Q CONSOLIDATED FINANCIAL RESULTS
 This is the translation of a document originally issued in Polish MANAGEMENT S DISCUSSION AND ANALYSIS OF Q3 2014 CONSOLIDATED FINANCIAL RESULTS GRUPA LOTOS S.A. ISIN Stock Exchange Thomson Reuters Bloomberg
LOTOS Group Q3 Consolidated Financial results
 LOTOS Group Q3 Consolidated Financial results 29 October 2014 Disclaimer Not for release, publication or distribution, directly or indirectly, in or into the United States of America, Australia, Canada
FINANCIAL HIGHLIGHTS - CONSOLIDATED THE LOTOS GROUP
 FINANCIAL HIGHLIGHTS - CONSOLIDATED THE LOTOS GROUP PLN 000 EUR 000 Year ended Year ended Year ended Year ended Dec 31 2012 Dec 31 2011 Dec 31 2012 Dec 31 2011 Revenue 33,111,000 29,259,586 7,933,439 7,067,362
PKN ORLEN consolidated financial results 1Q13
 PKN ORLEN consolidated financial results 1Q13 Jacek Krawiec, CEO Sławomir Jędrzejczyk, CFO 25 April 2013 1 Agenda 1Q13 highlights Macroeconomic environment Financial and operating results in 1Q13 Liquidity
Consolidated Financial Results of Grupa LOTOS S.A. Q (IFRS)
") Consolidated Financial Results of Grupa LOTOS S.A. Q3 2005 (IFRS) Paweł Olechnowicz President of the Management Board 14 November 2005 Agenda Financial Results in Q3 2005 Summary Implementation of Strategy
Consolidated Financial Results of Grupa LOTOS S.A. Q3 2005 (IFRS) Paweł Olechnowicz President of the Management Board 14 November 2005 Agenda Financial Results in Q3 2005 Summary Implementation of Strategy
THE LOTOS GROUP FINANCIAL HIGHLIGHTS. FINANCIAL HIGHLIGHTS - CONSOLIDATED PLN 000 EUR months ended Sep
 FINANCIAL HIGHLIGHTS FINANCIAL HIGHLIGHTS - CONSOLIDATED PLN 000 EUR 000 9 months ended Sep 30 2013 9 months ended Sep 30 2012 9 months ended Sep 30 2013 (restated) 9 months ended Sep 30 2012 (restated)
Financial Performance of PGNiG Group. August 31st, 2009
 Financial Performance of PGNiG Group H1 29 August 31st, 29 Financial highlights PGNiG Group (PLNm) H1 28 H1 29 change Q2 28 Q2 29 change Sales revenue 9,26 1,254 11% 3,929 3,875 (1%) Operating expenses
CONTINUING OBTAINING EXCELLENT RESULTS
 CONTINUING OBTAINING EXCELLENT RESULTS Rompetrol Rafinare (symbols, Bucharest Stock Exchange: RRC, Reuters: ROMP.BX) has released today its 2005 second quarter and first half financial and operational
Piotr Kownacki, CEO Jerzy Pazura, Planning and Controlling Executive Director August 13 th 2007
 Consolidated financial results of PKN ORLEN Q2 27 (IFRS) Piotr Kownacki, CEO Jerzy Pazura, Planning and Controlling Executive Director August 13 th 27 1 Agenda Financial results in Q2 7 Analysis of results
UNIPETROL 4Q 2013 FINANCIAL RESULTS
 UNIPETROL 4Q 2013 FINANCIAL RESULTS Marek Świtajewski, CEO Mirosław Kastelik, CFO Prague, Czech Republic AGENDA Key highlights of 4Q 2013 Macro environment Financial results Segment results CAPEX, cash
Financial Statements Matti Lievonen, President & CEO 7 February 2018
 Financial Statements 2017 Matti Lievonen, President & CEO 7 February 2018 Agenda 1. Year 2017 2. Group financials 2017 3. Segment reviews 4. Current topics 5. Appendix 2 Disclaimer The following information
Annual report of Grupa LOTOS S.A Annual report of Grupa LOTOS S.A. 2016
 Annual report of Grupa LOTOS S.A. 2016 Annual report of Grupa LOTOS S.A. 2016 Annual report of Grupa LOTOS S.A. 2016 A. Letter of the President of the Management Board B. Grupa LOTOS S.A. Financial highlights
Fuelling the future. July 20, 2018 Prague, Czech Republic
 Fuelling the future July 20, 2018 Prague, Czech Republic UNIPETROL FINANCIAL RESULTS Krzysztof Zdziarski, CEO Mirosław Kastelik, CFO #UNIPETROLQ2 @unipetrolcz TABLE OF CONTENTS KEY HIGHLIGHTS OF MACRO
Consolidated Statement of Profit or Loss (in million Euro)
") Consolidated Statement of Profit or Loss (in million Euro) Q1 2016 Q1 2017 % change Revenue 603 588-2.5% Cost of sales (408) (396) -2.9% Gross profit 195 192-1.5% Selling expenses (84) (86) 2.4% Research
Consolidated Statement of Profit or Loss (in million Euro) Q1 2016 Q1 2017 % change Revenue 603 588-2.5% Cost of sales (408) (396) -2.9% Gross profit 195 192-1.5% Selling expenses (84) (86) 2.4% Research
Consolidated Statement of Profit or Loss (in million Euro)
") Consolidated Statement of Profit or Loss (in million Euro) Q3 2015 Q3 2016 % change 9m 2015 9m 2016 % change Revenue 661 625-5.4% 1,974 1,873-5.1% Cost of sales (453) (415) -8.4% (1,340) (1,239) -7.5%
Consolidated Statement of Profit or Loss (in million Euro) Q3 2015 Q3 2016 % change 9m 2015 9m 2016 % change Revenue 661 625-5.4% 1,974 1,873-5.1% Cost of sales (453) (415) -8.4% (1,340) (1,239) -7.5%
(THIS DOCUMENT IS AN APPENDIX TO THE INTERIM CONDENSED CONSOLIDATED FINANCIAL STATEMENTS OF THE LOTOS GROUP)
") GRUPA LOTOS S.A. (THIS DOCUMENT IS AN APPENDIX TO THE INTERIM CONDENSED CONSOLIDATED FINANCIAL STATEMENTS OF THE LOTOS GROUP) INTERIM CONDENSED FINANCIAL STATEMENTS FOR THE SIX MONTHS ENDED JUNE 30TH 2011
GRUPA LOTOS S.A. (THIS DOCUMENT IS AN APPENDIX TO THE INTERIM CONDENSED CONSOLIDATED FINANCIAL STATEMENTS OF THE LOTOS GROUP) INTERIM CONDENSED FINANCIAL STATEMENTS FOR THE SIX MONTHS ENDED JUNE 30TH 2011
Q4 and Full Year 2007 STRONG RESULTS FOR THE 3 RD CONSECUTIVE YEAR
 Q4 and Full Year 27 STRONG RESULTS FOR THE 3 RD CONSECUTIVE YEAR Disclaimer "This presentation and the associated slides and discussion contain forward-looking statements. These statements are naturally
ORLEN GROUP RESULTS OF THE ORLEN GROUP FOR THE I QUARTER OF 2013 (Translation of a document originally issued in Polish)
") Summary of the results ORLEN GROUP RESULTS OF THE ORLEN GROUP FOR THE I QUARTER OF Table 1 Q4 Key financial data, PLNm 1 2 4=(2-)/ 5 6 7 8=(6-7)/7 1 245 27 472 29 248-6.1 Total sales revenue 27 472 29
Summary of the results ORLEN GROUP RESULTS OF THE ORLEN GROUP FOR THE I QUARTER OF Table 1 Q4 Key financial data, PLNm 1 2 4=(2-)/ 5 6 7 8=(6-7)/7 1 245 27 472 29 248-6.1 Total sales revenue 27 472 29
Investor News November 9, 2016, 6:30 am (GMT), 7:30 am (CET)
, 7:30 am (CET)") Investor News November 9, 2016, 6:30 am (GMT), 7:30 am (CET) OMV Aktiengesellschaft OMV Group Report January September and Q3 2016 including interim consolidated financial statements as of September 30,
Investor News November 9, 2016, 6:30 am (GMT), 7:30 am (CET) OMV Aktiengesellschaft OMV Group Report January September and Q3 2016 including interim consolidated financial statements as of September 30,
1Q 2017 FINANCIAL RESULTS UNIPETROL. Andrzej Modrzejewski, CEO Mirosław Kastelik, CFO. 27 April 2017 Prague, Czech Republic.
 UNIPETROL 1Q 2017 FINANCIAL RESULTS Andrzej Modrzejewski, CEO Mirosław Kastelik, CFO 27 April 2017 Prague, Czech Republic #Unipetrol @unipetrolcz TABLE OF CONTENTS KEY HIGHLIGHTS OF 1Q 2017 MACRO ENVIRONMENT
Supplementary Information
 Supplementary Information The information below has been provided to enhance understanding of the terminology and performance measures that have been used in the accompanying presentations. Group measures
OMV Q Conference Call
 OMV Q2 208 Conference Call Rainer Seele Chairman of the Executive Board and CEO August 2, 208 OMV Aktiengesellschaft Disclaimer This report contains forward-looking statements. Forward-looking statements
Fuelling the future. October 19, 2017 Prague, Czech Republic
 Fuelling the future October 19, 2017 Prague, Czech Republic UNIPETROL FINANCIAL RESULTS Andrzej Modrzejewski, CEO Mirosław Kastelik, CFO #UNIPETROLQ3 @unipetrolcz TABLE OF CONTENTS KEY HIGHLIGHTS OF MACRO
ORLEN GROUP CONSOLIDATED QUARTERLY REPORT
 CONSOLIDATED QUARTERLY REPORT FOR THE 1 st QUARTER 2018 4 ORLEN GROUP - SELECTED DATA PLN million EUR million Sales revenues 23 241 22 875 5 562 5 333 Profit from operations increased by depreciation and
First Quarter results Matti Lievonen, President & CEO 27 April 2017
 First Quarter results 2017 Matti Lievonen, President & CEO 27 April 2017 Agenda 1. Q1/17 Group financials 2. Q1/17 Segment reviews 3. Current topics 4. Appendix 2 Disclaimer The following information contains,
GRUPA LOTOS S.A. FINANCIAL HIGHLIGHTS
 FINANCIAL HIGHLIGHTS PLN 000 EUR 000 Dec 31 2015 Dec 31 2014 Dec 31 2015 Dec 31 2014 Revenue 20,482,298 26,243,106 4,894,451 6,264,318 Operating profit/(loss) 183,757 (1,294,183) 43,911 (308,926) Pre-tax
2013 3Q Results Presentation. Athens, 14 November 2013
 2013 3Q Results Presentation Athens, 14 November 2013 CONTENTS Executive Summary Industry Environment Group Results Overview Segmental Performance Financial Results Q&A 1 3Q 2013 GROUP KEY FINANCIALS FY
PEGAS NONWOVENS a.s. Preliminary unaudited consolidated financial results for 2017
 PEGAS NONWOVENS a.s. Preliminary unaudited consolidated financial results for 2017 22 March 2018 2017 Preliminary unaudited financial results PEGAS NONWOVENS a.s. announces its preliminary unaudited consolidated
Record year without Gas Business 2006 AND 2006 IV. QUARTER PRELIMINARY RESULTS. February 12, 2007
 Record year without Gas Business AND IV. QUARTER PRELIMINARY RESULTS February 12, 2007 highlights Outstanding results due to previous years investments and efficiency improvements in all businesses Key
Half-year results Matti Lievonen, President & CEO 3 August 2017
 Half-year results 2017 Matti Lievonen, President & CEO 3 August 2017 Agenda 1. Q2/17 Group financials 2. January-June 2017 review 3. Q2/17 Segment reviews 4. Current topics 5. Appendix 2 Disclaimer The
ANNUAL REPORT OF ORLEN GROUP FOR THE YEAR 2015
 ANNUAL REPORT OF ORLEN GROUP FOR THE YEAR 2015 1. LETTER OF THE PRESIDENT OF THE BOARD 2. OPINION AND REPORT OF THE INDEPENDENT AUDITOR 3. SELECTED FINANCIAL DATA 4. FINANCIAL STATEMENTS OF ORLEN GROUP
Financial results: FY 2006 (IFRS) and financial assumptions for the 2007 plan Piotr Kownacki, CEO Paweł Szymański, CFO
 and financial assumptions for the 2007 plan Piotr Kownacki, CEO Paweł Szymański, CFO") PSG\JAN5\EP\K2_OVERVIEW(1).PPT Financial results: FY 26 (IFRS) and financial assumptions for the 27 plan Piotr Kownacki, CEO Paweł Szymański, CFO March 1st 27 1 EBITDA increase of PKN ORLEN by 4% when
PSG\JAN5\EP\K2_OVERVIEW(1).PPT Financial results: FY 26 (IFRS) and financial assumptions for the 27 plan Piotr Kownacki, CEO Paweł Szymański, CFO March 1st 27 1 EBITDA increase of PKN ORLEN by 4% when
Consolidated Statement of Profit or Loss (in million Euro)
") Consolidated Statement of Profit or Loss (in million Euro) Unaudited, consolidated figures following IFRS accounting policies. Q2 2017 Q2 2018 H1 2017 H1 2018 Revenue 622 559 1,210 1,108 Cost of sales
Consolidated Statement of Profit or Loss (in million Euro) Unaudited, consolidated figures following IFRS accounting policies. Q2 2017 Q2 2018 H1 2017 H1 2018 Revenue 622 559 1,210 1,108 Cost of sales
BAZAN Group Oil Refineries Ltd. Second Quarter 2013 Results. August 2013
 BAZAN Group Oil Refineries Ltd. Second Quarter 2013 Results August 2013 1 Disclaimer This presentation has been prepared by Oil Refineries Ltd. (the "Company") as a general presentation of the Company
RESULTS SECOND QUARTER AND FIRST HALF 2011
 RESULTS SECOND QUARTER AND FIRST HALF 2011 Delivering growth through exploration and production TABLE OF CONTENTS Executive summary... 3 Key figures... 4 Basis of presentation... 5 Market environment...
Value creation through performance
 Investor Meeting Reinhard Florey, Chief Financial Officer Munich April 5, 2017 Value creation through performance OMV Aktiengesellschaft Disclaimer This presentation contains forward looking statements.
CONSOLIDATED FINANCIAL STATEMENTS
 CONSOLIDATED FINANCIAL STATEMENTS FOR THE YEAR ENDED 31 DECEMBER ENDESA, S.A. AND SUBSIDIARIES CONSOLIDATED STATEMENTS OF FINANCIAL POSITION AT 31 DECEMBER AND 31 DECEMBER ASSETS 31 December 31 December
SEAT Pagine Gialle Group
 Reclassified statement of operations 2007 2006 Absolute % Revenues from sales and services 1,453.6 1,460.2 (6.6) (0.5) Materials and external services (*) (504.2) (568.9) 64.7 Salaries, wages and employee
Results for Q3/07. Record net income with growth in all businesses. David Davies, CFO November 15, Move & More. 1 OMV Group, Q3/07
 Results for Record net income with growth in all businesses David Davies, CFO November 15, 2007 1 OMV Group, Move & More. Key themes in Clean EBIT at EUR 625 mn, up 15% on Strong earnings growth across
BAZAN Group Oil Refineries Ltd. First Nine Months and Q Results. November 2012
 BAZAN Group Oil Refineries Ltd. First Nine Months and Q3 2012 Results November 2012 2 Disclaimer This presentation has been prepared by Oil Refineries Ltd. (the "Company") as a general presentation of
SEPARATE ANNUAL REPORT OF PKN ORLEN S.A. FOR THE YEAR 2015
 SEPARATE ANNUAL REPORT OF PKN ORLEN S.A. FOR THE YEAR 2015 1. LETTER OF THE PRESIDENT OF THE BOARD 2. OPINION AND REPORT OF THE INDEPENDENT AUDITOR 3. SELECTED FINANCIAL DATA 4. SEPARATE FINANCIAL STATEMENT
CONSOLIDATED FINANCIAL STATEMENTS
 CONSOLIDATED FINANCIAL STATEMENTS FOR THE SIX MONTHS ENDED 30 JUNE 2017 ENDESA, S.A. AND SUBSIDIARIES CONSOLIDATED STATEMENTS OF FINANCIAL POSITION AT 30 JUNE 2017 AND 31 DECEMBER 2016 (*) Unaudited ASSETS
Supplementary Information Fourth quarter 2018
 Supplementary Information Fourth quarter 2018 The information below has been provided to enhance understanding of the terminology and performance measures that have been used in the accompanying presentations.
PETROLIAM NASIONAL BERHAD
 1. EXECUTIVE SUMMARY FY Ended 31 March Restated 2 Change Revenue 62,539 76,979 (18.8) Profit After Taxation 13,146 17,211 (23.6) Total Assets 125,691 106,586 17.9 Shareholders Equity 74,305 63,463 17.1
SARAS Second Quarter and First Half 2014 results
 SARAS Second Quarter and First Half 2014 results 8 th August 2014 8 August 2014 Saras SpA 1 AGENDA Highlights Segments Review Financials Outlook & Strategy Additional Information DISCLAIMER Certain statements
RESULTS TWELVE MONTHS AND FOURTH QUARTER OF 2012
 RESULTS TWELVE MONTHS AND FOURTH QUARTER OF 2012 Solid foundations to deliver sustainable value GALP ENERGIA: GROWING ENERGY TO CREATE SUSTAINABLE VALUE Who we are We are an integrated energy operator
RESULTS SECOND QUARTER AND FIRST HALF Extending success into new challenges
 RESULTS SECOND QUARTER AND FIRST HALF 2009 Extending success into new challenges TABLE OF CONTENTS EXECUTIVE SUMMARY... 3 KEY FIGURES... 4 BASIS OF PRESENTATION... 5 MARKET ENVIRONMENT... 6 FINANCIAL REVIEW...
Interim Report Q2 FY 18
 Interim Report Q2 FY 18 Quarter 2 / Fiscal Year 2018 Strong revenue growth driven by Signia Nx Sivantos delivered a strong organic growth 1) of 9.8% in Q2 2018 while nominal growth at 3.6% accounted negative
Q3 Investor Call. September 2016
 Q3 Investor Call September 2016 Disclaimer This presentation has been prepared by Corral Petroleum Holdings AB (publ) and/or its subsidiaries and affiliates ( Corral ). The information contained in this
Investor News February 16, 2017, 8:30 am (local time), 7:30 am (CET), 6:30 am (GMT)
, 7:30 am (CET), 6:30 am (GMT)") Investor News February 16, 2017, 8:30 am (local time), 7:30 am (CET), 6:30 am (GMT) OMV Petrom S.A. OMV Petrom Group: results 1 for Q4 and January December 2016 Highlights Q4/16 Free cash flow at RON 432
Investor News February 16, 2017, 8:30 am (local time), 7:30 am (CET), 6:30 am (GMT) OMV Petrom S.A. OMV Petrom Group: results 1 for Q4 and January December 2016 Highlights Q4/16 Free cash flow at RON 432
07/ M BOND ISSUE
 Q4 07/2015 70M BOND ISSUE Q4.2017, 28.2.2018 Consolidated statements have been prepared in accordance with International Financial Reporting Standards (IFRS) and unconsolidated statements have been prepared
8:00 am 2, 2018, August. for the. Highlights. 1.1 bn Clean CCS Clean CCS. the largest contributor. c. The six-week. Our operating
 Investor News August 2, 208, 8:00 am (local time), 7:000 am (CEST), 6:000 am (BST) OMV Petrom S.A. OMV Petrom Group results for January June and Q2 208 ncluding unaudited interim condensed consolidatedd
Financial Statements Fortum Corporation 2 February 2017
 Financial Statements 2016 Fortum Corporation 2 February 2017 Disclaimer This presentation does not constitute an invitation to underwrite, subscribe for, or otherwise acquire or dispose of any Fortum shares.
CORRAL FINANS AB (publ)
") CORRAL FINANS AB (publ) INTERIM REPORT FOR THREE MONTHS ENDED SEPTEMBER 30, 2007 FOR IMMEDIATE RELEASE Date: November 30, 2007 Stockholm Nr. of pages 12 Organizational Structure Corral Finans AB (publ)
CORRAL FINANS AB (publ) INTERIM REPORT FOR THREE MONTHS ENDED SEPTEMBER 30, 2007 FOR IMMEDIATE RELEASE Date: November 30, 2007 Stockholm Nr. of pages 12 Organizational Structure Corral Finans AB (publ)
RESULTS FOR Q ANALYST TELECONFERENCE
 RESULTS FOR Q3 217 ANALYST TELECONFERENCE Market 1 2 Operation Financials 3 Market 1 217 Third Quarter Market Conditions Fires & Strikes in Europe Harsh Hurricane Season in United States Increase in Global
Interim Report Q1 FY 18
 Interim Report Q1 FY 18 Quarter 1 / Fiscal Year 2018 Continued positive development extends into the new fiscal year Sivantos delivered 3.5% organic growth 1) in Q1 2018 with negative Fx translation effects
Corral Q May 2017
 Corral Q1 2017 May 2017 Disclaimer This presentation has been prepared by Corral Petroleum Holdings AB (publ) and/or its subsidiaries and affiliates ( Corral ). The information contained in this presentation
LOTOS Group. Proposed Rights Issue. 1 September LOTOS Group
 Proposed Rights Issue 1 September 2014 Disclaimer Not for release, publication or distribution, directly or indirectly, in or into the United States of America, Australia, Canada or Japan. This presentation
INA Group financial results (IFRS)
") Q1- / INA Group (ZB: INA-R-A; www.ina.hr) announced its Q1- / results today. This report contains unaudited consolidated financial statements for the period ending 30 September as prepared by the Management
Q1- / INA Group (ZB: INA-R-A; www.ina.hr) announced its Q1- / results today. This report contains unaudited consolidated financial statements for the period ending 30 September as prepared by the Management
ORLEN GROUP CONSOLIDATED HALF-YEAR REPORT
 CONSOLIDATED HALF-YEAR REPORT FOR THE 1ˢ HALF 2018 4 ORLEN GROUP - SELECTED DATA PLN million EUR million Sales revenues 49 942 45 900 11 780 10 807 Profit from operations increased by depreciation and
CORRAL PETROLEUM HOLDINGS AB (publ)
") CORRAL PETROLEUM HOLDINGS AB (publ) REPORT FOR THE FIRST QUARTER ENDED MARCH 31, 2018 FOR IMMEDIATE RELEASE Date: May 30, 2018 Stockholm No. of pages 14 This report includes unaudited consolidated financial
CORRAL PETROLEUM HOLDINGS AB (publ) REPORT FOR THE FIRST QUARTER ENDED MARCH 31, 2018 FOR IMMEDIATE RELEASE Date: May 30, 2018 Stockholm No. of pages 14 This report includes unaudited consolidated financial
RESULTS FIRST HALF AND SECOND QUARTER OF 2012
 RESULTS FIRST HALF AND SECOND QUARTER OF 2012 Solid foundations to deliver sustainable value TABLE OF CONTENTS Executive summary... 3 Key figures... 4 Basis of presentation... 5 Market environment... 6
07/ M BOND ISSUE
 Q3 07/2015 70M BOND ISSUE Q3.2017, 30.11.2017 Consolidated statements have been prepared in accordance with International Financial Reporting Standards (IFRS) and unconsolidated statements have been prepared
Group information. 6 Financial performance. 21 Depreciation, depletion and amortization. 7 Group income statement. 22 Group balance sheet
 6 Financial performance 7 Group income statement 8 Summarized group income statement by quarter 10 Replacement cost profit (loss) before interest and tax by business and geographical area 12 Non-operating
1Q 2018 IFRS FINANCIAL RESULTS. May 29, 2018
 1Q 2018 IFRS FINANCIAL RESULTS May 29, 2018 Forward-looking statements Certain statements in this presentation are not historical facts but are forward-looking. Examples of such forward-looking statements
RESULTS FOURTH QUARTER AND TWELVE MONTHS Extending success into new challenges
 RESULTS FOURTH QUARTER AND TWELVE MONTHS 2009 Extending success into new challenges TABLE OF CONTENTS EXECUTIVE SUMMARY... 3 KEY FIGURES... 4 BASIS OF PRESENTATION... 5 MARKET ENVIRONMENT... 6 FINANCIAL
Interim Report Q4 FY 17
 Interim Report Q4 FY 17 Quarter 4 / Fiscal Year 2017 Sustained positive development Sivantos delivered 3.1% organic growth 1) in Q4 FY2017. The moderate growth rate compared to previous quarters was a
KONE Q APRIL 25, 2018 HENRIK EHRNROOTH, PRESIDENT & CEO ILKKA HARA, CFO
 KONE 2018 APRIL 25, 2018 HENRIK EHRNROOTH, PRESIDENT & CEO ILKKA HARA, CFO 2018 Highlights Solid growth in orders received with stabilizing margins Profitability continued to be burdened Good progress
REPSOL BEATS EXPECTATIONS AND REACHES A NET INCOME OF BILLION EUROS IN 2016
 JANUARY-DECEMBER 2016 RESULTS Press release Madrid, February 23, 2017 6 pages REPSOL BEATS EXPECTATIONS AND REACHES A NET INCOME OF 1.736 BILLION EUROS IN 2016 The company reported its highest net income
APPENDICE 1 - Consolidated income statement
 APPENDICE 1 - Consolidated income statement (in millions of euros) 2008 Net sales 2 514 3 554 Metal price effect* (430) (1 135) Sales at constant metal prices* 2 085 2 419 Cost of sales (2 134) (3 065)
Plan for capital restructuring of Grupa LOTOS s upstream segment
 Plan for capital restructuring of Grupa LOTOS s upstream segment Prepared by LOTOS Petrobaltic S.A. Development Department / Grupa LOTOS S.A. 1. Rationale and objectives Grupa LOTOS S.A. is a vertically
INA Group financial results (IFRS)
") INA Group (ZB: INA-R-A; www.ina.hr) announced its Q2 / H1 2018 results today. This report contains unaudited consolidated financial statements for the period ending 30 June 2018 as prepared by the management
INA Group (ZB: INA-R-A; www.ina.hr) announced its Q2 / H1 2018 results today. This report contains unaudited consolidated financial statements for the period ending 30 June 2018 as prepared by the management
Consolidated and Separate Financial Statements of the Nordea Bank Polska S.A. Group The third quarter of 2006
 Consolidated and Separate Financial Statements of the Nordea Bank Polska S.A. Group The third quarter of 2006 SELECTED FINANCIAL FIGURES keur 3 quarter(s) 3 quarter(s) 3 quarter(s) 3 quarter(s) incrementally
TOTP150-couv_FR_GB 30/07/08 11:45 Page 1 Financial report 1st half 2008
 TOTP150-couv_FR_GB 30/07/08 11:45 Page 1 Financial report 1st half 2008 Content 1 Financial report - 1st half 2008 p.3 Key figures and consolidated accounts p. 3 Group results p. 4 Analysis of business
RESULTS NINE MONTHS AND THIRD QUARTER OF 2012
 RESULTS NINE MONTHS AND THIRD QUARTER OF 2012 Solid foundations to deliver sustainable value TABLE OF CONTENTS Executive summary... 3 Key figures... 4 Basis of presentation... 5 Market environment... 6
Quarterly Report 2018
 Q4 Quarterly Report 2018 OMV Aktiengesellschaft The energy for a better life. Table of Contents Directors Report (condensed, unaudited) 4 Group performance 4 Outlook 9 Business Segments 10 Upstream 10
RESULTS OF THE FOURTH QUARTER AND THE FULL YEAR th February 2015
 RESULTS OF THE FOURTH QUARTER AND THE FULL YEAR 2014 24 th February 2015 DISCLAIMER "This presentation and the associated slides and discussion contain forward-looking statements. These statements are
OMV Q Results Conference Call
 OMV Q 207 Results Conference Call Rainer Seele Chairman of the Executive Board and CEO May, 207 OMV Aktiengesellschaft Disclaimer This report contains forward-looking statements. Forward-looking statements
PEGAS NONWOVENS SA. First quarter 2009 unaudited consolidated financial results
 PEGAS NONWOVENS SA First quarter 2009 unaudited consolidated financial results 28 th May 2009 PEGAS NONWOVENS SA announces its unaudited consolidated financial st results for the first quarter of 2009
First Quarter 2007 Results. Lisbon, 17 May 2007
 Lisbon, 17 May 2007 Disclaimer Matters discussed in this presentation may constitute forward-looking statements. Forwardlooking statements are statements other than in respect of historical facts. The
The spoken word applies. Check against delivery.
 Mariana Gheorghe Chief Executive Officer and President of the Executive Board Andreas Matje Chief Financial Officer The spoken word applies. Check against delivery. 1 Mariana Gheorghe - OMV Petrom S.A.
Q Financial Summary for Investors and Analysts
 Page 1 o Q1 2017 Financial Summary for Investors and Analysts Solid start in a challenging year Healthcare sound base business, first Bavencio approvals & further pipeline progress Life Science solid growth
Report on the first three quarters of 2017
 Key figures Semperit Group Semperit Gruppe I Report on the first three quarters of 2017 1 Report on the first three quarters of 2017 Revenue in Q1 3 2017 increased by 3.5% year-on-year to EUR 670.0 million
9M I Hapag-Lloyd AG. Investor. report. 1 January to 30 September 2017
 Hapag-Lloyd AG Investor 1 9M I 2017 report 1 January to 30 September 2017 SUMMARY OF HAPAG-LLOYD KEY FIGURES Key operating figures 1 Q3 2017 Q3 2016 9M 2017 9M 2016 % change Total vessels, of which 215
ORLEN GROUP CONSOLIDATED QUARTERLY REPORT
 CONSOLIDATED QUARTERLY REPORT FOR THE 4 th QUARTER 2016 4 ORLEN GROUP - SELECTED DATA PLN million EUR million Sales revenues 79 553 88 336 18 181 20 188 Profit from operations increased by depreciation
REPSOL POSTS NET INCOME OF BILLION EUROS
 Tel.: +34 91 753 87 87 FIRST-HALF EARNINGS PRESS RELEASE Madrid, 26 July 2012 9 pages REPSOL POSTS NET INCOME OF 1.036 BILLION EUROS Net income, excluding YPF, fell 14.6% to 903 million euros due to the
Interim Financial Report as at 30 September 2017
 Interim Financial Report as at 30 September 2017 Interim Report as at 30 September 2017 TRANSLATION FROM THE ORIGINAL ITALIAN TEXT INDEX PREFACE... 4 INTERIM MANAGEMENT REPORT AS AT 30 SEPTEMBER 2017...
CORRAL PETROLEUM HOLDINGS AB (publ)
") CORRAL PETROLEUM HOLDINGS AB (publ) REPORT FOR THE SECOND QUARTER ENDED JUNE 30, 2018 FOR IMMEDIATE RELEASE Date: August 29, 2018 Stockholm No. of pages 14 This report includes unaudited consolidated financial
CORRAL PETROLEUM HOLDINGS AB (publ) REPORT FOR THE SECOND QUARTER ENDED JUNE 30, 2018 FOR IMMEDIATE RELEASE Date: August 29, 2018 Stockholm No. of pages 14 This report includes unaudited consolidated financial
Gazprom Neft. 3 rd Q & 9 M 2008 Operating and Financial Results. December 2008
 Gazprom Neft 3 rd Q & 9 M 2008 Operating and Financial Results December 2008 Q3 & 9M 2008 Operating Highlights Gazprom Neft crude production was 57.3 & 172.7 MMBbl in Q3 & 9M 2008 respectively vs. 60.5
As of December 31, 2011, figures for Q1/11 to Q3/11 were adjusted following the final purchase price allocation for OMV Petrol Ofisi A.S.
 OMV Aktiengesellschaft Investor News Report January June and Q2 202 incl. interim financial statements as of June 30, 202 August 8, 202 6:30 am (BST), 7:30 am (CEST) Clean CCS EBIT at EUR 865 mn, up 82%