ANNUAL REPORT OF ORLEN GROUP FOR THE YEAR 2015
|
|
|
- Gillian Cole
- 6 years ago
- Views:
Transcription

1
2 ANNUAL REPORT OF ORLEN GROUP FOR THE YEAR LETTER OF THE PRESIDENT OF THE BOARD 2. OPINION AND REPORT OF THE INDEPENDENT AUDITOR 3. SELECTED FINANCIAL DATA 4. FINANCIAL STATEMENTS OF ORLEN GROUP 5. MANAGEMENT BOARD REPORT ON THE OPERATIONS OF ORLEN GROUP


3

4

5
6

7


8


9


10
11


12
13


14

15
16

17


18

19

20

21

22


23


24
25


26


27
28 SELECTED FINANCIAL DATA OF THE ORLEN GROUP PLN million EUR million Sales revenues Profit/(Loss) from operations increased by depreciation and amortisation (EBITDA) (2 720) (650) EBITDA before impairment allowances * Profit/(Loss) from operations (EBIT) (4 711) (1 126) Profit/(Loss) before tax (6 246) 884 (1 493) Net profit/(loss) attributable to equity owners of the parent (5 811) 678 (1 389) Net profit/(loss) (5 828) 773 (1 393) Total net comprehensive income attributable to equity owners of the parent (6 584) 981 (1 573) Total net comprehensive income (6 499) (1 553) Net cash provided by operating activities Net cash (used) in investing activities (4 096) (4 020) (978) (961) Net cash provided by/(used in) financing activities (2 866) (685) 498 Net increase/(decrease) in cash and cash equivalents (1 608) (384) 299 Net profit/(loss) and diluted net profit/(loss) per share attributable to equity owners of the parent (in PLN/EUR per share) 6.63 (13.59) 1.59 (3.25) 31/12/ /12/ /12/ /12/2014 Non-current assets Current assets Total assets Share capital Equity attributable to equity owners of the parent Total equity Non-current liabilities Current liabilities Number of shares Carrying amount and diluted carrying amount per share attributable to equity owners of the parent (in PLN/EUR per share) The above data for 2015 and 2014 was translated into EUR using the following exchange rates: items in the statement of profit or loss and other comprehensive income and the statement of cash flows - by the arithmetic average of average exchange rates published by the National Bank of Poland as of the last day of the month during the reporting period: from 1 January to 31 December EUR/PLN; items of assets, equity and liabilities by the average exchange rate published by the National Bank of Poland as at 31 December EUR/PLN. * Impairment allowances of net non-current assets are: 2015: PLN (993) million mainly: PLN (852) million ORLEN Upstream Group and PLN (111) million Unipetrol Group; 2014: PLN (5,360) million mainly: PLN (4,181) million ORLEN Lietuva Group, PLN (752) million Unipetrol Group, PLN (322) million ORLEN Upstream Group, PLN (64) million Anwil Group (Spolana) and PLN (42) million Rafineria Nafty Jedlicze Group.

29
30 TABLE OF CONTENTS 1. INTRODUCTION PRINCIPAL ACTIVITY OF THE ORLEN GROUP PRINCIPLES OF PREPARATION OF FINANCIAL STATEMENTS 4 2. CONSOLIDATED STATEMENT OF PROFIT OR LOSS AND OTHER COMPREHENSIVE INCOME 5 3. CONSOLIDATED STATEMENT OF FINANCIAL POSITION 6 4. CONSOLIDATED STATEMENT OF CHANGES IN EQUITY 7 5. CONSOLIDATED STATEMENT OF CASH FLOWS 8 6. SEGMENTS DATA REVENUES, COSTS, FINANCIAL RESULTS, INVESTMENT EXPENDITURES ASSETS BY OPERATING SEGMENTS NON-CURRENT ASSETS BY GEOGRAPHICAL ALLOCATION DESCRIPTION OF SIGNIFICANT FACTORS INFLUENCING THE FINANCIAL DATA FOR THE YEAR EXPLANATORY NOTES TO THE CONSOLIDATED FINANCIAL STATEMENTS EXPLANATORY NOTES TO THE STATEMENT OF PROFIT OR LOSS AND OTHER COMPREHENSIVE INCOME EXPLANATORY NOTES TO THE STATEMENT OF FINANCIAL POSITION EXPLANATORY NOTES TO THE STATEMENT OF CASH FLOWS EXPLANATORY NOTES TO THE FINANCIAL INSTRUMENTS AND FINANCIAL RISKS OTHER EXPLANATORY NOTES ACCOUNTING PRINCIPLES SIGNIFICANT VALUES BASED ON PROFESSIONAL JUDGEMENT AND ESTIMATES INFORMATION CONCERNING SIGNIFICANT PROCEEDINGS IN FRONT OF COURT, BODY APPROPRIATE FOR ARBITRATION PROCEEDINGS OR IN FRONT OF PUBLIC ADMINISTRATION BODIES ORLEN GROUP STRUCTURE AND JOINT ARRANGEMENTS ORGANIZATION OF THE GROUP SUBSIDARIES INVESTMENTS IN JOINT ARRANGEMENTS EVENTS AFTER THE END OF REPORTING PERIOD STATEMENTS OF THE MANAGEMENT BOARD AND APPROVAL OF THE FINANCIAL STATEMENTS 52 CONSOLIDATED FINANCIAL STATEMENTS FOR THE YEAR
31 (PLN million) 1. INTRODUCTION 1.1. Principal activity of the ORLEN Group 1.2. Principles of preparation of financial statements 1.1. PRINCIPAL ACTIVITY OF THE ORLEN GROUP Polski Koncern Naftowy ORLEN Spółka Akcyjna seated in Płock, 7 Chemików Street ( Company, PKN ORLEN, Issuer, Parent Company ) was founded by incorporation of Petrochemia Płock S.A. with Centrala Produktów Naftowych S.A., on 7 September PKN ORLEN along with the entities forming the Capital Group of Polski Koncern Naftowy ORLEN S.A. ( ORLEN Group, ORLEN Capital Group, Group, Capital Group ) is one of the biggest and most modern fuel and power companies in Central Europe, operating on the Polish, Lithuanian, Czech and German market. The Group also possesses entities located in Malta, Sweden, the Netherlands, Slovakia, Hungary, Estonia, Latvia, USA and Canada. The core business of the ORLEN Group is crude oil processing, production of fuel, petrochemical and chemical goods, as well as, retail and wholesale of fuel products. The ORLEN Group conducts also exploration, recognition and extraction of hydrocarbons, and generates, distributes and trades of electricity and heat. The activity of the ORLEN Group companies is also service-related activity: storage of crude oil and fuels, road and rail transport, maintenance and overhaul services, laboratory, security, design, administrative, insurance and financial services. PKN ORLEN shares are quoted on the main market of the Warsaw Stock Exchange (WSE) in the continuous trading system. The first quotation of the shares were held on 26 November One of the subsidiaries of PKN ORLEN Unipetrol a.s. is also present on the capital market. The shares are listed on the Stock Exchange in Prague. Additional information is presented in note PRINCIPLES OF PREPARATION OF FINANCIAL STATEMENTS The consolidated financial statements have been prepared in accordance with accounting principles contained in the International Financial Reporting Standards (IFRS), comprising International Accounting Standards (IAS) as well as Interpretations of Standing Interpretation Committee (SIC) and the International Financial Reporting Standards Interpretations Committee (IFRIC), which were adopted by the European Union (EU) and entered in force till the end The consolidated financial statements have been prepared on a historical cost basis, except derivative financial instruments, financial assets available for sale and investment properties, which have been measured at fair value. The foregoing financial statements have been prepared using the accrual basis of accounting except from the consolidated financial statement of cash flows. The scope of consolidated financial statements is compliant with Minister of Finance Regulation of 19 February 2009 on current and periodic information provided by issuers of securities and conditions for recognition as equivalent information required by the law of a non-member state (uniform text Official Journal 2014, item 133) and covers the annual period from 1 January to 31 December 2015 and the comparative period from 1 January to 31 December Presented consolidated financial statements present a true and fair view of the ORLEN Group s financial position as at 31 December 2015, results of its operations and cash flows for the year ended 31 December The consolidated financial statements have been prepared assuming that the ORLEN Group will continue to operate as a going concern in the foreseeable future. As at the date of approval of these consolidated financial statements, there is no evidence indicating that the ORLEN Group will not be able to continue its operations as a going concern. Duration of the Parent Company and the entities comprising the ORLEN Group is unlimited. The foregoing consolidated financial statements have been prepared with earlier taking into consideration changes in IAS1 standard - Presentation of Financial Statements: Disclosure initiative. Key elements of the modification of the scope and format of disclosures related to: issues of significance - immaterial disclosures have not been presented even if they were part of the requirement of the standard; aggregation / disaggregation of selected items in order to increase transparency and usefulness; accounting principles presented those principles, which have a significant impact on the presentation of results of operations and the situation of the Group. Other changes to IFRS applied by the Group in accordance with their effective date as of 1 January 2015 to 31 December 2015, had no material impact on these consolidated financial statements. CONSOLIDATED FINANCIAL STATEMENTS FOR THE YEAR INTRODUCTION 4
32 (PLN million) 2. CONSOLIDATED STATEMENT OF PROFIT OR LOSS AND OTHER COMPREHENSIVE INCOME NOTE Sales revenues 6.1, 8.1.1, revenues from sales of finished goods and services revenues from sales of merchandise and raw materials Cost of sales (77 792) ( ) cost of finished goods and services sold (59 489) (76 211) cost of merchandise and raw materials sold (18 303) (24 799) Gross profit on sales Distribution expenses (3 971) (3 920) Administrative expenses (1 552) (1 512) Other operating income Other operating expenses, incl.: (1 354) (5 924) recognition of impairment allowances of property, plant and equipment and intangible assets (1 029) (5 492) Share in profit from investments accounted for under equity method Profit/(Loss) from operations (4 711) Finance income Finance costs (1 032) (1 889) Net finance income and costs (642) (1 535) Profit/(Loss) before tax (6 246) Tax expense (465) 418 current tax (310) (196) deferred tax (155) 614 Net profit/(loss) (5 828) Other comprehensive income: which will not be reclassified into profit or loss 3 (16) which were or will be reclassified into profit or loss (655) hedging instruments (1 758) foreign exchange differences on subsidiaries from consolidation deferred tax , (291) (671) Total net comprehensive income (6 499) Net profit/(loss) attributable to (5 828) equity owners of the parent (5 811) non-controlling interest 396 (17) Total net comprehensive income attributable to (6 499) equity owners of the parent (6 584) non-controlling interest Net profit/(loss) and diluted net profit/(loss) per share attributable to equity owners of the parent (in PLN per share) 6.63 (13.59) CONSOLIDATED FINANCIAL STATEMENTS FOR THE YEAR CONSOLIDATED STATEMENT OF PROFIT OR LOSS AND OTHER COMPREHENSIVE INCOME 5
33 (PLN million) 3. CONSOLIDATED STATEMENT OF FINANCIAL POSITION ASSETS NOTE 31/12/ /12/2014 Non-current assets Property, plant and equipment Intangible assets Investments accounted for under equity method Deferred tax assets Other financial assets Other assets Current assets Inventories Trade and other receivables Other financial assets Cash and cash equivalents Non-current assets classified as held for sale Total assets EQUITY AND LIABILITIES EQUITY Share capital Share premium Hedging reserve (80) (1 319) Foreign exchange differences on subsidiaries from consolidation Retained earnings Total equity attributable to equity owners of the parent Non-controlling interest Total equity LIABILITIES Non-current liabilities Loans, borrowings and bonds Provisions Deferred tax liabilities Other financial liabilities Current liabilities Trade and other liabilities Loans and borrowings Provisions Other financial liabilities Other liabilities Total liabilities Total equity and liabilities CONSOLIDATED FINANCIAL STATEMENTS FOR THE YEAR CONSOLIDATED STATEMENT OF FINANCIAL POSITION 6
34 (PLN million) 4. CONSOLIDATED STATEMENT OF CHANGES IN EQUITY Equity attributable to equity owners of the parent Share capital and share premium Hedging reserve Foreign exchange differences on subsidiaries from consolidation Retained earnings Total Non-controlling interest Total equity NOTE , /01/ (1 319) Net profit Items of other comprehensive income Total net comprehensive income Change in the structure of non-controlling interest Dividends (706) (706) - (706) 31/12/ (80) /01/ (201) Net (loss) (5 811) (5 811) (17) (5 828) Items of other comprehensive income - (1 467) 710 (16) (773) 102 (671) Total net comprehensive income - (1 467) 710 (5 827) (6 584) 85 (6 499) Change in the structure of non-controlling interest (72) (49) Dividends (616) (616) (1) (617) 31/12/ (1 319) CONSOLIDATED FINANCIAL STATEMENTS FOR THE YEAR CONSOLIDATED STATEMENT OF CHANGES IN EQUITY 7
35 (PLN million) 5. CONSOLIDATED STATEMENT OF CASH FLOWS Cash flows from operating activities NOTE Net profit/(loss) (5 828) Adjustments for: Share in profit from investments accounted for under equity method 9.3 (253) (57) Depreciation and amortisation Foreign exchange loss Interest, net Dividends (2) (2) Loss on investing activities, incl.: recognition/(reversal) of impairment allowances of property, plant and 8.1.4, 8.1.5, equipment and intangible assets Tax expense on profit/(loss) before tax 465 (418) Change in provisions Change in working capital 8.3 (1 320) inventories (655) receivables liabilities (1 923) (3 278) Other adjustments (252) (360) Income tax (paid) 8.3 (204) (168) Net cash provided by operating activities Cash flows from investing activities Acquisition of property, plant and equipment, intangible assets and perpetual usufruct of land (3 079) (3 700) Acquisition of shares adjusted for received cash (1 195) (792) Disposal of property, plant and equipment, intangible assets and perpetual usufruct of land Dividends received Other (145) 70 Net cash (used) in investing activities (4 096) (4 020) Cash flows from financing activities Proceeds from loans and borrowings received Bonds issued Repayments of loans and borrowings (3 771) (9 023) Interest paid 8.3 (258) (245) Dividends paid (706) (617) Other (27) (21) Net cash provided by / (used in) financing activities (2 866) Net increase/(decrease) in cash and cash equivalents (1 608) Effect of exchange rate changes 19 (2) Cash and cash equivalents, beginning of the period Cash and cash equivalents, end of the period including restricted cash CONSOLIDATED FINANCIAL STATEMENTS FOR THE YEAR CONSOLIDATED STATEMENT OF CASH FLOWS 8
36 (PLN million) 6. SEGMENTS DATA 6.1. Revenues, costs, financial results, investment expenditures 6.2. Assets by operating segments 6.3. Non-current assets by geographical allocation The operations of the Group is conducted in: - the Downstream segment, which includes integrated areas of refining and petrochemical production and sales and operations in the energy production activity, - the Retail segment, which includes sales at the petrol stations, - the Upstream segment, which include the activity related to exploration and extraction of mineral resources, and Corporate Functions, which include activities related to management and administration and other support functions and remaining activities not allocated to separate operating segments i.e. reconciling items. Assessments of the segments financial results and decisions on allocation of resources are performed mainly on the basis of segment profit/(loss) from operations, increased by depreciation and amortization EBITDA. EBITDA is one of a measure of the efficiency of the activity, which is not defined in IFRS. The ORLEN Group defines EBITDA as net profit/(loss) for the reporting period before taking into account the impact of the income tax, effects of financing activities and depreciation costs. Revenues from transactions with external customers and transactions with other segments are carried out on an arm s length basis REVENUES, COSTS, FINANCIAL RESULTS, INVESTMENT EXPENDITURES 2015 NOTE Downstream Segment Retail Segment Upstream Segment Corporate Functions Adjustments Total Sales revenues from external customers 8.1.1, Sales revenues from transactions with other segments (12 900) - Sales revenues (12 900) Operating expenses (64 963) (29 934) (347) (971) (83 315) Other operating income Other operating expenses (316) (67) (852) (119) - (1 354) Net operating income and expenses, incl.: (40) (17) (849) (28) - (934) recognition/reversal of impairment allowances of property, plant and equipment and intangible (136) - (852) (5) - (993) assets Share in profit from investments accounted for under equity method Profit/(Loss) from operations (981) (711) Net finance income and costs 8.1.6, (642) Profit before tax Tax expense (465) Net profit ADDITIONAL INFORMATION NOTE Downstream Segment Retail Segment Upstream Segment Corporate Functions Adjustments Total Depreciation and amortisation EBITDA (808) (626) CAPEX* NOTE Downstream Segment Retail Segment Upstream Segment Corporate Functions Adjustments Total Sales revenues from external customers 8.1.1, Sales revenues from transactions with other segments (15 822) - Sales revenues (15 822) Operating expenses (85 971) (35 015) (271) (1 007) ( ) Other operating income Other operating expenses (5 329) (186) (323) (86) - (5 924) Net operating income and expenses, incl.: (4 861) (4) (319) 26 - (5 158) recognition/reversal of impairment allowances of property, plant and equipment and intangible (5 062) 24 (322) - - (5 360) assets Share in profit from investments accounted for under equity method (1) - 57 Profit/(Loss) from operations (4 833) (292) (671) - (4 711) Net finance income and costs 8.1.6, (1 535) (Loss) before tax (6 246) Tax expense 418 Net (loss) (5 828) CONSOLIDATED FINANCIAL STATEMENTS FOR THE YEAR SEGMENTS DATA 9
37 (PLN million) ADDITIONAL INFORMATION NOTE Downstream Segment Retail Segment Upstream Segment Corporate Functions Adjustments Total Depreciation and amortisation EBITDA (3 425) (170) (565) - (2 720) CAPEX* * CAPEX - increases of non-current assets with borrowing costs 6.2. ASSETS BY OPERATING SEGMENTS 31/12/ /12/2014 Downstream Segment, incl.: investments accounted for under equity method non - current assets classified as held for sale Retail Segment Upstream Segment, incl.: investments accounted for under equity method 45 - Segment assets Corporate Functions Adjustments (203) (207) As at 31 December 2015, non-current assets classified as held for sale in downstream segment mainly relate to classified for sale net assets of Orlen Koltrans and Orlen Transport amounted to PLN 34 million and PLN 40 million, respectively. Operating segments include all assets except for financial assets, tax assets and cash and cash equivalents. Assets used jointly by different operating segments are allocated based on revenues generated by particular operating segments NON-CURRENT ASSETS BY GEOGRAPHICAL ALLOCATION 31/12/ /12/2014 % share Poland % 73.0% Czech Republic % 13.7% Canada % 7.2% Germany % 3.8% Lithuania, Latvia, Estonia % 2.3% % 100.0% Non-current assets by geographical allocation include property, plant and equipment (note 8.2.1), intangible assets (note 8.2.2), investment property and perpetual usufruct of land (note 8.2.5). CONSOLIDATED FINANCIAL STATEMENTS FOR THE YEAR SEGMENTS DATA 10
38 (PLN million) 7. DESCRIPTION OF SIGNIFICANT FACTORS INFLUENCING THE FINANCIAL DATA FOR THE YEAR 2015 OPERATING AND FINANCIAL RESULTS In 2015 the Group achieved record-high sales volumes of 38.7 million tonnes, which were higher by 8.1% in comparison with previous year. Sales volumes were higher in all operating segments of the Group. In value terms, sales revenues were lower by PLN (18,496) million due to the decrease in crude oil prices and therefore lower trading of the majority of products manufactured by the Group. Crude oil processing in 2015 reached a record-high level of 30.9 million tonnes and was higher by 13.3% in comparison with the previous year. Higher crude oil processing was mainly the result of a positive macroeconomic environment and an increase of capacities by 2.8 million t/year after acquisition of shares of Česká Rafinérská by Unipetrol from ENI in As a result, EBITDA profit before recognition of impairment allowances of property, plant and equipment and intangible assets for 2015, amounted to PLN 7,228 million and was higher by PLN 4,588 million in comparison with the previous year. This increase resulted mainly from positive changes of macroeconomic factors reflected in particular by an increase of model margin downstream (MMD*) by USD/bbl 2.4 and from the depreciation of average PLN exchange rate versus the USD and an increase in sales volumes. Net impairment allowances of property, plant and equipment and intangible assets for 2015 amounted to PLN (993) million and concerned mainly exploration assets of the ORLEN Upstream Group in Poland of PLN (429) million as a result of narrowing the search area, petrochemical assets of Unipetrol Group related to the accident at the ethylene production installation in August 2015 in the amount of PLN (93) million and impairment allowances of extraction assets in Canada of PLN (423) million. Additional information is presented in note After consideration of the above mentioned impairment allowances, EBITDA profit of the ORLEN Group in 2015 amounted to PLN 6,235 million. The negative balance on financing activities in 2015 amounted to PLN (642) million and consisted mainly of negative foreign exchange differences from revaluation of loans and other items in foreign currencies of PLN (317) million, settlement and valuation of net financial instruments of PLN (177) million and net interest of PLN (123) million. After consideration of tax charges of PLN (465) million, the net profit of the Group for 2015 amounted to PLN 3,233 million. CASH FLOWS AND INDEBTEDNESS The net cash flows provided by operating activities in 2015 amounted to PLN 5,354 million and comprised mainly of the EBITDA profit before impairment allowances of property, plant and equipment and intangible assets in the amount PLN 7,228 million as well as the negative impact of a net working capital increase of PLN (1,320) million, negative net exchange differences in the amount PLN (293) million and paid income taxes in the amount PLN (204) million. The increase in net working capital resulted mainly from an increase in the value of inventories, including the repurchase of 2 tranches of mandatory reserves for the total amount of PLN (3,644) million in part offset by a decrease in crude oil prices and therefore, the prices of petroleum products. Additional information is presented in note Net cash used in investing activities in 2015 amounted to PLN (4,096) million and included mainly net expenses for the acquisition of property, plant and equipment, intangible assets and the perpetual usufruct of land of PLN (2,948) million, acquisition of shares of Česká Rafinérská a.s. from ENI decreased by acquired cash and cash equivalents of PLN (35) million and acquisition of shares of upstream companies, Kicking Horse Energy Inc. and FX Energy Inc., in the total amount of PLN (1,161) million. Additional information regarding the acquisition of exploration assets in Canada and Poland is presented in note After consideration of interest paid in the amount PLN (258) million, dividends paid in the amount PLN (706) million (additional information is presented in note ), the effect of exchange rate changes in the amount PLN 19 million and other factors included in other financing activity in the total amount PLN (29) million, net indebtedness of the Group, at the end of 2015, was higher by PLN (90) million and resulted mainly from including the net indebtedness of purchased upstream companies in the total amount of PLN (374) million and amounted to PLN 6,810 million. Net financial leverage in 2015 amounted to 28.1%. Additional information is presented in note Detailed information on operating and finance results of the Group is presented in chapter 2 and 3 of the Management Board Report on the operations of the ORLEN Capital Group. * The integration of high-class production assets and the extended value chain through the full integration of the refining, petrochemical and power activities of ORLEN Group were the basis for determining the index - Model Margin Downstream (MMD), which reflects the base structure of the input basket and refinery and petrochemical products. The indicator s changes permit to estimate the impact of typical macroeconomic factors on operating results of the downstream segment. CONSOLIDATED FINANCIAL STATEMENTS FOR THE YEAR DESCRIPTION OF SIGINIFICANT FACTORS INFLUENCING THE FINANCIAL DATA FOR THE YEAR
39 (PLN million) 8. EXPLANATORY NOTES TO THE CONSOLIDATED FINANCIAL STATEMENTS 8.1. Explanatory notes to the statement of profit or loss and other comprehensive income 8.2. Explanatory notes to the statement of financial position 8.3. Explanatory notes to the statement of cash flows 8.4. Explanatory notes to the financial instruments and financial risks 8.5. Other explanatory notes 8.6. Accounting principles 8.7. Significant values based on professional judgement and estimates 8.8. Information concerning significant proceedings in front of court, body appropriate for arbitration proceedings or in front of public administration bodies 8.1. EXPLANATORY NOTES TO THE STATEMENT OF PROFIT OR LOSS AND OTHER COMPREHENSIVE INCOME Sales revenues by assortments Downstream Segment % share Medium distillates % 27.1% Light distillates % 12.4% Heavy fractions % 7.2% Monomers % 3.2% Polymers % 2.8% PTA % 1.7% Plastics % 1.3% Fertilizers % 1,0% Aromas % 1.6% Other % 7.6% Retail Segment % 65.9% Medium distillates % 17.5% Light distillates % 13.1% Other % 3.1% % 33.7% Upstream Segment % 0.3% Corporate Functions % 0.1% % 100.0% In 2015 and 2014 no leading customers were identified in the Group, for which turnover would exceeded 10% of total revenues from sale of the ORLEN Group Sales revenues geographical division - disclosed by customer s premises countries % share Poland % 42.2% Germany % 18.1% Czech Republic % 11.9% Lithuania, Latvia, Estonia % 8.2% Other countries % 19.6% % 100.0% The line Other countries comprises mainly sales to customers from Switzerland, Ukraine, Hungary, Slovakia, Great Britain, the Netherlands and Austria. CONSOLIDATED FINANCIAL STATEMENTS FOR THE YEAR EXPLANATORY NOTES TO THE CONSOLIDATED FINANCIAL STATEMENTS 12
40 (PLN million) Cost by nature % share Materials and energy (54 542) (70 586) 70.1% 69.9% Cost of merchandise and raw materials sold (18 303) (24 799) 23.5% 24.6% External services (4 352) (4 316) 5.6% 4.3% Employee benefits (2 110) (2 059) 2.7% 2.0% payroll expenses (1 700) (1 667) 2.2% 1.7% social security expenses (354) (347) 0.4% 0.3% other (56) (45) 0.1% 0.0% Depreciation and amortisation (1 895) (1 991) 2.4% 2.0% Taxes and charges (1 152) (653) 1.5% 0.6% Other (1 835) (6 383) 2.4% 6.3% (84 189) ( ) 108.2% 109.7% Change in inventories (693) (1 783) 0.9% 1.8% Cost of products and services for own use (0.3%) (0.2%) Operating expenses (84 669) ( ) 108.8% 111.3% Distribution expenses (5.1%) (3.9%) Administrative expenses (2.0)% (1.5%) Other operating expenses (1.7)% (5.9%) Cost of sales (77 792) ( ) 100.0% 100.0% Other operating income NOTE Profit on sale of non-current non-financial assets Gain on bargain purchase of shares Reversal of provisions Reversal of receivables impairment allowances Reversal of impairment allowances of property, plant and equipment and intangible assets Penalties and compensation Other Other operating expenses NOTE Loss on sale of non-current non-financial assets (38) (55) Recognition of provisions (101) (173) Recognition of receivables impairment allowances (47) (69) Recognition of impairment allowances of property, plant and equipment and intangible assets (1 029) (5 492) Penalties, damages and compensation (53) (22) Other (86) (113) Finance income (1 354) (5 924) Interest Settlement and valuation of derivative financial instruments Other Finance costs Interest (205) (242) Foreign exchange loss surplus (317) (1 459) Settlement and valuation of derivative financial instruments (447) (138) Other (63) (50) (1 032) (1 889) CONSOLIDATED FINANCIAL STATEMENTS FOR THE YEAR EXPLANATORY NOTES TO THE CONSOLIDATED FINANCIAL STATEMENTS 13
41 (PLN million) Tax expense The differences between tax expense recognized in profit or loss and the amount calculated based on the rate from profit/(loss) before tax Profit/(Loss) before tax (6 246) Tax expense for 2015 and 2014 by the valid tax rate in Poland (19%) (703) Differences between tax rates 57 (182) Lithuania (15%) 34 (184) Germany (29%) (14) (13) Canada (26%), ( %) Impairment allowances of property, plant and equipment and intangible assets - (896) Tax losses Investments accounted for under equity method Other (2) 48 Tax expense (465) 418 Effective tax rate 13% 7% As at 31 December 2015 and as at 31 December 2014, the Group had unsettled tax losses mainly relating to the ORLEN Lietuva Group, the Unipetrol Group and the Anwil Group of PLN 1,155 million and PLN 2,095 million respectively, for which no deferred tax asset was recognized due to the lack of certainty regarding the possibility of their realization in the future Deferred tax 31/12/2014 Deferred tax recognized in profit or loss Deferred tax recognized in other comprehensive income Acquisition of subsidiary Foreign exchange differences on subsidiaries from consolidation recognized in other comprehensive income 31/12/2015 Deferred tax assets Impairment allowances Provisions and accruals (1) Tax loss 438 (256) Valuation of financial instruments (291) Other 120 (55) (292) Deferred tax liabilities Temporary differences related to noncurrent assets Other (155) (292) (166) (6) (309) The above positions of deferred tax assets and liabilities are netted on the level of particular financial statements of the Group companies. As at 31 December 2015 deferred tax assets and liabilities amounted to PLN 365 million and PLN 674 million, respectively. CONSOLIDATED FINANCIAL STATEMENTS FOR THE YEAR EXPLANATORY NOTES TO THE CONSOLIDATED FINANCIAL STATEMENTS 14
42 (PLN million) 8.2. EXPLANATORY NOTES TO THE STATEMENT OF FINANCIAL POSITION Property, plant and equipment Land Buildings and constructions Machinery and equipment Vehicles and other Construction in progress Exploration and evaluation of mineral resource assets Assets related to development and extraction of mineral resources Net carrying amount at 01/01/2015 Gross carrying amount Accumulated depreciation (10) (7 766) (17 331) (1 259) (1) - (255) (26 622) Impairment allowances (42) (2 087) (8 611) (157) (155) (93) (315) (11 460) Grants - (23) (71) (2) (25) - - (121) increases/(decreases), net Investment expenditures Depreciation (1) (588) (894) (162) - (2) (184) (1 831) Borrowing costs Acquisition of subsidiary Impairment allowances * 9 (28) (74) (333) (423) (797) Reclassifications (2 105) (229) 236 (38) Grants - (28) (45) (4) (53) Sale of subsidiary (86) - (86) Foreign exchange differences, incl.: (8) (102) 22 foreign exchange differences of impairment allowances - (449) (1 360) (29) (30) 3 33 (1 832) Other (1) (38) (40) (106) (13) (11) - (209) Net carrying amount at 31/12/2015 Gross carrying amount Accumulated depreciation (12) (8 500) (19 593) (1 186) - (3) (420) (29 714) Impairment allowances (33) (2 564) (10 045) (165) (154) (423) (705) (14 089) Grants - (51) (116) (6) (1) - - (174) Total Net carrying amount at 01/01/2014 Gross carrying amount Accumulated depreciation (8) (7 292) (16 091) (1 246) - - (6) (24 643) Impairment allowances (42) (1 350) (3 456) (65) (108) (85) - (5 106) Grants - (18) (28) (3) (23) - - (72) increases/(decreases), net Investment expenditures Depreciation (1) (570) (1 056) (154) - - (132) (1 913) Borrowing costs Acquisition of subsidiary Impairment allowances * - (632) (4 218) (81) (34) (5) (309) (5 279) Reclassifications (1 989) (20) Grants - (5) (43) 1 (2) - - (49) Foreign exchange differences, incl.: foreign exchange differences of impairment allowances - (105) (937) (11) (13) (3) (6) (1 075) Other (4) (29) (62) (52) (20) (9) - (176) Net carrying amount at 31/12/ * Increases/(Decreases) net of impairment allowances include recognition, reversal, usage, reclassifications and acquisition of subsidiary. In 2015 and 2014 the capitalization rate used to calculate borrowing costs amounted to 1.44% and 1.95%, respectively. The gross carrying amount of all fully depreciated property, plant and equipment still in use as at 31 December 2015 and as at 31 December 2014 amounted to PLN 3,699 million and PLN 3,586 million, respectively. Amounts recognized in the financial statements, resulting from exploration and evaluation of mineral resources Preliminary analysis and other costs associated with mineral resources exploration recognized in the financial result (31) (38) Cash flows from operating activities Cash flows from investing activities (35) (195) Information regarding property, plant and equipment that were pledged for loans of the Group are presented in note CONSOLIDATED FINANCIAL STATEMENTS FOR THE YEAR EXPLANATORY NOTES TO THE CONSOLIDATED FINANCIAL STATEMENTS 15
43 (PLN million) Intangible assets As at 31 December 2015 and as at 31 December 2014 internally generated intangible assets amounted to PLN 12 million. The changes in other intangible assets Patents, trade marks and licenses Goodwill Rights Other Total Net carrying amount at 01/01/2015 Gross carrying amount Accumulated depreciation (830) (18) (1) (12) (861) Impairment allowances (84) (318) (66) (5) (473) Grants (3) (3) increases/(decreases), net Investment expenditures Amortisation (60) - - (7) (67) Acquisition of subsidiary Impairment allowances * (2) 3 7 (6) 2 Sale of subsidiary - (3) - - (3) Foreign exchange differences, incl.: - (3) (2) 1 (4) foreign exchange differences of impairment allowances (12) - - (4) (16) Other ** (54) Net carrying amount at 31/12/2015 Gross carrying amount Accumulated depreciation (975) (18) (1) (62) (1 056) Impairment allowances (98) (315) (59) (15) (487) Grants (3) (3) Net carrying amount at 01/01/2014 Gross carrying amount Accumulated depreciation (779) (16) - (11) (806) Impairment allowances (63) (321) (112) (3) (499) increases/(decreases), net Investment expenditures Amortisation (73) (73) Acquisition of subsidiary Impairment allowances * (18) - 46 (2) 26 Grants (3) (3) Foreign exchange differences, incl.: (1) 10 foreign exchange differences of impairment allowances (3) Other ** 10 (2) (129) (19) (140) Net carrying amount at 31/12/ * Increases/(Decreases) net of impairment allowances include recognition, reversal, usage, reclassifications and acquisition of subsidiary. ** Other increases/(decreases) of property rights in the net book value consist mainly of forward transactions settlement, granted free of charge and settlement of rights for 2015 and The gross carrying amount of all fully amortised intangible assets still in use as at 31 December 2015 and as at 31 December 2014 amounted to PLN 506 million and PLN 489 million, respectively Rights Change in owned CO 2 emission rights in 2015 Quantity Value (in thous. tonnes) 01/01/ Granted free of charge for 2014 and Emission settlement for 2014 (13 033) (337) Forward transactions settlement Foreign exchange differences - (2) Other CO₂ emission in As at 31 December 2015 the market value of one EUA amounted to PLN (representing EUR 8.22 at exchange rate as at 31 December 2015) (source: As at 31 December 2015 the Group recognized the rights to colourful energy in the amount PLN 10 million. Additionally, the Group recognized CO 2 emission rights in the amount PLN 18 million and rights to colourful energy in the amount PLN 32 million (note 8.2.7) in trade and other receivables. CONSOLIDATED FINANCIAL STATEMENTS FOR THE YEAR EXPLANATORY NOTES TO THE CONSOLIDATED FINANCIAL STATEMENTS 16
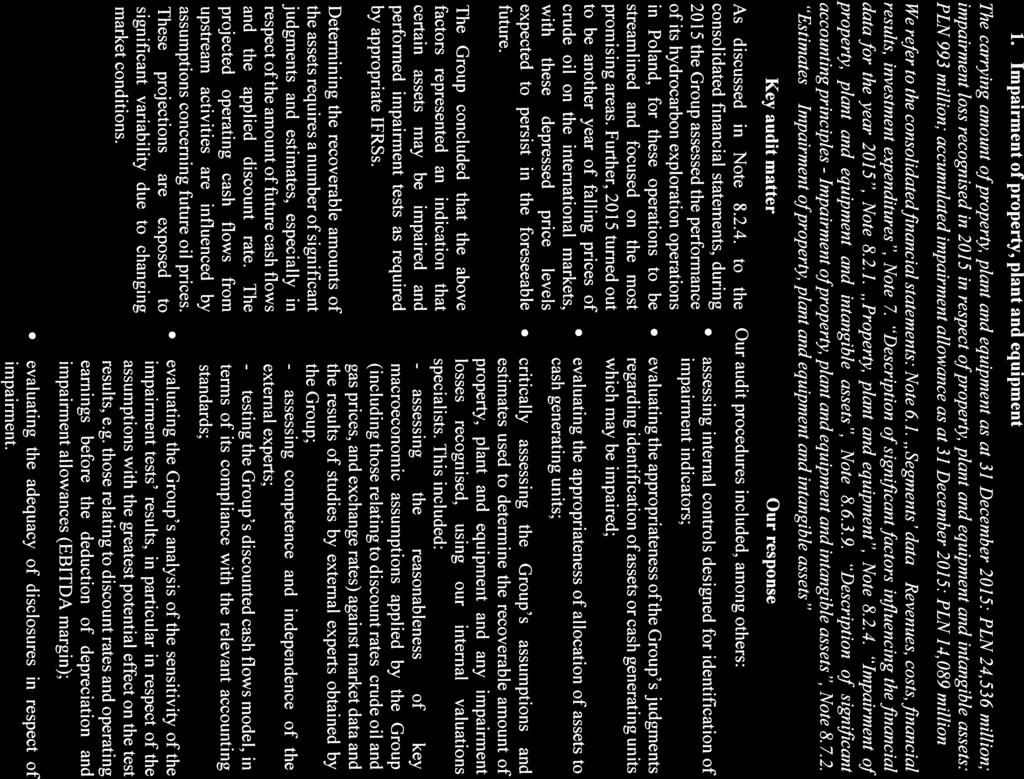
44 DISCOUNT RATE ORLEN GROUP (PLN million) Other financial assets Non-current Current Total 31/12/ /12/ /12/ /12/ /12/ /12/2014 Cash flows hedge instruments currency forwards commodity swaps Derivatives not designated as hedge accounting currency forwards commodity swaps Embedded derivatives currency swaps Receivables on cash flows settled hedge instruments Other The line Other includes deposits and loans granted Impairment of property, plant and equipment and intangible assets Net impairment allowances of property, plant and equipment and intangible assets NOTE ORLEN Upstream Canada (423) (311) ORLEN Upstream (429) (11) ORLEN Lietuva Group 1 (4 181) UNIPETROL Group (111) (752) Rafineria Nafty Jedlicze Group - (42) Anwil Group - Spolana (7) (64) (969) (5 361) Other impairment allowances (24) , (993) (5 360) While determining the value in use, the expected cash flows based on the most recent and approved financial plan, and thereafter the Group assumed constant rate of cash flow growth, estimated at the level of long-term inflation. Expected cash flows were discounted to their present value using a discount rate calculated as a weighted average cost of engaged equity and debt, before tax, which reflected the current market estimation of time value of money and the risk specific to the asset. ORLEN Upstream Canada An observed decline in crude oil prices on global markets affects the upstream segment results of ORLEN Group. As a result of impairment testing carried out at the end of 2015 in accordance with IAS 36 - impairment of assets, an impairment allowance of development and extraction of mineral resources assets of the ORLEN Upstream Canada within the ORLEN Upstream Group of PLN (423) million was recognized. As at 31 December 2015 the value in use of development and extraction of mineral resources assets in Canada was based on the estimated crude oil prices and reserves evaluation prepared by an independent company in accordance with professional standards for the Canadian market (APEGA - the Code of Ethics of the Association of Professional Engineers and Geoscientists of Alberta). Net cash flow projections used for the purposes of estimating the value in use of assets were discounted to their present value using a base discount rate before tax at 9% which reflects the current market value of money and the specific risks to the assets on the Canadian market. Future financial performance was based on a number of assumptions, a part of which concern macroeconomic factors, including: commodity prices, product quotations on global markets, foreign exchange rates or interest rates, remain beyond the control of the Group. Changes in these assumptions can affect impairment tests results of property, plant and equipment and intangible assets and as a result may lead to changes in the financial standing and financial results of the Group. Sensitivity analysis of the ORLEN Upstream Canada assets value in use within an impairment test performed as at 31 December 2015 PLN million HYDROCARBONS PRICES change -5% 0% 5% p.p. increase in allowance decrease in allowance decrease in allowance (14) p.p. increase in allowance - decrease in allowance (46) p.p. increase in allowance increase in allowance decrease in allowance (76) (32) 12 CONSOLIDATED FINANCIAL STATEMENTS FOR THE YEAR EXPLANATORY NOTES TO THE CONSOLIDATED FINANCIAL STATEMENTS 17
45 DISCOUNT RATE ORLEN GROUP (PLN million) ORLEN Upstream In the 2 nd quarter of 2015 the ORLEN Upstream Group has determined, based on the gathered data of previous work, the most promising areas for further exploration of hydrocarbon in Poland. Considering the technological and economic aspects of individual projects narrowed areas of exploration, which resulted in the partial impairment of assets related to exploration and recognition of mineral resources in the amount of PLN (429) million. The value in use of assets due to exploration and evaluation of mineral resources has been established basing on the analysis of future cash flows, which take into account the current and forecasted hydrocarbon prices, expected changes in the regulatory environment, probability of success/failure and long-term production forecasts. Net cash flow projections used for the purposes of estimating the value in use of the assets were discounted to their present value using a discount rate before tax at 8.99%, which reflects current market assessment of the time value of money and the risks specific to the respective assets on the Polish market. Sensitivity analysis of the ORLEN Upstream assets value in use within an impairment test performed as at 30 June 2015 PLN million HYDROCARBONS PRICES change -5% 0% 5% p.p. increase in allowance decrease in allowance decrease in allowance (25) p.p. increase in allowance - decrease in allowance (25) p.p. increase in allowance increase in allowance decrease in allowance (25) (11) 24 While lowering prices by 5% the entire value of the tested assets is impaired, with each of the analysed discount rates. Unipetrol Group As a consequence of the steam cracker unit accident in Litvinov (Unipetrol Group) in August 2015, impairment of property, plant and equipment of PLN (93) million translated using the exchange rate as at 30 September 2015 (representing approximately CZK (597) million) was recognized in the 3 rd quarter of As at 31 December 2015, ORLEN Group did not identify any other significant indicators of impairment of other property, plant and equipment and intangible assets. In 2014 identified indicators for impairment test within ORLEN Group resulting from deterioration of macroeconomic environment as well as the perspectives for its improvement especially in the area of the refinery. Strategy assumptions and the Mid-term Plan of the Group for the years were updated Other assets 31/12/ /12/2014 Investment property Perpetual usufruct of land Financial assets available for sale Inventories /12/ /12/2014 Raw materials Work in progress Finished goods Merchandise Spare parts Inventories, net Impairment allowances of inventories to net realisable value Inventories, gross As at 31 December 2015 and as at 31 December 2014 the value of mandatory reserves presented in consolidated financial statement amounted to PLN 4,534 million and PLN 4,024 million, respectively. CONSOLIDATED FINANCIAL STATEMENTS FOR THE YEAR EXPLANATORY NOTES TO THE CONSOLIDATED FINANCIAL STATEMENTS 18
46 (PLN million) Repurchase of mandatory reserves Transaction date Parties of the transaction Value of the transaction Seller Buyer million USD million PLN 29 January 2015 Neon PKN ORLEN including hedging transaction settlement August 2015 Cranbell PKN ORLEN including hedging transaction settlement Change in impairment allowances of inventories to net realizable value At the beginning of the period Recognition Reversal (67) (83) Usage (858) (69) Acquisition of subsidiary - 7 Foreign exchange differences The impairment allowances of inventories to net realizable value, which was mainly made in 4 th quarter of 2014, were used in The usage was the result of a decrease in crude oil and petroleum products prices. In 2015 and in 2014 the recognition and reversal of impairment allowances of inventories to net realizable value related mainly to the downstream segment and amounted to PLN (170) million and PLN (787) million, respectively Trade and other receivables 31/12/ /12/2014 NOTE Trade receivables Other Financial assets Excise tax and fuel charge receivables Other taxation, duties, social security and other benefits Tax expense Advances for non-current non-financial assets Rights Prepayments for deliveries Prepayments Non-financial assets Receivables, net Receivables impairment allowance Receivables, gross As at 31 December 2015 and as at 31 December 2014 trade and other receivables denominated in foreign currencies amounted to PLN 3,255 million and PLN 3,669 million. Division of financial assets denominated in foreign currencies is presented in note Division of receivables from related parties is presented in note Equity Share capital 31/12/ /12/2014 Share capital Share capital revaluation adjustment In accordance with the Polish Commercial Register, the share capital of Polski Koncern Naftowy ORLEN S.A. as at 31 December 2015 and as at 31 December 2014 amounted to PLN 535 million and is divided into 427,709,061 ordinary shares with nominal value of PLN 1.25 each. Number of shares issued A Series B Series C Series D Series Total In Poland, each new issue of shares is labelled as a new series of shares. All of the above series have the exact same rights. As at 31 December 2015 and 31 December 2014, the number of shares issued and the number of shares approved for issuance is equal. CONSOLIDATED FINANCIAL STATEMENTS FOR THE YEAR EXPLANATORY NOTES TO THE CONSOLIDATED FINANCIAL STATEMENTS 19
47 (PLN million) Shareholders structure Number of shares / voting rights Nominal value of shares (in PLN) Share in share capital State Treasury % Nationale-Nederlanden OFE* % Aviva OFE* % Other % % * Shareholders holding directly or indirectly via related parties, at least 5% of total votes at the Extraordinary Shareholders Meeting of PKN ORLEN S.A. held on 29 January Share premium 31/12/ /12/2014 Nominal share premium Share premium revaluation adjustment Share premium is the surplus of the issuance value over the nominal value of shares belonging to series B, C and D Hedging reserve NOTE At the beginning of the period (1 319) 148 gross value (1 629) 182 deferred tax 310 (34) Settlement of hedge instruments, incl.: sales revenues (226) (171) cost of sales (120) 32 inventories Valuation of hedge instruments, gross (93) (1 782) Non-controlling interest, gross - (53) Deferred tax, incl.: (291) 344 non-controlling interest - 10 (80) (1 319) gross value (99) (1 629) deferred tax Retained earnings 31/12/ /12/2014 Reserve capital Other capital Actuarial gains and losses (10) (13) Net profit/(loss) for the period attributable to equity owners of the parent (5 811) Equity attributable to non-controlling interest 31/12/ /12/2014 Unipetrol Group Other /12/ /12/2014 At the beginning of the period Share in profit/(loss), net, incl.: 396 (17) Unipetrol Group 397 (27) Share in items of other comprehensive income hedging reserve, net - 43 foreign exchange differences on subsidiaries from consolidation Change in the structure of non-controlling interest - (72) Paid and declared dividends - (1) CONSOLIDATED FINANCIAL STATEMENTS FOR THE YEAR EXPLANATORY NOTES TO THE CONSOLIDATED FINANCIAL STATEMENTS 20
48 (PLN million) Condensed financial information of UNIPETROL GROUP 31/12/ /12/2014 Non-current assets Current assets, incl.: cash Total assets Total equity Non-current liabilities Current liabilities, incl.: trade and other liabilities Total liabilities Total equity and liabilities Net debt (929) Sales revenues Cost of sales, incl.: (14 726) (17 965) depreciation and amortisation (284) (381) Gross profit on sales Distribution expenses (316) (307) Administrative expenses (200) (194) Net other operating income and expenses (96) (542) Profit/(Loss) from operations (135) Net finance income and costs (7) (55) Profit/(Loss) before tax (190) Tax expense (252) 118 Net profit/(loss) (72) Items of other comprehensive income Total net comprehensive income The impact of changes in the structure of non-controlling interest, presented in the consolidated statement of changes in equity in 2014, was a result of the purchase of non-controlling shares in Rafineria Trzebinia, ORLEN OIL and ORLEN Asfalt. In 2015 and in 2014, there were no significant restrictions in entities with significant non-controlling interest resulting from credit agreements, regulatory requirements and other contractual arrangements that restrict access to assets and settlement of liabilities of the Group Proposal to distribution of the Parent Company s profit for 2015 The improved financial situation of the ORLEN Group achieved in the recent years enabled it to implement, within the ORLEN Group s Strategy for years , a dividend policy which assumes a gradual increase in the level of dividend per share by taking into account the implementation of strategic financial objectives and forecasts of the macroeconomic situation. This method does not relate the rate of dividend to net profit, which in the ORLEN Group s area of operations is subject to high fluctuations and can include non-cash items, such as revaluation of assets, inventories or loans, distorting the view of the current financial situation of the Group. The Management Board of PKN ORLEN, after considering the liquidity situation and achievement of strategic financial objectives, proposes to distribute the net profit of PKN ORLEN for the year 2015 of PLN 1,047,519, as follows: PLN 855,418,122 will be allocated as a dividend payment (PLN 2 per 1 share) and the remaining amount of net profit of PLN 192,101, as reserve capital of the Parent Company. The Management Board recommends 15 July 2016 as the dividend date and 5 August 2016 as the payment date. This recommendation will be presented to the General Shareholders Meeting of PKN ORLEN, which will make a conclusive decision in this matter Distribution of the Parent Company s loss for 2014 and dividend payment in 2015 Pursuant to article point 2 of the Commercial Code and 7 sec. 7 point 3 of the Parent Company s Articles of Association, the Ordinary General Shareholders Meeting of PKN ORLEN S.A. on 28 April 2015, having analysed the motion of the Management Board, decided to cover the net loss for 2014 of PLN (4,671,826,145.06) from the reserve capital of the Parent Company. The Ordinary General Shareholders Meeting of PKN ORLEN S.A. also decided to allocate the amount of PLN 705,719, for the payment of dividends (PLN 1.65 per 1 share). The dividend was paid from the reserve capital of the Parent Company created from the profit of previous years Equity management policy Equity management is performed on the Group level in order to protect the Group s ability to continue its operations as a going concern while maximizing returns for shareholders. The Management Board monitors the following ratios: net financial leverage of the Group - as at 31 December 2015 and as at 31 December 2014 amounted to 28.1% and 33.0%, respectively; CONSOLIDATED FINANCIAL STATEMENTS FOR THE YEAR EXPLANATORY NOTES TO THE CONSOLIDATED FINANCIAL STATEMENTS 21
49 (PLN million) dividend per ordinary shares depends on current financial position of the Group. In 2015 and in 2014 the dividend of PLN 1.65 per share and PLN 1.44 per share was paid, respectively. Net financial leverage: net debt/equity (calculated as at the end of the period) x 100% Net debt: non-current loans, borrowings and bonds + current loans and borrowings cash and cash equivalents Loans, borrowings and bonds Non-current Current Total 31/12/ /12/ /12/ /12/ /12/ /12/2014 Loans Borrowings Bonds The ORLEN Group bases its financing mainly on floating interest rates, wherein hedges that change in the part variable to a fixed rate are used. Depending on the currency of financing these are WIBOR, LIBOR, EURIBOR, PRIBOR and CDOR increased by margin. The margin reflects risk connected to financing of the Group and in case of long-term contracts depends on net debt/ebitda ratio Loans - by currency (translated into PLN)/ by interest rate 31/12/ /12/2014 PLN - WIBOR EUR - EURIBOR USD - LIBOR USD CZK - PRIBOR CAD - LIBOR CAD LTL - VILIBOR As at 31 December 2015 unused credit lines (note ) increased by trade and other receivables (note 8.2.7) and cash and cash equivalents exceeded trade and other liabilities (note ) by PLN 6,610 million. The Group hedges cash flows related to interest payments regarding external financing in EUR and USD, by using interest rate swaps (IRS). In the period covered by the foregoing consolidated financial statements as well as after the reporting date there were no cases of violations of loans or interests repayment. Assets pledged as collateral for loans 31/12/ /12/2014 Loans secured by assets Assets pledged as collateral for loans Loans secured by assets Pledge on property, plant and equipment Cash in bank pledged as collateral Bonds - by currency (translated into PLN) 31/12/ /12/2014 PLN EUR by interest rate Fixed rate bonds Floating rate bonds Total 31/12/ /12/ /12/ /12/ /12/ /12/2014 Nominal value Carrying amount CONSOLIDATED FINANCIAL STATEMENTS FOR THE YEAR EXPLANATORY NOTES TO THE CONSOLIDATED FINANCIAL STATEMENTS 22
50 (PLN million) Nominal value Subscription Maturity Base rate Margin Rating date date A Series M WIBOR 1.50% A - (pol) B Series M WIBOR 1.50% A - (pol) C Series M WIBOR 1.40% A - (pol) D Series M WIBOR 1.30% A - (pol) E Series M WIBOR 1.30% A - (pol) F Series Fixed interest rate 5% A - (pol) Retail bonds Corporate bonds M WIBOR 1.60% - Eurobonds Fixed interest rate 2.5% BBB-, Baa The difference between the nominal value and carrying amount of bonds results from measurement of bonds according to amortized cost using the effective interest method Provisions Non-current Current Total 31/12/ /12/ /12/ /12/ /12/ /12/2014 Environmental Jubilee bonuses and post-employment benefits CO₂ emissions, energy certificates Other Changes in provisions in Environmental provision Jubilee bonuses and post-employment benefits provision CO₂ emissions, energy certificates Other provisions Total 01/01/ Recognition Reversal (9) - 2 (24) (31) Usage (38) (37) (367) (56) (498) Acquisition of subsidiary Foreign exchange differences (4) - 27 (12) 11 Changes in provisions in Environmental provision Jubilee bonuses and post-employment benefits provision CO₂ emissions, energy certificates Other provisions Total 01/01/ Recognition Reversal (7) - (9) (73) (89) Usage (29) (28) (330) (259) (646) Acquisition of subsidiary Foreign exchange differences Environmental provision The Group has legal obligation to clean contaminated land water environment in the area of production plants, fuel stations, fuel terminals and warehouses. The Management Board estimated the provision for environmental risks regarding the removal of contaminants based on analyses provided by independent experts or based on current expected costs of remediation. In the Czech Republic, the Government is responsible for liabilities arising from contamination of land-water environment before date of entity s privatization. In case of new contamination that arose after this date the Group is responsible for those liabilities. Moreover, at the stage of development and extraction of mineral resources the Group recognizes provisions for the cost of removal of drillings and supporting infrastructure. CONSOLIDATED FINANCIAL STATEMENTS FOR THE YEAR EXPLANATORY NOTES TO THE CONSOLIDATED FINANCIAL STATEMENTS 23
51 (PLN million) Provision for jubilee bonuses and post-employment benefits Change in employee benefits obligations Jubilee bonuses provision Post-employment benefits Total NOTE 31/12/ /12/ /12/ /12/ /12/ /12/2014 At the beginning of the period Current service costs Interest expenses Actuarial gains and losses arising from changes in assumptions: 4 30 (4) demographic financial (7) 23 (7) 19 (14) 42 other Past employment costs (7) (7) (8) (23) (15) (30) Payments under program (16) (25) (10) (6) (26) (31) Other (5) (10) (2) (24) (7) (34) The carrying amount of employee benefits liabilities is identical to their present value as at 31 December 2015 and 31 December Employee benefits liabilities divided into active and retired employees Active employees Retired employees Total 31/12/ /12/ /12/ /12/ /12/ /12/2014 Poland Czech Republic Lithuania, Latvia, Estonia Employee benefits liabilities divided into geographical structure Jubilee bonuses provision Post-employment benefits Total 31/12/ /12/ /12/ /12/ /12/ /12/2014 Poland Czech Republic Lithuania, Latvia, Estonia Maturity of employee benefits analysis Jubilee bonuses provision Post-employment benefits Total 31/12/ /12/ /12/ /12/ /12/ /12/2014 up to 1 year from 1 to 5 years above 5 years Weighted average duration of liabilities for post-employment benefits (in years) 31/12/ /12/2014 Poland Czech Republic Lithuania, Latvia, Estonia Employee benefits payments analysis Jubilee bonuses provision Post-employment benefits Total 31/12/ /12/ /12/ /12/ /12/ /12/2014 up to 1 year from 1 to 5 years above 5 years CONSOLIDATED FINANCIAL STATEMENTS FOR THE YEAR EXPLANATORY NOTES TO THE CONSOLIDATED FINANCIAL STATEMENTS 24
52 (PLN million) In 2015 the amount of provision for employee benefits changed as the result of update of assumptions, mainly in relation to discount rate, projected inflation and expected remuneration increase ratio. Should the 2014 assumptions be used, the provision for the employee benefits would be lower by PLN (11) million. Sensitivity analysis to changes in actuarial assumptions The Group analysed the impact of the financial and demographic assumptions and calculated that the changes of ratios: remuneration ratio by +/- 1.0 p.p., the discount rate by +/- 0.5 p.p. and the rate of turnover by +/- 0.5 p.p. in Poland, Czech, Lithuania, Latvia and Estonia are no higher than PLN 8 million. Therefore, the Group does not present any detailed information. As at 31 December 2015, the Group used the following actuarial assumptions that had an impact on the level of actuarial provisions for the Polish entities: discount rate 3.25%, expected inflation 2.5%, the remuneration increase rate: 0% in years and 2.5% in subsequent years. In the Group's foreign entities the main impact had: value of discount rate: from 0.54% to 1.50%. The Group carries out the employee benefit payments from current resources. As at 31 December 2015 there were no funded plans and the Group paid no contributions to fund liabilities Provision for CO 2 emissions, energy certificates Provision for CO 2 emissions, energy certificates comprises mainly recognition of the provisions for estimated in the reporting period, the cost of CO 2 emissions. As at 31 December 2015 and as at 31 December 2014 the value of the provision amounted to PLN 440 million and PLN 334 million, respectively Other provisions As at 31 December 2015 and as at 31 December 2014 other provisions comprise mainly provisions for the risk of unfavourable decisions of pending administrative or court proceedings of PLN 170 million and PLN 145 million, respectively Other financial liabilities Non-current Current Total 31/12/ /12/ /12/ /12/ /12/ /12/2014 Cash flows hedge instruments currency forwards interest rate swaps commodity swaps currency interest rate swaps Derivatives not designated as hedge accounting currency forwards commodity swaps Embedded derivatives currency swaps Liabilities on cash flows settled hedge instruments Investment liabilities Finance lease Other Trade and other liabilities 31/12/ /12/2014 Trade liabilities Investment liabilities Finance lease Other Financial liabilities Payroll liabilities Excise tax and fuel charge Value added tax Tax expense Other taxation, duties, social security and other benefits Accruals holiday pay liabilities due to reimbursement of excise tax cost to suppliers providing tax warehouse services Other Non-financial liabilities Trade and other liabilities denominated in foreign currencies as at 31 December 2015 and as at 31 December 2014 amounted to PLN 6,065 million and PLN 7,424 million, respectively. Division of financial liabilities denominated in foreign currencies is presented in note Division of liabilities from related parties is presented in note CONSOLIDATED FINANCIAL STATEMENTS FOR THE YEAR EXPLANATORY NOTES TO THE CONSOLIDATED FINANCIAL STATEMENTS 25
53 (PLN million) Other liabilities 31/12/ /12/2014 Deferred income Liabilities directly associated with assets classified as held for sale EXPLANATORY NOTES TO THE STATEMENT OF CASH FLOWS NOTE Change in provisions presented in the statement of financial position 102 (122) Usage of prior year provision for CO₂ emissions, energy certificates Foreign exchange differences 21 (32) Other (27) (35) Change in provisions in the statement of cash flows Change in inventories presented in the statement of financial position (886) Reclassification of inventories from/to property, plant and equipment and noncurrent assets classified as held for sale 13 (46) Acquisition of subsidiary 50 - Foreign exchange differences Change in inventories in the statement of cash flows (655) Change in trade and other receivables presented in statement of financial position Change in rights and advances for non-financial non-current assets (73) Acquisition of subsidiary Foreign exchange differences Other 23 (35) Change in receivables in the statement of cash flows Change in trade and other liabilities presented in statement of financial position (437) (2 792) Change in investment liabilities (585) (52) Acquisition of subsidiary (317) (24) Foreign exchange differences (489) (407) Other (95) (3) Change in liabilities in the statement of cash flows (1 923) (3 278) Foreign exchange loss NOTE Foreign exchange (loss) surplus presented in statement of profit or loss and other comprehensive income (317) (1 459) Adjustments to net profit/(loss) of foreign exchange differences presented in statement of cash flows realized foreign exchange differences concerning investing and financing activities unrealized foreign exchange differences concerning investing and financing activities (29) (18) hedge accounting of net investment hedge in foreign operation foreign exchange differences on cash (19) 2 Foreign exchange differences concerning operating activities not correcting net profit/(loss) (293) (579) CONSOLIDATED FINANCIAL STATEMENTS FOR THE YEAR EXPLANATORY NOTES TO THE CONSOLIDATED FINANCIAL STATEMENTS 26
54 (PLN million) Interest, net NOTE Finance income and costs of net interest presented in statement of profit or loss and other comprehensive income 8.1.6, (123) (167) Adjustments to net profit/(loss) of net interest presented in statement of cash flows interest paid concerning financing activities accrued interest concerning investing and financing activities (59) (4) Net interest concerning operating activities not correcting net profit/(loss) Income tax (paid) (76) (74) NOTE Tax expense on profit/(loss) before tax (465) 418 Change in deferred tax asset and liabilities 619 (697) Change in current tax receivables and liabilities Deferred tax recognized in other comprehensive income (292) 338 Acquisition of subsidiary (166) (117) Foreign exchange differences (11) (140) 8.4. EXPLANATORY NOTES TO THE FINANCIAL INSTRUMENTS AND FINANCIAL RISKS Financial instruments by category and class (204) (168) Financial instruments by class NOTE 31/12/ /12/2014 Financial instruments by category ASSETS Unquoted shares Available for sale Embedded derivatives and derivatives not designated as hedge accounting At fair value through profit or loss Hedging instruments Hedging financial instruments Loans and receivables Trade receivables Loans and receivables Cash and cash equivalents Loans and receivables Receivables on cash flows settled hedge instruments Loans and receivables Other 8.2.3, Loans and receivables LIABILITIES Embedded derivatives and derivatives not designated as hedge accounting At fair value through profit or loss Hedging instruments Hedging financial instruments Finance lease , Excluded from the scope of IAS Measured at amortised cost Bonds Measured at amortised cost Loans Measured at amortised cost Borrowings Measured at amortised cost Trade liabilities Measured at amortised cost Investment liabilities , Measured at amortised cost Liabilities on cash flows settled hedge instruments Measured at amortised cost Other , Measured at amortised cost Income, expense, profit and loss in the consolidated statement of profit or loss and other comprehensive income NOTE 31/12/ /12/2014 Financial instruments by category Interest income Loans and receivables Interest costs (205) (242) (194) (236) Measured at amortised cost (4) - Hedging financial instruments (7) (6) Excluded from the scope of IAS 39 Recognition/reversal of receivables impairment allowances (27) (26) Loans and receivables other operating income/expenses 8.1.4, (30) (31) Loans and receivables finance income/costs 3 5 Loans and receivables Financial instruments gains/(losses) (518) (1 371) 186 (182) Loans and receivables (529) (1 288) Measured at amortised cost (175) 102 At fair value through profit or loss (2) (5) Hedging financial instruments 2 2 Available for sale (668) (1 564) other, excluded from the scope of IFRS 7 (4) (2) CONSOLIDATED FINANCIAL STATEMENTS FOR THE YEAR EXPLANATORY NOTES TO THE CONSOLIDATED FINANCIAL STATEMENTS 27
55 (PLN million) Fair value measurement 31/12/2015 NOTE Carrying amount Fair value Fair value hierarchy Level 1 Level 2 Financial assets Embedded derivatives and hedging instruments Financial liabilities Bonds Loans Borrowings Finance lease , Embedded derivatives and hedging instruments /12/2014 Carrying amount Fair value hierarchy Level 1 Level 2 NOTE Financial assets Embedded derivatives and hedging instruments Fair value Financial liabilities Bonds Loans Borrowings Finance lease , Embedded derivatives and hedging instruments For other classes of financial assets and liabilities fair value represents their carrying amount Methods applied in determining fair value (fair value hierarchy) Financial liabilities due to loans, bonds, finance lease and liabilities and receivables for borrowings are measured at fair value using discounted cash flows method. Discount rates are calculated based on market interest rates according to quotations of 1- month, 3- months and 6-months interest rates increased by proper margins for particular financial instruments. For the majority as at 31 December 2015 and as at 31 December 2014, 1-month interest rate quotations were applied. 31/12/ /12/2014 WIBOR % % EURIBOR % % LIBOR USD % % PRIBOR % % LIBOR CAD % % VILIBOR % As at 31 December 2015 and as at 31 December 2014 the Group held unquoted shares in entities, for which fair value cannot be reliably measured, due to the fact that there are no active markets for these entities and no comparable transactions in the same type of instruments were noted. The value of shares of these entities was recognized in the consolidated statement of financial position as at 31 December 2015 and as at 31 December 2014 of PLN 40 million at acquisition cost less impairment allowances. During the reporting period and comparative period there were no reclassifications of financial instruments in Group between Level 1 and 2 of fair value hierarchy. CONSOLIDATED FINANCIAL STATEMENTS FOR THE YEAR EXPLANATORY NOTES TO THE CONSOLIDATED FINANCIAL STATEMENTS 28
56 (PLN million) Hedge accounting Cash flows hedge instruments NOTE 31/12/ /12/2014 currency forwards commodity swaps 8 (1 556) Hedging strategies operating and investing activity; sales of products and purchase of crude oil; operational inventories, refining margin, time mismatch occurring on purchases of crude oil by sea, risk of crude oil prices on arbitrage transactions cash & carry, offering customers the goods for which price formulas are based on fixed price; currency interest rate swaps (99) (111) interest payments concerning borrowing costs; interest rate swaps (92) (93) interest payments concerning borrowing costs 8.2.3, (71) (1 595) Planned realization date of hedged cash flows which will be recognized in the profit or loss 31/12/ /12/2014 Currency operating exposure Finance currency exposure Interest rate exposure Commodity risk exposure Risks identification The Group's activities are exposed to many different types of risk. Risk management is mainly focused on the unpredictability of financial markets and aims to minimize any potential negative impacts on the Group's financial results. Financial risks Type of risk Exposure Measurement of exposure Management/Hedging Commodity Currency Interest rate - risk of changes in refining and petrochemical margins on sale of products and Ural/Brent differential fluctuations; - risk of changes in crude oil and products prices related to the time mismatch occurring when purchasing by sea the part of crude oil for its processing or oversize periodic stock of operational crude oil, work in progress or finished goods, as well as future sales transactions of finished goods; - risk of changes in CO₂ emission rights prices; - risk of changes in crude oil and refinery product prices related to the obligation to maintain mandatory reserves of crude oil and fuels; - risk of changes in commodity prices on arbitrage transactions cash & carry involving acquisition of crude oil or products for stock in order to sell them or process them at a later date - economic currency exposure resulting from inflows decrease by expenses indexed to or denominated in other than the functional currency; - currency exposure resulting from investment or probable liabilities and receivables in foreign currencies; - balance sheet exposure resulting from assets and liabilities denominated in foreign currency Exposure resulting from owned assets and liabilities for which interest gains or losses are dependent on floating interest rates. cash flows planning cash flows planning analysis of balance sheet positions ratio: total net debt to positions for which interest costs are dependent on floating interest rate Market risk management policy and hedging strategies, which define principles of measurement of individual exposure, parameters and the time horizon of risk hedging and hedging instruments. Liquidity Losing cash and deposits Credit Risk of unforeseen shortage of cash or lack of access to financing sources, both in the horizon of short and long-term borrowing, leading to temporary or permanent loss of ability to pay financial liabilities or imposing the need to obtain funds on unfavourable terms. Risk of bankruptcy of domestic or foreign banks, in which accounts are kept or in which cash is invested for a short time. Risk of unsettled receivables for delivered products and services by customers. Credit risk is also related to the creditability of customers with whom sales transactions are concluded. cash flows planning in short and long-term horizon short-term credit rating of bank analysis of creditability and solvency of customers Short-term liquidity risk management policy, which defines rules of reporting and consolidation of liquidity of PKN ORLEN and ORLEN Group entities. Group carries out a policy of its financing sources diversification and uses range of tools for effective liquidity management. Management based on principles of surplus cash management, which determine possibility of granting quotas for individual banks made on the basis of, among others, ratings of investment and reporting data. Management based on procedures and policies adopted for management of trade credit and debt recovery. Other risks, disclosed in details in the Management Board Report on the operations of the ORLEN Capital Group in point 2.8. The ORLEN Group applies a consistent financial risk hedging policy based on market risk management policy supported and supervised by the Financial Risk Committee, the Management Board and the Supervisory Board. CONSOLIDATED FINANCIAL STATEMENTS FOR THE YEAR EXPLANATORY NOTES TO THE CONSOLIDATED FINANCIAL STATEMENTS 29
57 (PLN million) Commodity risks The impact of commodity hedging instruments on the Group's financial statements Type of hedged raw material/product Unit of measure 31/12/ /12/2014 Crude oil bbl Diesel t Heating oil t Gasoline t Naphta t JET fuel t Gas mcf The net carrying amount of hedging instruments for commodity risk as at 31 December 2015 and as at 31 December 2014 amounted to PLN 8 million and PLN (1,556) million, respectively. Sensitivity analysis for changes in prices of products and raw materials 31/12/2015 Analysis of the influence of changes in the carrying amount of financial instruments on hedging reserve to a hypothetical change in prices of products and raw materials: Increase of prices Total influence Decrease of prices Total influence Crude oil USD/bbl; CAD/bbl +19% (92) -19% 92 Diesel USD/t +17% (38) -17% 38 Gasoline USD/t +21% (62) -21% 62 Naphta USD/t +21% (9) -21% 9 Heating oil USD/t +20% 11-20% (11) JET fuel USD/t +16% 4-16% (4) (186) /12/2014 Analysis of the influence of changes in the carrying amount of financial instruments on result before tax and hedging reserve to a hypothetical change in prices of products and raw materials: Increase of prices Total influence Decrease of prices Total influence Crude oil USD/bbl; CAD/bbl +19% % (591) Diesel USD/t +17% (120) -17% 120 Gasoline USD/t +21% (74) -21% 74 Heating oil USD/t +20% 22-20% (22) 419 (419) including: Influence on result before tax Increase of prices Influence Decrease of prices Influence Crude oil USD/bbl; CAD/bbl +19% % (219) Diesel USD/t +17% (106) -17% 106 Gasoline USD/t +21% (70) -21% 70 Heating oil USD/t +20% (26) -20% (17) Influence on hedging reserve Increase of prices Influence Decrease of prices Influence Crude oil USD/bbl; CAD/bbl +19% % (372) Diesel USD/t +17% (14) -17% 14 Gasoline USD/t +21% (4) -21% 4 Heating oil USD/t +20% 48-20% (48) 402 (402) Applied for the sensitivity analysis of commodity risk hedging instruments variations of crude oil and products prices were calculated based on volatility for 2014 and available analysts forecasts. The influence of changes of prices was presented on annual basis. CONSOLIDATED FINANCIAL STATEMENTS FOR THE YEAR EXPLANATORY NOTES TO THE CONSOLIDATED FINANCIAL STATEMENTS 30
58 (PLN million) Fair value of commodity swaps is calculated based on discounted future cash flows of executed transactions, calculated as a difference between term and transaction price. In case of derivatives, the influence of crude oil, and products prices variations on fair value were examined at constant level of currency rates Currency risk Currency structure of financial instruments as at 31 December 2015 Financial instruments by class EUR USD CZK CAD Other currencies after translation to PLN Total after translation to PLN Financial assets Trade receivables Embedded derivatives and hedging instruments Cash and cash equivalents Receivables on cash flows settled hedge instruments Other Financial liabilities Bonds Loans Trade liabilities Investment liabilities Embedded derivatives and hedging instruments Liabilities on cash flows settled hedge instruments Other Currency structure of financial instruments as at 31 December 2014 Financial instruments by class EUR USD CZK CAD LTL Other currencies after translation to PLN Total after translation to PLN Financial assets Trade receivables Embedded derivatives and hedging instruments Cash and cash equivalents Receivables on cash flows settled hedge instruments Other Financial liabilities Bonds Loans Trade liabilities Investment liabilities Hedging instruments Other CONSOLIDATED FINANCIAL STATEMENTS FOR THE YEAR EXPLANATORY NOTES TO THE CONSOLIDATED FINANCIAL STATEMENTS 31
59 (PLN million) Sensitivity analysis for changes in the exchange rates EUR / PLN USD / PLN CZK / PLN CAD / PLN Total variation of exchange rates +15% Influence on result before tax (A) (758) 128 (196) (779) (142) - (12) (66) (1 108) (717) Influence on hedging reserve (B) (574) (683) 2 (58) (572) (741) Influence on foreign exchange differences on subsidiaries from consolidation ( C ) 6 (151) 10 (221) 168 (42) (83) (398) Total influence (A+B+C) (1 326) (706) (184) (1 058) 26 (42) (95) (50) (1 579) (1 856) Sensitivity of net investment in foreign operations including hedging reserve (D) Total influence on profit or loss and other comprehensive income (A+B+D) (1 260) (484) 13 (781) (319) (503) At variation of currency rates by -15%, sensitivity analysis assumes the same value as in the table above only with the opposite sign. Variations of currency rates described above were calculated based on average volatility of particular currency rates and analysts forecasts. Sensitivity of financial instruments for currency risk was calculated as a difference between the initial carrying amount of financial instruments (excluding derivative instruments) and their potential amount calculated using assumed changes in currency rates. Fair value of currency forwards and foreign exchange swaps is calculated based on discounted future cash flows of concluded transactions as a difference between forward price and transaction price. The influence of currency rate variations on fair value of derivative instruments was examined at constant level of interest rates The risk of interest rates changes Structure of financial instruments subject to risk of interest rates changes as at 31 December 2015 Financial instruments by class WIBOR EURIBOR LIBOR USD PRIBOR LIBOR CAD Total NOTE Financial assets Hedging instruments Financial liabilities Bonds Loans Borrowings Hedging instruments * 186* ** ** *In the position financial liabilities - hedging instruments, the Group recognized cross interest rate swaps (CIRS) of PLN 99 million, which are sensitive to both WIBOR and EURIBOR interest rates changes. **Total includes CIRS valuation of PLN 99 million. Structure of financial instruments subject to risk of interest rates changes as at 31 December 2014 Financial instruments by class WIBOR EURIBOR LIBOR USD PRIBOR LIBOR CAD VILIBOR Total NOTE Financial liabilities Bonds Loans Borrowings Hedging instruments * 193* ** ** *In the position financial liabilities - hedging instruments, the Group recognized cross interest rate swaps (CIRS) of PLN 111 million, which are sensitive to both WIBOR and EURIBOR interest rates changes. **Total includes CIRS valuation of PLN 111 million. CONSOLIDATED FINANCIAL STATEMENTS FOR THE YEAR EXPLANATORY NOTES TO THE CONSOLIDATED FINANCIAL STATEMENTS 32
60 (PLN million) Sensitivity analysis for the interest rates changes Interest rate Assumed variations Influence on result before tax Influence on hedging reserve Total 31/12/ /12/ WIBOR +0.5p.p. +0.5p.p. (14) (12) (44) (3) (58) (15) LIBOR USD +0.5p.p. +0.5p.p. (3) (3) EURIBOR +0.5p.p. +0.5p.p. (14) (21) (31) (36) WIBOR -0.5p.p. -0.5p.p The above interest rates variations were calculated based on observations of average interest rates fluctuations. Low interest rates of EURIBOR and LIBOR USD at the end of 2015 and 2014 and market forecasts for further periods caused that the Group did not take the further decrease in the sensitivity analysis into consideration. The Group does not consider in the sensitivity analysis change of PRIBOR and LIBOR CAD due to their insignificant impact. The sensitivity analysis was performed on the basis of instruments held as at 31 December 2015 and as at 31 December 2014, the influence of interest rates changes was presented on annual basis. The sensitivity of financial instruments for the risk of interest rate changes was calculated as arithmetic product of the balance of items, sensitive to interest rates changes (excluding derivatives) multiplied by adequate variation of interest rates. For derivatives in sensitivity analysis for the risk of interest rates changes interest rate curve displacement due to potential reference rate change was used, provided that other risk factors remain constant Liquidity and credit risk Liquidity risk Maturity analysis for financial liabilities as at 31 December 2015 up to 1 year from 1 to 3 years from 3 to 5 years above 5 years Total Carrying amount NOTE Bonds floating-rate bonds - undiscounted value fixed rate bonds - undiscounted value Loans - undiscounted value Trade liabilities Investment liabilities , Embedded derivatives and hedging instruments- undiscounted value gross exchange amounts, incl.: currency interest rate swaps (2) net exchange amounts, incl.: commodity swaps Other 8.2.9, , Maturity analysis for financial liabilities as at 31 December 2014 up to 1 year from 1 to 3 years from 3 to 5 years above 5 years Total Carrying amount NOTE Bonds floating-rate bonds - undiscounted value fixed rate bonds - undiscounted value Loans - undiscounted value Trade liabilities Investment liabilities , Embedded derivatives and hedging instruments- undiscounted value gross exchange amounts, incl.: (10) (2) currency interest rate swaps (11) (2) net exchange amounts, incl.: commodity swaps Other 8.2.9, , In 2015 and in 2014 for currency interest rate swaps the level of discount rates cause that undiscounted value is a financial asset and discounted value is a financial liability. As at 31 December 2015 and as at 31 December 2014 the maximum possible indebtedness due to loans amounted to PLN 13,916 million and PLN 14,372 million, respectively. As at 31 December 2015 and as at 31 December 2014 PLN 8,441 million and PLN 7,150 million, respectively, remained unused. CONSOLIDATED FINANCIAL STATEMENTS FOR THE YEAR EXPLANATORY NOTES TO THE CONSOLIDATED FINANCIAL STATEMENTS 33
61 (PLN million) The value of guarantees regarding liabilities to third parties granted during ongoing operations as at 31 December 2015 and as at 31 December 2014 amounted to PLN 458 million and PLN 592 million, respectively. These concern mainly: civil-law guarantees of contract performance and public-law guarantees resulting from generally applicable regulations secured regularity of business licensed in the liquid fuels sector and resulting from this activity tax and customs receivables, etc. Guarantees and sureties granted in the Group on behalf of related parties as at 31 December 2015 and as at 31 December 2014 amounted to PLN 6,836 million and PLN 6,667 million, respectively. They were mainly related to secure of ORLEN Capital future liabilities due to Eurobonds issuance and timely payment of liabilities by related parties. Based on analysis and forecasts as at the end of the reporting period, the Group recognized the probability of payment of the above amounts as low. Credit risk Based on the analysis of balances of receivables the customers were divided into two groups: Group I customers with very good or good history of cooperation in the current year; Group II other customers. The division of not past due receivables 31/12/ /12/2014 Group I Group II The ageing analysis of current receivables past due, but not impaired as at the end of the reporting period 31/12/ /12/2014 up to 1 month from 1 to 3 months from 3 to 6 months 12 6 from 6 to 12 months above 1 year Change in impairment allowances of trade and other receivables NOTE At the beginning of the period Recognition Reversal (24) (47) Usage (67) (19) Foreign exchange differences 2 6 Other Recognition and reversal of impairment allowances of trade and other receivables related mainly to downstream segment. Recognition and reversal of impairment allowances of receivables are recognized in other operating activity in relation to principal amount and in financial activities in relation to interest for delayed payments. As at 31 December 2015 and as at 31 December 2014 the Group received bank and insurance guarantees of PLN 2,648 million and PLN 3,143 million, respectively. Additionally the Group receives from its customers securities such as blockade of cash on bank accounts, deposits, mortgage and bills of exchange OTHER EXPLANATORY NOTES Concessions held The Group s operations require concessions, due to their importance to the public interest. Remaining concessions periods (in years) 31/12/2015 Electrical energy: manufacturing, distribution, trade 4-15 Heating energy: manufacturing, transmission, distribution, trade Gaseous fuels: transmission, distribution, trade 5-15 Liquid fuels: manufacturing, transmission, trade, storage 2-15 Non-reservuar storage of crude oil and liquid fuels 14 Rock salt: exploration, recognition and exploitation Exploration and recognition of crude oil and natural gas deposits 1-4 Personal and property security services indefinitely CONSOLIDATED FINANCIAL STATEMENTS FOR THE YEAR EXPLANATORY NOTES TO THE CONSOLIDATED FINANCIAL STATEMENTS 34
62 (PLN million) As at 31 December 2015 and as at 31 December 2014 the Group had no liabilities related to concession services in scope of IFRIC 12 Service concession arrangements Leases Group as a lessee Operating lease As at 31 December 2015 and as at 31 December 2014 the Group was a lessee under non-cancellable operating lease agreements (tenancy, rent), which regard mainly the lease of petrol stations, means of transportation and computer equipment. Agreements include clauses concerning contingent rent payables. In most cases they can be extended. The total lease payments, resulting from non-cancellable operating lease agreements recognized as expenses in 2015 and in 2014 amounted to PLN (85) million and PLN (83) million, respectively. Future minimum lease payments under non-cancellable operating lease agreements: 31/12/ /12/2014 up to 1 year from 1 to 5 years above 5 years Finance lease As at 31 December 2015 and as at 31 December 2014 the Group was a lessee under finance lease agreements, which relate to buildings and constructions, machinery and equipment and vehicles. In concluded lease agreements, the general conditions of finance lease are effective, they do not contain any clauses concerning contingent rent payables, give the possibility to purchase the leased equipment and eventually can be extended. Present value of future minimum Value of future minimum lease payments lease payments 31/12/ /12/ /12/ /12/2014 NOTE up to 1 year from 1 to 5 years above 5 years , The difference between the total value of future minimum lease payments and their present value results from discounting of lease payments by the interest rate implicit in the proper agreement Investment expenditures incurred and future commitments resulting from signed investment contracts The total amount of investment expenditures together with borrowing costs incurred in 2015 and in 2014 amounted to PLN 3,183 million and PLN 3,788 million, respectively, including PLN 306 million and PLN 521 million of investments relating to environmental protection. As at 31 December 2015 and as at 31 December 2014 the value of future commitments resulting from contracts signed until this date amounted to PLN 3,054 million and PLN 2,005 million, respectively Contingent assets and liabilities Contingent assets On 13 August 2015 the steam cracker unit accident in Unipetrol Group took place. In relation to damaged petrochemical assets, an impairment of PLN (93) million, translated using the exchange rate as at 30 September 2015 (representing approximately CZK (597) million), was recognized. Based on the insurance policies and the estimates made at the end of 2015, Unipetrol Group expects insurers to cover reconstruction costs of repair, in the amount of approximately PLN 647 million translated using the exchange rate as at 31 December 2015 (representing CZK 4.1 billion), as well as lost business profits in 2015 in the amount of approximately PLN 378 million translated using the exchange rate as at 31 December 2015 (representing CZK 2.4 billion) and other costs incurred in connection with the accident in the amount of approximately PLN 25 million translated using the exchange rate as at 31 December 2015 (representing CZK 156 million). Unipetrol Group received advance payments on account of the loss in amount of approximately PLN 43 million translated using the exchange rate as at 31 December 2015 (representing CZK 276 million), which was recognized under trade and other liabilities in the statement of financial position of the Group. Contingent liabilities Spolana a.s. currently produces chlorine using the mercury electrolysis. In case of production ceases, the company is required to present a reclamation program after it stops to use its fixed assets. On 9 September 2013, as a result of administrative proceedings, Spolana a.s. received a consent of Mid-Czech Regional Body to extend the integrated pollution prevention and control license from the end of 2014 until 30 June At the same time, the company is obliged to submit an action plan aiming to cease the production of chlorine using the mercury electrolysis until 31 March Information on significant court proceedings is presented in note 8.8. CONSOLIDATED FINANCIAL STATEMENTS FOR THE YEAR EXPLANATORY NOTES TO THE CONSOLIDATED FINANCIAL STATEMENTS 35
63 (PLN million) Excise tax guarantees Excise tax guarantees and excise tax on goods and merchandise under the excise tax suspension procedure as at 31 December 2015 and as at 31 December 2014 amounted to PLN 1,815 million and PLN 1,637 million, respectively Related party transactions As at 31 December 2015 and as at 31 December 2014 and in 2015 and in 2014 were no material transactions of related parties with: members of the Management Board and the Supervisory Board of the Parent Company and their relatives, key executive personnel of the Parent Company and ORLEN Group companies. ORLEN Group companies transactions and balances of settlements with related parties Sales Purchases Jointly- controlled entities (213) (507) joint ventures (37) (30) joint operations (176) (477) Associates (32) (47) (245) (554) Trade and other receivables Trade and other liabilities 31/12/ /12/ /12/ /12/2014 Jointly- controlled entities joint ventures joint operations Associates The above transactions with related parties include mainly sales and purchases of refinery and petrochemicals products and sales and purchases of services. In 2015 and in 2014 there were no material related party transactions in the Group concluded on other than an arm s length basis Remuneration together with profit-sharing paid and due or potentially due to the members of the Management Board, the Supervisory Board of the Parent Company and other members of key executive personnel of the Parent Company and the ORLEN Group companies Remuneration of the Management Board Members of the Parent Company performing duties in the current year remuneration and other benefits bonus paid for the previous year Bonuses potentially due to the Management Board Members of the Parent Company performing duties in the current year, to be paid in the next year Remuneration and other benefits paid and due to the former Management Board Members of the Parent Company * Remuneration and other benefits of the key executive personnel remuneration and other benefits of the key executive personnel of the Parent Company key executive personnel of the subsidiaries belonging of the ORLEN Group Remuneration of the Supervisory Board Members of the Parent Company * In 2015, remuneration paid due to severance payment and for non-competition, remuneration due for non-competition; in 2014 severance payment and bonus paid for the year The Management Board s, the Supervisory Board s and other key executive personnel s remuneration includes short-term employee benefits, post-employment benefits, other long-term employee benefits and termination benefits paid, due and potentially due during the period. Bonus systems for key executive personnel of the ORLEN Group The regulations applicable to PKN ORLEN Management Board, directors directly reporting to the Management Board of PKN ORLEN and other key positions of the ORLEN Group have certain common features. The persons subject to the above mentioned systems are remunerated for the accomplishment of specific goals set at the beginning of the bonus period, by the Supervisory Board for the Management Board Members and by the Management Board for the key executive personnel. The Bonus Systems are consistent with the Concern s Values, so as to promote the cooperation between individual employees in view to achieve the best possible results for the ORLEN Group. The goals so-said are qualitative or quantitative and are accounted for the end of the year for which they were set. Regulation gives the possibility to promote employees, who significantly contribute to the achieved results. CONSOLIDATED FINANCIAL STATEMENTS FOR THE YEAR EXPLANATORY NOTES TO THE CONSOLIDATED FINANCIAL STATEMENTS 36
64 (PLN million) Remuneration regarding non-competition clause and dissolution of the contract as a result of dismissal from the position held According to agreements, Members of the PKN ORLEN Management Board are obliged to obey a non-competition clause for 6 or 12 months, starting from the date of termination or expiration of the contract. In the period, they are entitled to receive remuneration in the amount of six or twelve basic monthly remuneration, payable in equal monthly instalments. In addition, agreements include remuneration payments in case of dissolution of the contract because of dismissal from the position held. Remuneration in such a case is six or twelve basic monthly remuneration. Directors directly subordinate to the Management Board of PKN ORLEN and Management Board members are typically obliged to obey a non-competition clause for 6 months, starting from the date of termination or expiration of the contract. In the period, they receive remuneration in the amount of 50% of six-month basic remuneration, payable in 6 equal monthly instalments. Furthermore, severance pay for termination of contract by the Employer amounts to three or six times basic monthly remuneration. Information on remuneration is presented in details in point 2.12 of the Management Board Report on the operations of ORLEN Capital Group Remuneration arising from the agreement with the entity authorized to conduct audit of the financial statements Remuneration of KPMG Audyt Sp. z o.o. in respect of the Parent Company audit and reviews of the financial statements additional services Remuneration of KPMG Audyt Sp. z o.o. and KPMG member firms in respect of subsidiaries of the Capital Group audit of the annual financial statements and verification procedures additional services In the period covered by this consolidated financial statements the entity authorized to conduct audit of the ORLEN Group s financial statements was KPMG Audyt Sp. z o.o. According to the agreement concluded on 30 May 2005 with subsequent amendments KPMG Audyt Sp. z o.o. executes the interim reviews and audits of separate and consolidated financial statements in years ACCOUNTING PRINCIPLES Impact of IFRSs amendments and interpretations on consolidated financial statements of the ORLEN Group IFRSs and their interpretations, announced and adopted by the European Union, not yet effective The Group intends to adopt listed below new standards and amendments to the standards and interpretations to IFRSs that are published by the International Accounting Standards Board, but not effective as at the date of publication of these financial statements, in accordance with their effective date. Possible impact on financial statements Amendments to IAS 16 - Property, Plant and Equipment and IAS 41 - Agriculture: Agriculture - Bearer Plants Amendments to IAS 16 - Property, Plant and Equipment and IAS 38 - Intangible Assets: Clarification of Acceptable Methods of Depreciation and Amortisation no impact expected no impact expected Amendments to IAS 19 Employee Benefits entitled Defined Benefit Plans: Employee Contributions Improvements to International Financial Reporting Standards Amendments to IAS 27 - Separate Financial Statements: Equity Method in Separate Financial Statements Amendments to IFRS 11 - Joint Arrangements: Accounting for Acquisitions of Interests in Joint Operations no impact expected no impact expected no impact expected no impact expected Standards and Interpretations adopted by International Accounting Standards Board (IASB), waiting for approval of EU New standard IFRS 9 - Financial Instruments New standard IFRS 15 - Revenue from Contracts with Customers IFRS 16 - Leasing Amendments to IAS 7 - Statement of Cash Flows - Disclosure initiative Amendments to IAS 12 - Income Taxes - Recognition of Deferred Tax Assets for Unrealized Losses Amendments to IFRS 10 - Consolidated Financial Statements and IAS 28 - Investments in Associates: Sale or Contribution of Assets between an Investor and its Associate or Joint Venture Amendments to IFRS 10 - Consolidated Financial Statements, IFRS 12 - Disclosure of Interests in Other Entities and IAS 28 - Investments in Associates and Joint Ventures: Investment Entities: Applying the Consolidation Exception New standard IFRS 14 - Regulatory Deferral Accounts Possible impact on financial statements impact* impact* impact* no impact expected no impact expected no impact expected no impact expected no impact expected * At the time of the initial implementation, the impact of the new standards will depend on specific facts and circumstances relating to the changes. The Group plans to finalize the analysis of the impact of the new standards IFRS 9 and IFRS 15 at the latest by The impact of the new IFRS 16 will result in the recognition in the consolidated statement of financial position the Group as a lessee under rent, tenancy, use and lease, which until the first application of the standard is not qualified as a finance lease. The Group plans to finalize the analysis of the impact of the standard IFRS 16 at the latest by CONSOLIDATED FINANCIAL STATEMENTS FOR THE YEAR EXPLANATORY NOTES TO THE CONSOLIDATED FINANCIAL STATEMENTS 37
65 (PLN million) Functional currency and presentation currency of financial statements and methods applied to translation of financial data for consolidation purposes The functional currency of the Parent Company and presentation currency of the foregoing consolidated financial statements is Polish Złoty (PLN). The data in the consolidated financial statements is presented in PLN million, unless is stated differently. Translation in to PLN of financial statements of foreign entities, for consolidation purposes: particular assets and liabilities at spot exchange rate as at the end of the reporting period, items in the statement of profit or loss and other comprehensive income and the statement of cash flows are translated at the average exchange rate. Foreign exchange differences resulting from the above recalculations are recognized in equity as foreign exchange differences on subsidiaries from consolidation. CURRENCY Average exchange rate for the reporting period Exchange rate as at the end of the reporting period /12/ /12/2014 EUR/PLN USD/PLN CZK/PLN CAD/PLN Description of significant accounting principles Transactions in foreign currency The Group recognizes exchange differences arising on the settlement and valuation of monetary items or on translating monetary items at rates different from those at which they were translated on initial recognition in profit or loss of the period in which they arise Principles of consolidation The consolidated financial statements of the Group include assets, liabilities, equity, income, expenses and cash flows of the Parent Company and its subsidiaries that are presented as those of a single economic entity and are prepared as at the same reporting period as separate financial statements of the Parent Company and using uniform accounting principles in relation to similar transactions and other events in similar circumstances. The subsidiaries are consolidated using full consolidation method and joint operations by recognition of respective share in assets, liabilities, revenues and cost. The joint ventures as well as investments in associates are accounted for under equity method. The Group's share in profit or loss of the investee is recognized in the Group's profit or loss as other operating activity. For investments in subsidiaries - non-controlling interests shall be presented in the consolidated statement of financial position as non-controlling interest, separately from the equity of the owners of the Parent Company. For investments in associates - the Group has a significant influence if it holds, directly or indirectly (i.e. through subsidiaries), from 20% to 49% of the voting rights of an entity, unless it can be clearly stated otherwise Sales revenues Revenues include received or due payments for delivered goods and services, decreased by the amount of any trade discounts, value added tax (VAT), excise tax and fuel charges. Revenues from the sale are adjusted for profits or losses from settlement of cash flows hedging instruments related to the above mentioned revenues Costs Cost of sales include costs of finished goods, merchandise, services and raw materials sold and adjustments related to inventories written down to net realizable value. Costs are adjusted for profits or losses from settlement of cash flow hedging instruments related to the above mentioned costs. Distribution expenses include selling brokerage expenses, trading expenses, advertising and promotion expenses as well as distribution expenses. Administrative expenses include expenses relating to management and administration of the Group as a whole Income tax expenses (tax expense) Income tax expenses (tax expense) include of current tax and deferred tax. Current tax expense is determined in accordance with the relevant tax law based on the taxable profit for a given period and is recognized as a liability, in the amount which has not been paid or receivable, if the amount of the current and prior periods income tax paid exceeds the amount due the excess is recognized. Deferred tax assets and liabilities are offset on the level of separate statements of ORLEN Group entities Property, plant and equipment Property, plant and equipment include both fixed assets (assets that are in the condition necessary for them to be capable of operating in the manner intended by management) as well as construction in progress (assets that are in the course of construction or development necessary for them to be capable of operating in the manner intended by management). Property, plant and equipment are initially measured at cost, including grants related to assets. The cost of an item of property, plant and equipment comprises its purchase price, including any costs directly attributable to bringing the asset into use. The cost of an item of property, plant and equipment also includes the initial estimate of the costs of dismantling and removing the item and restoring the site on which it is located, the obligation for which is connected with acquisition or construction of an item of property, plant and equipment. Property, plant and equipment are stated in the statement of financial position prepared at the end of the reporting period at the net book value i.e. the amount at which an asset is initially recognized (cost) less accumulated depreciation and any accumulated impairment losses, as well as received grants for assets. Fixed assets are depreciated with straight-line method and in justified cases units of production method of depreciation (catalysts, assets arising from development and extraction of mineral resources). CONSOLIDATED FINANCIAL STATEMENTS FOR THE YEAR EXPLANATORY NOTES TO THE CONSOLIDATED FINANCIAL STATEMENTS 38
66 (PLN million) Each part of an item of property, plant and equipment with a cost that is significant in relation to the total cost of the item is depreciated separately over the period reflecting its useful lives. The following standard useful lives are used for property, plant and equipment: Buildings and constructions years Machinery and equipment 4-35 years Vehicles and other 2-20 years The method of depreciation, residual value and useful life of an asset are reviewed at least at the end of each year. When it is necessary adjustments of depreciation are carried out in subsequent periods (prospectively). The costs of significant repairs and regular maintenance programs are recognized as property, plant and equipment and depreciated in accordance with their useful lives. The costs of current maintenance of property, plant and equipment are changed profit or loss in the period in which they are incurred. Property, plant and equipment is tested for impairment, when there are indicators or events that may imply that the carrying amount of those assets may not be recoverable. Recognition and reversal of impairment allowances of property, plant and equipment is recognized in other operating activities Exploration and extraction of mineral resources Within the framework of exploration and extraction of mineral resources, the following classification of stage was made: Stage of exploration and assessment of mineral resources include: - Acquisition of rights to explore and extract, exploration and recognition of resources are recognized according to the successful efforts method, - expenditures for exploratory and recognition drillings and other expenditures (including acquisition of seismic data, their processing, interpretation of geological and geophysical data), - other expenditures which are directly attributable to the phase of exploration and recognition and are subject for capitalization. If the direct attribution is not possible, other costs are recognized in profit or loss when incurred. The Group shall review annually expenditures incurred in the stage of exploration and recognition of mineral resources in order to confirm the intention of further work. If the work of the exploration and recognition is unsuccessful, the cost previously recognized as an asset are recognized as cost of a current period. Expenditure incurred in the exploration and recognition of resources (including unsuccessful drillings) are transferred from assets related to exploration and evaluation of mineral resources and are recognized as assets related to planning and extraction of mineral resources within property, plant and equipment at the moment of the conclusion of their technical feasibility and economic viability of mining. Stage of site planning and of extraction of mineral resources Expenditures incurred for mineral resource sites planning and extraction of resources are capitalized and amortised in line with general principles for property, plant and equipment and borrowing costs. Depreciation of assets related to exploration and extraction of mineral resources recognized by applying unit of production method that means proportionally to the forecast amount of extraction of mineral resources. Similarly, property, plant and equipment included in the extractive infrastructure are depreciated by unit of production method based on recognition as cost the depreciation amount per unit of extracted mineral resources. In case of significant change in estimated mineral resources, at the reporting date potential impairment allowances are recognized or reversed. In case of performance of exploratory drillings on already extracted resource, the Group analyses, if costs incurred enable rising new boreholes expenditures are recognized in non-current assets at the date of put into use. If despite the expenditures, new boreholes do not rise, expenditures are recognized in costs of the current period Intangible assets An intangible asset shall be measured initially at acquisition or production cost and shall be presented in the financial statements in its net carrying amount, including grants related to assets. Intangible assets with the finite useful life are amortised using straight-line method. Amortization shall begin when the asset is available for use, i.e. when it is in the location and condition necessary for it to be capable of operating in the manner intended by management. The asset shall be amortised over the period reflecting its estimated useful live. Standard useful lives of intangible assets are from 2 to 15 years for concessions, licenses, patents and similar and from 2 to 10 years for software. The amortization method and useful life of intangible asset item are verified at least at the end of each year. When necessary, the adjustments to amortization expense are accounted for in the future periods (prospectively). Intangible assets with an indefinite useful life shall not be amortised. Their value is decreased by the eventual impairment allowances. Additionally, the useful life of an intangible asset that is not being amortised shall be reviewed each period to determine whether events and circumstances continue to support an indefinite useful life assessment for that asset. Recognition and reversal of impairment allowances on intangible assets is recognized in other operating activities Goodwill Goodwill acquired in a business combination shall, from the acquisition date, be allocated to each of the acquirer's cash-generating units, (CGU), that is expected to benefit from the synergies of the combination, irrespective of whether other assets or liabilities of the acquire are assigned to those units or groups of units. The acquirer shall measure goodwill in the amount recognized at the acquisition date less any accumulated impairment allowances. A cash-generating unit to which goodwill has been allocated shall be tested for impairment annually, and whenever there is an indication that the unit may be impaired. An impairment loss recognized for goodwill shall not be reversed in a subsequent period Rights The main item of rights is CO2 emission rights, which are initially recognized as intangible assets, not amortised (assuming the high residual value), but tested for impairment. Granted emission allowances should be presented as intangible assets in correspondence with deferred income at fair value as at the date of registration. Purchased allowances should be presented as intangible assets at purchase price and are not amortised (assuming the high residual value) but tested for impairment. For the estimated CO2 emission during the reporting period, a provision should be created (taxes and charges). CONSOLIDATED FINANCIAL STATEMENTS FOR THE YEAR EXPLANATORY NOTES TO THE CONSOLIDATED FINANCIAL STATEMENTS 39
67 (PLN million) Grants should be recognized on a systematic basis to ensure proportionality with the related costs which the grants are intended to compensate. Outgoing of allowances is recognized using FIFO method (First In, First Out) within the individual types of rights (EUA, ERU, CER). Rights also include rights to so called colourful energy Impairment of property, plant and equipment and intangible assets At the end of the reporting period, the Group assesses whether there are indicators that an asset or cash-generating unit (CGU) may be impaired or any indicators that the previously recognized impairment should be reversed. If any indicator exists, the Group estimates the recoverable amount of asset or CGU by determining the greater of its fair value less costs of disposal or value in use by applying the proper discount rate. Assets that do not generate the independent cash flows are grouped on the lowest level on which cash flows, independent from cash flows from other assets, are generated (CGU). If such case occurs, the recoverable amount is determined on the CGU level, to which the asset belongs Inventories Inventories, including mandatory reserves comprise products, semi-finished products and work in progress, merchandise and materials. Finished goods, semi-finished products and work in progress are measured initially at production cost. Production costs include costs of materials and costs of conversion for the production period. Costs of production also include a systematic allocation of fixed and variable production overheads estimated for normal production level. Finished goods, semi-finished products and work in progress shall be measured at the end of the reporting period at the lower of cost or net realizable value. Outgoings of finished goods, semi-finished products and work in progress are determined based on the weighted average cost of production. Merchandise and materials are measured initially at acquisition cost, while as at the end of the reporting period merchandise and raw materials are measured at the lower of cost or net realizable value. The initial value of inventories is adjusted for profits or losses from settlement of cash flow hedging instruments related to the above mentioned. Outgoings of merchandise and raw materials are determined based on the weighted average acquisition cost. Impairment tests for specific items of inventories are carried out on a current basis during a reporting period. Write-down to net realizable value concerns inventories that are damaged or obsolete and the selling price have fallen. Raw materials held for use in the production are not written down below acquisition or production cost if the products in which they will be incorporated are expected to be sold at or above cost. However, when a decline in the price of materials indicates that the cost of the products exceeds net realizable value, the materials are written down to net realizable value. Recognition and reversal of impairment allowances of inventories is recognized in cost of sales Receivables Receivables, including trade receivables, are recognized initially at a fair value increased by transaction costs and subsequently, at amortised cost using the effective interest method less impairment allowances. Impairment allowances of receivables are based on an individual analysis of the value of held collaterals, and based on the possible compensation of debts, allowances. Recognition and reversal of impairment allowances of receivables are recognized in other operating activity in relation to principal amount and in financial activities in relation to interest for delayed payments Cash and cash equivalents Cash comprises cash on hand and in a bank accounts. Cash equivalents are short-term, highly liquid investments (of initial maturity up to three months), that are readily convertible to known amounts of cash and which are subject to an insignificant risk of change in value. Valuation and outflows of cash and cash equivalents in foreign currencies are based on FIFO (First In First Out) method Equity Share capital The share capital is an equity paid by shareholders and is stated at nominal value in accordance with the Parent Company s of association and the entry in the Commercial Register. Share capital as at 31 December 1996, in accordance with IAS 29, 24 and 25, was revalued based on monthly price indices of consumer goods and services Share premium The share premium is created by the surplus of the issuance value in excess of the nominal value of shares decreased by issuance costs. Capital from issue of shares above their nominal value as at 31 December 1996, in accordance with IAS 29, 24 and 25, was revalued based on monthly price indices of consumer goods and services Hedging reserve The hedging reserve relates to valuation and settlement of hedging instruments that meet the criteria of cash flow hedge accounting. The Group applies cash flow hedge accounting to hedge commodity risk, exchange rate risk and interest rate risk. Changes in fair value, which are an ineffective part of the hedge relationship, are recognized in profit or loss Foreign exchange differences on subsidiaries from consolidation Foreign exchange differences on subsidiaries from consolidation result mainly from translation of the financial statements of the foreign companies into PLN under consolidation procedures Retained earnings Retained earnings include: - reserve capital created and used in accordance with the Commercial Companies Code, - actuarial gains and losses from post-employment benefits, - the current reporting period profit/loss, - other capitals created and used according to the rules prescribed by law. CONSOLIDATED FINANCIAL STATEMENTS FOR THE YEAR EXPLANATORY NOTES TO THE CONSOLIDATED FINANCIAL STATEMENTS 40
68 (PLN million) Liabilities Liabilities, including trade liabilities, are initially measured at fair value, increased by, in the case of financial liability not qualified as those measured at fair value through profit or loss, transaction cost and subsequently, at amortised cost using the effective interest rate method Provisions The amount recognized as a provision is the best estimate of the expenditure required to settle the present obligation at the end of the reporting period. The provisions are reviewed on a regular basis during reporting period and adjusted to reflect the current best estimate Environmental provision The Group creates provisions for future liabilities due to reclamation of contaminated land or water or elimination of harmful substances if there is such a legal or constructive obligation. Environmental provision for reclamation is periodically reviewed on the basis of contaminated assessment Jubilee bonuses and post-employment benefits Under the remuneration plans employees of the Group are entitled to jubilee bonuses, paid to employees after an elapse of a defined number of years in service as well as retirement and pension benefits, paid once at retirement or pension. The amount of retirement and pension benefits as well as jubilee bonuses depends on the number of years in service and an employee s average remuneration. The jubilee bonuses are other long-term employee benefits, whereas retirement and pension benefits are classified as postemployment defined benefit plans. Provisions are determined by an independent actuary and revalued if there are any indications impacting their value, taking into account the staff turnover and planned growth of wages. Actuarial gains and losses from post-employment benefits are recognized in components of other comprehensive income and from other employment benefits are recognized in profit or loss CO 2 emissions, energy certificates The main item is the estimated CO2 emissions costs during the reporting period for which the Group recognizes provision in operating activity costs (taxes and charges). Provision is recognized based on the value of allowances recognized in the statement of financial position, taking into account the principle of FIFO. In case of a shortage of allowances, the provision is created based on the purchase price of allowance concluded in forward contracts or market quotations at the reporting date Other provisions Other provisions include mainly provisions for legal proceedings and are recognized after consideration of all available information, including the opinions of independent experts. The Group recognizes provisions if at the end of the reporting period the Group is an obligation arising from past events that can be reliably estimated and it is probable that fulfilment of this obligation will cause an outflow of resources embodying economic benefits. If it is more likely that no obligation exists at the end of the reporting period, the Group discloses a contingent liability, unless the possibility of an outflow of resources embodying economic benefits is remote Government grants Government grants are transfers of resources to the Group by the government, government agencies and similar bodies in return for past or future compliance with certain conditions. Government grants are recognized if there is reasonable assurance that the grants will be received and the entity will comply with the conditions attaching to them. Grants for cost position (e.g. the cost of CO 2 emissions) are recognized as a reduction of costs as they are incurred. Surplus of received grants over the value of the relevant costs are recognized in other operating income. Government grants related to assets are recognized as a decrease of a carrying amount of an asset and as a revenue over the useful life of the amortised asset through the decreased depreciation and amortisation charges Consolidated statement of cash flows The Group has chosen the presentation within the statement of cash flows and applies the following rules: - cash flows from operating activities using the indirect method, - the components of cash and cash equivalents in the consolidated statement of cash flows and consolidated statement of financial position are the same, - dividends received are presented in cash flows from investing activities, - dividends paid to shareholders of the parent company and non-controlling interest are presented in cash flows from financing activities, - interest and commissions paid on bank loans and borrowings received, debt securities issued, finance leases are presented in cash flows from financing activities, other interest paid is presented in cash flows from operating activities, - inflows and outflows from the settlement of derivative financial instruments, which are not recognized as a hedging position are presented in investing activities Financial instruments Measurement of financial assets and liabilities At initial recognition, the Group measures financial assets and liabilities at their fair value plus, in the case of a financial asset or a financial liability not at fair value through profit or loss (i.e. held for trading), transaction costs that are directly attributable to the acquisition or issue of the financial asset or financial liability. At the end of the reporting period, the Group measures item of financial assets and liabilities at amortised cost using effective interest rate method, except for derivatives, which are measured at fair value. Gains and losses resulting from changes in fair value of derivative instruments, for which hedge accounting is not applicable, are recognized in the current year profit or loss. CONSOLIDATED FINANCIAL STATEMENTS FOR THE YEAR EXPLANATORY NOTES TO THE CONSOLIDATED FINANCIAL STATEMENTS 41
69 (PLN million) Hedge accounting Derivatives designated as hedging instruments whose cash flows are expected to offset changes in the cash flows of a hedged item are accounted for in accordance with the cash flow hedge accounting. The Group assess effectiveness of cash flow hedge at the inception of the hedge and later, at minimum, at each reporting date. In case of cash flow hedge accounting, the Group recognizes in other comprehensive income part of profits and losses connected with the effective part of the hedge, whereas profits or losses connected with the ineffective part - under profit or loss. The Group uses statistical methods, in particular regression analysis, to assess effectiveness of the hedge. If a hedge of a forecast transaction subsequently results in the recognition of a financial asset or a financial liability, the associated gains or losses that were recognized in other comprehensive income are reclassified to profit or loss in the same period or periods during which the asset acquired, or liability assumed, affects profit or loss. However, if the Group expects that all or a portion of a loss recognized in other comprehensive income will not be recovered in one or more future periods, it reclassifies the amount that is not expected to be recovered to profit or loss. If a hedge of a forecast transaction subsequently results in the recognition of a non-financial asset or a non-financial liability, or a forecast transaction for a non-financial asset or non-financial liability becomes a firm commitment for which fair value hedge accounting is applied, the Group removes the associated gains and losses that were recognized in the other comprehensive income and includes them in the initial cost or other carrying amount of the asset or liability. If a hedge of a forecast transaction results in the recognition of revenue from sales of products, merchandise, materials or services, the Group removes the associated gains or losses that were recognized in the other comprehensive income and adjusts these revenues Fair value measurement The Group maximizes the use of relevant observable inputs and minimizes the use of unobservable inputs to meet the objective of fair value measurement, which is to estimate the price at which an orderly transaction to transfer the liability or equity instrument would take place between market participants as at the measurement date under current market conditions. The Group measures derivative instruments at fair value using valuation models for financial instruments based on generally available exchange rates, interest rates, forward and volatility curves, for currencies and commodities quoted on active markets. The fair value of derivatives is based on discounted future flows related to contracted transactions as the difference between term price and transaction price. Forward exchange rates are not modelled as a separate risk factor, but derives from the spot rate and the respective forward interest rate for foreign currency in relation to PLN. Derivative instruments are presented as assets, when their valuation is positive and as liabilities, when their valuation is negative Lease A lease is an agreement whereby a lessor conveys to the lessee in return for a payment or series of payments the right to use an asset for an agreed period of time. Assets used under the finance lease, that is under agreement which transfers substantially all the risks and rewards incidental to ownership of an asset to the lessee, are recognized as assets of the lessee. Assets used under the operating lease, that is under the agreement that does not transfer substantially all the risks and rewards incidental to ownership of an asset to the lessee, are recognized as assets of the lessor. Determining whether the transfer of risks and rewards exists depends on the assessment of essence of the economic substance of the transaction Contingent assets and liabilities The Group discloses at the end of reporting period information on contingent assets if the inflow of economic benefits is practically certain. If it is practicable the Group estimates the financial impact of contingent assets valuing them according to the principles of valuation provisions. The Group discloses at the end of reporting period information on contingent liabilities if the outflow of economic benefits is probable, unless the possibility of outflow of economic benefits is remote SIGNIFICANT VALUES BASED ON PROFESSIONAL JUDGEMENT AND ESTIMATES The preparation of consolidated financial statements in accordance with IFRSs requires that the Management Board makes expert estimates and assumptions that affect the presented amounts of assets, liabilities and equity, revenues and expenses. The estimates and related assumptions are based on historical expertise and other factors regarded as reliable in given circumstances and their effects provide grounds for professional judgment of the carrying amount of assets and liabilities which is not based directly on any other factors. In the matters of considerable weight, the Management Board might base its judgments, estimates or assumptions on opinions of independent experts. The judgments, estimates and related assumptions are verified on a regular basis Professional judgements Expenditures for exploration and evaluation of mineral resources Application of the Group s accounting policy for expenditures for exploration and evaluation of mineral resources requires an assessment, whether future economic benefits resulting from extraction or sale are possible or if indications allowing to estimate the resources does not yet exist. When estimating the resources, the Group assesses future events and circumstances, including the assessment whether the extraction will be economically feasible. Financial instruments The Management Board assesses the classification of financial instruments, nature and extent of risks related to financial instruments and application of the cash flow hedge accounting. The financial instruments are classified into different categories depending on the purpose of the purchase and nature of acquired assets. Additional information is presented in note 8.4. CONSOLIDATED FINANCIAL STATEMENTS FOR THE YEAR EXPLANATORY NOTES TO THE CONSOLIDATED FINANCIAL STATEMENTS 42
70 (PLN million) Investments in subsidiaries and jointly controlled entities The Group, regardless of the nature of its involvement in the entity (the entity in which it invested) defines its status by assessment, whether it controls the entity in which the investment was made, and assess whether it has a joint control in a joint venture, after consideration of all the facts and circumstances. Additional information is presented in note Estimates Exploration and evaluation of mineral resources The Group estimates resources based on interpretation of available geological data and verifies then on a the current basis, based on further exploration and recognition wells, trial exploitation, actual extraction (production) and economic factors such as: hydrocarbons prices, contractual terms or investment plans. At the end of each reporting period the Group analyses cost of removal of wells and supporting infrastructure. Estimated useful lives of property, plant and equipment and intangible assets As described in and the Group verifies useful lives of property, plant and equipment and intangible assets at least once at year end. Should the economic useful lives of properties, plant and equipment and intangible assets from 2014 be applied in 2015, the depreciation expense would not change significantly. Impairment of property, plant and equipment and intangible assets The Management Board assesses whether there is any indicator for impairment of an asset or cash generating unit. If there is an impairment, the estimation of recoverable amount of an asset is made. Additional information, including the sensitivity analysis of value in use and description of assumptions used, is presented in notes 8.2.1, 8.2.2, Net realizable values from sale of inventories The inventory allowances required estimation of the net realizable value based on the most recent sales prices at the moment of estimation. Additional information is presented in note Impairment of trade and other receivables The Management Board assesses whether there is any indicator for impairment of trade and other receivables taking into account the adopted internal procedures as individual assessed of each customer with regard to credit risk. Additional information is presented in note Contingent assets On the basis of the insurance policies held the Group estimates the value of the compensation related to accident on installation for ethylene production in Unipetrol Group. Additional information is presented in note INFORMATION CONCERNING SIGNIFICANT PROCEEDINGS IN FRONT OF COURT, BODY APPROPRIATE FOR ARBITRATION PROCEEDINGS OR IN FRONT OF PUBLIC ADMINISTRATION BODIES As at 31 December 2015 the ORLEN Group entities were parties in the following significant proceedings in front of court, body appropriate for arbitration proceedings or in front of public administration bodies: Proceedings in which the ORLEN Group entities act as the defendant Proceedings with the total value exceeding 10% of the Issuer s equity Risk connected with the disposal of assets and liabilities related to purchase of Unipetrol shares The claim regarding the payment of compensation for losses related among others, to alleged unfair competition of PKN ORLEN included in Agrofert Holding a.s. (Agrofert) claim and alleged illegal violation of reputation of Agrofert in relation to purchase by PKN ORLEN of UNIPETROL a.s. shares. On 21 October 2010 the Court of Arbitration in Prague dismissed the entire claim of Agrofert against PKN ORLEN regarding the payment of PLN 3,069 million translated using the exchange rate as at 31 December 2015 (representing CZK 19,464 million) with interest and obliged Agrofert to cover the cost of proceedings born by PKN ORLEN. On 3 October 2011 PKN ORLEN received from the common court in Prague (Czech Republic) Agrofert s claim which repealed the sentence of the Arbitration Court attached to the Economic Chamber of the Czech Republic and Agricultural Chamber of the Czech Republic in Prague issued on 21 October The complaint was dismissed by the court in Prague with the ruling of 24 January On 7 April 2014 Agrofert appealed the above decision. On 7 April 2015 the court of appeals dismissed the appeal of Agrofert and therefore confirms the earlier judgment of the court of 24 January 2014 dismissing Agrofert s claim which overruled the sentence of the Arbitration Court attached to the Economic Chamber of the Czech Republic and Agricultural Chamber of the Czech Republic in Prague of 21 October On 4 September 2015 Agrofert appealed to the Supreme Court against the judgment of the court dismissing the appeal. The appeal proceedings are pending. In the opinion of PKN ORLEN, the decision included in the judgment of the Arbitration Court dated 21 October 2010, in the judgment of the common court in Prague dated 24 January 2014 and in the judgment of the court of appeals dated 7 April 2015 are correct and the company will take all necessary means to retain the judgment in force Other significant proceedings with the total value not exceeding 10% of the Issuer s equity Tax proceedings in ORLEN Południe S.A. (previously Rafineria Trzebinia S.A.) On 14 May 2014 and 20 May 2014 the company received the decisions of the Head of the Customs Office in Kraków determining excise tax liabilities for the months: May - August 2004 in the amount of PLN 132 million. Rafineria Trzebinia S.A. paid the entire liability with interest. At the same time, provisions recognized for this purpose in prior years were used. Rafineria Trzebnia S.A. appealed to the Voivodship Administrative Court (VAC) in Kraków the decisions of tax liability for the months: May August On 26 February 2015 the VAC in Kraków announced a judgment dismissing the company s claim. On 5 May 2015 the company submitted to the Supreme Administrative Court in Warsaw annulment claims against the judgement of the VAC, that were not recognized until the date of approval of the foregoing financial statements. CONSOLIDATED FINANCIAL STATEMENTS FOR THE YEAR EXPLANATORY NOTES TO THE CONSOLIDATED FINANCIAL STATEMENTS 43
71 (PLN million) In view of the issue by the European Court of Justice in Luxembourg judgement in a similar case the company has submitted applications for renewal of administrative proceedings. Director of the Customs Chamber in Kraków by a decision issued on 23 July 2015 refused to reopen the proceedings due to the ongoing proceedings before the Supreme Administrative Court in the cases final decisions for May - August. Since the decision of the Director of the Customs Chamber in Kraków refusing to reopen the proceedings the company filed an appeal, that was dismissed. The company filed complaints against these decisions on 16 November 2015, which the Voivodship Administrative Court in Kraków dismissed on 11 February Until the date of approval of the foregoing consolidated financial statements, the company has not received the written reasons for the judgment. Power transfer fee in settlements with ENERGA OPERATOR S.A. (legal successor of Zakład Energetyczny Płock S.A.) Court proceeding concerning the settlement of a disputed system fee of PKN ORLEN with ENERGA OPERATOR S.A. for the period from 5 July 2001 to 30 June ENERGA OPERATOR S.A. claims from PKN ORLEN payment of PLN 46 million plus statutory interest. During the retrial, an opinion was prepared by an expert witness for the variant damages calculation. The District Court in Warsaw (as the initial court) by its judgment from 27 October 2014 ordered PKN ORLEN to pay to ENERGA - OPERATOR S.A. the amount of PLN 46 million, together with statutory interest from 30 June 2004 to the date of payment. This judgment is not binding. PKN ORLEN filed an appeal against this judgment. On 12 November 2015 the first hearing before the Court of Appeal was held. The consecutive hearing date is expected to be announced. On 29 June 2015 PKN ORLEN received consecutive claim on this case, in which ENERGA-OPERATOR S.A. requests approximately PLN 13.3 million in addition. The case is pending in front of the District Court in Łódź. On 10 July 2015 a response to the lawsuit was filed, which questioned the claim as unfounded. On 22 December 2015 the District Court in Łódź issued a judgement, which overruled the request of ENERGA-OPERATOR S.A. that PKN ORLEN is ordered to pay PLN 13 million and adjudged the return of proceeding s expenses by ENERGA-OPERATOR S.A to PKN ORLEN. On 29 January 2016 ENERGA- OPERATOR S.A. appealed against the judgment of the District Court in Łódź. I.P.-95 s.r.o. compensation claim against UNIPETROL RPA s.r.o. On 23 May 2012, UNIPETROL RPA s.r.o. received from the District Court in Ostrava a claim brought by I.P.-95 s.r.o. for compensation related to the filing by UNIPETROL RPA s.r.o. a motion for bankruptcy of the company I.P.-95 s.r.o. in November The total amount of the claim is approximately PLN 282 million, translated using the exchange rate as at 31 December 2015 (representing CZK 1,789 million). UNIPETROL RPA s.r.o. is one of 8 defendants against which the claim was brought. According to UNIPETROL RPA s.r.o the claim is without merit. The court in Ostrava shall give further procedural issues. Claim of OBR S.A. for compensation On 5 September 2014, the company OBR S.A. filed an action against PKN ORLEN with the District Court in Łódź for a claim for payment in respect of an alleged breach by PKN ORLEN of patent rights: The technique of the separation of hydrodesulfurization products of heavy residue after extractive distillation of crude oil. The amount of the claim in the lawsuit has been estimated by the OBR S.A. of approximately PLN 83 million. The claim covers the adjudged sum of money from PKN ORLEN for the OBR S.A. in the amount corresponding to the market value of the license fee for the use of the solution under the above patent and adjudge the obligation to repay the benefits derived from the use of this solution. On 16 October 2014, PKN ORLEN responded to the lawsuit. The value of the dispute was referred to by the plaintiff in a procedural document from 11 December 2014 in the amount of PLN 247 million. By the court order from 21 May 2015 the parties were directed to mediation. Mediation is ongoing. In the opinion of PKN ORLEN the claim of patent infringement is without merit Court proceedings in which the ORLEN Group entities act as a plaintiff Compensations due to damages suffered by ORLEN Południe S.A (previously Rafineria Trzebinia S.A.) ORLEN Południe S.A. acts as an auxiliary prosecutor in proceedings started in 2010 concerning abuses associated with the realization of an investment - installation for the esterification of biodiesel oils, in which Rafineria Trzebinia S.A. claims to have incurred a loss of approximately PLN 79 million. The company filed a motion requesting to oblige the defendants to compensate the incurred damages. Criminal proceedings concerning the accused who acted against the company s interest are ongoing. Further hearings is held during which one of the accused filed an explanations. The court set the next date of hearing on 31 March 2016 to continue the interrogation of the accused. Proceeding of ORLEN Lietuva for compensation in respect of an accident at the Terminal in Butingė AB ORLEN Lietuva is a plaintiff in a court proceeding against RESORT MARITIME S.A., The London Steamship Owners Mutual Insurance Association Limited, Sigma Tankers Inc., Cardiff Maritime Inc., Heidenreich Marine, Heidenreich Maritime Inc. and Heidmar Inc. regarding compensation payment for damage caused by a collision of a tanker ship into a terminal buoy in Butinge Terminal on 29 December The proceedings were initiated in December The total compensation claim amounts to approximately PLN 74 million, translated using the exchange rate as at 31 December 2015 (representing approximately EUR million). On October 2014 the parties agreed to change the jurisdiction to English courts. The company expects the next hearing date to be announced. Tax proceedings in UNIPETROL RPA UNIPETROL RPA s.r.o., acting as a legal successor of CHEMOPETROL a.s. acted in 2010 to the tax office for a refund of taxes paid for the year 2005 by CHEMOPETROL a.s.. The claim concerns unused investment relief attributable to CHEMOPETROL a.s.. The value of the claim amounts to approximately PLN 52 million, translated using the exchange rate as at 31 December 2015 (representing approximately CZK 325 million). The case was examined several times by the tax authorities and courts in the course of instances of appeal. On 14 October 2015 the Czech supreme administrative court after recognizing the annulment claim of UNIPETROL RPA s.r.o overruled the judgment of the Court in Usti by the Elbe River of 25 February 2015 and decided to refer the case to the same Court for its reconsideration. A decision is expected by the Court in Usti by the Elbe River. Arbitration proceedings against Basell Europe Holdings B.V. On 20 December 2012 PKN ORLEN sent an arbitration request to Basell Europe Holdings B.V. regarding an ad hoc proceeding before the Court of Arbitration in London on compensation relating to Joint Venture Agreement signed in 2002 between PKN ORLEN and Basell Europe Holdings B.V. The claims follow from the use by Basell Sales & Marketing Company so-called Cash Discounts which effectively led to a lower product price payable to Basell ORLEN Polyolefins Sp. z o.o. On 27 February 2014 PKN ORLEN submitted its statement on this case, according to which, inter alia, it requests payments from Basell Europe Holdings B.V. to Basell ORLEN Polyolefins Sp. z o.o. in the amount of approximately PLN 128 million, translated using the exchange rate as at 31 CONSOLIDATED FINANCIAL STATEMENTS FOR THE YEAR EXPLANATORY NOTES TO THE CONSOLIDATED FINANCIAL STATEMENTS 44
72 (PLN million) December 2015 (representing approximately EUR 30 million) plus interest, or alternatively, from Basell Europe Holdings B.V. to PKN ORLEN the amount of approximately PLN 57 million, provided that the amounts may be adjusted during arbitration proceedings. On 10 April 2014 PKN ORLEN submitted an application for suspension of the arbitration proceedings until 1 November Basell Europe Holdings B.V. accepted this request. On 23 April 2014 the parties received the Tribunal s decision regarding the suspension of the proceeding until 1 November On 1 November 2014, the arbitration proceedings were resumed. On March 2015 an evidentiary hearing was held in London in which the parties summarized their case positions and some witnesses and experts were interviewed. On 27 March 2015, the Court of Arbitration issued a procedural ordinance which established the schedule for further proceedings, including the order of submission of further pleadings by the parties. On 29 May 2015 the two parties submitted letters in which referred to the position of the opposing party in terms of summaries of the case. Additionally, the parties requested expenditures and costs incurred in arbitration proceedings. Further proceedings are not envisaged. Parties awaiting a judgment. The dispute between ORLEN Lietuva and Lietuvos Geležinkeliai On 31 December 2014, ORLEN Lietuva filed a motion for arbitration against the company Lietuvos Gelezinkeliai ( LG ) in the court of arbitration in Vilnius. Currently in this proceeding ORLEN Lietuva calls for the conversion of tariffs for rail transport in line with the contract with LG. Consideration of the request of ORLEN Lietuva would lead to savings for the company (compensation) in the amount estimated as at 31 December 2015 not lower than PLN 162 million translated using the exchange rate as at 31 December 2015 (representing EUR 38 million) due to breach of contract of rail transport by LG by the use of excessive rates. The amount of the claim will be updated in accordance with the activity on the base of the contract. Simultaneously, by 31 December 2015, 4 court proceedings were initiated in which LG demands from ORLEN Lietuva a payment of approximately PLN 77 million translated using the exchange rate as at 31 December 2015 (representing approximately EUR 18 million) from fees for rail transport. Three of the above described proceedings were combined and then the court decided that the combined case will not be considered by the state court since the priority of the arbitral tribunal. Proceedings in the fourth case was suspended by the court until the court of arbitration will decide on the claim of ORLEN Lietuva. LG appealed against the above decisions of state courts. The hearing date on appeal is expected to be announced. CONSOLIDATED FINANCIAL STATEMENTS FOR THE YEAR EXPLANATORY NOTES TO THE CONSOLIDATED FINANCIAL STATEMENTS 45
73 (PLN million) 9. ORLEN GROUP STRUCTURE AND JOINT ARRANGEMENTS 9.1. Organization of the Group 9.2. Subsidiaries 9.3. Investments in joint arrangements 9.1. ORGANIZATION OF THE GROUP PKN ORLEN as the Parent Company is a multi-segment entity, appropriately allocated to all operating segments and corporate functions. Name of entity Parent company Share in total voting rights 31/12/ /12/2014 Consolidation method/ Valuation method Website Downstream Segment ORLEN Lietuva Group AB ORLEN Lietuva PKN ORLEN S.A. 100% 100% full UAB Mazeikiu Naftos prekybos namai AB ORLEN Lietuva 100% 100% full OU ORLEN Eesti UAB Mezeikiu naftos prekybos namai 100% 100% full SIA ORLEN Latvija UAB Mezeikiu naftos prekybos namai 100% 100% full UAB Emas AB ORLEN Lietuva 100% 100% full UAB Paslaugos TAU AB ORLEN Lietuva - 100% full ANWIL Group Anwil S.A. PKN ORLEN S.A. 100% 100% full Spolana a.s. ANWIL S.A. 100% 100% full RemWil Sp. z o.o. 3 ANWIL S.A % full Przedsiebiorstwo Produkcyjno-Handlowo-Usługowe Pro-Lab Sp. z o.o. (in liquidation) ANWIL S.A % 99.32% full Przedsiębiorstwo Usług technicznych Wircom Sp. z o.o. ANWIL S.A full Basell Orlen Polyolefins Group Basell ORLEN Polyolefins Sp. z o.o. PKN ORLEN S.A. 50% 50% equity method Basell ORLEN Polyolefins Sprzedaż Sp. z o.o. Basell ORLEN Polyolefins Sp. z.o.o. 100% 100% equity method UNIPETROL Group PARAMO, a.s. UNIPETROL, a.s. 100% 100% full MOGUL SLOVAKIA, s.r.o. PARAMO, a.s. 100% 100% full Paramo Oil, s.r.o. PARAMO, a.s. 100% 100% full UNIPETROL Austria HmbH (in liquidation) UNIPETROL, a.s. 100% 100% full UNIPETROL RPA, s.r.o. UNIPETROL, a.s. 100% 100% full UNIPETROL Slovensko, s.r.o. UNIPETROL RPA, s.r.o. 100% 100% full UNIPETROL Deutschland GmbH UNIPETROL RPA, s.r.o. 100% 100% full UNIPETROL RPA Hungary Kft. UNIPETROL RPA, s.r.o. 100% - full CHEMOPETROL, a.s. UNIPETROL RPA, s.r.o. 100% 100% full Polymer Institute Brno s.r.o. UNIPETROL RPA, s.r.o % full UNIPETROL DOPRAVA, s.r.o. UNIPETROL RPA, s.r.o. 100% 100% full PETROTRANS, s.r.o. BENZINA, s.r.o. 100% 100% full UNIPETROL RAFINÉRIE, s.r.o. UNIPETROL, a.s. 100% 100% full ČESKÁ RAFINÉRSKÁ, a.s. UNIPETROL, a.s. 100% 67.56% full* Butadien Kralupy a.s. UNIPETROL, a.s. 51% 51% share in assets and liabilities ORLEN Południe Group ORLEN Południe S.A. PKN ORLEN S.A. 100% - Fabryka Parafin Naftowax Sp. z o.o. 1 RAFINERIA TRZEBINIA S.A % full Rafineria Nafty Jedlicze S.A. 1 PKN ORLEN S.A % full Rafineria Trzebinia S.A. 1 PKN ORLEN S.A % full EkoNaft Sp. z o.o. (in liquidation) ORLEN POŁUDNIE S.A. 100% 100% full Energomedia Sp. z o.o. ORLEN POŁUDNIE S.A. 100% 100% full Euronaft Trzebinia Sp. z o.o. ORLEN POŁUDNIE S.A. 100% 100% full RAF- Służba Ratownicza Sp. z o.o. RAFINERIA NAFTY JEDLICZE S.A % full RAF-Koltrans Sp. z o.o. RAFINERIA NAFTY JEDLICZE S.A % full Zakładowa Straż Pożarna Sp. z o.o. 1 RAFINERIA TRZEBINIA S.A % full Konsorcjum Olejów Przepracowanych - Organizacja Odzysku S.A. ORLEN Południe S.A. 89% 81% full com.pl ORLEN Oil Group ORLEN Oil Sp. z o.o. PKN ORLEN S.A. 100% 100% full Platinum Oil Sp. z o.o. 2 ORLEN OIL Sp. z o.o % full Orlen Oil Cesko s.r.o. ORLEN OIL Sp. z o.o % full ORLEN Asfalt Group ORLEN Asfalt Sp. z o.o. PKN ORLEN S.A. 100% 100% full ORLEN Asfalt Ceska Republika s.r.o. ORLEN ASFALT Sp. z o.o. 100% 100% full Inowrocławskie Kopalnie Soli "Solino" S.A. PKN ORLEN S.A. 100% 100% full Kopalnia Soli Lubień Sp. z o.o. PKN ORLEN S.A. 100% 100% full ORLEN Paliwa Sp. z o.o. PKN ORLEN S.A. 100% 100% full ORLEN Petrotank Sp. z o.o. 5 PKN ORLEN S.A % full Ship-Service S.A. PKN ORLEN S.A % 60.86% full Petrolot Sp. z o.o. PKN ORLEN S.A. 100% 100% full ORLEN KolTrans Sp. z o.o. PKN ORLEN S.A % 99.85% full ORLEN Transport S.A. 7 PKN ORLEN S.A. 100% 100% full ORLEN Automatyka Sp. z o.o. 3 PKN ORLEN S.A % full ORLEN Gaz Sp. z o.o. 6 PKN ORLEN S.A % full ORLEN Eko Sp. z o.o. PKN ORLEN S.A. 100% 100% full ORLEN Wir Sp. z o.o. PKN ORLEN S.A % 76.59% full Baltic Power Sp. z o.o. PKN ORLEN S.A. 100% 100% full Baltic Spark Sp. z o.o. 8 PKN ORLEN S.A % full CONSOLIDATED FINANCIAL STATEMENTS FOR THE YEAR ORLEN GROUP STRUCTURE AND JOINT ARRANGEMENTS 46
74 (PLN million) Name of entity Parent company Share in total voting rights Retail Segment 31/12/ /12/2014 Consolidation method/ Valuation method Website BENZINA, s.r.o. UNIPETROL, a.s. 100% 100% full AB Ventus-Nafta PKN ORLEN S.A. 100% 100% full ORLEN Deutschland GmbH PKN ORLEN S.A. 100% 100% full ORLEN Budonaft Sp.z o.o. PKN ORLEN S.A. 100% 100% full ORLEN Centrum Serwisowe Sp. z o.o. PKN ORLEN S.A % 99.33% full Upstream Segment ORLEN Upstream Group ORLEN Upstream Sp. z o.o. PKN ORLEN S.A. 100% 100% full ORLEN Upstream International BV ORLEN Upstream Sp. z o.o. 100% 100% full ORLEN Upstream Canada Ltd. ORLEN Upstream International BV 100% - full Alberta Ltd. ORLEN Upstream Canada Ltd. 100% 100% full OneEx Operations Partnership ORLEN Upstream Canada Ltd. 100% 100% full Kicking Horse Energy Inc. ORLEN Upstream Canada Ltd. 100% - full KCK Operating Company Ltd. Kicking Horse Energy Inc. 100% - full Columbia Natural Resources Canada Ltd. Kicking Horse Energy Inc. 100% - full Kicking Horse Internat. Exploration Ltd. Kicking Horse Energy Inc. 100% - full Pieridae Production GP Ltd Kicking Horse Energy Inc. 50% - equity method NB Ltd Pieridae Production GP Ltd 50% - equity method KCK Atlantic Holdings Ltd. Kicking Horse Energy Inc. 100% - full Pieridae Production LP KCK Atlantic Holdings Ltd. 80% - equity method FX Energy, Inc. ORLEN Upstream Sp. z o.o. 100% - full FX Drilling Company, Inc. FX Energy, Inc. 100% - full FX Producing Company, Inc. FX Energy, Inc. 100% - full Frontier Exploration, Inc. FX Energy, Inc. 100% - full FX Energy Netherlands Partnership C.V. FX Energy, Inc. 100% - full FX Energy Netherlands B.V. FX Energy Netherlands Partnership C.V. 100% - full FX Energy Polska Sp. z o.o. FX Energy Netherlands Partnership C.V. 100% - full TriOilResources Ltd. 4 ORLEN Upstream International BV - 100% full SIA Balin Energy OIEP Co BV - 50% share in assets and liabilities ORLEN International Exploration & Production Company BV ORLEN UPSTREAM Sp. z o.o % full Corporate Functions AB ORLEN Lietuva PKN ORLEN S.A. 100% 100% full ORLEN Administracja Sp. z o.o. PKN ORLEN S.A. 100% 100% full ORLEN Capital AB PKN ORLEN S.A. 100% 100% full ORLEN Centrum Usług Korporacyjnych Sp. z o.o. PKN ORLEN S.A. 100% 100% full ORLEN Finance AB PKN ORLEN S.A. 100% 100% full ORLEN Holding Malta Group ORLEN Holding Malta Ltd. PKN ORLEN S.A. 100% 100% full Orlen Insurance Ltd. ORLEN HOLDING MALTA Ltd. 100% 100% full ORLEN Ochrona Group ORLEN Ochrona Sp. z o.o. PKN ORLEN S.A. 100% 100% full UAB Apsauga ORLEN OCHRONA Sp. z o.o. 100% 100% full ORLEN Serwis S.A. PKN ORLEN S.A. 100% 100% full UNIPETROL Group UNIPETROL, a.s. PKN ORLEN S.A % 62.99% full UNIPETROL RPA, s.r.o. UNIPETROL, a.s. 100% 100% full UNIPETROL SERVICES, s.r.o. UNIPETROL, a.s. 100% 100% full Výzkumný ústav anorganické chemie, a.s. UNIPETROL, a.s. 100% 100% full HC Verva Litvinov, a.s. UNIPETROL RPA, s.r.o % 70.95% full ORLEN Projekt S.A. PKN ORLEN S.A % 99.77% full ORLEN Laboratorium Sp. z o.o. PKN ORLEN S.A % 99.38% full Płocki Park Przemysłowo-Technologiczny Group Płocki Park Przemysłowo-Technologiczny S.A. (PPPT S.A.) PKN ORLEN S.A. 50% 50% equity method Centrum Edukacji Sp. z o.o. PPPT S.A % 69.43% equity method 1) from ORLEN Południe S.A. 2) from ORLEN OIL Sp. z o.o 3) from ORLEN Serwis S.A. 4) from ORLEN Upstream Canada Ltd. 5) from ORLEN Paliwa Sp. z o.o. 6) from ORLEN Paliwa Sp. z o.o. 7) the company was sold 8) from Baltic Power Sp. z o.o. * detailed in note Activity of core companies belonging to ORLEN Group Name of entity Headquarters Principal activity UNIPETROL a.s. (including its own Capital Group) AB ORLEN Lietuva (including its own Capital Group) Anwil S.A (including its own Capital Group) ORLEN Upstream Sp. z o.o. (including its own Capital Group) Czech Republic - Prague Lithuania - Juodeikiai Poland - Włocławek Poland - Warsaw crude oil processing as well as manufacture and distribution of refinery, petrochemical and chemical products crude oil processing, production of refining products and wholesale production of nitrogen fertilizers, plastic and chemicals exploration and recognition of hydrocarbon deposits, extraction of crude oil and natural gas ORLEN Oil Sp. z o.o. Poland - Cracow production, distribution and sale of grease oils, maintenance liquids ORLEN Asfalt Sp. z o.o. Poland - Płock manufacture and sale of road bitumens and specific bitumen products ORLEN Południe S.A. Poland - Trzebinia crude oil processing, production and sale of biofuels, oils ORLEN Paliwa Sp. z o.o. Poland - Płock liquid fuels trade Inowrocławskie Kopalnie Soli "SOLINO" S.A. Poland - Inowrocław storage of crude oil, fuels and gases, extraction and supply of brine CONSOLIDATED FINANCIAL STATEMENTS FOR THE YEAR ORLEN GROUP STRUCTURE AND JOINT ARRANGEMENTS 47
75 (PLN million) STRUCTURED ENTITIES ORLEN Capital AB The company s business is raising funds through the issuance of bonds and other financial instruments for institutional and private investors. ORLEN Capital AB specializes in granting borrowings or loans to Group companies and conduct any other activities related to the financial instruments. On 30 June 2014 ORLEN Capital AB and PKN ORLEN issued Eurobonds with 7-year redemption of approximately of PLN 2,080 million translated using exchange rate as at 30 June 2014 (representing EUR 500 million).the funds obtained by ORLEN Capital through the issue were transferred to PKN ORLEN under the borrowing agreement. PKN ORLEN is the guarantor of the issued bonds by an irrevocable and unconditional guarantee issued to the bondholders of PLN 4,262 million translated using exchange rate as at 31 December 2015 (equivalent of EUR 1 billion). The guarantee was granted for the time of the Eurobond issue, until 30 June ORLEN Finance AB The company s business is to conduct financial services through transactions within the ORLEN Group, including intercompany borrowings and loans, as well as any other financial instruments. As at 31 December 2015 the Group has issued the guarantee to ORLEN Finance of PLN 852 million. Orlen Insurance Ltd. Orlen Insurance is an internal insurance company (i.e. captive), which main purpose is insurance and reinsurance the Group's business, matching insurance to the individual needs of its property and the potential loss of margin SUBSIDARIES Changes in shareholder structure affecting the financial data of the Group Acquisition of shares Acquisition of shares of Česká Rafinérská by Unipetrol In the 1 st quarter of 2014, Unipetrol a.s. acquired from Shell Overseas Investments BV (Shell) 152,701 shares of Česká Rafinérská representing % of this company share capital. The Group recognized a gain on the bargain purchase in other operating income of PLN 180 million, calculated as the difference between the acquired share in equity of Česká Rafinérská of PLN 262 million, and the purchase price of PLN 82 million. As a result of the transaction, Unipetrol s a.s. share in the capital of Česká Rafinérská increased to %. On 3 July 2014 Unipetrol a.s. accepted the offer of an Italian ENI Holding regarding the acquisition of Česká Rafinérská shares, representing % of share capital of the company. On 19 December 2014 Unipetrol a.s received approval from the Czech Antimonopoly Office for conclusion of this transaction, however on 5 January 2015 an organization, among other of the united independent fuel station operators on the Czech market SČS - Unie nezávislých petrolejářů, z.s. filed a complaint to this decision. On 30 March 2015 the Antimonopoly Office dismissed the appeal and declared the decision of 19 December 2014 to be valid. On 30 April 2015 Unipetrol a.s. acquired from ENI 303,301 shares of Česká Rafinérská for the amount of PLN 97 million translated using the exchange rate as at 30 April 2015 (representing EUR 24 million). As the result of the transaction, Unipetrol s a.s. stake in Česká Rafinérská s share capital increased from % to 100%. After settlement of the transaction, Unipetrol a.s. obtained control over Česká Rafinérská and started the full method of consolidation of the company. As a result of the settlement in the 2 nd quarter of 2015, the Group recognized a gain on bargain purchase in other operating income in the amount of PLN 63 million. Carrying amount as at the acquisition day Adjustments to fair value Fair value Non-current assets 338 (92) 246 Current assets (15) Assets (A) (107) Non-current liabilities Current liabilities Liabilities (B) Identifiable net assets at fair value (A-B) % of net acquired assets in fair value 160 Fair value of transferred payment due to acquisition (97) Gain on bargain purchase 63 Acquisition of shares of Kicking Horse Energy Inc. by ORLEN Upstream Canada (a subsidiary of ORLEN Upstream). On 12 October 2015 ORLEN Upstream Canada Ltd. (ORLEN Upstream Canada) signed an agreement to acquire Kicking Horse Energy Inc. (Kicking Horse) domiciled in Calgary, Canada. Kicking Horse is company engaged in the exploration and extraction of oil and natural gas. On 30 November 2015 Kicking Horse shareholders and option holders approved the acquisition of company shares by ORLEN Upstream Canada. On 1 December 2015 ORLEN Group acquired all of the outstanding common shares. The transaction was financed through an increase of equity in ORLEN Upstream Canada (made by ORLEN Upstream Sp. z o.o.) as well as Kicking Horse available lines of credit. CONSOLIDATED FINANCIAL STATEMENTS FOR THE YEAR ORLEN GROUP STRUCTURE AND JOINT ARRANGEMENTS 48
76 (PLN million) The fair value of the identifiable assets and liabilities of Kicking Horse at the acquisition date: Carrying amount as at the acquisition day Adjustments to fair value Fair value Exploration and evaluation of mineral resources assets Assets related to development and extraction of mineral resources Non-current financial assets Trade and other receivables Assets (A) Provision for decommissioning costs of drillings and supporting infrastructure Deferred tax liabilities Other financial liabilities Trade and other liabilities Liabilities (B) Identifiable net assets at fair value (A-B) Fair value of transferred payment due to acquisition adjusted by transaction costs (830) Acquisition of shares of FX Energy Inc. by ORLEN Upstream On 13 October 2015 ORLEN Upstream Sp. z o.o. (ORLEN Upstream) signed an agreement to acquire American company FX Energy, Inc. (FX Energy) domiciled in Salt Lake City, Utah, USA. FX Energy is engaged in the exploration and extraction of oil and natural gas mainly in Poland. As a result, on 31 December 2015 ORLEN Group acquired 100% of the common shares and 100% of preferred shares of FX Energy. The transaction was approved by the Office of Competition and Consumer Protection. Financing of the transaction was provided from own resources of PKN ORLEN as well as available lines of credit. The fair value of the identifiable assets and liabilities of FX Energy at the acquisition date: Carrying amount as at the acquisition day Adjustments to fair value Fair value Exploration and evaluation of mineral resources assets Assets related to development and extraction of mineral resources Other property, plant and equipment 3-3 Cash and cash equivalents Trade and other receivables Assets (A) Provision for decommissioning costs of drillings and supporting infrastructure Deferred tax liabilities Loans Trade and other liabilities Liabilities (B) Identifiable net assets at fair value (A-B) (22) Fair value of transferred payment due to acquisition adjusted by transaction costs (331) In 2014, the main changes in the shareholder structure of the Group, besides the acquisition of shares in Česká Rafinérská as described above, related also to the acquisition of 100% of shares in Birchill Exploration Limited Partnership for the amount of PLN 707 million. The settlement of executed transaction did not influence the consolidated statement of profit or loss and other comprehensive income, because fair value of net assets acquired was equal to price paid Other changes in the structure of the ORLEN Group On 5 January 2015, a merger of Rafineria Trzebinia S.A. and the companies: Rafineria Nafty Jedlicze S.A., Fabryka Parafin Naftowax Sp. z o.o. and Zakładowa Straż Pożarna Sp. z o.o. took place. The company operates under the new name of ORLEN Południe S.A. since 5 January 2015; On 5 January 2015, a merger of ORLEN OIL Sp. z o.o and Platinum Oil Sp. z o.o. took place; On 22 January 2015 acquisition by PKN ORLEN from Anwil S.A. shares of Przedsiębiorstwo Inwestycyjno-Remontowe RemWil Sp. z o.o, domiciled in Włocławek took place; On 20 February 2015 a merger of ORLEN Serwis S.A. with ORLEN Automatyka Sp. z o.o. and Przedsiębiorstwo Inwestycyjno- Remontowe RemWil Sp. z o.o. took place; On 19 March 2015 a merger of Baltic Power and Baltic Spark took place; On 1 June 2015 winding-up proceedings of EkoNaft Sp. z o.o. domiciled in Trzebinia began; On 26 June 2015 winding-up proceedings of ORLEN International Exploration & Production Company BV due to closure of the exploration and extraction project on the Latvian shelf began; On 30 June 2015 the District Court in Rzeszów made an entry of a merger of ORLEN PetroTank Sp. z o.o. and ORLEN Paliwa Sp. z o.o. into a single entity operating under the name ORLEN Paliwa Sp. z o.o. domiciled in Widełka. PKN ORLEN share in the share capital of ORLEN Paliwa Sp. z o.o. (formerly ORLEN PetroTank Sp. z o.o.) remained unchanged at 100%; On 2 July 2015 winding-up procedures of the SIA Balin Energy terminated; CONSOLIDATED FINANCIAL STATEMENTS FOR THE YEAR ORLEN GROUP STRUCTURE AND JOINT ARRANGEMENTS 49
77 (PLN million) On 1 August 2015 winding-up proceedings of Pro-Lab Sp. z o.o. domiciled in Włocławek began; On 1 October 2015 an increase in the share capital of ORLEN Upstream Sp. z o.o, which were fully subscribed by PKN ORLEN in exchange for a cash contribution of PLN 53 million took place. The proceeds from the capital increase will be earmarked for further exploration activity; On 30 October 2015, a merger of ORLEN Gaz Sp. z o.o. and ORLEN Paliwa Sp. z o.o. took place; On 18 November 2015 an increase in the share capital of ORLEN Upstream Sp. z o.o., which were fully subscribed by PKN ORLEN, in exchange for a cash contribution of PLN 1,501 million took place; On 28 December 2015 deletion from the trade registry RAF-SŁUŻBA RATOWNICZA Sp. z o.o. in liquidation on 14 December 2015 took place; On 1 January 2016 a merger of Kicking Horse Energy Inc., KCK Operating Company Ltd., Columbia Natural Resources Canada, Ltd. and Kicking Horse International Exploration Ltd. took place, in the next step merger with ORLEN Upstream Canada; On 1 January 2016 a merger of Benzina and Unipetrol RPA took place and a merger of Mogul Slovakia and Unipetrol Slovensko took place; On 29 February 2016 a merger of ORLEN Serwis S.A. with ORLEN Wir Sp. z o.o. and Przedsiębiorstwo Usług Technicznych Wircom Sp. z o.o. took place. Changes in the Group structure are an element of the ORLEN Group strategy, assuming a focus on core activities and allocating the resulting available capital for development of the Group in the most prospective areas INVESTMENTS IN JOINT ARRANGEMENTS Place of business Principal activity Valuation method joint ventures Bassel ORLEN Polyolefines Sp. z o.o. (BOP) Płocki Park Przemysłowo- Płock production, distribution and sales of poliolefins equity method Technologiczny (PPPT) Płock renting real estate equity method Pieridae Production GP Ltd exploration and extraction of (ORLEN Upstream Group) Calgary minerals equity method joint operations Butadien Kralupy a.s. Kralupy nad Vltavou manufacturing of butadien share in assets and liabilities In 2015 in accordance with IFRS 11 Joint Arrangements the ORLEN Group classified Unipetrol s jointly controlled entity - Butadiene Kralupy, a.s. as joint operations. Additionally, ORLEN Upstream has participated in the following joint operations: participation in a holding founded by ORLEN Upstream, Polskie Górnictwo Naftowe i Gazownictwo (PGNIG), LOTOS Petrobaltic as business parties and as scientific parties University of Science and Technology (Akademia Górniczo-Hutnicza), Institue of Oil and Gas (Instytut Nafty i Gazu), Gdansk University of Technology, Warsaw University of Technology (Blue Gas Polish Shale Gas program). The program aims to manufacture and commercialize the technology and gain knowledge for the extraction of shale gas in Poland. The Company participated in 6 projects carried out in ORLEN Upstream s total contribution to the implementation of these projects amounts to PLN 26 million. Until the end of 2015, the company donated to the Blue Gas program a cash contribution of PLN 3.8 million. In 2015, there were no costs incurred within the holding. exploration extraction projects carried out together with PGNiG (the search areas Sieraków 49% share of ORLEN Upstream, Bieszczady 49% share of ORLEN Upstream and through subsidiary FX Energy Poland the search areas Płotki 49% share of FX Energy Poland and Warszawa Południe 51% share of FX Energy Poland ). The agreements provide the conduct of joint operations and activities in the field of exploration, prospection and extraction of crude oil and natural gas. ORLEN Upstream and FX Energy Poland has the right to proportionate share of the income and bears a proportionate share in the costs of joint operations. Investments accounted for under equity method 31/12/ /12/2014 Joint ventures, incl.: Bassel ORLEN Polyolefines Sp. z o.o. (BOP) Associates Share in profit from investments accounted for under equity method Joint ventures Associates CONSOLIDATED FINANCIAL STATEMENTS FOR THE YEAR ORLEN GROUP STRUCTURE AND JOINT ARRANGEMENTS 50
78 (PLN million) Condensed financial information of Bassel ORLEN Polyolefines Sp. z o.o. 31/12/ /12/2014 Non-current assets Current assets cash other current assets Total assets Total equity Non-current liabilities Current liabilities, incl.: trade and other liabilities Total liabilities Total equity and liabilities Net debt (393) (183) Net assets Group s share in joint ventures (50%) Consolidation adjustments (15) (15) Joint ventures investments accounted for under equity method Sales revenues Cost of sales, incl.: (3 136) (3 205) depreciation and amortisation (101) (98) Gross profit on sales Distribution expenses (112) (94) Administrative expenses (23) (23) Other operating income and expenses, net 1 (7) Profit from operations Net finance income and costs 4 (3) Profit before tax Tax expense (120) (31) Net profit Items of other comprehensive income - 2 Total net comprehensive income Net cash provided by operating activities Net cash (used) in investing activities (17) (34) Net cash (used) in financing activities (433) (287) Dividends received from joint ventures Net profit Group s share in joint ventures (50%) Consolidation adjustments (3) - Group s share in result of joint ventures accounted for under equity method In 2015 and in 2014, there were no significant restrictions in associates and joint ventures resulting from loans agreements, regulatory requirements and other contractual agreements that would restrict access to assets and settlement of liabilities of the Group. 10. EVENTS AFTER THE END OF REPORTING PERIOD After the end of the reporting period there were no events required to be included in the foregoing consolidated financial statements. CONSOLIDATED FINANCIAL STATEMENTS FOR THE YEAR ORLEN GROUP STRUCTURE AND JOINT ARRANGEMENTS 10. EVENTS AFTER THE END OF REPORTING PERIOD 51
79 11. STATEMENTS OF THE MANAGEMENT BOARD AND APPROVAL OF THE FINANCIAL STATEMENTS In respect of the reliability of preparation of consolidated financial statements The Management Board of PKN ORLEN herby declares that to the best of its knowledge the foregoing consolidated financial statements and comparative data were prepared in compliance with the accounting principles applicable to the ORLEN Group in force and that they reflect true and fair view on financial position and financial result of the ORLEN Group and that the Management Board Report on the Operations presents true overview of business situation of the ORLEN Group, including basic risks and exposures. In respect of the entity authorized to conduct audit of financial statements The Management Board of PKN ORLEN declares that the entity authorized to conduct audit was selected in compliance with the law and that the entity and auditors conducting the audit met the conditions to issue an independent opinion in compliance with relevant regulations. The foregoing consolidated financial statements were approved by the Management Board of the Parent Company on 23 March CONSOLIDATED FINANCIAL STATEMENTS FOR THE YEAR
80
81 Table of contents: 1. WHO WE ARE Introduction Management and Supervisory Board Selected operation and financial data ORLEN Group strategy ORLEN Group organization Shareholders and shares OPERATING ACTIVITY AND THE MOST IMPORTANT ACHIEVEMENTS The most important events Awards and distinctions Organization and management Research and technological development Downstream segment Retail segment Upstream segment Risk management Significant contracts Information on significant court, arbitration and administrative proceedings Employment, policy and personel programmes Remuneration of the Company s bodies Corporate Social Responsibility Environmental protection Occupational health and safety FINANCIAL RESULTS Macroeconomic situation Financial results Financial resources management Realization of investment and capital plans Outlook - prospects for the development of the operations CORPORATE GOVERNANCE Corporate Governance rules Internal audit and risk management systems Corporate Governance rules, which were not applied Significant stake Special control and voting rights Amendments of Articles of Association General Meeting of Shareholders Management and supervisory bodies Remuneration policy MANAGEMENT BOARD REPORT ON THE OPERATIONS FOR THE YEAR


82 1. WHO WE ARE 1.1. Introduction Polski Koncern Naftowy ORLEN S.A. ( PKN ORLEN ; the Parent Company ; the Company ) together with the companies being members of the Polski Koncern Naftowy ORLEN S.A. Capital Group ( ORLEN Group, the Group, the Concern ) is the leader in the petroleum and petrochemical industry in the Central and Eastern Europe. UPSTREAM REFINERY DOWNSTREAM RETAIL Wholesale Gasoline Diesel oil LPG PETROCHEMICALS Jet fuel Asphalt Industry oils Wholesale Base chemicals Plastics Gasoline Diesel oil LPG Oil Natural gas POWER INDUSTRY ORLEN Group manages six refineries, three of which are located in Poland (Płock, Trzebinia, Jedlicze), two 1) in the Czech Republic (Litvinov, Kralupy) and one in Lithuania (Mazeiku). The total crude oil s capacity per year amounts to more than 35 million tons. The Group is also the leading manufacturer of petrochemicals, and their products are the basic raw material for a large group of chemical companies. ORLEN Group has been consistently developing a segment of exploration and extraction of hydrocarbons. ORLEN Group after the acquisition of two further upstream companies: Kicking Horse Energy Ltd. (Canada) and FX Energy (Poland) ORLEN Group has in total 97 million boe 2) of oil and gas reserves (2P). In power industry area,the construction of gas-steam power plant with a capacity of 463 MWe in Włocławek is being finalized and the construction of gas-steam power plant CCGT in Płock with a capacity of 596 MWe has commenced. The ORLEN Group s market flagship is the largest in the region network close to modern fuel stations located in Poland, Germany, the Czech Republic and Lithuania. The logistic facilities have been made with efficient infrastructure consisting of ground and underground storage depots and pipeline networks. According to the British financial magazine Euromoney, PKN ORLEN for the next time was awarded as the best managed petroleum company in the region. The Company represents the most valuable Polish brand, the value of which in 2015 exceeded PLN 4.5 billion. Moreover, PKN ORLEN is the most desirable employer, for many years the leader of the largest companies list in the country and the first company in the central part of Europe which received the title of The World's Most Ethical Company granted by the US Ethisphere Institute. The Company has been listed on the Warsaw Stock Exchange (WSE) for 16 years, now part of WIG 20, WIG 30 and elite Respect Index. For years, PKN ORLEN Investor Relations and the quality of published financial reports on the Stock Exchange are at the forefront of the best rated by analysts and investors. Reducing the impact of the manufacturing processes on the environment is one of the priorities of PKN ORLEN. Special attention is also devoted to the most important assets, which are customers and employees. We take care of the success being built by daily work and dedication of nearly 20 thousand employees of PKN ORLEN along with companies of The ORLEN Group which was created with compliance with the ethics and values of the company. 1) The production plant in Paramo does not process crude oil. 2) Barrel of oil equivalent MANAGEMENT BOARD REPORT ON THE OPERATIONS FOR THE YEAR

83 OUR MISSION: We discover and process natural resources to fuel the future. ORLEN, FUELLING THE FUTURE Values and rules of conduct Wojciech Jasiński, The President of the Management Board of PKN ORLEN: Values and rules of conduct define five most important values on which we are building the Group s corporate culture. These values are: Responsibility, Progress, People, Energy, and Dependability. This is our basis for building relations between employees and stakeholders as well as business decision making. Internal company culture basis on the universal values. Guided by them supporting realization of consortium targets and at the same time it protects business from irregularities. PKN ORLEN S.A. Management Board on 4 September 2012 accepted The core values and standards of conduct of PKN ORLEN. This document contains current mission and also range of values which corresponds to the Concern challenges. Responsibility, Progress, People, Energy and Dependability the values which support realization of strategy, are signs setting out the way to achieve the ambitious objectives by the people creating the company. The core values and standards of conduct of PKN ORLEN is a preliminary guide concerning relations within the company, but also in the external environment with business partners, local society, natural environment and competition. This document puts a significant emphasis on building relationships and mutual trust in the organization, provides employees the opportunity to clarify doubts or observed irregularities. Next step in process of corporate culture development was implementation of The core values and standards of conduct of PKN ORLEN in ORLEN Group companies. This direction of operation was appreciated not only by Polish experts but also by international group. In 2014, 2015 and 2016 US Ethisphere Institute has granted to PKN ORLEN the title of The World's Most Ethical Company, what placed Concern as the only company from Central and Eastern Europe in this honorable ranking. Simultaneously as a leader in ethical solutions in the region, PKN ORLEN became a partner in the Ethical Company contest, which goal is to create a Polish equivalent of ethical companies ranking. PKN ORLEN corporate culture based on values is constantly developing and addresses the needs of changing environment. The solutions adopted in the field of ethics are effective and demonstrate the responsibility of the Concern against the challenges and expectations, while at the same time rank PKN ORLEN among the best companies in the world. MANAGEMENT BOARD REPORT ON THE OPERATIONS FOR THE YEAR


84 1.2. Management and Supervisory Board The Management Board Composition of the Management Board on 31 December 2015: WOJCIECH JASIŃSKI President of the Management Board, Chief Executive Officer, On 16 December 2015 Mr Wojciech Jasiński was appointed President of the Management Board and CEO of the Company. He is a graduate of the Law and Administration of the University of Warsaw. In the years he worked in Płock, i.a. in the National Bank of Poland, Branch in Płock, in the Town Hall, also as a legal counsel in the Tax Chamber. In he organized the local government in the Płock Voivodeship, being the Delegate of the Government s Plenipotentiary for Local Government Reform. From 1992 to 1997 he worked in the Supreme Audit Office (NIK), in turn at the positions director: of NIK s Delegation in Warsaw, Finance and Budget Team, State Budget Department. In years he was a Member and then the President of the Management Board of Srebrna company located in Warsaw. In years he was a Member of the Supervisory Board of Bank Ochrony Środowiska. From September 2000 to July 2001, he held the position of Undersecretary of State in the Ministry of Justice. In he was the Minister of Treasury. Since 2001 till September 2015, he has been the Member of Polish Parliament, where he performed the following function: the Chairman of Standing Subcommittee for the Banking System and Monetary Policy, Chairman of the Economy Committee, Chairman of the Public Finance Committee. He was also a member of the State Treasury Committee in the Parliament. On 25 February 2016 he was appointed as the Member of the Supervisory Board of PKO Bank Polski S.A. SŁAWOMIR JĘDRZEJCZYK Vice-President of the Management Board, Chief Financial Officer In June 2008, Mr Sławomir Jędrzejczyk was appointed as Member of the Management Board of PKN ORLEN. On 18 September 2008 he became Vice- President of the Management Board. He is a graduate of the Łódź University of Technology and obtained the title of Certified Auditor of ACCA association. In , he served as President of the Management Board Chief Financial Officer of Emitel. Previously he had worked for companies listed on WSE as: Member of Management Board Chief Financial Officer of Impexmetal S.A. and the Director of Controlling in Telekomunikacja Polska S.A. and in Audit and Business Advisory Department of PriceWaterhouse. Currently, he serves as Vice-Chairman of the Supervisory Board of Unipetrol a.s. Since 1 January 2014 he acts as a member of the Board of Directors of Orlen Upstream Canada Ltd. PIOTR CHEŁMIŃSKI Member of the Management Board, Business Development / Power and Heat Generation Officer Mr Piotr Chełmiński was appointed as the Member of PKN ORLEN Management Board on 10 March He is a graduate of the Warsaw University of Life Sciences in Warsaw. He accomplished postgraduate management studies at University of Management and Marketing in Warsaw (Denver University Partner) and studies at Warsaw University of Technology-Institute of Heat Engineering, the Gas Energy faculty specialized in Gas Turbines and Gas-Steam systems. He has wide experience in managing of Polish and foreign companies, including public listed companies. In the years he served as Vice-President for sales, marketing and export of Okocimskie Zaklady Piwowarskie S.A. From 1996 to 1999 he worked for Eckes Granini GmbH & Co. KG as Regional Director for Central and Eastern Europe region and as President of its subsidiary, Aronia S.A. During he has been a Member of the Board of Directors, Browar Dojlidy Sp. z o.o. Between 2001 and 2006 he served as Member of the Management Board and as Member of Supervisory Board of Kamis-Przyprawy S.A. From 2006 to 2009 he served as Vice-President for Sales and Marketing, Gamet S.A. in Toruń and as Member of the Board of Directors, Gamet Holdings S.A. in Luxembourg. He was entrusted with the post of President of Directors and CEO at Unipetrol a.s. from December 2009 till April Currently, he serves as Chairman of the Supervisory Board of ANWIL S.A. and Vice-Chairman of Supervisory Board of Basell ORLEN Polyolefins Sp. z o.o. KRYSTIAN PATER Member of the Management Board, Production Mr Krystian Pater is the Member of the Management Board of PKN ORLEN since March He is a graduate of the Nicolaus Copernicus University in Torun, the Faculty of Chemistry. He has completed post-graduate courses in Chemical Engineering and Equipment at the Warsaw University of Technology, Management and Marketing at the Paweł Włodkowic University College, Petroleum Sector Management and Enterprise Value Management at the Warsaw School of Economics. Since 1993, he was involved in Petrochemia Płock S.A. and later on, in PKN ORLEN, where from 2005 to 2007 he served as Executive Director responsible for Refining Production. Currently, he is Member of the Management Board of AB ORLEN Lietuva and Member of the Supervisory Board of Unipetrol a.s. Additionally, he serves as Member of the Mana gement Board of European Petroleum Refiners Association and as Chairman of the Association of Oil Industry Workers in Płock. MAREK PODSTAWA Member of the Management Board, Sales Mr Marek Podstawa was appointed to the position of Member of PKN ORLEN Management Board in charge of Sales, effective from 19 March, He is a graduate of University of Science and Technology in Cracow. He holds MBA title granted by the University of Minnesota/Warsaw School of Economics. He has an extensive track record of leading international teams and large expertise in strategy development, project management as well as crisis management. From 1990 to 1992 he worked at Centralne Zakłady Automatyzacji Hutnictwa, then, till 1996 he worked in DuPont Conoco Poland. After conversion of the company in ConocoPhillips consortium he worked in retail, wholesale, marketing, business development, unification of financial management systems, in Europe and US until He was promoted to Director for Wholesale Programs and thereafter he became Director for Strategic Planning at the company s head office in Houston. From January 2009 he was Retail Sales Executive Director at PKN ORLEN. He was a member of the Management Board of Benzina s.r.o., he serves as Chairman of the Supervisory Board of ORLEN Deutschland GmbH, ORLEN Paliwa sp. z o.o. and ORLEN PetroTank sp. z o.o. Mr Marek Podstawa was dismissed by the Supervisory Board from the position of PKN ORLEN s Member of the Management Board on 8 February MANAGEMENT BOARD REPORT ON THE OPERATIONS FOR THE YEAR


85 Members of the Management Board appointed by the Supervisory Board at its meeting on 8 February 2016: MIROSŁAW KOCHALSKI Vice President of the Management Board, Corporate Affairs Mr Mirosław Kochalski was appointed by the Supervisory Board to the position of Vice President of the Management Board on 8 February He is a graduate of the Faculty of History at the University of Nicolaus Copernicus University in Toruń. He completed postgraduate studies at the National School of Public Administration and Enterprise Value Management at the Warsaw School of Economics. He has a long-standing experience on managerial and advisory positions in the private and public sector. In 1994 he worked at the Chancellery of the Prime Minister as a Chief Specialist. In years he worked at the Public Procurement Office as a Director of Public Procurement Bulletin, Director of Training and Promotion Department and then as a Chief Executive Officer. From 1999 to 2002 he held the position of the Director of Supplies and Non-fuel Purchases Department at PKN ORLEN S.A. In years he was an employee of the local government of the City of Warsaw, starting from the position of the Director in the Public Procurement Office and then acting as the President of the City of Warsaw. From 2006 to 2008 he held the position of the President of the Management Board of Ciech S.A. In 2010 he worked as a Managing Director at Coifer Impex SRL in Bucharest. From 2012 to 2015 he acted as a Director of the Centre for Document Personalization in the Ministry of Interior. ZBIGNIEW LESZCZYŃSKI Member of the Management Board, Sales Mr Zbigniew Leszczyński was appointed by the Supervisory Board to the position of the Member of the Management Board on 8 February He is a graduate of the University of Warsaw, Faculty of Accounting and Finance. He completed postgraduate studies Management of the Company in the European Union Market at the Warsaw School of Economics, Designing and Operating Computer Networks at the University of Nicolaus Copernicus in Totuń and Project management at the Koźmiński Academy of Entrepreneurship and Management. He has wide managerial experience in the petroleum industry. Associated with the ORLEN Group, for almost ten years was responsible for the construction, development and settlements of fuel stations network in ORLEN Paliwa as well as supported and developed wholesale of refinery products in PKN ORLEN. He implemented a variety of strategic projects for the Concern. He has served as Vice-President of the Management Board of the Warsaw Institute Foundation providing expert advice on oil, mining, gas and the energy sector. Before that, he worked i.a. as the President of the management board of Wisła Płock S.A., Head of Sales and Marketing at Kompania Węglowa S.A. and President of the Management Board of Wodociągi i Kanalizacja w Opolu Sp. z o. o. He has also provided advisory, supervisory and project management services as a freelancer. Supervisory Board Composition of the Supervisory Board on 31 December 2015 ANGELINA ANNA SAROTA Chairman of the Supervisory Board Mrs Angelina Sarota was appointed the Member of the Supervisory Board of PKN ORLEN in June, She held the function of the Secretary of the Company s Supervisory Board during two previous terms. On 27 June 2013 Mrs Angelina Sarota was appointed as the Chairman of the Supervisory Board of the company for the following term. Ph.D. in law, legal adviser, graduate of the Faculty of Law and Administration of the Jagiellonian University, the National School of Public Administration and postgraduate studies Strategic Management of Human Resources at the Kozminski University. In 2015 graduated from the prestigious program of the Advanced Executive MBA Program at the University of Navarra in Barcelona. Vice President of the Management Board of PGE EJ 1 Sp. z o.o., responsible for legal and regulatory affairs. From April to May 2014 Minister Counsellor at the Ministry of Treasury in the Ownership Policy Department. From 2005 to 2014 Director of the Legal Department of the Prime Minister s Office responsible for legal and legislative support, in particular for the Prime Minister, the Head of the Prime Minister s Office and the General Director. From Deputy Director of the Department of Science Strategy and Development in the Ministry of Scientific Research and Information Technology. From 2001 to 2003, chief specialist in the Court Representation Department and the Restructuring and State Aid Department in the Ministry of Treasury. She was a member of the Supervisory Boards i.a. of the following companies: Cerg Spółka z o.o. in Gliwice, Chemar Spółka z o.o. in Kielce, Vice Chairman of the Supervisory Board of Warsaw Technology Park S.A and Vice Chairman of the Supervisory Board of the Polish Security Printing Works S.A. Member of the Board of the College of Europe Foundation in Warsaw. LESZEK JERZY PAWŁOWICZ Member of the Supervisory Board Mr Leszek Jerzy Pawłowicz has been Vice Chairman of the Supervisory Board of PKN ORLEN for previous term. On 27 June 2013 was reappointed to the Company s Supervisory Board for next term office and again he serves as Vice-Chairman. He is a graduate of the Production Faculty of the Gdansk University. In 1977, he awarded PhD in Economics and then in 1988 postdoctoral degree. Since 1973 he has been associated with the University of Gdańsk. Since 1993 he has been worked as a professor and since October 2003 he has been served as Manager of the Banking Department at the University of Gdańsk. Since 1990 he has been Vice President of the Management Board of the Market Economy Research Institute, and since 1992, Director of the Banking Academy. In the years he served as Chairman and in the years as a Member of the Supervisory Board of Bank Gdański S.A. In the years he was a Chairman of the Programme Board of Bank monthly magazine. In the years a Member of the Scientific Board of Bank Gospodarki Żywnościowej SA. In the years served as a Chairman of the Economic Section of the Scientific Research Committee. In the years served as a Member of Supervisory Board of PPUP Poczta Polska. Since 8 January 1998, Mr. Leszek Pawłowicz has been a Member of the Supervisory Board of Bank Pekao S.A. and since 7 November 2012 has been a Vice Chairman of the Supervisory Board of Bank Pekao S.A. In the years he has served as a Member of the Supervisory Board of PTE Allianz Polska S.A. Since 30 June 2004, he has been a Member of the Supervisory Board of BEST S.A. and since 29 August 2014 he has been a Vice Chairman of the Supervisory Board of BEST S.A. From 12th February 2008 to 25 July 2014 he served as a Member of the Supervisory Board of WSE and from 22 February 2008 to 17 July 2013 he served as a Chairman of the Supervisory Board of WSE. Since October 2004 he has been a Member of Programme Board of Finansowanie nieruchomości quqrterly, since September 2006, he has been a Member of the Editorial Board of Kwartalnik Nauk o Przedsiębiorstwie quarterly and since April 2010 has been a Member of the Programme and Scientific Board of Safe Bank magazine. Since November 2011 he has been a Member of the Finance Committee of Sciences of the Polish Academy of Sciences. MANAGEMENT BOARD REPORT ON THE OPERATIONS FOR THE YEAR


86 ADAM AMBROZIK Member and Secretary of the Supervisory Board On 15 May 2014, Mr Adam Ambrozik was appointed the PKN ORLEN s Member of the Supervisory Board. He graduated in law at the Catholic University of Lublin and Marketing and Management at the Technical University of Lublin. By the end of January 2016 he holds the position of the Director of the Department of Restructuring and Public Aid at the Ministry of the State Treasury. He supervises the companies under restructuring, as well as oversees issues related to providing support and public aid from the entrepreneurs restructuring fund and the Industrial Development Agency. By the end of May he was a Chairman of the Supervisory Board of Polimex Mostostal S.A. In the past his duties included ownership supervision and implementation of new business projects in a private capital group. In addition, he served for five years as Secretary of the Tripartite Commission for Socio - Economic Issues on behalf of non-governmental organization Employers of Poland. CEZARY BANASIŃSKI Member of the Supervisory Board Mr Cezary Banasiński was appointed the Member of Supervisory Board of PKN ORLEN S.A. in On 27 June 2013 Mr Cezary Banasiński was reappointed to the Company s Supervisory Board for next term office. Ph.D. in law, docent at the Faculty of Law and Administration of the University of Warsaw. He graduated in Management and Law and Administration of the University of Warsaw. He received scholarship among others at the Faculty of Law of the University of Vienna and of the University of Tubingen, of the Humboldt Foundation at the University of Constance. From 1997 to 2000 he was an advisor at the Tribunal s Office of Adjudication. From 1999 to 2001 he held the position of under-secretary of state at the European Integration Committee and he was responsible for harmonization of the Polish law with the EU law. From 2001 to 2007 he served as President of the Office of Competition and Consumer Protection. From 2002 to 2004 he was a head of the team negotiating Poland s membership in the EU, responsible for the Competition policy negotiating area under the process of accession Poland to European Union. From 2005 to 2006 he served as a member of the Polish Securities and Exchange Commission and the Commission for Insurance and Pension Fund Supervision and from 2006 to 2007 as a member of the Coordinating Committee for Financial Conglomerations. Expert, advisor of teams and state-owned committees, arbitrator of the Court of Arbitration at the National Chamber of Commerce (from 2004), member of the Board Program Foundation European Law ( ) and other foundations, associations and courts. He was the Chairman of the Supervisory Board of PKO BP S.A. as well as other companies with share of the State Treasury and council legal entities. He is the author and co-author of many publications: books, articles, commentaries for acts and judgments of the Court of Justice in the scope of the administration and economic law and the European economic law. GRZEGORZ BOROWIEC Member of the Supervisory Board Mr Grzegorz Borowiec has been a Member of the Supervisory Board of PKN ORLEN for the two previous terms of office. On 27 June 2013 Mr Grzegorz Borowiec was reappointed to the Company s Supervisory Board for next term office. He graduated from the Gdynia Maritime University the National School of Public Administration, The Faculty of Management University of Warsaw, He have a title of Master of Business Administration under the University of Warsaw/University of Illinois programme and he was appointed as a civil servant. Since December 2007 till December 2015, he served as General Director of the Ministry of State Treasury. Since December 2015 employee of the Ministry of Development. Since January 2010 till November 2015, he was a member of the Audit Committee at the Ministry of Infrastructure and Development. From 1987 to 1994, Mr Borowiec worked as a deck officer for Polish and foreign ship owners in a merchant fleet. From April 1997 to June 1998, he held the position of the Deputy Director of the Ministry of the State Treasury Office for Free of Charge Distribution of Shares to Entitled Employees. From 1998 to 2001 he worked as General Director in the Energy Regulatory Authority. From August 2001 to December 2007, Mr Borowiec was the Director of the Finance Department in the Ministry of Finance. He served as a Member of the Supervisory Board of WSK Rzeszów (1998) and PKP SKM Fast City Railway in the Polish Tricity area ( ). From October 2009 to July 2014, he was the representative of the Minister of State Treasury in the Supervisory Board of TVP S.A. Since July 2014 till January 2016, he was Member of the Supervisory Board of Polskie Radio S.A. He graduated from many domestic and foreign training courses, which are attested by relevant certificates, e.g. the Internal Auditor Certificate (2005), the NATO Security Certificate (NATO secret 2002), course on institutional and economic reform of the energy sector (Power Sector Reform USAID, USA ) and training in project management (PRINCE2-2006). ARTUR GABOR Independent Member of the Supervisory Board Mr Artur Gabor was appointed the Supervisory Board of PKN ORLEN in On 27 June 2013 Mr. Artur Gabor was reappointed to the Company s Supervisory Board for next term office. He graduated in Economics at the University College of London and graduated in Law at the Warsaw University. In 2015 he graduated prestigious Advanced Management Programme on IESE Business School and on Harvard Business School / IESE Business, School, programme for members of supervisory boards Value Creation Through Effective Boards". He has worked as a Partner of Investment & Advisory Services in the company Gabor&Gabor. In the years Mr Artur Gabor worked as an Assistant of Institute of Economics of Polish Academy of Sciences. In the years he was a Business Development Director of Paged S.A. and in the years he worked as a Partner of Warsaw Consulting Group. He served as a Managing Director of Poland of Credit Lyonnais Investment Banking Group ( ), served as a Merger and Acquisition Director of Central Europe and Russia of General Electric Capital ( ) and as a Director of Financial Sector of IBM Poland ( ). In the years was a Member of the Management Board of American Chamber of Commerce and since 2005 he has been a Member of American Chamber of Commerce. Moreover, since 2006 he has been a Member of the Corps of Independent Members of the Supervisory Boards of Polish Institute of Directors. In the years he served as a Vice-Chairman of the Supervisory Board of GE Capital Bank S.A. and a Member of the Supervisory Board of GE Bank Mieszkaniowy S.A. In the years was a Chairman of the Supervisory Board of Getin Bank S.A. and a Member of the Supervisory Board of Getin Holding S.A. In the years he served as a Vice-Chairman of the Supervisory Board of Energomontaz Polnoc S.A. In the years was a Member of the Supervisory Board of Polmos Lublin S.A and in the years a Vice Chairman of the supervisory Board of Energopol Katowice S.A. In the years was a Member of the Supervisory Board of Fleet Holding S.A. and in the years an Independent Member of the Supervisory Board of Prime Car Management. Since 2007 Mr Gabor has been a Member of the Supervisory Board of Orbis S.A. and since 2008 has been a Chairman of the Supervisory Board of Lew S.A. Group. Since 2009 he has been a Vice-Chairman and since 19 December 2013 is a Chairman of the Supervisory Board of Sfinks S.A. Since 2014 he has been a Member of the Supervisory Board of MPay S.A. (the company listed on new connect), since February 2015 he has been a Member of the Supervisory Board of Idea Bank and since September 2015 he has been a Member of the Supervisory Board of Bioton S.A. MANAGEMENT BOARD REPORT ON THE OPERATIONS FOR THE YEAR

, Vice-Chairman of the Supervisory Board of PGE ZEW-T Dystrybucja Sp. z o.o (2008-2009), the Secretary of the Supervisory Board of BOT Elektrownia Turów S.A. (2007-2008), Member of the Supervisory Board of PGE Energia S.")
, the Chairman of the Supervisory Board of Investment TFI SA (2012-2014), Chairman of the Supervisory Board of the Brokerage of Investments SA")
87 RADOSŁAW LESZEK KWAŚNICKI Member of the Supervisory Board Mr Radosław Leszek Kwaśnicki has been appointed as a member of PKN ORLEN Supervisory Board on 15 May He received a doctorate in law and is a solicitor working as a Managing Partner in KKW - KWAŚNICKI, WRÓBEL & Partners Legal Practice. He specializes in company law, equity market law and legal proceedings. He held the functions among others of the Chairman of the Supervisory Board of Agencja Rozwoju Przemysłu S.A. (2007), Vice-Chairman of the Supervisory Board of PGE ZEW-T Dystrybucja Sp. z o.o ( ), the Secretary of the Supervisory Board of BOT Elektrownia Turów S.A. ( ), Member of the Supervisory Board of PGE Energia S.A. ( ), the Chairman of the Supervisory Board of Geometria Pyrzyce Sp. z o.o ( ), the Chairman of the Supervisory Board of BBI Capital NFI S.A. ( ), the Chairman of the Supervisory Board of Investments SA ( ), the Chairman of the Supervisory Board of Investment TFI SA ( ), Chairman of the Supervisory Board of the Brokerage of Investments SA ( ), Member of the Supervisory Board of MAGO S.A. ( ) and the Chairman of the Supervisory Board of NAVI GROUP (2014). He is a member of the Corps of the Polish Institute of Directors included on the list of candidates for Professional Members of the Supervisory Boards of Polish Institute of Directors and Member of the Supervisory Board of Polish State Railways SA (2015). He awarded the prestigious recommendation by the Global Law Experts as Poland's only lawyer in the area of the commercial law. He was also honored in this area by the European Legal Experts as well as in the field of corporate law and mergers and acquisitions (M&A) by the Legal 500. Mr Radosław Kwaśnicki has won 1st place in the competition Forbes Professionals 2014 Professions of Public Trust in Mazovian Voivodeship. He was the President and later Vice-President of the Permanent Court of Arbitration at the District Chamber of Legal Counsels in Warsaw (currently Arbitrator at this Court). He is also a domestic and international arbitrator, including: Arbitrator of the Court of Arbitration at the Polish Confederation Lewiatan, Arbitrator of the International Court of Arbitration at the International Chamber of Commerce in Paris, and Arbitrator of the Court of Arbitration at the Polish Bank Association. He has participated in legislative and strategic work related to the development of the commercial law. He is an editor and author, and co-author of several handbooks and legal comments, as well as over three hundred other publications and speeches devoted to practical aspects of commercial law. Mr. Kwaśnicki is a member of the Editorial Board of Monitor of Trade Law". He is a lecturer at classes for legal counsel trainees (the Circuit Chamber of Legal Counsel in Warsaw). He was a speaker at many conferences and seminars on economic and business law. Mr Kwaśnicki runs a blog dedicated to commercial law Business Law Law in Action. CEZARY MOŻEŃSKI Member of the Supervisory Board On 27 June 2013, Mr Cezary Możeński was appointed the Member of the Supervisory Board of PKN ORLEN. He is a graduate of the Technology and Chemical Engineering Faculty of the Cracow University of Technology. PhD in Chemical Engineering obtained at the Warsaw University of Technology (faculty of Chemical and Processing Engineering). From 1981 to 2000 he was a head of the Research Department at Institute of New Artificial Fertilisers in Puławy and then in the years he worked as the Director of Production and Business Development, Director of Strategy, Business Development and Investments in Zakłady Azotowe Puławy S.A. From 2002 to 2004 he served as a President of the Management Board of Melamina III Sp. z o.o. From 2003 to 2005 he had the position of Chairman of the Supervisory Board of Masz - ZAP Sp. z o.o. From 2005 to 2006 he served as a Member of the Management Board of Brasco S.A. and from 2004 to 2006 as a President of the Management Board of Spirits company Wratislawia Polmos Wrocław S.A. Since 2006 he has served as a Director of Institute of New Artificial Fertilisers in Puławy. Since 2008 he has been a Chairman of the Supervisory Board of Zakłady Azotowe Puławy S.A. Since 2011 he has been a Member of the Committee of Chemical and Process Engineering of Polish Academy of Sciences. Mr Cezary Możeński is an author of several patents and licenses used in chemical industry in the country and abroad. He has completed number of management and OHS trainings ( ). In 2002, he has also completed and passed exam for candidates for Members of the Supervisory Boards of State-owned Companies. In 2013, Mr Możeński participated in The Strategic Leadership Academy (Harvard Business Publishing). REMIGIUSZ NOWAKOWSKI Member of the Supervisory Board Mr Remigiusz Nowakowski was appointed to the Supervisory Board of PKN ORLEN on 23 November He is a graduate of the Wroclaw University of Economics, Faculty of Management and Computer Science, specializing in Business Management and graduate of the University of Wroclaw, Faculty of Law and Administration, specializing in Commercial law. Ph.D. student at the Wroclaw University of Economics, Faculty of Business Management, IT, Finance, Division of Strategy and Management Methods. Since December 2015 President of the Management Board of Tauron Polska Energia S.A. and member of Supervisory Boards in companies from Tauron capital group. In the years related to the energy company Fortum, holding various executive positions. He served as Head of Fuels Production Optimisation and Management and Proxy in Fortum Power and Heat Polska Sp. z o.o., the proxy in the capital group companies. In , he was responsible for construction of Power Plant Fortum in Poland in particular for development process of Combined Heat and Power (CHP) investment, obtaining of administrative permits, obtaining of energy and gas connections condition, selecting of contractors of main technological equipment of heat and power plant. In the years he supervised a business function of Fuels Production Optimisation and Management at Heat Fortum Division in Poland, responsible in particular for creating and implementation of fuels supplies strategy for Fortum in Poland, coordination of fuels purchase, electricity and heat production planning and optimization in heat and power plants, analysis of energy market and forecasts of market trends. Since September 2015 Director of Production Optimisation, Heat Electricity Sales and Solutions Division. In Member and Vice-president of the Management Board, Development Department Director at TAURON Polska Energia SA as well as President of the Management Board at EnergiaPro Koncern Energetyczny S.A. Involved in realization of the key restructuring projects in Polish electro-energy sector, ie. consolidation of energy companies from the TAURON group and unbundling process realization as well as setting up of operators dealing with electricity distribution in TAURON group. In CEO and co-owner of consulting company INERCON Sp. z o.o., advising to mergers and acquisitions in energy and utilities sector in Poland. He has extensive experience in the area of preparation and development of investment projects, design and implementation of public-private partnership models as well as creation and realization of development strategy in energy and heat sectors in Poland, including, in particular, strategic management in the areas of investments and fuels management in energy companies. The Extraordinary General Meeting of PKN ORLEN on 29 January 2016 dismissed from the Supervisory Board: Mr Adam Ambrozik, Mr Cezary Banasiński, Mr Grzegorz Borowiec, Mr Cezary Możeński and Mr Leszek Jerzy Pawłowicz. MANAGEMENT BOARD REPORT ON THE OPERATIONS FOR THE YEAR


88 Members of the Supervisory Board appointed at the Extraordinary General Meeting of PKN ORLEN SA on 29 January 2016: MATEUSZ HENRYK BOCHACIK Secretary of the Supervisory Board Mr Mateusz Henryk Bochacik was appointed to the Supervisory Board of PKN ORLEN on 29 January He graduated from the law and history at the Jagiellonian University in Cracow. In 2013 he passed advocate exam and was entered on the list of advocates conducted by the Regional Council of Advocates in Cracow. He is an advocate and conducts his own legal office in Cracow specializing in civil, economic and administrative law. During his practice he represented public persons as well as private ones, among others commercial companies, local government units and journalists. In total he was a representative in numerous lawsuits at the common and administrative courts as well as at the Supreme Court. Mr Bochacik was also an assistant of the Minister-Coordinator of the Special Services and Deputy of the Polish Sejm Zbigniew Wassermann as well as a director of his Deputy office ( ). In years he was an assistant of Deputy at the European Parliament Paweł Kowal. AGNIESZKA KRZĘTOWSKA Independent Member of the Supervisory Board Ms Agnieszka Krzętkowska was appointed to the Supervisory Board of PKN ORLEN on 29 January Ph.D. degree in economics, academic lecturer at the College of Economics and Social Sciences, The Warsaw University of Technology. Lecturer at the State School of Higher Professional Education in Plock. Over several years she managed the Institute of Economics and Law at the State School of Higher Professional Education in Płock. She specializes in contemporary economics and directions of domestic and world economy development. In her professional career she deals with enterprise financials, demography and statistics. ARKADIUSZ SIWKO Member of the Supervisory Board Mr Arkadiusz Siwko was appointed to the Supervisory Board of PKN ORLEN on 29 January He is a graduate of the Faculty of Law at the Adam Mickiewicz University in Poznan. He completed a training for Stockbrokers in Warsaw under the auspices of Oxford University as well as a training for Investment Advisors. In addition, he completed a training in Washington in Crisis Management at the State Structures under the auspices of the US State Department. In he worked as an academic employee at the Polish Academy of Sciences, Law Department. Next he became a director of the cabinet of Minister of Internal Affairs, supervising in years offices of administration, licensees, law and foreign issues as well as the Fire Department. In 1992 he became an advisor in development strategy of the Minister Chief of Central Office of Planning. In he held a position of President at the Domestic Office of Financial Advisory Projekt, he was also a Chairman of the Foundation Warsaw Institute of Finance and International Affairs. In 1996 he became a law advisor in administrative reform of the Warsaw Voivodship Governor. In he held a position of the Vice President of Orbis S.A. In 2005 he became an advisor in transportation and development of the Minister of Transportation and Building Industry. In he was a President of the Management Board at the Operator Logistyczny Paliw Płynnych, a market leader of fuel storage, including obligatory reserves and state reserves. In Mr Arkadiusz Siwko was a General Director at the Domestic Office of Financial Advisory Projekt. From 2013 he held a position of a President of the Management Board of the Institute of Strategic Studies Grosvenor House. Since 9 December 2015 he is the President of the Management Board of Polska Grupa Zbrojeniowa S.A. ADRIAN DWORZYŃSKI Independent Member of the Supervisory Board Mr Adrian Dworzyński was appointed to the Supervisory Board of PKN ORLEN on 29 January He is graduate of the Faculty Law and Administration at the University of Lodz. In years Counsel legal training at Warsaw Bar Association. In years he worked in Andrzej Żebrowski i Wspólnicy Law Office, providing legal services to large companies, especially banks. Between the Office of the City of Warsaw Deputy Director and subsequently Director of the Legal Office. In years Chancellery of the President of the Republic of Poland Director of the Legal and Legislative Office. In years Director of the Legal Department and subsequently Director of the Legal and Regulatory Department at Polkomtel S.A. In 2013 Director of the Legal D epartment at PGE Polska Grupa Energetyczna. Since 2014 he provides legal services under his own Law Office. In years the Member of the Warsaw Bar Association. Between Mr Adrian Dworzyński served as Vice Dean of Warsaw Bar Association. He was a Member of the Supervisory Boards: Oczyszczalnia Ścieków Południe Sp. z o.o. ( ), Tramwaje Warszawskie Sp. z o.o. (2005), Polska Agencja Informacji i Inwestycji Zagranicznych S.A. ( ), Nordisk Polska Sp. z o.o., PGE Dom Maklerski S.A., PGE Energia Odnawialna S.A. and Przedsiębiorstwo Usługowo-Produkcyjne TOP SERWIS Sp. z o.o. (2013). He is currently an Independent Member of the Supervisory Board in AAT Holding S.A. and DUON Group. MANAGEMENT BOARD REPORT ON THE OPERATIONS FOR THE YEAR
89 1.3. Selected operation and financial data. TABLE 1. Selected operation and financial data for the years I. MACROECONOMIC DATA (average value for the period) Specification Unit Oil Brent USD/bbl Oil Ural USD/bbl Oil WTI USD/bbl Brent/URAL differential 1) USD/bbl Model refining margin 1) USD/bbl Model petrochemical margin 1) EUR/t Model downstream marign 1) 2) USD/bbl II. OPERATING ACTIVITY Crude oil throughput ORLEN Group, of witch: 000 tonnes Crude oil throughput in PKN ORLEN 000 tonnes Crude oil throughput in Unipetrol Group 000 tonnes Crude oil throughput in ORLEN Lietuva Group 000 tonnes Sales of products and goods, including: 000 tonnes Downstream 000 tonnes Retail 000 tonnes Upstream 000 tonnes III. FINANCIAL ACTIVITY 3.1. Consolidated statement of profit or loss and other comprehensive income Sales revenues PLN million EBITDA LIFO before write-downs, including: 3) 4) PLN million Downstream PLN million Retail PLN million Upstream PLN million (32) (24) 2 Corporate functions PLN million (621) (565) (557) (611) (363) EBITDA LIFO, including: PLN million (147) Downstream PLN million (852) Retail PLN million Upstream PLN million (808) (170) (32) (24) 2 Corporate functions PLN million (626) (565) (557) (611) (370) Corrected LIFO PLN million (1 510) (2 573) (668) (175) EBITDA, including: PLN million (2 720) Downstream PLN million (3 425) Retail PLN million Upstream PLN million (808) (170) (32) (24) 2 Corporate functions PLN million (626) (565) (557) (611) (370) Amortization PLN million EBIT PLN million (4 711) Net profit (loss) PLN million (5 828) Balance sheet data Total assets PLN million Equity capital PLN million Net debt PLN million Consolidated cash flow statement Net cash from operating activities PLN million Net cash from / (used in) investing activities, including: PLN million (4 096) (4 020) (2 441) (2 853) CAPEX PLN million Net cash from (used in) financing activities PLN million (2 866) (2 438) (3 340) 332 Free cash flow 5) PLN million (833) Key indicators Return on capital employed (ROACE) 6) % Return on capital employed LIFO (ROACE LIFO) 7) % Net financial leverage 8) % Profit/(Loss) attributable to shareholders of the Parent Company per share (EPS) PLN/share 6.63 (13.59) ) The method of calculating the margin has been placed at the end of these reports "Dictionary of selected concepts and financial industry." 2) Due to changes in the method of management in the field of refining, petrochemical and energy in the ORLEN Group and the creation of an integrated Downstream Segment in 2014 has began calculation of the Downstream Margin Model. In addition, the value of margin mentioned above was presented for 2013 year. 3) The ORLEN Group inventories are valued in the financial statements in accordance with International Financial Reporting Standards by the method of weighted average cost or purchase price. This method results in later recognition of the effects of an increase or decrease in oil prices compared to the prices of finished products. The application of the LIFO method of inventory valuation causes current production costs are valued at the cost of purchased crude oil and as a result performance better represent the actual situation. 4) The results of operations for the years 2011, 2012, 2014 and 2015 include write-downs for impairment of assets in the amount of PLN (1 797) million, PLN (688) million, PLN (5 360) million and PLN (993) million. 5) Free cash flow = net cash from operating activities + net cash from / (used in) investment activities. 6) ROACE = operating profit for the last four quarters after tax and before write-down the value of assets / average capital employed (equity + net debt) for the last four quarters. 7) ROACE LIFO = LIFO operating profit for the last four quarters after tax and before write-down the value of assets / average capital employed (equity + net debt) for the last four quarters. 8) Net financial leverage = net debt / shareholder s equity - calculated as of the end of the period. MANAGEMENT BOARD REPORT ON THE OPERATIONS FOR THE YEAR

90 1.4. The ORLEN Group strategy Wojciech Jasiński, President of the PKN ORLEN s Management Board: Last year, PKN ORLEN consistently implemented strategy, which allowed to achieve excellent operating and financial results. Due to the constantly changings in macroeconomic environment which influences to the condition of the sector in which we operate, we have to face with discussion about the priority objectives and targets for the Group for next coming years. One of the key elements is intensification of support and innovation. They should become the driving force of our company and the economy of our country." Assumptions of the ORLEN Group strategy for the years The year 2015 was the first full year for the strategy realization. It assumes implementation of development projects in the most prospective areas by integrated value chain, financial safety and strength and modern management culture: Value creation EBITDA: PLN 5.1 bn 1 Financial strength Dividend: DPS increase 2 Human resources Value: ORLEN 1) The average annual LIFO EBITDA (operating profit before depreciation and amortization by LIFO) for the period of ) DPS (Dividend per Share) dividends paid by the company per share. Value Creation - The Company will focus on building a strong position in the large and growth markets, strong customer orientation, operational excellence, strengthening the chain value of an integrated and sustainable development of oil and gas. Financial strength - the Company s strategic objective is connected with the steady growth of the DPS (Dividend Per Share). The company s dividend policy assumes the payment of dividends, including the accomplishment of strategic goal of secure financial foundations and forecasts of the macroeconomic situation. Human resources responsibility for people, the environment and partners: zero tolerance for accidents, business responsibility towards the community, the environment and business partners. Development of human capital and innovation: consistent development of an experienced team of professionals, systematic increase in spending on research and development, the implementation of innovative solutions. CAPEX - in the years the planned expenditures of PLN 10.8 billion will be allocated for the development of the Concern, of which: PLN 6.4 billion in downstream segment, PLN 1.2 billion for retail segment and PLN 3.2 billion in upstream segment. Furthermore, the amount of PLN 5.5 billion will be allocated on the modernization work connected with maintaining high system performance and fulfillment of regulatory requirements. MANAGEMENT BOARD REPORT ON THE OPERATIONS FOR THE YEAR

91 1.4.2 Strategic objectives in the individual segments of the ORLEN Group Downstream Value drivers Integrated management comprehensive management of value chain expansion of product mix and the degree of conversion Operational excellence consistent improvement in key indicators of efficiency optimization of the structure and the restructuring of the Group s assets Effective sales adjustment of sales models for best practices strengthening the position in the home markets Raw materials Integrated chain value DOWNSTREAM Refinery Power Industry Petrochemicals Sales and logistics Products Downstream EBITDA LIFO growth [PLN billion] The development of industrial cogeneration construction of new power - EC Wloclawek and EC Plock modernization of existing assets Average Retail Value drivers Modern network: further development of the owned stations network as well as franchise (DOFO) growth in annual average fuel sales per station The increase in the share of fuel sales in domestic markets* [%] 14,1 17,0 Customer orientation: implementation of new services and products implementation of new shops formats under ORLEN logo and also new format of Stop Café Strong brand: full potential utilization of loyalty program e-commerce development * Poland, Czech, Lithuania, Germany Increase of non-fuel margin [index] Upstream Value drivers Organic growth in Poland concentration on the most perspective areas of unconventional deposits development of conventional projects Extraction development in Canada: extraction increase to 16 thousand boe per day increase of gas and oil (2P) reserves to 53 million boe Increase in hydrocarbons extraction [mln boe/year] 0, , Capital expenditures [PLN billion] 3,2 Opportunistic purchases of assets: in Poland and other markets dependent on the amount of the free cash flow 0, MANAGEMENT BOARD REPORT ON THE OPERATIONS FOR THE YEAR


92 1.4.3 The summary of strategic actions in the ORLEN Group in 2015 Value creation Financial strength Record EBITDA LIFO: PLN 8.7 billion 1) Record throughput of 30.9 million tonnes and sales of 38.7 million tonnes The acquisition of upstream assets in Canada and Poland New contracts for the supply of oil to 10.8 million tonnes per year Financial leverage at the end of 2015: 28.1% Cash flow from operating activities PLN 5.4 billion Dividends: payment of PLN 0.7 billion / PLN 1.65 per share Extension of the average maturity of sources of financing to the 4 quarter of 2019 People The World s Most Ethical Company 2015 Top Employers Polska 2015 Best managed companies in CEE 2015 ORLEN Warsaw Marathon/Verva Street Racing ORLEN the most valuable brand in Poland worth PLN 4.5 bn (by daily Rzeczpospolita ) 1) Before the impairment loss of non-current assets. Impairment losses on assets in 2015 amounted to negative value of PLN (993) million and was primarily related to impairment losses on exploration assets of the ORLEN Upstream Group in Poland recognized in II quarter of 2015 in negative amount of PLN (429) million, impairment losses on petrochemical assets of Unipetrol Group recognized in III quarter of 2015 in negative amount of PLN (93) million in connection with the failure of ethylene production installation in August 2015 and impairment losses of mining assets in Canada which amounted to negative value of PLN (423) million recognized in the IV quarter of MANAGEMENT BOARD REPORT ON THE OPERATIONS FOR THE YEAR
93 1.4.4 The strategy realization in segments Downstream Realization Record EBITDA LIFO: PLN 7.8 billion 1) Record throughput of 30.9 million tonnes and volume sales of 30.4 million tonnes Increased the yield of white products in the ORLEN Group 1 p.p. (y/y) to 79% and a decrease of energy absorptivity by nearly 3 p.p. (y/y) Construction of new powers - PP Włocławek (463 MWe) and PP Płock (600mWe) The contract for the construction of a new polyethylene plant (PE3) in Litvínov Adjustment of the PP in Płock to emission standards applicable from 2016 Retail Realization Record EBITDA LIFO: PLN 1.5 billion Volume sales increased by 3% (y/y), including: an increase in Poland by 4% and in the Czech Republic by 10% Start piloting new formats convenience store's 10 stations (5 in the ORLEN brand and 5 under the new brand O!Shop) points Stop Cafe and Stop Cafe Bistro in Poland; an increase of 154 points (y/y) and the launch of two test stations with the new format catering Stop Cafe 2.0 The acquisition of 68 retail stations from OMV in the Czech Republic and 13 Sun fuel stations in Germany from Germania Petrol Upstream Realization The acquisition of upstream assets in Canada (Kicking Horse Energy) and Poland (FX Energy) The increase in total oil and gas reserves (2P) to 97 million boe Average production in 2015 of 7.1 thousand boe/d 1) Before the impairment loss of non-current assets of PLN (136) million related mainly to the failure of the ethylene production installation in the Unipetrol Group of PLN (93) million described above. MANAGEMENT BOARD REPORT ON THE OPERATIONS FOR THE YEAR

94 1.5. ORLEN Group organization The ORLEN Group companies conduct business activities: production and commercial activities crude oil processing, production of refining, petrochemical and chemical products and semi-products, wholesale and retail sale of fuels and other refining and petrochemical products, service activities crude oil and fuels storage, transport, maintenance and repair services, laboratory, security, design, administrative, insurance and finance services, connected with exploration and extraction of hydrocarbon deposits and with production, transport, distribution and trade in electric energy. For management purposes, the ORLEN Group is divided into the 3 operating segments: Downstream, Retail, Upstream and Corporate Functions. A more detailed description of these abovementioned segments was presented in Chapter 2 and their financial results in Chapter 3. The ORLEN Group includes PKN ORLEN as the Parent Company and entities located in Poland, Germany, the Czech Republic, Lithuania, Malta, Sweden, the Netherlands, Slovakia, Hungary, Estonia, Latvia, the USA and Canada. As at 31 December 2015 the ORLEN Group consisted of 86 companies, including 77 subsidiaries. SCHEME 1. Capital and organizational relations in the ORLEN Group as at Percentage of shares owned by the Parent Company/ORLEN Group in capital of the ORLEN Group companies and consolidation methods are presented in point 9.1 to the Consolidated Financial Statements for MANAGEMENT BOARD REPORT ON THE OPERATIONS FOR THE YEAR

95 1.5.1 Range of activities of selected Companies in the ORLEN Group TABLE 2. The scope of business of other companies in the ORLEN Group. COMPANY s NAME Production and Sales PKN ORLEN ORLEN Lietuva Group Unipetrol Group ANWIL Group ORLEN Południe Group ORLEN OIL Sp. z o.o. ORLEN Paliwa Sp. z o.o. ORLEN Asfalt Group Inowrocławskie Kopalnie Soli SOLINO S.A. ORLEN Deutschland GmbH Petrolot Sp. z o.o. Services ORLEN KolTrans Sp. z o.o. ORLEN Transport S.A. ORLEN Serwis S.A. ORLEN Wir Sp. z o.o. ORLEN Eko Sp. z o.o. Extraction ORLEN Upstream Group BASIC SCOPE OF BUSINESS crude oil processing, production of refinery and petrochemical products as well as wholesale and retail sales crude oil processing, production of refinery products and wholesale of the company's products in the local market and export by land and sea crude oil processing, production and distribution of: refined, petrochemicals and chemicals products production of nitrogen fertilizers, plastics and the chemical processing for industry and agriculture crude oil processing, production and sale of biofuels, logistic and storage services, waste oils processing, manufacture and sale of oil bases and oils, heating oils and organic solvents production, distribution and sale of grease oils, lubricants, oil bases as well as car care products and maintenance liquids wholesale of fuels and liquefied petroleum gas sale of asphalt, including: road, modified and industrial oil and fuels storage, extraction and packaging of salt retail sale of fuel in Germany distribution of aviation and automotive fuels, fuels storage, storing, filling, and dispatching services rail transport of goods, rail servicing locations of loading and discharge, repairs and upgrade of railway rolling stock transport of fuels, LPG and chemicals maintenance of industrial installations, repair and modernization of installations, realization of investment projects, design and prefabrication, service of industrial automation equipment maintenance and modernization of compressors, centrifuges, locomotive engines and enginegenerators waste management with the use of waste recovery and disposal installation, including among others hazardous waste, provision of safety and hygiene services, fire precaution and environment protection services, rescue and fire equipment maintenance production of hydrocarbons in the Canadian market and conduct of exploration and production projects in the Polish market 1.6. Shareholders and shares Shareholding structure in PKN ORLEN The share capital of PKN ORLEN is divided into ordinary bearer shares with a nominal value of PLN The ownership rights of PKN ORLEN s shares are fully transferable. The Management Board of PKN ORLEN has no information about agreements influencing the future change of current shareholding and bondholding structure. DIAGRAM 1. Shareholding structure in PKN ORLEN 1) 1) According to the Extraordinary General Meeting of PKN ORLEN held on 29 January MANAGEMENT BOARD REPORT ON THE OPERATIONS FOR THE YEAR
96 1.6.2 Employee stock option scheme monitoring system In 2015 no employee stock option scheme was implemented in the ORLEN Group Shares repurchase In 2015 PKN ORLEN and other entities of the ORLEN Group did not hold or repurchase its own shares Number of PKN ORLEN shares and other entities of the ORLEN Group held by the management and supervisory personnel of PKN ORLEN Members of the Management Board of PKN ORLEN as at 31 December 2015 did not hold any shares of the Company. Mr Grzegorz Borowiec and Mr Artur Gabor from the Supervisory Board of PKN ORLEN held 100 and shares of the Company, respectively, at the end of Management and supervisory personnel of PKN ORLEN as at 31 December 2015 did not hold any shares in the other ORLEN Group s entities PKN ORLEN on the Stock Exchange PKN ORLEN shares are quoted on the main market of the Warsaw Stock Exchange in the continuous quoting system and are included in WIG, WIG20, WIG30, WIG-Poland and WIG- FUELS the industry index. Since 19 November 2009 PKN ORLEN`s shares are included in the index of companies engaged in corporate social responsibility, called RESPECT Index. TABLE 3. Key data regarding PKN ORLEN s shares. In 2015 the largest companies stock market index WIG 20 decreased by (19.7%) (y/y), whereas WIG index decreased by (9.6%) (y/y). In this period PKN ORLEN s share price increased by 38.7% (y/y), to afford the highest rate of return of all companies included in WIG20. In the previous year, of shares changed their holders on the market, that is 63% more in comparison to Net profit attributable to equity owners of the Parent Company KEY DATA U.M CHANGE % =(3-4)/4 PLN million (5 811) Highest share price 1) PLN % Lowest share price 1) PLN % Share price at year end 1) PLN % Average price in the period 1) PLN % P/E ratio average 9.9 (3.1) P/E ratio at the end of the year 10.2 (3.6) Number of issued shares Item % Capitalisation at year end PLN million % Average daily trading value PLN million % Average daily trading volume Item % 1) Share price according to a closing share price. TABLE 4. Brokerage offices which issue recommendations for shares of PKN ORLEN 1) SEATED IN POLAND SEATED OUTSIDE POLAND BDM ING Bank of America Merrill Lynch JP Morgan Deutsche Bank Vestor Barclays Morgan Stanley BOŚ Ipopema Concorde Securities Raiffeisen BZ WBK mbank Erste Societe Generale Citi PKO BP Goldman Sachs UBS Haitong Bank Trigon HSBC UniCredit 1) As at the date of approval of this Report. Current list of recommendations issued for the Company s shares is available on the corporate website under: MANAGEMENT BOARD REPORT ON THE OPERATIONS FOR THE YEAR
97 DIAGRAM 2. Key events on the background of quotations of PKN ORLEN in H'15 Results MAX PLN/share Q'14 Results 1Q'15 Results 3Q'15 Results MIN PLN/share Annual General Meeting 40 Jan-15 Feb-15 Mar-15 Apr-15 May-15 Jun-15 Jul-15 Aug-15 Sep-15 Oct-15 Nov-15 Dec-15 Source: Own calculations based on data from gpwinfostrefa.pl. Dividend payment Acquisition FX Energy Inc and Kicking Horse Energy Inc. Average annual quotation PLN/share AVERAGE PLN/share DIAGRAM 3. Quotations of PKN ORLEN on WSE in PLN/share Source: Own calculations based on data from gpwinfostrefa.pl DIAGRAM 4. Quotations of PKN ORLEN, WIG20 and WIG-FUELS on WSE in ) 180% WIG 20 PKN WIG PALIWA 160% 140% 120% 100% 80% 60% Dec-14 Jan-15 Feb-15 Mar-15 Apr-15 May-15 Jun-15 Jul-15 Aug-15 Sep-15 Oct-15 Nov-15 Dec-15 1) percentage change of quotations of PKN ORLEN, WIG 20 in relation to the listing of 30 December 2014 Source: Own calculations based on data from gpwinfostrefa.pl MANAGEMENT BOARD REPORT ON THE OPERATIONS FOR THE YEAR
98 2. OPERATING ACTIVITY AND THE MOST IMPORTANT ACHIEVEMENTS 2.1. The most important events JANUARY 2015 Repurchase of mandatory reserves On 29 January 2015 the agreement for gathering and keeping of crude oil mandatory reserves, concluded on 27 June 2013 between Neon Poland Sp. z o.o. ( Neon ) and PKN ORLEN S.A. has expired. Therefore, PKN ORLEN S.A. acquired crude oil owned by Neon. The value of the transaction was approximately USD 145 million (approximately PLN 540 million). On the day of signing the agreement the acquisition price of crude oil has been hedged with a forward contract. The settlement of the hedging transaction increased the value of the acquired raw material by USD 112 million (representing PLN 419 million). Regulatory announcement no. 13/2015. AUGUST 2015 Repurchase of mandatory reserves On 12 August 2015 PKN ORLEN S.A. exercised an option of early repurchase of a crude oil mandatory reserves sold to Cranbell Sp. z o.o.( Cranbell ) on 26 June Accordingly PKN ORLEN S.A. terminated the agreement for gathering and keeping of crude oil mandatory reserves concluded with Cranbell on 26 June 2014 and bought back crude oil owned by Cranbell. The value of the transaction was approximately USD 301 million (approximately PLN million). On the day of signing the agreement the acquisition price of crude oil has been hedged with a forward contract. The settlement of the hedging transaction increased the value of the acquired raw material by USD 406 million (representing PLN million). Regulatory announcement no.118/2015. SEPTEMBER 2015 Power Plant in Włocławek The consortium of companies (General Electric International S.A. and SNC-LAVALIN POLSKA Sp. z o.o.) that builds gas-steam power plant in Włocławek informed about new date for completion of the project. Therefore, commercial operation of the power plant is planned for the second quarter of The previously planned date of commercial operation of the power plant was December Regulatory announcement no 129/2015. NOVEMBER 2015 Changes in a composition of the Supervisory Board On 24 November 2015 PKN ORLEN Management Board informed that on 23 November 2015 the Minister of the State Treasury acting on behalf of the shareholder of the State Treasury, based on 8 item 2 point 1 of the Articles of Association, dismissed Mr Maciej Bałtowski of the Supervisory Board of PKN ORLEN S.A. and appointed Mr Remigiusz Nowakowski to the Supervisory Board. Regulatory announcement no. 161/2015. DECEMBER 2015 Convening of PKN ORLEN s Extraordinary Meeting of Shareholders On 9 December 2015 Management Board of the PKN ORLEN S.A. acting pursuant to the Article in conjuction with the Article of the Commercial Companies Code and 7 item 4 of the Articles of Association informed about convening PKN ORLEN s Extraordinary Meeting of Shareholders on 29 January Regulatory announcement no. 165/2015. Changes in PKN ORLEN s Management Board On 16 December 2015 the Supervisory Board of PKN ORLEN S.A. dismissed Mr Dariusz Krawiec from the Management Board of PKN ORLEN and at the same time appointed Mr Wojciech Jasiński as President of the Management Board for three year term of office, ending on the day of the Ordinary General Shareholders meeting that will approve the financial statements for Regulatory announcement no. 172/2015. The most important events in 2016 until publication of the Management Board Report. JANUARY 2016 Changes in a composition of the Supervisory Board of PKN ORLEN On 28 January 2016 the Minister of the State Treasury acting on behalf of the shareholder of the State Treasure, based on 8 item 2 point 1 of the Articles of Association, dismissed Mr Remigiusz Nowakowski from the Supervisory Board of PKN ORLEN S.A. Regulatory announcement no. 15/2016. On 29 January 2016 the Extraordinary General Meeting of Shareholders of PKN ORLEN S.A. dismissed Mr Adam Ambrozik, Mr Cezary Banasiński, Mr Grzegorz Borowiec, Mr Cezary Możeński and Mr Leszek Jerzy Pawłowicz from the Supervisory Board of PKN ORLEN and appointed Mr Mateusz Henryk Bochniak, Mr Adrian Dworzyński, Ms Agnieszka Krzętowska, Mr Remigiusz Nowakowski and Mr Arkadiusz Siwko to the Supervisory Board of PKN ORLEN. Regulatory announcement no. 17/2016. FEBRUARY 2016 Changes in a PKN ORLEN s Management Board On 8 February 2016 the Supervisory Board of PKN ORLEN S.A. dismissed Member of Management Board Mr Marek Podstawa and at the same time appointed Mr Mirosław Kochalski as a Vice-President of the Company s Management Board and Mr Zbigniew Leszczyński to the position of the Member of Management Board, for the common three year term of the office, ending on the day of the Ordinary General Shareholders Meeting that will approve the financial statements for Regulatory announcement no. 22/2016. Information concerning significant contracts are described point 2.9. MANAGEMENT BOARD REPORT ON THE OPERATIONS FOR THE YEAR
99 2.2. Awards and distinctions JANUARY 2015 ORLEN Warsaw Marathon was awarded the title "Mass Event of the Year" in the 80 th Plebiscite of Przegląd Sportowy. FEBRUARY 2015 PKN ORLEN for the fourth time in a row obtained title of Top Employers Polska, confirming its position among the best employers. MARCH 2015 For the second time PKN ORLEN obtained prestigious title of The World s Most Ethical Company for implementation ethics in the daily company s operations and determining the standards of ethical leadership. PKN ORLEN obtained title of Promoter of the ecology in the 15 th edition of National Ecological Competition Friendly to the Environment for education activities as well as a number of activities on optimizing the impact on the environment. APRIL 2015 In the next edition, of the prestigious plebiscite Fleet Awards organized by the Magazyn Flota, fleet card program FLOTA has been acclaimed as the best in the category Fuel cards for large fleets. PKN ORLEN winner of the Responsible Company Ranking 2015 made by Dziennik Gazeta Prawna in fuel, energy, extraction category. MAY 2015 PKN ORLEN for 16 th time in a row took first place in prestigious List of 500 ranking published by Rzeczpospolita. Among the biggest Polish companies were also other companies of ORLEN Group: ORLEN Paliwa, ORLEN Gaz and ORLEN Petrotank. PKN ORLEN awarded the CSR Golden Leaf for its outstanding activities in the area of the social responsibility and sustainable development in This is the 4 th CSR Leaf, after 3 silver awarded before by the Polityka magazine and Deloitte experts. JUNE 2015 PKN ORLEN became a laureate of two awards in the 10 th edition of Direct Marketing competition Golden Arrow. The Mobile Application VITAY and publication of Information Package PKN ORLEN Annual Report 2013 were awarded. JULY 2015 PKN ORLEN as the only one Polish Company was listed in the Global 500 American Fortune magazine at the prestigious list of the largest Companies in the world. This annually published list of the world s largest Companies is classified in terms of total revenue. AUGUST 2015 Three gold and one silver medals were won by athletes provided with PKN ORLEN individual scholarship program at 15 th Athletics World Championship in Beijing. Gold medals were won by: Anita Włodarczyk (Hammer Throw), Paweł Fajdek (Hammer Throw), Piotr Małachowski (Discus Throw), and the silver medal won Adam Kszczot. SEPTEMBER 2015 PKN ORLEN once again awarded in the 11 th edition of the ranking Best managed companies in CEE 2015 performed by British Euromoney financial magazine. PKN ORLEN another year in a row is the unquestionable leader in terms of revenue among the biggest Companies in Central Europe in the 9 th edition of CE TOP 500. PKN ORLEN was awarded with Safety leader in the Industry title granted by Risk Engineering and Industry Development Team of PZU in recognition of is merits and implementation of good practices, and in particular the implementation of the Report Threats in Safety at Work. OCTOBER 2015 PKN ORLEN awarded four prizes in the X edition of The Best Annual Report contest. Besides the Special Award, PKN ORLEN won contest for the best Report on the Internet and for the best Financial Statements prepared in accordance with MSSF/MSR standards, what is more PKN ORLEN received title The Best of the Best title, awarded to Companies which were able to achieve three times the highest distinction in competition organized by Accountancy and Tax Institute. PKN ORLEN once again awarded with Safe Work Leader Gold Card granted by Leaders in safety at work. PKN ORLEN awarded with Leader in purchase 2015 title in competition organized by Association of Polish Logistic Managers under patronage of Polish Chamber of Commerce and Harvard Business Review. PKN ORLEN leader of XIV ranking edition of List of 2000 The biggest Polish enterprises and exporters under patronage of Ministry of Economy. NOVEMBER 2015 ORLEN, BLISKA and STOP CAFE brands were awarded with Superbrands Created in Poland 2015/2016 title and PKN ORLEN brand won Business Superbrands 2015/2016 title. PKN ORLEN received Philanthropy Leader award in category of Individual Employee Philanthropy Program. The contest is organized by Warsaw Stock Exchange. DECEMBER 2015 PKN ORLEN for ninth time in a row became a laureate of the Most Valuable Polish Brand ranking. In 2015 value of PKN ORLEN brand reached PLN 4.5 billion. PKN ORLEN was rewarded in Reactions and Innovations 2015 plebiscite, for accomplishment of construction process of PX/PTA complex the second largest and the most modern petrochemical complex designed for production of paraxylene and terephthalic acid. Chartered Institute of Purchasing & Supply granted PKN ORLEN, for the first time in Poland, with Supply Chain Management Certificate. International CIPS experts performed integrated audit in the areas of: leadership and organization, strategy, employees competence, functions of process and systems and measurement with data management, experts concluded that PKN ORLEN is perfectly following purchasing standards. PKN ORLEN continuously since 2009 remains in an elite group of companies being members of RESPECT Index that selectsfirms which are managed in responsible and sustainable way. MANAGEMENT BOARD REPORT ON THE OPERATIONS FOR THE YEAR
100 2.3. Organization and management ORLEN Group development policy The ORLEN Group is striving to strengthen the position of its companies in the area of their primary activities and to extend the energy and upstream segment. At the same time, the Group is focusing on the improvement of management, restructuring and consolidation of assets, as well as on the divestment of assets which are not directly related to its primary activity. The purpose of these measures is to increase the market value of the ORLEN Group, to strengthen its position on the parent markets, as well as to ensure product and geographic expansion. The primary developmental investments aim at further expanding the product portfolio and the degree of conversion, generating new energy powers and continuing projects related to the exploration and extraction of hydrocarbons. Holding management principles, i.e. solutions aiming at the implementation of shared goals for companies in the ORLEN Group, defined by the Parent Company, were implemented to ensure effective management. The solution has been implemented on the basis of the ORLEN Group s Constitution stipulating three key regulations: the Agreement for Cooperation, the Group Regulations, and the provisions of ORLEN Group company Statutes/Agreement. The Constitution provided for the standardization of exchange of information, effective monitoring of key business decisions, as well as for the standardization of organization norms. Furthermore, the Constitution defines the legal basis for the formation of a cohesive strategy for the ORLEN Group. Since 2011, the Constitution was implemented in 39 and the holding management principles in 27 companies of the Group. Effective PKN ORLEN corporate supervision over the companies of the Group is based on the supervision of the operating activity of these companies, their financial and formal-legal supervision Changes in the principles of organization and management in the Parent Company and the ORLEN Group and in capital relations Parent Company PKN ORLEN S.A. On 16 December 2015, the President of the Management Board was replaced. By decision of the Supervisory Board, Mr Dariusz Jacek Krawiec was dismissed and Mr Wojciech Jasiński was appointed. SCHEME 2. The responsibility division of Members of the Management Board of PKN ORLEN as at AREAS OF RESPONSIBILITY OF THE MANAGEMENT BOARD OF PKN ORLEN PRESIDENT OF THE MANAGEMENT BOARD, CHIEF EXECUTIVE OFFICER WOJCIECH JASIŃSKI VICE-PRESIDENT OF THE MANAGEMENT BOARD, CHIEF FINANCIAL OFFICER SŁAWOMIR JĘDRZEJCZYK MEMBER OF THE MANAGEMENT BOARD, DEVELOPMENT AND POWER ENGINEERING PIOTR CHEŁMIŃSKI MEMBER OF THE MANAGEMENT BOARD, SALES MAREK PODSTAWA MEMBER OF THE MANAGEMENT BOARD, PRODUCTION KRYSTIAN PATER Human Resources Planning and Reporting Implementation of Investments Wholesale of Refinery Products Refinery Production Strategy and Project Management Business Controlling Development and Technologies Sale of Petrochemical Products Petrochemical Production Procurement Supply Chain Management Power Engineering Retail Sale Investments and Efficiency of Production Audit and Corporate Risk Management Finance Management Health and Safety Logistics Technics Marketing IT Environmental Protection Efficiency and Development of Sale in ORLEN GROUP Corporate Communication Taxes Trade of Crude Oil and Gas Capital Investments Legal Counselor Investor Relations Protection of Information, Critical Infrastructure, Security and Defense Matters Innovative Projects On 8 February 2016 the Supervisory Board dismissed Mr. Marek Podstawa from the Management Board of PKN ORLEN S.A. and appointed Mr Mirosław Kochalski for the Vice-President of the Management Board and Mr Zbigniew Leszczyński for the Member of the Management Board. Due to the acquisition of production assets from the ORLEN Group companies, a new organizational unit the Oil-Asphalt Block and its subordinated Asphalt and Oil Departments were established within the section governed by the Refinery Production Executive Director. A new organizational unit Representative Office in Brussels was established in the section governed by the Concern Counselor. MANAGEMENT BOARD REPORT ON THE OPERATIONS FOR THE YEAR
101 In the course of 2015, shifts were made in the following organizational units: - The Fuel Station Maintenance Department (with subordinated units) was shifted from the Retail Section to the Implementation of Property Investments Section, - The Innovative Project Office was shifted from the Strategy and Project Management Section to the section governed by the Chief Executive Officer, - The Refinery and Petrochemical Production Optimization and Production Processes Office with the subordinated Refinery and Petrochemical Production Optimization and Production Processes Team was shifted from the section governed by the Executive Petrochemical Production Director to the Investment and Production Effectiveness Office. In addition, a draft of the new division of competences between the Crude Oil and Gas Trade area and the Logistics area was implemented in relation to the transfer of the crude oil supply settlement process to the Logistics area. Due to the new division of competences, the organizational structure of the Executive Crude Oil and Gas Trade Director has changed. In turn, the responsibility to monitor the mandatory reserves was transferred from the Logistics area to the Supply Chain Management area. Unipetrol Group The Unipetrol Group consolidation project aiming at optimizing its structure and, in consequence, improving its operating activity and strengthening its market position was implemented. In May 2015, the Unipetrol Group finalized the acquisition of 100% of shares in Ceska Rafinerska a.s., becoming the sole operator of the refining capacity in the Czech Republic. Full control of integrated production assets creates the basis for further improvement of the company s operating parameters. In 2015, works related to the merger of Benzina s.r.o and Polymer Institute s.r.o. with Unipetrol RPA s.r.o. were conducted to ultimately lead to the creation of a Unipetrol Group operational center, concentrating the key business processes. The aforementioned company merger was performed on 1 January A merger of Mogul Slovakia s.r.o. and Unipetrol Slovensko s.r.o, companies trading fuels, oils and grease manufactured by the Unipetrol Group, took place on the same day. The purpose of the Unipetrol Group in terms of wholesale was to strengthen its position on the domestic market and on export markets by creating companies operating directly on these markets. Such measures allow for improving the quality of locally provided services and for flexibly reacting to the needs of new consumer groups. Completing the aforementioned assumptions, Unipetrol RPA established company Unipetrol RPA Hungary Kft for the wholesale and retail sale of fuels in November 2015 in Hungary. Expansion of the Unipetrol Group on international markets is also a strategic step in the context of increasing processing powers resulting from the purchase of Ceska Rafinerska a.s. shares. ORLEN Południe Group On 1 January 2015, pursuant to a sales agreement concluded in December 2014, the organized part of an enterprise including the Heat and Power Plant and thermal networks and the remaining infrastructural property (e.g. electrical, gas, water networks) in Energomedia Sp. z o.o., a daughter company, was transferred to Rafineria Trzebinia S.A. The merger of Rafineria Trzebinia S.A. as the acquiring company with companies: Rafineria Nafty Jedlicze S.A., Fabryka Parafin Naftowax Sp. z o.o. and Zakładowa Straż Pożarna Sp. z o.o. was recorded on 5 January The name of the company was changed to ORLEN Południe S.A. The current operational strategy has remained unchanged and is focused on the primary segments related to the production and sales of biofuels and biocomponents, paraffin and solvents. Agreements concluded between ORLEN Południe S.A. and ORLEN Asfalt Sp. z o.o. concerning the lease of the Trzebinia asphalt production facility (Trzebinia Production Department) belonging to ORLEN Asfalt sp. z o.o. and the acquisition of functions related to this part of the assets entered into force on 1 March ORLEN Asfalt Sp. z o.o. On 2 January 2015, PKN ORLEN S.A. purchased production assets with logistics, located in Płock, in the form an organized part of an enterprise, from ORLEN Asfalt Sp. z o.o. Integration of ORLEN Asfalt Sp. z o.o. production assets under the Płock production plant will raise the effectiveness of operations in this area and will allow the company to concentrate on its commercial development in the country and on foreign markets. ORLEN OIL Sp. z o.o. On 2 January 2015, PKN ORLEN S.A. purchased production assets located in Płock with logistics and base oil sales (Oil Block), in the form of an organized part of an entreprise, from ORLEN OIL Sp. z o.o. Integration of ORLEN OIL Sp. z o.o. production assets under the Płock production plant will raise the effectiveness of operations in this area and will allow the company to concentrate on its commercial development, including the implementation of an effective sales strategy on domestic markets. On 5 January 2015 ORLEN OIL Sp. z o.o. merged with its subsidiary, Platinum OIL Sp. z o.o. through acquisition of all Platinum OIL Sp. z o.o. assets by ORLEN OIL Sp. z o.o. The merger aimed at increasing the effectiveness of decision making processes, simplifying structures and increasing the effectiveness of sales and distribution of oil and lubricants. The project of logistics and distribution centralization and outsourcing was continued. In May 2015, the company completed its measures related to the centralization of supplies to PKN ORLEN fuel stations, as a result of which the company assumes all PKN ORLEN S.A. fuel stations in Poland with direct service. ORLEN Paliwa Sp. z o.o. In 2015, a multi-stage process of changes in the wholesale fuel sales channel in the ORLEN Group was completed. The first stage of this process was the acquisition of fuel and fuel oil wholesale to a part of small and medium companies and wholesale discounts from PKN ORLEN S.A. by ORLEN Paliwa Sp. z.o.o. On 30 June 2015, ORLEN PetroTank Sp. z o.o. acquired ORLEN Paliwa Sp. z o.o., changing its name to ORLEN Paliwa Sp. z o.o. On 30 October 2015, ORLEN Paliwa Sp. z o.o. acquired ORLEN Gaz Sp. z o.o. The purpose of these structural changes was to create an entity with a vast commercial offer, as to allow for the full use of the scale effect in terms of logistics and sales solutions, and to ensure a competitive, complex and high-quality commercial offer. MANAGEMENT BOARD REPORT ON THE OPERATIONS FOR THE YEAR
102 Support function centralisation processes In 2015, projects of further centralization of accounting services, payroll and personnel processes within the ORLEN Group were continued. The standardization and automation of accounting processes was continued by implementing a process model of accounting service utilizing an electronic workflow system in the consecutive companies. In terms of human resources and payroll, ORLEN Ochrona was assumed with central HR-payroll service. At the end of 2015 ORLEN Centrum Usług Korporacyjnych Sp. z o.o. kept accounting books of 21 ORLEN Group companies along with payroll and personnel processes in 30 companies. Changes in capital relations in 2015 TABLE 5. Changes in respect of capital relations in the ORLEN Group. TYPE OF TRANSCATION/COMPANY TRANSACTION DATE NUMBERS OF SHARES ACQUIRED/DISPOSED OF SHARE IN THE CAPITAL AFTER THE TRANSACTION FOUNDATION OF THE COMPANY AND SHARES AUTHORIZATION by ORLEN Upstream Sp. z o.o.: Kiwi Acquisition Corp. 9 October % by UNIPETROL RPA, s.r.o.: UNIPETROL RPA Hungary Kft. 10 November % ACQUISITION OF SHARES by PKN ORLEN: Przedsiębiorstwo Inwestycyjno-Remontowe RemWil Sp. z o.o. 23 January % by UNIPETROL a.s.: Česká Rafinérská a.s. 4 May % by ORLEN UPSTREAM Canada Ltd.: Kicking Horse Energy Inc. 1 December % by KIWI ACQUISITION CORP.: FX Energy Inc December % by ANWIL S.A.: Pro-Lab Sp. z o.o. 18 February % Wircom Sp. z o.o. 20 November % Wircom Sp. z o.o. 15 December % DISPOSAL OF SHARES by ANWIL S.A.: Przedsiębiorstwo Inwestycyjno-Remontowe RemWil Sp. z o.o. 23 January % INCREASING THE CAPITAL OF THE COMPANY AND SHARES AUTHORIZATION by PKN ORLEN: ORLEN Upstream Sp. z o.o. 25 March % ORLEN Upstream Sp. z o.o. 1 October % ORLEN Upstream Sp. z o.o. 18 November % MERGERS: Rafineria Trzebinia S.A. (currently ORLEN Południe S.A.), Rafineria Nafty Jedlicze S.A., Fabryka Parafin Naftowax sp. z o.o. and Zakładowa Straż Pożarna Sp. z o.o. by transfer the property to ORLEN Południe S.A. 1) ORLEN Oil Sp. z o.o. and Platinum Oil Sp. z o.o. by transfer to ORLEN Oil Sp. z o.o. the property of Platinum Oil Sp. z o.o. ORLEN Serwis S.A., ORLEN Automatyka Sp. z o.o. and Przedsiębiorstwo Inwestycyjno Remontowe RemWil Sp. z o.o. ( RemWil ) by transfer the property of ORLEN Automatyka Sp. z o.o. and RemWil to ORLEN Serwis S.A. Baltic Power Sp. z o.o. and Baltic Spark Sp. z o.o. by transfer the property of Baltic Spark Sp. z o.o. to Baltic Power Sp. z o.o. 5 January % 5 January % 20 February % 19 March % MANAGEMENT BOARD REPORT ON THE OPERATIONS FOR THE YEAR
103 ORLEN PetroTank Sp. z o.o. and ORLEN Paliwa Sp. z o.o. pr by transfer the property of ORLEN Paliwa Sp. z o.o. to ORLEN PetroTank Sp. z o.o. (at the same time changing the name from ORLEN PetroTank Sp. z o.o. to ORLEN Paliwa Sp. z o.o.) ORLEN Paliwa Sp. z o.o. and ORLEN Gaz Sp. z o.o. by transfer the property of ORLEN Gaz Sp. z o.o. to ORLEN Paliwa Sp. z o.o. 30 June % 30 October % Unipetrol RPA s.r.o. and Polymer Institute Brno s.r.o. 31 December % REMOVAL FROM NATIONAL REGISTER COURT Orlen Oil Cesko s.r.o. in liquidation 14 February % Raf-Koltrans Sp. z o.o. in liquidation 3 June % ZWCh Wistom S.A. in bankruptcy 30 June % SIA Balin Energy in liquidation 2 July % Huta Gliwice S.A. in bankruptcy 17 July % CHEMAPOL SCHWEIZ AG in liquidation 21 August % UAB Paslaugos TAU in liquidation 30 September % OIEPCo in liquidation 31 October % Raf-Służba Ratownicza Sp. z o.o. in liquidation 14 December % 1) On PKN ORLEN S.A. was added to the register of shareholders of ORLEN Południe SA in place of the minority shareholders, whose shares are canceled Research and technological development In 2015, the ORLEN Group realized projects of research and development related to the implementation of new products and technologies, as well as resulting from the existing laws on environmental protection and the production and sale of chemicals. Modernizing the DRW IV installation in the Płock production plant, PKN ORLEN used research works concerning the improvement of yields and energy efficiency in atmospheric and vacuum columns. An analysis of the operation of feeder furnaces in the Flue Gas Desulfurization Installations was also carried out for the purpose of reducing carbon oxide emissions. Research works were also conducted for the purpose of expanding the production capacity of the polymer modified asphalt bases. In cooperation with the Jedlicze Refinery from the ORLEN Południe Group, technological trials aimed at obtaining raw material feed for the production of base oils were conducted. A project related to raising the energy efficiency of the PTA technological process was also carried out. Projects related to biomass processing into fuel components were also carried out, as dictated by care for the natural environment and resulting from the goals in the application of biofuels specified by the Renewable Energy Directive (RED) for In this area, PKN ORLEN and the Unipetrol Group joined the project conducted by the BIOENERGY competence center, concerned with biomass use issues. A project in advanced biofuels, concerning the development of alternative methods of sourcing higher-generation biocomponents was launched in cooperation with the University of Warmia and Mazury in Olsztyn and the University of Szczecin. As part of this project, a testing station for growing algae with the use of carbon dioxide and post-production, refinery waters will be built within the premises of the Płock Production Plant. The main goal of this project is to develop a biocomponent production technology based on oil algae and Baltic diatoms in the refinery operating conditions. In terms of tightening cooperation with the representatives of the world of science, a series of Innovation Day meetings was organized to allow representatives of the industry and science to share their knowledge in innovation in the industry and to identify potential areas for cooperation. As part of its strategy, PKN ORLEN has commenced a series of measures aiming at implementing and completing innovative projects in particular areas of its activity. By implementing innovative solutions and developing unique services, PKN ORLEN is building an innovative culture throughout the entire value chain. Poland s first open competition for innovative solutions increasing the energy efficiency of production processes was announced in The purpose of the competition was to find the most effective technological concept for the recovery and utilization of low-temperature heat from distillation columns. Under the project, the Concern established cooperation with an international expert in crowdsourcing initiatives NineSigma. Despite the considerable challenge and the complexity of the problem, the competition became the point of interest of numerous innovators (teams of specialists, research institutions, scientists) from 10 countries of the world. The Unipetrol Group has implemented research and development works in refinery products in cooperation with VÚAnCh (Inorganic Chemistry Research Institute) and the Polymer Institute Brno in terms of petrochemical products. In the refinery area, research activities were focused on processes related to the production of engine fuels and the processing of residual fractions. With growing quality requirements for engine fuels, a large-scale test of diesel oil additives used in the refinery industry was carried out. Due to the obligation to reduce the emission of greenhouse gasses by 2020, tests of the effect of particular types of biocomponents on the properties of the winter diesel oil and emission levels were performed. Projects related to heavy fractions aimed at developing innovative technologies for the construction of asphalt paving using recycled materials. Research in plastics was carried out by the Polymer Institute Brno. Long-term plans in petrochemistry stipulate improvement in the quality of the product portfolio and increase of production effectiveness. The possibility of utilizing light hydrocarbons from pyrolysis and their further use was researched in In terms of polyethylene production, the focus was on continued improvement of the utility values of the litens produced and the search for savings in manufacture costs. Production of block copolymers was MANAGEMENT BOARD REPORT ON THE OPERATIONS FOR THE YEAR
104 launched as an aftermath of research conducted in the past years, concerning non-phthalate catalysts. Furthermore, new possibilities for preparing copolymers of improved utility values and innovations in existing polymer types were considered with the purpose of reducing operation costs. A project for the construction of a University in the Chempark in Litvínovie Záluží was completed in cooperation with the Higher School of Chemistry and Technology in Prague (VŠCHT). The purpose of the project was to provide vocational preparation and education of students. The ORLEN Lietuva Group continued the performance of projects related to improving the energy efficiency of production processes and implementation of new technologies. One of its most outstanding works was the finalization of effective use of semi-product streams obtained in the Visbreaker Vacuum Flasher by modifying existing processes and selecting optimal catalysts. Works on improving the effectiveness of catalytic cracking were conducted. Thanks to the use of additives, an increase of the diesel oil stream was achieved in the installation. After completing the research, the production of bitumens using new components was started. Another important group of subjects assumed with research and development works were projects related to the adaptation of production processes to new environmental regulations. IKS Solino launched a pilot program for testing the long-term storage of gasoline in salt caverns. The best practices and research works were carried out by the Concern with the assistance of the State Research Institute and indicated that the storage of gasoline in caverns is safe from the geological, environmental and technological point of view. The ANWIL Group participated in the preparation of assumptions and principles for the INNOCHEM sector program which, at the initiative of the Polish Chamber of Chemical Industry, has been distributing subsidies under the Intelligent Development Operational Program. Participation in the program will be an opportunity to obtain financing for the second, three-year stage of the project related to the development of a technology for manufacturing ceramizing composites on the basis of PVC, implemented in cooperation with the Lodz University of Technology and the GIG Mining Institute. Production trials for the possibility of implementing a nanocomposite-modified PVC production technology were carried out in The trials were carried out with the participation of the Industrial Chemistry Institute, which granted a license for the application of the patented invention. As a result, trial PVC polymer series were obtained and forwarded to processing tests performed by PVC manufacturers cooperating with ANWIL S.A. ORLEN Asfalt has carried out finishing works related with the implementation of a new group of asphalts marked with the symbol ORBITRON HIMA, modified by a high content of special polymer. Additional laboratory tests of utility features of the paving with the new asphalts were carried out and ultimately, the product enriched the commercial offer of the company in In 2015, ORLEN Oil carried out research works assuming the modification (qualitative and concerning costs) of products, related to obtaining new product certificates and the definition of directions for the development of lubricant technology. A series of works related to the adaptation of quality of oils to the expectations expressed by the clients were undertaken. Technologies for 14 new products were developed and implemented in the group of automotive oils, 3 in the group of consumable fluids and 21 technologies in the industrial oil area. In 2015, HETG and HEES hydraulic oils received EEL certificates (European Eco Label) as the most environmentally friendly products. These are the first certificates of this type, awarded for lubricants in Poland. Furthermore, ORLEN Oil has been actively cooperating within the structures of the Technical Association of the European Lubricants Industry (ATIEL), the manufacturers of NLGI grease, the European Committee for Standardization (CEN). ORLEN Południe Group has been continuing works related to the optimization of yields in the Fractional Distillation Installation (DRW). Works related to the optimization of raw materials in the hydro-refined and semi-refined paraffin area as well as to the expansion of the commercial offer of paraffin products were also continued. Production and sales of treatment oil was launched as a result of a project for the development of a new generation of metalworking fluids obtained from the recycling of waste oil. Works related to the concept of development of the 2nd and 3rd generation of biofuels were continued with the presence of PKN ORLEN. In 2015, the Upstream ORLEN Group continued its research and development works submitted in the first edition of the Blue Gas sector program, coordinated by the National Center for Research and Development. The purpose of the program is to create and commercialize shale gas in Poland. As part of the program, research and development projects devoted to the development of geological analyses, seismic surveys, methods of estimating resources and risks, construction of deposit engineering models and development of optimal concepts for the management of deposits in the extraction of shale gas are carried out cooperation with companies PGNiG and LOTOS Petrobaltic, and the academic centres: the AGH University of Science and Technology, the Warsaw University of Technology, the Gdansk University of Technology, and the Oil and Gas Institute. The Ungaslab project was also launched in 2015, the purpose of which is to create innovative services facilitating research in deposit engineering in unconventional reservoir rocks (lowporosity and low-permeable rocks) and the development of tools and services for unconventional deposit exploration and extraction. The project is carried out under the European Institute of Technology (EIT), in cooperation with the AGH University of Science and Technology and the Bay Zoltán Hungarian research center. ORLEN Laboratorium Sp. z o.o. launched research works related primarily to the corrosive-sediment assessment of production installations and new methods for testing crude oil for PKN ORLEN. MANAGEMENT BOARD REPORT ON THE OPERATIONS FOR THE YEAR

105 2.5. Downstream segment MANAGEMENT BOARD REPORT ON THE OPERATIONS FOR THE YEAR

106 2.5.1 Market trends in the downstream segment Adam Czyżewski, Chief Economist: The predictability of crude oil daily prices can be currently compared with the predictability of short-term floating exchange rate differences. The price of crude oil is one of the central macroeconomic categories, as it affects everything, beginning with the decisions of central banks regarding percentage rates and exchange rates, through state budget to the revenues and expenses of companies and households, and remains affected by these factors. Following a cartel decision of November 2014 to defend its share on the market, the price of crude oil seeks support in unpredictable end costs of extraction. The process will last until the surplus of crude oil supply is not absorbed. Before this happens, the price of crude oil can fluctuate in a relatively wide range. Afterwards, the price will increase, and the growth rate will depend on the reduction scale of the extraction capacity. Crude oil prices In the beginning of the year, a barrel of crude oil cost USD 55, whereas in the middle of May 2015, its price increased to USD 66, after which a drop in quotations commenced down to 36 USD/bbl in the end of the year. Lower prices generally resulted from a surplus in crude oil supply and excess of extraction capacity which grew in the environment of high prices maintaining from the middle of the year A downward trend was additionally reinforced by growing impact of geopolitical factors, expectations of lifting the sanctions imposed on Iran and the continuously high production of crude oil in OPEC countries. Demand factors related to the risk of deteriorated demand, resulting from a slowdown of the Chinese, Brazilian and Indian economies were also recorded. DIAGRAM 5. Change in prices of crude oil [USD/bbl]. Source: Bloomberg Demand and supply of raw material High supply of crude oil, compared with its demand, recorded in the horizon of a year or two will affect the level of prices. The market of crude oil supplies is also changing due to structural changes in the economies of the main developing countries and efforts to raise energy efficiency. However, after levelling demand with supply, some adverse geopolitical factors can be taken into account, which, at the current low level of extraction capacity reserves in OPEC countries, can add risk premium to the price. TABLE 6. Crude oil market in [million bbl/d]. ITEM World Demand Total World Supply, including: Non-OPEC Supply OPEC Source: Data by International Energy Agency (IEA). In 2015, demand for crude oil grew by 1.6 mbbl/d (by 1.7%) and this was one of the largest growths in the recent years, stimulated primarily by the fast drop in prices, which started in the second half of 2014 and was recorded throughout Crude oil demand forecasts according to IEA up to 2021 assume average annual increase by billion 1.2 bbl/d, which is a solid perspective in the historical perspective. Potential trends in changes of crude oil price In the short-term perspective to 2020, the dominant part of publicly available analyses and forecasts assume a break-through in the prices of crude oil. Forecasts indicate that in the middle of 2017, the crude oil market should reach a point of balance between demand and supply, which can constitute an impulse for raising the price of this raw material. Main factors affecting the prices of crude oil in 2016 are: - OPEC countries extraction policy in the past, OPEC accustomed the market to foreseeable crude oil prices. Currently, a part of the member states is forced to extract crude oil below the break-even point. Therefore, a conflict has been growing between particular members of the cartel, which can lead to successive turbulences on the crude oil market in Slowdown of world economic growth the driving force of the global economy and the largest consumer of raw materials China has been undergoing an economic slowdown. The process is very difficult to reverse using traditional monetary and fiscal policy, which stands for further slowdown in the successive years turning into dropping demand for raw materials for energy. - Return of Iranian crude oil on the market on 17 January 2015, a memorandum of understanding concerning the limitation of the Iranian nuclear program entered into force in return for gradual lift of the prevailing sanctions. The sanction lift can entail the supply of additional 400,000 bbl/d until the end of Growing geopolitical risk 2015 was the first year since a long time with a geopolitical risk factor. In 2016, deteriorating situation in the most turbulent regions of the world, that is in North Africa, in the Middle East and in Ukraine, might stimulate the change of the raw material prices dynamic. The above specified factors implied the Brent crude oil prices forecasts to 2020 to hover around USD/bbl, however, at the turn of 2015 and 2016, forecasts declaring prices below 30 USD/bbl have also appeared. Balancing the crude oil market will be possible thanks to the supply reduction. MANAGEMENT BOARD REPORT ON THE OPERATIONS FOR THE YEAR
107 DOWNSTREAM SALES AND PRODUCTION In 2015, the market of petroleum products in Europe recorded good results, primarily thanks to dropping crude oil prices. Their level was generally affected by the surplus in crude oil supply, with a relatively stable level of demand. A drop in the price of crude oil caused an increase in product margins, thanks to the mechanism of delay in adapting fuel prices to drop in crude oil prices. The increase in margins improved the profitability of crude oil processing and stimulated growth of refining capacity. In turn, the allocation of higher product volume on the market required a decrease in their prices. DIAGRAM 6. Refining margins in Europe [USD/bbl] - Potential surplus in stocks. Absorption of crude oil surplus entails its processing to refinery products, which is currently performed at a very high pace, die to beneficial margins. Since the increase in margins and processing does not result from increased demand, the market will undergo a growth in refinery product stocks, which will create pressure on their prices. - Relative stability of demand. A strong reduction of margins could be stimulated by a breakdown in fuel demand as a result of global recession caused by geopolitical factors, however, the probability that this scenario will come to life is relatively low. The key driver for the growth demand of fuel in Europe will be plunging crude oil price lower fuel prices translate into growth in their consumption. Higher forecasts of growth of demand for gasoline, exceeding the demand for diesel oil are symptomatic. Growth of gasoline sales is also manifested by new, more restrictive emission standards implemented by the EU and improving quality of gasoline engines. In turn, according to HIS forecasts, the European demand for diesel oil has and will maintain a slightly increasing trend to 2030 (increase of CAGR 1 by 0.8% per annum). In Poland, a growth tendency is particularly displayed by projected demand for jet fuel, thanks to a growing volume of air carriage in Poland according to available forecasts, the number of passengers carried to 2020 can increase by nearly 37% compared to Growing demand for gasoline is the effect of a growing number of vehicles registered in Poland according to data published by the European Automotive Manufacturers Association, the number of newly registered vehicles increased by 18% in Poland in 2015 compared to Source: IHS. In 2016, the refinery industry in Europe will be affected by a series of factors, which will determine the dynamic of margins. The most important are the following: - The surroundings of refineries. Currently, the European refinery industry is under structural pressure of low demand. Additionally, competition from the Middle and Far East refineries, development of production capacities in Russia and increase of fuel production in that market create a risk of fuel import and decrease of margins of the local manufacturers in Europe. The release of crude oil export in the US may have a positive impact and narrow the Brent/WTI differential, thus partly improving the competitive position of European refineries in relation to their competitors from the US. - The position of refineries. European refineries are working with reduced production capacity, which additionally raises the costs and limits profitability. They are relatively older and, consequently, less effective to the competitive refineries in the Middle East and Asia. Therefore, despite the current improvement in the industry, the issue of efficiency improvement, in a long term, will be of high significance for European refineries. DIAGRAM 7. Compound Annual Growth Rate (CAGR) in Poland [%]. Source: JBC Energy In the Czech Republic an increase in demand for jet fuel is anticipated, assuming stable demand for gasoline and LPG. According to JBC Energy, maximum demand for diesel oil is to fall in the years primarily due to the development of the transport sector, whereas in the successive years, i.e. to 2020, demand for diesel oil will drop (CAGR (-) 0.9%). 1 CAGR compound annual growth rate. MANAGEMENT BOARD REPORT ON THE OPERATIONS FOR THE YEAR
108 DIAGRAM 8. Compound Annual Growth Rate (CAGR) in the Czech Republic [%]. Source: JBC Energy The German market is the focal point for all western European fuel market trends. There are forecasts of decrease in demand, mainly for gasoline. For several years, we have been witnessing progressive deterioration in automotive usage rates and growing effectiveness of engine use. The number of registered vehicles dropped from 559 per 1000 residents in 2008 to 540 currently. The use of alternatives to combustion engines is growing, and Germany is the third country in Europe in terms of registration of electrical cars. DIAGRAM 9. Compound Annual Growth Rate (CAGR) in Germany [%]. Source: JBC Energy In the Baltic states, the anticipated growth in demand for fuels concerns primarily Diesel oil and results from the region economy development forecast, stipulating an average growth by 3.5% per annum to DIAGRAM 10. Compound Annual Growth Rate (CAGR) in the Baltic countries [%]. Source: JBC Energy A series of economically significant factors affect the European refinery sector: - Competition from refineries in the Middle East. IHS analysts expect refining capacity in the Middle East to increase nearly by 2.2 million bbl/d to State investments in the countries of this region are partially forced by the need to diversify the source of income, and to provide stimulus for economic growth and to stimulate employment in these fastgrowing populations. With decreasing export of diesel oil to China, caused by the Chinese economic slowdown, Middle Eastern countries might look for new disposal markets, also in Europe. - Russian manufacturers policy, aiming at selling higher volume of processed products instead of the raw material. Russia has been increasing its fuel export, taking advantage of the market situation and modernization of own refineries. Russia is producing 2.5 more diesel oil than it consumes (production of 1,500 thousand bbl/d, compared to consumption of 600 thousand bbl/d). In turn, demand for gasoline is practically balanced with production. Increased processing, securing consumption of gasoline, simultaneously forces domestic companies to export diesel oil. The problem which most of the Russian refineries can encounter in increasing export to Europe is the fact that production of diesel oil has been growing faster, exceeding the transfer capacity of pipelines. At this point, increasing the fuel transfer capacity has become the main priority of the Russian refinery industry. In result of these measures and additional upgrading works, Russian pipeline throughputs are to be increased by 515 thousand bbl/d to This will allow for further increase of diesel oil export to Europe in the next years, implying the excess of diesel oil in Europe. - Loss of the American market. Due to increased production of hydrocarbons from unconventional deposits in the US, Europe has practically lost its opportunity to export gasoline surpluses to the American market. - Introduction of regulatory limitations. Adaptation of production processes to community regulations in terms of the share of biocomponents and other renewable fuels in the general amount of fuels consumed in transport, high penalties for the non-performance of specific levels or the abolishment of tax exemptions related to the use of biocomponents and biofuels in production are the dominant factors to impact the cost of operation of petroleum concerns in Europe. Restrictive regulations regarding environmental protection and greenhouse gas emissions act to the diminish competitiveness between the European refineries and Chinese, Indian or US companies. One of the biggest challenges for the manufacturers of the petrochemical sector in Europe is the development of new production capacities in the USA, in the Middle East and in Asia. Due to low natural gas prices, thanks to the shale revolution in North America, the costs of manufacturing of petrochemicals in the US fell nearly to the costs from Middle Eastern countries. Asian markets have become the most important markets for petrochemical products, but it is worth noticing, that these very regions are expected to undergo the fastest growth of production capacities in the next years. Low gas prices in North America in the last 8 years allowed for increase the supply of ethylene characterized by lower production costs compared to Europe, where production is based on crude oil. In world petrochemistry, the cost of raw material and energy determines competitiveness and constitutes approx. 70% of the product cost. MANAGEMENT BOARD REPORT ON THE OPERATIONS FOR THE YEAR


109 The European petrochemical industry will have to face a competition challenge from the USA, which has considerable raw material advantage. European manufacturers display significant diversification of potential to achieve economic benefits the main factors are: the scale of operations, integration with the refinery, location and technology as well as age of the installations. Companies having installations based on gasoline feeds convert parts of their production to lighter LPG mixes. The main drivers for improving the situation of manufacturers in Europe are cost reduction, margin improvement and plant restructuring programs. Further technological development and other process innovations will also be important. Among optimization measures including improvement of price policy, the portfolio of specialized products featuring higher margins is also possible. The commencement of production of more advanced products requires not only changes in terms of change of production installation regimes, but also strong R&D competences, capital expenditures and reorganization of sales channels, as well as establishment of relations with clients. The prevailing gap between polyolefin consumption ratios for Western Europe and Poland as well as Central-Eastern Europe indicates further growth potential for the ORLEN Group in this area. DOWNSTREAM POWER INDUSTRY Over 80% of the energy consumed worldwide currently comes from fossil fuels: crude oil, coal and natural gas. In today's conditions the cheapest energy source is coal. However, it is expected that, in the long term, coal as an energy source will be replaced with natural gas and renewable energy sources. The change will be dictated by the necessity of decarbonisation of DIAGRAM 11. World energy power [GW]. industry and fuel prices. After 2035 gas will be the largest source of electricity generation. Less expensive crude oil will have undoubtedly impact on the reduction of gas prices. Shale gas, which price in the United States and Canada is low, competes for primacy with coal in particular by offering a significant reduction in CO2 emissions. DIAGRAM 12. Demand for electricity in the various regions of the world. Source: IEA The pace of economic growth plays an essential role in shaping electricity consumption trends. Increase in demand in non-oecd countries will be stimulated by fast economic growth and increasing revenues, growing population and the development of urban agglomerations. According to the 2015 World Energy Outlook report published by the International Energy Agency, the average pace of demand increase for electricity in non-oecd countries in will equal 2.9% per year, whereas in OECD countries only 0.7% per year. Despite the fast growth of demand for electricity per capita, non-oecd countries will consume less than 40% of the average consumption per capita in the OECD countries in In the power industry area of the downstream segment of the ORLEN Group, the core market is Poland - favourable growth prospects are provided due to lower energy consumption compared to most European countries. In Poland, energy consumption per capita is significantly lower than the average in the European Union and amounted to 4.1 MWh/capita in 2015 with the average of 5.4 MWh/capita in the European Union. In , demand for electricity in Poland was growing at the average pace of 1.3% a year. In , we are expecting an acceleration of growth of demand for electricity (acc. to CERA, CAGR will equal approx. 1.8%). Growth of demand for electricity is anticipated in Poland in years , which will be primarily related to the economic development of the country. DIAGRAM 13. Domestic demand for electricity in Poland in years [TWh]. 1) Source: IEA 1) Final demand for electricity, i.e. without taking into account losses in transmission and own needs of power plants Until 2011, wholesale prices of electricity indicated a stable growth. In , a drop in prices from 180 PLN/MWh at the end of 2011 to approximately 140 PLN/MWh at the end of 2013 was recorded. Following the growth in 2014 (to a level of approx. 190 PLN/MWh), prices were stable in 2015 at the level of approx. 150 PLN/MWh. A considerable part of the production capacity in Poland requires modernization and/or replacement due to their age and high emission rates. It is estimated that approximately 5 GW of production capacities should be withdrawn from the market until MANAGEMENT BOARD REPORT ON THE OPERATIONS FOR THE YEAR
110 The Czech market of electricity was fully liberated in 2006 and is currently one of the most mature European markets. In years , energy demand was relatively stable (CAGR 0.3%). In years , according to CERA, a demand growth of approx. 1.5% is anticipated. The main energy wholesale facility is the Prague Energy Exchange (PXE). The Lithuanian energy system generates a total consumption of 10 TWh/annum. The Mazeikiai refinery is the largest recipient of energy in Lithuania, consuming approx. 0.6 TWh per year. In years , energy consumption by end users in Lithuania grew at the pace of 2.6% per year. In years , according to CERA, average demand growth of approx. 2.4% is anticipated. Lithuania is also an importer of electricity from the neighboring countries. In the future, development of renewable energy sources (RES) in the world is also expected. It will be supported by regulations aimed at reducing CO2 emissions and preferential treatment of RES. In 2014, the EU agreed targets for reducing CO2 emissions and the share of renewables in energy consumption for 2030 years. Target for CO2 reduction and the target for the share of renewable energy is 40% and 27%, respectively (compared to 1990). An important step towards a global consensus was also the agreement between the US and China, which are the world's biggest CO2 emitters to reduce greenhouse gas emissions. In Poland, over 80% of electricity is generated from coal, but the share of renewable energy sources is gradually increasing. In 2005, the share of RES in energy production amounted to 2.4%, in %, while in 2014 up to 12.5%. MANAGEMENT BOARD REPORT ON THE OPERATIONS FOR THE YEAR

111 2.5.2 The ORLEN Group s position and competitive environment Krystian Pater, Member of the Management Board, Production: After 50 years of operation of the Płock Production Plant, we have beaten another record in crude oil processing. Last year, we processed 15.7 million tonnes, which exceeds the current best results from by half a million tons. Higher crude oil processing was possible mainly due to full use of the potential of the installations in terms of improving yields in our key units, implementing an innovative process control system with APC systems (Advanced Process Control), and extending periods between maintenance standstills. We are following our strategy, we are systematically researching and searching for new, better technologies suitable for use in our facilities, and we are striving to use our resources in the Płock Production Plant and other production facilities in the Capital Group in a broader and more effective manner. MAIN PRODUCTION ASSETS OF THE ORLEN GROUP SCHEME 3. Types of European refineries. Source: Own calculation based on Wood Mackenzie. Total capacity of the ORLEN Group amounts to 35.2 million tonnes. Production plant PKN ORLEN in Płock is one of the modern integrated production facilities in Central and Eastern Europe with annual capacity of conversion at the level of 16.3 million tonnes per year. According to Wood Mackenzie's ranking, the complex has been classified as a so-called Super-Site, which means refinery of strategic importance characterized by large depth of crude oil processing, integrated with petrochemical activity and generating high margins. Within petrochemical production area the key installation Olefin has maximum capacity about 700 thousand tonnes of ethylene and about 380 thousand tonnes of propylene. Produced monomers are input used to production of polymers in BOP and PVC installation in the ANWIL Group. PKN ORLEN has also modern complex PX/PTA, which capacity amounts to 400 thousand tonnes of paraxylene, which enables production of 600 thousand tonnes of terephthalic acid. Other Polish PKN ORLEN refineries are located in the southern Poland (Trzebinia and Jedlicze). They specialize mainly in services related to the storage and distribution of fuels, production of bio-components, base oils, heating oils and regeneration of spent oils. At the beginning of 2015 they were merged and currently they are operating as ORLEN Południe. Taking into account size of capacity, the second largest production plant in the ORLEN Group and also the only one on the market of the Baltic countries (Lithuania, Latvia and Estonia) is a refinery belonging to ORLEN Lietuva. Capacity of the Lithuanian refinery amounting to 10.2 million tonnes per year exceeds the demand of the local market and enables directing part of the products to the worldwide markets by sea. Crude oil processing in the Unipetrol Group is realized by refineries in Kralupy and in Litvinov. In 2013, the Unipetrol Group signed an agreement for the purchase of 16.4% of shares in Ceska Rafinerska a.s. from Shell. Continuing the consolidation process of refinery assets in 2014, Unipetrol concluded an agreement with the Italian concern Eni, for the purchase of the next 32.4% of the shares in Ceska Rafinerska. In May 2015, the Unipetrol Group finalized the acquisition of shares from Eni and thus became the sole owner of the refineries belonging to Ceska Rafinerska, which resulted in higher availability of production capacities and guaranteed the safety of raw material supplies to the petrochemical segment. The total production capacities of the Unipetrol Group grew to 8.7 million tonnes/year. The Unipetrol Group also possessed petrochemical assets of total production capacities of approx. 600 thousand tonnes/year, including 320 thousand tonnes of polyethylene and approx. 280 thousand MANAGEMENT BOARD REPORT ON THE OPERATIONS FOR THE YEAR

112 tonnes of polypropylene. Construction of a new Polyethylene 3 installation of total production capacity of approx. 270 thousand tonnes/year is in progress and will allow for increasing the use of the ethylene installation and for deeper integration of petrochemical and refinery production in the Unipetrol Group. The biggest competitors of the ORLEN Group in Central and Eastern Europe are: Lotos Group with headquarter in Gdańsk second largest refinery in Poland. Mitteldeutschland Refinery in Leuna/Spergau of Total Group, located in the south-eastern Germany, about 150 km from the Polish-German border, the most modern of German refineries. PCK Refinery in Schwedt located northeast of Berlin, about 20 km from the Polish-German border. Slovnaft Refinery - integrated refining and petrochemical group with a dominant position in the Slovak Republic, located near Bratislava, about 350 km from the Polish border. Mozyr Refinery - leading Belarusian refinery. The ANWIL Group is one of the largest chemical companies in Central Europe, the only producer of polyvinyl chloride (PVC) in Poland and the Czech Republic, as well as one of the major producers of sodium hydroxide and fertilizers in Poland. The ANWIL Group's production capacity is at the level of 1,160 thousand tonnes per year of nitrogen fertilizer, approx. 560 thousand tonnes per year of PVC and granules, approx. 360 thousand tonnes per year of sodium hydroxide and about 50 thousand tonnes per year of caprolactam. The Basell Orlen Polyolefins Group has facilities with total capacities at the level of 820 thousand tonnes, including 320 thousand tonnes of high density polyethylene ( HDPE ) and 100 thousand tonnes of low density polyethylene ("LDPE") and 400 thousand tonnes of polypropylene. BOP products are distributed both in domestic and foreign markets. MARKET SHARES OF THE ORLEN GROUP IN DOWNSTREAM SEGMENT Wholesale of refinery products In 2015, the ORLEN Group conducted wholesale of refinery products in Poland, Czech Republic, Germany, Slovakia, Hungary, Lithuania, Latvia, Estonia, Finland and Ukraine and by sea to Western Europe transshipment terminals. The ORLEN Group s domestic markets include: Polish, Lithuanian and Czech markets. The ORLEN Group has an extensive portfolio of refinery products, among others: gasoline, diesel, jet fuel, light and heavy heating oil and a wide range of non-fuel products and semiproducts. Growth in total sales of gasoline and diesel oil, which the ORLEN Group reached on the Polish market, allowed for maintaining high market shares at the level of 59.5%. Introduced legal regulations, concerning illicit fuel trade (also referred to as the shadow economy ), can particularly stimulate increase in the consumption of fuels, as announced in official statistics, and can therefore disturb the dynamic of changes in the ORLEN Group market shares. DIAGRAM 14. Participation in the wholesale fuel market in Poland. DIAGRAM 15. Participation in the wholesale fuel market in the Czech Republic. Source: Own calculation. Despite aggressive competition from Scandinavian and Belarussian suppliers, the ORLEN Lietuva Group maintained its leading position in the fuel sales sector of the Baltic markets, increasing its total share on the market in 2015 by 7 p.p. DIAGRAM 16. Participation in the wholesale fuel market in the Baltic countries. Source: Own calculation. Considerable growth of production potential of the Unipetrol Group allowed for increasing sales and strengthening the Group s leading position on the Czech market. Source: Own calculation. MANAGEMENT BOARD REPORT ON THE OPERATIONS FOR THE YEAR

.")
113 Wholesale of petrochemical products The ORLEN Group is one of the largest petrochemical companies Central and Eastern Europe and the only producer of monomers and polymers on the Polish market and most petrochemical products on the Czech market. Competition in the European market is determined by the type of manufactured and offered petrochemicals products. Polyethylene The production capacity of high and low density polyethylene in Europe are at a level of about thousand tonnes/year. The largest producer of polyethylene is a company Lyondell Basell Industries, which has a production capacity of about thousand tonnes/year (including a 50% stake in BOP). The company has assets located in Germany, France and Poland. The second largest producer is Ineos Olefins & Polymers Europa with a production capacity of around thousand tonnes/year and assets located in Belgium, France, Germany, Italy and Norway. The third largest producer is Sabic with a production capacity of about thousand tonnes/year and assets located in Germany, the Netherlands and the UK. Other major producers are Total Petrochemicals, Borealis and ExxonMobil. DIAGRAM 17. Polyolefins producers in Europe. Source: Own calculations based on POLYGLOBE. Polypropylene Polypropylene production capacity in Europe is at the level of about thousand tonnes/year. The largest producer of polypropylene is a company Lyondell Basell Industries, which has a production capacity of about thousand tonnes/year (including a 50% stake in BOP). The company has assets located in Germany, France, Italy, Spain, the UK and Poland. The second largest producer is Borealis a company with a production capacity of around thousand tonnes/year and assets located in Belgium, Germany, Austria and Finland. The next major producers are Total Petrochemicals with a production capacity of about thousand tonnes/year and assets located in Belgium and France, and Sabic having production capacity of thousand tonnes/year and assets located in the Netherlands and Germany. The total share of BOP and the Unipetrol Group in the European polyethylene production capacity is approx. 4% and about 4% in case of polypropylene. DIAGRAM 18. Polypropylene producers in Europe. Source: Own calculations based on POLYGLOBE. PTA PTA production in the European market in 2015 amounted to about 2,611 thousand tonnes/year, with nominal production capacity of approximately 3,883 thousand tonnes/year. This results from the fact that the actual production recorded by Artlant in 2015, compared to minimum production powers, was significantly reduced due to long-term shutdown of the Portuguese manufacturer (since Q3 2014, the installation was operational for 3 weeks in October 2015, and the re-start of production is planned for the second half of 2016). PTA in Europe is mainly used for the production of PET granulate intended for food bottles (about 85% of European production) and the production of polyester fibers (about 5% of European production) and foil (about 3% of European production). There were 7 PTA producers on the European market. In 2015, a decision was made to close the production unit Indorama Ottana Energia JV with nominal production capacity of 190 thousand tonnes/year. The largest producers of PTA in Europe are: BP Chembel NV located in Belgium with nominal capacity of 1,400 thousand tonnes/year, the company Artlant in Portugal with nominal production capacity of 750 thousand tonnes/year and PKN ORLEN with production capacity of 600 thousand tonnes/year. In total, these three producers represented in 2015 over 72% of European nominal production capacity in the PTA segment. The ORLEN Group in 2015 had a 16% share in the nominal European production of PTA and was the only one in Europe holding PTA manufacturing systems fully integrated with the production of paraxylene. Planned in the future investments of PTA in Europe, except from planned for the Q1/Q increase of production powers of the Indorama Rotterdam installation (by 250 thousand tonnes/year), concentrates in Russia: Etana (750 thousand tonnes/year 2020), Mogilev (600 thousand tonnes/year 2020) and OJSC TANECO (210 thousand tonnes/year 2021). MANAGEMENT BOARD REPORT ON THE OPERATIONS FOR THE YEAR
 is about 7,500 thousand tonnes/year.")

114 DIAGRAM 19. PTA producers in Europe. Fertilizers Total ammonium nitrate and nitro-chalk production capacity in 28 countries of European Union (including Switzerland and Norway) is about 7,500 thousand tonnes/year. The product is used mainly in agriculture as a fertilizer. The largest producer is Yara with 23% share in the European market. The next big manufacturers are Borealis and Azoty Group with 10% and 9% market share respectively. The share of ANWIL S.A., regarding the production capacity, in the market of ammonium nitrate and nitro-chalk is 6% and places ANWIL in the 4th position. Source: Own calculations based on PCI. Plastics PVC nominal production capacity in Europe is 7,858 thousand tonnes/year, whereas Oltchim and Karpatneftekhim, recording nominal production capacities of approx. 300 thousand tonnes each, have been permanently shut down for a long time. The leading manufacturers of PVC in Europe are INOVYN (a company established through the merger of Ineos Chlor and Solvay), Kern One and Vynova. The share of these companies in normal PVC production capacities is estimated, respectively, for: 31.5%, 11.0% and 10.5%. Estimated share of the ANWIL Group, with the production capacity of 475 thousand tonnes/year, in the European production capacity is approx. 6% and places the company in the 6th position. The ANWIL Group's main competitors in the PVC domestic and European market are BorsodChem, Inovyn and Vynova. DIAGRAM 21. Ammonium nitrate and saltrzak producers in Europe Source: Own calculations based on Fertilizers Europe. Core products, goods and services of the ORLEN Group are described in point DIAGRAM 20. PVC in Europe. Source: Own calculations based on IHS. LOGISTICS ASSETS OF THE ORLEN GROUP Efficient logistics infrastructure is the key element of the competitive advantage of the ORLEN Group on the market. The ORLEN Group uses a network of mutually complementary infrastructure elements: fuel terminals, onshore and offshore handling facilities, networks of raw material pipelines. In 2015, product logistics in the ORLEN Group was based on pipeline use, on railway transport, as well as on tank truck carriage. In 2015 pipeline transport was the primary transport form of raw materials and products. The total length of used product and raw material pipeline networks, belonging to external entities and own facilities in Poland, the Czech Republic and in Lithuania was nearly 3.8 thousand km (2.1 thousand km are product pipelines, and 1.7 thousand km are raw material pipelines). On the Polish market PKN ORLEN uses 620 kilometers of pipelines owned by Przedsiębiorstwo Eksploatacji Rurociągów Naftowych "Przyjaźń" and its own transportation infrastructure with a length of 338 km consist of two sections: Płock - Ostrów Wielkopolski - Wrocław with a length of 319 km and Wielowieś Góra (IKS Solino) with a length of 19 km for the transport of fuel products. Crude oil transport is performed primarily with the use of a network of pipelines belonging to PERN Przyjaźń, of a total length of 887 km, as well as using own pipeline of 43 km, linking MANAGEMENT BOARD REPORT ON THE OPERATIONS FOR THE YEAR

115 Góra (IKS Solino) to Żółwiniec (connection to the PERN Przyjaźń pipeline). For operational purposes of receipt, dispatch and loading of fuel in 2015, the ORLEN Group used in aggregate 24 facilities (own fuel terminals, terminals owned by entities from the ORLEN Group and third parties centres). The total storage capacity within own infrastructure and based on agreements concluded at the end of 2015 amounted to 7 million m 3. In 2015 on the Czech market, the ORLEN Group used 1,774 km of pipelines (1,110 km of product pipelines owned by CEPRO and 674 km of raw material pipelines owned by MERO) and 12 storage and distribution stations belonging to the state-owned operator CEPRO and 2 storage facilities leased from third parties. The main component of the logistics infrastructure, currently used on the Lithuanian market, is the raw material pipeline with the length of 91 km, linking the Butinge terminal with the Mazeikiai refinery. Both the terminal and the pipeline are owned by ORLEN Lietuva. On the German market, ORLEN Deutschland has taken advantage of the warehouse-distribution capacities in five facilities located in the northern part of Germany, belonging to external entities. Fuel transport on this market is performed entirely with the use of road transport. SCHEME 4. Logistics infrastructure used by the ORLEN Group in Europe. MANAGEMENT BOARD REPORT ON THE OPERATIONS FOR THE YEAR

116 POWER INDUSTRY The ORLEN Group is a significant producer of electricity and heat, which is used in large part for their own production needs. It is also one of the largest consumers of gas in Poland and an active participant in the process of liberalization of the gas market. According to the assumptions of the ORLEN Group strategy, the current production sources are undergoing upgrading projects and new investments in the form of gas-steam blocks are carried out. The ORLEN Group currently owns energy blocks in the three countries. In Poland, they are located in Płock, Włocławek, Jedlicze and Trzebinia. In the Czech Republic in Litvinov, Spolana, Kolin and Pardubice and Lithuania in Mazeikiai. SCHEME 5. Energy assets in the ORLEN Group. PKN ORLEN Power Plant in Płock ("PP") is the largest in terms of installed capacity industrial power plant in Poland and one of the largest in Europe, producing heat and electricity in the highefficiency cogeneration. The total installed electric capacity is 345 MWe and installed thermal capacity is MWt. The PP provides, as the basic supplier, heat in steam and heating water and electricity - the media used for the production installations and for external customers including the city of Płock. Different types of fuel may be used for the production of electricity and heat: heavy fuel oil as the primary fuel, natural gas and post-refining gas. In 2015, in the PP in Płock, the construction of an installation of Catalytic Denitrification and Dedusting was continued. Alongside the construction of Catalytic Denitrification and Dedusting installation, on individual boilers, flue gas desulphurization installation based on the wet-limestone technology, used to desulphurization of flue gas from all boilers, was constructed and commissioned in December After the launch of the aforementioned installations, the PP in Płock fulfilled environmental requirements effective as of the beginning of Construction of the gas-steam power plant in Włocławek of 463 MWe in total power. The installation will be strictly technologically linked to the ANWIL Group Production Plant. The initial, contractual completion term for the investment the end of 2015 was shifted to the turn of the quarter II and III of 2016 due to extension of construction-installation works. In Q4 2015, a series of works related to start-up was carried out. Tests and assessments related to the electrical and power systems and PSE power connections were completed, gas turbine burners were lit up, inducing turbine rotations. After commissioning, the newly built power plant will serve as the main source of technological heat and electricity for the ANWIL Group, and the surplus of electricity manufactured will be allocated by PSE on the domestic market. Construction of a gas-steam block of 596 MWe in Płock was commenced in In April 2015, the site was handed over to the General Contractor a consortium of Siemens AG and Siemens Polska Sp. z o.o. As of the beginning of July, the Contractor obtained a replacement building permit for the construction project and commenced civil works. All earthworks related to technological and auxiliary buildings were completed until the end of the year. The foundation slab for the boiler room, the water conditioning station and raw and demineralized water tanks were completed. Apart from the construction of the gassteam block, contract and design works devoted to the infrastructure required for its launch were carried out, i.e. devoted to the 400kV block line, the 30kV busbars, the multi-chamber reactors for decarbonized water, and to the ICT installations. At the end of 2015, technical documentation required for obtaining an environmental decision for the construction of the 400kV line was submitted. Furthermore, a tender for the appointment of contractor of this line was announced. The completion of this investment is planned for the end of Energy trading The Energy Trading Department of PKN ORLEN is responsible for trade within the entire ORLEN Group, on the Polish, Czech, German and Lithuanian markets. The Active Energy Trading Group was operating in 2015 and optimized additional energy production from TG6 (Płock PP) and T700 (Unipetrol) to optimize the work of turbines. Arbitration transactions on the wholesale electricity market were also carried out. In 2015, the formation of retail structures was commenced to extend the margin chain and to be able to offer energy to end recipients in The Polish renewable energy industry is primarily based on wind turbines was marked by continuing works on the draft of act on renewable energy sources, which would guarantee their further, sustainable development. After completing the legislative process, the ORLEN Group will make decisions regarding the legitimacy of implementation of projects devoted to renewable energy sources. In 2015, PKN ORLEN S.A. opened a pilot project for furnishing a selected group of fuel stations with photovoltaic modules. Heat and Power Plant in ANWIL is an industrial power plant generating technological heat and electricity in a cogeneration process. The total installed electric capacity of three turbine generators is 91.5 MWe,and in 2015 a total installed thermal capacity of four boilers increased by about 48 MWt and amounted to 448 MWt. The Heat and Power Plant provides heat in technological steam and heating water and electricity for the purpose of production installations and for external customers. As fuel in boilers uses natural gas and heating oil. Heat and Power Plant ORLEN Południe Group located in Trzebinia ensures full heating needs in steam and water, and partly the need of electricity. Currently in the Heat and Power Plant there are 3 installed steam boilers and 2 backpressure turbine sets to produce electricity for a total capacity of 8 MWe of electricity, and the total thermal power of 90 MWt. The basic fuel MANAGEMENT BOARD REPORT ON THE OPERATIONS FOR THE YEAR
117 in the Heat and Power Plant is fine coal, moreover, there is a possibility of burning heavy fuel oil. Future plans consist of modernization of energy assets in the direction of increasing the efficiency of production, to meet future environmental standards and to protect fully the needs of electricity for the Refinery Trzebinia. A tender for the modernization of the Heat and Power Plant was carried out in 2015, administrative decisions were obtained, an economic model for the investment was developed and the site was prepared for construction works. Heat and Power Plant in Jedlicze is the primary source of heat production in technological steam. Currently, in the Heat and Power Plant there are 6 steam boilers and a dischargebackpressure turbine set installed. The total thermal power of the Heat and Power Plant is 61 MWt, whereas the production of electricity allows for satisfying 10% of the needs. The basic fuel in the Heat and Power Plant is fine coal, but it is also possible to burn heavy fuel oil and natural gas. Works related to the reduction of dust emissions from coal boilers are currently in progress. An energy audit was carried out for the Heat and Power Plant, under which applicable effectiveness measures will be implemented. Several modernization variants for the existing property are at the stage of analytical works. Heat and Power Plant in Litvinov in the Unipetrol Group, is based on brown coal and has electric and thermal power which amounts to 112 MWe and 768 MWt. According to the current strategy, energy assets in Litvinov are under modernization. At the same time, in order to ensure supplies of technological steam to petrochemical plant, preparatory works for the construction of a new steam source are in progress. Heat and Power Plant in Spolana with an installed capacity of 70 MWe and 280 MWt, based on brown coal. In 2015 the process of analyzing and implementing initiatives to improve the energy efficiency of power plants was continued. The Paramo Heat and Power Plant includes two production plants: Kolin and Pardubice, in which the source of producing steam based on the combustion of natural gas are located. A variant analysis for the modernization of the Heat and Power Plant was performed in 2015 in Pardubice for the purpose of adapting it to reduced demand for steam and new emission limits. An analysis of adaptation to new emission limits was carried out in the Kolin Heat and Power Plant. Heat and Power Plant in the ORLEN Lietuva Group is a source of technological steam for production processes and operates on a mix of heavy fuel oil and refining gases. The electric power of the plant is 160 MWe and thermal powers is 694 MWt. In 2015, an analysis of adaptation of energy assets to reference requirements was commenced. Continuation of analyses and commencement of preparatory works is planned for Competitive projects. A significant part of existing production capacity requires modernization and/or replacement due to their age and high emission rates. It is estimated that approximately 5 GW of production capacities will have been withdrawn from the market by At the end of 2015, the total installed power capacity in Poland was approx. 40 GW. Sources (without considering RES projects) of total power of approx. 5 GW are currently under construction. These units will partially replace the blocks which are put out of service. In the group of implemented investments, approximately 1.7 GW refer to cogeneration projects, including two blocks built by PKN ORLEN (Płock and Włocławek), a gas-steam unit in Stalowa Wola of 450 MW in total power, which is a joint project of PGNiG and Tauron, and a gas heat and power plant in Gorzów Wielkopolski, of 138 MW in total power, contracted by PGE. MANAGEMENT BOARD REPORT ON THE OPERATIONS FOR THE YEAR

118 2.5.3 Volume sales of Downstream Segment Zbigniew Leszczyński, Member of Management Board, Sales: In 2015, the ORLEN Group completed record-breaking sales volume reaching 38.7 million tonnes, out of which 30.4 million tonnes constituted downstream segment sales. We must emphasize that we have achieved volume growth on all of our operations markets. Strong competition on the domestic market persuaded us to seek new solutions in the optimization of the fuel wholesale channel within the ORLEN Group. One of our unquestionable accomplishments is the merger of ORLEN Paliwa, ORLEN PetroTank and ORLEN Gaz. The introduced changes aimed at creating an entity with a broad commercial offer, offering beneficial commercial terms basing on state of the art logistics and sales solutions. We are convinced that the offer of the company will be competitive on the market not only due to the quality guarantee but also due to its unique universality in terms of product offer. In 2015, the ORLEN Group achieved the volume sales increase on all domestic markets. Downstream segment volumes of the ORLEN Group amounted to 30,380 thousand tonnes and increased by 9.7% (y/y). Medium distillates, which sales increased by 18.9% (y/y) and light distillates, which sales grew by 17.6% (y/y) had the biggest effect on the positive sales result. Recordbreaking results were recorded for diesel oil, which sales increased by more than 21.1% (y/y). The increase of production capacity of the Unipetrol Group after the purchase of 32% shares of Ceska Rafinerska from ENI in 2015 had the largest impact on the sales level recorded by the ORLEN Group. This contributed to strengthening the position of the Unipetrol Group on the Czech market. Thanks improved market situation, higher volume sales was also recorded on markets operated by the ORLEN Lietuva Group and in Poland. TABLE 7. The ORLEN Group sales in the downstream segment (PLN million/thousand tonnes). Sales VALUE VOLUME VALUE VOLUME VALUE VOLUME CHANGE % =(2-4)/4 9=(3-5)/5 Downstream Segment Light destillates 1) (13.1%) 17.6% Midlle distillates 2) (13.5%) 18.9% Heavy fractions 3) (40.1%) 0.4% Monomers 4) (13.6%) 4.9% Polymers 5) (20.7%) (18.6%) Aromas 6) (44.0%) (13.3%) Fertilizers 7) (0.8%) 0.3% Plastics 8) % 6.5% PTA (13.3%) 2.8% Others 9) (34.1%) 0.4% Total (19.2%) 9.7% 1) Gasoline, LPG. 2) Diesel oil, light heating oil, jet fuel. 3) Heavy heating oil, bitumen, oils. 4) Ethylene, propylene. 5) Polyethylene, polypropylene. 6) Benzene, toluene, paraxylene, ortoxylene. 7) Canwil, ammonium sulphate, ammonium nitrate, other fertilizers. 8) PVC, PVC granulate. 9) Other value - includes the sale of other products, goods and materials of the segment, also includes revenues from the sale of mandatory reserves for the total amount of PLN 2,236 million in 2014 and PLN 1,045 million in 2013 and revenues from sales of services of the segment. Other volume - consists mainly of brine, salt base, vacuum distillates, acetone, ammonia, butadiene, phenol, technical gases, glycols, caprolactam, caustic soda and sulfur. In 2015, 2014 and 2013, the ORLEN Group did not have any recipient whose share in total sales would exceed 10%. DIAGRAM 22. Structure of revenues from the sale of the ORLEN Group downstream segment. MANAGEMENT BOARD REPORT ON THE OPERATIONS FOR THE YEAR
119 2.5.4 Markets Basic home markets and ORLEN Group companies in the downstream segment: - Polish market: PKN ORLEN S.A., ORLEN Paliwa sp. z o.o., ORLEN Południe S.A., ORLEN Asfalt Sp. z o.o., ORLEN Oil Sp. z o.o., IKS SOLINO S.A., Petrolot Sp. z o.o., Ship- Service S.A., Anwil S.A. - Czech Republic market: Unipetrol RPA s.r.o., Ceska Rafinerska a.s., Paramo a.s., Unipetrol Slovensko s.r.o., Mogul Slovakia s.r.o., Unipetrol Deutschland GmbH, Butadien Kralupy a.s., Unipetrol RPA Hungary Kft., ORLEN Asfalt Ceska Republika s.r.o., Spolana a.s. - Baltic countries market: AB ORLEN Lietuva, ORLEN Latvija SIA (Latvia), ORLEN Eesti OU (Estonia). TABLE 8. Sales volume of the ORLEN Group in the downstream segment on domestic markets (in thousands of tonnes) 1) SALES CHANGE CHANGE % =(2-3) 6=(2-3)/3 Markets Poland % Lithuania % Czech Republic % Total % 1) by country of headquarter of company carrying out the sales. DIAGRAM 23. Structure of sales volume of the ORLEN Group in the downstream segment on domestic markets. Polish market The year 2015 marked the continuation of the growth trend of the Polish economy. According to preliminary estimates of the Central Statistical Office of Poland, the GDP dynamic was 3.6% (y/y) in 2015 and was by 0.3 p.p. higher in comparison to Positive trends were also recorded on the labor market in the form of reduced unemployment rates. Good condition of the Polish economy translated into increase in the level of fuel consumption. Data published by the Energy Market Agency indicates that the long-term downward trend in the domestic gasoline and diesel oil consumption rates was reversed. In 2015, the consumption of these fuels grew, respectively, by 2.6% and 5.8% (y/y). Apart from the improvement in general market conditions, growth in demand was also stimulated by low fuel prices. Record-breaking crude oil price drops on international markets translated into lower fuel price levels, which additionally encouraged vehicle users to use this mean of transport more intensively. A negative effect, which the entire Polish market has been struggling with is the so-called shadow economy in fuel trading. The illegally marketed diesel oil volume is estimated for more than a dozen or so per cent of the overall consumption of this fuel. Further growth in diesel oil and gasoline consumption is expected in The scale of the growth will depend on whether the pace of the growth of the Polish economy will be maintained and on the effects of measures taken to counteract unfair competition. MANAGEMENT BOARD REPORT ON THE OPERATIONS FOR THE YEAR
 6=(2-3)/3 Polish Market Light distillates 1 634 1 624 1 878 10 0.6% Medium distillates 4 980 4 437 4 636 543 12.")
120 TABLE 9. Sales volume of the ORLEN Group in the downstream segment on the Polish market (in thousands of tonnes). SALES CHANGE CHANGE % =(2-3) 6=(2-3)/3 Polish Market Light distillates % Medium distillates % Heavy fractions (254) (9.9%) Monomers % Aromas % Fertilizers (11) (1.1%) Plastics % PTA % Other % Total % DIAGRAM 24. Structure of sales volume of the ORLEN Group in the downstream segment on the Polish market. The ORLEN Group sales in the downstream segment on the Polish market increased in 2015 by 3.6% (y/y) and reached the level of 15,192 thousand tonnes. Thanks to a consistent sales strategy implemented in 2015, a 9.8% (y/y) growth in fuel wholesale was recorded. Increase of sales of medium distillates results from high diesel oil and jet fuel volume, the sales of which grew, respectively, by 14.0% and 14.6% (y/y) was the next year marking significant growth in the sale of jet fuel, and consistent strengthening of the leading position among the suppliers of this fuel. The Polish market of air carriage is one of the fastest-developing in Europe. Last year, the number of passenger carriage increased in Poland by 13% (y/y), and according to the Civil Aviation Authority, successive growth is expected in the next years. Maintaining a leading position and increasing the sales volume on a such prospective market, is a significant element of the Concern s sales strategy. Strong competition on the domestic market and highly changeable macroeconomic environment prompted a search for the possibilities to optimize the fuel wholesale channel within the ORLEN Group. The formation of a specialist Office of International Trade was continued to concentrate the competences of marine trading and central chartering service within the ORLEN Group in one area of competence. Essential changes in the structure of companies in the wholesale area were introduced in 2015 ORLEN Paliwa merged with ORLEN PetroTank and ORLEN Gaz. ORLEN Paliwa currently forms one of the country s largest sales organizations, offering a comprehensive portfolio of fuel products. In the petrochemical area, the ORLEN Group recorded an increase in the sales of its core product groups including monomers, aromas, plastics and PTA, with the exception of slight reduction of volume of artificial fertilizers, resulting from limited availability of production installations. Light distillate sales increased by 0.6% (y/y). Low level of gasoline price stimulated a 4.2% (y/y) growth in sales of this fuel, simultaneously resulting in reduced LPG sales by (-) 13.8% (y/y). MANAGEMENT BOARD REPORT ON THE OPERATIONS FOR THE YEAR
121 Baltic countries and Ukraine markets In 2015, the volume sales of the ORLEN Group increased by 13.2% (y/y) and equaled 8,462 thousand tonnes. The sales increase (y/y) was achieved thanks to the high sales rate of products by sea and higher onshore sales volume in the Baltic States with limited gasoline sales in Ukraine. The highest sales peaks were recorded for: gasoline by 13.4% (y/y), LPG by 20.9% (y/y) and diesel oil by 17.6% (y/y). TABLE 10..The ORLEN Group volume sales in the downstream segment markets serviced by the ORLEN Lietuva Group (thousand tonnes). SALES CHANGE % CHANGE =(2-3) 6=(2-3)/3 ORLEN Lietuva s Markets Light distillates % Medium distillates % Heavy fractions % Other % Total % DIAGRAM 25. Structure of sales volume of the ORLEN Group in the downstream segment on the markets serviced by the ORLEN Lietuva Group. Fuel consumption in the aforementioned three Baltic States decreased by (-) 2.5% (y/y), including the largest drop on the Lithuanian market by (-) 4.8% (y/y). Lower gasoline consumption results from the long-term phenomenon of growing diesel popularity among the vehicle park in this region. Lowered on shore gasoline sales resulting from reduced consumption, was entirely covered by offshore sales, whereas the commercial terms were significantly improved in this distribution channel. The demand for diesel oil increased by 7.1% in the Baltic States, including by 8.6% (y/y) on the Lithuanian market, by 7.4% (y/y) on the Latvian market, and by 4.0% (y/y) on the Estonian market. In 2015, the ORLEN Lietuva Group significantly improved its market share in diesel oil on the Latvian and Estonian markets. The share on the Lithuanian market of diesel oil was reduced mainly due to aggressive competition from Scandinavian suppliers. The Ukrainian market was still overcome by a very difficult political and economic situation. The country is struggling with recession, reflected by a GDP dynamic drop by (-) 9.0% and inflation of 50% (according to estimated IMF data). Many Ukrainian clients of the ORLEN Lietuva Group lost their assets in the area of warfare, including fuel stations and warehouses. Compared to consumption levels on the Ukrainian market from 2013, that is before the beginning of the conflict, with estimated data from 2015, a drop in gasoline consumption by more than (-) 41% (y/y), and diesel oil by nearly (-) 10% (y/y), is evident. Despite very difficult operating conditions and decreasing demand, the ORLEN Lietuva Group has maintained gasoline and diesel oil sales at the record level from Czech Republic market The year 2015 marked the continuation of economic growth in the Czech Republic, characterized by growing GDP dynamic at the level of 4.3% and low inflation level. Favourable macroeconomic environment stimulated the growth of market consumption of diesel oil by 4.4% (y/y), while the consumption of gasoline decreased by (-) 0.5% (y/y). In May 2015, Unipetrol completed the process of consolidation of refinery assets in Ceska Rafinerska a.s., acquiring the remaining shares from ENI. The Czech company became the sole owner of the Litvinov and Kralupy refineries and has become the sole producer of fuels in the Czech Republic. Considerable increase in production potential and strengthening of the market leader position allowed the company to increase its sales by 20.7% (y/y). Excellent results were achieved in the sales of light distillates, thanks to increased gasoline sales by 54.0% (y/y). Growth in the sales of medium distillates was achieved thanks to an increase in the diesel oil sales volume by 40.7% (y/y). MANAGEMENT BOARD REPORT ON THE OPERATIONS FOR THE YEAR

122 Increased production potential was temporarily limited due to a failure of the ethylene installation from August 2015, which resulted in lower (y/y) level of sales of petrochemical products. Installation shutdown forced the need to modify a series of processes to optimize the production and to limit the effect of the breakdown. Thanks to the coordination of product flows in the ORLEN Group, as well as the purchases of semi-products and finished products on the external market, the sales of petrochemical products was maintained at the level which allowed fulfilling all contractual obligations. Thanks to increased sales potential after the purchase of the shares in Ceska Rafinerska, the Unipetrol Group has considerably increased its market share on the Czech market. Shares on the gasoline market increased by more than 18 percentage points, and on the diesel oil market by more than 10 percentage points. The Unipetrol Group is currently the leader on the Czech market, satisfying a half of the local demand for fuels. TABLE 11. Sales volume of the ORLEN Group in the downstream segment on the Czech market (in thousands of tonnes). SALES CHANGE CHANGE % =(2-3) 6=(2-3)/3 Czech market Light distillates % Medium distillates % Heavy fractions % Monomers (54) (36.5%) Polymers (110) (18.6%) Aromas (82) (36.1%) Fertilizers % Plastics (17) (13.8%) Others (50) (5.0%) Total % DIAGRAM 26. Structure of sales volume of the ORLEN Group in the downstream segment on the Czech market. In 2015, the Unipetrol Group expanded its client portfolio in result of significant growth of its sales potential. Cooperation with major fuel concerns and supermarket chains was continued. Unipetrol has been selling its products on the Slovakian, Hungarian, German and Austrian markets, taking full advantage of the cooperation capacity under the ORLEN Group with such companies as Unipetrol Slovakia and Unipetrol Deutschland Sources of supply Crude oil Crude oil deliveries to PKN ORLEN are realized through "Druzhba" pipeline and by sea using Gdańsk-Płock pipeline. ORLEN Lietuva Group is supplied with raw material by the terminal in Butinge. The main directions of supply of raw material for the production of Unipetrol Group are the southern section of the pipeline "Druzhba" for the refinery in Litvinov and TAL and IKL pipelines to refinery in Kralupy. Litvinov refinery can also be supplied using the TAL and IKL pipeline. In 2015, there were two long-term contracts for the supply of crude oil by pipeline to refinery in Płock (executed respectively with companies Mercuria Energy Trading SA, Rosneft Oil Company) Each contract provides the possibility to re-negotiate prices annually; in case of lack of agreement on this matter, the contract may be terminated. Due to the long-term character of these contracts, agreement ensured safety and continuity of supplies of over 60% of purchased raw material for refineries and MANAGEMENT BOARD REPORT ON THE OPERATIONS FOR THE YEAR
123 contained supply guarantee clauses based on financial guarantees. PKN ORLEN provides crude oil to the refinery in Płock and three ORLEN Group refineries located respectively in Litvinov and Kralupy in the Czech Republic and in Mazeikiai in Lithuania. In 2015 the crude oil supplies in all directions proceeded according to plan. The raw material suppliers to all refineries were both manufacturers and companies operating in the Russian s crude oil market, including traders operating in the international crude oil market. Crude oil delivered to Płock came primarily from Russia, moreover, from Saudi Arabia, Kazakhstan, Norway and the United Kingdom. To refineries in the Czech Republic crude oil were supplied from Russia, Algeria, Azerbaijan, Kazakhstan and Libya. The supply of raw material to the Mazeikiu refinery came primarily from Russia, moreover, from Algeria, Azerbaijan, Iraq, Kazakhstan and Nigeria. In 2015, the share of Rosneft Oil Company in crude oil supplies exceeded 10% of the overall revenues of the ORLEN Group. Natural gas Purchases of natural gas are based on a long-term contract between PKN ORLEN and PGNiG and on short-term contracts with alternative suppliers. Due to progressing liberalization of the gas market and development of trans-border infrastructure, prices in Poland came close to the marked on the liquid German market. The ORLEN Group continues efforts to ensure stable supply and reduce the overall purchase cost of natural gas, mainly through diversification of supply sources. In 2015, more than 20% of natural gas in the ORLEN Group was supplied by alternative suppliers. The ORLEN Group also implements a number of exploration and extraction projects in order to obtain their own sources of gas and crude oil. MANAGEMENT BOARD REPORT ON THE OPERATIONS FOR THE YEAR
 and improvement of non-fuel margins on the Polish and Czech markets.")
124 2.6. Retail segment ORLEN GROUP Zbigniew Leszczyński, Member of the Management Board, Sales: Yet again, we have recorded a record-breaking EBITDA result for the retail segment, amounting to PLN 1.5 billion. The result was achieved thanks to increased fuel sales volume by 2.7% (y/y) and improvement of non-fuel margins on the Polish and Czech markets. Last year, we focused on further development of our offer by launching another 154 Stop Café and Stop Café Bistro points. It is also worth to emphasize the increase of ORLEN Group shares on the Czech and Lithuanian market, and retain of market shares on the developed German market Market trends The 2015 was a year of considerable reductions in fuel retail prices as a result of crude oil price decrease. Lower prices on fuel stations reduced the attractiveness of economic chains. Premium stations began to gain customer esteem, and clients were more eager to refill using more expensive premium fuels and paid more attention to the non-fuel and gastronomy offer. The price ceased to be the most important element in the choice of place for refueling. As a result, the initiatives of particular chains were focused on development of stores, particularly their gastronomical parts. A similar direction was also recorded for economic chains. ORLEN Group domestic markets did not display significant changes in the number of functioning fuel stations. A growing number of independent stations entered into cooperation with international chains or joined association that united them. In 2015, Total company appeared on Polish market and ultimately plans to open 100 franchise stations in the successive years. In 2015, 10 fuel stations entered into cooperation with this French chain. The rebranding process ofthe Neste stations acquired in 2013 by Shell was completed. On the Czech market, following the completed acquisitions (44 Lukoil and 125 AGIP stations) the Hungarian petroleum concern MOL commenced the rebranding process assuming these units. The German and Lithuanian markets did not display any significant structural changes, and the current leaders, including ARAL and Lukoil, have maintained their prime position. Information regarding plans to sell a Russian concern chains in Lithuania and Latvia appearedin December The transaction is to be finalized in the second quarter of After the introduction of an obligation to provide constant reporting of fuel changes in Germany in 2014, the principles of establishing prices in all chains were changed. The reaction time for adaptation to competitors prices has shortened, the method of monitoring competition was changed, and the number of daily shifts in fuel stations prices was increased. The main premium chains operating on the German market made a decision to rebrand a part of their stations and to enter the economy segment MANAGEMENT BOARD REPORT ON THE OPERATIONS FOR THE YEAR


125 2.6.2 Market position and environment The ORLEN Group is an unquestionable leader on the fuel market in Central Europe, with a chain of fuel stations operating in the Premium and economy segments. SCHEME 6. The number of the ORLEN Group stations for the key markets at the end of concerns and the Lotos Group in the number of stations increased, respectively, by 0.2 and 0.4 percentage points (y/y). DIAGRAM 28. Fuel station network in Poland on Source: Own calculations based on POPiHN data. In Poland, fuel stations operate under the ORLEN brand in the Premium segment and under the BLISKA brand in the economy segment, whereas in the Czech Republic under the Benzina Plus and Benzina brands, whereas in Lithuania under the ORLEN and Ventus brands. On the German market, fuel stations have been operating primarily in the economy segment under the STAR brand, and the chain is complemented / supplemented by a dozen of Familia market stations. Poland The ORLEN Group on the Polish market at the end of 2015 operates a network of fuel stations. The implemented investment program was focused on the establishment of new fuel stations and highway facilities, upgrading of existing facilities and rebranding of the BLISKA stations to ORLEN. The main focus was still the development of the gastronomical offer, as well as new store formats. Corporate fleet and loyalty programs contributed to strengthening the market-leading position of the Group and increasing its total fuel sales volume by 3.8% (y/y). DIAGRAM 27. Share in the retail fuel market in Poland. Germany The ORLEN Group has been present on the largest retail market in Europe in Germany since As of the end of 2015, the STAR chain owned by the Group included 565 fuel stations managed by ORLEN Deutschland GmbH and maintained a 6.0% share on the German retail market in DIAGRAM 29. Share in the retail fuel market in Germany. The main competitors of ORLEN Deutschland GmbH include such international chains as: Aral, Shell, Esso, Total and JET the main competitor in the segment of economy stations. Czech Republic The ORLEN Group has retained its leading position in terms of number of fuel stations in the Czech Republic as of the end of 2015, Benzina managed 339 stations. Effective operations and optimization of retail price management process contributed to an increase of the share on the Czech retail market by 0.8 percentage points (r/r) to the level of 15.9%. DIAGRAM 30. Share in the retail fuel market in Czech Republic. According to the data published by POPiHN (Polish Organization of Oil Industry and Trade) in 2015, more than 6.6 thousand fuel stations operated on the Polish market. The share of the ORLEN Group in the total number of stations was reduced by (-) 0.8 percentage points and reached the level of 26.5%. The main competitors of PKN ORLEN on the Polish market include such foreign concerns as: Shell, BP, Statoil, Lukoil, which owned 21.9% of fuel stations as well as the Lotos Group with 7.2% of share in the number of stations. The share of foreign Second place in the Czech market in terms of number of fuel stations belongs to Hungarian MOL company (with 317 stations), MANAGEMENT BOARD REPORT ON THE OPERATIONS FOR THE YEAR


126 focusing Slovnaft, Lukoil, Agip and Pap Oil stations. Ultimately, only two brands will be present in the chain: MOL (60% of the stations) and PapOil (40%). In 2015, approximately 80 stations were launched under the MOL brand. Important members of the fuel market are also OMV, Shell, Euro Oil. Lithuania As of the end of 2015, the ORLEN Group in Lithuania owned 26 fuel stations and increased its retail market share by 0.1 percentage point (y/y) to the level of 3.6%. DIAGRAM 31. Share in the retail fuel market in Lithuania. The ORLEN Group's main competitors in the Lithuanian market in this segment are Lukoil, Statoil and Neste. Passengers service areas ( MOP ) Continued expansion of the road system in Poland creates a possibility for development that assumes the so-called Passenger Service Centers (MOP) located next to highways and expressways. As of the end of 2015, there were 69 MOPs on the Polish market, out of which 27 (39.1%) belonged to the ORLEN Group. Four facilities of this type are currently under construction, including 2 located next to A1 highway in the Stryków Tuszyn section, and 1 located in the A4 highway next to Rzeszów Korczowa section, as well as 1 next to expressway S8 in the Łódź Wrocław section. SCHEME 7. Passengers Service Areas in Poland at the end of S 6 S 61 S 10 S 7 S 11 S 5 S 8 S 5 S 11 S 3 S 8 S 7 S 17 Source: Own preparation Sales volume of retail segment Sales volume of Retail Segment of the ORLEN Group in 2015 increased by 2.7% (y/y) and amounted to thousand tonnes as a result of higher fuel sales on the Polish, Czech and Lithuanian market, with slightly lower volume on the German market. MANAGEMENT BOARD REPORT ON THE OPERATIONS FOR THE YEAR
/4 9=(3-5)/5 Retail Segment Light distillates 1) 12 084 3 000 13 951 2 916 14 229 2 832 (13.4%) 2.")
127 TABLE 12. The ORLEN Group sales in retail segment (PLN million /thousand tonnes). SALES VALUE VOLUME VALUE VOLUME VALUE VOLUME CHANGE % =(2-4)/4 9=(3-5)/5 Retail Segment Light distillates 1) (13.4%) 2.9% Medium distillates 2) (16.6%) 2.6% Other 3) % - Razem (13.5%) 2.7% 1) Gasoline, LPG. 2) Diesel; light fuel oil sold by ORLEN Deutschland. 3) Other value includes revenues from sales of non-fuel goods and services. DIAGRAM 32. Structure of sales revenue of the ORLEN Group in retail segment Sales markets The retail area of the ORLEN Group includes companies operating in all domestic markets of the ORLEN Group: PKN ORLEN in the Polish market, ORLEN Deutschland GmbH in the German market, Benzina s.r.o. in the Czech market and Ventus Nafta AB in the Lithuania market. TABLE 13. Sales volume of the ORLEN Group in the retail segment on domestic markets (in thousands of tonnes). SALES CHANGE CHANGE % =(2-3) 6=(2-3)/3 Markets Poland % Germany (0.7%) Czech Republic % Lithuania % Total % DIAGRAM 33. Structure of sales volume of the ORLEN Group in the retail segment on domestic markets. MANAGEMENT BOARD REPORT ON THE OPERATIONS FOR THE YEAR
128 Polish market Despite a reduction of the number of stations in the chain, the overall sales volume increased in 2015 by 3.5% (y/y) and amounted to PLN thousand tonnes. Completion of a series of developmental projects and the implemented efficiency initiatives contributed significantly to the increase in the annual average sales volume on CODO fuel stations by 2.5% (y/y) to the level of 4.1 million liters. TABLE 14. Sales volume of the ORLEN Group in the retail segment on the Polish market (in thousands of tonnes). SALES CHANGE CHANGE % =(2-3) 6=(2-3)/3 Light distillates % Medium distillates % Total % DIAGRAM 34. Structure of sales volume of the ORLEN Group in the retail segment on the Polish market. In 2015, measures aiming at further development of fleet sales were continued. Despite large competition in this segment of the fuel market and the persisting so called shadow economy the ORLEN Group increased the volume in this channel by nearly 4.5 percentage points (y/y) to the level of 30.2% of the total sales volume in the segment. In 2015, using the Flota and OpenDrive fleet cards, drivers were able to make payments on all Polish highways. A new functionality allowing for full control of GPS monitoring parameter, collated with the fuel expenses on ORLEN Group stations was launched. The introduced solution generates savings in the usage and carfleet management costs and increases the safety of transactions. Sales to the segment of small and medium companies increased by 9% (y/y). A significant achievement was recorded by the MikroFlota program, which sales volume increased by 147% (y/y) to reach 21 million liters. In 2015, considerable increase in sales revenues of non-fuel products and services was achieved. The key driver of this success was further development of Stop Café and Stop Café Bistro, effective sales supporting marketing activities, and systematic expanding the offer with new products. In the 4th quarter of 2015, a new, pilot gastronomic format Stop Café 2.0 was launched on 2 test stations. As a part of development of new store formats, tests of 10 convenience stores (5 under the O!Shop and 5 under the ORLEN brand) were commenced. Modernization and development of automatic car washes, decrease of the malfunction ratios, shortening of devices standstills and measures supporting sales increased the revenues from these services by 13% (y/y). Another important element of further improvement in the non-fuel area was the implementation of a system providing a detailed analysis of receipt data in the end of 2015, allowing a better match of the offer and new promotional activities with expectations of the clients. As at the end of 2015, the retail network was reduced due to optimization measures by 19 units and therefore amounted to fuel stations. This is the net effect of the opening of 22 new facilities and completion of liquidation processes for 36 stations, commenced in the previous years. Furthermore, in 2015 the number of fuel stations in the DOFO segment was reduced by 5 facilities. In 2015, the number of Premium stations operating under the ORLEN brand increased by 93 to Increased number of ORLEN stations resulted from the opening of new units in both channels owned and franchised, the modernization of existing stations and the continuation of the BLISKA ORLEN rebranding project commenced in Customers gained improved access to the wider range of fuel (VERVA fuels) as well as non-fuel offer, including rich gastronomy offer not available on economic staions. This change also allowed for increasing the number of participants in VITAY loyalty program, available under the Premium network. As part of the rebranding project conducted in 2015, 57 BLISKA stations both owned and franchised changed brand to ORLEN (from the beginning of the project the brand was introduced in more than 300 stations). As at the end of 2015, PKN ORLEN had 159 economic stations operating at under the BLISKA brand in its station network. The remaining stations are stations with so-called simplified format. The number of these stations was reduced from 95 to 49 in As part of an investment project, 22 new, owned fuel stations (including 4 MOP) were opened. Another 16 units were built from the begining in the current station locations, as part of the Break MANAGEMENT BOARD REPORT ON THE OPERATIONS FOR THE YEAR

129 down and Build project. 21 new stations were opened in 2015 as part of the PKN ORLEN franchise network. In result, as at the end of 2015, the overall number of stations in the DOFO network amounted to 442. One of the most important factors which impacted further development of this network was the implementation of new terms of cooperation with franchisees. In 2015, approximately 250 partners signed new agreements (apart from the stations incorporated into the network). This process will be continued throughout After two years, the process of replacing the price pylons in nearly owned stations was completed. As a result, stations were included in the automatic repricing system and the process of fuel price management was significantly optimized. In 2015, PKN ORLEN changed the method of monitoring service standards in its fuel station network on the Polish market. A new Customer Satisfaction Surveying System was introduced, which allowed for collecting a considerably higher number of individual customer surveys and information about their expectations, opinions and suggestions on possible changes. The confirmation of retention of high customer standards of service at PKN ORLEN fuel stations, good perception of the ORLEN network by customers were awards acquired in The fuel station in Warsaw in Lazurowa Street was awarded in the Fuel Station Store category. The ORLEN, BLISKA and Stop Café brands received the Superbrands Created in Poland title, whereas PKN ORLEN was honored with the Business Superbrand title. PKN ORLEN was also recognized in the area of fleet sales, which was confirmed by its victory in the Fleet Awards voting in the category of Fuel Cards for Large Fleets. In 2015, the ORLEN brand was honored by the consumers with the prestigious title Customer Service Quality Star, awarded as part of the Polish Service Quality Program. German market In 2015, the ORLEN Group maintained the sales of light distillates on the German market at the same level as in previous year and increased the volume of diesel oil by 0.5% (y/y). Insignificant decrease of total sales by (-) 0.7% (y/y) was an effect of lower wholesale of light fuel oil, conducted by the German company ORLEN Deutschland. In 2015, the average annual flow per station maintained the level from the previous year and amounted to 5 million liters. TABLE 15. Sales volume of the ORLEN Group in the retail segment on the German market (in thousands of tonnes). SALES CHANGE CHANGE % =(2-3) 6=(2-3)/3 Light distillates % Medium distillates (19) (1.3%) Total (19) (0.7%) DIAGRAM 35. Structure of sales volume of the ORLEN Group in the retail segment on the German market. In 2015, the situation on the German fuel market changed. In the recent years, the leading networks (Aral, Shell, Esso, Total) operating in the premium segment, lost their volume in favor of economic stations (such as STAR, Jet, Tamoil). To reverse this trend, some of the premium networks (Shell, Aral, Total) made a decision to rebrand a part of their stations and to enter the economic sector as well. Advertising activities were also taken, including offering price discounts for the customers. Due to significant retail price reduction in 2015, a part of the volume lost in the preceding years was recovered by premium stations. With lower retail prices, a part of the clients started to purchase premium fuels and to take advantage of the non-fuel offer available on premium stations. The results of ORLEN Deutschland were also significantly affected by the introduction of minimal wage in Germany in The negative effect of this change was generally compensated by development activities in the area of non-fuel sales, gastronomy and other fuel station services. In the last quarter of 2015, the company purchased a package of 13 SUN fuel stations operating in the vicinity of Berlin from Germania Petrol. 6 units were taken over until the end of As of 31 December 2015, ORLEN Deutschland managed a network of 565 stations, out of which 541 operated in the economic segment under the STAR brand and 1 under the ORLEN brand, located in Hamburg. The remaining 23 stations are the acquired Sun stations and stations operating under supermarkets. 4 new MANAGEMENT BOARD REPORT ON THE OPERATIONS FOR THE YEAR
130 stations were opened under the STAR brand and an equal number of stations was closed. As at the end of 2015, ORLEN Deutschland completed works on a new model of cooperation with dealers running fuel stations owned by the company. The new agreement standardizes the terms of cooperation in the entire network and was already approved by the majority of partners. Czech market 2015 was the consecutive year displaying high dynamic of fuel sales on the Czech market. The average annual sales recorded by Benzina stations increased by 8.2% (y/y) and reached the level of 2 million liters. TABLE 16. Sales volume of the ORLEN Group in the retail segment on the Czech market (in thousands of tonnes). SALES CHANGE CHANGE % =(2-3) 6=(2-3)/3 Light distillates % Medium distillates % Total % DIAGRAM 36. Structure of sales volume of the ORLEN Group in the retail segment on the Czech market. Very good operating results of the segment are the effect of implemented initiatives of efficiency. The appearance of stores and their offer were adapted to the current expectations of the customers and new market trends. The new operations model introduced in 2014 resulted in significant improvement of non-fuel revenues and reduction of station costs in In 2015, Benzina reached an increase in revenue from the sales of non-fuel products and services by nearly 25% (y/y). Implementation of a new system for establishing fuel prices and optimization of the retail price management process had great impact on the improvement of unit margins and on volume increase. An important initiative to limit the costs of fuel losses was the installation of new measurement devices in nearly 200 stations and the update of software to monitor the condition of fuels in the next 135 activities. A new Customer Satisfaction Surveying System was introduced in the entire Benzina network in The tool allows for collecting individual surveys and information on their expectations, opinions and suggestions and the level of their satisfaction during their visit to a specific station. As at the end of 2015, Benzina s.r.o managed a network of 339 stations operating under two brands: Benzina Plus in the Premium segment (117 stations) and Benzina in the economic segment (202 stations), as well as 16 stations in the simplified brand. These were completed by 4 self-service stations, which will ultimately operate under the Benzina Express brand. In the end of 2015, an agreement for the purchase of 68 stations located in the Czech Republic from OMV was signed. All stations will be incorporated into the Benzina network with the beginning of Since 2015, the ORLEN Group opened the next stage of development of Stop Café and Stop Café Bistro formats on the Czech market. 33 gastronomy facilities were opened in the entire network. As at the end of 2015, 131 stations with Stop Café and Stop Café Bistro facilities operated as part of Benzina stations. The project will be continued in MANAGEMENT BOARD REPORT ON THE OPERATIONS FOR THE YEAR
 and comparable (y/y) level of fuel sales entirely covered the lower sales of LPG. The average annual flow per station increased from 2.8 to 2.9 million liters. TABLE 17.")
131 Lithuanian market In 2015, the ORLEN Group recorded an increase of sales volume by a 5.2% (y/y) on the Lithuanian market. Noticeable diesel oil sales increase by 10.3% (y/y) and comparable (y/y) level of fuel sales entirely covered the lower sales of LPG. The average annual flow per station increased from 2.8 to 2.9 million liters. TABLE 17. Sales volume of the ORLEN Group in the retail segment on the Lithuanian market (in thousands of tonnes). SALES CHANGE CHANGE % =(2-3) 6=(2-3)/3 Light distillates (1) (5.3%) Medium distillates % Total % DIAGRAM 37. Structure of sales volume of the ORLEN Group in the retail segment on the Lithuanian market. As at 31 December 2015 the retail network in Lithuania comprised of 26 own stations in COCO model. 25 stations operated under the ORLEN brand in the Premium segment and 1 station under the Ventus brand operated in the economic segment Sources of supply The majority of fuels sold on the Polish, Czech and Lithuanian markets comes from production within the downstream segment of the ORLEN Group. An exception is the German market, on which the ORLEN Group did not have its own refining assets. The largest suppliers of this German company include the following sellers operating on the German market: such as Deutsche BP AG, Holborn European Marketing Company Limited, Total Deutschland GmbH, Raffinerie Heide GmbH, Shell Deutschland Oil GmbH. An important supplier of fuels to ORLEN Deutschland GmbH is also the Czech company Unipetrol RPS s.r.o., member of the ORLEN Group (12% of all supplies). MANAGEMENT BOARD REPORT ON THE OPERATIONS FOR THE YEAR

132 2.7. Upstream segment Wiesław Prugar, President of the Management Board of ORLEN Upstream: Changing macroeconomic conditions require continuous optimizations of the business model and revisions of our goals and adaptation of the pace of their implementation to make sure all of our resources are used in an optimal manner. On the one hand, they affect the reallocation and optimization of capital expenditures and reduction of operational costs. On the other hand, the situation on the market of crude oil in 2015 created an opportunity for further development of the portfolio of assets through selected acquisitions Market trends According to the World Energy Outlook 2015 report prepared by IEA (International Energy Agency) significant changes matching the demand for primary energy will take place in the future. Economic policy will play a very important role in shaping the global energy sector. In all scenarios, global demand for primary energy is growing, but its pace depends on the emissions management policy. According to the basic scenario, in years the global demand will increase by 32%, and non-oecd economies will be primarily responsible for this increase. According to the forecasts, the demand for primary energy will drop by 3% in OECD countries. TABLE 18. Global energy demand by fuel type [million toe] 1). Items Current Policies Scenario New Policies Scenario Coal Oil Gas Nuclear Hydro Bioenergy Other Total ) Toe tonne of oil equivalent the definition was included in the "Glossary of definitions and abbreviations. Source: IEA 450 Scenario MANAGEMENT BOARD REPORT ON THE OPERATIONS FOR THE YEAR
133 In 2040, global demand for energy will be nearly twice as high as in 2000, and the demand for gas and crude oil will constitute 50% of total demand, mainly from China, India and the Middle East. DIAGRAM 38. Changes in demand for oil [million toe]. Source: IEA. DIAGRAM 39. Changes in demand for gas [million toe]. Source: IEA. Facing a surplus of the raw materials and dropping prices, crude oil manufacturers have been lowering operational costs and increasing the scale of new investments. In the basic scenario, WEO authors assume that crude oil production will increase by 8% to 2040 (to 104 million b/d), initially to 2020 generally thanks to non-opec countries, and thanks to OPEC countries in the next following years as well. In short-term, the impulse for the demand growth for crude oil is a derivative of low prices. However, it will be balanced by low expectations in terms of economic growth in several key economies, and the impact of improved effectiveness and the emissions policy. The largest crude oil consumer in the world the United States will record a significant decrease in demand, primarily due to introduction of restrictive fuel consumption standards in transport. India and China, in turn, will become the largest consumers of crude oil after Currently, natural gas markets are displaying considerable diversification between particular regions, with strong demand for gas in the United States, in the Middle East and in China, and low demand in Europe. The basic scenario assumes that the world market of gas will display constant growth by 1.4% a year, reaching billion m 3 in 2040, becoming in terms of share,the second fuel in the global energy mix. The IEA scenario assumes the largest growth of demand for gas in China and in the Middle East. Latin America countries (Brazil, Argentina), African countries (Nigeria, Tanzania and other) as well as India will notice increased use of natural gas, but at varying pace. The United States remain the world s largest consumer of natural gas, and their demand for gas will increase by 15% in Additionally, it is assumed that by 2020 the supply of natural gas extracted from unconventional deposits in the US will increase sufficient enough to exceed 50% of share on the global market of gas Position and competitive environment The strategy of the ORLEN Group assumes the intensification of exploration and extraction activities in order to enable access to own resources of crude oil and natural gas. The development of competences in the upstream segment stood for intensive works on the formation of an international team of specialists, capable of creating and managing a diversified portfolio of assets, with access to own resources and exploration of crude oil and natural gas, and capable of applying state of the art exploration methods and extraction technologies. Currently, ORLEN Upstream is conducting works in the area of eight regions in Poland and has become a recognizable operator in the Alberta province in Canada. In years the exploration process of unconventional hydrocarbons (especially shale gas) in Poland has developed rapidly. The intensification of investors activities was noted in 2012, when 20 extraction and exploration companies were operating on the market. The number of concessions reached 115, and in the 2012 alone, 24 exploration drillings were performed. The results of works, published in the last few years appear to vary from the results obtained for key areas of hydrocarbon extraction from unconventional deposits in North America. The main differences resulted from geological conditions (i.e. higher depth of formation depositing and higher complexity level of geological formation). With the progress of exploration works, between 2013 and 2015, a great majority of operators made a decision to withdraw from the Polish market (such as ExxonMobil, Marathon Oil, Talisman Energy, ENI, Nexen, Total, Mitsui, RAG, Sorgenia, Dart Energy, 3Legs Resources, Chevron and ConocoPhilips) and the pace of works decelerated. The similar situation took place in other European countries with potential sources of shale gas. In Romania, Bulgaria, Sweden, Hungary and Lithuania foreign companies from the industry have withdrawn from exploration and in Ukraine exploration works were suspended. Taking into account current results of reconnaissance exploration works and risk profile of shale gas projects, in the environment of low hydrocarbons prices, it is expected that extraction and exploration companies will be striving to reduce the exposure to high-risk, expensive exploration projects as much as possible. MANAGEMENT BOARD REPORT ON THE OPERATIONS FOR THE YEAR

134 2.7.3 Activities in Poland 2015 was marked by significant changes on the map of assets owned by ORLEN Upstream. This was related both to the acquisition of new exploration areas, and resignation from less prospective parts of the license portfolio. SCHEME 8. Exploration projects of ORLEN Group in Poland. Exploration assets with cooperation: Warsaw South (51% of shares), Bieszczady (49% of shares) ORLEN Upstream 100% of shares : Karbon, Lublin Shale, Mid-Poland Unconventional, Karpaty, Miocen, Edge requested areas Exploration and production assets with cooperation: Sieraków (49% of shares), Płotki** (49% of shares) ORLEN Upstream 100% of shares: Edge ** Production from Płotki project (100% gas) Source: Own preparation In 2015, ORLEN Upstream purchased two concessions owned by Deutsche Erdoel AG and negotiated a Joint Operations Agreement with PGNiG S.A. in the area of eight concessions blocks in the Karpaty region (the Bieszczady project). In October 2015, as part of a tender process, the Group obtained a concession from the Ministry of the Environment concerning the Siennów Rokietnica area situated in the Podkarpackie region, in the geostructural unit referred to as Zapadlisko Przedkarpackie. On 31 December 2015, the purchase of transaction of 100% of shares in FX Energy Inc. was completed, and thus the portfolio of assets owned by the Group in Poland increased, among others, by a share in 7 production deposits. The total value of the transaction was approximately USD 125 million. Currently, gas extraction is performed in cooperation with PGNiG (FX Energy share is 49%). 2P resources owned by the ORLEN Group in Poland equaled 8.2 million boe in the end of Apart from the extraction conducted, the potential of the acquired assets also includes exploration concessions. Part of one of the acquired concession (the Edge area in the Kujawsko-Pomorskie region), includes the Tuchola deposit discovered in 2013, which is currently prepared to be developed. Commercial extraction can start in 2018, and the Concern owns 100% of shares in this area. Effects of the operating activity of the purchased FX Energy shares will be included in ORLEN Group statements for ORLEN Upstream is currently conducting works, either individually or with partner, in the area of 29 concessions situated in 8 regions. The share of the Concern is: 100% on 14 concessions; 51% in 1 concession, and 49% in 14 concessions. As part of works carried out in the Podlasie-Lublin Basin, the drilling of a vertical borehole in the Wołomin license area and an analysis of the data from the borehole were completed in In August 2015, the acquisition of 2D seismic data from the Wodyn- Łuków concession area was carried out, followed by the so-called processing of this data. In November 2015, the acquisition of 3D seismic data in the license area was initiated. In 2015, the acquisition of new 2D seismic data from the Sieradz block was carried out followed by data interpretation. In the Wielkopolska region, preparatory works were carried in order to exploit a part of the Sieraków area. The acquisition of new seismic data for the 2D Hoczew-Lutowiska area was carried out with a partner under the Bieszczady project. The completion of these works is planned for the first quarter of Activities in Canada In Canada, PKN ORLEN runs extraction activities in the Alberta province, utilizing horizontal drilling and hydraulic fracturing techniques. In 2015, 16 such operations were started. As a result, in 4Q 2015 the production level of 7.3 thousand boe/day was reached and 45% of which accounted for liquid hydrocarbons (crude oil and condensate). In December 2015, the acquisition of extraction assets belonging to Kicking Horse Energy, located primarily in the Kakwa area in Alberta, was carried out via a subsidiary of ORLEN Upstream Canada, a subsidiary of the company. The purchase of new assets increased the amount of 2P hydrocarbon reserves in Canada as well as their extraction levels. The total value of the transaction was approx. CAD 295 million. As at the end of the year, production from assets in the Kakwa area exceeded 4.5 thousand boe/day. The effect of operating activities of the purchased Kicking Horse Energy assets will be included in the ORLEN Group statements for The transaction performed on stable Canadian market fits the risk profile established in PKN ORLEN strategy. The favourable deposits parameters and development of operations in an already well-recognized regions minimize the operational risk of the MANAGEMENT BOARD REPORT ON THE OPERATIONS FOR THE YEAR

135 investment. In addition, the efficiency of utilized horizontal drillings and multisectional hydraulic fracturing techniques enable exchange of experiences between Polish and Canadian teams and exploitations of synergies from utilized solutions. Canadian market is characterized by wide access to high-end drilling and maintenance services as well as access to qualified and experienced in unconventional deposits extraction personnel. The stable tax system and friendly regulatory environment are also significant. ORLEN Upstream also owns 10.7% of shares in the project concerning the construction of a liquefied gas export terminal on the eastern shore of Canada (the Nova Scotia province) Goldboro LNG, currently at the initial stage. SCHEME 9. Assets in Canada Sales volume of Upstream Segment TABLE 19. The ORLEN Group volume sales in the upstream segment (thousand tonnes). SALES VALUE VOLUME VALUE VOLUME VALUE VOLUME CHANGE % =(2-4)/4 9=(3-5)/5 Upstream Segment Crude oil (45%) (4%) Natural gas (19%) 35% Others % 40% Total (28%) 20% In 2015, the total sales of the extraction segment on the Canadian market reached the level of 310 thousand tonnes of crude oil, natural gas and NGL (natural gas liquids). Thanks to the acquisition of 100% shares of FX Energy in December 2015, an additional hydrocarbon sales volume from the Polish market will take place starting from In December 2015 average extraction from the acquired extraction assets of FX Energy amounted to 1.3 thousand tonnes boe/day. The prices of crude oil and gas had the largest effect on the level of hydrocarbon extraction. MANAGEMENT BOARD REPORT ON THE OPERATIONS FOR THE YEAR
 mailny Natural Gas Liquids MANAGEMENT BOARD REPORT ON THE")
136 DIAGRAM 40. Upstream segment revenues in the ORLEN Group *) mainly Natural Gas Liquids DIAGRAM 41. Sales volume of the Upstream segment in the ORLEN Group *) mailny Natural Gas Liquids MANAGEMENT BOARD REPORT ON THE OPERATIONS FOR THE YEAR
137 2.8. Risk management The functioning of the Corporate and Market Risk Management System The functioning of the Corporate and Market Risk Management System in 2015 did not change. The ORLEN Group within its operations monitors and assesses risks and undertakes activities in order to minimise their impact on the financial situation on the ongoing basis. PKN ORLEN has an Audit and Corporate Risk Management Department, which coordinates the corporate risk management process at all levels of the organization. The main purpose of the office is to make an independent and objective evaluation of risk management and internal control as well as business process analysis. The Department conducts audit tasks based on the annual audit plans approved by the Management Board and accepted by the Audit Committee of the Supervisory Board and the Supervisory Board. The Department may also perform ad hoc audits commissioned by the Supervisory Board and the Management Board. SCHEME 10. The Risk Management System structure in the ORLEN Group SUPERVISORY BOARD (including: AUDIT COMMITTEE) Performs an annual assessment of the effectiveness of the Enterprise Risk Management System, monitors the level of risks affecting the achievement of business objectives, submits to the General Meeting an evaluation of the internal control system and risk management system. MANAGEMENT BOARD Supervises the process of corporate risk management, accepts the assumptions, principles of risk management periodically reports the results of the risk assessment to the Management Board and the Audit Committee of the Supervisory Board. AUDIT AND CORPORATE RISK MANAGEMENT OFFICE Supervises the process of corporate risk management, develops policies and procedures for risk management at the corporate level, periodically reports the results of the risk assessment to the Management Board and the Audit Committee of the Supervisory Board. Management team Financial Risk Committee Market risk Credit and liquidity risk Operating risk Management team involved in the process of risk management, is responsible for monitoring, identification, assessment and analysis of risks and the implementation of recommendations on the management of various types of risks in the context of the policies.. Manages the risk of changes in market prices of commodities (including refinery and petrochemical margins, differential of Brent/Ural, crude oil and products prices, prices of CO2 emission allowances), and the risk of changes in exchange rates and interest rates Liquidity and credit risk management Net working capital management Market risk management policy Internal policies and procedures Internal policies and procedures The objective of market risk management process is to reduce the undesirable effects of changes in market risk factors on the cash flows and results in the short and medium term. The ORLEN Group applies consistent hedging policy in the field of commodity, currency and interest rate risks. ORLEN Group manages the market risks resulting from the above factors on the basis of market risk management policy, which sets out the rules for measuring individual exposures, parameters and time of risk hedging and hedging instruments. In PKN ORLEN market risk management principles are realized by the designated organizational units under the supervision of: PKN ORLEN s Financial Risk Committee, PKN ORLEN s Management Board and PKN ORLEN s Supervisory Board. Financial Risk Committee of PKN ORLEN is responsible for the supervision and coordination of financial risk management process. In order to ensure the efficiency and operational safety of the process in the PKN ORLEN s Office of Financial Management three areas were created responsible for carrying out financial transactions (Front Office), measurement and risk analysis (Middle Office), reporting and settlement of transactions (Back Office). MANAGEMENT BOARD REPORT ON THE OPERATIONS FOR THE YEAR
138 Management Boards are responsible for risk management in the ORLEN Group companies for each company under the supervision of the Supervisory Boards. For the execution of hedging transactions on behalf of individual companies of ORLEN Group covered by the common hedging policy corresponds to PKN ORLEN, which under the contracts was given appropriate powers of attorney. Effectiveness and performance of hedging transactions are monitored and presented to PKN ORLEN s Committee for Financial Risk Management and PKN ORLEN s Management Board through PKN ORLEN s Office of Financial Management. The risk management process is a continuous process which, due to the changing economic environment is modified. Since 2013 in PKN ORLEN and other entities of the ORLEN Group operate the Enterprise Risk Management Policy and Procedures (ERM) that comprehensively regulates the process of operation of the Integrated Enterprise Risk Management System. According to these regulations Audit and Corporate Risk Management Department coordinates risk management process, providing tools and methodological support for process participants. The adopted methodology allows the identification of risks based on a common model, linking them with the strategic objectives and therefore the same business processes. Entreprise Risk Management is one of the tools facilitating the effectiveness of realization of strategic and operational goals, as it allows for obtaining information on key risks of the organization and provides a guarantee that an effective method of their management was selected. Risk assessment by two business areas is carried out at least one a year and aims at ensuring that the list of risk is updated to list the most significant risks. The assessment will be carried out by the owners of particular processes, risks and control measures. The assessment assumes the significance of each risk in reference to three states: - when no control mechanisms have been implemented in reference to a specific risk the gross risk assessment, - existing with the effective control mechanisms applicable to a given risk the net risk assessment, which depends on the results of effectiveness tests for the operation of control mechanisms limiting a given risk, - expected risk level the so-called appetite for risk, meaning the risk level accepted by the organization, one the organization should aim at. The assessment will specify suitable repair plans for particular risks and their control measures, which can lead to equaling the net risk assessment (with functioning control mechanisms) to the appetite for risk desired by the organization. Each risk assessment and control mechanism testing process is completed with a report, which is submitted to the Management Board Members and the Supervisory Board Audit Committee, which contains comprehensive information on the most significant risks for PKN ORLEN and the planned method of their limitation. In 2015, the process of risk self-assessment and control mechanism testing was carried out in PLN ORLEN S.A. with the presence of the managerial staff, which allowed for updating the assessment of 675 risks by testing 1280 control mechanisms in 85 business processes. The Corporate Audit and Risk Management Office also implements cyclic measures aiming at verifying the quality of the risk assessment process and the control mechanisms. A process aiming at implementing the ERM system in key ORLEN Group companies has been also carried out for three years. In 2015, ERM was implemented in ORLEN Deutschland and ORLEN Gaz and implementation works were finalized in the ORLEN Lietuva Group Risks and threats of conducted operations of the ORLEN Group The main financial risks, to which the ORLEN Group is exposed as part of its activity include: 1. Market risks: commodity risk related with changes: in refinery and petrochemical margins charged on the sales of products, the level of Brent/Ural differential, the prices of crude oil and products, the prices of CO2 emission licenses, exchange rate risk related to the economical currency exposure, interest rate risk related to the volatility of cash flows resulting from changes in interest rates and from the owned assets and liabilities recorded, for which revenues and interest cost depend on variable interest rates. 2. Liquidity risk related to an unforeseeable shortage of cash or lack of cash and access to sources of financing. 3. Loss of cash and deposits risk the risk of bankruptcy of domestic or foreign banks, in which the ORLEN Group deposits its cash. 4. Credit risk related to the unsettlement of receivables delivered for the products and services supplied by the contract parties. Detailed description of the above risks together with their determined way of its measurement on the ORLEN Group financial statements is presented in note to Consolidated Financial Statements for Industry risks - the ORLEN Group is additionally vulnerable to specific risks in fuel industry: Fuel consumption. General economic situation influences significantly on the level of the fuel consumption as well as the sales volume and prices of the ORLEN Group products and have material impact on the financial position. Changes in the diesel oil and gasoline consumption level recorded on the operating markets are presented in point 3.1. The ORLEN Group, operating on the fuel market, is exposed to the risk resulting from the activities of the so called shadow economy connected primarily with the distribution of fuel, disregarding the obligation to pay taxes. In accordance with the estimates of the Polish Organisation of Oil Industry and Trade (POPiHN), influence of shadow economy for diesel may exceed than 20% of its consumption. Crude oil throughput / raw materials supplies. The Company is exposed to disruptions in crude oil throughput due to irregular raw material supplies, lack of access to logistics services through the pipeline and unstable situation in countries where crude oil is extracted. Change in the MANAGEMENT BOARD REPORT ON THE OPERATIONS FOR THE YEAR
139 parameters of supplied crude oil and related lower white product yields as well as overhaul turnaround of production plants may also be of importance. Expansion of existing refineries and construction of new ones in Russia may result in lower volume of exported Russian crude oil and, consequently, lower availability of this raw material for European customers, including the ORLEN Group. Gas purchases are based on the long-term agreement with PGNiG as well as short-term agreements with alternative suppliers. Due to no price mechanisms on liquid gas markets in Europe, prices of gas in Poland may be lower or higher than the prices on neighbouring deregulated markets (such as German or Czech market). The ORLEN Group takes measures to ensure stable raw materials supply, mainly through diversification of sources and adoption of the production installations to process various types of raw materials. Furthermore, the ORLEN Group implements a number of exploration and extraction projects in order to obtain own sources of gas and crude oil. In the scope of product logistics, the ORLEN Group is largely dependent on local companies such as PERN and OLPP owned by PERN in Poland as well as ČEPRO in the Czech Republic. Product logistics of the refinery in Mazeiku is dependent on the sole provider of the railway transport service, that is AB Lietuvos Geležinkeliai. Regulatory risk Changes in current regulations or the new ones may have significant impact on the ORLEN Group, its financial condition and operating results. Realization of National Indicative Target ( NIT ) Since 2008 the obligation to comply with the National Indicative Target (NIT) has been imposed on the fuel producers, which determines the minimum share of biocomponents and other renewable fuels calculated at the heating value in the general quantity of liquid fuels and biofuels consumed up in transport during the calendar year. Following 1 January 2012, it is possible to apply the reduced NIT adjusted by the reduction index of 0.85 for a given year, if at least 70% of biocomponents obtained from domestic producers entered in the producer register maintained by the Agricultural Market Agency are used in fuel production. Starting from 2015, all bio-components used in order to fulfill the obligation must meet the criteria of sustainable development. In 2015, a decision on an extension of the operation of the NIT reduction mechanism for the years was made. The level of NIT in 2016 for Poland will remain unchanged and will amount to 7.1%. The level for PKN ORLEN, after including the abovementioned reduction index, will be set at 6.035%. In case of non-compliance with NIT, penalty of PLN 17.5 thousand per tonne of not used biocomponents may be imposed. Additionally the implement of the provisions of Directive 2009/30 / EC will force the realization of the National Target Reduction (NTR) related to the mandatory reduction of greenhouse gas emission (GHG) by 6% by the end of 2020 compared with CO2 emission rights. On 26 February 2014, the European Commission approved the draft plant list with the preliminary number of CO2 emission rights granted free-of-charge. The legislative process is being finalized on the domestic level. As a part of CO2 emissions management, the ORLEN Group annually monitors CO2 emission for the plants covered by the emission trade system and compares the number of rights, together with determination of the way of systematic balancing of the identified shortages/surpluses by way of intragroup transactions or forward and futures and spot transactions. Industrial emissions. The Industrial Emissions Directive introduces, following 2016, emission standards for sulphur dioxide, nitrogen dioxide and dust, more restrictive than the existing ones. In order to meet the above requirements, the ORLEN Group constructed the flue gases desulphurisation, denitrification and dedusting installation, which will reduce the emission of sulphur and nitrogen dioxide as well as dust from the Heat and Power Plant in Płock by more than 90%. Color energy certificates. Color certificates support electric energy producers of renewable sources and high efficiency cogeneration. The number of awarded free of charge color certificates depends on size of energy production and the structure of used fuel. The legislation work carried out on amending the Energy Law and other laws has been restored the certified system of supporting electricity generation in high-efficiency cogeneration in the horizon until In the following years, the ORLEN Group is exposed to risks associated with the number of certificates, price changes of certificates and the risk of increase in the cost of substitute fees. Mandatory reserves. In 2014 as a part of the implementation of Community legislation, the changes regulating the level of mandatory reserves have been made. Under the new regulations, manufacturers and traders in return for a gradual reduction of obligation in the level of reserves maintained (from 76 days to 53 days of average daily fuel production or import of crude oil or fuels at the end of 31 December 2017) for the reserves maintained by the for Material Reserves Agency, are required, starting 1 January 2015, to pay an additional fee concerning mandatory reserves. In 2015, mandatory reserves were reduced by 8 days to the level of 68 days, and the additional fee concerning mandatory reserves amounted to 43 PLN/tonne of crude oil and 99 PLN/tonne of LPG. During 2016, there will be further reduction of mandatory reserves level from 68 to 60 days. Change of the mandatory reserves system will have an influence on the partial release of capital frozen until now in physically maintained mandatory reserves of crude oil and fuels. The ORLEN Group is exposed to an increase in operating costs due to an additional fee concerning mandatory reserves and paid to Material Reserves Agency, which amount will depend on the quantity of reserves maintained. Additional fee could have an influence on fuel prices and as a result on the level of domestic consumption. Moreover, the maintenance of mandatory reserves (despite a reduction in the proportion of reserves maintained by producers) is still connected with the costs of financing and storage and also creates a risk of noncash impact on the ORLEN Group's operating results in case of changes in market prices leading to revaluation of the reserves value. Hydrocarbon tax The act of 25 July 2014 on special hydrocarbon tax entered into force on 1 January The MANAGEMENT BOARD REPORT ON THE OPERATIONS FOR THE YEAR
140 act introduced a new tax and expanded the scope of extraction taxation for certain minerals to include the extraction of crude oil and natural gas. According to the act, the special hydrocarbon tax will be charged on the profits from hydrocarbon extraction activity. According to the act, crude oil, natural gas and their natural derivatives will be treated as hydrocarbons. The act will also introduce several changes in the act on tax on the extraction of specific minerals. Its provisions will also assume extraction activity in terms of natural gas and crude oil. The introduction of additional burdens resulting from the hydrocarbon act can act to the detriment of the ORLEN Group activity economy in the Upstream segment. Liberalization of the gas market The process of liberalization of the gas market implies a two-stage departure from the gas price tariffs (the I stage: institutional buyers, the II stage: households). The potential impact of the liberalization of the gas market for ORLEN Group may cause changes in gas prices resulting from the abolition of tariffs and the gradual reduction of the scope of long-term contracts for the construction of a portfolio of suppliers in the short-term contracts. Sales tax. The legislature is conducting works on the introducing a retail sales tax. The tax is to assume store chains and retail sellers who generate a defined level of sales revenue. According to the provisions of the draft, the retail sales tax will be progressive and will assume diverse rates, depending on the level of sales. Conducting retail sales as part of its fuel station network, the ORLEN Group can become a payer of the aforementioned tax. New business areas. According to the strategy, the ORLEN Group focuses on the construction of new business segments including upstream and energy. The development of these areas is aimed at diversification of the of the Group s operations, which currently focuses on downstream activities, which are related to the throughput of crude oil into petroleum products, including fuel, and the sale of these products to customers. Upstream projects are subject to a number of geological and operational risks, which may prevent the realization of expected profits. Implementation of these projects may be delayed or may not be successful, primarily because of the high exploration risk of this type of projects, exceed of costs, lower than expected crude oil and gas prices, high fiscal burden, adverse changes in the sectorial regulations, shortages of equipment and qualified personnel, harsh weather conditions, and the difficulty in finding experienced partners to share the risks and costs connected with conducting projects. These projects can also often require the use of new, advanced technologies, which are expensive to develop, acquire and implement, and may not function as expected. Energy projects are primarily exposed to the risk of an increase in natural gas prices and to the risk of an unfavourable changes in the regulations related to the loss of support for producers of electricity from renewable sources and produced in high-efficiency cogeneration. Operations and unforeseen accident losses risk. The ORLEN Group is exposed to operations and unforeseen accident losses. Any adverse effects of such risks are minimalised through adopted professional and tailored to the Group s individual needs insurance program. The program is created and operated by the entity formed specially for that purpose - ORLEN Insurance Ltd. Insurance coverage under ORLEN Insurance Ltd. polices is reinsured by the biggest international insurance and reinsurance companies under the program led by AIG Europe and Allianz, and where the biggest world and Polish insurance companies such as AIG, Allianz, SCOR, VIG, Munich Re, ACE and PZU and TUiR Warta are involved. In addition to comprehensive assets insurance, the ORLEN Group holds other insurances to ensure minimizing the adverse impact of damages i.e. third party insurance or property insurance in transport. Court and regulatory tax proceedings, customs and excise duty inspections. The ORLEN Group companies are currently engaged in proceedings referred to point 2.10 or may possibly be engaged in the future in other court or regulatory proceedings. The ORLEN Group has been a subject of a number of tax, customs and excise duty inspections. Although the Company does not expect at present that any of the above proceedings, to which it is a party, will possibly have negative impact on its financial standing and results on operations, it is uncertain whether the final result of current or future proceedings will not have such an impact on the ORLEN Group results or financial standing. Risks related to the stability and security of IT systems and data. Due to the functioning in the ORLEN Group the complex and advanced IT systems in many areas of activity, to the typical extend for corporate organization, identifies the risks associated with the proper information systems functioning. Information systems in the ORLEN Group are secured in accordance with the best world practices in IT security, but risks in this area cannot be excluded. MANAGEMENT BOARD REPORT ON THE OPERATIONS FOR THE YEAR
141 2.9. Significant contracts Specification of significant contracts published in current announcements. A significant contract, within the meaning of the Minister of Finance Regulation, should be understood as a contract or sum of contracts, whose total value for the period of 12 months exceeds 10% of PKN ORLEN equity. JANUARY 2015 On 12 January 2015 PKN ORLEN signed one-year agreement with BP Europa SE for the sales by PKN ORLEN of gasoline and diesel oil for the period between 1 January 2015 and 31 December The total estimated net value of the agreement amounts to PLN million. The total value of agreements signed between PKN ORLEN and PKN ORLEN subsidiaries and companies from the BP Group in the peri od from 7 November 2014 to 12 January 2015 amounts to approximately PLN million. Regulatory announcement no. 3/2015 On 12 January 2015 PKN ORLEN signed one-year agreement with Lukoil Polska Sp. z o.o for the sales by PKN ORLEN of gasoline and diesel oil for the period between 1 January 2015 and 31 December The total estimated net value of the agreement amounts to PLN million. The total value of agreements signed between PKN ORLEN and PKN ORLEN subsidiaries and companies from the Lukoil Group in the period from 11 January 2014 to 12 January 2015 amounts to approximately PLN million. Regulatory announcement no. 4/2015 On 12 January 2015 it signed one-year agreement with Shell Polska Sp. z o.o for the sales by PKN ORLEN of gasoline and diesel oil to for the period between 1 January 2015 and 31 December The total estimated net value of the agreement amounts to PLN million. The total value of agreements signed between PKN ORLEN and PKN ORLEN subsidiaries and companies from the Shell Group in the period from 7 August 2014 to 12 January 2015 amounts to approximately PLN million. Regulatory announcement no. 5/2015 FEBRUARY 2015 On 10 February 2015 ORLEN Deutschland GmbH signed an agreement with Lekkerland Deutschland GmbH & Co. KG. On the base of the agreement Lekkerland Deutschland delivers to gas stations of ORLEN Deutschland goods and services from the non-fuel categories in the period of 1 February 2015 until 31 January Estimated net value of the agreement amounts to EUR 780 million, i.e. PLN million based on EUR/PLN average exchange rate as of 10 February 2015, stated by the National Bank of Poland. Regulatory announcement no. 20/2015 On 16 February 2015 PKN ORLEN signed a spot agreement with Statoil ASA, for crude oil deliveries to PKN ORLEN. The total estimated value of agreements signed between PKN ORLEN and PKN ORLEN subsidiaries and companies from the Statoil Group in the 12 months to 16 February 2015 amounts to approximately PLN million. The agreements between ORLEN Group and companies from the Statoil group were concluded for the purchase of products and crude oil. Regulatory announcement no. 25/2015 MARCH 2015 On 2 March 2015 PKN ORLEN signed a spot agreement with Vitol S.A for crude oil deliveries to AB ORLEN Lietuva. The total estimated value of agreements signed between PKN ORLEN and PKN ORLEN subsidiaries ( ORLEN Group ) and companies fro m the Vitol group in the period from 23 December 2014 to 3 March 2015 amounts to approximately PLN million. The agreements between ORLEN Group and companies from the Vitol group were concluded for the sales and purchase of products and purchase of crude oil. Regulatory announcement no. 32/2015 On 4 March 2015 within ORLEN Group there were concluded agreements with companies from Eni group. The total estimated value of agreements signed between ORLEN Group and companies from the Eni group in the period from 18 June 2014 to 5 March 2015 amounts to approximately PLN million. The agreements between ORLEN Group and companies from the Eni group were concluded for the purchase of products and crude oil Regulatory annoucement no. 34/2015 APRIL 2015 On 16 April 2015 within ORLEN Group there was concluded agreement with company from Trafigura Group. The total estimated value of agreements signed between ORLEN Group and companies from the Trafigura Group in the 12 months untill 16 April 2015 amounts to approximately PLN million. The agreements between ORLEN Group and companies from the Trafigura Group were concluded for the sales of products and purchase of crude oil. Regulatory announcement no. 58/2015 On 30 April 2015 PKN ORLEN and Rosneft Oil Company, signed second annex to the agreement dated 21 June 2013 for crude oil deliveries to Unipetrol RPA s.r.o. The Annex provides increase of crude oil volumes deliveries to Unipetrol RPA s.r.o. by ca. 120 thousand tonnes of REBCO crude oil per month. The Annex will be valid from 1 May 2015 to 30 June As of the day of signing of the Annex, the estimated total value of the deliveries, specified in the Annex, by 30 June 2016 amounts to approximately USD 700 million (i.e. approximately PLN million, based on the average PLN/USD exchange rate as of 30 April 2015, as stated by the National Bank of Poland). Regulatory announcement no. 71/2015 MAY 2015 On 27 May 2015 within ORLEN Group there was concluded agreement with company from Lukoil Group. The total estimated value of agreements signed between ORLEN Group and companies from the Lukoil Group in the period from 13 January 2015 to 28 May 2015 amounts to approximately PLN million. The agreements between ORLEN Group and companies from the Lukoil Group were concluded for the sales of products and purchase of crude oil. Regulatory announcement no. 83/2015 JUNE 2015 On 22 June 2015 within ORLEN Group there was concluded agreement with company from Mercuria Group. The total estimated value of agreements signed between ORLEN Group and companies from the Mercuria Group in the period from 29 July 2014 to 23 June 2015 amounts to approximately PLN million. The agreements between ORLEN Group and companies from the Mercuria Group were concluded for the purchase of crude oil. Regulatory announcement no. 94/2015 On 23 June 2015 within ORLEN Group, there was concluded agreement with company from Glencore Group. The total estimated value of agreements signed between ORLEN Group and companies from the Glencore Group in the period from 15 October 2014 to 24 June 2015 amounts to approximately PLN million. The agreements between ORLEN Group and companies from the Glencore Group were concluded for the purchase of crude oil. Regulatory announcement no. 95/2015 On 25 June 2015 ORLEN Deutschland GmbH signed yearly agreement with BP Europe SE. The agreement was signed for the sale of fuels to ORLEN Deutschland fuel stations in Germany till 31 December The estimated net value of the agreement amounts to EUR million (i.e. approximately PLN million based on EUR/PLN average exchange rate as of 25 June 2015, stated by the National Bank of Poland). The total estimated value of agreements signed between ORLEN Group and companies from the BP Group in the period from 13 January 2015 to 25 June 2015 amounts to approximately PLN million. The agreements between ORLEN Group and companies from the BP Group were concluded for the purchase and sales of products and purchase of crude oil. Regulatory announcement no. 96/2015 MANAGEMENT BOARD REPORT ON THE OPERATIONS FOR THE YEAR
142 JULY 2015 On 27 July 2015 within ORLEN Group there was concluded agreement with company from Total Group. The total estimated value of agreements signed between ORLEN Group and companies from the Total Group in the period from 24 October 2014 to 28 July 2015 amounts to approximately PLN million. The agreements between ORLEN Group and companies from the Total Group were concluded for the sales of products and purchase of crude oil. Regulatory announcement no. 110/2015. On 30 July 2015 within ORLEN Group there was concluded agreement with company from Vitol Group. The total estimated value of agreements signed between ORLEN Group and companies from the Vitol Group in the period from 4 March 2015 to 31 July 2015 amounts to approximately PLN million. The agreements between ORLEN Group and companies from the Vitol Group were concluded for purchase of crude oil. Regulatory announcement no. 111/2015 SEPTEMBER 2015 On 22 September 2015 within ORLEN Group there was concluded agreement with company from Trafigura Group. The total estimated value of agreements signed between PKN ORLEN and companies from the Trafigura Group in the period from 18 April 2015 to 23 September 2015 amounts to approximately PLN million. The total estimated value of agreements signed between PKN ORLEN subsidiaries and companies from the Trafigura Group in the period from 18 April 2015 to 23 September 2015 amounts to approximately PLN million. The agreements between ORLEN Group and companies from the Trafigura Group were concluded for the sales of products and purchase of crude oil. Regulatory announcement no. 134/2015 On 23 September 2015 within ORLEN Group there were concluded agreements with company from Gunvor Group. The total estimated value of agreements signed between PKN ORLEN and companies from the Gunvor Group in the last 12 months amounts to approximately PLN million. The total estimated value of agreements signed between PKN ORLEN subsidiaries and companies from the Gunvor Group in the last 12 months amounts to approximately PLN million. The agreements between ORLEN Group and companies from the Gunvor Group were concluded for the sales of products and purchase of crude oil. Regulatory announcement no. 135/2015 OCTOBER 2015 On 2 October 2015 within ORLEN Group there was concluded agreement with company from Vitol Group. The total estimated value of agreements signed between ORLEN Group and companies from the Vitol group in the period from 1 August 2015 to 2 October 2015 amounts to approximately PLN million. The agreements between ORLEN Group and companies from the Vitol Group were concluded for purchase of crude oil and natural gas. Regulatory announcement no. 140/2015 On 12 October 2015 within ORLEN Group there was concluded agreement with company from Socar Group. The total estimated value of agreements signed between ORLEN Group and companies from the Socar Group in the last 12 months amounts to approximately PLN million. The agreements between ORLEN Group and companies from the Socar Group were concluded for purchase of crude oil. Regulatory announcement no. 146/2015 NOVEMBER 2015 On 9 November 2015 within ORLEN Group there was concluded agreement with company from Glencore Group. The total estimated value of agreements sig ned between ORLEN Group and companies from the Glencore Group in the period from 25 June 2015 to 10 November 2015 amounts to approximately PLN million. The agreements between ORLEN Capital Group and companies from the Glencore Group were concluded for the purchase of crude oil and rapeseed oil. Regulatory announcement no. 155/2015 On 20 November 2015 within ORLEN Group there was concluded agreement with company from Mercuria Group. The total estimated value of agreements signed between ORLEN Capital Group and companies from the Mercuria Group in the period from 24 June 2015 to 20 November 2015 amounts to approximately PLN million. The agreements between ORLEN Group and companies from the Mercuria Group were concluded for the purchase of crude oil and natural gas. Regulatory announcement no. 160/2015 DECEMBER 2015 On 23 December 2015 PKN ORLEN signed an agreement with Tatneft Europe AG, for crude oil deliveries, in the quantity from 3.6 million tonnes to 7.2 million tonnes, to PKN ORLEN. The deliveries will be realized starting from 1 January 2016 to 31 December In the Agreement there have been set liquidated damages in the amount not higher than ca. PLN 2 million monthly. The estimated maximum value of the deliveries by 31 December 2018 will amount to approximately PLN million.regulatory announcement no. 177/2015 On 30 December 2015 PKN ORLEN signed with Rosneft Oil Company an annex to the agreement signed on 1 February 2013 for crude oil deliveries to PKN ORLEN, in the quantity from 18 million tonnes to 25.2 million tonnes. The deliveries will be realized starting from 1 February 2016 to 31 January The estimated maximum value of the deliveries, in current market conditions, by 31 January 2019 will amount to approximately PLN million. Regulatory announcement no. 178/2015 Specification of significant contracts in 2016 until publication date of the following Management Board Report s. JANUARY 2016 On 11 January 2016 within ORLEN Group there were concluded agreements with companies from Shell Group. On the basis of yearly agreement signed between PKN ORLEN and Shell Polska Sp. z o.o., PKN ORLEN will be selling gasoline and diesel oil to Shell Polska in the period from 1 January 2016 to 31 December The total estimated net value of the agreement amounts to PLN 2.1 billion. The total estimated value of agreements signed between ORLEN Group and companies from the Shell Group in the period from 13 January 2015 to 11 January 2016 amounts to approximately PLN million. The agreements between ORLEN Group and companies from the Shell Group were concluded for the purchase of crude oil as well as purchase and sales of products. Regulatory announcement no. 3/2016 On 11 January 2016 within ORLEN Group there was concluded agreement with company from BP group. On the basis of yearly agreement signed today between PKN ORLEN and BP Europa SE, PKN ORLEN will be selling gasoline and diesel oil to BP Europa in the period from 1 January 2016 to 31 December The total estimated net value of the agreement amounts to PLN million. The total estimated value of agreements signed between ORLEN Group and companies from the BP group in the period from 26 June 2015 to 11 January 2016 amounts to approximately PLN million. The agreements between ORLEN Group and companies from the BP Group were concluded for the purchase of crude oil as well as purchase and sales of products. Regulatory announcement no. 4/2016 On 11 January 2016 within ORLEN Group there was concluded agreement with company from Lukoil Group. On the basis of yearly agreement signed today between PKN ORLEN and Lukoil Polska Sp. z o.o., PKN ORLEN will be selling gasoline and diesel oil to Lukoil Polska in the period from 1 January 2016 to 31 December The total estimated net value of the agreement amounts to PLN million. The total estimated value of agreements signed between ORLEN Group and companies from the Lukoil Group in the period from 29 May 2015 to 11 January 2016 amounts to approximately PLN million. The agreements between ORLEN Group and companies from the Lukoil Group were concluded for the purchase of crude oil and sales of products. Regulatory announcement no. 5/2016 On 18 January 2016 within ORLEN Group there was concluded agreement with company from Vitol Group. The total estimated value of agreements signed between ORLEN Group and companies from the Vitol Group in the period from 3 October 2015 to 19 January 2016 amounts to approximately PLN million. The agreements between ORLEN Group and companies from the Vitol Group were concluded for purchase of crude oil and gas as well as sales of products. Regulatory announcement no. 10/2016 MANAGEMENT BOARD REPORT ON THE OPERATIONS FOR THE YEAR
143 Agreement with the entity authorized to conduct audit of financial statements The entity authorized to conduct audit of financial statements of ORLEN Group for 2015 is KPMG Audyt Sp. z o.o. For further details on the abovementioned agreement see note to the Consolidated Financial Statements for the year Information on significant court, arbitration and administrative proceedings Proceedings in which the ORLEN Group entities act are the defendant Proceedings with the total value exceeding 10% of the Issuer s equity Risk connected with the disposal of assets and liabilities related to purchase of Unipetrol shares The claim regarding the payment of compensation for losses related among others, to alleged unfair competition of PKN ORLEN included in Agrofert Holding a.s. (Agrofert) claim and alleged illegal violation of reputation of Agrofert in relation to purchase by PKN ORLEN of UNIPETROL a.s. shares. On 21 October 2010 the Court of Arbitration in Prague overruled the entire claim of Agrofert against PKN ORLEN regarding the payment of PLN million translated using the exchange rate as at 31 December 2015 (representing CZK million) with interest and obliged Agrofert to cover the cost of proceedings born by PKN ORLEN. On 3 October 2011 PKN ORLEN received from the common court in Prague (Czech Republic) Agrofert s claim which overruled the sentence of the Arbitration Court attached to the Economic Chamber of the Czech Republic and Agricultural Chamber of the Czech Republic in Prague issued on 21 October The complaint was dismissed by the court in Prague with the ruling of 24 January On 7 April 2014 Agrofert filed an appeal against that judgement. On 7 April 2015 the court of appeals dismissed the appeal of Agrofert and therefore confirms the earlier judgment of the court of 24 January 2014 dismissing Agrofert s claim which overruled the sentence of the Arbitration Court attached to the Economic Chamber of the Czech Republic and Agricultural Chamber of the Czech Republic in Prague of 21 October In the opinion of PKN ORLEN, the decision included in the judgment of the Arbitration Court dated 21 October 2010, in the judgment of the common court in Prague dated 24 January 2014 and in the judgment of the court of appeals dated 7 April 2015 are correct and the company will take all necessary means to retain the judgment in force. Other significant proceedings with the total value not exceeding 10% of the Issuer s equity Tax proceedings in ORLEN Południe S.A. (previously Rafineria Trzebinia S.A.) On 14 May 2014 and 20 May 2014 the company received the decisions of the Director of the Customs Office in Kraków determining excise tax liabilities for the periods: May, June, July and August 2004 at the amount of PLN 132 million. Rafineria Trzebinia S.A. paid the entire liability with accrued interest. At the same time, provisions recognized for this purpose in prior years were used. Rafineria Trzebnia S.A. appealed to the Voivodship Administrative Court (VAC) in Kraków the decisions of tax liability for the months May August On 26 February 2015 the VAC in Kraków announced a judgment dismissing the company s claim. On 5 May 2015 the company submitted to the Supreme Administrative Court in Warsaw annulment claims against the judgement of the VAC, that were not recognized until the date of approval of the foregoing financial statements. Pursuant to a decision issued by the European Court of Justice in Luxembourg in a similar case, the company submitted application for the reopening of its administrative procedure. Under decisions issued on 23 July 2015, the director of the Customs Office in Kraków refused to reopen the procedure due to ongoing proceeding with the SAC in matters closed with ultimate decisions for May August. The company appealed against the decisions of the Director of the Customs Office in Kraków, which were however denied. The company complained against these decisions on 16 November 2015, however, they have not been recognized until the date of the financial statements. Power transfer fee in settlements with ENERGA OPERATOR S.A. (legal successor of Zakład Energetyczny Płock S.A.) PKN ORLEN participates in a court proceeding concerning the settlement of a disputed system fee with ENERGA OPERATOR S.A. for the period from 5 July 2001 to 30 June ENERGA OPERATOR S.A. claims from PKN ORLEN payment of PLN 46 million plus accrued interest. During the retrial, an opinion was prepared by an expert witness for the variant damages calculation. The District Court in Warsaw (as the initial court) by its judgment from 27 October 2014 ordered PKN ORLEN to pay to ENERGA - OPERATOR S.A. the amount of PLN 46 million, together with accrued interest from 30 June 2004 to the date of payment. This judgment is not binding. PKN ORLEN filed an appeal against this judgment. The first hearing with the Appeals Court took place on 12 November The court is expected to set the date of the next hearing. On 29 June 2015, PKN ORLEN received the next lawsuit in the case, in which ENERGA OPERATOR S.A. claimed an additional sum of approx. PLN 13.3 million. The court is proceeded by the District Court in Łódź. On 10 July 2015, a reply to the lawsuit was submitted, in which the lawsuit was questioned as illegitimate. On 22 December 2015, the District Court in Łódź announced its sentence, in which it dismissed the claim of ENERGA- OPERATOR S.A. regarding the payment of the sum of PLN 13 million by PKN ORLEN and adjudged that ENERGA-OPERATOR S.A. paid the costs of the trial. I. I.P.-95 s.r.o. compensation claim against UNIPETROL RPA s.r.o. On 23 May 2012, UNIPETROL RPA s.r.o. received from the District Court in Ostrava a claim brought by I.P.-95 s.r.o. for compensation related to the filing by UNIPETROL RPA s.r.o. a MANAGEMENT BOARD REPORT ON THE OPERATIONS FOR THE YEAR
144 motion for bankruptcy of the company I.P.-95 s.r.o. in November The total amount of the claim is approximately PLN 282 million, translated using the exchange rate as at 31 December 2015 (representing CZK million). UNIPETROL RPA s.r.o. is one of 8 defendants against which the claim was brought. According to UNIPETROL RPA s.r.o the claim is without merit. Based on a Supreme Court decision, on the jurisdiction of the court proceedings is continued in the District Court in Ostrava. The court shall give procedural issues. Claim of OBR S.A. for compensation On 5 September 2014, the company OBR S.A. filed an action against PKN ORLEN with the District Court in Łódź for a claim for payment in respect of an alleged breach by PKN ORLEN of patent rights: The technique of the separation of hydrodesulfurization products of heavy residue after extractive distillation of crude oil. The amount of the claim in the lawsuit has been estimated by the OBR S.A. of approximately PLN 83 million. The claim covers the adjudged sum of money from PKN ORLEN for the OBR S.A. in the amount corresponding to the market value of the license fee for the use of the solution under the above patent and adjudge the obligation to repay the benefits derived from the use of this solution. On 16 October 2014, PKN ORLEN responded to the lawsuit. The value of the dispute was referred to by the plaintiff in a procedural document from 11 December 2014 in the amount of PLN 247 million. By the court order from 21 May 2015 the parties were directed to mediation. Mediations are in progress. In the opinion of PKN ORLEN, the patent infringement claim is illegitimate. Court proceedings in which entities of the Group act as a plaintiff Compensations due to damages suffered by Rafineria Trzebinia S.A (currently ORLEN Południe S.A) ORLEN Południe S.A. acts as an auxiliary prosecutor in proceedings started in 2010 concerning abuses associated with the realization of an investment - installation for the esterification of biodiesel oils, in which Rafineria Trzebinia S.A. claims to have incurred a loss of approximately PLN 79 million. The Company filed a motion requesting to oblige the defendants to compensate the incurred damages. There is an criminal investigation in progress concerning the alleged accused acting to the detriment of the company. A hearing took place on 26 January 2016, during which one of the defendants presented their explanations. The court set the next hearing for 11 February 2016 to continue the defendant s hearing. Proceeding of ORLEN Lietuva for compensation in respect of an accident at the Terminal in Butingė AB ORLEN Lietuva is a plaintiff in a court proceeding against RESORT MARITIME S.A., The London Steamship Owners Mutual Insurance Association Limited, Sigma Tankers Inc., Cardiff Maritime Inc., Heidenreich Marine, Heidenreich Maritime Inc. and Heidmar Inc. regarding compensation payment for damage caused by a collision of a tanker ship into a terminal buoy in Butinge Terminal on 29 December The legal proceedings were started in December The total compensation claim amounts to approximately PLN 74 million, translated using the exchange rate as at 31 December 2015 (representing approximately EUR million). In October the parties agreed to change the jurisdiction to English courts. The company expects the next hearing date to be announced. Tax proceedings in UNIPETROL RPA s.r.o. UNIPETROL RPA s.r.o., acting as a legal successor of CHEMOPETROL a.s. claims a refund of income taxes paid in 2006 for the year 2005 by CHEMOPETROL a.s.. The claim concerns unused investment relief attributable to CHEMOPETROL a.s.. The value of the claim amounts to approximately PLN 52 million, translated using the exchange rate as at 31 December 2015 (representing approximately CZK 325 million). On 11 December 2013, the Court in Usti by the Elbe River (Czech Republic) issued a judgement in which it dismissed the decisions of the tax authorities regarding income tax liability of UNIPETROL RPA s.r.o. UNIPETROL RPA s.r.o. submitted an annulment claim against the sentence of the Court in Usti by the Elbe River seeking to dismiss the decision of the tax authorities and to state that they are invalid, as such statement would improve the company's position against the tax authorities in this particular case. On 19 March 2014 the Czech supreme administrative court overruled the annulment claim of UNIPETROL RPA, s.r.o and at the same time dismissed the Court in Usti by the Elbe River judgment and decided to return the case to the Court in Usti for re-examination. At a hearing on 25 February 2015 the Court in Usti by the Elbe River rejected of an annulment claim of UNIPETROL RPA s.r.o regarding dismissal of the tax authorities decision. On 8 April 2015 UNIPETROL RPA s.r.o. submitted an annulment claim against this sentence. On 14 October 2015, the Supreme Administrative Court repealed the sentence of the Court of Usti by the Elbe River and decided to return the case to this Court for reconsideration. Arbitration proceedings against Basell Europe Holdings B.V. On 20 December 2012 PKN ORLEN sent an arbitration request to Basell Europe Holdings B.V. regarding an ad hoc proceeding before the Court of Arbitration in London relating to Joint Venture Agreement signed in 2002 between PKN ORLEN and Basell Europe Holdings B.V. The claims arising from the use by Basell Sales & Marketing Company so-called Cash Discounts which effectively led to a lower product price payable to Basell ORLEN Polyolefins Sp. z o.o. On 27 February 2014 PKN ORLEN submitted its statement on this case, according to which, it requests payments from Basell Europe Holdings B.V. to Basell ORLEN Polyolefins Sp. z o.o. in the amount of PLN 128 million, translated using the exchange rate as at 31 December 2015 (representing approximately EUR 30 million) plus interest, or alternatively, from Basell Europe Holdings B.V. to PKN ORLEN the amount of approximately PLN 57 million, provided that the amounts may be adjusted during arbitration proceedings. On 10 April 2014 PKN ORLEN submitted an application for suspension of the arbitration proceedings until 1 November Basell Europe Holdings B.V. accepted this request. On 23 April 2014 the parties received the Tribunal s decision regarding the suspension of the proceeding until 1 November On 1 November 2014, the arbitration proceedings were resumed. On March 2015 an evidentiary hearing was held in London in which the parties summarized their case positions and some witnesses and experts were interviewed. On 27 March 2015, the Court of Arbitration issued a procedural ordinance which established the schedule for MANAGEMENT BOARD REPORT ON THE OPERATIONS FOR THE YEAR
145 further proceedings, including the order of submission of further pleadings by the parties. On 29 May 2015 the two parties submitted letters in which they referred to the position of the opposing party in terms of summaries of the case. Additionally, the parties requested expenditures and costs incurred in arbitration proceedings. Further proceedings are not envisaged. Parties are awaiting a judgment. The dispute between ORLEN Lietuva and Lietuvos Geležinkeliai On 31 December 2014, ORLEN Lietuva filed a motion for arbitration against the company Lietuvos Gelezinkeliai ( LG ) in the court of arbitration in Vilnius. Currently in this proceeding ORLEN Lietuva seeks the recalculation of rail transport tariffs in line with the agreement with LG. Taking into account the claim would result in obtaining the savings (compensation) in the amount of at least approx. PLN 162 million, translated with the exchange rate as at 31 December 2015 (equivalent of EUR 38 million) due to a breach of contract of rail transport by LG because of excessive rates. The amount of the claim will increase continuously in accordance with the activity on the base of the agreement. At the same time, 4 court proceedings were instituted until 31 December 2015, in which LG claimed the payment of approx. PLN 77 million by ORLEN Lietuva, as translated at the exchange rate of 31 December 2015 (which corresponds to approx. EUR 18 million), of charges for railway transport. Three of the aforementioned proceedings were merged, and then the court decided that the merged case would be proceeded by a state court, since the jurisdiction of a court of arbitration is given top priority. The proceeding in the fourth case was suspended by the court until the court of arbitration decides on the action brought by Orlen Lietuva. LG appealed against the aforementioned decisions of state courts. A date of the appeal hearing it to be set. Significant transactions in the ORLEN Group concluded on the other than arms-length terms There were no significant transactions in PKN ORLEN concluded with related parties on other than arm s length terms in 2015 MANAGEMENT BOARD REPORT ON THE OPERATIONS FOR THE YEAR

146 2.11. Employment, policy and personel programmes Mirosław Kochalski, Vice-President of the Management Board of PKN ORLEN, Corporate Affairs: The human resources policy in 2015 was focused on the implementation of a strategy based on three pillars: competent, committed and motivated employees, properly chosen and effective tools supporting human resources processes and efficient organization. The effects of these measures were recognized by independent institutions which honoured PKN ORLEN with a series of distinctions, including again, the prestigious certificate awarded for the Group s human resources policy Top Employers Polska In 2015, the human resources policy adopted by the ORLEN Group focused on three key aspects. The first of them concerned the ORLEN Group consolidation processes (ORLEN Serwis, ORLEN Południe, ORLEN Paliwa) and the acquisition of production assets of ORLEN Oil and ORLEN Asfalt by PKN ORLEN. As part of these processes, the employees of these entities were transferred to new or the acquiring entities. The second element is restructuring processes, assuming the implementation of a four-brigade shift system in PKN ORLEN and the optimization of employment in the rest of companies, mainly in the ORLEN Lietuva Group and in ORLEN Oil. The third area includes developmental initiatives related to expanding the scale of activity, primarily in upstream (the ORLEN Upstream Group) and in the maintenance area (ORLEN Serwis S.A.). Consequently, employment in the ORLEN Group decreased by 373 people, resulting in a total of people at the end of DIAGRAM 42. Employment at the end of 2015 and 2014 in the ORLEN Group companies DIAGRAM 43. Employment structure in the ORLEN Group in professional groups in DIAGRAM 44. Employment structure of men and women in Management and Supervisory Boards in Realized personnel programs Personnel policy ( HR ) The measures implemented in 2015 in the HR area were focused on the fulfillment of a strategy based on three pillars: competent, committed and motivated employees, effective and simple tools and human resources processes and cost-effective organization. Works related to building the commitment of ORLEN Group s employees were continued. An employee opinion survey was carried out in 11 companies of the ORLEN Group, and initiatives to raise their commitment were implemented, including: simplification of procedures, preparation of solutions in development and the use of employees potential, facilitation of communication, implementation of pro-community initiatives. Furthermore, negotiations were conducted and payroll solutions were implemented according to the standard adopted for the ORLEN Group. MANAGEMENT BOARD REPORT ON THE OPERATIONS FOR THE YEAR
147 Recruitment policy In 2015 the recruitment policy of the ORLEN Group was continued and focused on acquiring high-class specialists whose knowledge and competences together with an experience and professionalism of the current employees will ensure continuity and the highest level of business processes realized by the ORLEN Group. Undertaken actions were focused on recruiting employees whose attitude and values were consistent with ethical values and standards of conduct in PKN ORLEN. The actions were undertaken focused on the cooperation with the academic environment and on raising interest among students and graduates in their development in the areas of upstream and power industry of the ORLEN Group s operations. PKN ORLEN took part in the Job Fairs on technical universities and assisted students and graduates in gaining their first professional experience through providing internships and traineeships. Furthermore, the educational programmes were implemented in the form of workshops addressed to the students. The so-called Adaptation Programme was continued, thanks to which newly hired employees become familiar with the ORLEN Group s activities and organizational culture and realize e-learning training including the history as well as current organizational and labour issues, values and principles of conduct. Development and training To guarantee their continuous development, exchange of knowledge and experience, employees can take advantage of numerous initiatives facilitating their participation in interdepartmental projects, stimulating their further involvement in the process of mobility, and guaranteeing their self-improvement and cooperation in the implementation of best practices and uniform standards. The development and training activities in PKN ORLEN were focused, both on strengthening of the employees abilities in the area of securing the achievement of business goals and shaping of the desired organizational culture supporting strategy execution and enhancing employees engagement. The leading trends of 2015 were: diversity management, commitment and innovativeness. To stimulate the development of leadership skills, the Group launched the Leader Zone program, i.e. a multi-module program for the development of leadership skills in the form of workshops shaping managerial abilities in the area of team management, team potential, commitment and innovativeness building, and managerial authority. As part of the Leader Zone, prodevelopment initiatives directed at female managers were initiated in the form of discussion panels devoted to the role of women in business, attended by experts in motivation, diversity management and business psychology. Furthermore, a new talent program titled the ORLEN Talent Academy was launched. The program is dedicated to managers at PKN ORLEN and selected ORLEN Group companies. Thematic lectures for employees called Wektor were continued, and new forms of inspiration in the form of meetings with authorities from various disciplines were introduced. As part of the Narzędziownik program, employees were proposed to develop their abilities in terms of: cooperation in a diverse team, strengthening of innovativeness in everyday work, development of presentation abilities, counteracting the effects of shift work and promotion of pro-health behaviors in the workplace. In 2015, a new development tool in the form of a mentoring program titled Ex-Change was implemented. The tool is based on the concept of peer mentoring and reverse mentoring. The program assumes the preparation of a database of mentors from various disciplines, the development of their abilities to share their knowledge with others, and the use of their potential in the development of other employees. In 2015, PKN ORLEN s employees took part in various trainingdevelopment initiatives, including internal and foreign conferences, specialist training courses, international development programs, M.Sc. courses, postgraduate courses or MBA courses. Employees continued their education in foreign languages, particularly in English, as part of the PKN ORLEN Language Academy and holiday courses. Employees also took part in training courses aiming at guaranteeing them safe-working conditions. Employees developed their skills by participating in training not only traditional, but also using the training available on an e-learning platform. In 2015, PKN ORLEN has trained over 4 thousand employees, most of whom participated in several training. Students and internship programmes PKN ORLEN takes care of the professional development of not only its employees but also young persons, pupils, students, graduates of higher education institutions and secondary schools, giving them the opportunity to obtain first professional experience thanks to participation in traineeship and internship programmes. For years PKN ORLEN organizes internships in the cooperation with schools and universities and by participation in nationwide and international contests. The practical training and internships performed in 2015 was even more focused on substantive aspects of the programme and interns and trainees could actively and substantively participate in tasks and projects performed. In 2015, in total around 100 students took part in internships and traineeships in PKN ORLEN. Apart from internship or traineeship programmes for pupils and students in 2015, there were also other educational and informational activities conducted in the form of meetings, open days, representation of PKN ORLEN on job fairs or seminars. HR Function development The main challenge for HR function is to adjust administrationpayroll solution and IT systems to support business processes in an effective and proper manner. In 2015, the significant activity in this area was a consolidation and restructuring of ORLEN Group companies. The development of Transactional Center (TC) has been continued, which as of the end of 2015, provided services for 30 ORLEN Group companies. Competency Centres and HR Business Partners in PKN ORLEN supported ORLEN Group companies in preparation of new solutions in the area of remuneration and bonus system. In 2015, they were implemented in 8 ORLEN Group companies. Social dialogue and benefits PKN ORLEN cares for social dialogue based on the independence of parties, acting in compliance with law, as well as trust, will to compromise and obeying the adopted rules. The ORLEN Group provides its employees with social support in the form of various benefits and allowances, e.g. granting additional funds for holiday or stay in health resorts, child care, leisure time for children and youths, school sets, financial support for families with lower income, recreation and sport activities, and offering cultural and educational activities, non-reimbursable allowances, funding for rehabilitative tours, returnable housing loans, and purchase of Christmas gifts for the employees kids. MANAGEMENT BOARD REPORT ON THE OPERATIONS FOR THE YEAR
148 Medical care The Company provides a widely understood preventive care, including preventive medical care falling beyond the scope of occupational medicine: consultations with specialist physicians, ambulatory treatment, diagnostic tests, rehabilitation, vaccination, preventive health care programmes offered in cooperation with Centrum Medyczne Medica Sp. z o.o. in Płock and Military Institute of Medicine in Warsaw. In 2015, there were preventive medical examinations in the workplace organized within Prevention for the asking project. Family Friendly Employer Being a company, which implements modern solutions aimed at keeping balance between professional activity and family life, PKN ORLEN realized project Family Friendly Employer offering such solutions as: two additional days for taking care of a child up to 3 years old, an additional hour for breastfeeding a baby, quick access to the pediatrician, complex medical care during the pregnancy, rooms for breastfeeding mothers, gift for employees newborn children, providing people staying on maternity and parental leaves with information on the firm s life. The activities aimed at ensuring the work-life balance are also implemented in the ORLEN Group. In 2015, there was an opening of nursery for the ORLEN Group employees children. Awards and certificates Personnel policy and practices in PKN ORLEN were surveyed by independent organizations. Basic benefits, additional benefits, working conditions, trainings and development, professional career development and the company s organizational culture management were analyzed. The assessments resulted in awarding the following distinctions: Top Employers Poland 2015 certificate PKN ORLEN has been awarded this prestigious certificate awarded by the personnel policy implemented for the fourth time. Employer for Engineer title PKN ORLEN was awarded as one of top three most respected employers in Poland. The title The most desired employer by specialists and managers in the category: Power Industry, Gas, Fuels, Chemistry Remuneration of the Company s bodies Remuneration of management and supervisory bodies Remuneration for Members of the Board is determined by the Supervisory Board taking into account the recommendations of the Nomination and Remuneration Committee. The components of the Management Board Members remuneration system include: - monthly fixed base pay, - annual bonus dependent on the accomplishment level of quantitative and qualitative targets, - severance pay for dismissal from the Management Board Member function, - compensation for non-competition. All remuneration components and additional benefits are regulated by agreement between a Board Member and the Company. TABLE 20. Remuneration paid to the Company s Management Board Members fulfilling their function in 2015 (in PLN thousand). Remuneration of Members of the Company s Management Board, including: ITEM remuneration and other benefits Dariusz Krawiec 1) Sławomir Jędrzejczyk Piotr Chełmiński Krystian Pater Marek Podstawa Wojciech Jasiński 2) bonuses for prior year Dariusz Krawiec Sławomir Jędrzejczyk Piotr Chełmiński Krystian Pater Marek Podstawa Total: ) Remuneration for the fulfilling position of President of the Management Board for the period to 16 December ) Remuneration for the fulfilling position of President of the Management Board for the period from 16 December MANAGEMENT BOARD REPORT ON THE OPERATIONS FOR THE YEAR
149 TABLE 21. Bonuses potentially due to the Company s Management Board Members fulfilling position in a given year to be paid in the next year (in PLN thousand). ITEM Dariusz Krawiec 1) Sławomir Jędrzejczyk Piotr Chełmiński Krystian Pater Marek Podstawa Total: ) bonus potentially due to fulfilling a position till 16 December TABLE 22. Remuneration and other benefits paid and due for former Members of the Company s Management Board (in PLN thousand). ITEM Dariusz Krawiec 1) Marek Serafin 2) Total: ) remuneration from severance pay and compensation for non-competition due to payment in the next year. 2) severance pay and bonus paid for General terms and conditions for granting annual bonuses Members of the Management Board are entitled to annual bonus on the principles established in the Bonus System Regulations of the Management Board, which is part of the contract with the Board Member. The Supervisory Board approves the rules of appointing and assessment of individual bonus tasks for Board Members for the particular year. The level of annual bonus is determined by the performance of individual activities (qualitative and quantitative). Individual bonus tasks are recorded in Goals Charter of Board Member and approved by the Supervisory Board, The assessment of individual bonus tasks implementation (quantitative and qualitative) by the particular Member of Management Board is made yearly by the Supervisory Board on the basis of the President of the Management Board s recommendation, report on the performance of bonus activities by the particular Member of the Management Board, the ORLEN Group s financial statements and other documents, the investigation of which the Supervisory Board deems appropriate. The assessment of the performance of quantitative individual bonus tasks is made by awarding percentage points. The assessment of the performance of qualitative bonus tasks is made by granting a level of achievement according to the principles contained in the Bonus System Regulations of the Management Board. Execution of individual tasks is expressed as the sum of the weighted percentage points granted by the Supervisory Board for each bonus task. The Supervisory Board adopts a resolution to grant or not Board Member of the annual bonus for the financial year, and its amount, by 30 April of the following year. The annual bonus will be paid if the Company s consolidated financial statements for the financial year will be approved by the General Meeting. For 2015 the Supervisory Board set for all Members of Management Board following six quantitative targets: - Reported EBIT of the Concern, - EBITDA LIFO of the Concern (% of plan realization in real macro), - Maintenance CAPEX of the Concern + overhead and personnel costs of the Concern (% of plan realization in real macro), - Development CAPEX of the Concern (% of plan realization in real macro), - Stock exchange rate: TSR of PKN ORLEN relative to the market, - Accident rate: TRR of the Concern, and attributed to them the relevant bonuses thresholds. The Supervisory Board for each of the Members of the Management Board also established qualitative objectives related to their areas of supervised activities. The Supervisory Board added a qualitative goal for all Members of the Management Board related to the level of innovations in the Company. TABLE 23. Remuneration of key executive personnel of the ORLEN Group (PLN thousand). ITEM Remuneration and other benefits of members of key executive personnel: - other key executive personnel of the Company key executive personnel of the subsidiaries of the ORLEN Group Total: MANAGEMENT BOARD REPORT ON THE OPERATIONS FOR THE YEAR
150 Rules for awarding bonuses to the key executive personnel (including members of the Management Board) The regulations applicable to the PKN ORLEN Management Board, directors reporting directly to the Management Board of PKN ORLEN and other key positions have certain common features. The persons subject to the above mentioned systems are remunerated for the accomplishment of individual goals set at the beginning of the bonus period by the Supervisory Board for the Management Board Members and by the Management Boards for the key executive personnel members. Bonuses systems are consistent with the Company s Values, promote the cooperation between individual employees and motivate to achieve the best possible results for the ORLEN Group. The targets set are qualitative as well as quantitative and are settled after the end of the year for which they were set. Moreover, there is a possibility to distinguish employees, who significantly contribute to generated results. Remuneration of the Company s Management and Supervisory Board Members for holding functions in the Management or Supervisory Boards of subsidiaries, companies under joint control or associated companies (PLN thousand) Members of PKN ORLEN Management Board who in 2015 and 2014 were acting as the Management and the Supervisory Boards of the subsidiaries, jointly controlled entities belonging and associate of the ORLEN Group did not receive any remuneration, except for Unipetrol a.s., wherein the payments were transferred to the ORLEN s Foundation Dar Serca. TABLE 24. Remuneration of the Members of the Supervisory Board of PKN ORLEN (PLN thousand). Remuneration of the Company s Supervisory Board members, including: ITEM Angelina Sarota 1) Adam Ambrozik 2) Maciej Bałtowski 2) Cezary Banasiński Grzegorz Borowiec Artur Gabor Radosław Kwaśnicki 2) Cezary Możeński Leszek Pawłowicz Remigiusz Nowakowski 3) 17 - Michał Gołębiowski 4) - 48 Total: ) From 27 June 2013 President of the Supervisory Board. 2) In Supervisory Board from 15 May ) For the period of performing the function from 23 November ) For the period of performing the function to 21 April Non-competition agreements and agreements on termination of contract due to removal from the position held executed with the management personnel In accordance with applicable agreements, members of the Management Board of PKN ORLEN S.A. are required for a period of 6 or 12 months from the date of termination or expiry of the contract, to refrain from competitive activities. During this period, the Board members are entitled to receive compensation in the amount of six or twelve monthly basic salary, paid in equal monthly installments. The Company may dismiss the President, Vice President and Members of the Board of the non-competition clause applicable after the termination or expiration of the contract or reduce the duration of the ban. In the case of an exemption from the prohibition of competition, the Company does not pay compensation. In case of shortening the duration of the noncompliance clause, the payment of the compensation shall be in proportion to the duration of the non-compliance. In addition, the agreements predict for the payment of compensation in case of termination due to dismissal from the position. In this case the salary amounts to six or twelve months of remuneration. The Supervisory Board may authorize the use of these provisions also in case of resignation from the position of Member of the Management Board. Management Board Members from other ORLEN Group companies are required from the date of termination or expiry of the agreement to refrain from competitive activity for a period of six-months. During this period they receive remuneration in the amount of 50% of six-month basic salary, payable in six equal monthly installments. In contrast, the severance allowance of appeal from the position is typically three or six monthly remuneration. MANAGEMENT BOARD REPORT ON THE OPERATIONS FOR THE YEAR
151 2.13. Corporate Social Responsibility Year 2015 brought an essential change in PKN ORLEN s process of social initiatives. In February 2015, the Management Board of the Company adopted a CSR strategy for , which constitutes a practical interpretation of the Values and principles of PKN ORLEN S.A. Listing the goals undertaken by the Concern, the Strategy also specified the approach to various groups of stakeholders. The CSR Strategy assumed that corporate value growth should converge with the interest of the environment and should be based on a sustainable and responsible use of the resources. This means that at the stage of designing the business strategy, the principles of corporate responsibility will be taken into account. Defining measurable CSR goals will allow for analyzing and assessing the effects derived from these measures in the Concern and its environment. The strategy basing on Values and principles is also to motivate employees to seek new ideas and innovative solutions. Supporting business, the strategy is building a sense of coresponsibility for the implementation of CSR in the organization and promotes the idea of responsibility and involvement among the stakeholders. The document indicated three basic fields of action. The first one is Organization, where the goal is to build permanent relations with employees, basing diversity, the sense of safety, development possibilities, and the combination of social and professional roles. Issues of employment policy and human resources programs were further described in point 2.11 of this Report. In turn, in the Direct environment, the priority is to develop social sensitivity and responsibility for business partners and clients by sharing good practices, knowledge and implementing the highest CSR standards. In turn, in terms of Indirect environment, PKN ORLEN embarked on implementing a strategy and promoting the innovative attitude, setting the highest standards in the industry in terms of business ethic and environment protection. Environmental issues have been discussed in detail in point 2.14 of this report. The key elements for the implementation of the Strategy include full implementation of the adopted initiative, education and inspiration of employees to build the sense of responsibility for the effect of activities performed and decisions made on the environment. The CSR strategy is implemented with a pre-assumed plan. 55 CSR projects/measures have been implemented in PKN ORLEN, and 488 in the ORLEN Group. The Management Board of PKN ORLEN and the Supervisory Board CSR Committee periodically review the completion of CSR strategy objectives. The CSR strategy and the projects implemented thereunder are a logical consequence and continuation of social initiatives from previous years. One of the most essential events was the official endorsement of the initiative by the Secretary General of the United Nations, Kofi Annan s Global Compact organization of PKN ORLEN declared the respect for principles of observance of human rights, work standards, protection of natural environment and counteracting corruption. Signing the declaration was a public obligation to respect them and undergo public verification, and the next step in the corporate policy adopted by the Concern. As part of the corporate social responsibility activities are also oriented to the realization of Charity policy of Polski Koncern Naftowy ORLEN S.A., which are the protection of health and life, education and upbringing. PKN ORLEN independently initiates and conducts charitable activities, but also participates in them as a partner. In achieving the objectives, the Foundation ORLEN DAR SERCA plays a key role, which in 2001 was established to implement the social mission of the Founder - PKN ORLEN. Since the beginning of the activity, the Foundation has been providing universal help to foster homes, consistently promoting this form of foster care as the most effective method of providing proper conditions for personal growth to children devoid of their natural families. The Foundation is currently maintaining children in more than 300 foster homes. Furthermore, the foundation has also launched several scholarship programs. Their goal is to support young people in the process of education and to strengthen their motivation. The Corporate Foundation has also taken active part in projects aiming at improving safety and health protection, e.g. the NIE DLA DYMU ( SAY NO TO SMOKE ) campaign. The Foundation has been closely cooperating with PKN ORLEN in its program to support fire brigades. A major part of the Foundation s activity includes projects aimed at the local community. In community initiatives of PKN ORLEN and ORLEN s foundation DAR SERCA also participate PKN ORLEN s clients and the members of the VITAY loyalty program. They have been increasingly interested in devoting their points to charity purposes: foster care support or environmental projects. One of the fixed elements of the system of communication of PKN ORLEN pro-community initiatives is social reporting, which has been changing along with the changes taking place inside the Concern and its environment to meet the expectations of stakeholders. In 2015, PKN ORLEN issued its first Integrated statements. This new formula combines financial reporting with CSR reporting and guidelines of the International Integrated Reporting Council. The formula also considers the directions of new EU legislation in reference to the disclosure of non-financed information and information regarding diversity. The report titled Napędzamy Przyszłość ( Fueling the Future ) presents the relations and mutual dependences between financial and non-financial aspects of PKN ORLEN activity as well as selected ORLEN Group companies. The pillars serving as the basis for integrated reporting value-building, financial strength, people present the processes which take place in the company and the measures focused on building its value in a holistic manner. Non-financial data was presented according to international guidelines of the Global Reporting Initiative (GRI) in version G 4. MANAGEMENT BOARD REPORT ON THE OPERATIONS FOR THE YEAR
152 2.14. Environmental protection Piotr Chełmiński, Member of the Management Board, Business Development/ Power and Heat Generation Officer Both caring for the environment and sustainable development are the significant part of developing competitive advantage by the ORLEN Group. In the past year, the Concern has been continuing environmental activities, which went hand in hand with the strengthening market position and uncompromising approach to matters related to environmental protection. Our ambition is for PKN ORLEN to be a safe workplace, and the goal we target is total elimination of accidents and occupational diseases. Last year, we progressed in integrating companies from the ORLEN Group in terms of work safety. We have been continuing our activities devoted to the optimization of processes for the exchange of information on threats, accidents, inspections, fires and failures. Thanks to the efforts of all employees, in 2015, we managed to achieve a comparable TRR rate to the year before. We introduced the so-called total accident rate, which also includes information on the accident rates among our colleagues, since the safety of contracted employees is as important as the safety of our employees. The main purpose of the environment protection measures taken is to fulfill business strategies, maintaining the highest ecological neutrality possible, and to promote the green image of the ORLEN Group, effectively manage waste and consolidate and reinforce competences in the area of environmental services. The environmental projects carried out in 2015 were primarily related to the adaptation of installations to the new environmental requirements and standards effective as of 1 January These were both administrative activities, such as obtaining indefinite integrated permits for the use of installations, as well as investments related to the construction of pro-environmental installations. The most important environmental investment continued in 2015 in the Production Plant in Płock was the construction of systems for denitrification and dedusting systems for individual and joint Power Plant boiler and flue gas desulphurization installation. Next two K1 and K4 boilers are equipped with systems to reduce emissions of nitrogen oxides and dusts. Currently 6 of 8 boilers are equipped with reducing installations. In 2016 another boiler will be opened after the modernization. In December 2015 was launched flue gas desulphurization, which allowed for reduction of SO2 emissions from Heat and power plant by more than 11% (y/y) in The most important projects carried out in the remaining ORLEN Group companies in 2015 included the replacement of contamination emission measurement analyzers and modernization of sewage installations in the Unipetrol Group, installation of new heaters utilizing secondary heat from hot water in the ORLEN Lietuva HP Plant, modernization of technological tanks and extension of hydro-geological monitoring in IKS SOLINO S.A., as well as liquidation of the Freon system in the Anwil Group was another year of the third trading period of the Community system for greenhouse gas emissions trading. Emission reports for chemical plants in all ORLEN Group companies were verified by an independent auditor. In 2015 free CO2 emission allowances were obtained on the basis of the Article 10a of Directive 2003/87/EC and due to production of electricity on the basis of the Article 10c of this Directive. In 2015, PKN ORLEN signed an updated version of the World Responsible Care Card (RC), which expresses support and confirms the company s commitment in the development of the RC Program in the world. As a leader of the chemical industry, PKN ORLEN has been putting the RC Program to life for more than 18 years. In addition, the Company obtained a prolongation of the RC Management System Framework Certificate, which confirms the conformity of the implemented system with guidelines of the European Chemical Industry Council and principles and criteria approved by the Polish Chemical Industry Chamber Occupational health and safety The main task of the occupational health and safety ( OSH ) in the ORLEN Group is to create proper working conditions and continuous identification and elimination of occupational safety threats. System is implemented in PKN ORLEN and all the ORLEN Group companies In 2015, works were commenced to perfect the existing work safety model in force in the ORLEN Group by implementing the OSH strategy for , which serves as a tool for providing effective management of planned measures in terms of widely understood work safety culture. It is dedicated to all companies of the ORLEN Group and guarantees their development and perfection in two main directions: building the standard of the ORLEN Group and fulfilling the individual needs of particular companies. As a result of implemented measures aiming at the improvement of work safety, in 2015, we achieved an accident rate (Total Recordable Rate TRR) comparable to the year before, that is To permanently increase the effectiveness of measures in the area of safe work, the so-called Total Recordable Rate was implemented in all companies of the ORLEN Group in The new rate contains information on the accident rate both among ORLEN Group employees and among the contracted and outsourced companies. The value of the overall TRR rate in 2015 in the ORLEN Group was 0.86, and the total number of accidents at work for both employees and contractors decreased by 6% (y/y) and equaled 72. To standardize the safety management system in the ORLEN Group, new process safety event rates (T1 PSER, T2 PSER) were introduced in August Reporting with the use of these rates allows for comparing the ORLEN Group to other companies from the group in terms of process safety. Furthermore, a Process Safety Platform was created and contains information on the implementation of new initiatives, the current value of process safety rates and recorded emergency events in the ORLEN Group and in other companies from the chemical industry. The method of rate calculation is presented in "Glossary of selected technical and financial definitions" at the end of the Report. MANAGEMENT BOARD REPORT ON THE OPERATIONS FOR THE YEAR


153 3. FINANCIAL RESULTS Sławomir Jędrzejczyk, Vice President of the Management Board of PKN ORLEN, CFO: Results for 2015 present how effectively we take advantage of favourable macroeconomic conditions in order to strengthen our financial fundamentals. The EBITDA LIFO profit before non-cash effect of impairment allowances of non-current assets reached the record level of PLN 8.7 billion, and was higher by PLN 3.5 billion in comparison to the previous year. Net financial leverage ratio at the end of 2015 was below safe level of 30% established in the ORLEN Group strategy. It enabled the company to carry on the investment program persistently as well as consecutively pay out a dividend to the Shareholders. Simultaneously, we continue integration of the operating segments and perpetually increase effectiveness, what strengthen our market position and flexibility in volatile market environment Macroeconomic situation The ORLEN Group operates within variable macroeconomic environment, which has impact on the level of revenues and generated results. Economic situation, labour market and macroeconomic trends have significant impact on the level of the fuel and petrochemical products consumption and consequently on the volume and sales prices. DIAGRAM 45. GDP in Poland (y/y). Basic indicator reflecting economic situation is GDP index, which is determined by consumption, capital expenditures and export allow to assess at what stage the economy is. Changes of GDP ratio are generally correlated with the unemployment rate. DIAGRAM 46..GDP in the Czech Republic (y/y). DIAGRAM 47..GDP in Lithuania (y/y). DIAGRAM 48. GDP in Germany (y/y). Source: Data for Poland, Germany, the Czech Republic and Lithuania based on EUROSTAT. Data for the Czech Republic for the year 2015 based on the Czech Statistical Office forecasts. Fuel consumption in the ORLEN Group operating markets is an derivative of the individual countries economic situation. The overall condition of the economy, e.g measured with GDP, has an influence on current and future customer behaviours. MANAGEMENT BOARD REPORT ON THE OPERATIONS FOR THE YEAR
, the Lithuanian Statistical Office, the Czech Statistical Office and the German Petroleum Industry Association.")

154 DIAGRAM 49. Consumption of gasoline and diesel oil in countries operated by the ORLEN Group. Source: The estimates prepared on the basis of available data of the Energy Market Agency (Agencja Rynku Energii S.A.), the Lithuanian Statistical Office, the Czech Statistical Office and the German Petroleum Industry Association. Prices of refining and petrochemical products offered by the ORLEN Group are fixed on a basis of quotations on commodity markets that are denominated in foreign currencies. Expenses related to purchase of basic raw materials including crude oil and DIAGRAM 50. USD/PLN average exchange rate. costs of debt service are also denominated in foreign currencies i.e. USD or EUR. As a result, exchange rates of mentioned currencies have an impact on financial results of the ORLEN Group. DIAGRAM 51..EUR/PLN average exchange rate. Source: Based on rates of the National Bank of Poland (NBP) Among the external factors typical for the refining and petrochemical industry, key macroeconomic factors are as follows: crude oil prices, so-called Brent/Ural differential and margins on refining and petrochemical products offered by the ORLEN Group. The basic raw material used in the production by the ORLEN Group is crude oil, which international prices are subject to fluctuations caused by changes in global demand and supply and political factors. As a result of 85% share of the Ural sulphated crude oil in the processing structure of the ORLEN Group, the level of the Brent/Ural differential has an influence on the operating results as well. MANAGEMENT BOARD REPORT ON THE OPERATIONS FOR THE YEAR


155 DIAGRAM 52. Brent oil quotations (USD/bbl). DIAGRAM 53. Brent/Ural differential (USD/bbl). Source: Own calculations based on Platts data. Source: Own calculations based on Platts data. The ORLEN Group operating results are largely dependent on the difference between the market prices of petroleum products a crude oil prices and also other raw materials needed to manufacture the products. The purchase costs of raw materials and the price at which the ORLEN Group may eventually sell refined petroleum products depends on many factors which are beyond its control, including: - changes in the supply / demand for refinery and petrochemical products, - development of the production capacity of the world refining industry, - changes in the operating costs associated with technological processes (energy costs, media, modernizations), - amendments to environmental protection law, and others that might be associated with significant expenses for the ORLEN Group. DIAGRAM 54. Refining margins ( crack ) quotations ( USD/t) and petrochemical margins ( crack ) quotations (EUR/t). Source: Own calculations based on Platts and ICIS data. Quotations of refining products for the purpose of calculate the above crack spreads originate from the Platts information service that publishes data on the basis of daily quotation of products on the London Exchange. Quotations of petrochemical products originate from the ICIS information service that publishes data on the basis of weekly quotations of products on the London Exchange. Integration of the high-class production assets and an extended value chain due to full integration of the refinery, petrochemical and power activities of the ORLEN Group was the basis to determine model downstream margin that reflects typical structure of the basic raw materials and refinery and petrochemical products. Changes at the model downstream margins allow to estimate an impact of macroeconomic factors on operating results of downstream segment. The method of calculation of model downstream, refinery and petrochemical margins is presented in Glossary of selected technical and financial definitions at the end of the foregoing Report MANAGEMENT BOARD REPORT ON THE OPERATIONS FOR THE YEAR
![DIAGRAM 55. Model downstream margin [USD/bbl]. TABLE 25. The product structure of the downstream margin margins (crack) from quotations.](/docs-images/74/70090477/images/156-0.jpg "Product 2015 2014 CHANGE % Refinery products (USD/t) Gasoline 177 167 6% Diesel oil 108 108 0% Heavy fuel oil (142) (225) 37% SN 150 177 161 10% Petrochemical products (EUR/t) Ethylene 602 589 2%")

156 DIAGRAM 55. Model downstream margin [USD/bbl]. TABLE 25. The product structure of the downstream margin margins (crack) from quotations. Product CHANGE % Refinery products (USD/t) Gasoline % Diesel oil % Heavy fuel oil (142) (225) 37% SN % Petrochemical products (EUR/t) Ethylene % Propylene (10%) Benzene (36%) Paraxylene % Sensitivity analysis Estimated impact of the selected macroeconomic factors on the ORLEN Group financial results and the description of applied methodology is presented below. Estimates of change in impact of the model downstream and refining margin is performed assuming full processing capacity of crude oil of the ORLEN Group amounting around 220 million bbl. Estimates of impact of change in the model petrochemical margin are performed assuming the sale of polymers in the ORLEN Group of approximately 480 thousand tonnes per year. Estimates of impact of change in retail margin are performed assuming the sale of fuels in the ORLEN Group of approximately 9.8 billion litres per year. DIAGRAM 56. Sensitivity analysis of the change in the key macroeconomic parameters (USD/EUR/PLN million). The impact of the change in the above mentioned parameters has been estimated with the assumption of the lack of dependence between them and other parameters forming results of the ORLEN Group. The changes of macroeconomic factors may have additional effect on other parameters such as optimization of the structure of products, sales directions or the capacity utilization which can have an additional impact on the presented operating results Financial results Principles of presentation of the consolidated financial statements. The consolidated financial statements have been prepared in accordance with accounting principles contained in the International Financial Reporting Standards (IFRS), comprising International Accounting Standards (IAS) as well as Interpretation of Standing Interpretation Committee (SIC) and the International Financial Reporting Interpretations Committee (IFRIC), which were adopted by the European Union (EU) and were in force as at 31 December The scope of the Management Board Report is in line with the Minister of Finance Regulation of 19 February 2009 on current and periodic information provided by issuers of securities and conditions for recognition as equivalent information required by the law of a non-member state (uniform text in Official Journal of Laws 2014, item 133). The consolidated financial statements have been prepared assuming that the ORLEN Group will continue to operate as a going concern in the foreseeable future. As at the date of approval of the Consolidated Financial Statements, there is no evidence indicating that the ORLEN Group will not be able to continue its operations as a going concern. Duration of the Parent Company and the entities comprising the ORLEN Group is unlimited The consolidated financial statements, have been prepared assuming initially the amendment to IAS1 Presentation of Financial Statements: Disclosure initiative. Main elements of scope and format modification included: materiality issue, aggregation / disaggregation of line items and accounting policy. MANAGEMENT BOARD REPORT ON THE OPERATIONS FOR THE YEAR
157 3.2.2 Consolidated statement of profit or loss and other comprehensive income and operating segments TABLE 26. Consolidated statement of profit or loss and other comprehensive income. ITEM, PLN million change change % =(2-3) 6=(2-3)/3 Sales revenues (18 496) (17.3%) Cost of sales (77 792) ( ) ( ) % Gross profit on sales % Distribution expenses (3 971) (3 920) (3 883) (51) (1.3%) Administrative expenses (1 552) (1 512) (1 451) (40) (2.6%) Other operating income (346) (45.2%) Other operating expenses (1 354) (5 924) (714) % Share in profit from investments accounted for under equity method % Profit / (Loss) from operations under LIFO increased by amortisation and depreciation (EBITDA LIFO) before % impairment allowances 1) Profit / (Loss) from operations increased by amortisation and depreciation (EBITDA) (2 720) Profit/ (Loss) from operations (4 711) Finance income % Finance costs (1 032) (1 889) (610) % Net finance income and costs (642) (1 535) (150) % Profit / (Loss) before tax (6 246) Tax expense (465) 418 (67) (883) - Net profit /(loss) (5 828) ) The impairment of non-current assets recognized in 2015 of PLN (993) million, includes: ORLEN Lietuva of PLN (1) million, the Unipetrol Group of PLN (111) million, the Anwil Group of PLN (7) million, Baltic Power sp. z o.o. of PLN (18) million and the ORLEN Upstream Group of PLN (852) million. The impairment of non-current assets recognized in 2014 of PLN (5 360) million, includes: ORLEN Lietuva of PLN (4 181) million, the Unipetrol Group of PLN (752) million, the Anwil Group (Spolana) of PLN (64) million, the Rafineria Jedlicze Group of PLN (42) million and the ORLEN Upstream Group of PLN (322) million. Sales revenues Sales revenues of the ORLEN Group amounted to PLN million and decreased by PLN (18 496) million (by (-) 17.3%) (y/y), as result of the lower quotations of a crude oil and the ORLEN Group products. Sales volume of the ORLEN Group increase by 8.2% (y/y) and amounted to thousand tonnes. Lower by PLN (13 562) million (by (-) 19.2%) (y/y) sales revenues of downstream segment result mainly from lower crude oil and products quotations and higher by 9.7% (y/y) sales volume. In comparison with prior year the average annual gasoline quotations decreased by (-) 37.4% (y/y), diesel oil by (-) 41.1% (y/y), Jet A-1 fuel by (-) 42.0% (y/y), light heating oil by (-) 41.6% (y/y) and LPG by (-) 45.5% (y/y). Additionally, quotations decreased for products: ethylene by (-) 16.7% (y/y), propylene by (-) 23.5% (y/y), benzene by (-) 36.0% (y/y), toluene by (-) 26.9% (y/y), butadiene by (-) 30.2% (y/y), paraxylene by (-) 18.1% (y/y), xylene by 25.1% (y/y), polypropylene homo by (-) 6.4% (y/y) and polypropylene copo by (-) 6.2% (y/y). Revenues of retail segment decreased by PLN (4 861) million (by (-) 13.5%) (y/y) mainly due to lower products quotations and therefore lower fuels prices on fuel stations accompanied by higher by 2.7% (y/y) sales volume. In 2015 revenues of Upstream segment generated PLN 215 million of revenue compared to PLN 298 million in 2014, accompanied by higher by 52 thousand tonnes (by 20.2%) (y/y). Decrease of sales revenues is related to lower quotations of crude oil on global markets. Detailed information relating to sales volume changes of the particular segments are described in Chapter 2. MANAGEMENT BOARD REPORT ON THE OPERATIONS FOR THE YEAR

 1) In 2015, the ORLEN Group achieved again a record EBITDA LIFO")
![result, before recognition of impairment allowances of non-current assets, of PLN 8 738 million. DIAGRAM 58. EBITDA LIFO before impairment of non-current assets in 2015 [PLN million].](/docs-images/74/70090477/images/158-2.jpg "*) EBITDA LIFO before impairment of non-current assets in the amount of PLN (993) million in 2015 and PLN (5 360) million in 2014.")
158 DIAGRAM 57. Geographical structure of sales revenues in the ORLEN Group. Other countries item contains mainly sales realized to customers from Switzerland, Ukraine, Denmark, Slovakia, Great Britain and Austria. Information relating to the geographic distribution of sales revenues is also presented in point of the Consolidated Financial Statements for Profit from operations increased by depreciation and amortization according to inventory valuation under LIFO method ( EBITDA LIFO ) 1) In 2015, the ORLEN Group achieved again a record EBITDA LIFO result, before recognition of impairment allowances of non-current assets, of PLN million. DIAGRAM 58. EBITDA LIFO before impairment of non-current assets in 2015 [PLN million]. *) EBITDA LIFO before impairment of non-current assets in the amount of PLN (993) million in 2015 and PLN (5 360) million in ) ORLEN Group s inventories are valued in the financial statements in accordance with International Financial Reporting Standards at weighted average cost method or purchase price method. Therefore, an upward trend in crude oil prices has a positive effect and the downtrend has a negative impact on the reported results. Application of the LIFO method of inventory valuation causes that current production costs are measured at cost of purchased crude oil and consequently, the results of operations better represent the actual situation. As a result, the operating results based on LIFO method of inventory valuation were additionally presented in the foregoing report. In accordance with IFRS inventory valuation under LIFO is not acceptable and consequently it is not applied in the accounting principles as well as in the financial statements of the ORLEN Group. MANAGEMENT BOARD REPORT ON THE OPERATIONS FOR THE YEAR
 as well as decrease in average USD/PLN rates amounted to PLN 3 982 million (y/y).")
159 EBITDA LIFO of the ORLEN Group increased by PLN million (y/y). Positive effect of macroeconomic factors related mainly to increase in model downstream margin by 2.4 USD/bbl (y/y) as well as decrease in average USD/PLN rates amounted to PLN million (y/y). The positive impact of higher sales volume in all operating segments amounted to PLN million (y/y). The impact of other factors amounted to PLN (1 780) million (y/y) and related mainly to: - PLN (1 323) million (y/y) the impact of settlement of repurchase of the V and VI tranche of mandatory reserves in 2015 amounting accordingly to PLN (297) and (860) million (y/y) and a lack of positive effects from 2014 including profit totaling PLN (166) million (y/y) on the repurchase of the IV tranche and the sales of the VI tranche of reserves, - PLN (290) million (y/y) a lack of positive effects in 2014 related to the optimization of the level of operating reserves and as an effect of the rotation of crude oil purchased in previous years, - PLN (140) million (y/y) negative impact of change of balance on other operating activity, before impairment allowances of non-current assets, including mainly decrease by PLN (117) million (y/y) of gain on the bargain purchase of Ceska Rafinerska shares by Unipetrol a.s. from ENI in 2015 in comparion to the purchase of shares from Shell in Impairment allowances of non-current assets in 2015 amounted to PLN (993) million and concerned mainly included in the 2nd quarter of 2015 the impairment allowance of exploration assets of ORLEN Upstream Group in Poland of PLN (429) million, included in the 3rd quarter of 2015 the impairment allowance of petrochemical assets of Unipetrol Group related to the accident on installation for ethylene production in August 2015 in the amount of PLN (93) million and impairment allowance of exploration assets in Canada of PLN (423) million from 4th quarter Impairment allowances of the non-current assets in 2014 amounted to PLN (-) million and related mainly to the allowances recognized in ORLEN Lietuva Group of PLN (4 181) million, Unipetrol Group in the amount of PLN (752) million and impairment of the ORLEN Upstream Group assets in Canada of PLN (311) million. Taking into account the above mentioned impairment allowances, EBITDA LIFO of the ORLEN Group for 2015 amounted to PLN million. The negative impact of crude oil prices on inventory valuation amounted to PLN (-) million. As a result EBITDA of the ORLEN Group for the 12 months of 2015 amounted to PLN million. Segments` results of the ORLEN Group DIAGRAM 59..EBITDA LIFO segments results in 2015 [PLN million]. DIAGRAM 60..Change in segments results in 2015 [PLN million]. *) before the impairment allowances of non-current assets. MANAGEMENT BOARD REPORT ON THE OPERATIONS FOR THE YEAR
160 Downstream Segment TABLE 27. Basic financial data of downstream segment. DOWNSTREAM SEGMENT, PLN million change change % =(2-3) 6=(2-3)/3 Segment revenues, including: (16 330) (19.0%) Sales revenues from external customers (13 562) (19.2%) Sales revenues from transactions with other segments (2 768) (18.0%) Segment expenses (64 963) (85 971) (92 710) % Other operating income/expenses, net (40) (4 861) (211) % Share in profit from investments accounted for under equity method % Operating Profit/(Loss) under LIFO increased by depreciation and amortisation (EBITDA LIFO) before % impairment allowances 1) Operating Profit/(Loss) under LIFO increased by depreciation and amortisation (EBITDA LIFO) (852) Profit/(Loss) from operations increased by depreciation and amortisation (EBITDA) (3 425) Operating Profit/(Loss) under LIFO (2 260) Profit/(Loss) from operations (4 833) CAPEX (472) (17.4%) 1) The impairment of non-current assets recognized in 2015 of PLN (136) million mainly in the Unipetrol Group of PLN (111) million, Baltic Power sp. z o.o. of PLN (18) million. The impairment of non-current assets recognized in 2014 of PLN (5 062) million, includes: ORLEN Lietuva of PLN (4 181) million, the Unipetrol Group of PLN (752) million, the Anwil Group (Spolana) of PLN (64) million, the Rafineria Jedlicze Group of PLN (42) million In 2015, EBITDA LIFO of the ORLEN Group in downstream segment, before impairment allowances of non-current assets of PLN (136) million, amounted to PLN million and increased by PLN million (y/y). The growth of model downstream margin reflecting the changes in macroeconomic conditions and the impact of decrease in average USD/PLN rates contributed to the increase of EBITDA LIFO of the segment by PLN million (y/y). The increase on Polish market sales of refinery and petrochemical products as a result of favourable market situation caused by low fuel prices and limitations of maintenance standstills (y/y). The growth of sales in the ORLEN Lietuva Group due to high seaborn sales and higher sales volume in Lithuania, Latvia and Estonia with limited sales in Ukraine. The increase in sales of the refinery products of the Unipetrol Group on the Czech market was possible due to the greater production capacity after purchase of the 32% Ceska Rafinerska shares from ENI and favourable market conditions. The breakdown of ethylene production installation in August 2015 resulted in decrease of petrochemicals volume. Consequently, the growth of sales volume by 9.7% (y/y) on all market in downstream segment caused increase of EBITDA LIFO by PLN mln (y/y). The impact of other factors amounted to PLN (1 743) million (y/y) and related mainly to: - PLN (1 323) million (y/y) the impact of settlement of repurchase of the V and VI tranche of mandatory reserves in 2015 amounting accordingly to PLN (297) and (860) million (y/y) and a lack of positive effects from 2014 including profit totaling PLN (166) million (y/y) on the repurchase of the IV tranche and the sales of the VI tranche of mandatory reserves, - PLN (290) million (y/y) a lack of positive effects in 2014 related to the optimization of the level of operating reserves and as an effect of the rotation of crude oil purchased in previous years, - PLN (105) million (y/y) negative impact of change of balance on other operating activity, before impairment allowances of non-current assets, including mainly decrease by PLN (117) million (y/y) of gain on the bargain purchase of Ceska Rafinerska shares by Unipetrol a.s. from ENI in 2015 in comparion to the purchase of shares from Shell in Impairment allowances of assets in 2015 amounted to PLN (136) million and concerned mainly included in the 3rd quarter of 2015 impairment allowance of petrochemical assets of Unipetrol Group related to the accident on installation for ethylene production in August 2015 in the amount of PLN (93) million. Impairment allowances of assets in 2014 amounted to PLN (5 062) million and related mainly to the allowances recognized in the 2nd quarter of 2014 on the ORLEN Lietuva Group of PLN (4 181) million, the Unipetrol Group of PLN (-) 752 million and petrochemical assets of the ANWIL Group in the amount of PLN (64) million. Taking into account the above mentioned impairment allowances, EBITDA LIFO of the ORLEN Group for 2015 amounted to PLN million. The negative impact of crude oil prices on inventory valuation amounted to PLN (1 510) million and, in result, EBITDA of the ORLEN Group for 2015 amounted to PLN million. In 2015, compared to the previous year, capital expenditures of MANAGEMENT BOARD REPORT ON THE OPERATIONS FOR THE YEAR
161 the segment decreased by PLN (472) million (y/y) to reach the level of PLN million. The most important capital expenditures were described in point 3.4. Retail Segment TABLE 28..Basic financial data for retail segment. RETAIL SEGMENT, PLN million change change % =(2-3) 6=(2-3)/3 Segment revenues, including: (4 982) (13.8%) Sales revenues from external customers (4 861) (13.5%) Sales revenues from transactions with other segments (121) (63.4%) Segment expenses (29 934) (35 015) (35 695) % Other operating income/expenses, net (17) (4) (12) (13) (325.0%) Profit/(Loss) from operations increased by depreciation and amortisation (EBITDA) before impairment allowances 1) % Profit/(Loss) from operations increased by depreciation and amortisation (EBITDA) % Profit/(Loss) from operations % CAPEX % 1) Impairment reversal of the non-current assets recognized in 2014 of PLN 24 million. In 2015, EBITDA of the retail segment of the ORLEN Group achieved record level of PLN million in comparison to PLN million in Increase of fuel margins on Czech Republic market, accompanied by the limitations on other markets and increase of results from sale of non-fuel products and services contributed to the improvement EBITDA segment by PLN 57 million. Increase in retail sales volume (y/y) on Polish and Czech Republic markets with slight decrease on German market increased segment s EBITDA by PLN 81 million (y/y). The negative impact of the other factors amounted to PLN (39) million (y/y) and related mainly to increased costs of operations of fuel stations resulting from the higher by 2.7% (y/y) sales volume and negative impact of balance on other operating activities. In 2015 the segment s capital expenditures increased by PLN 103 million. The most significant capital expenditures in the segment were described in point 3.4. At the end of 2015, the ORLEN Group operated fuel stations, which represent a decrease of (-) 13 (y/y), compared to the previous year. Due to an acquisition project implemented in Germany, the number of stations managed by ORLEN Deutschland GmbH increased by 6 (y/y). The number of stations operating in the Czech Republic and Lithuania has not changed. As a result of completed liquidation process assuming 36 stations shut down at the turn of 2013 and 2014, the number of fuel stations on the Polish market decreased by (-) 19 (y/y). In the end of 2015, the development of non-fuel offer was continued. At the end of 2015, the number of Stop Café and Stop Café Bistro increased by 154 (y/y) and amounted to Thanks to the initiation of development of the Stop Café project in the Benzina chain, the number of stations with their own gastronomy sections (Stop Café or Bistro) increased by 33 (y/y) and amounted to 131. On the Lithuanian market, the number of Stop Café and Stop Café Bistro has not changed (y/y) and amounted to 23. MANAGEMENT BOARD REPORT ON THE OPERATIONS FOR THE YEAR
162 Upstream Segment TABLE 29. Basic financial data for upstream segment. UPSTREAM SEGMENT, PLN million change change % =(2-3) 6=(2-3)/3 Segment revenues, including: (83) (27.9%) Sales revenues from external customers (83) (27.9%) Sales revenues from transactions with other segments Segment expenses (347) (271) (48) (76) (28.0%) Other operating income/expenses, net (849) (319) (7) (530) (166.1%) Profit/(Loss) from operations increased by depreciation and amortisation (EBITDA) before impairment allowances 1) (32) (108) (71.1%) Profit/(Loss) from operations increased by depreciation and amortisation (EBITDA) (808) (170) (32) (638) (375.3%) Profit/(Loss) from operations (981) (292) (38) (689) (236.0%) CAPEX (211) (42.3%) 1) The impairment of non-current assets recognized in 2015 of PLN (852) million and in 2014 of PLN (322) million related mainly to the ORLEN Upstream Group s assets. In 2015, upstream segment s EBITDA, before impairment allowances of non-current assets, amounted to PLN 44 million and decreased by PLN (108) million (y/y), including PLN (62) million (y/y) as a result of macroeconomic factors - a decline in crude oil prices on world markets. The observed decline in crude oil prices on the world markets, had influenced on the Upstream segment. As a result of the tests performed in accordance with IAS 36 Impairment of Assets, in 2015 an impairment allowance of property, plant and equipment amounting to PLN (852) million had been recognized and related mainly to exploration assets of the ORLEN Upstream Group in Poland of PLN (429) million recognized in 2nd quarter of 2015 and exploration assets in Canada of PLN (423) million recognized in 4 th quarter of In 2014 the total value of impairment allowance of non-current assets of upstream segment amounted to PLN (322) million and consisted mainly of impairment allowance of assets related to development and extraction of mineral resources in Canadian TriOil, belonging to the ORLEN Upstream Group. In 2015, the ORLEN Upstream Group signed an agreement to acquire the canadian company Kicking Horse Energy Inc. engaged in the exploration and production of crude oil and gas in Canada. It has also signed an agreement of merger with the American company FX Energy, Inc. leading exploration development and production of crude oil and natural gas primarily in Poland. The situation on the oil and gas market in 2015 contributed to the rationalization of capital expenditures in the upstream segment by PLN (211) million, compared to the previous year, reaching the level of PLN 288 million. The capital expenditures in the segment were described in point 3.4. Corporate functions TABLE 30.. Basic financial data for corporate functions. CORPORATE FUNCTIONS, PLN million change change % =(2-3) 6=(2-3)/3 Segment revenues, including: (23) (7.4%) Sales revenues from external customers % Sales revenues from transactions with other segments (33) (13.8%) Segment expenses (971) (1 007) (1 078) % Other operating income/expenses, net (28) (54) - Share in profit from investments accounted for under equity method 0 (1) (1) 1 - Profit/(Loss) from operations increased by depreciation and amortisation (EBITDA) before impairment allowances 1) (621) (565) (557) (56) (9.9%) Profit/(Loss) from operations increased by depreciation and amortisation (EBITDA) (626) (565) (557) (61) (10.8%) Profit/(Loss) from operations (711) (671) (678) (40) (6%) CAPEX (25) (10.9%) 1) The impairment of non-current assets recognized in 2015 of PLN (5) million related mainly to PKN ORLEN s assets. MANAGEMENT BOARD REPORT ON THE OPERATIONS FOR THE YEAR
163 In 2015, EBITDA of corporate functions decrease by PLN (61) million (y/y) mainly as a result of negative impact of other operating activities in the amount of PLN (54) million (y/y), which includes primarily the effects of the reversal of actuarial provisions in 2014 and recognition of provision for possible negative results of litigation in The capital expenditures of corporate functions in 2015 were described in point 3.4. Financial expenses and net result In 2015, the net financial expenses amounted to PLN (642) million and included mainly the net negative exchange differences of PLN (317) million, settlement and valuation of the financial instruments in the net amount of PLN (177) million net and interests of PLN (123) million. Taking into account tax charges of PLN (465) million, net profit generated by the ORLEN Group for 2015 amounted to PLN million Statement of financial position TABLE 31..Consolidated statement of financial position assets. ASSETS, PLN million change change% =(2-3) 6=(2-3)/3 ASSETS Property, plant and equipment % Intangible assets % Investments accounted for under equity method % Deferred tax assets (20) (5.2%) Other financial assets (180) (55.0%) Other assets % Non-current assets % Inventories % Trade and other receivables (451) (6.4%) Other financial assets % Cash and cash equivalents (1 589) (40.4%) Non-current assets classified as held for sale % Current assets (979) (4.5%) Total assets % As at 31 December 2015 the ORLEN Group total assets amounted to PLN million and increased by PLN million in comparison to the 31 December Current assets decreased by PLN (979) million to the level of PLN million, mainly as an effect of decrease by PLN (1 589) million of cash and cash equivalents and an increase by PLN 886 million of inventories value. The change of inventories included mainly the effect of repurchase of two tranches of mandatory reserves as well as declining quotation of crude oil and thus prices of the ORLEN Group products. Total value of non-current assets as at 31 December 2015 amounted to PLN million and was higher by PLN million compared to the end of the previous year, mainly due to capital expenditure on property, plant and equipment, intangible assets in the amount of PLN million, the acquisition of exploration assets in Canada and Poland as part of the purchase of shares of Kicking Horse Energy and FX Energy in the amount of PLN million, depreciation and amortization in the amount of PLN (1 895) million and impairment allowances in the total amount of PLN (993) million. MANAGEMENT BOARD REPORT ON THE OPERATIONS FOR THE YEAR
164 TABLE 32..Consolidated statement of financial position equity and liabilities. EQUITY AND LIABILITIES, PLN million change change % =(2-3) 6=(2-3)/3 EQUITY Share capital % Share premium % Hedging reserve (80) (1 319) % Foreign exchange differences on subsidaries from consolidation (201) % Retained earnings % Equity attributable to equity owners of the parent % Non-controling interest % Total equity % Loans, borrowings and bonds (1 539) (15.9%) Provisions % Deferred tax liabilities % Deferred income % Other non-current liabilities (1 139) (61.8%) Non-current liabilities (2 078) (16.9%) Trade and other liabilities (437) (3.9%) Loans, borrowings and bonds % Provisions % Other financial liabilities (150) (14.7%) Other liabilities % Current liabilities (368) (2.6%) Total liabilities (2 446) (9.3%) Total shareholders equity and liabilities % Total equity as at 31 December 2015 amounted to PLN million and was higher by PLN million in comparison to the balance at the end of the prior year, mainly as a result of: - net profit attributable to equity owners of the Parent Company for 2015 in the amount of PLN million and an increase of PLN 456 million of equity attributable to noncontrolling interest, - dividend payment in the amount of PLN (706) under the decision of the Ordinary General Shareholders Meeting of PKN ORLEN S.A. on 28 April 2015, - Positive impact of change of balance of hedging reserve by PLN million. As at December 2015, net indebtedness of the ORLEN Group amounted to PLN million and was higher by PLN 90 million in comparison to the end of The increase is a resultof accommodation of net indebtedness of purchased companies in the upstream segment in total amount of PLN 374 million and repayment of loans and borrowings, decrease of cash and cash equivalents balances and the net impact of negative exchange differences from revaluation, indebtedness valuation as well as recalculation of balances of foreign entities in the total amount of PLN (284) million. MANAGEMENT BOARD REPORT ON THE OPERATIONS FOR THE YEAR
 1) The methodology of calculating ratios is presented in Glossary of selected financial term at the end of the foregoing")
165 DIAGRAM 61. Financial ratios 1) 1) The methodology of calculating ratios is presented in Glossary of selected financial term at the end of the foregoing Report. 2) Before the impairment allowances of non-current assets. MANAGEMENT BOARD REPORT ON THE OPERATIONS FOR THE YEAR
166 3.2.4 Statement of cash flows TABLE 33. Consolidated statement of cash flows. ITEM, PLN million change change % =(2-3) 6=(2-3)/3 Cash flows operating activities Net profit/(loss) (5 828) Adjustments for: Share in profit from investments accounted for under equity method (253) (57) (40) (196) (343.9%) Depreciation and amortisation (96) (4.8%) Foreign exchange loss (856) (97.3%) Interest, net (42) (17.4%) Dividends (2) (2) (2) 0 0.0% Loss on investing activities (3 909) (77.9%) Tax expense 465 (418) Change in provisions % Change in working capital (1 320) (3 072) - inventories (655) (4 761) - receivables % liabilities (1 923) (3 278) % Other adjustments (252) (360) (215) % Income tax (paid) (204) (168) (107) (36) (21.4%) Net cash provided by operating activities % Cash flows investing activities Acquisition of property, plant and equipment, intangible assets and perpetual usufruct of land (3 079) (3 700) (2 382) % Acquisition of shares adjusted by cash taken over (1 195) (792) (536) (403) (50.9%) Disposal of property, plant and equipment, intangible assets and perpetual usufruct of land (269) (67.3%) Dividends received % Other (145) (215) - Net cash (used) in investing activities (4 096) (4 020) (2 441) (76) (1.9%) Cash flows financing activities Proceeds from loans and borrowings received (7 743) (80.3%) Bonds issued (2 350) - Repayments of loans and borrowings (3 771) (9 023) (5 433) % Interest paid (258) (245) (310) (13) (5.3%) Dividends paid (706) (617) (642) (89) (14.4%) Other (27) (21) (342) (6) (28.6%) Net cash provided by/(used in) financing activities (2 866) (2 438) (4 949) - Net increase/(decrease) in cash and cash equivalents (1 608) (2 858) - Effect of exchange rate changes on cash and cash equivalents 19 (2) (1) 21 - Cash and cash equivalents, beginning of the period % Cash and cash equivalents, end of the period (1 589) (40.4%) Restricted cash (15) (40.5%) Net cash flows from operating activities in 2015 amounted to PLN million and comprised mainly EBITDA result before impairment allowances of property, plant and equipment of PLN million and negative impact of net working capital increase of PLN (1 320) million, negative operating net foreign exchange differences of PLN (293) million and paid income taxes in the amount of PLN (204) million. The increase of net working capital in 2015 is mainly a result of an increase of value of inventory, including the repurchase of 2 tranches of mandatory reserves and reduction of their value due to lower crude oil prices and also prices of petroleum products accompanied by decrease of mutually compensating receivables and liabilities. Net cash used in investing activities in 2015 amounted to PLN (4 096) million and included mainly net expenses for the acquisition of property, plant and equipment, intangible assets and perpetual usufruct of land of PLN (2 948) million, shares acquisition of Ceska Rafinerska a.s from ENI adjusted by acquired cash and cash equivalents of PLN (35) million and shares acquisition of upstream companies Kicking Horse Energy Inc. and FX Energy Inc. in the amount of PLN (1 161) million. MANAGEMENT BOARD REPORT ON THE OPERATIONS FOR THE YEAR
167 The cash used in financing activities in 2015 amounted to PLN (2 866) million and comprised mainly net repayment of the loans and borrowings of PLN (1 875) million, the dividend payment of PLN (706) million and interest payments of PLN (258) million. Taking into account the revaluation of cash due to exchange differences, the cash balance in 2015 decreased by PLN (1 589) million and as at 31 December 2015 amounted to PLN million. DIAGRAM 62. Free cash flow [PLN million]. *) EBITDA LIFO 2015 before impairment allowances of value of assets of PLN (993) million. **) Including PLN (374) million net indebtedness of upstream companies taken over in Q ***) Total repurchase amounted to PLN (3 644) million, of which PLN (1 157) million impact was recognized in EBITDA LIFO. ****) Including PLN million changes in working capital adjusted by LIFO effect of PLN (1 510) million. Differences between financial results disclosed in annual report and previously published forecasts of financial results for the year The ORLEN Group did not publish forecasts of financial results for The ORLEN Group operating results for 2015 did not change in comparison to the results published on 28 January 2015 in consolidated quarterly report for the IV quarter of MANAGEMENT BOARD REPORT ON THE OPERATIONS FOR THE YEAR

168 3.3. Financial resources management General management rules Liquidity management The ORLEN Group takes advantage of a cash-pooling system to optimize finance costs and effectively manage the current financial liquidity within the ORLEN Group. In 2015 the following cash polling systems were in operation: PLN cash-pooling system which as at 31 December 2015 included 27 members of the ORLEN Group, international cash-pooling system for EUR, USD, CZK and PLN held for foreign companies of the ORLEN Group (ORLEN Finance, ORLEN Lietuva Group, ORLEN Deutschland, Unipetrol Group, Ventus Nafta). As a part of liquidity management, the Parent Company may issue bonds up to the agreed limits and to acquire bonds issued by the ORLEN Group companies. In 2015 the ORLEN Group invested funds in bank deposits. Decisions concerning bank deposits are founded on the maximum return on investment and current assessment of the financial standing of the banks based on the short-term rating assessment for deposits on the investment level. Working capital management The ORLEN Group manages the working capital in a flexible way in the unstable market conditions with a range of tools used to its level optimization. One of those tools were sale transactions of part of mandatory crude oil reserves connected with concluding the agreement to maintain those mandatory reserves for PKN ORLEN. On 29 January 2015 the agreement for gathering and keeping of crude oil mandatory reserves, which PKN ORLEN SA concluded on the 27 June 2013 between PKN ORLEN and Neon Poland Sp.z o.o has expired. In addition, on the 12 August 2015 there was an early repurchase of mandatory reserves, which were sold to the Cranbell Sp. z. o.o. on the 26 June The ORLEN Group uses also factoring agreements. PKN ORLEN uses factoring services without recourse that rely on discount sale of short-term trade receivables due to the Company prior to their maturity and taking over its insolvency risk by the bank. The level of net working capital at the end of 2015 amounted to PLN million and was higher by PLN million compared to the level at the end of 2014 as a result of buy back two tranches of mandatory reserves Loans, borrowings, and debt securities As part of optimizing financing sources PKN ORLEN uses services of banks proving high reliability as well as remarkable market position. Such approach allows to limit banking costs with providing concurrent guarantee of high standard of services provided and security deposits. TABLE 34. Sources of financing. ITEM, PLN million change change % =(2-3) 6=(2-3)/3 Bank loans (1 491) (23.0%) Borrowings (2) (40.0%) Debt securities (6) (0.1%) Financial indebtedness (1 499) (14.1%) By maturity: Non-current (1 539) (15.9%) Current % DIAGRAM 63. The debt structure [%]. The most significant loans in 2015 in the ORLEN Group are the following (in excess of PLN 100 million): long-term syndicate loan for the amount of EUR million MANAGEMENT BOARD REPORT ON THE OPERATIONS FOR THE YEAR
169 (approximately PLN million at the average National Bank of Poland exchange rate for EUR/PLN as at 31 December 2015), signed by PKN ORLEN in April This loan has replaced the funding of EUR million. Currently balance of the loan is EUR million (PLN million at the average National Bank of Poland exchange rate for EUR/PLN as at 31 December 2015). The loan is in the form of a multicurrency revolving credit line extended by the syndicate of 17 banks. The loan term is 5 years (i.e. until 2019) with two extension options, each by 1 year. In August 2015, PKN ORLEN used the first prolongation option, due to which the crediting period was extended until April PKN ORLEN may allocate the funds obtained for general corporate and financial purposes of the ORLEN Group companies. The loan may be used in EUR, USD, CZK, CAD and PLN; 2 bilateral loan agreements allocated to fund the investments signed by PKN ORLEN with the European Investment Bank (EIB) in 2007 and the European Bank for Reconstruction and Development (EBRD) in The amount of EUR 210 million (approximately PLN 895 million at the average National Bank of Poland exchange rate for EUR/PLN as at 31 December 2015) was granted by EIB for investments in the development of fuel stations network and environmental protection. The agreement is being repaid. The amount of EUR 250 million (PLN million at the average National Bank of Poland exchange rate for EUR/PLN as at 31 December 2015) was granted by EBRD for investments in the development and modernization of the Power and Heat Plant in Płock and for general corporate purposes. The loan maturity is 7 years (until 2018). According to the agreement, the loan amount will be reduced down to EUR 167 million and down to EUR 83 million respectively in June 2016 and in June Available currencies of the loan are: EUR, USD and PLN; long-term loan as a part of the Polish Investments program of Bank Gospodarstwa Krajowego of PLN million. The funds will be used by the Company to support an implementation of the energy strategy. The final maturity date is on December 2025; 5 bilateral agreements of short-term overdraft in PKN ORLEN s current account in the total amount of PLN million for financing current activities; 9 overdraft agreements in the Unipetrol Group s current account in the total amount of PLN million for financing current activities, base currency for most of loans is CZK; Loans incure by the ORLEN Upstream Group: 3 loan agreements in amout of CAD 290 million (PLN 815 million at the average National Bank of Poland exchange rate for CAD/PLN as at 31 December 2015) and syndicated loan agreement in amount of EUR 90 million (PLN 384 million at the average National Bank of Poland exchange rate for EUR/PLN as at 31 December 2015); loan to ORLEN Finance AB for EUR 200 million (approximately PLN 852 million at the average National Bank of Poland exchange rate for EUR/PLN as at 31 December 2015) as part of international cash pool system, taken in Nordea Bank Finland, the agreement will remain in force until June 2016; investment loan to IKS Solino of PLN 176 million extended by the consortium of 2 banks in August 2004 for the construction of underground warehouse of crude oil and fuels, the agreement will remain in force until As at 31 December 2015, the loan balance amounted to PLN 6 million. After taking into account cash and cash equivalents net financial indebtedness at the end of 2015 amounted to PLN million. As regards the loan agreements in force, the ORLEN Group subsidiaries are obliged to maintain selected financial indicators within brackets agreed in the loan agreements. In 2015 the financial ratios assessed by the lending banks remained at the safe level. The covenant level included in loan agreements (net debt/ebitda before impairment allowances of non-current assets) was 0.88 The financial indicators attained in 2015, presented in point confirm the full ability to perform payment obligations resulting from the loan agreements and other agreements with banks and financial institutions. Additional information on the debt structure of the ORLEN Group was presented in point to the Consolidated Financial Statements for Issue of securities and usage of the proceeds from the issue PKN ORLEN S.A. continues to use the non-public bond issue programme, which is in operation in accordance with agreement Bond Issue Programme ( Programme Agreement ), executed with a consortium of Polish banks in November 2006 with a debt limit up to PLN million. Funds obtained from the issue are allocated to financing ongoing operations. In 2012, within the Programme Agreement PKN ORLEN issued 7-year corporate bonds with variable interest rate, the nominal value of PLN million and a maturity date on 27 February In 2015 as part of the Programme Agreement, PKN ORLEN issued short-term bonds in PLN for ANWIL, ORLEN Asfalt, ORLEN Centrum Usług Korporacyjnych, ORLEN KolTrans, ORLEN Oil, ORLEN Południe, ORLEN Transport, ORLEN Upstream and Ship-Service. Each time bonds profitability is determined on arm s length conditions. In 2015 PKN ORLEN S.A. used the funds raised in from the implementation of a public bond issue programme ("Programme") to finance the current operations. Acting on a basis of the agreement with UniCredit CAIB Poland S.A., Powszechna Kasa Oszczędności Bank Polski S.A. and Bank Pekao S.A., in 2013 PKN ORLEN directed 4 series of medium-term bonds (4- year) with a total nominal value of PLN 700 million to retail investors, and then, continuing the Programme in 2014, the Company issued two consecutive series of 4-year bonds with a nominal value of PLN 200 million and 6-year bonds with a nominal value of PLN 100 million and interest at a fixed interest rate. Emissions conducted in 2014 allowed the Company to realize the Programme for the full amount. Rating of bonds issued under the Programme has not changed and at the end of 2015 was still on MANAGEMENT BOARD REPORT ON THE OPERATIONS FOR THE YEAR
170 'A- (pol)' level. In 2015, the ORLEN Group used the funds raised by ORLEN Capital AB through the issue of eurobonds, held in June 2014, in which the PKN ORLEN was a guarantor. The value of the issue amounted to EUR 500 million, and the maturity dated on 30 June Eurobonds have the ratings awarded by Fitch Ratings Ltd. at BBB- and the agency Moody's Investors Service at Baa3 level. The funds raised by the ORLEN Capital AB from Eurobonds issue were loaned to PKN ORLEN S.A. The nominal value of eurobonds at the end of 2015 did not change compared to the end of 2014 and amounted to EUR 500 million (PLN million at the average National Bank of Poland exchange rate for EUR/PLN as at 31 December 2015). At the end of 2015 the total amount of securities issued within the ORLEN Group amounted to PLN million in comparison to PLN million at the end of Additional information on the issue of debt securities was presented in point to the Consolidated Financial Statements for Borrowings granted and received At the end of 2015 the following agreements of borrowings granted by the Parent Company to entities within the ORLEN Group were in force: borrowings granted to ORLEN Finance AB in relation to international cash-pool system in total amount of PLN 13 million, long-term investment borrowing granted on 2 June 2014 to IKS Solino S.A. of PLN 50 million. The borrowing will be repaid in installments, with the final maturity dated on 31 December As at 31 December 2015, the borrowing balance amounts to PLN 50 million. At the end of 2015 in the ORLEN Group the following agreements of borrowings received by the Parent Company from entities within the ORLEN Group were in force: short-term borrowing agreement concluded on 22 November 2013 with ORLEN Insurance of USD 15 million with final maturity date on 21 November 2016 with extension possibility for the following year. As at 31 December 2015 the borrowing balance amounts to USD 10 million plus accrued interest, borrowings received from ORLEN Finance AB in relation to international cash-pool system in total amount of PLN 554 million, long-term borrowing agreement concluded on 30 June 2014 with ORLEN Capital AB of EUR 496 million with the final maturity date on the 30 June As at 31 December 2015 the borrowing balance amounts to EUR 496 million plus accrued interest. Borrowings granted to and received from the ORLEN Group are eliminated during standard consolidation procedures Sureties, guarantees and other contingent liabilities As at 31 December 2015 the ORLEN Group possessed off balance liabilities arising out of the issued guarantees and sureties for the overall of PLN million, in comparison with PLN million at the end of In 2015 the amount includes: sureties and guarantees issued to subsidiaries to the benefit of third parties of PLN million, which related mainly to hedge of ORLEN Capital future liabilities resulting from issue of Eurobonds and timely payment of liabilities by the subsidiaries, securities for excise and excise duty on products and goods undergoing the procedure of suspended excise collection in the amount of PLN million, guarantees concerning liabilities towards third parties issued in the course of normal business operations mainly relate to: guarantees and performance warranties, guarantee submitted as a security deposit for the purposes of the Article 105b of the The Goods and Services Tax Act, guarantees providing security on property referred to the Article 38a of the Energy Law, customs guarantees, tender guarantees, payment guarantees of PLN 458 million. Additional information on sureties and guarantees was presented in point and point of the Consolidated Financial Statements for Contingent liabilities were described in point of the Consolidated Financial Statements for Financial instruments The ORLEN Group using financial instruments hedges its cash flows: from inflows from operating activities performing forward sales and purchases of currency in the formula without settlement (so called non-deliverable forwards), from sales of the ORLEN Group products and purchase of crude oil using commodity swaps, from periodic increase of operational inventory using commodity swaps, from interest payments concerning external financing using interest rate swaps (IRS), from investment projects using foreign exchange forwards. Financial instruments were presented in point of the Consolidated Financial Statements for MANAGEMENT BOARD REPORT ON THE OPERATIONS FOR THE YEAR
171 3.3.7 Ratings In 2015, PKN ORLEN ratings at the investment level in two leading rating agencies: Fitch and Moody`s remained unchanged, BBB- and Baa3 respectively (positive outlook). The above ratings reflects a consistent process of debt removal, of the ORLEN Group financing diversification and maintaining of the financial results at the safe level. The Group s reliability was maintained also due to updating of the ORLEN Group s strategy for the years The announced strategy is advantageous for the Company s credit profile by keeping credit ratios at a safe level. The agencies positively assessed greater financial flexibility of the ORLEN Group. Firstly, the sustainable investment policy was noticed, particularly an additional capex, which can be deferred depending on the financial situation of the ORLEN Group. The agency positively views PKN ORLEN s ability to manage its working capital in response to changes in financial situation. The strategy of the ORLEN Group was assessed by the rating agencies as an ambitious plan for improvement of core activity with development of new operating segments, showing extensive flexibility of actions planned Dividend policy Improved financial situation of the ORLEN Group achieved in the recent years enabled to implement, within the ORLEN Group s strategy for years , the dividend policy which assumes a gradual increase in the level of dividend per share by taking into account the implementation of strategic financial indicators and forecasts of the macroeconomic situation. This method does not relate the dividend to net profit, which in the ORLEN Group s area of operations is the subject to high fluctuations and can include non-cash items, such as the revaluation of assets, inventories or loans and as a result does not fully reflect the Group s current financial situation. Taking into account the liquidity situation and realization of strategic financial objectives, The Management Board of PKN ORLEN recommends to distribute the net profit of PKN ORLEN for the 2015 in the amount of PLN as follows: to allocate the amount of PLN to dividend payment (PLN 2 for 1 share) and to allocate the remaining amount of PLN to the Company s reserve capital. The Management Board of PKN ORLEN recommend the 15 July 2015 as the dividend date and the 5 August 2015 as the payment date. This recommendation will be presented to the General Shareholders` Meeting of PKN ORLEN, which will make a conclusive decision in this matter. MANAGEMENT BOARD REPORT ON THE OPERATIONS FOR THE YEAR
![3.4. Realization of investment and capital plans DIAGRAM 64. Level of capital expenditures by segments [PLN million].](/docs-images/74/70090477/images/172-0.jpg "*) Power industry; mainly CCGT Włocławek (industrial cogeneration) and IOS, SCR (manufacturing energy). **) Excludes expenditures in the amount of PLN 1 632 million, incl.")
, - modernization of 65 fuel stations (incl.")
172 3.4. Realization of investment and capital plans DIAGRAM 64. Level of capital expenditures by segments [PLN million]. *) Power industry; mainly CCGT Włocławek (industrial cogeneration) and IOS, SCR (manufacturing energy). **) Excludes expenditures in the amount of PLN million, incl. PLN million on acquisition of extraction assets of Kicking Horse Energy, FX Energy and acquisition on shares of Ceska Rafinerska in the amount of PLN 97 million. Retail - opening of 56 fuel stations (incl. own stations: 22 in Poland, 11 in Germany and 1 in the Czech Republic), - modernization of 65 fuel stations (incl. own stations: 40 in Poland, 3 in the Czech Republic and 2 in Germany), - opening of 154 Stop Cafe and Stop Cafe Bistro locations in Poland. Upstream - preparation of new drillings for manufacturing in Canada, - extraction, exploration and development works on possessed concessions in Poland. Corporate functions - IT projects, - administration projects in utilized properties. SCHEME 11. Capital expenditures by operating markets [%]. The most significant investments realised in 2015 comprised of: Downstream: - PKN ORLEN: construction of a the power plant in Włocławek and Płock (CCGT), Installation of Catalytic Denitrification and Dedusting and the installation of Flue Gas Desulfurization, construction of a Metathesis installation, modernization of the DRW IV installation increased the yields of white products, upgrading of automatic terminals, exchange of convection furnace sections in the Olefin II Production Plant, modernization of the fuel system of the CHP Complex, projects related to the improvement of effectiveness of the PTA installation and increase of possibility of railway carriage in the Fuel Terminal in Ostrów Wielkopolski. - ORLEN Lietuva Group: exchange of coil pipes in the Visbreaking installation. - Unipetrol Group: reconstruction of ethylene installation, construction of a Polyethylene 3 installation, modernization of the T700 CHP Plant reconstruction and modification of boilers for the purposes of new nitrogen oxide emission reduction technology, modernization of the Hydrocracking Installation, reconstruction of a pirolytic furnace, - ANWIL Group: projects related to the construction of infrastructure for CCGT in Włocławek, modernization of reforming furnace and synthesis gas compressor. The ORLEN Group manages the capital expenditures structure depending on market situation and focuses on the most effective investment projects. The most relevant investment projects planned for completion in the following years are described in point 3.5 of the foregoing Report. Potential activities related to acquisitions on Polish or other markets will be based on current market and financial condition as well as attractiveness level of potential assets. The ORLEN Group maintains stable financial position. Generated cash flows and available funding sources will enable implementation of the planned investment projects. The level of selected financial ratios confirming feasibility of completing investment plans is presented in point MANAGEMENT BOARD REPORT ON THE OPERATIONS FOR THE YEAR


173 GRUPA ORLEN 3.5. Outlook - prospects for the development of the operations Expected macroeconomic environment: GDP forecast - Poland 3.3% in 2016, the Czech Republic 2.8% in 2016, Germany 1.7% in 2016, Lithuania 3.2% in 2016, Brent oil price predicted oil price in baseline scenario at a comparable level with the average price in Key factors leading to price increase are: demand growth, reduced volume of oil extraction and rise of geopolitical risks, Model downstream margin - expected decrease of average margin level (y/y) mainly due to lower margins on diesel and petrochemical products. Despite the fall, high level of margin is expected due to favourable macroeconomic environment i.e. low oil prices and increase of fuel and petrochemical products consumption. The projected market trends: - The expected growth in fuels demand, both petrol and diesel oil, in Poland and Baltic countries, stabilization of demand in the Czech Republic and decline of demand in Germany. Legislative changes: Shadow economy in the fuel markets existing shadow economy maintained on the Polish fuel market. Further regulatory actions focused on its reduction may lead to change in fuel consumption. Mandatory reserves gradual reserves reduction during 2016 from 68 to 60 days (approx. 0.3 million tonnes) and as a consequence decrease of net working capital, NIT the level in 2016 for Poland will remain unchanged and will amount to 7.1%. NIT for PKN ORLEN will be reduced to 6.035%. Sales tax legislative works are being to introduce retail turnover tax, including fuel stations. Investment activities of the ORLEN Group: downstream: construction of CCGT in Płock and PE3 installation in Unipetrol, retail: introducing 35 new fuel stations and rebranding of approx. 50 Bliska fuel stations in Poland; opening of 7 locations and rebranding of 13 purchased stations in 2015 by ORLEN Deutschland GmbH in Germany; rebranding and introducing to Benzina chain a part of 68 fuel stations in the Czech Republic acquired from Austrian OMV company, upstream: optimization of extraction operations in Canada (60% of expected expenditures) and in Poland (40% of expected expenditures) taking into account current crude oil and gas quotations. DIAGRAM 65. CAPEX Plan in 2016 [PLN bn]. SCHEME 12. CAPEX Plan in 2016 by countries [PLN bn]. Canada 0.5 Germany 0.1 Lithuania 0.1 Czech Republic * 1.9 Poland 2.8 *) The amount of PLN 1.9 bn in the Czech Republic includes expenditures on Steam Cracker in Unipetrol of PLN 0.6 bn. Maintenance standstills in the ORLEN Group in 2016: PKN ORLEN: DRW, HOG, HON, Olefins Plant. ORLEN Lietuva Group: Reforming, HON; Visbreaking. Unipetrol Group: Steam Cracker (Litvinov), Polypropylene (Litvinov), Visbreaking (Litvinov), Hydrocracking (Litvinov), HON (Kralupy). ANWIL Group: PVC. BOP: Polyethylene/Polypropylene. MANAGEMENT BOARD REPORT ON THE OPERATIONS FOR THE YEAR
SEPARATE ANNUAL REPORT OF PKN ORLEN S.A. FOR THE YEAR 2015
 SEPARATE ANNUAL REPORT OF PKN ORLEN S.A. FOR THE YEAR 2015 1. LETTER OF THE PRESIDENT OF THE BOARD 2. OPINION AND REPORT OF THE INDEPENDENT AUDITOR 3. SELECTED FINANCIAL DATA 4. SEPARATE FINANCIAL STATEMENT
ORLEN GROUP CONSOLIDATED QUARTERLY REPORT
 CONSOLIDATED QUARTERLY REPORT FOR THE 1 st QUARTER 2018 4 ORLEN GROUP - SELECTED DATA PLN million EUR million Sales revenues 23 241 22 875 5 562 5 333 Profit from operations increased by depreciation and
ORLEN GROUP CONSOLIDATED QUARTERLY REPORT
 CONSOLIDATED QUARTERLY REPORT FOR THE 4 th QUARTER 2016 4 ORLEN GROUP - SELECTED DATA PLN million EUR million Sales revenues 79 553 88 336 18 181 20 188 Profit from operations increased by depreciation
ORLEN GROUP CONSOLIDATED HALF-YEAR REPORT
 CONSOLIDATED HALF-YEAR REPORT FOR THE 1ˢ HALF 2018 4 ORLEN GROUP - SELECTED DATA PLN million EUR million Sales revenues 49 942 45 900 11 780 10 807 Profit from operations increased by depreciation and
ORLEN GROUP CONSOLIDATED QUARTERLY REPORT
 CONSOLIDATED QUARTERLY REPORT FOR THE 3 rd QUARTER 2017 4 ORLEN GROUP - SELECTED DATA PLN million EUR million Sales revenues 70 630 56 651 16 593 12 967 Profit from operations increased by depreciation
UNIPETROL, a.s. CONSOLIDATED QUARTERLY REPORT
 CONSOLIDATED QUARTERLY REPORT FOR THE 1 ST QUARTER 2017 PREPARED IN ACCORDANCE WITH INTERNATIONAL FINANCIAL REPORTING STANDARDS AS ADOPTED BY THE EUROPEAN UNION CONSOLIDATED QUARTERLY REPORT FOR THE 1
GRUPA LOTOS S.A. FINANCIAL HIGHLIGHTS
 FINANCIAL HIGHLIGHTS PLN 000 EUR 000 Dec 31 2015 Dec 31 2014 Dec 31 2015 Dec 31 2014 Revenue 20,482,298 26,243,106 4,894,451 6,264,318 Operating profit/(loss) 183,757 (1,294,183) 43,911 (308,926) Pre-tax
ORLEN GROUP RESULTS OF THE ORLEN GROUP FOR THE I QUARTER OF 2013 (Translation of a document originally issued in Polish)
") Summary of the results ORLEN GROUP RESULTS OF THE ORLEN GROUP FOR THE I QUARTER OF Table 1 Q4 Key financial data, PLNm 1 2 4=(2-)/ 5 6 7 8=(6-7)/7 1 245 27 472 29 248-6.1 Total sales revenue 27 472 29
Summary of the results ORLEN GROUP RESULTS OF THE ORLEN GROUP FOR THE I QUARTER OF Table 1 Q4 Key financial data, PLNm 1 2 4=(2-)/ 5 6 7 8=(6-7)/7 1 245 27 472 29 248-6.1 Total sales revenue 27 472 29
Public Company ORLEN Lietuva
 2 0 CONSOLIDATED FINANCIAL STATEMENTS FOR THE YEAR ENDED 31 DECEMBER 2017 PREPARED IN ACCORDANCE WITH INTERNATIONAL FINANCIAL REPORTING STANDARDS AS ADOPTED BY EUROPEAN UNION 1 7 Table of contents: Independent
Annual report of Grupa LOTOS S.A Annual report of Grupa LOTOS S.A. 2016
 Annual report of Grupa LOTOS S.A. 2016 Annual report of Grupa LOTOS S.A. 2016 Annual report of Grupa LOTOS S.A. 2016 A. Letter of the President of the Management Board B. Grupa LOTOS S.A. Financial highlights
Public Company ORLEN Lietuva
 2 0 CONSOLIDATED FINANCIAL STATEMENTS FOR THE YEAR ENDED 31 DECEMBER 2016 PREPARED IN ACCORDANCE WITH INTERNATIONAL FINANCIAL REPORTING STANDARDS AS ADOPTED BY EUROPEAN UNION 1 6 Table of contents: Independent
Fuelling the future. October 19, 2017 Prague, Czech Republic
 Fuelling the future October 19, 2017 Prague, Czech Republic UNIPETROL FINANCIAL RESULTS Andrzej Modrzejewski, CEO Mirosław Kastelik, CFO #UNIPETROLQ3 @unipetrolcz TABLE OF CONTENTS KEY HIGHLIGHTS OF MACRO
(This is a translation of a document originally issued in Polish)
") GRUPA LOTOS S.A. NON-CONSOLIDATED FINANCIAL STATEMENTS FOR THE YEAR ENDED DECEMBER 31ST 2007 PREPARED IN ACCORDANCE WITH THE INTERNATIONAL FINANCIAL REPORTING STANDARDS ALONG WITH THE AUDITOR S OPINION
GRUPA LOTOS S.A. NON-CONSOLIDATED FINANCIAL STATEMENTS FOR THE YEAR ENDED DECEMBER 31ST 2007 PREPARED IN ACCORDANCE WITH THE INTERNATIONAL FINANCIAL REPORTING STANDARDS ALONG WITH THE AUDITOR S OPINION
UNIPETROL, a.s. CONSOLIDATED QUARTERLY REPORT
 CONSOLIDATED QUARTERLY REPORT FOR THE 4 TH QUARTER 2017 PREPARED IN ACCORDANCE WITH INTERNATIONAL FINANCIAL REPORTING STANDARDS AS ADOPTED BY THE EUROPEAN UNION CONSOLIDATED QUARTERLY REPORT FOR THE 4
Fuelling the future. July 20, 2018 Prague, Czech Republic
 Fuelling the future July 20, 2018 Prague, Czech Republic UNIPETROL FINANCIAL RESULTS Krzysztof Zdziarski, CEO Mirosław Kastelik, CFO #UNIPETROLQ2 @unipetrolcz TABLE OF CONTENTS KEY HIGHLIGHTS OF MACRO
UNCONSOLIDATED FINANCIAL STATEMENTS OF Polski Koncern Naftowy ORLEN SPÓŁKA AKCYJNA for the year ended 31 December 2009
 UNCONSOLIDATED FINANCIAL STATEMENTS OF Polski Koncern Naftowy ORLEN SPÓŁKA AKCYJNA 31 December 2009 Prepared in accordance with International Financial Reporting Standards as adopted by the European Union
Content Profile 4 Financial data Operating data
 Content Profile 4 Profile 5 Shareholders structure 6 Structure of the Unipetrol Group 7 Financial data 8 Main financial data 9 Financial ratios 10 Financial data by segment 11 Statement of profit or loss
1Q 2017 FINANCIAL RESULTS UNIPETROL. Andrzej Modrzejewski, CEO Mirosław Kastelik, CFO. 27 April 2017 Prague, Czech Republic.
 UNIPETROL 1Q 2017 FINANCIAL RESULTS Andrzej Modrzejewski, CEO Mirosław Kastelik, CFO 27 April 2017 Prague, Czech Republic #Unipetrol @unipetrolcz TABLE OF CONTENTS KEY HIGHLIGHTS OF 1Q 2017 MACRO ENVIRONMENT
Quarterly report containing the interim financial statements of the Group for Q3 of the financial year of
 Quarterly report containing the interim financial statements of the Group for Q3 of the financial year of 2016-2017 covering the period from 01-07-2016 to 31-03-2017 Publication date: 16 May 2017 TABLE
Quarterly Report containing interim financial statements of the AB Group for Q1 of the financial year
 Quarterly Report containing interim financial statements of the AB Group for Q1 of the financial year 2016-2017 covering the period from 01-07-2016 to 30-09-2016 Publication date: 14 November 2016 TABLE
Piotr Kownacki, CEO Jerzy Pazura, Planning and Controlling Executive Director August 13 th 2007
 Consolidated financial results of PKN ORLEN Q2 27 (IFRS) Piotr Kownacki, CEO Jerzy Pazura, Planning and Controlling Executive Director August 13 th 27 1 Agenda Financial results in Q2 7 Analysis of results
Quarterly report containing the interim financial statements of the Capital Group for Q3 of the financial year of
 Quarterly report containing the interim financial statements of the Capital Group for Q3 of the financial year of 2015-2016 covering a period from 01 July 2015 to 31 March 2016 Publication date: 16 May
EXTENDED CONSOLIDATED REPORT OF THE CIECH GROUP FOR THE FIRST HALF OF 2016
 We are providing a courtesy English translation of our audited financial statements which were originally written in Polish. We take no responsibility for the accuracy of our translation. For an accurate
(This is a translation of a document originally issued in Polish) GRUPA LOTOS S.A.
 GRUPA LOTOS S.A.") GRUPA LOTOS S.A. NON-CONSOLIDATED FINANCIAL STATEMENTS FOR THE YEAR ENDED DECEMBER 31ST 2008 PREPARED IN ACCORDANCE WITH THE INTERNATIONAL FINANCIAL REPORTING STANDARDS ALONG WITH THE AUDITOR S OPINION
GRUPA LOTOS S.A. NON-CONSOLIDATED FINANCIAL STATEMENTS FOR THE YEAR ENDED DECEMBER 31ST 2008 PREPARED IN ACCORDANCE WITH THE INTERNATIONAL FINANCIAL REPORTING STANDARDS ALONG WITH THE AUDITOR S OPINION
UNIPETROL, a.s. UNAUDITED NON-CONSOLIDATED FINANCIAL STATEMENTS PREPARED IN ACCORDANCE WITH INTERNATIONAL FINANCIAL REPORTING STANDARDS
 UNAUDITED NON-CONSOLIDATED FINANCIAL STATEMENTS PREPARED IN ACCORDANCE WITH INTERNATIONAL FINANCIAL REPORTING STANDARDS AS OF 31 MARCH 2008 AND 2007 AUDITED NON-CONSOLIDATED FINANCIAL STATEMENTS IN ACCORDANCE
Quarterly report containing interim financial statements of the Capital Group for Q3 of the financial year of
 Quarterly report containing interim financial statements of the Capital Group for Q3 of the financial year of 2013-2014 covering the period from 01-01-2014 to 31-03-2014 Publication date: 15 May 2014 TABLE
ZAKŁADY AUTOMATYKI POLNA Spółka Akcyjna
 ZAKŁADY AUTOMATYKI POLNA Spółka Akcyjna Condensed unitary statement for the periods of the 3 rd quarter finished on 30 th September 2011 and 30 th September 2010 prepared in compliance with International
EXTENDED CONSOLIDATED QUARTERLY REPORT OF THE CIECH GROUP FOR THE FIRST QUARTER OF 2016
 We are providing a courtesy English translation of our audited financial statements which were originally written in Polish. We take no responsibility for the accuracy of our translation. For an accurate
PKN ORLEN consolidated financial results 1Q13
 PKN ORLEN consolidated financial results 1Q13 Jacek Krawiec, CEO Sławomir Jędrzejczyk, CFO 25 April 2013 1 Agenda 1Q13 highlights Macroeconomic environment Financial and operating results in 1Q13 Liquidity
ANNUAL REPORT IMPEXMETAL S.A.
 ANNUAL REPORT IMPEXMETAL S.A. FOR 2016 IMPEXMET POLISH FINANCIAL SUPERVISION AUTHORITY Annual report R 2016 (according to 82 para. 1 of the Minister of Finance Regulation of 19 February 2009 - Journal
ABC DATA S.A. FINANCIAL STATEMENTS FOR THE YEAR ENDED 31 DECEMBER 2014 WITH AUDITOR S OPINION
 ABC DATA S.A. FINANCIAL STATEMENTS FOR THE YEAR ENDED 31 DECEMBER 2014 WITH AUDITOR S OPINION Statement of comprehensive income... 4 Balance sheet... 5 Cash flow statement... 6 Statement of changes in
AB S.A. Capital Group. Consolidated Financial Statements for the financial year 2015/16 covering the period from to
 AB S.A. Capital Group Consolidated Financial Statements for the financial year 2015/16 covering the period from 01.07.2015 to 30.06.2016. TABLE OF CONTENTS Page CONSOLIDATED PROFIT AND LOSS ACCOUNT FOR
Consolidated and Separate Financial Statements of the Nordea Bank Polska S.A. Group The third quarter of 2006
 Consolidated and Separate Financial Statements of the Nordea Bank Polska S.A. Group The third quarter of 2006 SELECTED FINANCIAL FIGURES keur 3 quarter(s) 3 quarter(s) 3 quarter(s) 3 quarter(s) incrementally
ORLEN GROUP TABLE OF CONTENTS
 TABLE OF CONTENTS 1. BASIS FOR THE PREPARATION AND INFORMATION ON PRINCIPLES ADOPTED FOR PREPARING THE CONSOLIDATED REPORT ON PAYMENTS TO GOVERNMENTS... 3 2. TERMINOLOGY USED... 3 3. PAYMENTS OVERVIEW...
GETBACK SPÓŁKA AKCYJNA
 GETBACK SPÓŁKA AKCYJNA SEPARATE FINANCIAL STATEMENTS FOR THE FINANCIAL YEAR 2015 ENDED ON 31.12.2015 DRAFTED IN ACCORDANCE WITH THE ACCOUNTING ACT OF 29 SEPTEMBER 1994 Wrocław, 26.02.2016 TABLE OF CONTENTS
mbank Hipoteczny S.A. IFRS Condensed Financial Statements for the first half of 2018
 IFRS Condensed Financial Statements for the first half of 2018 Selected financial data The following selected financial data constitute supplementary information to the condensed financial statements of
Condensed financial statements for the 1st quarter of 2014 prepared pursuant to the International Financial Reporting Standards endorsed by EU
 Wawel S.A. 1 Condensed financial statements for the 1st quarter of 2014 prepared pursuant to the International Financial Reporting Standards endorsed by EU Wawel S.A. 2 I. FINANCIAL STATEMENT state as
Consolidated interim report for the first half of 2016
 Consolidated interim report for the first half of 2016 Interim condensed consolidated financial statements for the six and three months ended June 30th 2016 (all figures in PLN 000 unless indicated otherwise)
Naftna industrija Srbije A.D.
 Naftna industrija Srbije A.D. Interim Condensed Consolidated Financial Statements (Unaudited) This version of the financial statements is a translation from the original, which is prepared in Serbian language.
INTERIM CONDENSED CONSOLIDATED FINANCIAL STATEMENT
 INTERIM CONDENSED CONSOLIDATED FINANCIAL STATEMENT FOR THE PERIOD OF THREE MONTHS ENDING ON JUNE 30th, 2018 DRAWN UP IN ACCORDANCE WITH INTERNATIONAL STANDARDS OF FINANCIAL REPORTING Capital Group LIVECHAT
FOTA S.A. FINANCIAL REPORTS FOR THE YEAR ENDED ON 31 DECEMBER 2012 WITH AN OPINION OF AN INDEPENDENT CHARTERED AUDITOR
 FOTA S.A. FINANCIAL REPORTS FOR THE YEAR ENDED ON 31 DECEMBER 2012 WITH AN OPINION OF AN INDEPENDENT CHARTERED AUDITOR Gdynia, 30 April 2013 FOTA S.A. Financial statements for the year ended on 2012 STATEMENT
THE BUDIMEX GROUP CONSOLIDATED FINANCIAL STATEMNETS. For the year ended 31 December 2009
 THE BUDIMEX GROUP CONSOLIDATED FINANCIAL STATEMNETS For the year ended 2009 Prepared in accordance with International Financial Reporting Standards Table of contents CONSOLIDATED STATEMENT OF FINANCIAL
CI GAMES GROUP CONSOLIDATED QUARTERLY REPORT Q3 2013
 CI GAMES GROUP Q3 2013 Warsaw, November 14, 2013 2 CONTENTS I. CONSOLIDATED FINANCIAL DATA - CI GAMES GROUP 4 II. SEPARATE FINANCIAL DATA - CI GAMES S.A. 13 III. FINANCIAL HIGHLIGHTS 22 IV. NOTES TO THE
Interim condensed consolidated financial statements for the three months ended March 31st 2014
 The IPOPEMA Securities Group Interim condensed consolidated financial statements for the three months ended March 31st 2014 Warsaw, May 14th 2014 Contents Financial highlights... 3 Interim condensed consolidated
 T A B L E O F C O N T E N T S 1 Principal activities... 6 2 Events for the year ended 31 December 2012... 6 3 Principal accounting policies... 7 4 Segment reporting... 34 5 Net interest income and similar
INTERIM CONDENSED CONSOLIDATED FINANCIAL STATEMENTS FOR Q3 ENDED SEPTEMBER 30TH 2015
 Periodic report for Q1 2014 (PLNm) INTERIM CONDENSED CONSOLIDATED FINANCIAL STATEMENTS FOR Q3 ENDED SEPTEMBER 30TH 2015 Page 1 of 54 Page 2 of 54 POLISH FINANCIAL SUPERVISION AUTHORITY Consolidated Quarterly
Condensed financial statements for the 3rd quarter of 2017 prepared pursuant to the International Financial Reporting Standards endorsed by EU
 Wawel S.A. 1 Condensed financial statements for the 3rd quarter of 2017 prepared pursuant to the International Financial Reporting Standards endorsed by EU Wawel S.A. 2 I. FINANCIAL STATEMENT state as
THE LOTOS GROUP. Contents MANAGEMENT S DISCUSSION AND ANALYSIS OF THE FINANCIAL PERFORMANCE IN Q3 2011
 THE LOTOS GROUP MANAGEMENT S DISCUSSION AND ANALYSIS OF THE FINANCIAL PERFORMANCE IN This is a translation of a document originally issued in Polish. Contents 1 Market environment... 2 2 Upstream segment...
Naftna industrija Srbije A.D.
 Naftna industrija Srbije A.D. Interim Condensed Consolidated Financial Statements (Unaudited) This version of the financial statements is a translation from the original, which is prepared in Serbian language.
PAO TMK Consolidated Financial Statements Year ended December 31, 2016
 Consolidated Financial Statements Consolidated Financial Statements Contents Independent auditor s report...3 Consolidated Income Statement...8 Consolidated Statement of Comprehensive Income...9 Consolidated
Condensed financial statements for the 1st quarter of 2017 prepared pursuant to the International Financial Reporting Standards endorsed by EU
 Wawel S.A. 1 Condensed financial statements for the 1st quarter of 2017 prepared pursuant to the International Financial Reporting Standards endorsed by EU Wawel S.A. 2 I. FINANCIAL STATEMENT state as
Nordea Bank Polska S.A. Annual Report 2011
 Nordea Bank Polska S.A. Annual Report 2011 This document is a free translation of the Polish original. Terminology current in Anglo-Saxon countries has been used where practicable for the purposes of this
AB S.A. Capital Group. Consolidated Financial Statements for the financial year covering the period from until
 AB S.A. Capital Group Consolidated Financial Statements for the financial year 2016-2017 covering the period from 01.07.2016 until 30.06.2017. TABLE OF CONTENTS CONSOLIDATED PROFIT AND LOSS ACCOUNT FOR
CONSOLIDATED QUARTERLY STATEMENTS FOR Q3, 2012
 CONSOLIDATED QUARTERLY STATEMENTS FOR Q3, 2012 14 2012 Consolidated Interim Financial Statements of the ACTION S.A. CAPITAL GROUP for Q3, 2012 Contents I. Statement of the Management Board concerning the
Unconsolidated Financial Statements of Bank Pekao S.A. for the period ended on 31 December 2011
 This document is a free translation of the Polish original. Terminology current in Anglo-Saxon countries has been used where practicable for the purposes of this translation in order to aid understanding.
CONSOLIDATED FINANCIAL STATEMENT OF ZPUE S.A. CAPITAL GROUP FOR THE 3RD QUARTER OF 2012
 CONSOLIDATED FINANCIAL STATEMENT OF ZPUE S.A. CAPITAL GROUP FOR THE 3RD QUARTER OF 2012 WŁOSZCZOWA, NOVEMBER 2012 LIST OF CONTENTS 1. Condensed Consolidated Financial Statement for the 3rd Quarter of 2012
CONSOLIDATED FINANCIAL STATEMENTS DECEMBER 31, Direction de la CONSOLIDATION REPORTING GROUPE
 CONSOLIDATED FINANCIAL STATEMENTS DECEMBER 31, 2010 Direction de la CONSOLIDATION REPORTING GROUPE CONSOLIDATED BALANCE SHEET Notes Dec. 31, 2010 Dec. 31, 2009 ASSETS Goodwill (3) 11,030 10,740 Other intangible
Interim Financial Statements of Nordea Bank Polska S.A. 2nd quarter of 2007
 Interim Financial Statements of Nordea Bank Polska S.A. 2nd quarter of 2007 Selected financials In thousand of PLN In thousand of EUR period period period period from from from from 01/01/2007 to 01/01/2006
OAO GAZPROM IFRS CONSOLIDATED FINANCIAL STATEMENTS 31 DECEMBER 2013
 IFRS CONSOLIDATED FINANCIAL STATEMENTS 31 DECEMBER 2013 Independent Auditor s Report To the Shareholders and Board of Directors of OAO Gazprom We have audited the accompanying consolidated financial statements
FINANCIAL STATEMENTS OF AUSCHWITZ-BIRKENAU FOUNDATION FOR THE FINANCIAL YEAR FROM 1 JANUARY TO 31 DECEMBER 2014
 FINANCIAL STATEMENTS OF AUSCHWITZ-BIRKENAU FOUNDATION FOR THE FINANCIAL YEAR FROM 1 JANUARY TO 31 DECEMBER 2014 Translation of the financial statements of Auschwitz-Birkenau Foundation for the financial
FOR THE YEAR ENDED 31 DECEMBER 2012
 INDEPENDENT AUDITOR S REPORT, AND STAND-ALONE ANNUAL REPORT CONTENTS Pages INDEPENDENT AUDITOR S REPORT 3-4 5 42 STATEMENT OF COMPREHENSIVE INCOME 5 BALANCE SHEET 6 STATEMENT OF CHANGES IN EQUITY 7 STATEMENT
Financial statements of AB S.A. for the financial year 2013/2014
 Financial statements of AB S.A. for the financial year 2013/2014 covering the period 01-07-2013 to 30-06-2014 AB S.A. BANK ACCOUNT: Kredyt Bank S.A I/o Wrocław, PL68 1500 1155 1211 5003 2339 0000 (PLN),
PAO TMK Unaudited Interim Condensed Consolidated Financial Statements Three-month period ended March 31, 2018
 Unaudited Interim Condensed Consolidated Financial Statements Unaudited Interim Condensed Consolidated Financial Statements Contents Report on Review of Interim Financial Information...3 Unaudited Interim
Converse Bank Closed Joint Stock Company Consolidated financial statements. Year ended 31 December 2016 together with independent auditor s report
 Consolidated financial statements Year ended 31 December 2016 together with independent auditor s report 2016 Consolidated financial statements Contents Independent auditor s report Consolidated statement
[1.1] [Takko Unaudited Interim Report FY Q2.pdf] [Page 1 of 42] UNAUDITED INTERIM REPORT
![[1.1] [Takko Unaudited Interim Report FY Q2.pdf] [Page 1 of 42] UNAUDITED INTERIM REPORT](/thumbs/75/72014162.jpg "[1.1] [Takko Unaudited Interim Report FY Q2.pdf] [Page 1 of 42] UNAUDITED INTERIM REPORT") [1.1] [Takko Unaudited Interim Report FY2017-18 Q2.pdf] [Page 1 of 42] UNAUDITED INTERIM REPORT Q2 2017 / 2018 Overview & figures in EUR k 1 May 2017 1 May 2016 1 Feb 2017 1 Feb 2016 304,424 296,923 545,405
[1.1] [Takko Unaudited Interim Report FY2017-18 Q2.pdf] [Page 1 of 42] UNAUDITED INTERIM REPORT Q2 2017 / 2018 Overview & figures in EUR k 1 May 2017 1 May 2016 1 Feb 2017 1 Feb 2016 304,424 296,923 545,405
The KRUK Group Consolidated financial statements for the year ended December 31st 2014
 Consolidated financial statements for the year ended December 31st 2014 Prepared in accordance with the International Financial Reporting Standards as endorsed by the European Union The KRUK Group December
Notes to the Consolidated Financial Statements
 Financials > Financial Statements > Notes to the Consolidated Financial Statements > The Group s accounting policies for the Consolidated Financial Statements Notes to the Consolidated Financial Statements
Midas Spółka Akcyjna FINANCIAL STATEMENTS FOR THE YEAR ENDED 31 DECEMBER 2015 TOGETHER WITH THE INDEPENDENT AUDITOR S OPINION
 Midas Spółka Akcyjna FINANCIAL STATEMENTS FOR THE YEAR ENDED 31 DECEMBER 2015 TOGETHER WITH THE INDEPENDENT AUDITOR S OPINION CONTENTS Selected financial data... 3 Statement of comprehensive income...
The Capital Group of Midas Spółka Akcyjna
 The Capital Group of Midas Spółka Akcyjna Consolidated quarterly report for the QSr 1/2015 Place and date of publication: Warsaw, 13 May 2015 CONTENT OF THE REPORT: Selected financial data of the Midas
YIOULA GLASSWORKS S.A. AND SUBSIDIARIES NOTES TO THE CONSOLIDATED FINANCIAL STATEMENTS SEPTEMBER 30, 2012
 1. CORPORATE INFORMATION: Yioula Glassworks S.A., a corporation formed under the laws of the Hellenic Republic (also known as Greece), οn August 5, 1959, by Messrs Kyriacos and Ioannis Voulgarakis is the
PUBLIC JOINT STOCK COMPANY JOINT STOCK BANK UKRGASBANK Financial Statements. Year ended 31 December 2011 Together with Independent Auditors Report
 PUBLIC JOINT STOCK COMPANY JOINT STOCK BANK UKRGASBANK Financial Statements Year ended 31 December 2011 Together with Independent Auditors Report Contents Independent Auditors Report Statement of financial
PAO TMK Unaudited Interim Condensed Consolidated Financial Statements Three-month period ended March 31, 2017
 Unaudited Interim Condensed Consolidated Financial Statements Unaudited Interim Condensed Consolidated Financial Statements Contents Report on Review of Interim Financial Information...3 Unaudited Interim
The Midas Spółka Akcyjna Capital Group
 The Midas Spółka Akcyjna Capital Group Consolidated quarterly report for the 3-month and 9-month period ended 2013 QSr 3/2013 Place and date of publication: Warsaw, 14 November 2013 CONTENT OF THE REPORT:
PREPARED IN ACCORDANCE WITH THE INTERNATIONAL FINANCIAL REPORTING STANDARDS ADOPTED BY THE EUROPEAN UNION
 SEPARATE FINANCIAL STATEMENTS SEPARATE FINANCIAL STATEMENTS 31 DECEMBER 2016 PREPARED IN ACCORDANCE WITH THE INTERNATIONAL FINANCIAL REPORTING STANDARDS ADOPTED BY THE EUROPEAN UNION SEPARATE FINANCIAL
Interim Financial Statements of Nordea Bank Polska S.A. for 2nd Quarter of 2008
 Interim Financial Statements of Nordea Bank Polska S.A. 2 nd quarter of 2008 1 Financial Statements of Nordea Bank Polska S.A. Table of contents: Title Str. I. SELECTED FINANCIAL DATA... 4 II. PROFIT AND
Consolidated Full-Year Report of the PGNiG Group. for the period January 1st 2017 December 31st Polskie Górnictwo Naftowe i Gazownictwo S.A.
 Polskie Górnictwo Naftowe i Gazownictwo S.A. Consolidated Full-Year Report of the PGNiG Group for the period January 1st December 31st Strona 1 z 2 PGNiG GROUP CONSOLIDATED FULL-YEAR REPORT FOR (in PLN
TAURON Polska Energia S.A.
 Condensed interim financial statements prepared in accordance with the International Financial Reporting Standards, as endorsed by the European Union for the 3-month period ended 1 CONDENSED INTERIM STATEMENT
Selecta Group B.V. and its subsidiaries, Amsterdam (The Netherlands)
") Selecta Group B.V. and its subsidiaries, Amsterdam (The Netherlands) Consolidated financial statements for the year ended 30 September and report of the independent auditor Table of Contents Consolidated
Selecta Group B.V. and its subsidiaries, Amsterdam (The Netherlands) Consolidated financial statements for the year ended 30 September and report of the independent auditor Table of Contents Consolidated
MCI VENTURE PROJECTS LIMITED VI JOINT-STOCK PARTNERSHIP. Financial statements for a period
 0 MCI VENTURE PROJECTS LIMITED VI JOINT-STOCK PARTNERSHIP Financial statements for a period 01.11.2016 31.10.2017 Monitor ERP System Polska Spółka z ograniczoną odpowiedzialnością 1 Financial statements
 TABLE OF CONTENTS 1 PRINCIPAL ACTIVITIES... 6 2 EVENTS FOR THE YEAR ENDED 31 DECEMBER 2012... 7 3 PRINCIPAL ACCOUNTING POLICIES... 8 4 SEGMENT REPORTING... 34 5 NET INTEREST INCOME AND SIMILAR INCOME...
DINO POLSKA S.A. FINANCIAL STATEMENTS FOR THE YEAR ENDED 31 DECEMBER 2017 WITH THE AUDIT REPORT OF THE INDEPENDENT AUDITOR
 FINANCIAL STATEMENTS FOR THE YEAR ENDED 31 DECEMBER 2017 WITH THE AUDIT REPORT OF THE INDEPENDENT AUDITOR Krotoszyn, 16 March 2018 Unofficial translation. Only the original Polish text is binding. Introduction
MULTIMEDIA POLSKA GROUP CONSOLIDATED FINANCIAL STATEMENTS FOR THE YEAR ENDED 31 DECEMBER 2008 WITH INDEPENDENT AUDITOR S REPORT
 CONSOLIDATED FINANCIAL STATEMENTS FOR THE YEAR ENDED 31 DECEMBER 2008 WITH INDEPENDENT AUDITOR S REPORT Consolidated financial statements for the year ended 31 December 2008 (in thousand PLN) CONSOLIDATED
PEGAS NONWOVENS a.s. FIRST QUARTER RESULTS 2018
 PEGAS NONWOVENS a.s. FIRST QUARTER RESULTS 2018 17 May 2018 First Quarter of 2018 Unaudited Consolidated Financial Results PEGAS NONWOVENS a.s. announces its unaudited consolidated financial results for
FINANCIAL STATEMENTS FOR THE THREE MONTH PERIOD ENDED MARCH 31, 2013
 FINANCIAL STATEMENTS FOR THE THREE MONTH PERIOD ENDED MARCH 31, 2013 (UNAUDITED) NOTICE OF NO AUDITOR REVIEW Pursuant to National Instrument 51-102, Part 4, subsection 4.3(3)(a), the accompanying unaudited
Financial Statements of AB S.A. for the financial year 2015/2016
 Financial Statements of AB S.A. for the financial year 2015/2016 covering the period from 01-07-2015 to 30-06-2016 TABLE OF CONTENTS Page PROFIT AND LOSS ACCOUNT FOR THE PERIOD FROM 1 JULY 2015 TO 30 JUNE
Consolidated annual financial statements of the Quantum software S.A. Capital Group for the period from to
 Consolidated annual financial statements of the Quantum software S.A. Capital Group for the period from 01.01.2017 to 31.12.2017 Kraków 20 April 2018 1 Contents of the consolidated financial statements:
ČEZ, a. s. FINANCIAL STATEMENTS
 ČEZ, a. s. FINANCIAL STATEMENTS PREPARED IN ACCORDANCE WITH INTERNATIONAL FINANCIAL REPORTING STANDARDS AS OF DECEMBER 31, 2017 ČEZ, a. s. BALANCE SHEET AS OF DECEMBER 31, 2017 in CZK Millions ASSETS:
FABRYKA FARB i LAKIERÓW "ŚNIEŻKA" S.A. FINANCIAL STATEMENTS FOR THE YEAR ENDED 31 DECEMBER 2012 WITH AN OPINION OF AN INDEPENDENT CERTIFIED AUDITOR
 FABRYKA FARB i LAKIERÓW "ŚNIEŻKA" S.A. FINANCIAL STATEMENTS FOR THE YEAR ENDED 31 DECEMBER 2012 WITH AN OPINION OF AN INDEPENDENT CERTIFIED AUDITOR Lubzina, 18 April 2013 Fabryka Farb i Lakierów "Śnieżka"
SAUDI ARAMCO TOTAL REFINING & PETROCHEMICAL COMPANY (SATORP) (A Saudi Arabian Mixed Limited Liability Company)
 (A Saudi Arabian Mixed Limited Liability Company)") SAUDI ARAMCO TOTAL REFINING & PETROCHEMICAL COMPANY (SATORP) CONSOLIDATED FINANCIAL STATEMENTS FOR THE YEAR ENDED 31 DECEMBER 2017 AND INDEPENDENT AUDITOR S REPORT CONSOLIDATED FINANCIAL STATEMENTS FOR
SAUDI ARAMCO TOTAL REFINING & PETROCHEMICAL COMPANY (SATORP) CONSOLIDATED FINANCIAL STATEMENTS FOR THE YEAR ENDED 31 DECEMBER 2017 AND INDEPENDENT AUDITOR S REPORT CONSOLIDATED FINANCIAL STATEMENTS FOR
LSI SOFTWARE GROUP CONDENSED INTERIM CONSOLIDATED FINANCIAL STATEMENT FOR THE FIRST HALF OF THE YEAR ENDED 30 JUNE 2017
 LSI SOFTWARE GROUP CONDENSED INTERIM CONSOLIDATED FINANCIAL STATEMENT FOR THE FIRST HALF OF THE YEAR ENDED 30 JUNE 2017 Daily work becomes easier A. STATEMENT OF THE MANAGEMENT BOARD On the basis of the
Group information. 6 Financial performance. 21 Depreciation, depletion and amortization. 7 Group income statement. 22 Group balance sheet
 6 Financial performance 7 Group income statement 8 Summarized group income statement by quarter 10 Replacement cost profit (loss) before interest and tax by business and geographical area 12 Non-operating
TAURON Polska Energia S.A.
 Condensed interim financial statements prepared in accordance with the International Financial Reporting Standards as endorsed by the European Union for the 9-month period ended 1 CONDENSED INTERIM STATEMENT
Sekisui Chemical Integrated Report Financial Section. Financial Section
 Sekisui Chemical Integrated Report 2018 Financial Section Financial Section 77 Financial Highlights (6 years) 78 Consolidated Financial Statements 78 Consolidated Balance Sheet 80 Consolidated Statement
ORLEN GROUP TABLE OF CONTENTS
 TABLE OF CONTENTS 1. BASIS FOR THE PREPARATION AND INFORMATION ON PRINCIPLES ADOPTED FOR PREPARING THE CONSOLIDATED REPORT ON PAYMENTS TO GOVERNMENTS... 3 2. TERMINOLOGY USED... 3 3. PAYMENTS OVERVIEW...
Shihlin Electric & Engineering Corp. Financial Statements for the Years Ended December 31, 2013 and 2012 and Independent Auditors Report
 Shihlin Electric & Engineering Corp. Financial Statements for the Years Ended and 2012 and Independent Auditors Report INDEPENDENT AUDITORS REPORT The Board of Directors and Stockholders Shihlin Electric
THE SECO/WARWICK GROUP
 INTERIM CONDENSED CONSOLIDATED FINANCIAL STATEMENTS FOR THE PERIOD JANUARY 1ST MARCH 31ST 2015 PREPARED IN ACCORDANCE WITH THE INTERNATIONAL FINANCIAL REPORTING STANDARDS CONTENTS INTERIM CONDENSED CONSOLIDATED
PAO TMK Consolidated Financial Statements Year ended December 31, 2017
 Consolidated Financial Statements Consolidated Financial Statements Contents Independent auditor s report...3 Consolidated Income Statement...8 Consolidated Statement of Comprehensive Income...9 Consolidated
MANAGEMENT S REPORT. February 22, BLACKPEARL RESOURCES INC. / 2016 FINANCIAL REPORT
 MANAGEMENT S REPORT The accompanying Consolidated Financial Statements of BlackPearl Resources Inc. and related financial information presented in this financial report are the responsibility of Management
TAURON Polska Energia S.A.
 TAURON Polska Energia S.A. Condensed interim financial statements prepared in accordance with the International Financial Reporting Standards, as endorsed by the European Union for the 9-month period ended
Consolidated Financial Statements of
 Consolidated Financial Statements of For the years ended Table of Contents Page Management s Responsibility for Financial Reporting 2 Independent Auditors Report 3-4 Consolidated Balance Sheets 5 Consolidated