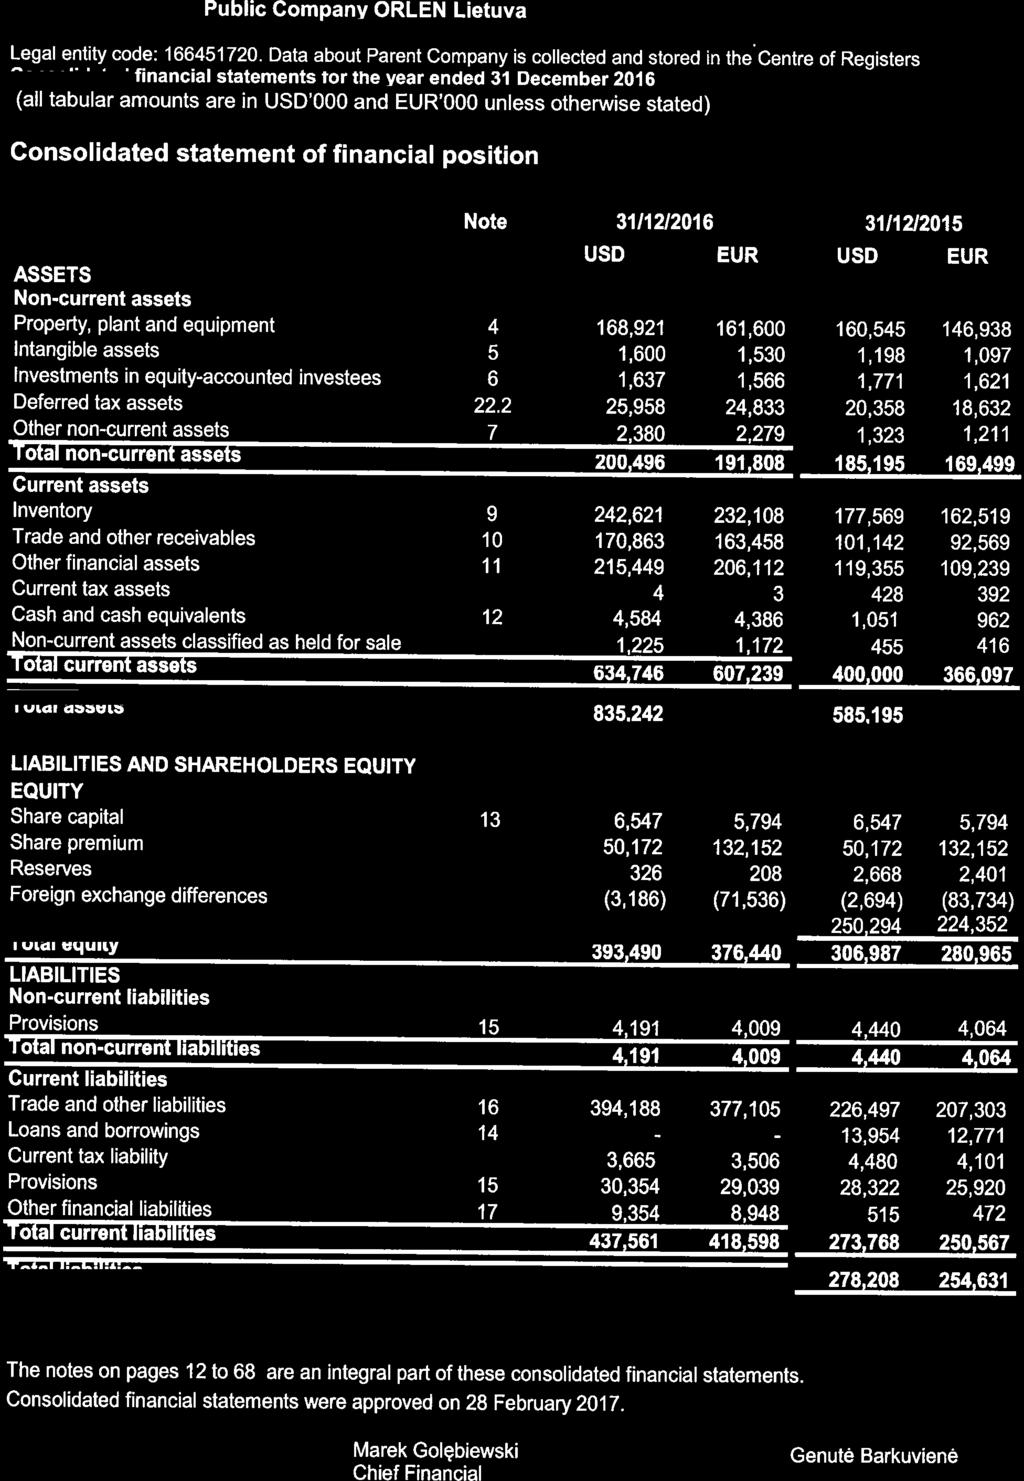
Public Company ORLEN Lietuva
|
|
|
- Alexandra Lester
- 6 years ago
- Views:
Transcription
1 2 0 CONSOLIDATED FINANCIAL STATEMENTS FOR THE YEAR ENDED 31 DECEMBER 2016 PREPARED IN ACCORDANCE WITH INTERNATIONAL FINANCIAL REPORTING STANDARDS AS ADOPTED BY EUROPEAN UNION 1 6
2 Table of contents: Independent auditor s report to the shareholder of AB ORLEN Lietuva... 4 Consolidated statement of financial position... 7 Consolidated statement of profit or loss and other comprehensive income... 8 Consolidated statement of cash flows... 9 Statement of changes in consolidated equity Accounting principles and other explanatory information Reporting entity Accounting principles Principles of preparation of financial statements Impact of IFRS amendments and interpretations on consolidated financial statements of the Group Functional and presentation currency of financial statements and methods applied to translation of financial data for consolidation purposes Description of significant accounting principles The Management estimates and assumptions Property, plant and equipment Intangible assets Investments in equity-accounted investees Other non-current assets Impairment of non-current assets Inventories Trade and other receivables Other financial assets Cash and cash equivalents Share capital Loans and borrowings Provisions Environmental provision Provision for jubilee bonuses and post-employment benefits Business risk provision Restructuring provision Provision for CO2 emission Trade and other liabilities Other financial liabilities Sales revenues Operating expenses Other operating income and expenses Other operating income Other operating expenses
3 21. Financial income and expenses Financial income Financial expenses Tax expenses The differences between income tax expense recognized in profit or loss and the amount calculated based on profit before tax Deferred tax Financial instruments and financial risks Financial instruments by category and class Income and expense, profit and loss in the consolidated statement of profit or loss and other comprehensive income Fair value measurement Hedge accounting Financial risk management Other explanatory notes Capital commitments Contingencies Guarantees Related party transactions Remuneration together with profit-sharing paid and due or potentially due to the members of Management Board, Supervisory Board and other members of key executive personnel of Parent company and the Group companies Remuneration arising from the agreement with the entity authorized the conduct audit of the financial statements Information concerning significant proceedings in front of court, body appropriate for arbitration proceedings or in front of public administration bodies Court proceedings in which the Parent company act as plaintiff Court proceedings in which Parent company act as a defendant Significant events after the end of the reporting period Factors and events that may influence future results CONSOLIDATED ANNUAL REPORT OF PUBLIC COMPANY ORLEN LIETUVA FOR THE YEAR
4
5
6
7
8
9

10
11
12 Accounting principles and other explanatory information 1. Reporting entity Public Company ORLEN Lietuva (hereinafter the Parent company) is incorporated and domiciled in Lithuania. Its registered office is located at the address: Mažeikių St. 75, Juodeikiai village, Mazeikiai District, Republic of Lithuania. Its legal entity code is The Parent company comprises an oil refinery enterprise in Mažeikiai, the Būtingė terminal and an oil products pumping station in Biržai. The sole shareholder of the Parent company is PKN ORLEN S.A. The consolidated financial statements as at 31 December 2016 include the Parent company and subsidiary companies. The Parent company also prepares separate financial statements. The Consolidated group (hereinafter the Group ) consists of the Parent company and its four subsidiaries. The Group has one associate which is accounted for using the equity method. The subsidiaries and the associate included into the Group s consolidated financial statements are listed below: Subsidiary/associated company Subsidiaries UAB Mažeikių Naftos prekybos namai 31/12/ /12/2015 SIA ORLEN Latvija Latvia OU ORLEN Eesti Estonia UAB EMAS Lithuania Associated company Established in Year of establishment/ acquisition Lithuania Share of the Group UAB Naftelf Lithuania Nature of activity Intermediate holding entity has two subsidiaries SIA ORLEN Latvija and OU ORLEN Eesti. Their activity is wholesale trading in petroleum products in Latvia and Estonia. Wholesale trading in petroleum products in Latvia. This company is a subsidiary of UAB Mažeikių Naftos prekybos namai which holds 100 percent of shares of this company. Wholesale trading in petroleum products in Estonia. This company is a subsidiary of UAB Mažeikių Naftos prekybos namai which holds 100 percent of shares of this company. Installation, supervision, repair of electrical equipment and related services, in-door and industrial cleaning services. UAB EMAS was reorganised in 2015 by merging UAB Paslaugos tau to UAB EMAS activities. UAB Paslaugos tau ceased the operations from 30 September 2015 and UAB EMAS continue as one entity. Trading in aviation fuel and construction of storage facilities thereof. 12
13 2. Accounting principles 2.1. Principles of preparation of financial statements The consolidated financial statements have been prepared in accordance with International Financial Reporting Standards (IFRS) adopted by the European Union (EU) effective as at 31 December The consolidated financial statements cover the period from 1 January to 31 December 2016 and the corresponding period from 1 January to 31 December The consolidated financial statements have been prepared assuming that the Group will continue to operate as a going concern in the foreseeable future. As at the date of approval of these consolidated financial statements, there is no evidence indicating that the Group will not be able to continue its operations as a going concern. Duration of the Parent company and the entities comprising the Group is unlimited. The financial statements, except for consolidated cash flow statement, have been prepared using the accrual basis of accounting. The consolidated financial statements were authorized for issue by the General Director, Chief Financial Officer and Chief accountant on 28 February Owners of every entity have the power to amend, approve or reject financial statements after their issue Impact of IFRS amendments and interpretations on consolidated financial statements of the Group IFRSs and their interpretations, announced and adopted by the European Union, not yet effective The Group intends to adopt listed below new standards and amendments to the standards and interpretations to IFRSs that are published by the International Accounting Standards Board, but not effective as at the date of publication of these financial statements, in accordance with their effective date. Possible impact on financial statements IFRS 9 - Financial Instruments IFRS 15 - Revenue from Contracts with Customers impact* impact** * IFRS 9 Financial Instruments (2014) (Effective for annual periods beginning on or after 1 January 2018, to be applied retrospectively with some exemptions. The restatement of prior periods is not required, and is permitted only if information is available without the use of hindsight. Early application is permitted.) This Standard replaces IAS 39, Financial Instruments: Recognition and Measurement, except that the IAS 39 exception for a fair value hedge of an interest rate exposure of a portfolio of financial assets or financial liabilities continues to apply, and entities have an accounting policy choice between applying the hedge accounting requirements of IFRS 9 or continuing to apply the existing hedge accounting requirements in IAS 39 for all hedge accounting. Although the permissible measurement bases for financial assets amortised cost, fair value through other comprehensive income (FVOCI) and fair value through profit and loss (FVTPL) are 13
14 similar to IAS 39, the criteria for classification into the appropriate measurement category are significantly different. A financial asset is measured at amortized cost if the following two conditions are met: the assets is held within a business model whose objective is to hold assets in order to collect contractual cash flows; and, its contractual terms give rise on specified dates to cash flows that are solely payments of principal and interest on the principal outstanding. In addition, for a non-trading equity instrument, a company may elect to irrevocably present subsequent changes in fair value (including foreign exchange gains and losses) in OCI. These are not reclassified to profit or loss under any circumstances. For debt instruments measured at FVOCI, interest revenue, expected credit losses and foreign exchange gains and losses are recognised in profit or loss in the same manner as for amortised cost assets. Other gains and losses are recognised in OCI and are reclassified to profit or loss on derecognition. The impairment model in IFRS 9 replaces the incurred loss model in IAS 39 with an expected credit loss model, which means that a loss event will no longer need to occur before an impairment allowance is recognised. IFRS 9 includes a new general hedge accounting model, which aligns hedge accounting more closely with risk management. The types of hedging relationships fair value, cash flow and foreign operation net investment remain unchanged, but additional judgment will be required. The standard contains new requirements to achieve, continue and discontinue hedge accounting and allows additional exposures to be designated as hedged items. Extensive additional disclosures regarding an entity s risk management and hedging activities are required. It is expected that the new Standard, when initially applied, will have a significant impact on the financial statements, since the classification and the measurement of the Entity s financial instruments are expected to change. The Group does not expect IFRS 9 (2014) to have material impact on the financial statements. The classification and measurement of the Group s financial instruments are not expected to change under IFRS 9 because of the nature of the Group s operations and the types of financial instruments that it holds. However the Group believes that impairment losses are likely to increase and become more volatile for assets in the scope of expected credit loss impairment model. The Group has not yet finalised the impairment methodologies that it will apply under IFRS 9. ** IFRS 15 Revenue from contracts with customers (Effective for annual periods beginning on or after 1 January Earlier application is permitted.) The new Standard provides a framework that replaces existing revenue recognition guidance in IFRS. Entities will adopt a five-step model to determine when to recognise revenue, and at what amount. The new model specifies that revenue should be recognised when (or as) an entity transfers control of goods or services to a customer at the amount to which the entity expects to be entitled. Depending on whether certain criteria are met, revenue is recognised: over time, in a manner that depicts the entity s performance; or at a point in time, when control of the goods or services is transferred to the customer. 14
15 IFRS 15 also establishes the principles that an entity shall apply to provide qualitative and quantitative disclosures which provide useful information to users of financial statements about the nature, amount, timing, and uncertainty of revenue and cash flows arising from a contract with a customer. It is expected that the new Standard, when initially applied, will have a significant impact on the financial statements, since the timing and the measurement of the Entity s revenues are expected to change. Although it has not yet fully completed its initial assessment of the potential impact of IFRS 15 on the Group s financial statements, management does not expect that the new Standard, when initially applied, will have material impact on the Group s financial statements. The timing and measurement of the Group s revenues are not expected to change under IFRS 15 because of the nature of the Group s operations and the types of revenues it earns Standards and interpretations adopted by International Accounting Standards Board (IASB), waiting for approval of EU Possible impact on financial statements IFRS 14 - Regulatory Deferral Accounts Amendments to IFRS 10 - Consolidated Financial Statements and IAS 28 - Investments in Associates: Sale or Contribution of Assets between an Investor and its Associate or Joint Venture IFRS 16 - Leasing Amendments to IAS 12 Income Taxes - Recognition of Deferred Tax Assets for Unrealized Losses Amendments to IAS 7 Statement of Cash Flows - Diclosure initiative Amendments to IFRS 15 - Revenue from Contracts with Customers Amendments to IFRS 2 - Share-based Payment Amendments to IFRS 4 - Insurance contracts Improvements to IFRS ( ) IFRIC 22 - Foreign Currency Transactions and Advance Consideration Amendments to IAS 40 - Investment Property no impact expected no impact expected impact*** no impact expected no impact expected no impact expected no impact expected no impact expected no impact expected no impact expected no impact expected *** The impact of the new IFRS 16 will result in the recognition in the statement of financial position the Group as a lessee under rent, tenancy, use and lease, which until the first application of the standard is not qualified as a finance lease. The Group plans to finalize the analysis of the impact of the standard IFRS 16 at the latest by Functional and presentation currency of financial statements and methods applied to translation of financial data for consolidation purposes Items included in the financial statements of each of the Group s entities are measured using the currency of the primary economic environment in which the entity operates (the functional currency ). The functional currency of the Parent company is the US dollar (USD) as it mainly influences sales prices for goods and services and material costs, the funds from financing activities are mainly generated in the USD and the Parent retains the major part of receipts from its operating activities in the USD. A significant portion of the Group s business is conducted in US 15
16 dollars and management uses the USD to manage business risks and exposures and to measure performance of the business. The consolidated financial statements are presented in US dollars, which is the Parent company s functional currency, and, due to the requirements of the laws of the Republic of Lithuania, also in Euro (EUR) being an additional presentation currency. Exchange rates used for calculation of financial data exchange rate at the end CURRENCIES of the reporting period 31/12/ /12/2015 EUR/USD The consolidated financial statements of the Group, prepared in US dollars, the functional currency of the Parent company, are translated to the presentation currency Euro by using period end exchange rate for translation of assets and liabilities. The statement of profit or loss and other comprehensive income and particular items of statement of cash flow are recalculated into currency Euro using monthly average exchange rate of working days of Central bank of the Republic of Lithuania during reporting period. All resulting exchange differences are recognized as cumulative translation adjustments in other comprehensive income Description of significant accounting principles Transactions in foreign currencies Exchange rate differences arising on the settlement of monetary items or on translating monetary items at the currency exchange rates different from those at which they were translated on initial recognition during the reporting period or in previous financial statements is recognized by the Group in profit or loss in the period in which they arise Principles of consolidation The consolidated financial statements of the Group include assets, liabilities, equity, income, expenses and cash flow of the Parent Company and its subsidiaries that are presented as those of a single economic entity and are prepared for the same reporting period as separate financial statements of the Parent Company and using uniform accounting principles in relation to similar transactions and other events in similar circumstances. The subsidiaries are consolidated using full consolidation method. Investments in associates are accounted for under equity method. The Group s share in profit or loss of the investee is recognized in the Group s profit or loss as other operating activity. For investments in associates the Group has a significant influence if it holds, directly or indirectly (i.e. through subsidiaries), from 20% to 49% of the voting rights of an entity, unless it can be clearly stated otherwise. Associates are those entities in which the Group has significant influence, but not control or joint control, over the financial and operating policies Property, plant and equipment Property, plant and equipment include both property, plant and equipment (assets that are in the condition necessary for them to be capable of operating in the manner intended by management) 16
17 as well as construction in progress (assets that are in the course of construction or development necessary for them to be capable of operating in the manner intended by management). Property, plant and equipment are initially stated at cost. The cost of an item of property, plant and equipment comprises its purchase price, including any costs directly attributable to bringing the asset into use. The cost of an item of property, plant and equipment includes also the initial estimate of the costs of dismantling and removing the item and restoring the site on which it is located, the obligation for which is connected with acquisition or construction of an item of property, plant and equipment. Property, plant and equipment are stated in the statement of financial position prepared at the end of the reporting period at the carrying amount i.e. the amount at which an asset is initially recognized (cost) less accumulated depreciation and any accumulated impairment losses. Property, plant and equipment are depreciated with straight-line method and in justified cases units of production method of depreciation (catalysts). Each part of an item of property, plant and equipment with a cost that is significant in relation to the total cost of the item is depreciated separately over the period reflecting its economic useful life. The following standard economic useful lives are used for property, plant and equipment: buildings and constructions years machinery and equipment 4-35 years Vehicles and other 2-20 years The method of depreciation, residual value and useful life of an asset are reviewed at least once a year. When it is necessary adjustments of depreciation are carried out in subsequent periods (prospectively). The cost of significant repairs and regular maintenance programs are recognized as property, plant and equipment and depreciated in accordance with their useful lives. The cost of current maintenance of property, plant and equipment is recognized as an expense in the period in which they are incurred. Property, plant and equipment are tested for impairment, when there are indications or events that may imply that the carrying amount of those assets may not be recoverable. Recognition and reversal of impairment allowances of property, plant and equipment is recognised in other operating activities Intangible assets An intangible asset is measured initially at acquisition or production costs, including grants related to assets. Subsequent to initial recognition, the intangible asset is measured at cost, less accumulated amortisation and accumulated impairment losses. Intangible assets with definite useful life are amortized using straight-line method. Amortisation begins when the asset is available for use, i.e. when it is in the location and condition necessary for it to be capable of operating in the manner intended by management. The asset is amortized over the period reflecting its estimated useful life. The following standard economic useful lives are used for intangible assets: Licenses, patents and similar assets Software 2 15 years 2 10 years 17
18 The method of amortization and useful life of an asset are reviewed at least once a year. When it is necessary adjustments of amortization are carried out in subsequent periods (prospectively). Intangible assets with an indefinite useful life are not amortized. Their value is decreased by the eventual impairment allowances. At each period the useful life is reviewed to determine whether events and circumstances continue to support an indefinite useful life assessment for that asset. Recognition and reversal of impairment allowances of intangible assets is recognised in other operating activities Rights Carbon dioxide emission rights (CO 2) CO 2 emission rights are initially recognized as intangible assets, which are not amortized (assuming the high residual value), but tested for impairment. Granted emission allowances are presented as separate items as intangible assets in correspondence with deferred income at fair value as at the date of registration. Purchased allowances are presented as intangible assets at purchase price and are not amortised (assuming the high residual value) but tested for impairment. For the estimated CO 2 emissions during the reporting period, a provision is created in operating activity costs (taxes and charges). Grants of CO 2 emission rights are recognized on a systematic basis to ensure matching with the related costs for which the grants were intended to compensate. Outgoing of allowances is recognized using FIFO method (first in, first out) based on particular type of allowances (EUA, ERU, CER) Impairment of property, plant and equipment and intangible assets At the end of each reporting period Group assess whether there is any indication that an asset or cash generating unit (CGU) may be impaired or any indicators that the previously recognized impairment should be reversed. If any such indication exists, the Group estimates the recoverable amount of the asset (CGU) by determining the greater of its fair value less costs of disposal or value in use by applying the proper discount rate. Assets that do not generate the independent cash flows are grouped on the lowest level on which cash flows, independent from cash flows from other assets, are generated (CGU). If such case occurs, the recoverable amount is determined on the GCU level, to which the asset belongs Inventories Inventories, including mandatory reserves, comprise products, work in progress, merchandise and materials. Finished goods and work in progress are measured initially at production cost. Production costs include costs of materials and costs of conversion for the production period. Costs of production include also a systematic allocation of fixed and variable production overheads estimated for normal production level. 18
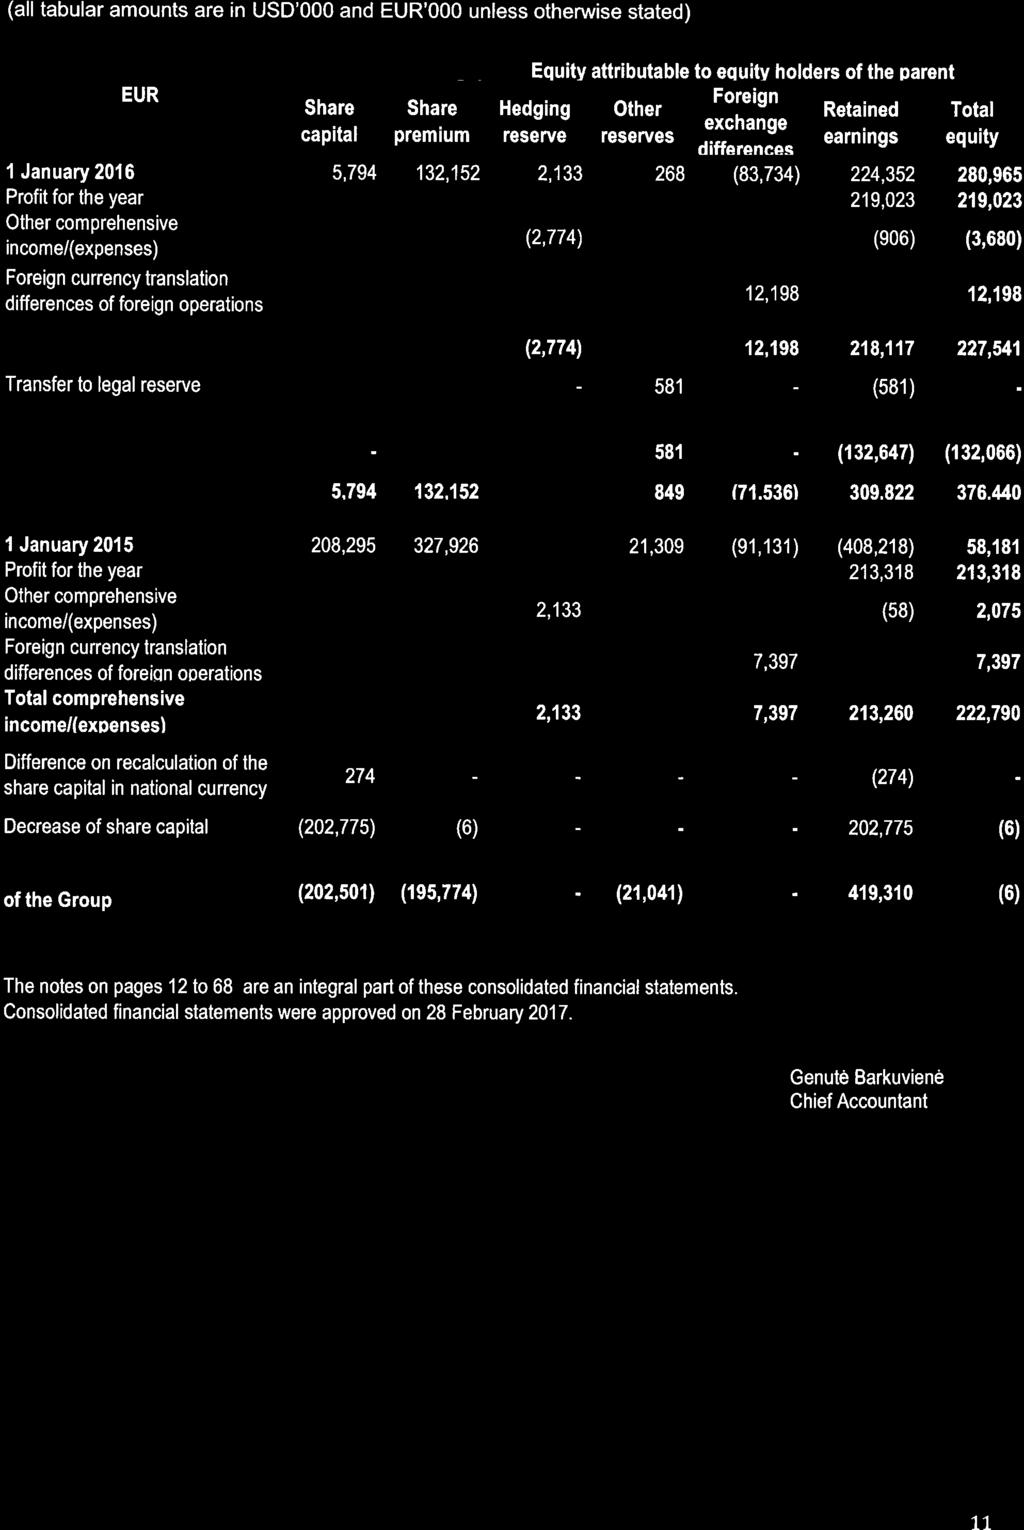
19 Finished goods and work in progress are measured at the end of the reporting period at the lower of cost or net realisable value. Finished goods and work in progress are evaluated based on the weighted average cost of production. Merchandise and raw materials are measured initially at acquisition cost. Merchandise and raw materials are measured at the lower of cost or net realizable value, considering any write-downs for obsolescence. Outgoings of merchandise and raw materials are determined based on the weighted average acquisition cost. Write-down tests for specific items of inventories are carried out on a current basis during a reporting period. Write-down to net realizable value concerns inventories that are damaged or obsolete and the selling price have fallen. Raw materials held for use in the production are not written down below acquisition or production cost if the products in which they will be incorporated are expected to be sold at or above cost. However, when a decline in the price of materials indicates that the cost of the products exceeds net realizable value, the materials are written down to net realizable value. Recognition and reversal of write-down of inventories is recognized in cost of sales. The initial value of inventories is adjusted for profits or losses from settlement of cash flow hedging instruments related to the above mentioned Receivables Receivables, including trade receivables, are recognized initially at fair value and are subsequently measured at amortized cost using the effective interest rate method less impairment allowances. Impairment allowances of receivables are based on an individual analysis of the value of held collaterals, and possible compensation of debts, allowances. Recognition and reversal of impairment allowances of receivables are recognized in other operating activity in relation to principal amount and in financial activities in relation to interest for delayed payments Cash and cash equivalents Cash comprises cash on hand and in a bank account. Cash equivalents are short-term highly liquid investments (of initial maturity up to three months), that are readily convertible to known amounts of cash and which are subject to an insignificant risk of change in value. The Group uses cash concentrated system (cash pool), which is not considered as cash and cash equivalents. The cash pool is presented as receivable or payable amounts Equity Equity and equity related reserves are presented in accounting books by type, in accordance with legal regulations and the Parent company s articles of association Share capital The share capital is equity paid in by shareholders and is stated at nominal value in accordance with the Parent company s articles of association and the entry in the Centre of Registers. 19
20 Share premium Share premium is created by the surplus of the issuance value in excess of the nominal value of shares decreased by issuance costs Foreign exchange differences Foreign exchange differences arise from the translation of the financial statements of foreign operations and from translation of the consolidated financial statements amounts to the additional presentation currency Euro (EUR) Other reserves Additional payments to equity are initially recognized at fair value. According to Lithuanian legislation an annual transfer of 5% of net profit to the legal reserve is compulsory until the reserve reaches 10% of the share capital. The legal reserve cannot be distributed as dividends and is formed to cover future losses Hedging reserve The hedging reserve relates to valuation and settlement of hedging instruments that meet the criteria of cash flow hedge accounting. The Group applies cash flow hedge accounting to hedge commodity risk. Changes in fair value, which are an ineffective part of the hedge relationship, are recognized in profit or loss Retained earnings Movements in retained earnings include: the amounts arising from profit distribution/loss cover, the undistributed result for prior periods, the current period profit/(loss), the effects (profit/loss) of prior period errors, changes in accounting principles, actuarial gains or losses from post-employment benefits, recognized directly to other comprehensive income Liabilities Liabilities, including trade liabilities, are initially stated at fair value increased by transaction cost and subsequently amortized cost using the effective interest rate method Provisions The amount recognized as a provision is the best estimate of the expenditure required to settle the present obligation at the end of the reporting period. The provisions are reviewed at the end of each reporting period and adjusted to reflect the current best estimate. 20
21 Environmental provision The Group creates provisions for future liabilities due to reclamation of contaminated land or water or elimination of harmful substances if there is such a legal or constructive obligation. Environmental provision for reclamation is periodically reviewed based on reports prepared by management. Recognition and reversal of environmental provision are recognized in profit or loss Jubilee bonuses and post-employment benefits Under the Group s remuneration plans employees are entitled to jubilee bonuses, paid to employees after an elapse of a defined number of years in service as well as retirement and pension benefits, paid once at retirement or pension. The amount of retirement and pension benefits as well as jubilee bonuses depends on the number of years in service and an employee s average salary. Provisions are determined by an independent actuary and revalued if there are any indications impacting their value, taking into account the staff turnover and planned growth of wages. Actuarial gains or losses: from post-employment benefits are recognized in other comprehensive income, from other employment benefits, including jubilee bonuses, are recognized in profit and loss CO2 emissions The Group creates provision for the estimated CO 2 emission costs during the reporting period for which the Group recognizes provision in operating activity costs (taxes and charges). Provision is recognized based on the value of allowances recognized in the statement of financial position, taking into account the principle of FIFO. In case of a shortage of allowances, the provision is created based on the purchase price of allowance concluded in forward contracts or market quotations at the reporting date Other provisions Other provisions include mainly provisions for legal proceedings and are recognized after consideration of all available information, including the opinion of independent experts. The Group recognizes provision at the end of the reporting period the Group has an obligation arising from past events that can be reliably estimated and it is probable that fulfilment of this obligation will cause an outflow of resources embodying economic benefits. If it is more likely that no present obligation exists at the end of the reporting period, the Group discloses a contingent liability, unless the possibility of an outflow of resources embodying economic benefits is remote Sales revenues Revenues from sales of finished goods, merchandise, materials and services are recognized when the amount of revenue can be measured reliably, it is probable that the economic benefits associated with the sale transaction will flow to the Company and the costs incurred or to be incurred in respect of the transaction can be measured reliably. Revenues from sale of finished goods, merchandise, and raw materials are recognized when the Company has transferred to the buyer the significant risks and rewards of ownership of the goods and the Company retains neither continuing managerial involvement to the degree usually associated with ownership nor effective control over the goods sold. Revenues include received or due payments for delivered goods and services, decreased by the amount of any trade discounts, value added tax (VAT), excise tax and fuel charges. 21
22 Revenues from the sale are adjusted for profits or losses from settlement of cash flows hedging instruments related to the above mentioned revenues Costs Cost of sales comprises costs of finished goods, merchandise and raw materials sold and adjustments related to inventories written down to net realizable value. Costs are adjusted for profits or losses from settlement of cash flow hedging instruments related to the above mentioned costs. Distribution expenses include selling brokerage expenses, trading expenses, advertising and promotion expenses as well as distribution expenses. Administrative expenses include expenses relating to management and administration of the Group as a whole Income tax expenses Income tax expense comprises current tax and deferred tax. Current tax expense is determined in accordance with the relevant tax law based on the taxable profit for a given period and is recognized as a liability, in the amount which has not been paid or received, if the amount of the current and prior periods income tax paid exceeds the amount due to the excess is recognized. Deferred tax assets and liabilities are offset on the level of separate statements of the Group entities Consolidated statement of cash flows The Group has chosen the presentation within the statement of cash flows and applied the following rules: Cash flows from operating activities using the indirect method, The components of cash and cash equivalents in the consolidated statement of cash flows and consolidated statement of financial position are the same, Dividends received are presented in cash flows from investing activities, Dividends paid to shareholders of the Parent company are presented in cash flows from financing activities, Interest received due to financial finance leases, loans and cash pooling system (cash pool) are presented in cash flows from investing activities, other interest received are presented in cash flows from operating activities, Interest and commissions paid on bank loans received, debt securities issued, finance leases are presented in cash flows from financing activities, other interest paid is presented in cash flows from operating activities, Inflows and outflows from the settlement of derivative financial instruments, which are not recognized as a hedging positions are presented in investing activities Financial instruments Measurement of financial assets and liabilities When a financial asset or liability is recognized initially, the Group measures it at its fair value plus, in the case of a financial asset or a financial liability not at fair value through profit or loss, 22
23 transaction costs that are directly attributable to the acquisition or issue of the financial asset or financial liability. At the end of the reporting period, the Group measures item of financial assets and liabilities at amortised cost using effective interest rate method, except for derivatives, which are measured at fair value. Gains and losses resulting from changes in fair value of derivative instruments, for which hedge accounting is not applicable, are recognized in the current year profit or loss Hedge accounting Starting from 1 July 2015 the Parent Company has applied hedge accounting in relation to commodity swaps on crude oil and products. Consequently, the result of commodity swaps for transactions after 1-st of July settlement is included in operating activity of the statement of profit or loss and other comprehensive income. The valuation of commodity swap transactions is included in the statement of financial position as hedging reserve. Derivatives designated as hedging instruments whose cash flows are expected to offset changes in the cash flows of a hedged item are accounted for in accordance with the cash flow hedge accounting. The Group assesses effectiveness of cash flow hedge at the inception of the hedge and later, at minimum, at each reporting date. In case of cash flow hedge accounting, the Group recognizes in other comprehensive income part of profits and losses connected with the effective part of the hedge, whereas profits and losses connected with the ineffective part under profit or loss. The Group uses statistical methods, in particular regression analysis, to assess effectiveness of the hedge. If a hedge of a forecast transaction results in the recognition of a financial asset or a financial liability, the associated gains or losses that were recognised in other comprehensive income are reclassified to profit or loss in the same period or periods during which the asset acquired or liability assumed affect profit or loss. However, if the Group expects that all or a portion of a loss recognised in other comprehensive income will not be recovered in one or more future periods, it reclassifies the amount that is not expected to be recovered to profit or loss. If a hedge of a forecast transaction results in the recognition of a non-financial asset or a nonfinancial liability, or a forecast transaction for a non-financial asset or non-financial liability becomes a firm commitment for which fair value hedge accounting is applied, the Group removes the associated gains and losses that were recognised in the other comprehensive income and includes them in the initial cost or other carrying amount of the asset or liability. If a hedge of a forecast transaction results in the recognition of revenue from sales of products, merchandise, materials or services, the Group removes the associated gains or losses that were recognised in the other comprehensive income and adjusts these revenues Fair value measurement The Group maximizes the use of relevant observable inputs and minimize the use of unobservable inputs to meet the objective of a fair value measurement, which is to estimate the price at which an 23
24 orderly transaction to transfer the liability or equity instrument would take place between market participants as at the measurement date under current market conditions. The Group measures derivative instruments at fair value using valuation models for financial instruments based on generally available exchange rates, interest rates, forward and volatility curves, for currencies and commodities quoted on active markets. The fair value of derivatives is based on discounted future flows related to contracted transactions as the difference between term prices and transaction price. Derivative instruments are presented as assets, when their valuation is positive and as liabilities, when their valuation is negative Contingent assets and contingent liabilities The Group discloses at the end of reporting period information on contingent assets if the inflow of economic benefits is practically certain. If it is practicable the Group estimates the financial impact of contingent assets valuing them according to the principles of valuation provisions. The Group discloses at the end of reporting period information on contingent liabilities if the outflow of economic benefits is possible, unless the possibility of outflows of economic benefits is remote. 3. The Management estimates and assumptions The preparation of consolidated financial statements in accordance with IFRSs as adopted by the EU requires the Management to make judgments, estimates and assumptions that affect the adopted methods and reported amounts of assets, liabilities and equity, revenue and expenses. The estimates and related assumptions are based on historical expertise and other factors regarded as reliable in given circumstances and their effects provide grounds for expert assessment of the carrying amount of assets and liabilities which is not based directly on any other factors. In the matters of considerable weight, the Management might base its estimates on opinions of independent experts. The estimates and related assumptions are reviewed on regular basis. Changes in accounting estimates are recognized in the period when they are made only if they refer to that period or in the present and future periods if they concern both the present and future periods. Actual results may differ from the estimated values. Judgments, which have a significant impact on carrying amounts recognized in the consolidated financial statements, were disclosed in the following notes: Financial instruments classification, methods of fair value measurement concerning financial instruments, nature and extent of risks related to financial instruments (Note 23). The Management classifies the financial instruments depending on the purpose of the purchase and nature of the instrument. The fair value of financial instruments is measured using common practiced valuation models. Details of the applied estimates and sensitivity analysis have been presented in the above note. Estimates and assumptions, which have a significant impact on carrying amounts recognized in the consolidated financial statements, were disclosed in the following notes: Impairment of property, plant and equipment and intangible assets (Note 4 and Note 5). The Management assesses, if there is an objective indicator for impairment of assets or CGU. If 24
25 there is an indicator for impairment the Group assesses the recoverable amount of an asset or cash generating units by determining higher of fair value less cost to sell or value in use by applying the proper discount rate. Estimated economic useful lives of property, plant and equipment and intangible assets (Note 4 and Note 5). As described in Note and the Group verifies economic useful lives of property, plant and equipment and intangible assets at least once a year. Provisions. As described in Note , recognition of provisions requires estimate of the probable outflow of economic benefits and defining the best estimate of the expenditure required to settle the present obligation at the end of reporting period. Details of applied estimates and their influence on the foregoing consolidated financial statements are disclosed in Note 15. Contingent liabilities (Note 24.2). As described in Note , disclosing of contingent liabilities requires estimate of the probable outflow of economic benefits and defining the best estimate of the expenditure required to settle the present and possible obligation at the end of reporting period. Utilization of deductible temporary differences and recognition of deferred tax assets (Note 22). As described in Note , deferred tax assets are recognized to the extent that it is probable that taxable profit will be available against which the deductible temporary differences could be utilized. 4. Property, plant and equipment 31/12/ /12/ /12/ /12/2015 Buildings and constructions 4,830 4,620 4,642 4,249 Machinery and equipment 124, , , ,824 Vehicles and other 28,625 27,384 26,532 24,283 Construction in progress 10,765 10,299 8,284 7,582 Total 168, , , ,938 25
26 USD Land Buildings and constructions Machinery and equipment Vehicles and other Construction in progress Acquisition costs 1 January ,976 1,576,620 77,251 28,843 1,756,691 Investment expenditures ,284 6,005 7,224 23,517 Reclassifications ,118 (1,727) (5,645) (2,860) Sales - - (23) (3) (369) (395) Liquidation - - (527) (3,486) (914) (4,927) Foreign exchange differences - - (20) (52) - (72) 31 December ,374 1,590,452 77,988 29,139 1,771,954 Accumulated depreciation and impairment allowances 1 January ,334 1,455,533 50,719 20,559 1,596,146 Depreciation ,021 2,826-14,011 Impairment allowances, net (791) (2,185) (2,719) Reclassifications - - (456) (592) - (1,048) Sales - - (23) (3) - (26) Liquidation - - (517) (2,744) - (3,261) Foreign exchange differences - - (18) (52) - (70) 31 December ,544 1,465,751 49,363 18,374 1,603,033 Total Acquisition costs 1 January ,968 1,564,281 85,929 33,714 1,757,893 Investment expenditures - - 8,141 9,387 3,338 20,866 Reclassifications - 8 5, (7,924) (2,768) Sales (46) - (46) Liquidation - - (831) (16,954) (285) (18,070) Other decreases (1,000) - (1,000) Foreign exchange differences - - (50) (134) - (184) 31 December ,976 1,576,620 77,251 28,843 1,756,691 Accumulated depreciation and impairment allowances 1 January ,171 1,446,090 67,009 23,128 1,605,399 Depreciation ,292 1,628-12,082 Other increases Impairment allowances, net (2,302) (2,569) (4,393) Reclassifications - - (465) (78) - (543) Sales (29) - (29) Liquidation - - (812) (15,391) - (16,203) Foreign exchange differences - - (50) (118) - (168) 31 December ,334 1,455,533 50,719 20,559 1,596,146 Carrying amounts 1 January , ,087 26,532 8, , December , ,701 28,625 10, ,921 1 January , ,191 18,920 10, , December , ,087 26,532 8, ,545 26
27 EUR Land Buildings and constructions Machinery and equipment Vehicles and other Construction in progress Acquisition costs 1 January ,706 1,442,998 70,704 26,398 1,607,807 Investment expenditures - 4 9,344 5,476 6,043 20,867 Reclassifications ,713 (1,617) (5,100) (2,635) Sales - - (21) (1) (340) (362) Liquidation - - (479) (3,094) (815) (4,388) Foreign exchange differences - 3,071 65,972 3,141 1,690 73, December ,150 1,521,527 74,609 27,876 1,695,163 Accumulated depreciation and impairment allowances 1 January ,457 1,332,174 46,421 18,816 1,460,869 Depreciation ,961 2,557-12,667 Impairment allowances, net (708) (1,979) (2,448) Reclassifications - - (406) (546) - (952) Sales - - (21) (2) - (23) Liquidation - - (469) (2,424) - (2,893) Foreign exchange differences - 2,881 60,795 1, , December ,530 1,402,230 47,225 17,577 1,533,563 Total Acquisition costs 1 January ,812 1,286,065 70,646 27,718 1,445,242 Investment expenditures - - 7,401 8,527 3,046 18,974 Reclassifications - 7 4, (7,075) (2,485) Sales (43) - (43) Liquidation - - (747) (15,168) (259) (16,174) Other decreases (889) - (889) Foreign exchange differences - 6, ,734 7,593 2, , December ,706 1,442,998 70,704 26,398 1,607,807 Accumulated depreciation and impairment allowances 1 January ,869 1,188,894 55,091 19,015 1,319,870 Depreciation ,279 1,460-10,885 Impairment allowances, net (2,062) (2,333) (3,957) Reclassifications - - (416) (71) - (487) Sales (26) - (26) Liquidation - - (730) (13,762) - (14,492) Foreign exchange differences - 6, ,709 5,791 2, , December ,457 1,332,174 46,421 18,816 1,460,869 Carrying amounts 1 January , ,824 24,283 7, , December , ,297 27,384 10, ,600 1 January ,943 97,171 15,555 8, , December , ,824 24,283 7, ,938 In 2016, reclassifications of property, plant and equipment with the carrying amount of USD 1,812 thousand or EUR 1,683 thousand were made: reclassified to non-current assets held for sale of USD 1,188 thousand or EUR 1,120 thousand, reclassified to inventories of USD 35 thousand or EUR 31 thousand and reclassified to intangible assets of USD 589 thousand or EUR 532 thousand. In 2015, reclassifications of property, plant and equipment with the carrying amount of USD 2,225 thousand or EUR 1,998 thousand were made: reclassified to non-current assets held for sale of USD 1,520 thousand or EUR 1,368 thousand, reclassified to inventories of USD 1,017 thousand or 27
28 EUR 907 thousand and reclassified from intangible assets of USD 312 thousand or EUR 277 thousand. Change in property, plant and equipment impairment: USD Land Buildings and constructions Machinery and equipment Vehicles and other Construction in progress 1 January , ,728 13,955 20, ,120 Recognition Reversal (153) (619) (772) Reclassifications (173) (578) (673) Sale and liquidation - - (10) (476) (988) (1,474) 31 December , ,939 13,164 18, ,401 increase/(decrease) net (791) (2,185) (2,719) 1 January , ,250 16,257 23, ,513 Recognition Reversal (1,000) (153) (1,153) Reclassifications (4) (2,850) (2,358) Sale ans liquidation - - (18) (1,298) (183) (1,499) 31 December , ,728 13,955 20, ,120 increase/(decrease) net (2,302) (2,569) (4,393) Total EUR Land Buildings and constructions Machinery and equipment Vehicles and other Construction in progress 1 January , ,560 12,773 18, ,410 Recognition Reversal (137) (580) (717) Reclassifications (159) (520) (610) Sale and liquidation - - (9) (423) (878) (1,310) Foreign exchange differences - 1,280 29, , December , ,652 12,593 17, ,406 increase/(decrease) net (709) (1,978) (2,448) 1 January , ,971 13,366 19, ,738 Recognition Reversal (890) (140) (1,030) Reclassifications (3) (2,584) (2,132) Sale and liquidation - - (17) (1,169) (166) (1,352) Foreign exchange differences - 2,874 67,151 1,469 2,135 73, December , ,560 12,773 18, ,410 increase/(decrease) net (2,062) (2,333) (3,957) Other information connected with property, plant and equipment Total The acquisition costs of all fully depreciated property, plant and equipment still in use The carrying amounts of idle property, plant and equipment and not clasified as held for sale 31/12/ /12/ /12/ /12/ , ,165 89,953 82,
29 5. Intangible assets 31/12/ /12/ /12/ /12/2015 Software 1,590 1,521 1,196 1,095 Licenses, patents and similar assets Total 1,600 1,530 1,198 1,097 USD Software Licenses, patents and similar assets Emission rights Research and development Acquisition costs 1 January ,455 7, ,233 Investment expenditures Acquisitions - - 2,191-2,191 Granted CO2 free of charge - - 7,157-7,157 Reclassifications Other decreases (12) (12) Utilisation - - (9,348) - (9,348) Foreign exchange differences (5) (5) 31 December ,295 8, ,558 Accumulated amortization and impairment allowances 1 January ,259 7, ,035 Amortization Impairment allowances, net Reclassifications 20 (20) Foreign exchange differences (6) (6) 31 December ,705 8, ,958 Acquisition costs 1 January ,490 6, ,270 Investment expenditures 295 1, ,295 Acquisitions - - 1,235-1,235 Granted CO2 free of charge ,096-11,096 Reclassifications (312) (312) Liquidation (3) (3) Utilisation - - (12,331) - (12,331) Foreign exchange differences (15) (2) - - (17) 31 December ,455 7, ,233 Accumulated amortization and impairment allowances 1 January ,974 6, ,701 Amortization Impairment allowances, net 1 1, ,030 Liquidation (3) (3) Foreign exchange differences (15) (1) - - (16) 31 December ,259 7, ,035 Carrying amounts 1 January , , December , ,600 Total 1 January , , December , ,198 29
30 EUR Software Licenses, patents and similar assets Emission rights Research and development Acquisition costs 1 January ,976 6, ,095 Investment expenditures Acquisitions - - 1,932-1,932 Granted CO2 free of charge - - 6,454-6,454 Reclassifications Other decreases (11) (11) Utilisation - - (8,245) - (8,245) Foreign exchange differences (141) December ,501 7, ,406 Accumulated amortization and impairment allowances 1 January ,881 6, ,998 Amortization Impairment allowances, net Reclassifications 18 (18) Foreign exchange differences , December ,980 7, ,876 Acquisition costs 1 January ,379 5, ,953 Investment expenditures ,155 Acquisitions - - 1,148-1,148 Granted CO2 free of charge - - 9,774-9,774 Reclassifications (277) (277) Liquidation (3) (3) Utilisation - - (11,456) - (11,456) Foreign exchange differences 1, , December ,976 6, ,095 Accumulated amortization and impairment allowances 1 January ,133 5, ,663 Amortization Impairment allowances, net Liquidation (3) (3) Foreign exchange differences 1, , December ,881 6, ,998 Carrying amounts 1 January , , December , ,530 Total 1 January , , December , ,097 30
31 Change in impairment of intangible assets: USD Software Licenses, patents and similar assets Research and development 1 January ,461 1, ,358 Reclassifications December ,465 2, ,858 increase/(decrease) net January , ,328 Recognition Reclassifications 1 1,000-1, December ,461 1, ,358 increase/(decrease) net 1 1, ,030 Total EUR Software Licenses, patents and similar assets Research and development 1 January ,168 1, ,904 Reclassifications Foreign exchange differences December ,315 2, ,604 increase/(decrease) net January , ,558 Recognition Reclassifications Foreign exchange differences December ,168 1, ,904 increase/(decrease) net Other information regarding intangible assets Total The acquisition costs of all fully amortized intangible assets still in use 31/12/ /12/ /12/ /12/ ,262 12,687 11,064 10,126 Rights Change in CO 2 emission rights (EUA) in 2016: Quantity (in tonnes) USD EUR As at 1 January Granted free of charge 1,359,259 7,157 6,454 Settled emission for 2015 (1,755,789) (9,348) (8,245) Purchase 396,530 2,191 1,932 Foreign exchange differences - - (141) As at 31 December Emission in ,830,354 12,284 11,068 Shortage (1,830,354) (12,284) (11,068) 31
32 The quantity of CO2 emission rights as at 31 December 2016 is not audited. The Parent company will receive emission allowances for 2017 in quantity of 1.3 MM tonnes. The missing part will be purchased. Change in CO 2 emission rights (EUA) in 2015: Quantity (in tonnes) USD EUR As at 1 January Granted free of charge 1,385,117 11,096 9,774 Settled emission for 2014 (1,631,285) (12,331) (11,456) Purchase 246,168 1,235 1,148 Foreign exchange differences As at 31 December Emission in ,761,329 13,690 12,333 Shortage (1,761,329) (13,690) (12,333) As at 31 December 2016 and 31 December 2015 the market value of one EUA amounted to 6.84 USD or 6.54 EUR and amounted 8.98 USD or 8.22 EUR, respectively. 6. Investments in equity-accounted investees 31/12/ /12/ /12/ /12/ January 1,771 1,621 1,858 1,527 Share of net profit /(loss) Dividends (150) (132) (65) (59) Foreign exchange differences (69) - (190) 1 As at 31 December 1,637 1,566 1,771 1,621 Investments in associates represent an investment of a 34% interest in Naftelf UAB, incorporated in Lithuania. In 2016 the Parent Company received dividends by amount USD 150 thousand or EUR 132 thousand (as at 31 December 2015: USD 65 thousand or EUR 59 thousand) under Resolution of shareholders of Naftelf UAB. Condensed financial data comprising total assets and liabilities as at 31 December 2016 and 31 December 2015, revenues, financial expenses and profit for 2016 and 2015 in Naftelf UAB are disclosed below. 31/12/ /12/ /12/ /12/2015 Non-current assets Current assets 4,338 4,150 4,748 4,346 Equity 4,814 4,605 5,208 4,767 Current liabilities
33 for the year ended for the year ended 31/12/ /12/ /12/ /12/2015 Sales revenues 13,195 11,923 20,353 18,478 Profit/(loss) from operations Profit/(loss) before tax Tax expense (50) (45) (102) (94) Net profit/(loss) Other non-current assets Note 31/12/ /12/ /12/ /12/2015 Loans granted Other non-current receivables 23 1,673 1,601 1,214 1,111 Financial assets 1,725 1,651 1,294 1,184 Non-current prepayment Total non-financial assets As at 31 December 2,380 2,279 1,323 1, Impairment of non-current assets At the end of each reporting period the Group is performing testing of assets value in use. As at 31 December 2016 the impairment test of intangible assets and property, plant and equipment for ORLEN Lietuva Group was performed. The impairment test was conducted based on the Group s Budget for 2017, Strategy and Mid-term Plan for approved by the Board and after the period of financial projections a constant growth rate of cash flows was adopted estimated at the level of long-term inflation. For the purpose of impairment testing of property, plant and equipment and intangible assets, the periods of analysis for each cash-generating unit were based on the expected useful life. The calculated value in use is not suggesting any significant reversal or additional impairment of recognized impairment. The discount rate structure used in the impairment testing of assets by cash-generating unit of the Group as at 31 December 2016 Refining Cost of equity 15,26% Cost of debt after tax Capital structure 4,27% 62,4% Debt structure 37,6% Nominal discount rate 11,13% Long term rate of inflation* 1,84% Tax rate 15,00% *Group assume that long-term growth to be in line with long term rate of inflation. Cost of equity is determined by the profitability of the government bonds that are considered to be risk-free, with the level of market and operating segment risk premium (beta). Cost of debt includes the average level of credit margins and expected market value of money for each country. For the purpose of impairment testing of property, plant and equipment and intangible assets, the periods 33
34 of analysis performed on the basis of the expected useful life of Refining segment. The useful life adopted for the analysis of the Refining segment as of 31 December 2016 was 23 years. As at 31 December 2016 the Group did not identify any impairment indications and any indications of reversal of impairment in relation to intangible assets and property, plant and equipment of the Group. 9. Inventories 31/12/ /12/ /12/ /12/2015 Raw materials 97,637 93,406 70,608 64,624 Work in progress 20,869 19,964 16,265 14,886 Finished goods 102,934 98,474 69,404 63,522 Goods for resale 1,347 1,289 1,964 1,797 Spare parts 19,834 18,975 19,328 17,690 Inventories, net 242, , , ,519 Write-down of inventories to the net realizable value 15,617 14,940 23,797 21,780 Inventories, gross 258, , , ,299 Change in write-down of inventories to realizable net value Note for the year ended for the year ended 31/12/ /12/ /12/ /12/2015 January 1 23,797 21,780 64,690 53,185 Recognition 19 1,505 1,412 7,366 6,783 Utilization (8,935) (8,196) (47,141) (40,047) Foreign exchange differences ,249 Write-down of inventories excluding spare parts (7,367) (6,742) (39,775) (32,015) Recognition Reversal 19 (1,307) (1,171) (666) (611) Utilization (40) (36) (785) (713) Foreign exchange differences ,633 Write-down of spare parts for obsolescence (813) (98) (1,118) 610 As at 31 December 15,617 14,940 23,797 21,780 As at 31 December 2016 the Group inventory includes state fuel reserve of USD 88,372 thousand or EUR 84,542 thousand (as at 31 December 2015: USD 77,085 thousand or EUR 70,552 thousand). 34
35 10. Trade and other receivables Note 31/12/ /12/ /12/ /12/2015 Trade receivables 159, ,579 89,426 81,847 Financial assets , ,579 89,426 81,847 Other taxation, duty, social security receivables and other benefits Deferred insurance costs 9,987 9,555 9,482 8,678 Accrued income and deferred charges Other Non-financial assets 11,372 10,879 11,716 10,722 Receivables, net 170, , ,142 92,569 Receivables impairment allowance 7,572 7,245 6,408 5,865 Receivables, gross 178, , ,550 98,434 As at 31 December 2016 and 31 December 2015 trade and other receivables denominated in functional currencies amounted to USD 59,062 thousand or EUR 56,502 thousand and USD 45,290 thousand or EUR 41,452 thousand, respectively. Detailed information about receivables from related parties is disclosed in Note Detailed information of financial assets denominated in foreign currencies is presented in Note Change in impairment allowances of trade and other receivables Note 31/12/ /12/ /12/ /12/ January 6,408 5,865 6,956 5,719 Recognition Reversal 20.1 (472) (430) (20) (18) Reclassification 1,936 1, Other increases/decreases (257) (238) (20) (18) Foreign exchange differences (384) (37) (537) 156 As at 31 December 7,572 7,245 6,408 5, Other financial assets Note 31/12/ /12/ /12/ /12/2015 Cash flow hedge instruments 2,537 2,427 2,331 2,133 commodity swaps 23 2,537 2,427 2,331 2,133 Deposits ,256 2,065 Loans granted Receivables from cash pool , , ,299 99,120 Receivables on settled cash flow hedge instruments 23 3,752 3,589 6,443 5,897 As at 31 December 215, , , ,239 As at 31 December 2016 the Group had short term deposits of USD 563 thousand or EUR 539 thousand (as at 31 December 2015 USD 2,256 thousand or EUR 2,065 thousand). The use of 35
36 these funds was restricted by banks as collateral for the proper performance of contract or legal obligations. 12. Cash and cash equivalents Note 31/12/ /12/ /12/ /12/2015 Cash on hand and in bank 23 4,584 4,386 1, December 4,584 4,386 1, The Group did not have restricted cash as at 31 December 2016 or as at 31 December Share capital In January 2015, the nominal value of one share of the Parent Company was changed from EUR 0.29 to EUR 36 and number of share was reduced from 719,200,800 to 5,793,562 shares. In February 2015, share capital of the Parent Company was reduced from EUR 208,568,232 to EUR 5,793,562 by changing nominal value of one share from EUR 36 to EUR 1. The purpose of the reduction of the authorized capital of the Parent Company to cancel the losses recorded in the balance sheet of the Parent Company. In April 2015 PKN ORLEN S.A. the sole shareholder of Parent Company, approved the profit (loss) appropriation, making decision to cover of accumulated losses from share capital, share premium and other reserves. The holders of ordinary shares are entitled to receive dividends as declared from time to time, and are entitled to one vote per share at meetings of the Parent company. The sole shareholder of the Parent company is PKN ORLEN S.A., controlling 100 % shares. In 2016 Parent company paid dividends amounting USD 150,000 thousand or EUR 132,066 thousand to the shareholders. In 2015 the Parent company did not pay any dividends to the shareholders. 14. Loans and borrowings Note 31/12/ /12/ /12/ /12/2015 Bank loans ,954 12,771 Current loans ,954 12,771 Total bank loans ,954 12,771 The Group financing is based on floating interest rate. Depending on the currency of financing there are LIBOR, EURIBOR, EONIA and plus a margin. Margin reflects the risks associated with the financing of the Group By currency Note 31/12/ /12/ /12/ /12/2015 USD - - 5,314 4,863 EUR - - 8,640 7,908 Total ,954 12,771 36
37 By interest rate Note 31/12/ /12/ /12/ /12/2015 EURIBOR - - 4,526 4,142 LIBOR - - 5,314 4,863 EONIA - - 4,114 3,766 Total ,954 12, Provisions Non-current Current Total USD 31/12/ /12/ /12/ /12/ /12/ /12/2015 Environmental provision 2,560 2, ,192 3,391 Post employment benefits provision 1,631 2, ,707 2,163 Business risk provision ,362 11,745 17,362 11,745 Restructuring provision Provision for CO2 emission ,284 15,420 12,284 15,420 As at 31 December 4,191 4,440 30,354 28,322 34,545 32,762 Non-current Current Total EUR 31/12/ /12/ /12/ /12/ /12/ /12/2015 Environmental provision 2,449 2, ,054 3,103 Post employment benefits provision 1,560 1, ,633 1,980 Business risk provision ,609 10,749 16,609 10,749 Restructuring provision Provision for CO2 emission ,752 14,113 11,752 14,113 As at 31 December 4,009 4,064 29,039 25,920 33,048 29,984 As at 31 December 2016 and 31 December 2015 the business risk provision amounting to USD 561 thousand or EUR 536 thousand and USD 2,224 thousand or EUR 2,036 thousand respectively is secured by the Group s deposit. Change in provisions in 2016 USD Post employment benefits Business risk Environmental Restructuring Provision for CO2 1 January ,391 2,163 11, ,420 32,762 Recognition 1,006-7, ,284 21,020 Usage (1,051) (10) (29) (55) (9,348) (10,493) Reversal (26) (1,316) (1,978) (1) (6,072) (9,393) Accounted from equity Foreign exchange differences (128) (94) (93) - - (315) As at 31 December ,192 1,707 17,362-12,284 34,545 Total 37
38 EUR Post employment benefits Business risk Provision for CO2 1 January ,103 1,980 10, ,113 29,984 Recognition 926-7, ,068 19,306 Usage (962) (9) (27) (49) (8,244) (9,291) Reversal (25) (1,248) (1,782) (1) (5,356) (8,412) Accounted from equity Foreign exchange differences 12 (4) As at 31 December ,054 1,633 16,609-11,752 33,048 Change in provisions in 2015 USD Post employment benefits Business risk Provision for CO2 1 January ,166 2,198 2,644 2,229 14,061 24,298 Recognition 1, ,506-13,690 24,663 Usage (784) (3) (18) (541) (12,331) (13,677) Reversal - - (132) (1,638) - (1,770) Accounted from equity Foreign exchange differences (323) (223) (255) (7) - (808) As at 31 December ,391 2,163 11, ,420 32,762 Total Total EUR Post employment benefits Business risk Environmental Restructuring Environmental Restructuring Environmental Restructuring Provision for CO2 1 January ,603 1,807 2,174 1,833 11,560 19,977 Recognition 1, ,616-12,333 22,267 Usage (710) (3) (15) (493) (11,456) (12,677) Reversal - - (123) (1,475) - (1,598) Accounted from equity Foreign exchange differences 17 (4) ,676 1,960 As at 31 December ,103 1,980 10, ,113 29, Environmental provision The Parent company has legal obligation to clean contaminated land-water environment in the area of production plant in Mažeikiai. The operation of the refinery causes pollution. A provision was recognized for the costs to be incurred for handling of waste and contaminated land which was accumulated before the end of According to the waste treatment plan agreed with the Ministry of Environment of the Republic of Lithuania, the Parent company is required to clean up all contamination that it causes. The amount of the provisions is the best estimate of the Management based on evaluation of the remaining quantities and average level of costs necessary to remove contamination. The potential future changes in regulation and common practice regarding environmental protection may influence the value of this provision in the future periods Provision for jubilee bonuses and post-employment benefits The Group realizes the program of paying out the post-employment benefits, which includes retirement and pension benefits in line with remuneration systems in force as well as other postemployment benefits. Provisions for post-employment benefits are calculated individually for each entitled individual. The base for the calculation of provision for an employee is expected benefit Total 38
39 which the Group is obliged to pay in accordance with Labour Code of the country. The retirement (pension) benefits are paid once at retirement (pension). The amount of retirement and pension benefits depends on the number of years of service and an employee s remuneration. The present value of these obligations is estimated at the end of each reporting year by an independent actuary. The provision amount equals discounted future payments, considering employee rotation and relate to the period ended at the last day of the reporting year. Change in jubilee bonuses and post-employment benefits in 2016 Note Jubilee bonuses Post-employment Total USD EUR 1 January ,148 1,966 2,163 1,980 Current service costs Interest expense Actuarial gains and losses recognized in Other Comprehensive Income net demographic assumptions financial assumptions experience adjustment Actuarial gains and losses recognized in Profit and loss (14) (14) - - (14) (14) net other 19 (14) (14) - - (14) (14) Payments under program (10) (9) (10) (9) Recognized past service cost (1,480) (1,403) (1,480) (1,403) Exchange differences (1) - (92) (12) (93) (12) As at 31 December ,707 1,633 1,707 1,633 Change in jubilee bonuses and post-employment benefits in 2015 Note Jubilee bonuses Post-employment Total USD EUR 1 January ,182 1,793 2,198 1,807 Current service costs Interest expense Actuarial gains and losses recognized in Other Comprehensive Income net demographic assumptions - - (29) (29) (29) (29) financial assumptions experience adjustment Actuarial gains and losses recognized in Profit and loss (1) (1) - - (1) (1) net experience adjustment 19 (1) (1) - - (1) (1) Payments under program (3) (3) (3) (3) Exchange differences (1) - (222) (4) (223) (4) As at 31 December ,148 1,966 2,163 1,980 The carrying amount of employment benefits liabilities is identical to their present value as at 31 December 2016 and 31 December
40 Division of liabilities for employee benefits for active employees Active employees Active employees 31/12/ /12/ /12/ /12/2015 Lithuania 1,707 1,633 2,148 1,966 Latvia Estonia Total 1,707 1,633 2,163 1,980 Geographical division of employee benefits obligations in 2016 Active employees 31/12/ /12/2016 USD EUR Lithuania 1,707 1,633 Latvia - - Estonia - - Total 1,707 1,633 Geographical division of employee benefits obligations in 2015 Provision for jubilee Post-employment Total 31/12/ /12/ /12/ /12/ /12/ /12/2015 USD EUR Lithuania - - 2,148 1,966 2,148 1,966 Latvia Estonia Total ,148 1,966 2,163 1,980 Analysis of sensitivity to change in actuarial assumptions For the Group entities, in order to update the provision for employee benefits as at 31 December 2016, the Group used the following actuarial assumptions: discount rate of 0.85 %; inflation rate 1.2% in 2017 and 2.2% in following years and the remuneration increase rate 0% in and 2.5 % in the following years. 40
41 Demographic assumptions (+) Assumed variations 31/12/2016 Influence on postemployment benefits 2016 USD EUR staff turnover rates, disability and early retirement 0.5 p.p. (93) (89) Financial assumptions (+) discount rate 0.5 p.p. (111) (106) level of future remuneration 0.5 p.p Total (122) (117) Demographic assumptions (-) staff turnover rates, disability and early retirement -0.5 p.p Financial assumptions (-) discount rate -0.5 p.p level of future remuneration -0.5 p.p. (72) (69) Total Demographic assumptions (+) Assumed variations 31/12/2015 Influence on postemployment benefits Influence on provision for jubilee staff turnover rates, disability and early retirement 0,5 p.p. (1) (1) (105) (96) Financial assumptions (+) discount rate 0,5 p.p (1) (1) (120) (110) level of future remuneration 1 p.p Total (2) (2) Demographic assumptions (-) staff turnover rates, disability and early retirement -0.5 p.p Financial assumptions (-) discount rate -0.5 p.p level of future remuneration -1 p.p. - - (239) (219) Total The Group implements employee benefit payments from current resources. There are no financing programs, or contributions to fund obligations. Analysis of liabilities and payment terms for employee benefits as at 31 December 2016 Post-employment Total up to 1 year from 1 to 3 years from 3 to 5 years above 5 years 1,384 1,324 1,384 1,324 1,707 1,633 41
42 Analysis of liabilities and payment terms for employee benefits as at 31 December 2015 Provision for jubilee Post-employment Total USD EUR up to 1 year from 1 to 3 years from 3 to 5 years above 5 years 6 5 1,658 1,517 1,664 1,522 2,163 1,980 The weighted average duration of liabilities for post-employment benefits (in years) 31/12/ /12/2015 Lithuania Latvia - 1 Estonia - 20 Not discounted future cash flow of employee benefits payments as at 31 December 2016 Post-employment Total up to 1 year from 1 to 3 years from 3 to 5 years above 5 years 3,092 2,958 3,092 2,958 3,451 3,301 Not discounted future cash flow of employee benefits payments as at 31 December 2015 Provision for jubilee Post-employment Total USD EUR up to 1 year from 1 to 3 years from 3 to 5 years above 5 years ,158 5,636 6,198 5,672 6,799 6,223 Total costs recognized in profit or loss and other comprehensive income for the year ended for the year ended 31/12/ /12/ /12/ /12/2015 In profit and loss Current service costs Interest expense Resulting from other issues (14) (14) (1) (1) Payments under program (10) (9) (3) (3) Recognized past service cost (1,480) (1,403) - - Total (1,326) (1,256) In components of other comprehensive income demographic assumptions (29) (29) financial assumptions experience adjustment In 2016, the amount of provision for employee benefits changed as the result of the update of assumptions, mainly in discount rate, as well as projected inflation. Should the prior year 42
43 assumptions be used, the provision for the employee benefits would be lower by USD 151 thousand or EUR 144 thousand. On the basis of existing legislation, the Group is obliged to pay contributions to the national pension insurance. These expenses are recognized as employee benefit costs. The Group has no other obligations in this respect Business risk provision Business risk is described in more detail in Note 25 concerning significant legal proceedings Restructuring provision The restructuring provision was created in 2014 for the Group s restructuring process. The provision represented a reduction in the number of employees. The plan was implemented mainly in 2015 and finished implementing in The restructuring plan for 2017 was not created Provision for CO 2 emission The Parent company recognizes provision for estimated CO 2 emissions in the reporting period. The cost of recognized provision in the consolidated statement of profit or loss is compensated with settlement of deferred income on CO 2 emission allowance granted free of charge. 16. Trade and other liabilities Note 31/12/ /12/ /12/ /12/2015 Trade liabilities 327, , , ,447 Liabilities for investments 2,952 2,824 3,360 3,075 Uninvoiced services 3,779 3,615 6,633 6,071 Financial liabilities , , , ,593 Prepayments 5,159 4,936 6,287 5,754 Payroll liabilities 1,682 1,609 1,741 1,593 Excise tax and fuel charge 15,283 14,621 8,854 8,104 Value added tax 27,527 26,334 21,489 19,668 Other taxation, duties, social security and other benefits 5,013 4,795 5,075 4,645 Acruals 4,627 4,428 4,197 3,842 Holiday pay accrual 3,264 3,123 3,252 2,977 Other accruals 1,363 1, Other liabilities ,298 2,104 Non-financial liabilities 60,067 57,464 49,941 45,710 Total 394, , , ,303 Trade and other liabilities denominated in functional currency amounted to USD 240,961 thousand or EUR 230,519 thousand as at 31 December 2016 and USD 100,668 thousand or EUR 92,136 thousand as at 31 December Detailed information of financial liabilities denominated in foreign currencies is presented in Note
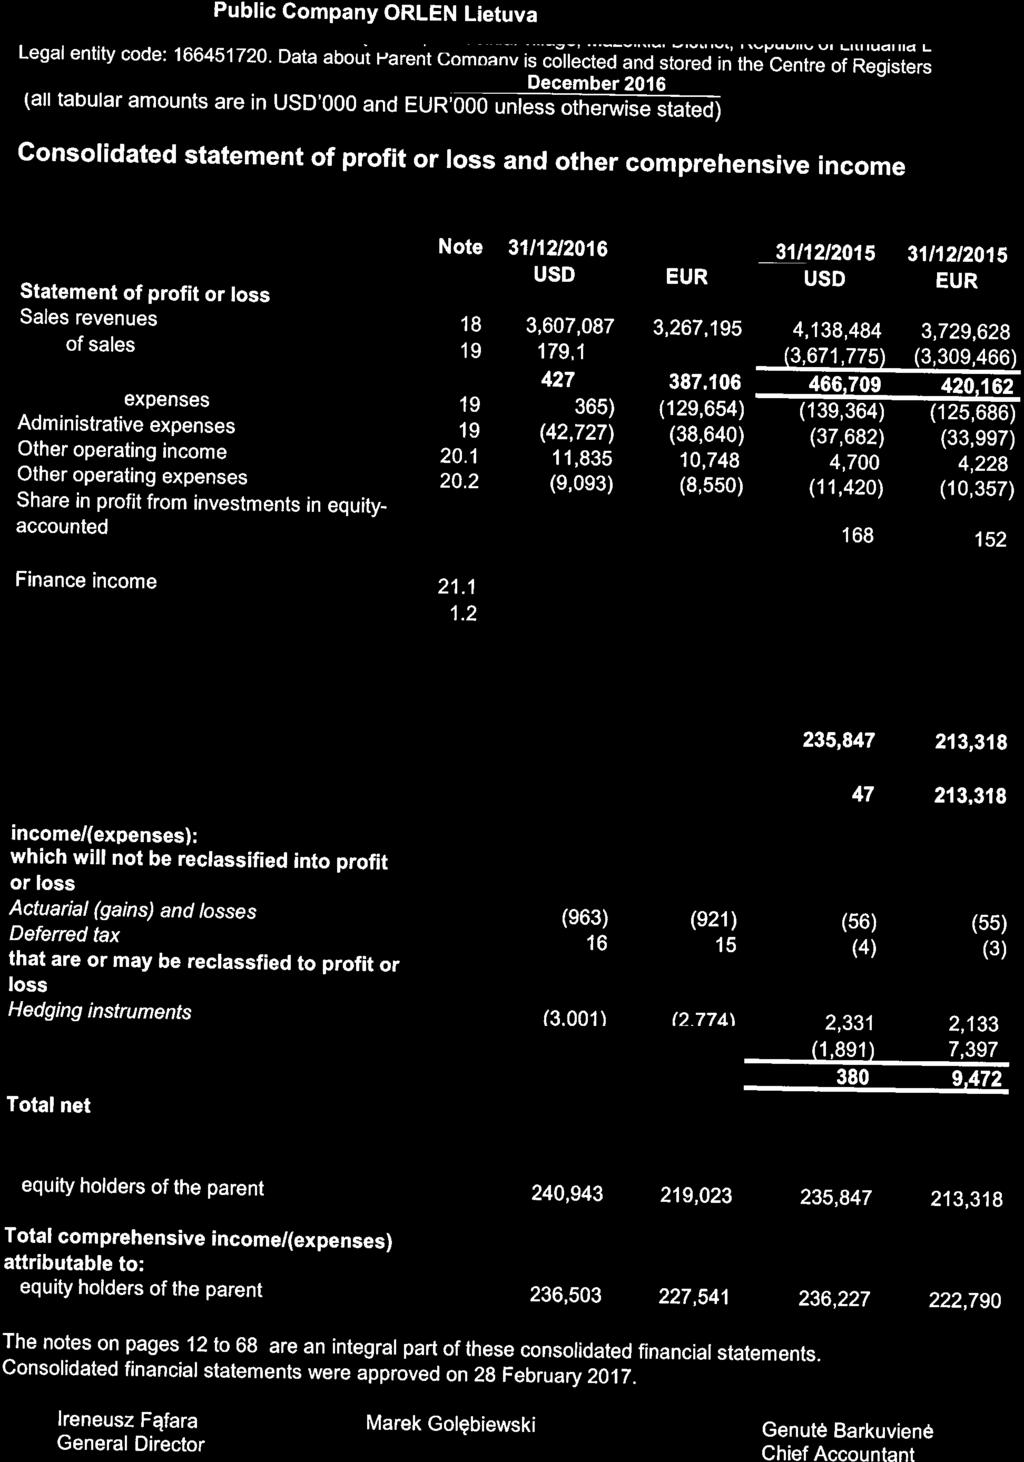
44 17. Other financial liabilities Note 31/12/ /12/ /12/ /12/2015 Cash flow hedge instruments 3,207 3, commodity swap 23 3,207 3, Liabilities from cash pool Liabilities on settled derivatives not designated for hedge accounting Liabilities on settled cash flow hedge instruments 23 6,102 5, ,354 8, The Parent Company, ORLEN Eesti and ORLEN Latvia are the members of the international cash pool managed by ORLEN Finance AB. The internal cross-currency credit limit granted to ORLEN Latvia and ORLEN Eesti is 10 million EUR and to the Parent Company million EUR. The date of full repayment of the internal cross-currency credit limit is December Sales revenues for the year ended for the year ended 31/12/ /12/ /12/ /12/2015 Sales of finished goods 3,475,781 3,148,308 3,995,738 3,602,621 Sales of services 23,732 21,466 27,904 25,111 Revenues from sales of finished goods and services, net 3,499,513 3,169,774 4,023,642 3,627,732 Sales of goods for resale 106,917 96, ,655 99,889 Sales of spare parts ,187 2,007 Revenues from sales of goods for resale and spare parts, net 107,574 97, , ,896 Total 3,607,087 3,267,195 4,138,484 3,729,628 Sales revenues by assortments for the year ended for the year ended 31/12/ /12/ /12/ /12/2015 3,607,087 3,267,195 4,138,484 3,729,628 Gasoline 1,225,615 1,108,389 1,374,314 1,240,656 Diesel fuel 1,785,366 1,618,105 2,130,151 1,917,337 Jet A-1 fuel 105,207 95, ,317 93,935 Heavy heating oil 320, , , ,527 LPG 87,929 79,636 95,739 86,440 Bitumens 37,601 33,802 42,825 38,624 Light heating oil 3,510 3,107 5,222 4,696 Sulphur 4,367 3,962 7,009 6,288 Other 12,488 11,825 13,179 12,007 Sales of spare parts ,187 2,007 Services 23,732 21,466 27,904 25,111 Total 3,607,087 3,267,195 4,138,484 3,729,628 44
45 In 2016 there was one major customer in the Group, whose revenues from sales amounted to USD 1,024,492 thousand or EUR 927,762 thousand and individually exceeded 10% of total revenues from sale to external customers. In 2015 there was one major customer in the Group, whose revenues from sales amounted to USD 989,623 thousand or EUR 925,262 thousand and individually exceeded 10% of total revenues from sale to external customers. Sales revenues geographical division disclosed by customer s premises countries for the year ended for the year ended 31/12/ /12/ /12/ /12/2015 Lithuania 797, , , ,984 Other Baltic countries 711, , , ,996 Poland 264, ,528 53,295 50,222 Other EU countries 208, , , ,528 Other countries, including: 1,624,693 1,473,277 2,003,785 1,874,898 Switzerland 357, , , ,473 Ukraine 206, , , ,998 Singapore 1,024, , , ,387 Other countries 35,686 32,421 18,307 17,040 Total 3,607,087 3,267,195 4,138,484 3,729,628 Other countries comprises sales to customers from Moldova, Norway, Panama, Russia, Turkey, Virgin Islands and other countries. 19. Operating expenses Cost of sales for the year ended for the year ended 31/12/ /12/ /12/ /12/2015 Cost of finished goods and services sold 3,062,980 2,774,491 3,560,240 3,210,010 Cost of goods for resale and spare parts sold 116, , ,535 99,456 Total 3,179,182 2,880,089 3,671,775 3,309,466 45
46 Cost by kind Note for the year ended for the year ended 31/12/ /12/ /12/ /12/2015 Usage of materials and energy, including: 3,151,651 2,854,660 3,593,237 3,236,202 usage of materials 3,114,321 2,820,907 3,559,167 3,205,546 usage of energy 37,330 33,753 34,070 30,656 External services, including: 162, , , ,575 railway services 103,030 93,109 99,819 90,036 repairs and maintenance services 12,107 10,929 10,744 9,702 terminal services,transit and freight 29,234 26,489 29,242 26,366 advisory services 2,731 2,469 2,575 2,327 lease 6,211 5,618 5,801 5,236 security of property 4,531 4,091 4,402 3,966 others services 4,727 4,289 5,481 4,942 Payroll, social security and other employee benefits 45,055 40,819 45,151 40,790 Depreciation and amortization 4,5 14,440 13,055 12,405 11,177 Taxes and charges 10,248 9,223 6,313 5,690 Write-down of spare parts for obsolescence, net 9 (773) (670) (333) (310) Other costs, including: 11,676 10,559 7,457 6,701 insurance 10,842 9,802 6,539 5,877 other costs ,394,868 3,074,640 3,822,294 3,442,825 Change in finished goods and work in progress (28,881) (25,612) 29,358 28,352 Cost of products and services for own use (2,218) (2,057) (10,197) (8,811) Write-down of inventories 9 1,505 1,412 7,366 6,783 Total operating expenses 3,365,274 3,048,383 3,848,821 3,469,149 Distribution expenses 143, , , ,686 Administrative expenses 42,727 38,640 37,682 33,997 Cost of sales 3,179,182 2,880,089 3,671,775 3,309,466 Total operating expenses 3,365,274 3,048,383 3,848,821 3,469,149 Employee benefits costs Note for the year ended for the year ended 31/12/ /12/ /12/ /12/2015 Payroll expenses 34,025 30,853 33,491 30,256 Social security expenses 10,521 9,546 10,230 9,242 Future benefits expenses 15.2 (1,326) (1,256) Other employee benefits expenses 1,835 1,676 1,298 1,170 Total 45,055 40,819 45,151 40,790 46
47 20. Other operating income and expenses Other operating income Note for the year ended for the year ended 31/12/ /12/ /12/ /12/2015 Profit from disposal of non-financial fixed assets Reversal of provisions 8,053 7,262 1,770 1,598 Reversal of receivables impairment allowances 10, Decreases of impairment allowances of property, plant and equipment and intangible assets ,159 1,035 Penalties and compensations earned 2,153 1,990 1,535 1,380 Other Total 11,835 10,748 4,700 4, Other operating expenses Note for the year ended for the year ended 31/12/ /12/ /12/ /12/2015 Loss from disposal of non-financial fixed assets Recognition of provisions 7,730 7,312 9,506 8,616 Recognition of impairment receivables 10, Recognition of impairment allowances of property, plant and equipment, intangible assets and noncurrent assets classified as held for sale Penalties and compensations Other Total 9,093 8,550 11,420 10, Financial income and expenses Financial income Note for the year ended for the year ended 31/12/ /12/ /12/ /12/2015 Interest Settlement and valuation of financial instruments ,821 12,519 Other Total ,309 12, Financial expenses Note for the year ended for the year ended 31/12/ /12/ /12/ /12/2015 Interest ,837 1,677 1,305 1,169 Foreign exchange loss ,003 1, Costs of factoring , Settlement and valuation of financial instruments ,976 64,756 Other Total 4,544 3,992 76,515 68,028 47
48 22. Tax expenses for the year ended for the year ended 31/12/ /12/ /12/ /12/2015 Tax expense in the statement of profit or loss (25) (1,178) (14,942) (13,884) Current tax expense 5,561 5,067 4,959 4,457 Deferred tax expense (5,586) (6,245) (19,901) (18,341) Deferred tax recognized in other comprehensive income (16) (15) 4 3 Actuarial gains and losses from post-employment benefits (16) (15) 4 3 Total (41) (1,193) (14,938) (13,881) The differences between income tax expense recognized in profit or loss and the amount calculated based on profit before tax for the year ended for the year ended 31/12/ /12/ /12/ /12/2015 Profit (loss) for the period before tax 240, , , ,434 Profit tax applying 15 % tax rate 36,138 32,677 33,136 29,915 Effect of different tax rates in other countries (67) (60) Non-taxable income (9,590) (8,666) (14,942) (13,462) Expenses not deductible for tax purposes 1,650 1,491 12,330 11,109 Fixed asset investment relief utilization (4,480) (4,036) Tax loss utilization (2,538) (2,293) (20,934) (18,860) Change in estimates related to prior years (25,874) (23,380) (20,008) (18,026) Other (28) (25) Forex impact, because of different currency exchange rate - (1,178) - (485) Income tax (25) (1,178) (14,942) (13,884) 48
49 22.2. Deferred tax 31/12/2015 Deferred tax recognized in statement of profit or Deferred tax recognized in other comprehensive 31/12/2016 Deferred tax assets / (liabilities) Impairment allowances 120, ,656 (1,513) 3, , ,216 Provisions and accruals (included actuarial loss) 2,230 2,041 (345) (237) ,901 1,819 Unrealized foreign exchange differences (12,043) (11,022) (3,564) (3,909) - - (15,607) (14,931) Difference between carrying amount and tax base of property, plant and equipment (21,817) (19,968) (7,939) (8,498) - - (29,756) (28,466) Tax loss 45,562 41,701 (19,574) (16,839) ,988 24,862 Financial instruments valuation (966) (884) (82) (78) Investment relief 4,480 4,100 (4,480) (4,100) Other 1,285 1,175 (732) (646) Total deferred tax assets / (liabilities) 139, ,799 (37,263) (29,863) ,387 97,951 Deferred tax asset / (liabilities) not recognised (119,276) (109,167) 42,847 36, (76,429) (73,118) Deferred tax, net 20,358 18,632 5,584 6, ,958 24,833 The Parent Company has not recognised deferred income tax by amount USD 76,429 thousand or EUR 73,118 thousand, because is not probable that future taxable profits will be available against which the Parent company can utilize the benefits. 31/12/2014 Deferred tax recognized in statement of profit or Deferred tax recognized in other comprehensive 31/12/2015 Deferred tax assets / (liabilities) Impairment allowances 126, ,944 (5,527) 6, , ,656 Provisions and accruals (included actuarial loss) 3,362 2,764 (1,128) (720) (4) (3) 2,230 2,041 Unrealized foreign exchange differences (980) (806) (11,063) (10,216) - - (12,043) (11,022) Difference between carrying amount and tax base of property, plant and equipment (13,373) (10,995) (8,444) (8,973) - - (21,817) (19,968) Tax loss 72,953 59,978 (27,391) (18,277) ,562 41,701 Financial instruments valuation - - (966) (884) - - (966) (884) Investment relief - - 4,480 4, ,480 4,100 Other ,285 1,175 Total deferred tax assets / (liabilities) 189, ,661 (49,698) (27,859) (4) (3) 139, ,799 Deferred tax asset / (liabilities) not recognised (188,842) (155,255) 69,566 46, (119,276) (109,167) Deferred tax, net ,868 18,229 (4) (3) 20,358 18,632 49
50 The Parent Company has not recognised deferred income tax by amount USD 119,276 thousand or EUR 109,167 thousand, because is not probable that future taxable profits will be available against which the Parent company can utilize the benefits. for the year ended for the year ended 31/12/ /12/ /12/ /12/2015 Beginning of the period 20,358 18, Deferred tax recognised in profit or loss 5,586 6,245 19,901 18,341 Deferred tax recognised in other comprefensive income (4) (3) Foreign exchange differences (2) (59) (33) (112) Total 25,958 24,833 20,358 18,632 Deferred tax, net 25,958 24,833 20,358 18, Financial instruments and financial risks Financial instruments by category and class Financial assets as at 31 December 2016 Financial instruments by category USD Financial Hedging Loans and assets held financial receivables to maturity instruments Total Financial instruments by class Note Other non-current receivables 7 1, ,673 Deposits Trade receivables , ,491 Receivables from cash pool , ,571 Loans granted 7, Cash flow hedge instruments ,537 2,537 Receivables on settled cash flow hedge instruments 11 3, ,752 Cash and cash equivalents 12 4, ,584 Total 378, , ,249 Financial instruments by category EUR Financial Hedging Loans and assets held financial receivables to maturity instruments Total Financial instruments by class Note Other non-current receivables 7 1, ,601 Deposits Trade receivables , ,579 Receivables from cash pool , ,532 Loans granted 7, Cash flow hedge instruments ,427 2,427 Receivables on settled cash flow hedge instruments 11 3, ,589 Cash and cash equivalents 12 4, ,386 Total 361, , ,728 50
51 as at 31 December 2015 Financial instruments by category USD Financial Hedging Loans and assets held financial receivables to maturity instruments Total Financial instruments by class Note Other non-current receivables 7 1, ,214 Deposits 11-2,256-2,256 Trade receivables 10 89, ,426 Receivables from cash pool , ,299 Loans granted 7, Cash flow hedge instruments ,331 2,331 Receivables on settled cash flow hedge instruments 11 6, ,443 Cash and cash equivalents 12 1, ,051 Total 206,539 2,256 2, ,126 Financial instruments by category EUR Financial Hedging Loans and assets held financial receivables to maturity instruments Total Financial instruments by class Note Other non-current receivables 7 1, ,111 Deposits 11-2,065-2,065 Trade receivables 10 81, ,847 Receivables from cash pool 11 99, ,120 Loans granted 7, Cash flow hedge instruments ,133 2,133 Receivables on settled cash flow hedge instruments 11 5, ,897 Cash and cash equivalents Total 189,034 2,065 2, ,232 Financial liabilities as at 31 December 2016 USD Financial instruments by category Financial liabilities measured at amortized cost Hedging financial instruments Financial instruments by class Note Trade liabilities , ,121 Liabilities from cash pool Cash flow hedge instruments 17-3,207 3,207 Liabilities on settled cash flow hedge instruments 17 6,102-6,102 Total 340,268 3, ,475 Total 51
52 EUR Financial instruments by category Financial liabilities measured at amortized cost Hedging financial instruments Financial instruments by class Note Trade liabilities , ,641 Liabilities from cash pool Cash flow hedge instruments 17-3,068 3,068 Liabilities on settled cash flow hedge instruments 17 5,837-5,837 Total 325,521 3, ,589 as at 31 December 2015 USD Financial liabilities measured at amortized cost Financial instruments by category Financial liabilities valued at amortized cost Hedging financial instruments Financial instruments by class Note Bank loans 14-13,954-13,954 Trade liabilities , ,556 Liabilities from cash pool Liabilities on settled derivatives not designated for hedge accounting Liabilities on settled cash flow hedge instruments Total , ,025 EUR Financial liabilities measured at amortized cost Financial instruments by category Financial liabilities valued at amortized cost Hedging financial instruments Financial instruments by class Note Bank loans 14-12,771-12,771 Trade liabilities , ,593 Liabilities from cash pool Liabilities on settled derivatives not designated for hedge accounting Liabilities on settled cash flow hedge instruments Total , ,836 Total Total Total 52
53 23.2. Income and expense, profit and loss in the consolidated statement of profit or loss and other comprehensive income As at 31 December 2016 USD Financial instruments by category Financial Loans and liabilities receivables measured at amortised cost Total Financial instruments by class Note Interest income Interest costs (1,837) (1,837) Foreign exchange gain/(loss) 21.2 (538) (1,465) (2,003) Recognition/reversal of receivables impairment allowances recognized in other operating income/expenses, net 20.1, Costs of factoring (456) (456) Other (248) (248) Total 415 (4,006) (3,591) Financial instruments by category EUR Financial amortised cost Loans and liabilities receivables measured at Total Financial instruments by class Note Interest income Interest costs (1,677) (1,677) Foreign exchange gain/(loss) 21.2 (480) (1,209) (1,689) Recognition/reversal of receivables impairment allowances recognized in other operating income/expenses, net 20.1, Costs of factoring (399) (399) Other (227) (227) Total 390 (3,512) (3,122) 53
54 As at 31 December 2015 USD Financial assets and financial liabilities at fair value through profit or loss Loans and receivables Financial liabilities measured at amortised cost Financial instruments by class Note Interest income Interest costs (1,305) (1,305) Foreign exchange gain/(loss) (2,296) 1,534 (762) Recognition/reversal of receivables impairment allowances recognized in other operating income/expenses, net 20.1, 20.2 Financial instruments by category Total - (9) - (9) Settlement and valuation of 21.1, financial instruments, net 21.2 (59,155) - - (59,155) Costs of factoring (1,070) (1,070) Other, net (402) (237) Total (59,155) (1,817) (1,243) (62,215) EUR Financial assets and financial liabilities at fair value through profit or loss Loans and receivables Financial liabilities measured at amortised cost Financial instruments by class Note Interest income Interest costs (1,169) (1,169) Foreign exchange gain/(loss) (2,147) 1,368 (779) Recognition/reversal of receivables impairment allowances recognized in other operating income/expenses, net 20.1, 20.2 Total - (8) - (8) Settlement and valuation of 21.1, financial instruments, net 21.2 (52,237) - - (52,237) Costs of factoring (966) (966) Other, net (358) (207) Total (52,237) (1,714) (1,125) (55,076) Fair value measurement Financial instruments by category As at 31 December 2016 and as at 31 December 2015 fair value of financial assets and financial liabilities are equal or similar to carrying amount due to short term nature Hedge accounting As a part of hedging strategy the Parent Company hedges its cash flows from sales of products and purchase of crude oil using commodity swaps. 54
55 Net result of cash flows hedge instruments accounted in financial assets and financial liabilities: Note 31/12/ /12/ /12/ /12/2015 Cash flows hedge instruments Commodity swap 11,17 (670) (641) 2,331 2,133 Total (670) (641) 2,331 2,133 Cash flows hedge recognised in financial statements 31/12/ /12/2016 USD EUR Inventories Sales revenues 12,125 10,458 Cost of sales 1, Planned realization date of hedged cash flows which will be recognized in the profit or loss 31/12/ /12/2015 Commodity risk exposure January-April 2017 January-March Financial risk management The Group is exposed particularly to the following financial risks: credit risk; liquidity risk; market risk, including currency risk, interest rate risk, commodity price risk, price risk of allowances CO Credit risk Within its trading activity the Group sells products and services with deferred payment term, which may result in the risk that customers will not pay for the Group s receivables from sales of products and services. In order to minimize credit risk and working capital the Group manages the risk by credit limit policies governing granting of credit limits to customers and establishment of pledges collaterals of appropriate different types. The established average payment term of receivables connected with the ordinary course of sales is 12 to 15 days. Each non-cash customer with deferred payment is individually assessed with regard to credit risk. A portion of trade receivables is insured within an organized trade credit insurance program. Group also uses recourse (terminated in 2016) and non-recourse factoring. Trade receivables are monitored by Treasury, Financial Planning and Controlling Department on regular basis. In the event of occurrence of overdue receivables, sale is withheld and debt recovery procedures are implemented as described in the binding procedures. In order to reduce the risk of recoverability of trade receivables the Group receives securities from its customers such as: bank guarantees, documentary letters of credit, stand-by letters of credit, mortgages and third-party guarantees. 55
56 The ageing analysis of current receivables past due, but not impaired as at the end of the reporting period: 31/12/ /12/2015 Overdue: Up to 1 month 2,147 2,054 10,335 9, months ,136 2, months months ,288 2,094 Above 1 year 6,218 5,949 4,077 3,731 8,572 8,201 20,190 18, Liquidity risk The goal of the Group is to maintain the balance between continuity and flexibility of financing. To achieve this goal, the Group uses, first of all, financing on the PKN Group level (cash pool), accompanied by local sources of financing (factoring facilities). The Group maintains the ratio of current assets to current liabilities (current ratio) on a safe level. As at 31 December 2016 and 31 December 2015, the ratio amounted to 1.45 and 1.46, respectively. In 2015 Parent Company signed a non-recourse factoring agreement with AB SEB Bank on the factoring limit up to EUR 37 million. In 2016 Parent Company prolonged this agreement for the factoring limit up to EUR 17 million. Detailed information regarding loans is disclosed in Note 14. As at 31 December 2016 and 31 December 2015 the maximum possible indebtedness under the signed loan agreements (mainly non-recourse factoring) amounted to USD 34,231 thousand or EUR 31,331 thousand and USD 44,102 thousand or EUR 36,258 thousand, respectively. In 2016 all loans were refunded. Financing available for the year 2016 under the credit/cash pool agreements to cover net current liabilities with the maturity of 31 December 2017 (EUR 100 million) is covering the expected liquidity needs for 2016 with reserve. Maturity analysis for financial liabilities: 31/12/2016 Carrying USD Note up to 1 year amount Trade liabilities , ,121 Liabilities on settled cash flow hedge instruments 17 6,102 6,102 Cash flow hedge instruments 17 3,207 3,207 Liabilities from cash pool Total 343, ,475 56
57 31/12/2016 Carrying EUR Note up to 1 year amount Trade liabilities , ,641 Liabilities on settled cash flow hedge instruments 17 5,837 5,837 Cash flow hedge instruments 17 3,068 3,068 Liabilities from cash pool Total 328, ,589 31/12/2015 Carrying USD Note up to 1 year amount Bank loans-undiscounted value 14 13,954 13,954 Trade liabilities , ,556 Liabilities on settled cash flow hedge instruments Liabilities on settled derivatives not designated for hedge accounting Liabilities from cash pool Total 191, ,025 31/12/2015 Carrying EUR Note up to 1 year amount Bank loans-undiscounted value 14 12,771 12,771 Trade liabilities , ,593 Liabilities on settled cash flow hedge instruments Liabilities on settled derrivatives not designated for hedge accounting Liabilities from cash pool Total 174, , Market risks The Group is exposed to currency risks, interest rate risks and risks of changes in commodity prices and CO 2 emission allowance prices. The objective of market risk management process is to reduce the unfavourable effects of changes in market risk factors on the cash flow and financial results in the short and medium term. Market risk management is conducted using hedging strategies based on derivatives. Derivatives are used solely to reduce the risk of changes in fair value and risk of changes in cash flows. The Group applies only those instruments which can be measured independently, using standard valuation models for each instrument. As far as market valuation of the instruments is concerned, the Group relies on information obtained from market leading banks, brokers and information services. Transactions are concluded only with reliable partners, authorized to participate in transactions through the application of appropriate procedures and signing the relevant documentation Commodity risks As part of its operating activity the Parent Company is exposed mainly to the following commodity risks: - risk of changes in refining margins on the sale of products and Ural/Brent differential fluctuations- hedges on an irregular basis as a part of hedging strategies; 57
58 - risk of changes in crude oil and products prices related to the time mismatch between the date of the crude oil purchase and the date of its processing and sale of products, oversize periodic stock of operational crude oil and/or products, as well as future sales transactions - identified and hedged in a systematic and regular manner; - risk of changes in CO2 emission rights prices; - risk of changes in crude oil and refinery product prices related to the obligation to maintain mandatory reserves of crude oil and fuels - is not hedged on purpose due to the permanent exposure and non-cash impact on the Parent Company results. The impact of commodity hedging instruments on the Group's financial statements Type of hedged raw material/product Unit of measure 31/12/ /12/2015 Crude oil bbl 737,250 4,914,000 Diesel oil Mt 11, ,905 Gasoline Mt - 288,286 Heating oil Mt 85, ,511 Sensitivity analysis for changes in prices of products and raw materials As at 31 December 2016 Analysis of the influence of changes in the carrying amount of financial instruments on result before tax and hedging reserve to a hypothetical change in prices of products and raw materials: Type of hedged raw material/product Increase of prices Decrease of prices Crude oil USD/bbl +45% 8,719 8,342-45% (8,719) (8,342) Diesel oil USD/Mt +42% (2,342) (2,240) -42% 2,342 2,240 Heating oil USD/Mt +53% (13,670) (13,077) -53% 13,670 13,077 (7,292) (6,975) 7,292 6,975 As at 31 December 2015 Type of hedged raw material/product Increase of prices Total influence Total influence Decrease of prices Total influence Total influence Crude oil USD/bbl +19% 16,281 14,901-19% (16,281) (14,901) Diesel oil USD/Mt +17% (7,448) (6,817) -17% 7,448 6,817 Gasoline USD/Mt +21% (13,020) (11,917) -21% 13,020 11,917 Heating oil USD/Mt +20% (1,416) (1,296) -20% 1,416 1,296 (5,603) (5,128) 5,603 5,128 Applied for the sensitivity analysis of commodity risk hedging instruments variations of crude oil and products prices were calculated based on volatility for 2016 and 2015 and available analysts forecasts Currency risk Currency risk - The Group s functional currency is US dollar. The Group is exposed to currency risk resulting from current receivables and short-term liabilities, cash and cash equivalents, investment expenditures as well as from future planned cash flows from sales and purchases of refinery products. 58
59 Currency structure of financial instruments as at 31 December 2016: Financial instruments by class Note EUR USD PLN Other Total after conversion to USD Total after conversion to EUR Financial assets Other non-current receivables 7 1, ,673 1,601 Deposits Trade receivables 10 96,077 59, , ,579 Receivables from cash pool 11 3, , , ,532 Loans granted 7, Cash flow hedge instruments 11-2, ,537 2,427 Receivables on settled cash flow hedge instruments 11-3, ,752 3,589 Cash and cash equivalents 12 4, ,584 4,386 Total 106, , , ,728 Financial liabilities Trade and other liabilities 16 88, ,961 1, , ,641 Cash flow hedge instruments 16-3, ,207 3,068 Liabilities on settled cash flow hedge instruments 17-6, ,102 5,837 Liabilities from cash pool Total 88, ,270 1, , ,589 Total, net 17,563 19,904 (1,444) (304) 37,774 36,139 Sensitivity analysis for currency risk Increase/decrease in exchange rate means appreciation/depreciation of the relevant currencies against the functional currency of the Group (USD). The influence of potential changes in carrying amounts of financial instruments (as at 31 December 2016) arising from hypothetical changes in exchange rates of relevant currencies in relation to functional currency (USD) on profit before tax would be: Influence of financial instruments on profit before tax Financial instruments by class Increase of Total Decrease of Total exchange rate influence exchange rate influence EUR/USD +15% 2,754-15% (2,754) 2,754 (2,754) 59
60 Currency structure of financial instruments as at 31 December 2015: Financial instruments by class Note EUR USD PLN Other Total after conversion to USD Total after conversion to EUR Financial assets Other non-current receivables 7 1, ,214 1,111 Deposits 11 2, ,256 2,065 Trade receivables 10 40,395 45, ,426 81,847 Receivables from cash pool 11 4, , ,299 99,120 Loans granted 7, Cash flow hedge instruments 11-2, ,331 2,133 Receivables on settled cash flow hedge instruments 11-6, ,443 5,897 Cash and cash equivalents , Total 49, , , ,232 Financial liabilities Bank loans 14 7,908 5, ,954 12,771 Trade liabilities 16 69, ,668 1, , ,593 Liabilities on settled derrivatives not designated for hedge accounting Liabilities on settled cash flow hedge instruments Liabilities from cash pool Total 77, ,450 1, , ,836 Total, net (27,696) 50,715 (1,146) (178) 20,101 18,396 Sensitivity analysis for currency risk Increase/decrease in exchange rate means appreciation/depreciation of the relevant currencies against the functional currency of the Group (USD). The influence of potential changes in carrying amounts of financial instruments (as at 31 December 2015) arising from hypothetical changes in exchange rates of relevant currencies in relation to functional currency (USD) on profit before tax would be: Influence of financial instruments on profit before tax Financial instruments by class Increase of Total Decrease of Total exchange rate influence exchange rate influence EUR/USD +15% (4,539) -15% 4,539 (4,539) 4,539 Variations of currency rates described above were calculated based on historical volatility of particular currency rates and analysts forecasts. Sensitivity of financial instruments for currency risk was calculated as a difference between the initial carrying amount of financial instruments (excluding derivative instruments) and their potential carrying amount calculated using assumed increases/(decreases) in currency rates. In case of derivative instruments, the influence of currency rate variations on fair value was examined at constant level of interest rates. The fair value of foreign currency forward contracts is determined based on discounted future cash flows of the transactions, calculated based on the difference between the forward rate and the transaction price. 60
61 Interest rate risk The Group is exposed to the risk of volatility of cash flows arising from interest rates resulting from borrowings, cash pool facility and bank loans based on floating interest rates. Interest rate structure of financial instruments: USD Note 31/12/2016 EONIA* LIBID** Total Financial instruments by class Financial assets Receivables from cash pool 11 3, , ,571 Total 3, , ,571 Financial liabilities Liabilities from cash pool Total EUR Note 31/12/2016 EONIA* LIBID** Total Financial instruments by class Financial assets Receivables from cash pool 11 3, , ,532 Total 3, , ,532 Financial liabilities Liabilities from cash pool Total USD Note 31/12/2015 EONIA* LIBID** LIBOR*** EURIBOR**** Total Financial instruments by class Financial assets Other non-current receivables Deposits Loans granted 7, Receivables from cash pool 11 5, , ,299 Total 5, , ,299 Financial liabilities Bank loans 14 4,114-5,314 4,526 13,954 Liabilities from cash pool Total 4,114-5,361 4,526 14,001 EUR Note 31/12/2015 EONIA* LIBID** LIBOR*** EURIBOR**** Total Financial instruments by class Financial assets Other non-current receivables Deposits Loans granted 7, Receivables from cash pool 11 4,862 94, ,120 Total 4,862 94, ,120 Financial liabilities Bank loans 14 3,765-4,864 4,142 12,771 Liabilities from cash pool Total 3,765-4,907 4,142 12,814 61
62 *EONIA Euro OverNight Index Average **LIBID London InterBank Bid Rate ***LIBOR London InterBank Offered Rate ****EURIBOR Euro InterBank Offered Rate Sensitivity analysis for interest rate risk The influence of financial instruments on profit before tax due to changes in significant interest rates: Interest Assumed variation Influence on profit before tax rate 31/12/ /12/ /12/ /12/ /12/ /12/2015 EONIA LIBID , LIBOR (27) (25) EURIBOR (23) (21) Total 1, EONIA (19) (18) - - LIBID (1,023) (979) - - LIBOR EURIBOR Total (1,042) (997) - - Total The above interest rates variations were calculated based on observations of interest rates fluctuations. Low interest rates of EONIA, LIBID, LIBOR and EURIBOR at the end of 2015 and market forecasts for the further periods caused that the Group did not take the further decreases in the sensitivity analysis into consideration. The sensitivity analysis was performed on the basis of instruments held as at 31 December 2016 and 31 December The influence of interest rates changes was presented on annual basis. The sensitivity of financial instruments for interest rate risk was calculated as arithmetic product of the balance of the statement of financial position items, sensitive to interest rates (excluding derivatives) multiplied by adequate variation of interest rate. 24. Other explanatory notes Capital commitments Capital expenditure contracted for at the reporting date but not yet incurred is as follows: 31/12/ /12/2015 Property, plant and equipment 14,211 13,595 4,797 4, Contingencies Information on significant court proceedings is presented in Note
63 24.3. Guarantees Excise tax guarantees of the Parent Company as at 31 December 2016 and as at 31 December 2015 amounted to USD 303 thousand or EUR 290 thousand and USD 317 thousand or EUR 290 thousand, respectively. As at 31 December 2016 and as at 31 December 2015 the Group received guarantees of USD 309,981 thousand or EUR 296,548 thousand and USD 338,956 thousand or EUR 310,229 thousand, respectively Related party transactions As at 31 December 2016 and as at 31 December 2015 and in 2016 and in 2015 there were no material transactions of related parties with: - Members of the Management Board and the Supervisory Board of the Parent Company and their relatives, - Key executive personnel of the Parent Company and the Group companies (Note 24.5). Transactions and balance of settlement of the Group with related parties for the year ended 31 December 2016 USD Note Shareholder Related of the Group parties Associates Total Sales 232,655 49,361 11, ,491 Purchases 2,768,043 17,000-2,785,043 Interest income Interest expenses Receivables from cash pool , ,571 Trade and other receivables (net) 1,687 4, ,599 Liabilities from cash pool Trade and other liabilities 225, ,469 EUR Note Shareholder Related of the Group parties Associates Total Sales 211,877 44,650 10, ,881 Purchases 2,503,945 15,785-2,519,730 Interest income Interest expenses Receivables from cash pool , ,532 Trade and other receivables (net) 1,614 4, ,313 Liabilities from cash pool Trade and other liabilities 215, ,698 63
64 for the year ended 31 December 2015 USD Note Shareholder Related of the Group parties Associates Total Sales 26,370 55,155 18,229 99,754 Purchases 3,155,658 19,606-3,175,264 Interest income Interest expenses - 1,304-1,304 Other operating income Other financial costs Receivables from cash pool , ,299 Trade and other receivables (net) 985 3, ,150 Liabilities from cash pool Trade and other liabilities 76, ,871 EUR Note Shareholder Related of the Group parties Associates Total Sales 24,037 49,741 16,430 66,171 Purchases 2,840,639 17,888-17,888 Interest income Interest expenses - 1,168-1,168 Other operating income Other financial costs Receivables from cash pool 11-99,120-99,120 Trade and other receivables (net) 902 2, ,896 Liabilities from cash pool Trade and other liabilities 69, The above transactions with related parties include mainly sales and purchases of refinery products and sales and purchases of services. Sale and purchase transactions with related parties were made at market conditions Remuneration together with profit-sharing paid and due or potentially due to the members of Management Board, Supervisory Board and other members of key executive personnel of Parent company and the Group companies The Management Board s, the Supervisory Board s and other key executive personnel s remuneration includes short-term employee benefits, other long-term employee benefits and termination benefits paid, due and potentially due during the period. 64
65 for the year ended for the year ended 31/12/ /12/2015 Remuneration and other benefits of the key executive personnel 2,567 2,319 2,544 2,310 - key executive personnel of the Parent company 2,227 2,012 2,002 1,796 - key executive personnel of the subsidiaries belonging to the Group Remuneration and other benefits potentially due to the key executive personnel, to be paid in the following year - key executive personnel of the Parent company key executive personnel of the subsidiaries belonging to the Group Post employment benefits for the key executive personnel key executive personnel of the Parent company key executive personnel of the subsidiaries belonging to the Group There are no other liabilities or accounts receivables from key executive personnel. Bonus systems for key executive personnel of the Group Since 2007 the Group s key executive personnel is participating in the annual Management by objectives (MBO) bonus system. The persons subject to the MBO system are remunerated for the accomplishment of specific goals set at the beginning of the bonus period, by the Board for the General Director and his deputies and by the General Director of the Parent Company for the key personnel members. MBO system in subsidiaries is applied only for the manager of the entity, the goals and bonus amount are set and approved by the Board. The bonus systems are structured in such way, so as to promote the cooperation between individual employees in view to achieve the best possible results for the Group. The goals are qualitative, dedicated to increase Group's management quality and process efficiency, and quantitative, which are related with operational and financial indicators in managed area. Goals are accounted for following the end of the year for which they were set, on the appropriate rules. 65
66 24.6. Remuneration arising from the agreement with the entity authorized the conduct audit of the financial statements for the year ended for the year ended 31/12/ /12/2015 Fees payable to KPMG Baltics UAB in respect of the Parent Company audit of the annual financial statements agreed upon procedures on financial statements other services Fees payable to KPMG companies in respect of subsidiaries belonging to the Group audit of the annual financial statements agreed upon procedures on financial statements other services In the period covered by this consolidated financial statement the entity authorized to conduct audit of the Group s financial statements is KPMG Baltics, UAB. According to the agreement amendment concluded on 17 April 2015 with the Parent Company for the years 2015 and 2016, KPMG Baltics, UAB, performs the interim reviews agreed upon procedures and audits of separate and consolidated financial statements in years Following the concluded agreements for the year 2016, KPMG Baltics, UAB performs the agreed upon procedures of interim and audit of financial statements of the subsidiaries (except for UAB Mažeikių Naftos prekybos namai). 25. Information concerning significant proceedings in front of court, body appropriate for arbitration proceedings or in front of public administration bodies Court proceedings in which the Parent company act as plaintiff Compensation due to property damages Parent company is a party in the compensation proceeding against RESORT MARITIME SA, The London Steamship Owners Mutual Insurance Association Limited, Sigma Tankers Inc., Cardiff Maritime Inc., Heidenreich Marine, Heidenreich Maritime Inc. and Heidmar Inc. due to losses incurred during the accident in Būtingė Terminal (the tanker ship hit a terminal buoy) on 29 December The total compensation claim amounts to approximately EUR 23,300 thousand (USD 22,290 thousand) at exchange rate as at 31 December Arbitration proceedings against AB Lietuvos geležinkeliai regarding calculation of rail carriage tariffs and overpaid difference Starting from 1 January 2014, AB Lietuvos Geležinkeliai applied higher tariffs for rail carriage on the Parent company. Calculation of the tariffs, according to AB Lietuvos Geležinkeliai, relates to the regulation on infrastructure fees, approved by the Government of the Republic of Lithuania. The Parent company did not agree with the applied tariffs, as they have been calculated by AB Lietuvos Geležinkeliai not in accordance with the effective rail carriage contract. On 31 December 2014, the Parent company filed a request for arbitration against AB Lietuvos geležinkeliai in the Vilnius court of commercial arbitration. The Parent company claims that calculation of tariffs for railway transportation should be done in line with the current contract concluded between the Parent company and AB Lietuvos geležinkeliai, and AB Lietuvos geležinkeliai should pay the 66
67 compensation to the Parent company for excessive tariffs applied. Granting of a relief according to the Parent company s claims would lead to savings for the company in the amount of not less than EUR 41 million, as of 31 December 2016 (USD 42.9 million at exchange rate as at 31 December 2016), and to receiving of compensation of approximately EUR 100 million, as of 31 December 2016 (USD million at exchange rate as at 31 December 2016). The amount of savings and compensation will be further updated in accordance with the activity ongoing on the basis of the rail carriage contract. Court proceedings against AB Lietuvos geležinkeliai regarding repayment of the debt and penalty interest under fuel sale-purchase contract The Parent company started the civil proceedings at Vilnius District Court against AB Lietuvos geležinkeliai regarding the repayment of the debt and penalty interest under fuel sale-purchase contract. The value of the claim exceeds EUR 5.7 million (USD 6.0 million at exchange rate as at 31 December 2016). The hearing of the case is suspended until the dispute in arbitration on railway tariffs between the Parent company and AB Lietuvos geležinkeliai is finally resolved Court proceedings in which Parent company act as a defendant Payment request from a Company of inventors In 2010, a group of individuals claimed royalties and interest related to production improvement process which has been invented and patented by the group and supposedly improved the performance of the Parent company s refinery. The claim covered the years and amounted to EUR 11.1 million (USD 11.6 million at exchange rate as at 31 December 2016), not including the procedural interest, litigation and other costs. On 6 August 2015, the court partially satisfied the claim and awarded to the claimants from the Parent company EUR 6.8 million (USD 7.1 million at exchange rate as at 31 December 2016) principal amount and interest, respective procedural interest and litigation costs. On 20 May 2016, the appellate instance court reduced the amount adjudged to the claimants from the Parent company up to EUR 0.6 million (USD 0.6 million at exchange rate as at 31 December 2016) of principal amount and interest. On 2 December 2016 the Supreme Court of Lithuania decided that the Parent company should pay the royalties to the claimants according to the 1st instance court decision. Additionally, the court decided that case should be re-examined at the appellate instance as a matter of compensation for the claimants, for the extended period of the patent validity. The Parent company applied for renewal of the proceedings at the Supreme Court. The Parent company s request for renewal, as well as the respective part of the case transferred to the appellate instance will be heard in forthcoming months. Dispute with Lietuvos geležinkeliai regarding rail carriage contract Starting from 1 January 2015, AB Lietuvos Geležinkeliai applied to the Parent company higher tariffs for railway transportation. Calculation of the tariffs, according to AB Lietuvos Geležinkeliai, relates to the regulation on infrastructure fees, approved by the Government of the Republic of Lithuania. The Parent company did not agree with the applied tariffs, as they were calculated by AB Lietuvos Geležinkeliai not in accordance with the effective rail carriage contract. Therefore, the Parent company covered only a respective portion of the invoices issued by AB Lietuvos Geležinkeliai and paid for transportation services applying the tariffs calculated in an appropriate manner. As a result of disagreement, on 4 June, 28 October 2014, 26 June 2015, 19 August 2015, 5 January 2016, 27 June 2016, and 16 December 2016 AB Lietuvos geležinkeliai filed claims against the Parent company claiming the overdue debt and penalty interest in amount of EUR 37.5 million (USD 39.2 million at exchange rate as at 31 December 2016), as well as respective procedural 67
68
69 CONSOLIDATED ANNUAL REPORT OF PUBLIC COMPANY ORLEN LIETUVA FOR THE YEAR 2016 Public Company ORLEN Lietuva and its subsidiaries (hereinafter the Group) ended the year 2016 with the outstanding performance indicators which were directly impacted by the Group achievements in the production and sales areas as well as favorable macroeconomic conditions. Similar to the previous years, the improvement of flexibility and operational efficiency were among the key targets of the Group for the year The Group has taken advantage of the favorable market conditions and business opportunities to establish a sustainable position on the market being exposed to the tough competition. In 2016, the Group succeeded in achieving exceptional results, with the Better Done Program of Public Company ORLEN Lietuva (hereinafter Parent Company), aimed at improvement of the main business areas, making an important contribution to the financial success of the Group. The Parent Company was implementing the operational efficiency improvement, sales promotion, performance optimization measures and the value creating initiatives as well as continued the labor efficiency increase to maintain a competitive presence on the market in case of a worsened situation. In 2016, the work organization and structural changes were continued by introducing advanced technical measures and tools as well as performing modernization of processes which was followed by staff optimization and labor efficiency increase. Operating Results In 2016, the feedstock processing volume amounted to 9.9 million tons, i.e. was by 0.9 million tons (9.5%) higher than in the previous year, when the volume of feedstock processed was 9.05 million tons. Annual capacity utilization in 2016 was higher than in 2015 by 8.1 percentage points. Increased processing volume and better capacity utilization were caused by the favorable macroeconomic environment. The year 2016 was also marked by improvement of other indicators representing the operational efficiency such as internal fuel and losses reduction, improvement of energy intensity index and mechanical availability. Increased processing volume resulted in the product sales growth. Sales of petroleum products by the Group in 2016 amounted to 9.5 million tons, compared to 8.6 million tons in Petroleum product sales volume in 2016 was by 0.9 million tons or 9.6% higher in comparison with Despite the sales volume increase, the Group revenues in 2016 were USD 3.6 billion (EUR 3.3 billion), whereas revenues of the Group in 2015 amounted to USD 4.1 billion (EUR 3.7 billion), with lower revenues caused by the fall in world prices for crude oil and petroleum products. Sales of light products in Lithuania during 2016 amounted to 1.8 million tons; the Group succeeded in maintaining and slightly increasing the sales level of 2015 when it comprised 1.77 million tons. Such result was achieved through the stable market share: the majority of the national retail network was trading in the fuel produced by the Parent Company; in addition, the fuel consumption in Lithuania increased. The year 2016 was also marked by the particularly successful sales to Ukraine reaching almost 0.8 million tons of fuel sold by the Group in spite of the extremely difficult conditions for sale impacted by the complicated economic and political situation in this country. Sales on the Polish market were four times that of the year 2015, with the highest growth in sales of diesel fuel. The volume of products sold in 2016 to Poland amounted to 0.6 million tons in comparison with 0.1 million tons sold in
70 Notwithstanding the fierce competition on the market of Baltic countries, the Group succeeded in increasing gasoline sales not only in Lithuania but in Latvia and Estonia as well. Volume of sales in comparison with the year 2015 increased by 9.9%; however, further increase of the growing number of clients was and still remains one of the main targets for the sales activities. Growth of the processing volume also resulted in seaborne sales increase by 4.3%. Seaborne sales in 2016 amounted to 4.5 million tons, compared to 4.3 million tons in Financial Results The net profit of the Group for the year 2016 under the International Financial Reporting Standards (IFRS) amounted to USD million (EUR million), in comparison to the net profit of USD million (EUR million) for the year Operating profit for the year 2016 comprised USD million (EUR million), compared to the operating profit of USD million (EUR million) in Positive results of the Group have also contributed to the improvement of its financial indicators. Net profit margin of the Group for the year 2016 was 6.7% (5.7% in 2015). Changes of other indicators were as follows: the net debt to equity ratio was (-0.31 in 2015), the current ratio was 1.45 (1.46 in 2015), and the asset turnover ratio was 4.32 (7.07 in 2015). Information on financial risk management of the Group is available in Note 23 -of Consolidated Financial Statements. The information includes data on financial risk management trends, used insurance instruments to which the accounting of insurance transactions is applicable as well as pricing risk, credit risk, liquidity risk, and cash flow risk. Modernization, Mandatory and Other Projects The total amount of investments made by the Parent Company to property plant and equipment as well as intangible assets (excluding purchase of deficient CO 2 emission allowances) during the year 2016 comprised USD 24.1 million, i.e. was by 9% higher than in the year 2015 (USD 22.2 million). In 2016, the Parent Company completed the project of heat exchange optimization in LK-2 Crude Distillation Unit. The project will allow for the fuel savings reaching USD 10 million per year. The main focus of the Group, similar to the previous years, was given for implementation of the projects with the short pay-back period requiring relatively low investment. The number of such projects completed in 2016 was 12, with their total budget reaching USD 1.9 million and the positive impact on EBITDA (Earnings before Interest, Taxes, Depreciation and Amortization) possibly reaching USD 3.3 million, depending on the market situation. In addition to the Crude Distillation Unit heat exchange optimization project, other projects intended for EBITDA improvement included the projects of bitumen production in winter season, isopentane (i-c5) supply to Gasoline Blending Station, installation of load control system for compressors IK and IK-301-2, modification of liquid fuel supply to Power House, connection of coolerscondensers AK-117, AK-118, AO-111 and AV-117 for cooling of Tower K-105 bottom product. Besides the projects intended for profit margin increase, the activities for refurbishment of the process units and catalyst replacement works were also implemented in
71 Employees Development and Work Compensation Policy Employees development remains the priority area of the human resource management. In 2016, following the applicable legislation and the internal requirements 1,903 employees of the Group attended trainings and received certificates in the areas of fire safety and civil protection, first aid and hygiene, as well as execution of specialized works. The Parent Company continuously improves qualifications of its workers to ensure proper servicing by the operational staff of the process equipment and modernized units. During 2016, trainings in this relation were completed by 405 employees. More than 525 employees of the Group participated in trainings on mechanical engineering, process engineering, energy, law, leadership, business security, management, etc. In 2016, the project of internal trainings Expert Club. Refined Knowledge was further continued by aiming to exchange of knowledge and learning from each other. Experts being the experienced specialists and managers of the Parent Company prepared information and introduced activities of their departments as well as various projects to more than 400 employees. The group of 60 mid-level managers and specialists of the Parent Company continued and completed the Leadership Program initiated at the end of 2015, improving their knowledge of the refining market specifics, activities of the Company and management solutions, and taking part in business simulation classes. Seeking to further improve efficiency of the Group activities, LEAN management and skills development program was further continued in 2016 enrolling 332 employees of the Group. In 2016, the Group also continued the Program of Social Awareness and Relationship Management based on the DiSC methodology which involved 101 managers and employees of the Group. The Parent Company s remuneration system is aimed at encouraging its employees to pursue achievement of the best possible results. The remuneration system comprises of the following main parts: base salary (monthly salary or hourly wage), monthly, quarterly, or annual incentive bonus, reward for the initiatives submitted, implemented and recognized as rewardable, management discretion bonuses for exceptional performance, and annual bonus for the Company s performance results as well as the package of additional benefits under the Collective Agreements and other internal acts of the companies within the Group. Organizational Changes and Restructuring Performance optimization and labor efficiency increase remained one of the key targets of the Group to achieve the objectives set by its shareholders. To improve the efficiency of internal processes, the Parent Company was further implementing organizational changes. Implementation of the work organization associated changes and introduction of advanced technical and organizational solutions resulted in the performance indicators improvement. The number of active employees in the Group at the end of 2016 was 1,562 (including the Parent Company s Representative Office in Ukraine). 71
72 Environmental Protection In 2016, the Parent Company was operating in compliance with the established environmental requirements, introducing the changes required for adequate implementation of existing and evolving provisions. To prepare for application in the Parent Company of the conclusions on the best available techniques (BAT) for the refining of mineral oil and gas established in the 9 October 2014 Decision of the European Commission, the Parent Company was exercising the activities and realizing the projects included in the relevant action plan for the period until October 2018, with the costs of implementation to reach EUR million. In 2016, different environmental measures were implemented, with the most important of these being related to fuel and electricity savings allowing for reduction of industrial emissions. Implementation of the said measures in 2016 allowed the Parent Company s Refinery to reduce the energy consumption by approx. 5% in comparison with the year Certification and Maintaining of the Management Systems Activities of the Parent Company comply with the strict international integrated management system standards (ISO 9001, ISO 14001, BS OHSAS and ISO/IEC 27001). In 2016, the Parent Company further continued maintenance and improvement of its Integrated Management System which includes the areas of quality, environmental, information security as well as occupational health and safety management. In December of 2016, LRQA Lietuva completed audit of the Integrated Management System, by determining that activities of the Parent Company are compliant to the requirements of ISO 9001, ISO 14001, ISO/IEC and OHSAS standards, and extended validity of the relevant certificates until autumn of Occupational Health and Safety Safety is one of the priorities in the Parent Company. Safety First Program launched in 2012 ensures the highest level of occupational health and safety (OHS) in the Parent Company. The Parent Company is making constant progress in introducing the efficient measures which promote OHS culture and improve OHS level such as motivation system, system on reporting and eliminating dangerous places, employee training system, OHS inspection system with participation of the top management, system of permit issue for dangerous works, contractor management system, etc. In 2016, the Parent Company commenced implementation of the Health Program, performed assessment of fire safety and evacuation systems and developed their improvement measures. Consistent, year by year, improvement of Safety First Program and implementation of additional occupational health and safety measures allowed the Parent Company reaching the best results in the history of the Parent Company related to OHS indicators, i.e. the lowest number of accidents (2) and the best TRR indicator (number of accidents per 1 million man-hours) of Ownership Structure Shares of the Parent Company are owned by the sole shareholder Polski Koncern Naftowy ORLEN S.A. entitled to 100% of the shares. In 2016, the Group did not acquire or transfer any of its own shares. 72
73
Public Company ORLEN Lietuva
 2 0 CONSOLIDATED FINANCIAL STATEMENTS FOR THE YEAR ENDED 31 DECEMBER 2017 PREPARED IN ACCORDANCE WITH INTERNATIONAL FINANCIAL REPORTING STANDARDS AS ADOPTED BY EUROPEAN UNION 1 7 Table of contents: Independent
Public Company ORLEN Lietuva
 2 0 CONSOLIDATED FINANCIAL STATEMENTS FOR THE YEAR ENDED 31 DECEMBER 2015 PREPARED IN ACCORDANCE WITH INTERNATIONAL FINANCIAL REPORTING STANDARDS AS ADOPTED BY EUROPEAN UNION 1 5 Table of contents: Independent
GRUPA LOTOS S.A. FINANCIAL HIGHLIGHTS
 FINANCIAL HIGHLIGHTS PLN 000 EUR 000 Dec 31 2015 Dec 31 2014 Dec 31 2015 Dec 31 2014 Revenue 20,482,298 26,243,106 4,894,451 6,264,318 Operating profit/(loss) 183,757 (1,294,183) 43,911 (308,926) Pre-tax
Rhodia. Consolidated financial statements. Year ended December 31, 2009
 Rhodia Consolidated financial statements Year ended December 31, 2009 Rhodia Notes to the Consolidated Financial Statements for the Year ended December 31, 2009 1 / 82 CONTENTS A. CONSOLIDATED INCOME STATEMENTS...
ČEZ, a. s. FINANCIAL STATEMENTS
 ČEZ, a. s. FINANCIAL STATEMENTS PREPARED IN ACCORDANCE WITH INTERNATIONAL FINANCIAL REPORTING STANDARDS AS OF DECEMBER 31, 2017 ČEZ, a. s. BALANCE SHEET AS OF DECEMBER 31, 2017 in CZK Millions ASSETS:
in accordance with International Financial Reporting Standards (IFRS) as adopted by the European Union (EU)
 as adopted by the European Union (EU)") Financial Statements as at 31 December 2017 and for the year then ended in accordance with International Financial Reporting Standards (IFRS) as adopted by the European Union (EU) (Translation) Contents
Financial Statements as at 31 December 2017 and for the year then ended in accordance with International Financial Reporting Standards (IFRS) as adopted by the European Union (EU) (Translation) Contents
FINANCIAL STATEMENTS CONSOLIDATED BALANCE SHEET PROVISIONS CONSOLIDATED INCOME STATEMENT TRADE AND OTHER PAYABLES 84
 56 AALBERTS INDUSTRIES N.V. ANNUAL REPORT 2015 1. CONSOLIDATED BALANCE SHEET 58 18. PROVISIONS 81 2. CONSOLIDATED INCOME STATEMENT 59 19. TRADE AND OTHER PAYABLES 84 3. CONSOLIDATED STATEMENT OF COMPREHENSIVE
KOMERCIJALNA BANKA AD SKOPJE. Separate Financial Statements and Independent Auditors Report for the year ended December 31, 2016
 Separate Financial Statements and Independent Auditors Report for the year ended CONTENTS Page Independent Auditors Report Separate Statement of Profit and Loss and Other Comprehensive Income 1 Separate
Consolidated Financial Statements
 Consolidated Financial Statements Years ended March 31, 2018 and 2017 Consolidated Statement of Financial Position Sumitomo Chemical Company, Limited and Consolidated Subsidiaries March 31, 2018, 2017
Royal DSM Integrated Annual Report 2017
 Royal DSM Integrated Annual Report 2017 Financial Statements Consolidated financial statements Summary of significant accounting policies Basis of preparation DSM's consolidated financial statements have
Financial review Refresco Financial review 2017
 Financial review 2017 Financial review 2017 Financial review 2017 1 69 Consolidated income statement For the year ended December 31, 2017 (x 1 million euro) Note December 31, 2017 December 31, 2016 Revenue
BlueScope Financial Report 2013/14
 BlueScope Financial Report /14 ABN 16 000 011 058 Annual Financial Report - Page Financial statements Statement of comprehensive income 2 Statement of financial position 4 Statement of changes in equity
Consolidated Financial Statements and Independent Auditor s Report
 Consolidated Financial Statements and Independent Auditor s Report For the year ended 31 March, 2017 Daiichi Sankyo Company, Limited Contents Page 1) Consolidated Statement of Financial Position 1 2) Consolidated
Balsan / Carpet tiles
 Balsan / Carpet tiles Financial report I. Definitions 47 II. Financial statements 48 III. Notes to the consolidated financial statements for the year ended 30 November 2005 54 IV. Statutory auditor s report
Consolidated Financial Statements and Independent Auditor s Report
 Consolidated Financial Statements and Independent Auditor s Report For the year ended 31 March, 2018 Daiichi Sankyo Company, Limited Contents Page 1) Consolidated Statement of Financial Position 1 2) Consolidated
(Continued) ~3~ March 31, 2017 December 31, 2016 March 31, 2016 Assets Notes AMOUNT % AMOUNT % AMOUNT % Current assets
 ~3~ March 31, 2017 December 31, 2016 March 31, 2016 Assets Notes AMOUNT % AMOUNT % AMOUNT % Current assets") Current assets DAVICOM SEMICONDUCTOR, INC. AND SUBSIDIARIES CONSOLIDATED BALANCE SHEETS (Expressed in thousands of New Taiwan dollars) (The consolidated balance sheets as of March 31,2017 and 2016 are
Current assets DAVICOM SEMICONDUCTOR, INC. AND SUBSIDIARIES CONSOLIDATED BALANCE SHEETS (Expressed in thousands of New Taiwan dollars) (The consolidated balance sheets as of March 31,2017 and 2016 are
Consolidated financial statements. December 31, 2017
 Consolidated financial statements December 31, 2017 Table of contents 1.Consolidated statement of income... 2 Other comprehensive income... 3 2. Consolidated statement of cash flows... 4 3. Consolidated
Notes to the Consolidated Financial Statements
 121 Notes to the Consolidated Financial Statements 1. General information Neste Corporation (the Company) is a Finnish public limited liability company domiciled in Espoo, Finland. The company is listed
Unaudited consolidated interim financial statements and independent auditor s review report BORETS INTERNATIONAL LIMITED 30 June 2015
 Unaudited consolidated interim financial statements and independent auditor s review report BORETS INTERNATIONAL LIMITED 30 June 2015 Contents Independent Auditor s Review Report Unaudited Consolidated
9. Share-Based Payments Jointly Controlled Entities Other Operating Income Other Operating Expense 130
 92 Financial Report Detailed contents: Consolidated financial statements Consolidated Income Statement for the year ended 31 December Consolidated Statement of Comprehensive Income for the year ended 31
Financial Section Annual R eport 2018 Year ended March 31, 2018
 Financial Section Annual R eport 2018 Year ended March 31, 2018 Consolidated Financial Statements, Notes to the Consolidated Financial Statements and Independent Auditors' Report Consolidated Financial
PAO TMK Consolidated Financial Statements Year ended December 31, 2017
 Consolidated Financial Statements Consolidated Financial Statements Contents Independent auditor s report...3 Consolidated Income Statement...8 Consolidated Statement of Comprehensive Income...9 Consolidated
 11 Consolidated Statement of Profit or Loss and Other Comprehensive Income Year ended Notes 2017 2016 $ 000 $ 000 Revenue 19 16,513,084 15,780,756 Earnings before interest, depreciation, amortisation,
Notes to the Consolidated Financial Statements
 Financials > Financial Statements > Notes to the Consolidated Financial Statements > The Group s accounting policies for the Consolidated Financial Statements Notes to the Consolidated Financial Statements
ACERINOX, S.A. AND SUBSIDIARIES. 31 December 2015
 ACERINOX, S.A. AND SUBSIDIARIES Annual Accounts of the Consolidated Group 31 December 2015 (Free translation from the original in Spanish. In the event of discrepancy, the Spanishlanguage version prevails.)
in accordance with International Financial Reporting Standards (IFRS) as adopted by the European Union (EU)
 as adopted by the European Union (EU)") Financial Statements as at 31 December 2013 and for the year then ended in accordance with International Financial Reporting Standards (IFRS) as adopted by the European Union (EU) (Translation) Contents
Financial Statements as at 31 December 2013 and for the year then ended in accordance with International Financial Reporting Standards (IFRS) as adopted by the European Union (EU) (Translation) Contents
financial statements 2017
 financial statements 2017 1. Consolidated balance sheet 60 18. Provisions 84 2. Consolidated income statement 61 19. Trade and other payables 87 3. Consolidated statement of comprehensive income 62 20.
IFRS-compliant accounting principles
 IFRS-compliant accounting principles Since 1 January 2005, Uponor Corporation has prepared its consolidated financial statements in compliance with the following accounting principles: Main functions Uponor
Consolidated Financial Statements of ANGOSTURA HOLDINGS LIMITED. December 31, 2014 (Expressed in Trinidad and Tobago Dollars)
") Consolidated Financial Statements of (Expressed in Trinidad and Tobago Dollars) Consolidated Statement of Comprehensive Income Year ended (Expressed in Trinidad and Tobago Dollars) Restated Notes 2014
Consolidated Financial Statements of (Expressed in Trinidad and Tobago Dollars) Consolidated Statement of Comprehensive Income Year ended (Expressed in Trinidad and Tobago Dollars) Restated Notes 2014
E Consolidated Financial Statements
 E Consolidated Financial Statements 1. Significant accounting policies 204 2. Accounting estimates and assessments 214 3. Consolidated Group 215 4. Revenue 216 5. Functional costs 217 6. Other operating
TOTAL ASSETS 417,594, ,719,902
 WABERER'S International NyRt. CONSOLIDATED STATEMENT OF FINANCIAL POSITION data in EUR Description Note FY 2014 FY 2015 restated NON-CURRENT ASSETS Property 8 15,972,261 17,995,891 Construction in progress
Consolidated financial statements and independent auditor s report BORETS INTERNATIONAL LIMITED 31 December 2017
 Consolidated financial statements and independent auditor s report BORETS INTERNATIONAL LIMITED 31 December 2017 Contents Independent Auditor s Report Consolidated Statement of Financial Position 1 Consolidated
ADB GJENSIDIGE Interim Financial Statements for the period ended 30 September 2017
 ADB GJENSIDIGE Interim Financial Statements for the period ended 30 September 2017 ADB Gjensidige CONTENTS Page FINANCIAL STATEMENTS : STATEMENT OF FINANCIAL POSITION 3-4 STATEMENT OF COMPREHENSIVE INCOME
Pieno Žvaigždės, AB. Financial statements for the year ended 31 December 2014
 Financial statements for the year Table of contents Company details 1 Management s statement on the financial statements 2 Independent auditor s report 3 Statement of comprehensive income 5 Statement of
FINANCIAL STATEMENTS 2015
 FINANCIAL STATEMENTS 2015 INDEPENDENT AUDITOR S REPORT AND FINANCIAL STATEMENTS (PREPARED IN ACCORDANCE WITH INTERNATIONAL FINANCIAL REPORTING STANDARDS, AS ADOPTED BY THE EU) For the year ended 31 December
NESTE Financial Statements
 NESTE 2016 Financial Statements 2 Financial Statements Consolidated Statement of Income... 3 Consolidated Statement of Comprehensive Income... 3 Consolidated Statement of Financial Position... 4 Consolidated
International Financial Reporting Standards Consolidated Financial Statements and Auditors Report
 JSC Chelyabinsk Zinc Plant International Financial Reporting Standards Consolidated Financial Statements and Auditors Report For the years ended 31 December 2005, 2004 and 2003 Contents STATEMENT OF MANAGEMENT
(Prepared in Accordance with International Financial Reporting Standards as Adopted by the EU)
") (Prepared in Accordance with International Financial Reporting Standards as Adopted by the EU) INDEPENDENT AUDITOR S REPORT AND SEPARATE FINANCIAL STATEMENTS (PREPARED IN ACCORDANCE WITH INTERNATIONAL
(Prepared in Accordance with International Financial Reporting Standards as Adopted by the EU) INDEPENDENT AUDITOR S REPORT AND SEPARATE FINANCIAL STATEMENTS (PREPARED IN ACCORDANCE WITH INTERNATIONAL
Monetary figures in the financial statements are expressed in millions of euros unless otherwise stated.
 Notes to the consolidated financial statements General information Orion Corporation is a Finnish public limited liability company domiciled in Espoo, Finland, and registered at Orionintie 1, FI-02200
2005 Financial Statements. Consolidated Financial Statements of the Nestlé Group Annual Report of Nestlé S.A.
 2005 Financial Statements Consolidated Financial Statements of the Nestlé Group Annual Report of Nestlé S.A. Consolidated Financial Statements of the Nestlé Group 3 Consolidated income statement for the
Azer-Turk Bank Open Joint Stock Company Financial statements. Year ended 31 December 2016 together with independent auditor s report
 Financial statements Year ended 31 December together with independent auditor s report financial statements Contents Independent auditor s report Financial statements Statement of financial position...
ELECTROMAGNETICA SA SEPARATE FINANCIAL STATEMENTS PREPARED IN ACCORDANCE WITH
 SEPARATE FINANCIAL STATEMENTS PREPARED IN ACCORDANCE WITH Ministry of Public Finance Order no. 2844/2016 approving the Accounting Regulations compliant with International Financial Reporting Standards
FINANCIAL STATEMENTS
 FINANCIAL STATEMENTS 2 ab LIETUVOS PAŠTAS FINANCIAL STATEMENTS 2010 CONTENTS Contents 3 5 7 8 9 11 29 Independent auditors report to the shareholder of PUBLIC LIMITED company Lietuvos paštas BALANCE SHEET
GCS HOLDINGS, INC. AND SUBSIDIARY
 GCS HOLDINGS, INC. AND SUBSIDIARY CONSOLIDATED FINANCIAL STATEMENTS AND REVIEW REPORT OF INDEPENDENT ACCOUNTANTS JUNE 30, 2013 AND REVIEW REPORT OF INDEPENDENT ACCOUNTANTS To the Board of Directors and
Notes to the Consolidated Financial Statements
 Notes to the Consolidated Financial Statements Contents C1 Significant Accounting Policies...38 C2 Critical Accounting Estimates and Judgments... 47 C3 C4 C5 C6 C7 C8 C9 Segment Information...49 Net Sales...53
JAMAICAN TEAS LIMITED CONSOLIDATED FINANCIAL STATEMENTS 30 SEPTEMBER 2015
 CONSOLIDATED FINANCIAL STATEMENTS CONSOLIDATED FINANCIAL STATEMENTS I N D E X PAGE Independent Auditors' Report to the Members 1-2 FINANCIAL STATEMENTS Consolidated Statement of Profit or Loss and Other
INFORMA 2017 FINANCIAL STATEMENTS 1
 INFORMA 2017 FINANCIAL STATEMENTS 1 GENERAL INFORMATION This document contains Informa s Consolidated Financial Statements for the year ending 31 December 2017. These are extracted from the Group s 2017
KOMERCIJALNA BANKA AD SKOPJE. Separate Financial Statements and Independent Auditors Report for the year ended December 31, 2017
 Separate Financial Statements and Independent Auditors Report for the year ended CONTENTS Page Independent Auditors Report Separate Statement of Profit and Loss and Other Comprehensive Income 1 Separate
Independent Auditor s Report to the Members of Caltex Australia Limited
 61 Independent Auditor s Report to the Members of Caltex Australia Limited Report on the financial report We have audited the accompanying financial report of Caltex Australia Limited (the Company), which
Linamar Corporation December 31, 2012 and December 31, 2011 (in thousands of dollars)
") CONSOLIDATED FINANCIAL STATEMENTS Linamar Corporation, and, (in thousands of dollars) 1 MANAGEMENT S RESPONSIBILITY FOR THE CONSOLIDATED FINANCIAL STATEMENTS The management of Linamar Corporation is responsible
CONSOLIDATED FINANCIAL STATEMENTS Linamar Corporation, and, (in thousands of dollars) 1 MANAGEMENT S RESPONSIBILITY FOR THE CONSOLIDATED FINANCIAL STATEMENTS The management of Linamar Corporation is responsible
WE HAVE A SOUND FINANCIAL BASIS!
 WE HAVE A SOUND FINANCIAL BASIS! The Consolidated Financial Statements presented as follows have been prepared in accordance with the International Financial Reporting Standards (IFRS) as adopted by the
NALCOR ENERGY MARKETING CORPORATION FINANCIAL STATEMENTS December 31, 2017
 FINANCIAL STATEMENTS December 31, 2017 Deloitte LLP 5 Springdale Street, Suite 1000 St. John's NL A1E 0E4 Canada Tel: (709) 576-8480 Fax: (709) 576-8460 www.deloitte.ca Independent Auditor s Report To
Johnson Matthey / Annual Report and Accounts 2018
 136 Johnson Matthey / Annual Report and 2018 Contents 138 Consolidated Income Statement 138 Consolidated Statement of Total Comprehensive Income 139 Consolidated and Parent Company Balance Sheets 140 Consolidated
SAUDI BASIC INDUSTRIES CORPORATION (SABIC) AND ITS SUBSIDIARIES (A Saudi Joint Stock Company)
 AND ITS SUBSIDIARIES (A Saudi Joint Stock Company)") SAUDI BASIC INDUSTRIES CORPORATION (SABIC) AND ITS SUBSIDIARIES INTERIM CONDENSED CONSOLIDATED FINANCIAL STATEMENTS FOR THE THREE MONTH PERIOD AND YEAR ENDED 31 DECEMBER 2017 AND INDEPENDENT AUDITORS REVIEW
SAUDI BASIC INDUSTRIES CORPORATION (SABIC) AND ITS SUBSIDIARIES INTERIM CONDENSED CONSOLIDATED FINANCIAL STATEMENTS FOR THE THREE MONTH PERIOD AND YEAR ENDED 31 DECEMBER 2017 AND INDEPENDENT AUDITORS REVIEW
GASUM CONSOLIDATED (IFRS) FINANCIAL STATEMENTS 2013
 FINANCIAL STATEMENTS 2013") GASUM CONSOLIDATED (IFRS) FINANCIAL STATEMENTS 2013 Cleanly with natural energy gases USE TRANSMISSION AND DISTRIBUTION LNG PRODUCTION, SOURCING AND SALES CONTENTS CONTENTS... 2 CONSOLIDATED STATEMENT
GASUM CONSOLIDATED (IFRS) FINANCIAL STATEMENTS 2013 Cleanly with natural energy gases USE TRANSMISSION AND DISTRIBUTION LNG PRODUCTION, SOURCING AND SALES CONTENTS CONTENTS... 2 CONSOLIDATED STATEMENT
PALESTINE DEVELOPMENT AND INVESTMENT LIMITED (PADICO) CONSOLIDATED FINANCIAL STATEMENTS
 CONSOLIDATED FINANCIAL STATEMENTS") PALESTINE DEVELOPMENT AND INVESTMENT LIMITED (PADICO) CONSOLIDATED FINANCIAL STATEMENTS DECEMBER 31, 2014 Ernst & Young Jordan P.O. Box 1140 Amman 11118 Jordan Tel: +962 6552 6111/+962 6552 7666 Fax: +962
PALESTINE DEVELOPMENT AND INVESTMENT LIMITED (PADICO) CONSOLIDATED FINANCIAL STATEMENTS DECEMBER 31, 2014 Ernst & Young Jordan P.O. Box 1140 Amman 11118 Jordan Tel: +962 6552 6111/+962 6552 7666 Fax: +962
Financial Statements. First Nations Bank of Canada October 31, 2017
 Financial Statements First Nations Bank of Canada Independent auditors report To the Shareholders of First Nations Bank of Canada We have audited the accompanying financial statements of First Nations
JSC VTB Bank (Georgia) Consolidated financial statements
 Consolidated financial statements") Consolidated financial statements For the year ended 31 December 2017 together with independent auditor s report 2017 consolidated financial statements Contents Independent auditor s report Consolidated
Consolidated financial statements For the year ended 31 December 2017 together with independent auditor s report 2017 consolidated financial statements Contents Independent auditor s report Consolidated
PAO TMK Consolidated Financial Statements Year ended December 31, 2016
 Consolidated Financial Statements Consolidated Financial Statements Contents Independent auditor s report...3 Consolidated Income Statement...8 Consolidated Statement of Comprehensive Income...9 Consolidated
PJSC Enel Russia Consolidated financial statements. For the year ended 31 December 2016 with independent auditor s report
 Consolidated financial statements 31 December 2016 with independent auditor s report Consolidated financial statements 31 December 2016 Contents Independent auditor s report... 3 Consolidated statement
CLARION CO., LTD. AND SUBSIDIARIES
 Consolidated Financial Statements, etc. Consolidated Financial Statements 1) Consolidated Statements of Financial Position As of March 31, 2016 As of March 31, 2015 As of March 31, 2016 Thousands of U.S.
EVA AIRWAYS CORP. Parent-Company-Only Financial Statements December 31, 2015 and 2014 (With Independent Auditors' Report Thereon)
") Parent-Company-Only Financial Statements December 31, 2015 and 2014 (With Independent Auditors' Report Thereon) Address: No. 376, Sec. 1, Hsin-nan Road, Luchu Dist., Taoyuan City, Taiwan Telephone No.:
Parent-Company-Only Financial Statements December 31, 2015 and 2014 (With Independent Auditors' Report Thereon) Address: No. 376, Sec. 1, Hsin-nan Road, Luchu Dist., Taoyuan City, Taiwan Telephone No.:
Consolidated Financial Statements in Accordance with International Financial Reporting Standards (IFRS)
") Consolidated Financial Statements in Accordance with International Financial Reporting Standards (IFRS) Fiscal Years Ended December 31, 2012 and 2011 Rakuten, Inc. and its Consolidated Subsidiaries Table
Consolidated Financial Statements in Accordance with International Financial Reporting Standards (IFRS) Fiscal Years Ended December 31, 2012 and 2011 Rakuten, Inc. and its Consolidated Subsidiaries Table
Annual report of Grupa LOTOS S.A Annual report of Grupa LOTOS S.A. 2016
 Annual report of Grupa LOTOS S.A. 2016 Annual report of Grupa LOTOS S.A. 2016 Annual report of Grupa LOTOS S.A. 2016 A. Letter of the President of the Management Board B. Grupa LOTOS S.A. Financial highlights
Accounting policies extracted from the 2016 annual consolidated financial statements
 Steinhoff International Holdings N.V. (Steinhoff N.V.) is a Netherlands registered company with tax residency in South Africa. The consolidated annual financial statements of Steinhoff N.V. for the period
AB KAUNO ENERGIJA SET OF CONSOLIDATED AND PARENT COMPANY S FINANCIAL STATEMENTS FOR THE 9 MONTHS 2018, PREPARED ACCORDING TO INTERNATIONAL FINANCIAL
 AB KAUNO ENERGIJA SET OF CONSOLIDATED AND PARENT COMPANY S FINANCIAL STATEMENTS FOR THE 9 MONTHS 2018, PREPARED ACCORDING TO INTERNATIONAL FINANCIAL REPORTING STANDARDS, AS ADOPTED BY THE EUROPEAN UNION
F Consolidated Financial Staements
 F Consolidated Financial Staements 1. Significant accounting policies 244 2. Accounting estimates and management judgements 255 3. Consolidated Group 256 4. Revenue 258 5. Functional costs 258 6. Other
TECO IMAGE SYSTEMS CO., LTD. AND SUBSIDIARIES CONSOLIDATED FINANCIAL STATEMENTS AND REVIEW REPORT OF INDEPENDENT ACCOUNTANTS JUNE 30, 2016 AND 2015
 TECO IMAGE SYSTEMS CO., LTD. AND SUBSIDIARIES CONSOLIDATED FINANCIAL STATEMENTS AND REVIEW REPORT OF INDEPENDENT ACCOUNTANTS JUNE 30, 2016 AND 2015 -----------------------------------------------------------------------------------------------------------------------------
NALCOR ENERGY MARKETING CORPORATION FINANCIAL STATEMENTS December 31, 2016
 FINANCIAL STATEMENTS December 31, 2016 Deloitte LLP 5 Springdale Street, Suite 1000 St. John's NL A1E 0E4 Canada Tel: (709) 576-8480 Fax: (709) 576-8460 www.deloitte.ca Independent Auditor s Report To
Consolidated and the parent company s separate financial statements for the year ended 31 December 2017
 Consolidated and the parent company s separate financial statements for the year ended 31 December 2017 VILKYŠKIŲ PIENINĖ AB Consolidated and separate financial statements for the year ended 31 December
DOOSAN ENGINE CO., LTD. SEPARATE FINANCIAL STATEMENTS AS OF AND FOR THE YEARS ENDED DECEMBER 31, 2012 AND 2011, AND INDEPENDENT AUDITORS REPORT
 DOOSAN ENGINE CO., LTD. SEPARATE FINANCIAL STATEMENTS AS OF AND FOR THE YEARS ENDED DECEMBER 31, 2012 AND 2011, AND INDEPENDENT AUDITORS REPORT Independent Auditors Report English Translation of a Report
BE VANDEMOORTELE NV 3 KEY FINANCIAL FIGURES
 BE 0429 977 343 VANDEMOORTELE NV 3 KEY FINANCIAL FIGURES BE 0429 977 343 VANDEMOORTELE NV 4 BE 0429 977 343 VANDEMOORTELE NV 5 CONSOLIDATED INCOME STATEMENT As the shares are not traded in a public market,
Financial Statements and Independent Auditors' Report. Universal Investment Bank AD, Skopje. 31 December 2013
 Financial Statements and Independent Auditors' Report Universal Investment Bank AD, Skopje 31 December 2013 Universal Investment Bank, AD Skopje Contents Page Independent Auditors Report 1 Statement of
ČEZ, a. s. FINANCIAL STATEMENTS
 ČEZ, a. s. FINANCIAL STATEMENTS PREPARED IN ACCORDANCE WITH INTERNATIONAL FINANCIAL REPORTING STANDARDS AS OF DECEMBER 31, 2018 ČEZ, a. s. BALANCE SHEET AS OF DECEMBER 31, 2018 in CZK Millions ASSETS:
INTELLIEPI INC. (CAYMAN) AND SUBSIDIARIES CONSOLIDATED FINANCIAL STATEMENTS AND REPORT OF INDEPENDENT ACCOUNTANTS DECEMBER 31, 2016 AND 2015
 AND SUBSIDIARIES CONSOLIDATED FINANCIAL STATEMENTS AND REPORT OF INDEPENDENT ACCOUNTANTS DECEMBER 31, 2016 AND 2015") INTELLIEPI INC. (CAYMAN) AND SUBSIDIARIES CONSOLIDATED FINANCIAL STATEMENTS AND REPORT OF INDEPENDENT ACCOUNTANTS DECEMBER 31, 2016 AND 2015 ---------------------------------------------------------------------------------------------------------
INTELLIEPI INC. (CAYMAN) AND SUBSIDIARIES CONSOLIDATED FINANCIAL STATEMENTS AND REPORT OF INDEPENDENT ACCOUNTANTS DECEMBER 31, 2016 AND 2015 ---------------------------------------------------------------------------------------------------------
THE GALA CORAL GROUP PRELIMINARY INTERNATIONAL FINANCIAL REPORTING STANDARDS (IFRS) TRANSITION STATEMENTS
 TRANSITION STATEMENTS") THE GALA CORAL GROUP PRELIMINARY INTERNATIONAL FINANCIAL REPORTING STANDARDS (IFRS) TRANSITION STATEMENTS INTRODUCTION Implementation of International Financial Reporting Standards ( IFRS ) For the year
THE GALA CORAL GROUP PRELIMINARY INTERNATIONAL FINANCIAL REPORTING STANDARDS (IFRS) TRANSITION STATEMENTS INTRODUCTION Implementation of International Financial Reporting Standards ( IFRS ) For the year
 STATEMENT OF PROFIT OR LOSS For the year ended 31 December 2014 Financial statements Note 2014 2013 Interest income Cash and cash equivalents 893,744 506,424 Loans to customers 1,020,693 440,642 Amounts
MANAGEMENT S RESPONSIBILITY FOR FINANCIAL REPORTING
 MANAGEMENT S RESPONSIBILITY FOR FINANCIAL REPORTING The preparation and presentation of the Company s consolidated financial statements is the responsibility of management. The consolidated financial statements
May & Baker Nig Plc RC. UNAUDITED CONSOLIDATED FINANCIAL STATEMENTS 31 MARCH 2017
 ` May & Baker Nig Plc RC. 558 UNAUDITED CONSOLIDATED FINANCIAL STATEMENTS 31 MARCH 2017 UNAUDITED CONSOLIDATED STATEMENT OF PROFIT OR LOSS AND OTHER COMPREHENSIVE INCOME Note Continuing operations Revenue
KOMERCIJALNA BANKA AD SKOPJE. Consolidated financial statements and Independent Auditors Report For the year ended December 31, 2017
 Consolidated financial statements and Independent Auditors Report For the year ended CONTENTS Page Independent Auditors Report Consolidated statement of profit or loss and other comprehensive Income 1
PJSC LUKOIL CONSOLIDATED FINANCIAL STATEMENTS
 CONSOLIDATED FINANCIAL STATEMENTS 31 December 2017 Consolidated Statement of Financial Position (Millions of Russian rubles) Assets 31 December 31 December Note Current assets Cash and cash equivalents
JOINT STOCK COMPANY AIR ASTANA. Financial Statements For the year ended 31 December 2012
 JOINT STOCK COMPANY AIR ASTANA Financial Statements For the year ended 2012 JOINT STOCK COMPANY AIR ASTANA TABLE OF CONTENTS Page STATEMENT OF MANAGEMENT S RESPONSIBILITIES FOR THE PREPARATION AND APPROVAL
OAO GAZPROM IFRS CONSOLIDATED FINANCIAL STATEMENTS 31 DECEMBER 2013
 IFRS CONSOLIDATED FINANCIAL STATEMENTS 31 DECEMBER 2013 Independent Auditor s Report To the Shareholders and Board of Directors of OAO Gazprom We have audited the accompanying consolidated financial statements
Financial supplement NPM/CNP. Compagnie Nationale à Portefeuille Nationale PortefeuilleMaatschappij
 Financial supplement 2004 NPM/CNP Compagnie Nationale à Portefeuille Nationale PortefeuilleMaatschappij CONSOLIDATED ANNUAL ACCOUNTS Page Statutory auditor's report 2 Consolidated income statement 4 Consolidated
BRITISH COLUMBIA FERRY SERVICES INC.
 Consolidated Financial Statements of BRITISH COLUMBIA FERRY SERVICES INC. INDEPENDENT AUDITORS REPORT To the Shareholders of British Columbia Ferry Services Inc. We have audited the accompanying consolidated
Intesa Sanpaolo Banka d.d. Bosna i Hercegovina
 Intesa Sanpaolo Banka d.d. Bosna i Hercegovina Financial Statements as at 2016 Intesa Sanpaolo Banka, d.d. Financial statements as at 2016 Contents Management Board s Report 2 Responsibilities of the Management
2 To the shareholders. 15 Statement of the Board of Directors. 5 Overview of financial results
 High-quality solutions for rising demands. Financial Statements and Corporate Governance 212 Content Group Review 212 1 Schindler in brief 2 Schindler in brief 2 To the shareholders 15 Statement of the
MULTICARE PHARMACEUTICALS PHILIPPINES, INC. (A Subsidiary of Lupin Holdings, B.V.)
") MULTICARE PHARMACEUTICALS PHILIPPINES, INC. (A Subsidiary of Lupin Holdings, B.V.) Financial Statements March 31, 2017 and 2016 and Independent Auditors Report 26 th Floor, Rufino Tower Building, 6784
MULTICARE PHARMACEUTICALS PHILIPPINES, INC. (A Subsidiary of Lupin Holdings, B.V.) Financial Statements March 31, 2017 and 2016 and Independent Auditors Report 26 th Floor, Rufino Tower Building, 6784
FINANCIAL SECTION 2016 ASAHI GROUP HOLDINGS, LTD. CONTENTS
 FINANCIAL SECTION 2016 ASAHI GROUP HOLDINGS, LTD. CONTENTS 2 CONSOLIDATED STATEMENT OF FINANCIAL POSITION 4 CONSOLIDATED STATEMENT OF PROFIT OR LOSS 4 CONSOLIDATED STATEMENT OF COMPREHENSIVE INCOME 5 CONSOLIDATED
NIS А.D. Naftna industrija Srbije Novi Sad. Interim Condensed Financial Statements For The Nine Month Period Ended September 30, 2010 (unaudited)
") NIS А.D. Naftna industrija Srbije Novi Sad Interim Condensed Financial Statements For The Nine Month Period Ended (unaudited) Novi Sad, October 28, C O N T E N T S : Page Condensed Balance Sheet 3 Condensed
NIS А.D. Naftna industrija Srbije Novi Sad Interim Condensed Financial Statements For The Nine Month Period Ended (unaudited) Novi Sad, October 28, C O N T E N T S : Page Condensed Balance Sheet 3 Condensed
Schindler in brief To the shareholders Elevators & Escalators. Corporate Citizenship Overview of financial results Financial calendar
 Global challenges. First-class solutions. Financial Statements and Corporate Governance 2 Schindler in brief To the shareholders Elevators & Escalators Corporate Citizenship Overview of financial results
CLARION CO., LTD. AND SUBSIDIARIES
 Consolidated Financial Statements, etc. Consolidated Financial Statements 1) Consolidated Statements of Financial Position As of March 31, 2018 As of March 31, 2017 As of March 31, 2018 Thousands of U.S.
BLUESCOPE STEEL LIMITED FINANCIAL REPORT 2011/2012
 BLUESCOPE STEEL LIMITED FINANCIAL REPORT / ABN 16 000 011 058 Annual Financial Report - Page Financial statements Statement of comprehensive income 2 Statement of financial position 3 Statement of changes
C ONSOLIDATED FINANCIAL STATEMENTS. Algeco Scotsman Global S.à r.l. Years Ended December 31, 2012, 2011 and 2010 With Report of Independent Auditors
 C ONSOLIDATED FINANCIAL STATEMENTS Algeco Scotsman Global S.à r.l. Years Ended December 31, 2012, 2011 and 2010 With Report of Independent Auditors Table of Contents Consolidated Statements of Comprehensive
Maria Perrella. Andrew Hider. Chief Executive Officer. Chief Financial Officer
 MANAGEMENT S RESPONSIBILITY FOR FINANCIAL REPORTING The preparation and presentation of the Company s consolidated financial statements is the responsibility of management. The consolidated financial statements
SENAO NETWORKS, INC. AND SUBSIDIARIES
 SENAO NETWORKS, INC. AND SUBSIDIARIES CONSOLIDATED FINANCIAL STATEMENTS AND REVIEW REPORT OF INDEPENDENT ACCOUNTANTS SEPTEMBER 30, 2015 AND 2014 ------------------------------------------------------------------------------------------------------------------------------------
Georgian Leasing Company LLC Consolidated financial statements
 Consolidated financial statements For the year ended 31 December together with the independent auditor s report Consolidated financial statements Contents Independent auditor s report Consolidated statement
Yapi Kredi Bank Azerbaijan CJSC Consolidated financial statements
 Yapi Kredi Bank Azerbaijan CJSC Consolidated financial statements Year ended 31 December 2014 together with independent auditors report 2014 Consolidated financial statements Contents Independent auditors
CONSOLIDATED FINANCIAL STATEMENTS
 CONSOLIDATED FINANCIAL STATEMENTS 66 Consolidated Statement of Comprehensive Income 67 Consolidated Balance Sheet 68 Consolidated Statement of Changes in Equity 69 Consolidated Statement of Cash Flows
INDEPENDENT AUDITOR S REPORT AND FINANCIAL STATEMENTS FOR THE PERIOD ENDING 31 DECEMBER 2013 (According IFRS) Skopje, March 2014
 Skopje, March 2014") INDEPENDENT AUDITOR S REPORT AND FINANCIAL STATEMENTS FOR THE PERIOD ENDING 31 DECEMBER 2013 (According IFRS) Skopje, March 2014 These reports are translation from the official ones issued on macedonian
INDEPENDENT AUDITOR S REPORT AND FINANCIAL STATEMENTS FOR THE PERIOD ENDING 31 DECEMBER 2013 (According IFRS) Skopje, March 2014 These reports are translation from the official ones issued on macedonian