The Platform for the Connected Home and Business
|
|
|
- Karin Melton
- 5 years ago
- Views:
Transcription
1 The Platform for the Connected Home and Business November 2018 Copyright Alarm.com 2018
2 Safe harbor statement Forward-Looking Statements This presentation contains forward-looking statements that involve risks and uncertainties. All statements other than statements of historical fact contained in this presentation, including, but not limited to, statements regarding our possible or expected future results of operations, our financial position, our business strategy, our product development plans, including product and feature releases and related benefits, our competitive position, addressable markets, industry trends, potential growth opportunities, our ability to successfully expand in existing markets including internationally, our ability to attract new subscribers, development and growth in our partner ecosystem, and our future financial performance, including our target financial model and expected future revenue, are forward-looking statements. Any such statements are not guarantees of future performance, but are based on our assumptions, expectations and beliefs as of the date of this presentation and are subject to substantial risks, uncertainties, assumptions, and changes in circumstances that may cause our actual results, performance, or achievements to differ materially from those expressed or implied in any forward-looking statement. Investors should not place undue reliance on our forward-looking statements. For more information about factors that may cause our actual results to differ materially from these forwardlooking statements, please refer to the reports we file with the Securities and Exchange Commission (the SEC ) from time to time, including our most recent Annual Report on Form 10-K for the year ended December 31, 2017, filed with the SEC on February 28, 2018, our most recent Quarterly Report on 10-Q for the quarter ended September 30, 2018, filed with the SEC on November 7, 2018 and our subsequent filings with the SEC. Except as required by law, we assume no obligation to update these forward-looking statements publicly, or to update the reasons actual results could differ materially from those anticipated in the forward-looking statements, even if new information becomes available in the future. The information in this presentation on new products, features or functionality is intended to outline our general product direction. The information on new products, features, and functionality is not a commitment, promise or legal obligation to deliver any feature or functionality. The development, release, and timing of any features or functionality described for our products remains at our sole discretion. Non-GAAP Financial Measures This presentation also contains certain non-gaap financial measures as defined by the SEC rules. These non-gaap financial measures are in addition to, and not a substitute for or superior to, measures of financial performance prepared in accordance with GAAP. As required by Regulation G, we have provided a reconciliation of those measures to their most directly comparable GAAP measures, which is available in the Appendix slides to this presentation. Please refer to our November 7, 2018 press release for information as to why we believe these non-gaap financial measures are useful to investors and others in assessing our operating results. We urge investors not to rely on any single financial measure to evaluate our business. 2
3 Company Overview Market Opportunity AGENDA Alarm.com Solution Competitive Advantages Growth Drivers Financial Overview 3

4 Company Overview Founded in 2000 IPO in June 2015; Nasdaq: ALRM Smart Home and Business Solutions to intelligently protect, monitor and manage properties worldwide Go-to-market via 7,000+ service provider partners 5.5 million+ subscribers 866 employees Note: Data as of September 30,


5 Key Investment Highlights Large & Growing Market Market Leader & Innovator SaaS Recurring Revenue Model Strong Growth & Profitable 5


6 Market Leading Innovation 6

7 Largest Platform for Intelligently Connected Properties Million Subscribers Billion Data Points in the last year alone 80 + Millions of Connected Devices 7


8 August Locks now work with home security systems powered by Alarm.com You can expand your system with popular smart-home devices through Alarm.com We are making the video camera smarter Alarm.com s enterprise services support the end-to-end needs of Smart Home Security Dealers. The promise of cost-effective solutions that leverage AI are beginning to materialize with new video analytics from Alarm.com One of the coolest integrations we saw was all the smart home stuff you can control through Alarm.com. FEATURED IN: 8
9 MARKET OPPORTUNITY 9
10 Global Connected Home Security Market Professional Installation ($B) $ $ $4.1 $4.8 $5.8 $ Source: Technavio, Morgan Stanley Research 10

11 Security: TOP SMART HOME CONSUMER BENEFIT Personal and family security 41% Energy/resource management Property loss protection Indoor convenience 13% 16% 16% Smart Home Considerations: Who installs, integrates and supports a security-centric smart home system? Who can create and manage a tightly controlled ecosystem for these devices to work well together? How can the data from these devices be leveraged? Source: Business Insider,


12 120 million North American Homes Current Home Security Market 75 million owned homes 45 million rented homes 22 million homes with professionally monitored security Source: Pew Research 12
13 Current Home Security Market 22 Million Homes 5.5+ million Alarm.com ACCOUNT TYPES (North American households) SMART HOME SECURITY Controlled and managed via mobile apps 8 million smart home security High subscriber value and engagement 14 million traditional security TRADITIONAL SECURITY Controlled and managed locally Limited capabilities and low engagement Source: Parks Associates 13

14 Projected Home Security Market in Million Homes ACCOUNT TYPES (North American households) 16 million smart home security 10 million traditional security SMART HOME ADOPTION D R I V E N B Y T H E S E C U R I T Y C H A N N E L Nearly two-thirds of smart home devices are attached to a centralized controller provided by a security company Source: Parks Associates 14


15 Small and Medium Sized Business Market ~4 million target properties in US High penetration of traditional services Opportunity to upgrade to integrated, smart business solutions Source: Parks Associates 15
16 A LARM.COM SOLUTION 16


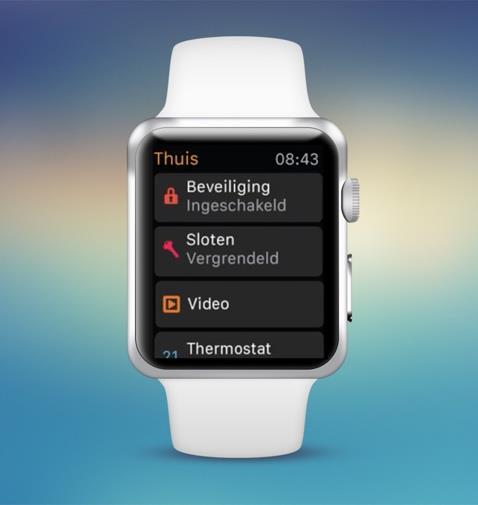
17 Intelligent Solutions Interactive Security Video Monitoring Energy Management Intelligent Automation Wellness Solutions 17


18 Alarm.com Platform Unified Experience Intelligent Solutions Security Access Video Energ y Lights Garage Water Internet of Things Ecosystem Advanced Cloud Platform 18

19 OPEN, FLEXIBLE ECOSYSTEM 19


20 SIRI SHORTCUTS Use Siri to arm, disarm, and run Scenes. More commands coming soon! Hey Siri, I m almost home from work Done. Alarm.com says: Running Almost Home Scene. Almost Home Scene: Porch Lights On Interior Garage Door Unlocked Hallway Light On A/C Set to Cool Audio On 20


21 Subsidized by Major Utilities Energy Savings Verified by EPA Guaranteed Accurate Measurements Copyright Alarm.com


22 SMARTER BUILDER SUPPORT Heating and Cooling Systems In-Wall Lighting Control 22
23 A LARM.COM FOR BUSINESS 23


24 A Unified Solution Security Video Access Energy Copyright Copyright Alarm.com

25 Play Video 25


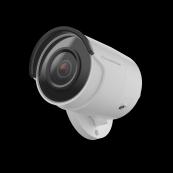
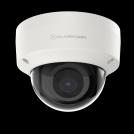
26 Commercial-Grade Video Solutions Flexibly addresses the needs of many types of small and medium sized business Broad portfolio of commercial-grade video cameras Integrated with intrusion and access control into a single, intelligent solution Live streaming HD video and recorded clips of important activity 26

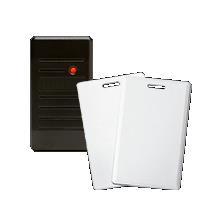
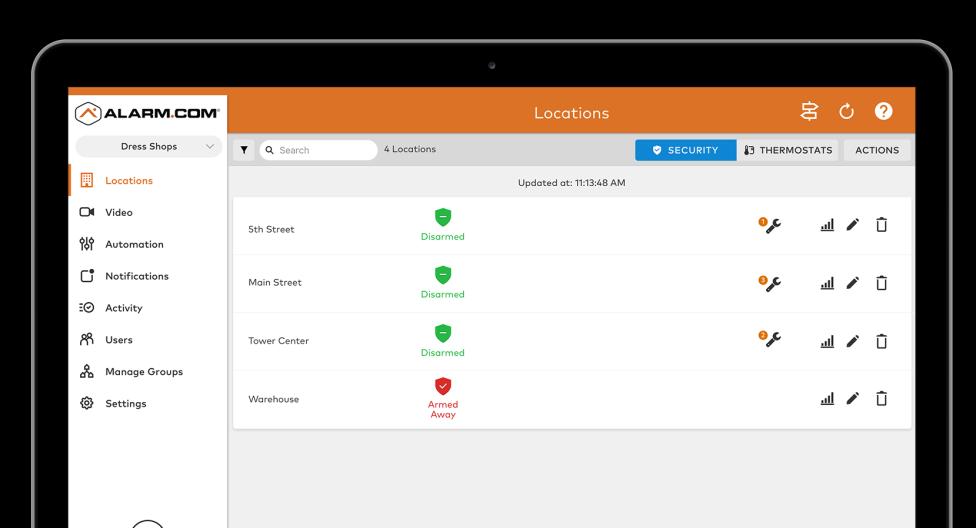
27 Smarter Access Control Securely manage access to assets and facilities ranging from storefronts to entire office. Intuitive, cloud-based user management software designed for the SMB market Enterprise-grade integration streamlines permission management across all access points and for multiple employees Retrofit friendly and minimal on-site hardware for competitive price point. 27


28 IN-APP UPSELL: ACCESS CONTROL New card on app home screen Tap to open animated, interactive sequence 28
29 A LARM.COM AI 29

30 Play Video 30


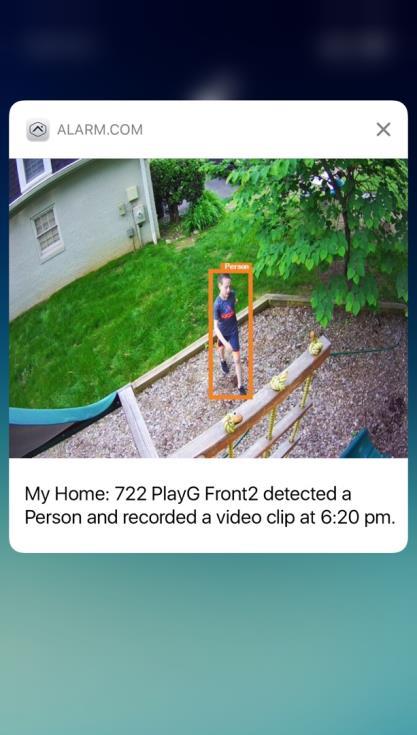


31 ALERTS THAT MATTER Person Stay Connected to Family Enhance Perimeter Security Catch the Unexpected 31
32 COMPETITIVE ADVANTAGES 32


33 Go to Market Strategy 7,000+ Service Provider Partners Residential ~22 million homes in the US have monitored home security (Parks Associates) Commercial ~4 million commercial buildings in the US are less than 10,000 square feet (EIA) 33


34 Sales, Marketing and Training Resources Customer Engagement and Upsell Solutions Remote Diagnostics and Support Tools Business Intelligence Reporting 34
35 How We re Different For years, Alarm.com has continued to achieve strong growth even as the DIY/Retail market segment has more entrants, thanks to several key distinctions: DIY/RETAIL PRODUCTS Typically singular device with narrow capability; added devices require separate apps/seldom integrate Primarily home automation devices; most end-users seek convenience and are lured by marketing User-installed User resolves technical glitches with limited support Typically self-monitored Broad system of multiple devices and capabilities, well-integrated with single app control Users seek security first, often triggered by life event (family expansion, new home, etc.), but they also value home automation Professional installation Ongoing professional tech support Professionally-monitored 35
36 GROWTH DRIVERS 36
37 Compelling Growth Drivers Add more subscribers (Currently 5.5 million+) Upsell and cross sell existing subscribers (In App Ads and Upsell Engine) Grow Commercial (Enable existing service providers and add new partners) Grow International Grow Verticals Property Mgmt. & Vacation Rental, Demand Response, Wellness, Etc. Add more Service Provider Partners (Currently 7,000 +) 37


38 Growth Opportunities 1.4B-1.5B households worldwide 5.3% Global smart home penetration Global Markets Property Management Energy Management Alarm.com services are available Targeted future expansion 38


39 Global Service Provider Brands SEE MORE EXAMPLES HERE 39


40 Growth Opportunities 27 million Multi-family units 16 million Single-family rental households ~1 million Vacation rental properties Global Markets High Growth Potential for Untapped Vacation Rental and Property Management Markets Property Management Energy Management Source: National Multifamily Housing Council, Urban Institute, and Wall Street Journal 40


41 Growth Opportunities Managing connected devices and distributed energy resources for utilities at scale. Global Markets Property Management >4 million smart thermostats sold in 2015 >32 million smart thermostats in 2020 Energy Management >7 million electric vehicles on the road in the U.S. by x growth in energy storage capacity in the U.S. by 2022 Source: Navigant Research 41


42 Advanced Control of Distributed Energy Resources Utilities rely on EnergyHub s Mercury DERMS software platform to control consumer-, industrial-, and utility-owned DERs and IoT devices and provide critical grid services, such as demand response, load shifting, voltage support, renewables matching, and managed charging. 40 utility clients, including 12 of the top-50 in the United States Programs available to 25 percent of U.S homes Largest connected device manufacturer ecosystem 2012 Pioneered the widely adopted Bring Your Own Thermostat program delivery model 42
43 FINANCIAL OVERVIEW 43
44 Q3 18 Snapshot Continued Strong Execution Year-over-Year Growth 20% $74.3m S a a S & L I C E N S E R E V E N U E 33% $25.8m A D J U S T E D E B I T D A ( N O N - G A A P ) 24% $111.8m T O T A L R E V E N U E 36% $18.2m N E T I N C O M E ( N O N - G A A P ) 85% SaaS 62% Total G R O S S M A R G I N $41.5m L T M F R E E C A S H F L O W Current data represents results as of fiscal quarter ended September 30, The future financial results presented are not projections, guidance or an outlook for Alarm.com's future financial results. Free cash flow defined as operating cash flows less Cap Ex. 44
45 Consistent Revenue Growth ($ in millions) $103 $87 $68 $41 $55 $47 $83 $56 $111 $141 $174 $ SaaS and License Revenue Hardware and Other Revenue 45
46 Track Record of Profitability ($ in millions) 21% 22% 17% 16% 19% 21% $72 $49 $21 $28 $28 $ Note: We define Adjusted EBITDA as net income before interest and other income / (expense), net, provision for income taxes, amortization and depreciation expense, stock-based compensation expense, acquisition-related expense and legal costs incurred in connection with non-ordinary course litigation, particularly costs involved in ongoing intellectual property litigation. Adj. EBITDA Adj. EBITDA margin 46

47 Key Financial Highlights Scale Growing Highly scalable platform 5.5 million+ subscribers 80 million+ connected devices 100 billion+ data points processed in 2017 Strong compound annual revenue growth TAM expanding with Smart Home Adoption Recurring High SaaS and license recurring revenue model SaaS and license revenue renewal rate of 94% Profitable Strong cash flow and profitable Increased operating leverage as business scales Favorable unit Economics: CLTV/CAC ratio > 6.0 LTM; payback of S&M in 12 months 47
48 A PPENDIX 48
49 Investor Data Sheet (1/3) Alarm.com Holdings, Inc. Select Financial Data Fiscal Year End December 31, ($ in thousands) Statement of Operations Data: Q Q Q Q Q Q Q Q SaaS and license revenue 1 $140,936 $173,540 $236,283 $46,888 $50,226 $58,928 $61,924 $65,205 $67,988 $70,968 $74,292 Hardware and other revenue 67,952 87, ,654 22,906 23,968 27,060 28,038 23,588 24,768 33,520 37,556 Total revenue 208, , ,937 69,794 74,194 85,988 89,962 88,793 92, , ,848 Cost of SaaS and license revenue 2 25,722 30,229 35,610 8,450 8,092 8,500 9,545 9,473 10,806 11,027 11,501 Cost of hardware and other revenue 51,652 69,151 80,578 18,265 18,543 21,335 22,288 18,412 17,571 25,461 30,491 Total cost of revenue 77,374 99, ,188 26,715 26,635 29,835 31,833 27,885 28,377 36,488 41,992 Net income (loss) $11,768 $10,154 $29,251 $2,976 $3,963 $9,865 $15,103 $320 $10,515 $10,733 ($7,652) Net income (loss) per share, diluted $(0.30) $0.21 $0.59 $0.06 $0.08 $0.20 $0.31 $0.01 $0.21 $0.22 ($0.16) Weighted-average common shares outstanding - diluted 24,108,362 47,875,522 49,153,948 48,025,847 48,758,774 49,000,553 49,259,701 49,341,091 49,268,255 49,497,088 47,812,642 Balance Sheet Data (as of): Cash and cash equivalents $128,358 $140,634 $96,329 $140,634 $63,150 $68,916 $84,640 $96,329 $96,798 $105,959 $124,243 Non-GAAP financial measures 3 : Adjusted EBITDA 3 $34,370 $49,034 $71,628 $14,311 $14,103 $15,881 $19,478 $22,166 $22,958 $23,409 $25,821 Adjusted net income 3 20,577 31,138 45,104 9,057 7,822 10,654 13,335 13,030 16,654 16,761 18,166 Adjusted net income attributable to common stockholders 3 7,066 31,126 45,095 9,055 7,821 10,651 13,330 13,030 16,652 16,760 18,166 1 Includes software revenue of $10.5 million and $9.3 million for the three months ended September 30, 2018 and 2017, respectively. 2 Includes cost of software revenue of $0.4 million and $0.4 million for the three months ended September 30, 2018 and 2017, respectively. 3 Adjusted EBITDA, adjusted net income and adjusted net income attributable to common stockholders are non-gaap financial measures - see next page for reconciliation to GAAP. 49
50 Investor Data Sheet (2/3) Alarm.com Holdings, Inc. Non-GAAP Reconciliations Fiscal Year Ended December 31 ($ in thousands) Q4 Q1 Q2 Q3 Q4 Q1 Q2 Q Adjusted EBITDA: Net income / (loss) $11,768 $10,154 $29,251 $2,976 $3,963 $9,865 $15,103 $320 $10,515 $10,733 ($7,652) Adjustments: Interest expense and other income / (expense), net 526 (323) 1,133 (122) (21) Provision for / (benefit from) income tax 5,697 4,227 2,990 1, (4,506) (5,018) 11,971 1,202 (2,554) (9,061) Amortization and depreciation expense 5,808 6,490 17,734 1,627 2,864 4,846 5,071 4,953 5,025 5,238 5,891 Stock-based compensation expense 4,124 4,001 7,413 1,121 1,313 1,915 1,906 2,279 2,669 3,544 3,457 Acquisition-related expense ,098 5,895 5,301 3,648 1, Litigation expense 6,347 13,387 7,212 2,108 1,793 1,251 1,879 2,289 3,271 6,117 33,167 Total adjustments 22,602 38,880 42,377 11,335 10,140 6,016 4,375 21,846 12,443 12,676 33,473 Adjusted EBITDA $34,370 $49,034 $71,628 $14,311 $14,103 $15,881 $19,478 $22,166 $22,958 $23,409 $25,821 Adjusted net income: Net income / (loss), as reported $11,768 $10,154 $29,251 $2,976 $3,963 $9,865 $15,103 $320 $10,515 $10,733 ($7,652) Provision for / (benefit from) income tax 5,697 4,227 2,990 1, (4,506) (5,018) 11,971 1,202 (2,554) (9,061) Income / (loss) before income taxes 17,465 14,381 32,241 4,276 4,506 5,359 10,085 12,291 11,717 8,179 (16,713) Adjustments: Other income / (expense), net 348 (513) (1,066) (175) (237) (137) (342) (350) (396) (420) (717) Amortization expense 2,151 1,750 12, ,493 3,530 3,682 3,577 3,820 3,797 3,801 Stock-based compensation expense 4,124 4,001 7,413 1,121 1,313 1,915 1,906 2,279 2,669 3,544 3,457 Acquisition-related expense ,098 5,895 5,301 3,648 1, Litigation expense 6,347 13,387 7,212 2,108 1,793 1,251 1,879 2,289 3,271 6,117 33,167 Non-GAAP adjusted income before income taxes 30,535 44,104 63,977 13,013 12,516 13,891 17,431 20,139 21,081 21,217 22,995 Income tax (9,958) (12,966) (18,873) (3,956) (4,694) (3,237) (4,096) (7,109) (4,427) (4,456) (4,829) Non-GAAP adjusted net income $20,577 $31,138 $45,104 $9,057 $7,822 $10,654 $13,335 $13,030 $16,654 $16,761 $18,166 Non-GAAP adjusted net income per share - diluted 1 $0.27 $0.65 $0.92 $0.19 $0.16 $0.22 $0.27 $0.26 $0.34 $0.34 $ For periods with GAAP net losses and non-gaap adjusted net income, the weighted-average outstanding shares used to calculate diluted non-gaap adjusted net income per share includes potentially dilutive securities that were excluded from the calculation of GAAP net income per share as the effect was anti-dilutive. 50
51 Investor Data Sheet (3/3) Alarm.com Holdings, Inc. Non-GAAP Reconciliations Fiscal Year Ended December 31 ($ in thousands) Q4 Q1 Q2 Q3 Q4 Q1 Q2 Q Adjusted net income attributable to common stockholders: Net income / (loss) attributable to common stockholders, as reported ($7,219) $10,142 $29,238 $2,974 $3,961 $9,860 $15,097 $320 $10,512 $10,732 ($7,652) Provision for / (benefit from) income taxes 5,697 4,227 2,990 1, (4,506) (5,018) 11,971 1,202 (2,554) (9,061) Income / (loss) attributable to common stockholders before taxes (1,522) 14,369 32,228 4,274 4,504 5,354 10,079 12,291 11,714 8,178 (16,713) Adjustments: Dividends paid to participating securities 18,987 Other income / (expense), net 348 (513) (1,066) (175) (237) (137) (342) (350) (396) (420) (717) Amortization expense 2,151 1,750 12, ,493 3,530 3,682 3,577 3,820 3,797 3,801 Stock-based compensation expense 4,124 4,001 7,413 1,121 1,313 1,915 1,906 2,279 2,669 3,544 3,457 Acquisition-related expense ,098 5,895 5,301 3,648 1, Litigation expense 6,347 13,387 7,212 2,108 1,793 1,251 1,879 2,289 3,271 6,117 33,167 Non-GAAP adjusted income attributable to common stockholders before income taxes 30,535 44,092 63,964 13,011 12,514 13,886 17,425 20,139 21,078 21,216 22,995 Income taxes (9,958) (12,966) (18,869) (3,956) (4,693) (3,235) (4,095) (7,109) (4,426) (4,456) (4,829) Less: income allocated to participating securities (13,511) Non-GAAP adjusted net income attributable to common stockholders $7,066 $31,126 $45,095 $9,055 $7,821 $10,651 $13,330 $13,030 $16,652 $16,760 $18,166 51
52 Supplemental Financial Data Supplemental Financial Data: Alarm.com Holdings, Inc. Supplemental Financial Data Fiscal Year Ended December 31 ($ in thousands) Q SaaS and license revenue 1 $140,936 $173,540 $236,283 $46,888 $50,226 $58,928 $61,924 $65,205 $67,988 $70,968 $74,292 Hardware and other revenue 67,952 87, ,654 22,906 23,968 27,060 28,038 23,588 24,768 33,520 37,556 Total revenue 208, , ,937 69,794 74,194 85,988 89,962 88,793 92, ,488 $111,848 Cost of SaaS and license revenue 2 25,722 30,229 35,610 8,450 8,092 8,500 9,545 9,473 10,806 11,027 11,501 Cost of hardware and other revenue 51,652 69,151 80,578 18,265 18,543 21,335 22,288 18,412 17,571 25,461 30,491 Total cost of revenue 77,374 99, ,188 26,715 26,635 29,835 31,833 27,885 28,377 36,488 41,992 Sales and marketing 32,240 38,980 43,490 9,448 10,314 11,899 10,426 10,851 10,822 14,612 14,128 General and administrative 35,473 57,926 55,396 15,802 15,375 13,450 12,974 13,597 16,162 18,119 43,662 Research and development 40,002 44,272 72,755 12,048 14,521 20,062 19,257 18,915 20,377 21,521 22,869 Amortization and depreciation 5,808 6,490 17,734 1,627 2,864 4,846 5,071 4,953 5,025 5,238 5,891 Total operating expenses 113, , ,375 38,925 43,074 50,257 47,728 48,316 52,386 59,490 86,550 Operating income 17,991 14,058 33,374 4,154 4,485 5,896 10,401 12,592 11,993 8,510 (16,694) Interest expense (178) (190) (2,199) (53) (216) (674) (658) (651) (672) (751) (736) Other income / (expense), net (348) 513 1, Income before income taxes 17,465 14,381 32,241 4,276 4,506 5,359 10,085 12,291 11,717 8,179 (16,713) Provision for / (benefit from) income taxes 5,697 4,227 2,990 1, (4,506) (5,018) 11,971 1,202 (2,554) (9,061) Net income $11,768 $10,154 $29,251 $2,976 $3,963 $9,865 $15,103 $320 $10,515 $10,733 ($7,652) Stock-based compensation expense data: Sales and marketing $372 $536 $561 $114 $113 $65 $181 $202 $235 $319 $301 General and administrative 2,486 1,430 2, ,028 1,481 1,191 Research and development 1,266 2,035 4, ,095 1,141 1,347 1,406 1,744 1,965 Total stock-based compensation expense $4,124 $4,001 $7,413 $1,121 $1,313 $1,915 $1,906 $2,279 $2,669 $3,544 $3,457 As a percent of revenue: Cost of SaaS and license revenue as a percentage of SaaS and license revenue 18% 17% 15% 18% 16% 14% 15% 15% 16% 16% 15% Cost of hardware and other revenue as a percentage of hardware and other revenue 76% 79% 78% 80% 77% 79% 79% 78% 71% 76% 81% Sales and marketing 15% 15% 13% 14% 14% 14% 12% 12% 12% 14% 13% General and administrative 17% 22% 16% 23% 21% 16% 14% 15% 17% 17% 39% Research and development 19% 17% 22% 17% 19% 23% 21% 21% 22% 21% 20% Amortization and depreciation 3% 3% 5% 2% 4% 5% 6% 6% 5% 5% 5% Total operating expenses 54% 57% 56% 56% 58% 58% 53% 54% 56% 57% 77% Operating income / (loss) 9% 5% 10% 6% 6% 7% 12% 14% 13% 8% -15% Net income / (loss) 6% 4% 9% 4% 5% 11% 17% 0% 11% 10% -7% 1 Includes software revenue of $10.5 million and $9.3 million for the three months ended September 30, 2018 and 2017, respectively. Q Q Q Q Q Q Q Includes cost of software revenue of $0.4 million and $0.4 million for the three months ended September 30, 2018 and 2017, respectively. 52
53 Security Access Video Energy Lights Garage Water One Intelligent Platform Users prefer these Smart Home applications over DIY device specific apps R E P O R T 53
The Platform for the Connected Home and Business March 2018
 The Platform for the Connected Home and Business March 2018 1 Safe harbor statement Forward-Looking Statements This presentation contains forward-looking statements that involve risks and uncertainties.
The Platform for the Connected Home and Business. November 2017
 The Platform for the Connected Home and Business November 2017 1 Safe harbor statement Forward-Looking Statements This presentation contains forward-looking statements that involve risks and uncertainties.
Alarm.com Reports Second Quarter 2018 Results
 Alarm.com Reports Second Quarter 2018 Results August 7, 2018 -- Second Quarter SaaS and License Revenue Increased 20.4% to $71.0 million Year-Over-Year -- -- Second Quarter Total Revenue Increased 21.5%
Safe Harbor Statement
 1 November 19, 2014 Safe Harbor Statement Forward-Looking Statements. Our presentation today, including the slides contained herein, contains "forward-looking statements" within the meaning of the Private
CalAmp Reports Fiscal 2018 Third Quarter Financial Results
 NEWS RELEASE CalAmp Reports Fiscal 2018 Third Quarter Financial Results 12/21/2017 Record Q3 revenue of $93.7 million, up 12% year over year GAAP net income of $0.33 per diluted share; Non-GAAP net income
2014 Investor Day. November 19, 2014
 2014 Investor Day November 19, 2014 Forward-Looking Statements This presentation includes certain forward-looking statements within the meaning of the Private Securities Litigation Reform Act of 1995,
AL AR M.COM AN N U AL R E P O R T
 2016 ANNUAL REPORT Audio Door Bell Door Locks Door & Window Sensors Energy Monitoring Garage Door Image Sensor Irrigation Lights Security Panel Smoke Detector Thermostats Video Monitoring Water Sensor
Investor Update 2Q Rob LoCascio CEO Chris Greiner CFO
 Investor Update 2Q 2018 Rob LoCascio CEO Chris Greiner CFO Safe Harbor Provision Statements in this presentation regarding LivePerson that are not historical facts are forward-looking statements and are
Q Results. May 2015
 Q1 2015 Results May 2015 Safe Harbor Forward-Looking Statements. Our presentation today, including the slides contained herein, contains "forwardlooking statements" within the meaning of the Private Securities
CalAmp Reports Fourth Quarter and Fiscal Year 2018 Financial Results
 NEWS RELEASE CalAmp Reports Fourth Quarter and Fiscal Year 2018 Financial Results 4/26/2018 Record quarterly revenue of $94.4 million, up 10% year over year Q4 MRM Telematics product revenue grew a record
LogMeIn Roadshow Presentation J A N U A R Y
 LogMeIn Roadshow Presentation J A N U A R Y 2 0 1 7 Safe Harbor Statement Forward-Looking Statements This communication contains forward-looking statements concerning LogMeIn, Inc. ( LogMeIn ), Citrix
CalAmp Reports Second Quarter Fiscal 2018 Financial Results
 NEWS RELEASE CalAmp Reports Second Quarter Fiscal 2018 Financial Results 9/28/2017 Q2 revenue of $89.8 million Awarded the largest SaaS contract in the company's history MRM Telematics product revenue
Investor Overview Q Slides updated as of February 21, 2018
 Investor Overview Q4 2017 Slides updated as of February 21, 2018 Safe Harbor and Non-GAAP Financial Measures This presentation contains forward-looking statements within the meaning of federal securities
Investor Presentation
 Investor Presentation Presented by: Michael Burdiek Chief Executive Officer & President Kurtis Binder EVP & Chief Financial Officer November 8, 2017 Forward Looking Statements This presentation may contain
SNAP INTERACTIVE, INC. Third Quarter 2017 Earnings Call November 7, 2017
 SNAP INTERACTIVE, INC. Third Quarter 2017 Earnings Call November 7, 2017 SAFE HARBOR This presentation is for discussion purposes only. The material is based upon information that we consider reliable,
Deutsche Bank 24 th Annual Media, Internet & Telcom Conference. March 8, 2016
 Deutsche Bank 24 th Annual Media, Internet & Telcom Conference March 8, 2016 Safe Harbor for Forward-Looking Statements Certain statements in this presentation are forward-looking statements within the
APX Group Holdings, Inc.
 APX Group Holdings, Inc. 4 th Quarter and Full Year 2018 Results March 5, 2019 1 forward-looking statements This presentation includes forward-looking statements as defined by the Private Securities Litigation
Q Results. November 2014
 Q3 2014 Results November 2014 Safe Harbor Forward-Looking Statements. Our presentation today, including the slides contained herein, contains "forwardlooking statements" within the meaning of the Private
Q1 FY 18 Financial Results
 Q1 FY 18 Financial Results August 3, 2017. Forward-Looking Statements and Non-GAAP Financial Measures This presentation contains forward-looking statements, as that term is defined under the federal securities
APX Group Holdings, Inc.
 APX Group Holdings, Inc. Imperial Capital Security Investor Conference December 11, 2014 preliminary statement APX Group, Inc. (the Company, we, our, or us ) obtained the industry, market and competitive
Investor Update Philip Mezey, President and Chief Executive Officer
 Investor Update Philip Mezey, President and Chief Executive Officer Barbara Doyle, Vice President, Investor Relations March 2018 FORWARD LOOKING STATEMENTS Certain matters in this presentation and being
Q3 FY 18 Financial Results
 Q3 FY 18 Financial Results February 6, 2018. Forward-Looking Statements and Non-GAAP Financial Measures This presentation contains forward-looking statements, as that term is defined under the federal
Investor Presentation
 Investor Presentation (NASDAQ: TRIP) Q2 2013 Safe Harbor Statement Forward-Looking Statements. Our presentation today, including the slides contained herein, contains "forward-looking statements" within
APX Group Holdings, Inc.
 APX Group Holdings, Inc. Imperial Capital 2015 Security Investor Conference December 10, 2015 preliminary statement This presentation includes forward-looking statements as defined by the Private Securities
F O U R T H Q U A R T E R R E S U L T S February 6, 2018
 F O U R T H Q U A R T E R 2 0 1 7 R E S U L T S February 6, 2018 Safe Harbor for Forward-Looking Statements Certain statements in this presentation are forward-looking statements within the meaning of
Investor Presentation. November 2018
 Investor Presentation November 2018 Disclaimer Forward-Looking Statements: This presentation contains forward-looking statements which are made pursuant to the safe harbor provisions of Section 27A of
CalAmp Reports Fiscal 2017 First Quarter Financial Results
 NEWS RELEASE CalAmp Reports Fiscal 2017 First Quarter Financial Results 6/28/2016 Strong Revenue Contribution and Earnings Leverage From LoJack; GAAP Gross Margins of 38%; Non-GAAP Gross Margins of 43%;
Q Investor Presentation August 1, 2017
 Q2 2017 Investor Presentation August 1, 2017 Safe Harbor Disclosure and Definitions This presentation contains forward-looking statements. The use of words such as "anticipates," "estimates," "expects,"
Investor Presentation. Third Quarter 2018
 Investor Presentation Third Quarter 2018 Safe Harbor and Other Information This presentation contains forward looking statements that are based on our management s beliefs and assumptions and on information
Investor Presentation
 Investor Presentation (NASDAQ: TRIP) Q4 2012 Safe Harbor Statement Forward-Looking Statements. Our presentation today, including the slides contained herein, contains "forward-looking statements" within
Q2 FY2015 Earnings Presentation August 4, 2015
 Q2 FY2015 Earnings Presentation August 4, 2015 FORWARD LOOKING STATEMENTS AND OTHER IMPORTANT CAUTIONS Statements in this presentation which are not statements of historical fact, including but not limited
SAFE HARBOR STATEMENT
 SAFE HARBOR STATEMENT This presentation may contain projections or other forward-looking statements within the meaning of Section 27A of the Securities Act of 1933, as amended, and Section 21E of the Securities
Adjusted Net Income increased 44.3% year-over-year to RMB197.5 million ($31.9 million) for the first quarter of 2015.
 for the first quarter of 2015.") Autohome Inc. Announces Unaudited Results for the First Quarter Ended March 31, 2015 First Quarter Net Revenues Increased Significantly by 82.1% Year-over-Year to RMB622.9 Million BEIJING, May 6, 2015
Autohome Inc. Announces Unaudited Results for the First Quarter Ended March 31, 2015 First Quarter Net Revenues Increased Significantly by 82.1% Year-over-Year to RMB622.9 Million BEIJING, May 6, 2015
4Q18 EARNINGS. February NASDAQ: GRPN /
 4Q18 EARNINGS February 2019 NASDAQ: GRPN / ir@groupon.com Forward-Looking Statements The statements contained in this release that refer to plans and expectations for the next quarter, the full year or
Three months ended Dec. 31,
 Wix.com Reports Fourth Quarter and Full Year 2015 Results -- Exceeded Prior Q4 and Full Year 2015 Guidance for Collections on a Constant Currency Basis, Revenue and Adjusted EBITDA -- -- Provides Strong
Investor Presentation
 Investor Presentation (NASDAQ: TRIP) Q3 2012 Safe Harbor Statement Forward-Looking Statements. Our presentation today, including the slides contained herein, contains "forward-looking statements" within
First Quarter Supplemental Earnings Call Slides
 First Quarter 2017 Supplemental Earnings Call Slides Safe Harbor Provision Statements in this press release regarding LivePerson that are not historical facts are forward-looking statements and are subject
CalAmp Reports Fiscal 2019 Third Quarter Financial Results
 NEWS RELEASE CalAmp Reports Fiscal 2019 Third Quarter Financial Results 12/20/2018 Q3 Software and Subscription Services revenue of $19.9 million, up 25% year-over-year Q3 operating cash ow of $11.3 million
2Q17 EARNINGS AUGUST 2017
 2Q17 EARNINGS AUGUST 2017 FORWARD-LOOKING STATEMENTS The statements contained in this release that refer to plans and expectations for the next quarter, the full year or the future are forward-looking
Broadview Networks Holdings, Inc. Company Overview
 Broadview Networks Holdings, Inc. Company Overview Quarter Ended March 31, 2017 Broadview Networks Holdings, Inc. Safe Harbor Statement This presentation may contain forward-looking statements, including
Xylem Agrees to Acquire Sensus to Broaden Portfolio and Enhance Growth Platform AUGUST 15, 2016
 1 Xylem Agrees to Acquire Sensus to Broaden Portfolio and Enhance Growth Platform AUGUST 15, 2016 Forward-Looking Statements This presentation contains information that may constitute forward-looking statements.
4Q17 EARNINGS FEBRUARY 2018
 4Q17 EARNINGS FEBRUARY 218 2 FORWARD-LOOKING STATEMENTS The statements contained in this release that refer to plans and expectations for the next quarter, the full year or the future are forward-looking
ViaSat, Inc. FY17 Q2 Results
 ViaSat, Inc. FY17 Q2 Results November 8, 2016 1 Safe Harbor Disclosure website at www.viasat.com. 2 Forward-Looking Statements This presentation contains forward-looking statements regarding future events
Resideo at a Glance. The Honeywell logo is a trademark of Honeywell International Inc. used under license to Resideo Technologies, Inc.
 Resideo at a Glance The Honeywell logo is a trademark of Honeywell International Inc. used under license to Resideo Technologies, Inc. WHO WE ARE Resideo is positioned to be a smart home industry leader
Tom Walker, Chief Financial Officer. May 25, 2017
 Tom Walker, Chief Financial Officer May 25, 2017 The presentations today contain "forward-looking" statements, which are subject to the safe harbor provisions of the Private Securities Litigation Reform
Raymond James 37 th Annual Institutional Investors Conference. March 8, 2016
 Raymond James 37 th Annual Institutional Investors Conference March 8, 2016 Forward-looking statements and Non-GAAP financial measures Forward-looking statements Certain statements included in this presentation,
SAFE HARBOR STATEMENT
 SAFE HARBOR STATEMENT This presentation may contain projections or other forward-looking statements within the meaning of Section 27A of the Securities Act of 1933, as amended, and Section 21E of the Securities
Q EARNINGS PRESENTATION
 Q2 2014 EARNINGS PRESENTATION August 7, 2014 FORWARD LOOKING STATEMENTS AND OTHER IMPORTANT CAUTIONS Statements in this presentation which are not statements of historical fact, including but not limited
Q2 FY 18 Financial Results
 Q2 FY 18 Financial Results November 7, 2017. Forward-Looking Statements and Non-GAAP Financial Measures This presentation contains forward-looking statements, as that term is defined under the federal
AGILYSYS REPORTS RECORD QUARTERLY REVENUE OF $33.9 MILLION FOR FISCAL 2018 FIRST QUARTER -SAAS REVENUE GROWS 58%-
 AGILYSYS REPORTS RECORD QUARTERLY REVENUE OF $33.9 MILLION FOR FISCAL 2018 FIRST QUARTER -SAAS REVENUE GROWS 58%- -REITERATES OUTLOOK FOR FY 2018 REVENUE GROWTH OF APPROXIMATELY 7% - 10% AND POSITIVE ADJUSTED
APX Group Holdings, Inc.
 APX Group Holdings, Inc. 2 nd Quarter 2015 Results August 11, 2015 forward-looking statements APX Group Holdings, Inc. (the Company, Vivint, we, our, or us ) obtained the industry, market and competitive
Investor Presentation
 Investor Presentation (NASDAQ: TRIP) Q3 2013 Safe Harbor Statement Forward-Looking Statements. Our presentation today, including the slides contained herein, contains "forward-looking statements" within
Q1 FY2015 Earnings Presentation May 5, 2015
 Q1 FY2015 Earnings Presentation May 5, 2015 FORWARD LOOKING STATEMENTS AND OTHER IMPORTANT CAUTIONS Statements in this presentation which are not statements of historical fact, including but not limited
Bank of America Merrill Lynch Technology Conference
 Bank of America Merrill Lynch Technology Conference NASDAQ - TRIP 5/9/2012 Safe Harbor Statement Forward-Looking Statements. Our presentation today, including the slides contained herein, contains "forward-looking
Wix.com Reports First Quarter 2016 Results
 Wix.com Reports First Quarter 2016 Results Exceeded High End of Q1 Guidance for Collections, Revenue and Adjusted EBITDA Results Highlighted by a Unique Combination of Record Registered User Growth and
CARBONITE (NASDAQ: CARB)
") CARBONITE (NASDAQ: CARB) FOURTH QUARTER AND FY 2016 FINANCIAL RESULTS Thursday, February 9 th 2017 JERRY SISITSKY VP, Investor Relations Phone: 781-928-0713 Email: investor.relations@carbonite.com (NASDAQ:
CARBONITE (NASDAQ: CARB) FOURTH QUARTER AND FY 2016 FINANCIAL RESULTS Thursday, February 9 th 2017 JERRY SISITSKY VP, Investor Relations Phone: 781-928-0713 Email: investor.relations@carbonite.com (NASDAQ:
LogMeIn Announces Second Quarter 2018 Results
 LogMeIn Announces Second Quarter 2018 Results Boston, July 26, 2018 LogMeIn, Inc. (NASDAQ: LOGM), a leading provider of cloud-based connectivity, today announced its results for the second quarter ended
1Q18 EARNINGS MAY 2018
 1Q18 EARNINGS MAY 2018 FORWARD-LOOKING STATEMENTS The statements contained in this release that refer to plans and expectations for the next quarter, the full year or the future are forward-looking statements
Company Profile April 2016
 Company Profile April 2016 Forward Looking Statement This presentation contains forward-looking statements, within the meaning of the Private Securities Litigation Reform Act of 1995. Statements made herein
May 8, Fellow Calix stockholders:
 May 8, 2018 Fellow Calix stockholders: Our mission is to connect everyone and everything. Calix platforms empower our customers to build new business models, rapidly deploy new services and make the promise
Identiv, Inc. (INVE) Q Earnings Presentation. November 9, :00 PM PST (5:00 PM EST)
 Q Earnings Presentation. November 9, :00 PM PST (5:00 PM EST)") Identiv, Inc. (INVE) Q3 2016 Earnings Presentation November 9, 2016 2:00 PM PST (5:00 PM EST) Safe Harbor Statement Note Regarding Forward-Looking Information This presentation contains forward-looking
Identiv, Inc. (INVE) Q3 2016 Earnings Presentation November 9, 2016 2:00 PM PST (5:00 PM EST) Safe Harbor Statement Note Regarding Forward-Looking Information This presentation contains forward-looking
Viasat, Inc. FY19 Q2 Results. November 1, 2018
 Viasat, Inc. FY19 Q2 Results November 1, 2018 Safe Harbor Disclosure Forward-looking statements This presentation contains forward-looking statements regarding future events and our future results that
SunTrust 2018 Internet & Digital Media Conference. May 8, 2018
 SunTrust 2018 Internet & Digital Media Conference May 8, 2018 SAFE HARBOR STATEMENT This presentation is for informational purposes only and is not an offer to sell securities or a solicitation of an offer
Cincinnati Bell Second Quarter 2017 Results August 4, 2017
 Cincinnati Bell Second Quarter 2017 Results August 4, 2017 Safe Harbor This presentation may contain forward-looking statements, as defined in federal securities laws including the Private Securities Litigation
YY Reports Fourth Quarter and Full Year 2012 Unaudited Financial Results
 March 7, 2013 YY Reports Fourth Quarter and Full Year Unaudited Financial Results 4Q12 Net Revenues Up 136.3% YOY 4Q12 Net Income of RMB33.2Million 4Q12 Non-GAAP Net Income Up 80.9% YOY GUANGZHOU, China,
Q Earnings Presentation May 9, 2018
 Q1 2018 Earnings Presentation May 9, 2018 Forward Looking Statements ADT has made statements in this presentation and other reports, filings, and other public written and verbal announcements that are
Viasat, Inc. FY18 Q4 results. May 24, 2018
 Viasat, Inc. FY18 Q4 results May 24, 2018 Safe Harbor Disclosure Forward-looking statements This presentation contains forward-looking statements regarding future events and our future results that are
Nasdaq: DAIO. Data I/O Corporation January 2018 Investor Presentation
 Nasdaq: DAIO Data I/O Corporation January 2018 Investor Presentation Safe Harbor The matters that we discuss today will include forward-looking statements that involve risks factors that could cause Data
ZEBRA TECHNOLOGIES. William Blair Growth Stock Conference June 16, 2016
 ZEBRA TECHNOLOGIES William Blair Growth Stock Conference June 16, 2016 Safe Harbor Statement Statements made in this presentation which are not statements of historical fact are forward-looking statements
Paylocity Announces First Quarter Fiscal Year 2018 Financial Results
 November 2, 2017 Paylocity Announces First Quarter Fiscal Year 2018 Financial Results Q1 2018 Total Revenue of $81.5 million, up 25% year-over-year Q1 2018 Recurring Revenue of $78.9 million, up 26% year-over-year
Nasdaq: DAIO. Joel Hatlen. Chief Operating & Financial Officer. Data I/O Corporation September 2017 Investor Presentation
 Nasdaq: DAIO Joel Hatlen Chief Operating & Financial Officer Data I/O Corporation September 2017 Investor Presentation Safe Harbor The matters that we discuss today will include forward-looking statements
Ooma Reports Fourth Quarter and Fiscal Year 2018 Financial Results
 NEWS RELEASE Ooma Reports Fourth Quarter and Fiscal Year 2018 Financial Results 3/6/2018 SUNNYVALE, Calif., March 06, 2018 (GLOBE NEWSWIRE) -- Ooma, Inc. (NYSE:OOMA), a smart communications platform for
Stifel Investor Conference
 Roper Technologies, Inc. Stifel Investor Conference June 15, 2017 Safe Harbor Statement The information provided in this presentation contains forward-looking statements within the meaning of the federal
Silicon Labs to Acquire Sigma Designs ~ Investor Presentation 8 D E C E M B E R
 Silicon Labs to Acquire Sigma Designs ~ Investor Presentation 8 D E C E M B E R 2 0 1 7 Legal Non-GAAP Financial Measures In addition to GAAP reporting, Silicon Labs provides investors with certain information
Jefferies Technology Group Investor Conference. First Quarter 2017 Results May 10, 2017
 Jefferies Technology Group Investor Conference First Quarter 2017 Results May 10, 2017 Safe Harbor for Forward-Looking Statements Certain statements in this presentation are forward-looking statements
June Investor Presentation
 June 2014 Investor Presentation Safe Harbor Certain statements included herein, including guidance and those that express management's objectives and the strategies to achieve those objectives, as well
American Woodmark s Acquisition of RSI Home Products December 1, 2017
 American Woodmark s Acquisition of RSI Home Products December 1, 2017 Forward Looking Statements This communication contains certain forward-looking statements within the meaning of the Private Securities
IXYS Corporation Reports Increased Profits for the September 2016 Quarter
 Press Release Contact: Uzi Sasson President & CEO IXYS Corporation 1590 Buckeye Drive Milpitas, California 95035 (408) 457-9000 IXYS Corporation Reports Increased Profits for the September 2016 Quarter
LogMeIn Announces Fourth Quarter and Fiscal Year 2017 Results
 NEWS RELEASE LogMeIn Announces Fourth Quarter and Fiscal Year 2017 Results 2/15/2018 BOSTON, Feb. 15, 2018 (GLOBE NEWSWIRE) -- LogMeIn, Inc. (NASDAQ:LOGM), a leading provider of cloud-based connectivity,
Ooma Reports First Quarter Fiscal Year 2019 Financial Results
 1 NEWS RELEASE Ooma Reports First Quarter Fiscal Year 2019 Financial Results 5/22/2018 SUNNYVALE, Calif., May 22, 2018 (GLOBE NEWSWIRE) -- Ooma, Inc. (NYSE:OOMA), a smart communications platform for businesses
Viasat, Inc. FY19 Q1 results. August 9, 2018
 Viasat, Inc. FY19 Q1 results August 9, 2018 Safe Harbor Disclosure Forward-looking statements This presentation contains forward-looking statements regarding future events and our future results that are
Q Earnings Conference Call
 Q4 2013 Earnings Conference Call FEBRUARY 5, 2014 Jeff Housenbold, CEO Brian Regan, CFO Safe Harbor Disclaimer This presentation contains "forward-looking" statements within the meaning of Section 27A
Q Investors Presentation
 Q2 2017 Investors Presentation Forward Looking Statements and Non-GAAP Measures This presentation contains information about management's view of the Company's future expectations, plans and prospects
Fourth quarter and full year 2017 results
 Fourth quarter and full year 207 results FINANCIAL AND OPERATIONAL HIGHLIGHTS Financial summary Q4 '7 Revenue of 220 million (Q4 '6: 266 million) Gross margin of 59% (Q4 '6: 58%) EBITDA of 37 million (Q4
THIRD QUARTER 2018 RESULTS November 6, 2018
 THIRD QUARTER 2018 RESULTS November 6, 2018 Safe Harbor for Forward-Looking Statements Certain statements in this presentation are forward-looking statements within the meaning of the Private Securities
Rent-A-Center today is
 INVESTOR PRESENTATION FIRST QUARTER 2014 Safe Harbor This presentation contains forward-looking statements that involve risks and uncertainties. Such forward-looking statements generally can be identified
Plantronics to Acquire Polycom
 Plantronics to Acquire Polycom Creating the collaboration gold-standard so good ideas are seen and heard Investor Presentation March 28, 2018 FORWARD LOOKING STATEMENTS This Press Release, together with
COMPANY OVERVIEW. February 7, 2019
 COMPANY OVERVIEW February 7, 2019 1 DISCLAIMERS This presentation contains forward-looking statements. All statements contained in this presentation other than statements of historical facts, including,
Groupon Announces First Quarter 2015 Results
 May 5, 2015 Groupon Announces First Quarter 2015 Results Gross billings of $1.6 billion Revenue of $750.4 million Adjusted EBITDA of $72.4 million GAAP loss per share of $0.02; non-gaap earnings per share
Roper Technologies, Inc. Goldman Sachs Presentation
 Roper Technologies, Inc. Goldman Sachs Presentation November 3, 2016 Safe Harbor Statement The information provided in this presentation contains forward-looking statements within the meaning of the federal
2 nd Quarter 2018 Earnings Results. July 24, 2018
 2 nd Quarter 2018 Earnings Results July 24, 2018 Safe Harbor statement NOTE: In this presentation we have made forward-looking statements. These statements are based on our estimates and assumptions and
Q Preliminary Earnings Results Summary May 3, 2018
 Q1 2018 Preliminary Earnings Results Summary May 3, 2018 SAFE HARBOR STATEMENT This presentation may contain projections or other forward-looking statements within the meaning Section 27A of the Private
Investors Presentation. Second Quarter 2016 Results August 3, 2016
 Investors Presentation Second Quarter 2016 Results August 3, 2016 Safe Harbor for Forward-Looking Statements Certain statements in this presentation are forward-looking statements within the meaning of
ANIXTER ANNOUNCES ACQUISITION OF HD SUPPLY S POWER SOLUTIONS BUSINESS JULY 15, 2015
 ANIXTER ANNOUNCES ACQUISITION OF HD SUPPLY S POWER SOLUTIONS BUSINESS JULY 15, 2015 Products. Technology. Services. Delivered Globally. 1 SAFE HARBOR AND NON-GAAP FINANCIAL MEASURES Safe Harbor Statement
2015 Investor Day. November 12, 2015
 2015 Investor Day November 12, 2015 Forward-Looking Statements This presentation includes certain forward-looking statements within the meaning of the Private Securities Litigation Reform Act of 1995,
August 7, Fellow Calix stockholders:
 August 7, 2018 Fellow Calix stockholders: Our mission is to connect everyone and everything. Calix platforms empower our customers to build new business models, rapidly deploy new services and make the
july 2012 CEB to Acquire SHL Compelling Value Creation, Growth, and Scale Opportunity
 july 2012 CEB to Acquire SHL Compelling Value Creation, Growth, and Scale Opportunity Safe Harbor Disclaimer This presentation contains forward-looking statements within the meaning of the Private Securities
Investor Presentation First Data Corporation. All Rights Reserved.
 Investor Presentation 2015 First Data Corporation. All Rights Reserved. Disclaimer This presentation was prepared on April 29, 2016 and represents the information available to us on that date. We assume
ARI Network Services Announces Fiscal Year 2012 Financial Results
 For Immediate Release For more information, contact: Darin Janecek, Chief Financial Officer ARI Network Services, Inc. Phone: (414) 973-4300 Investor Contact: Joe Dorame, Robert Blum, Joe Diaz Lytham Partners,
Where Intelligence Meets Infrastructure
 Where Intelligence Meets Infrastructure Earnings Conference Call For The First Quarter Ended December 31, 2018 February 5, 2019 These slides are not intended to be a stand-alone presentation, but are for