28 th Financial Analysts & Institutional Investors Meet. 21 st August 2018
|
|
|
- Roland Malone
- 5 years ago
- Views:
Transcription


1 28 th Financial Analysts & Institutional Investors Meet 21 st August 2018

2 Disclaimers 1. This presentation may contain statements which reflect Management s current views and estimates and could be construed as forward looking statements. The future involves uncertainties and risks that could cause actual results to differ materially from the current views being expressed. Potential uncertainties and risks include factors such as general economic conditions, commodities and currency fluctuations, competitive product and pricing pressures, industrial relations and regulatory developments. 2. Real Internal Growth (RIG) and Organic Growth (OG) are basis Nestlé Internal Reporting Standards. 3. Figures are regrouped / reclassified to make them comparable. 4. Calculations are based on non-rounded figures. 5. Analytical data are best estimates to facilitate understanding of business and NOT meant to reconcile reported figures. 6. Answers may be given to non-price sensitive questions. Slide 2
: Shobinder Duggal Q&A (17:00")
3 Committed to a Healthier Future (15:30 hrs): Suresh Narayanan Financial Highlights & Nestlé Business Excellence (16:20 hrs): Shobinder Duggal Q&A (17:00 17:45 hrs)
4 Driven by our purpose and values Growth plus sustained profits Focus on penetration + volume to drive growth Continued efforts towards innovation and renovation Commitment towards relevant Nutrition Proposition / NHW Last Time Consumer centric initiatives on digital, on ground activation, route to market People initiatives to internalize change

5 Committed to a Healthier Future Healthier Business Healthier Products Healthier Society Healthier Environment

6 Healthier Business and Healthier Products

7 Where Are We Today?


8 Largest listed F&B Company in India

9 Third Largest FMCG by Market Cap

10 Innovation As a strong GROWTH foundation


11 Organizational Stability Lowest level of Talent attrition


12 Market Leadership In Nearly 85% of the Portfolio
 Nestlé India s Position Instant Noodles 59.1 59.7 1 Ketchups & Sauces 21.6 22.")

13 Brand Strength & Market Position Leadership Position In 7 Out Of 9 Categories Category Brand YTD (Jan-Jun 2018) MAT (Jul 17-June 18) Nestlé India s Position Instant Noodles Ketchups & Sauces Instant Pasta Infant Formula (excluding Amul Spray) Infant Cereals Tea Creamer Chocolates White & Wafers Instant Coffee Source: AC Nielsen June 2018


14 The Brands India LOVES And TRUST 7 NESCAFE 6 21 MAGGI POLO 10 Source: ET Brand Equity Survey


15 Innovations - Fueling The Growth 25 sustainable innovations Contribution to Domestic Sales Full Year % Full Year % H % H %


16 NESPLUS Entry Into New Category Grain Pfus Nutrition Plus Taste Pl:us Choice Plus


17 Laying the Foundation for the Future Adult Oral Nutrition Supplement Disease Specific Supplements Pediatric Allergy Critical Care Nutrition


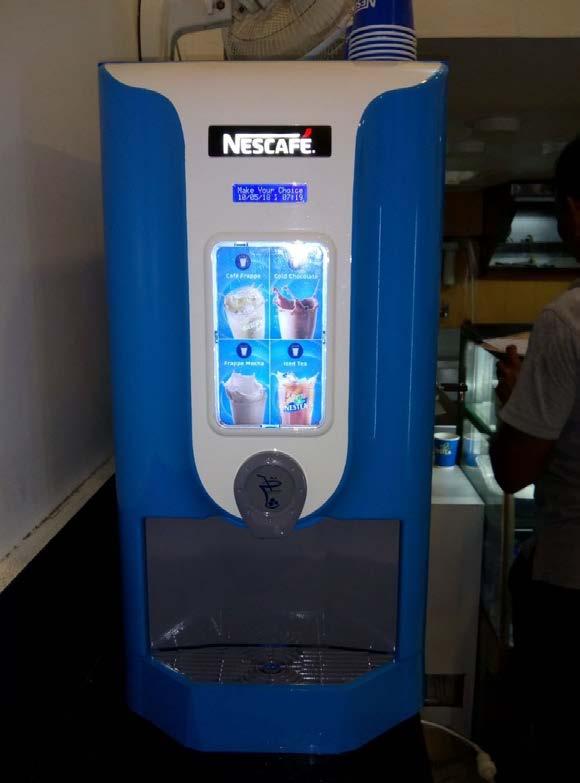
18 Out of Home Large Opportunity Over 350 touch points & vending machines setup pan - India


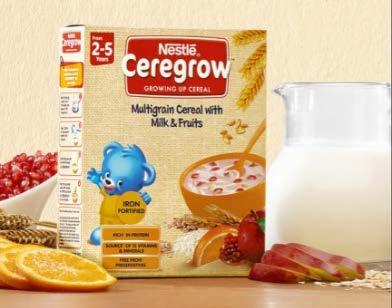
19 Most Recognized FMCG Responsible Business Leader Award Best Initiative for Working Mothers and among India s Most Admired Employer Best Supplier Award Ceregrow wins Product of The Year Award 2018! Humbled by 40+ Awards and Recognitions in 2017 and 2018 CSR Leadership Award from ET Now

![I - - - I ~T I r ] - f- 3 ~ - -1 8 I -1-4 / I,j,, -- - '- - 9 I -.](/docs-images/89/100187395/images/20-1.jpg "..;_,t--.l 1 _..,. - 1 10 '... I!4-l. 15 I - 1\" - -,,.")
20 . (,) ". / SUN ::,... MON TUE / - WED 1H CALENDAR f- - _,_ I -~IJ FRI J 2 1. I I ~T I r ] - f- 3 ~ I -1-4 / I,j,, -- - '- - 9 I -...;_,t--.l 1 _.., '... I!4-l. 15 I - 1" - -,,. 12 I L 1 16 I - ~ 21 I - ;.JJ 18 J- 22,g, I Double Digit Growth


21 In Step With Our Listed Peers 16.00% 14.00% 12.80% 13.60% 14.80% 12.00% 11.00% 10.00% 9.20% VALUE GROWTH 8.00% 6.00% 6.40% 4.00% 2.00% 0.00% FULL YEAR 2016 FULL YEAR 2017 H Nestlé India Listed Peers Comparable Growth

22 Comparable Growth % Reported Growth % On The Road To Double Digit Value Growth *Reported growth rates are adversely impacted due to lower reported sales by the change in structure of indirect taxes and reduction in realisations to pass on the GST benefits

23 On The Road To Broad Based Volume Growth
24 On The Road To Deliver What We Promise Q1 Q2 Q3 Q4 Q1 Q Volume Growth (Domestic) Organic Growth - Domestic (Comparable) Operating Profit as % of Sales (Comparable) Comparable numbers are on estimated basis adjusted for change in Indirect Tax Structure (GST)
25 Total Shareholder s Return Total Return (%) : Annualized Return (%) : 20.7 Bar size represents Market Capitalisation (INR Billion) 1, JUL'18 Market Capitalization is calculated on period end closing share price on BSE


26 ENCORE ONCE MORE!


27 Making It Happen
28 8 Essential M s Mindset of GROWTH Method & Plan Meaning & Outcomes Mastery of Execution
29 8 Essential M s Might lies in Detailed Clusters Managing Infrastructure to match GROWTH Magic of PEOPLE Music of Performance
30 Maps not to scale Consumer Clusters Our New Approach


31 Context Current Construct We see a Gap We have a Vision Branch and State lens Consumer targeting influenced by past precedence and performance NPD planning and launches based on legacy and past performance Maps not to scale Regional players and Start-ups are showing keen consumer connect and high agility Many Indias within India We need to update our view of Consumer India To grow by reaching out to consumers more efficiently By having a sharper understanding of Varying Consumer Potential Consumer Differentiation What sells Where Who buys what and why
 clusters Maps not")
32 Our India in 15 Clusters 3 clusters per geographic branch 3 metro(s) clusters Maps not to scale


33 Cluster Approach Will Unleash Growth Potential Planning Ahead Problem Solving Performance Tracking Resource Optimization Empowerment at Local Levels
 NiM In-Market")


34 Center of Scale(CoS) Center of Competence (CoC) NiM In-Market (Local) Global Expertise & world-class services Shareable Judgmental or competencedriven activities Non-Shareable Category / Business / customer focused

 Gender Diversity")


35 People, Passion, Progress Our Way Of Our Life Attract Women Employees (Total) Gender Diversity Overall Gender Diversity In Hiring Management Trainees 71% 18.5% Women in Managerial Position 14.9% Women in Field Force 17% Technical Trainees 63% Multiple Touch Points On Campus Enhancing Offline & Online Connect


 2015 2016 2017 2018 Dainik Jagran")
36 People, Passion, Progress Our Way Of Our Life Retention & Key Initiatives % High Performer Attrition A soft skill enhancement program for Technical campuses 7% 6% 4% 3% st of its kind initiative in the industry 2 campuses, 85 students % Women Managers Attrition Employee Wellness Initiative employees covered 24*7 professional counselling support 15% 11% 10% 7% 50+ self assessment tools available (2018: Jan to July) Dainik Jagran The Times Of India - Rajasthan

37 Healthier Society and Healthier Environment


38 Enhancing quality of life and contributing to a healthier future for individuals & families Enabling healthier and happier lives for our communities Helping develop thriving, resilient communities for the planet Stewarding resources for future generations Encouraging over good nutrition and breastfeeding practices through community action Over 200,000 students Over 3 million beneficiaries Creating access to water and sanitation Over 290,000 students Reducing water use in agriculture Helping adolescents live healthier Nearly vendors Safe and hygienic food Over students Creating awareness about water conservation Nearly 1400 employees Over 240 trees saved Engaging employees in social initiatives Enhancing rural livelihoods Over 200,000 farmers Recycling waste paper at our offices


39 Good Food, Good Life Means Eat Right Reduced sodium by 10% in relevant product categories in recent years Further by 2020, we will reduce in our relevant product categories An average 6% reduction in added sugar An average 10% reduction in salt An average of about 2.5% reduction in total fat Reduced 850 tonnes of sugar in relevant product categories in recent years

")


40 Plastic Waste Management Recyclable MLP (monomaterial) Around 26,000 tonnes of plastic waste is generated every day in India, 6% of which is multilayered plastic waste.
41 Why Is Plastic Important For The Food Industry? Increased Food safety, Quality and Shelf life. Better Product Hygiene Reduced Food Waste Innovative Packaging Options for Consumers. Consumer Convenience The properties of plastics that enable 1 Inert, inherent barrier against oxygen and moisture 2 Light weight and shatter proof 3 Highly versatile


42 Why Is Plastic an Environment Issue?


43 What is Nestlé India going to do Reduce the use of Plastics Support the development of waste management systems Change complex combinations of packaging materials Collective Action Reduced around 1500 MTs of plastic material used in product packaging Working with Authorities, State Pollution Boards, NGOs, other industry members to develop waste management models EPR implementation already in place for 12 states Work in progress to develop and transit to more environment friendly packaging Commercial pilots done for new MAGGI and MUNCH packaging Special plan of action for hill states and tourist destinations Building consumer awareness on plastic waste disposal
44 Speed, Sharpness, Sustainability Innovations at the Core Improvise but Act! Growth dimension Thrive not Survive Manage for Market Share Our growth > Category Growth Clusters, Micro targeting, Resourcing for Action Today Key efficiency enhancement through Nestlé Business Excellence Active engagement with environment and issues People, passion, progress our way of our life
45 Agenda Nestlé Business Excellence (NBE) Market Dynamics Recap - Impact of GST on financial results Financial Performance: January-June 2018


46 NBE - One Organization Leveraging Skills and Capabilities of Globe & NCE
47 ~1n~ 1 ~~ Business Nestle I Excellence FUEL FOR GROWTH SIMPLIFY STANDARDIZE SHARE Optimize Provide Support Global End-to-End World Class Demand Focused Flows Business Services Organizations ~ Global ~~ Business Nestle Services ~ I '\\ ~O,~ UO~S)\ NisUi /~EXCEil.ENCE /~ ENABLE THROUGH PEOPLE Alignment, Leadership and Lean ways of working / ' ~ I.~~~~ ENABLE THROUGH TECHNOLOGY Processes, Data and Systems
48 Optimizing End-to-End Flows From Customer Order to Invoice Payment E2E Owner is Supply Chain, contributors are Marketing & Sales, Finance From Sourcing Materials and Services to paying vendors E2E Owner is Supply Chain (Procurement), contributors are Supply Chain, Finance From attracting talent to enabling employees on their Nestlé journey E2E Owner is Human Resources, contributor is Finance From recording transactions to financial and performance reporting E2E Owner is Finance, contributors are all End-to-Ends From innovative product ideas to consumer launch E2E Owner is Marketing & Sales, contributors are R&D, Supply Chain, Finance and Control, Technical & Production Processes Data Organization Technology Shared Services From strategic and product planning to supplying our products E2E Owner is Supply Chain, contributors are Technical & Production, Marketing & Sales, Finance

 Shareable Transactional activities e.g.")
49 Provide World Class Business Services Center of Competence (CoC) Shareable Judgmental or Competence-driven activities e.g. Costing, Treasury, Pricing, Order Fulfillment, Customer Exception & Solution Management, Talent & Reward Management, Procurement Center of Scale* (CoS) Shareable Transactional activities e.g. AP, AR, Order Management, Billing, Payroll, HR Administration, Contract & Purchase Order Management Leveraging Skills and Scale to drive Agility *11 Centers of Scale spread across geographies

50 Phases of the NBE Program Transparency AS-IS data gathering Shared service coverage Engagement AS-IS Vs TO-BE comparison Identify Change Impacts Change management Prepare project plan Transformation Implement: New processes New solutions Change impacts New organization designs 7
51 Market Dynamics Market Size 2017 Market Growth (YoY) H1 18 H2 17 FMCG 52.9 Bio F&B 29.7 Bio Processed Food (excld Commodities) 17.0 Bio Market momentum continued to be favourable Nestlé Categories 4.8 Bio Market Size in USD Bio for 2017 (INR 65.08) Note: Infant Formula and Infant Cereal segments included in FMCG, F&B, Processed Foods and Nestlé categories Source: AC Nielsen


52 Market Dynamics and Product Portfolio Market Share % YTD June * 45.2 >70.0 # 67.7 Without Amulspray Leadership position in ~85% of the product portfolio Products scoring higher on NHW grow faster and are more profitable Source: AC Nielsen - June 2018 *In whites and wafers category # Internal Estimates
53 Recap - Impact of GST on Financial results (H1 18) Pre GST Post GST Sales a. Gross of Excise duty Excise duty - Separate cost line b. VAT not recognised as part of Sales a. Excise duty subsumed in GST b. GST not recognised as part of Sales c. Reduction in realisations to pass on GST benefits Impact due to change in Indirect Tax Structure and reduction in realisations (drop in selling price/ increase in grammage) to pass on GST benefits Reported Domestic Sales ~ 5.8% Domestic Sales Growth ~ 6.7% Operating Profit as % of sales ~120 bps Net Profit as % of sales ~ 80 bps
54 Recap - Impact of GST on Financial results (H1 18) Pre GST Post GST Reported Expenses Reported inclusive of Taxes when not Cenvatable Reported net of GST where ITC available Comparability of Results Accordingly, Sales, Absolute expenses, Elements of Working Capital and Ratios in percentage of Sales are not comparable
55 Highlights : January - June Total Sales RIG (%) OG (%) Amount in INR billion unless otherwise stated Profit from Operations Reported Growth* % Comparable Growth % Reported Margin* Effective Margin +590 bps +470 bps / / Net Profit Total Comprehensive Income EPS (INR) Reported Margin* +380 bps Effective Margin +300 bps 15.1 / / INR Growth +43.6% H1 17 H1 18 % of Sales (a) *Reported Growth rates are adversely impacted and Reported Profit margins are positively impacted due to lower reported sales by the change in structure of indirect taxes and reduction in realisations to pass on the GST benefits (b) RIG & OG % are based on Nestlé s Internal Reporting Standards in relation to third party sales (c) Figures in maroon colour represents comparable numbers
56 Evolution of Quarterly results % YoY Growth 7.7*/ 11.0 Total Sales */ */ 17.7 Q1 Q2 Q3 Q4 7.3*/ */ */ 14.6 INR Billion Profit from Operations % of Net Sales 18.1*/ */ */ */ */ */ 20.3 INR Billion (a) *Reported Growth rates are adversely impacted and Reported Profit margins are positively impacted due to lower reported sales by the change in structure of indirect taxes and reduction in realisations to pass on the GST benefits (b) Figures in maroon colour represents comparable numbers
57 Sales Performance Value (INR Billion) Volume (in 000 Tons) 7.1/13.8% 9.2% Domestic Contribution: 94% * 10.7% 16.7% Exports Contribution: 6% H1 17 H1 18 (a) Figures in maroon colour represents comparable growth on estimated basis (b) *Includes extra grammage to comply with anti-profiteering rules
58 Domestic Sales - Growth Reported Growth (%) 7.1 Of Which: RIG (Volume/Mix) Net Pricing Broad Based Growth supported by increase in volumes offset by negative pricing due to GST (a) Reported growth rates are adversely impacted due to lower reported sales by the change in structure of indirect taxes and reduction in realisations to pass on the GST benefits (b) Real Internal Growth (RIG)% is based on Nestlé Internal Reporting Standards

59 Region-wise Sales H1 18 Growth% % Cont to Domestic Sales West 18 North 27 South 24 East 31 Reported Comparable North East South West Total E-Commerce % Cont. to domestic Sales Comparable Growth is on estimated basis H1'17 Bar size represents Sales Value H1'18


60 Categorywise Contribution Product Groups Milk Products & Nutrition Products Contribution (%) H1 18 Growth% Reported Comparable Prepared Dishes & Cooking Aids Confectionery Powdered & Liquid Beverages Domestic Growth Comparable Growth is on estimated basis Domestic Sales: INR 50.7 Billion


 6.3/10.")


61 Milk Products & Nutrition - Domestic 48.1% Value (INR Bio) Volume (000 Tons) 6.3/10.8% 4.6% H1 17 H1 18 Broad based Growth in Key Brands Good response to new launches like CEREGROW, NAN Excella Pro Figures in maroon colour represents comparable growth on estimated basis

")


 *Includes extra")
62 Prepared Dishes & Cooking Aids - Domestic 28.0% Value (INR Bio) Volume (000 Tons) 8.9/15.0% 12.8% * H1 17 H1 18 Continued to rebuild MAGGI Noodles Strong growth in Masala-e-Magic (a) Figures in maroon colour represents comparable growth on estimated basis (b) *Includes extra grammage to comply with anti-profiteering rules

 *Includes extra grammage")
63 Confectionery - Domestic 12.7% Value (INR Bio) Volume (000 Tons) 4.6/15.3% 6.1% * H1 17 H1 18 Strong Growth in KitKat. Good response to New launches Focus on Value Up and Mainstream (a) Figures in maroon colour represents comparable growth on estimated basis (b) *Includes extra grammage to comply with anti-profiteering rules


 Figures in")
")
64 Powdered & Liquid Beverages - Domestic 11.2% Value (INR Bio) Volume (000 Tons) 9.2/23.6% 9.2% * H1 17 H1 18 Strong Growth in NESCAFE Classic & NESCAFE Sunrise Volume Growth positively influenced by liquid beverages Regained No. 1 Market Position * in Instant Coffee *Source: AC Nielsen (a) Figures in maroon colour represents comparable growth on estimated basis (b) *Includes extra grammage to comply with anti-profiteering rules
65 Movement of Profit from Operations Movement in Bps % 20.9% 22.1% H1 17 Reported Materials Employee benefits Depreciation Other Expenses Adv. & Sales Promotion H1 18 Comparable Denominator impact (Reported sales being lower than comparable)* H1 18 Reported Improvement in Margins due lower commodity prices, operating leverage & lower base (a) Percentages are with reference to sales (b) *Reported Profit margins are positively impacted due to lower reported sales by the change in structure of indirect taxes and reduction in realisations to pass on the GST benefits (c) Reported numbers have been adjusted to make them Comparable
66 Marketing Spends * % of Domestic Sales INR Billion H1' 17 H1' 18 Direct Marketing spends grew faster Maintained Investment behind Innovations Digital Media spends growing at CAGR of over 40% for past 3 years (a)*marketing Spends include: Advertisement & Sales Promotion, Marketing & Selling incentives to trade, free goods to consumers etc. (b) Reported numbers have been adjusted to make them Comparable Source: Nielsen
67 Tax Expense and Effective Tax Rate Tax Expense (INR Billion) H1' 17 H1' 18 Marginal Tax Rate (%) Effective Tax Rate (%) 20.0 Effective Tax rate Impacted by End of first 5 years of tax 100% of profits of Samalkha factory Unit II on 31st March For the next 5 years, tax holiday is 30% of profits. Health and Education Cess increased from 3% to 4% w.e.f Financial Year
68 Net Profit after Tax Movement in Bps INR 8.19 Bio INR 5.70 Bio 11.3% 14.3% 15.1% H1 17 Reported Profit from Operations Financial Income Effective Tax Rate H1 18 Comparable Denominator impact (Reported sales being lower than comparable)* H1 18 Reported Net Profit supported by increase in operating margins and treasury income (a) % and bps movements are net of effective tax & in reference to sales (b) *Reported Profit margins are positively impacted due to lower reported sales by the change in structure of indirect taxes and reduction in realisations to pass on the GST benefits
69 Cash generation from Operating activities Amount in INR billion */17.6% 11.4% H1 17 Profit from Trade Net Other Taxes H1 18 Operations Working elements of Capital Working Capital Strong Cash generation from operations (a) Percentages are with reference to sales (b) *Positively Impacted due to lower reported sales by the change in structure of indirect taxes and reduction in realisations to pass on the GST benefits (c) Figures in maroon colour represents comparable numbers
70 Dividend Payout Increased Includes additional Interim dividend of INR 10 Per Share H1 '17 H1 '18 Dividend Per Share (INR)
71 Capital Efficiency & Value Creation Improves ROIC % Economic Profit% Asset Turns Invested Capital 5 (INR Billion) H1'18 Invested capital : Basis average of 5 quarter end (Nestlé Internal Reporting Standards)
72 Key Messages Market Momentum continued to be favorable Market Leadership in 85% of portfolio. Retained focus on NHW & Innovations Sales Growth broad based Margin improvement aided by softer commodity prices & lower base Strong Cash Generation from operations Dividend Payout increased Sustained Value Creation
73 Rebuild of MAGGI Noodles INR Bio 29 Q1 Q2 Q3 Q4 Q1 Q2 Q3 Q4 Q1 Q Bar size represents Sales Value Sales Indexed with Q1 16 Figures in maroon colour represents comparable numbers
74 Commodity Price Movement H1 18 Vs H1 17 Milks Wheat Coffee Palm Oil Sugar DWP MSK Palm Kernel -12% -0.4% -8% -14% -6% -21% 10% 23% Nestlé India s Commodity basket Price Index % H1'18 Indexed with base year 2011
75 Movement in price index of commodity basket % % % - 1.4% % % Q4 Q1 Q2 Q3 Q4 Q1 Q Indexed with base Q4-16

76 Milks Consumption Price Index Milks 37% Current Price 98 Q1 Q2 Q3 Q4 Q1 Q2 Q3 Q4 Q1 Q Indexed with base Q1-16

77 Wheat Flour Consumption Price Index Wheat Flour 12% Current Price Q1 Q2 Q3 Q4 Q1 Q2 Q3 Q4 Q1 Q Indexed with base Q1-16

78 Green Coffee Consumption Price Index Green Coffee 10% Current Price Q1 Q2 Q3 Q4 Q1 Q2 Q3 Q4 Q1 Q Indexed with base Q1-16
79 Palm Oil Consumption Price Index Palm Oil 7% 125 Current Price Q1 Q2 Q3 Q4 Q1 Q2 Q3 Q4 Q1 Q Indexed with base Q1-16

80 Sugar Consumption Price Index Sugar 6% Current Price 95 Q1 Q2 Q3 Q4 Q1 Q2 Q3 Q4 Q1 Q Indexed with base Q1-16

81 DWP Consumption Price Index DWP 4% Current Price Q1 Q2 Q3 Q4 Q1 Q2 Q3 Q4 Q1 Q Indexed with base Q1-16

82 MSK Consumption Price Index MSK 4% Current Price 97 Q1 Q2 Q3 Q4 Q1 Q2 Q3 Q4 Q1 Q Indexed with base Q1-16

83 Palm Kernel Oil Consumption Price Index Palm Kernel Oil 3% Current Price Q1 Q2 Q3 Q4 Q1 Q2 Q3 Q4 Q1 Q Indexed with base Q1-16
Nestlé India Limited. 22nd Financial Analysts Meet. Gurgaon 30 th July 2013
 Nestlé India Limited 22nd Financial Analysts Meet Gurgaon 30 th July 2013 Disclaimer This presentation may contain statements which reflect Management s current views and estimates and could be construed
Nestlé India Limited. 14 th Financial Analysts Meet. Gurgaon, 5 th August 2008
 Nestlé India Limited 14 th Financial Analysts Meet Gurgaon, 5 th August 2008 Agenda Opening Remarks Martial Rolland Key Financials Shobinder Duggal Questions & Answers All Disclaimer This presentation
Nestlé India Limited 20th Financial Analysts Meet - Gurgaon 30th November 2011
 Nestlé India Limited 20 th Financial Analysts Meet - Gurgaon 30 th November 2011 Disclaimer This presentation may contain statements which reflect Management s current views and estimates and could be
 Excerpts from Analysts' Reports 2011 Consistent strong sales growth.. Momentum to continue Capex plans firming up Cut in dividend payout ratio to 56% Raw material cost pressure continue No signs of competitive
Nestlé India Limited
 Nestlé India Limited Nestle India Limited Financial Analysts Meet Financial Analysts Meet - Agenda Introduction & Overview Martial Rolland Financials Shobinder Duggal Chocolates & Confectionery Stewart
Nestlé in India: Winning in the New Reality
 Nestlé in India: Winning in the New Reality Helio Waszyk Chairman and Managing Director Nestlé India September 25 th, 2012 Disclaimer This presentation contains forward looking statements which reflect
2007 half year results conference call
 2007 half year results conference call 2007 half year results conference call - 15 August 2007 Disclaimer This presentation contains forward looking statements which reflect Management s current views
Margin improvement / portfolio management / capital structure François Roger: Chief Financial Officer
 Margin improvement / portfolio management / capital structure François Roger: Chief Financial Officer 1 September 26, 2017 Investor Seminar Disclaimer This presentation contains forward looking statements
2007 half year results roadshow
 2007 half year results roadshow 2007 half year results roadshow - August 2007 Disclaimer This presentation contains forward looking statements which reflect Management s current views and estimates. The
2010 Full Year Results Conference Call. James Singh Chief Financial Officer
 2010 Full Year Results Conference Call James Singh Chief Financial Officer Disclaimer This presentation contains forward looking statements which reflect Management s current views and estimates. The forward
Hindustan Unilever Limited. MQ 18 & FY Results Presentation : 14 th May 2018
 Hindustan Unilever Limited MQ 18 & FY 17-18 Results Presentation : 14 th May 2018 Safe Harbor Statement This Release / Communication, except for the historical information, may contain statements, including
2008 Half-Year results Half-Year results 7 th August 2008 Name of chairman
 1 00 Half-Year results Disclaimer This presentation contains forward looking statements which reflect Management s current views and estimates. The forward looking statements involve certain risks and
Welcome to the Full-Year 2016 Conference. February 16, 2017 Nestlé Full-Year Results 2016
 Welcome to the Full-Year 2016 Conference 1 Disclaimer This presentation contains forward looking statements which reflect Management s current views and estimates. The forward looking statements involve
NESTLE INDIA LTD Result Update (PARENT BASIS): Q2 CY18
: Q2 CY18") Index Details NESTLE INDIA LTD Result Update (PARENT BASIS): Q2 CY18 Stock Data Sector Packaged Foods BSE Code 500790 Face Value 10.00 52wk. High / Low (Rs.) 11590.00/6585.00 Volume (2wk. Avg.) 13000 Market
Index Details NESTLE INDIA LTD Result Update (PARENT BASIS): Q2 CY18 Stock Data Sector Packaged Foods BSE Code 500790 Face Value 10.00 52wk. High / Low (Rs.) 11590.00/6585.00 Volume (2wk. Avg.) 13000 Market
Full-year results 2018
 Full-year results 2018 Investor Call 1 Disclaimer This presentation contains forward looking statements which reflect Management s current views and estimates. The forward looking statements involve certain
Full-year results 2018
 Full-year results 2018 Press Conference 1 Disclaimer This presentation contains forward looking statements which reflect Management s current views and estimates. The forward looking statements involve
Nestlé Investor Seminar 2008
 Nestlé Investor Seminar 2008 Procurement of Raw Materials at Nestlé Malcolm Harrison Head of Procurement 1 Nestlé Investor Seminar Vevey 16-17 June 2008 Disclaimer This presentation contains forward looking
2006 full year conference call
 2006 full year conference call Name of chairman Disclaimer This presentation contains forward looking statements which reflect Management s current views and estimates. The forward looking statements involve
ANNUAL SHAREHOLDERS MEETING May 12, 2014
 ANNUAL SHAREHOLDERS MEETING May 12, 2014 AGENDA PERFORMANCE FY14 FIRST HALF RESULTS PLANS AND GUIDANCE Strong track record of growth and increasing shareholder value over the last ten years Managed to
Nestle India (NEST IN)
") (NEST IN) Rating: HOLD CMP: Rs11,363 TP: Rs10,996 August 24, 2018 Analyst Meet Update Change in Estimates Target Reco Change in Estimates Current Previous CY19E CY20E CY19E CY20E Rating HOLD UNDER REVIEW
(NEST IN) Rating: HOLD CMP: Rs11,363 TP: Rs10,996 August 24, 2018 Analyst Meet Update Change in Estimates Target Reco Change in Estimates Current Previous CY19E CY20E CY19E CY20E Rating HOLD UNDER REVIEW
Nestle India (NEST IN) Altius, Citius, Fortius
 Altius, Citius, Fortius") INSTITUTIONAL EQUITY RESEARCH Nestle India (NEST IN) Altius, Citius, Fortius INDIA FMCG Company Update We attended Nestle analyst meet yesterday and came pretty impressed with 1) management agility on
INSTITUTIONAL EQUITY RESEARCH Nestle India (NEST IN) Altius, Citius, Fortius INDIA FMCG Company Update We attended Nestle analyst meet yesterday and came pretty impressed with 1) management agility on
2007 full year conference call
 2007 full year conference call 2007 full year conference call - 21 February 2008 Disclaimer 2 2007 full year conference call - 21 February 2008 This presentation contains forward looking statements which
Full-year results 2017 Conference. February 15, 2018 Nestlé full-year results 2017
 Full-year results 2017 Conference 1 Disclaimer This presentation contains forward looking statements which reflect Management s current views and estimates. The forward looking statements involve certain
February21, Name of chairman
 SPRING Nestlé Full PRESS Year Results CONFERENCE 2007 February21, 2008 Disclaimer This presentation contains forward looking statements which reflect Management s current views and estimates. The forward
Nestlé India (NESIND) 6603
 6603") Management Meet Note Rating matrix Rating : Buy Target : 76 Target Period : 12-15 months Potential Upside : 15% What s changed? Target EPS CY17E EPS CY18E Rating Unchanged Unchanged Unchanged Unchanged
Management Meet Note Rating matrix Rating : Buy Target : 76 Target Period : 12-15 months Potential Upside : 15% What s changed? Target EPS CY17E EPS CY18E Rating Unchanged Unchanged Unchanged Unchanged
Portfolio Management. François-Xavier Roger EVP, Chief Financial Officer. Nestlé Investor Seminar May, 2016
 Portfolio Management François-Xavier Roger EVP, Chief Financial Officer Nestlé Investor Seminar 24 25 May, 2016 Disclaimer This presentation contains forward looking statements which reflect Management
Our Transformation Continues Sidoti NDR May 29-30, 2018
 Our Transformation Continues Sidoti NDR May 29-30, 2018 Disclosure Regarding Forward-Looking Statements Forward-Looking Statements and Factors That May Affect Future Results: Throughout this presentation,
MORGAN STANLEY GLOBAL CONSUMER & RETAIL CONFERENCE. Cécile Cabanis, CFO. November 14, 2017 I 1 I
 MORGAN STANLEY GLOBAL CONSUMER & RETAIL CONFERENCE November 14, 2017 Cécile Cabanis, CFO I 1 I This document contains certain forward-looking statements concerning Danone. In some cases, you can identify
FY2014 Nine Months Results
 FY2014 Nine Months Results August 13, 2014 Lance Y. Gokongwei President & CEO Michael P. Liwanag Vice President Disclaimer This presentation contains certain forward looking statements with respect to
Unilever - CAGE Conference. Paul Polman CEO Roger Seabrook VP Investor Relations London - 19 th March 2012
 Unilever - CAGE Conference Paul Polman CEO Roger Seabrook VP Investor Relations London - 19 th March 2012 Contents 1 2011 key takeaways 2 Our progress over the last 3 years 3 Your questions addressed 2011
JOHN F. BROCK / CHAIRMAN & CEO BILL DOUGLAS / EVP & CFO
 JOHN F. BROCK / CHAIRMAN & CEO BILL DOUGLAS / EVP & CFO Forward-Looking Statements INCLUDED IN THIS PRESENTATION ARE FORWARD-LOOKING MANAGEMENT COMMENTS AND OTHER STATEMENTS THAT REFLECT MANAGEMENT S CURRENT
Safe Harbor Statement
 Hindustan Unilever Limited DQ 17 Results Presentation : 17 th January 2018 1 Safe Harbor Statement This Release / Communication, except for the historical information, may contain statements, including
Nestlé Press conference, February 19, 2010
 Nestlé Press conference, February 19, 2010 2 Nestlé Press conference, February 19, 2010 Paul Bulcke Chief Executive Officer Nestlé S.A. Richard Laube John Harris Laurent Freixe Luis Cantarell Frits van
Our Transformation Continues. March 21, 2018
 Our Transformation Continues March 21, 2018 Disclosure Regarding Forward-Looking Statements Forward-Looking Statements and Factors That May Affect Future Results: Throughout this presentation, we make
RESULTS FOR SEPTEMBER QUARTER % DOMESTIC CONSUMER SALES GROWTH, OPERATING PROFIT (PBIT) UP 11% IN SEPTEMBER QUARTER 2013
 UP 11% IN SEPTEMBER QUARTER 2013") RESULTS FOR SEPTEMBER QUARTER 2013 10% DOMESTIC CONSUMER SALES GROWTH, OPERATING PROFIT (PBIT) UP 11% IN SEPTEMBER QUARTER 2013 Mumbai, October 26 th, 2013: Hindustan Unilever Limited announced its results
RESULTS FOR SEPTEMBER QUARTER 2013 10% DOMESTIC CONSUMER SALES GROWTH, OPERATING PROFIT (PBIT) UP 11% IN SEPTEMBER QUARTER 2013 Mumbai, October 26 th, 2013: Hindustan Unilever Limited announced its results
KRAFT FOODS BACK-TO-SCHOOL. September 2008
 KRAFT FOODS BACK-TO-SCHOOL September 2008 Irene Rosenfeld Chairman and CEO 2 Forward Looking Statements This presentation contains forward-looking statements regarding our four strategies to get Kraft
Half Year Results François-Xavier Roger Chief Financial Officer
 Half Year Results 2016 François-Xavier Roger Chief Financial Officer Disclaimer This presentation contains forward looking statements which reflect Management s current views and estimates. The forward
Investor Relations Presentation
 Investor Relations Presentation Delivering solutions, shaping the future. Beauty + Home Food + Beverage Pharma Forward Looking Statements & Non-GAAP Financial Measures This presentation includes forward-looking
Group sales, profitability and financial position
 First half of : Nestlé delivers 3.5% organic growth combined with a 30 bps EBIT margin improvement Vevey, Switzerland, August 12, CHF Millions Reported Change vs. Reported Sales Group 52 267 +3.5% -1.5%
BARCLAYS GLOBAL CONSUMER STAPLES CONFERENCE
 I 1 I BARCLAYS GLOBAL CONSUMER STAPLES CONFERENCE September 6, 2017 Emmanuel Faber, CEO I 2 I This document contains certain forward-looking statements concerning Danone. In some cases, you can identify
SQ 14 Results Presentation October 27, 2014
 SQ 14 Results Presentation October 27, 2014 1 Safe Harbor Statement This Release / Communication, except for the historical information, may contain statements, including the words or phrases such as expects,
PRESS RELEASE. de-stocking; consolidated net profit without exceptional items is INR 230 crore
 PRESS RELEASE 1Q FY2018 results India business delivers 6% sales growth despite GST driven de-stocking; consolidated net profit without exceptional items is INR 230 crore Mumbai, July 31, 2017: Godrej
Nestlé s long-term value creation model
 Nestlé s long-term value creation model François-Xavier Roger EVP, Chief Financial Officer Nestlé, S.A. Bernstein Conference London, September 2018 September 27, 2018 Bernstein Conference 1 Disclaimer
DQ 2015 Results Presentation January 15, 2016
 DQ 2015 Results Presentation January 15, 2016 1 Safe Harbor Statement This Release / Communication, except for the historical information, may contain statements, including the words or phrases such as
2015 Letter to Our Shareholders
 2015 Letter to Our Shareholders 1 From Our Chairman & CEO Pierre Nanterme DELIVERING IN FISCAL 2015 Accenture s excellent fiscal 2015 financial results reflect the successful execution of our strategy
2005 full year results conference call
 2005 full year results conference call - February 2006 2005 full year results conference call 2 2005 full year results conference call - February 2006 2005: Delivering The Nestle Model: Improvement in
CAGNY Conference. February 22, 2018
 CAGNY Conference February 22, 2018 Disclaimer This presentation has been prepared and issued by Nomad Foods Limited (the "Company"). This Presentation has been provided solely for information and background.
Kraft Foods. Deutsche Bank Global Consumer Conference. June 19, 2012
 Kraft Foods Deutsche Bank Global Consumer Conference June 19, 2012 Forward-looking statements This presentation contains a number of forward-looking statements. The words drive, build, focus, manage, aim,
MQ 2015 & FY Results Presentation May 8, 2015
 MQ 2015 & FY 2014-15 Results Presentation May 8, 2015 1 Safe Harbor Statement This Release / Communication, except for the historical information, may contain statements, including the words or phrases
Nestlé India. Q2CY17 Result Update. Positives priced in; Downgrade to Hold. Sector: FMCG CMP: ` 6,786. Recommendation: HOLD
 Nestlé India Q2CY17 Result Update Positives priced in; Downgrade to Hold Sector: FMCG CMP: ` 6,786 Recommendation: HOLD Market statistics Current stock price (`) 6,786 Shares O/S (cr.) 9.6 Mcap (`cr) 65,424
FY2012 First Quarter Results February 15, 2012
 FY2012 First Quarter Results February 15, 2012 AGENDA FY12 Q1 Financial Performance Plans and Expectations Total URC: Margin recovery has started Php Billions First Quarter 2012 (Year on year % change)
JOHN F. BROCK CHAIRMAN & CEO NIK JHANGIANI SVP & CFO
 JOHN F. BROCK CHAIRMAN & CEO NIK JHANGIANI SVP & CFO Forward-Looking Statements Included in this presentation are forward-looking management comments and other statements that reflect management s current
Acquisition of Crown Flour Mills Limited 12 January 2010 Singapore
 Acquisition of Crown Flour Mills Limited 12 January 2010 Singapore 1 1 Cautionary note on forward-looking statements This presentation may contain statements regarding the business of Olam International
Unilever Investor Event 2018 Graeme Pitkethly 4 th December 2018
 Unilever Investor Event 2018 Graeme Pitkethly 4 th December 2018 SAFE HARBOUR STATEMENT This announcement may contain forward-looking statements, including forward-looking statements within the meaning
Bernstein Strategic Decisions Conference John Murphy President, Asia Pacific. September 26, 2018
 Bernstein Strategic Decisions Conference John Murphy President, Asia Pacific September 26, 2018 FORWARD-LOOKING STATEMENTS This presentation may contain statements, estimates or projections that constitute
Nestle India NEUTRAL. Performance Highlights. CMP `4,387 Target Price - 2QCY2012 Result Update FMCG. Quarterly results. Investment Period -
 2QCY2012 Result Update FMCG August 6, 2012 Nestle India Performance Highlights Quarterly results (` cr) 2QCY12 2QCY11 % yoy 1QCY12 % qoq Revenue 1,987 1,763 12.7 2,047 (3.0) EBITDA 429 344 24.5 457 (6.2)
The New Unilever Simpler, Faster, Stronger Jean-Marc Huët
 The New Unilever Simpler, Faster, Stronger Jean-Marc Huët Agenda 1 Driving sustainable growth ahead of the market 2 Delivering steady, sustainable margin improvements 3 Deploying cash effectively to fund
Results SQ 10. October 26, Investor Presentation
 Results SQ 10 October 26, 2010 Investor Presentation Safe Harbour Statement This Release / Communication, except for the historical information, may contain statements, including the words or phrases such
Half-year results July 27, 2017 Nestlé half-year results 2017
 Half-year results 2017 1 Disclaimer This presentation contains forward looking statements which reflect Management s current views and estimates. The forward looking statements involve certain risks and
Press release Vevey, February 15, Nestlé reports full-year results for 2017
 Press release Vevey, February 15, 2018 Follow today's events live 09:00 CET Press conference webcast 14:00 CET Investor call audio webcast Full details: www.nestle.com/media/mediaeventscalendar/allevents/-full-year-results
Investor Presentation. April 2018
 Investor Presentation April 2018 Disclaimer This presentation has been prepared and issued by Nomad Foods Limited (the "Company"). This Presentation has been provided solely for information and background.
DQ 14 Results Presentation January 19, 2015
 DQ 14 Results Presentation January 19, 2015 1 Safe Harbor Statement This Release / Communication, except for the historical information, may contain statements, including the words or phrases such as expects,
Half-year results July 26, 2018 Nestlé half-year results
 Half-year results 2018 July 26, 2018 Nestlé half-year results 2018 1 Disclaimer This presentation contains forward looking statements which reflect Management s current views and estimates. The forward
2016 RESULTS February 15, Emmanuel Faber, CEO Cécile Cabanis, CFO
 2016 RESULTS February 15, 2017 Emmanuel Faber, CEO Cécile Cabanis, CFO DISCLAIMER This document contains certain forward-looking statements concerning Danone. Although Danone believes its expectations
Delivering Superior Sustainable Profitable Growth
 Investor Seminar October 22, 2018 Delivering Superior Sustainable Profitable Growth Cécile CABANIS CFO Our journey towards long-term sustainable value creation Accelerated transformation since last three
2012 Full Year Results
 2012 Full Year Results Wan Ling Martello Chief Financial Officer Roddy Child-Villiers Head of Investor Relations Disclaimer This presentation contains forward looking statements which reflect Management
Hindustan Unilever Limited. SQ 18 Results Presentation : 12 th October 2018
 Hindustan Unilever Limited SQ 18 Results Presentation : 12 th October 2018 Safe Harbor Statement This Release / Communication, except for the historical information, may contain statements, including the
A new inflection point. 10 February 2017
 A new inflection point 10 February 2017 1 Important notice This presentation contains statements with respect to the financial condition, results of operations and business of RB (the Group ) and certain
September Quarter 2015 Results Presentation October 14, 2015
 September Quarter 2015 Results Presentation October 14, 2015 1 Safe Harbor Statement This Release / Communication, except for the historical information, may contain statements, including the words or
John F. Brock CHAIRMAN & CEO. Bill Douglas EVP & CFO
 John F. Brock CHAIRMAN & CEO Bill Douglas EVP & CFO Forward-Looking Statements INCLUDED IN THIS PRESENTATION ARE FORWARD- LOOKING MANAGEMENT COMMENTS AND OTHER STATEMENTS THAT REFLECT MANAGEMENT S CURRENT
Welcome to the Nine-Month Sales Conference
 Welcome to the Nine-Month Sales Conference Nine-Month Sales Conference Paul Bulcke Nestlé CEO 2010 2011 2012 2013 3 Nine-Month Sales Conference Wan Ling Martello Chief Financial Officer This presentation
Unilever at Deutsche Bank Conference Paul Polman CEO Paris, June 11 th 2015
 Unilever at Deutsche Bank Conference Paul Polman CEO Paris, June 11 th 2015 SAFE HARBOUR STATEMENT This presentation may contain forward-looking statements, including forward-looking statements within
Chairman & CEO SVP & CFO
 Chairman & CEO SVP & CFO 1 Included in this presentation are forward-looking management comments and other statements that reflect management s current outlook for future periods. As always, these expectations
Nestlé (Malaysia) Berhad. January June Financial Analysts Briefing 14 th August 2015
 Berhad. January June Financial Analysts Briefing 14 th August 2015") Nestlé (Malaysia) Berhad January June 2015 Financial Analysts Briefing 14 th August 2015 Disclaimer This presentation contains forward looking statements which reflect Management s current views and estimates.
Nestlé (Malaysia) Berhad January June 2015 Financial Analysts Briefing 14 th August 2015 Disclaimer This presentation contains forward looking statements which reflect Management s current views and estimates.
Dollar guidance revised upwards; Rupee guidance revised downwards, reflecting appreciating Rupee
 Q1 revenues grew by 25.1% year on year; sequential growth flat Dollar guidance revised upwards; Rupee guidance revised downwards, reflecting appreciating Rupee Bangalore, India July 11, 2007 Highlights
Zone Americas. Luis Cantarell. Executive VP, Zone AMS. 11 November 2009
 Zone Americas Luis Cantarell Executive VP, Zone AMS November 009 Disclaimer This presentation contains forward looking statements which reflect Management s current views and estimates. The forward looking
PRESS RELEASE. Mumbai, January 30, 2017: Godrej Consumer Products Limited (GCPL), a leading
, a leading") PRESS RELEASE 3Q FY2017 results GCPL delivers sales growth of 8% and EBITDA growth of 14% Mumbai, January 30, 2017: Godrej Consumer Products Limited (GCPL), a leading emerging markets FMCG company, today
PRESS RELEASE 3Q FY2017 results GCPL delivers sales growth of 8% and EBITDA growth of 14% Mumbai, January 30, 2017: Godrej Consumer Products Limited (GCPL), a leading emerging markets FMCG company, today
Dean Foods. May 2015
 Dean Foods May 2015 1 Forward-Looking Statements Some of the statements made in this presentation are forward-looking and are made pursuant to the safe harbor provision of the Private Securities Litigation
BERNSTEIN STRATEGIC DECISIONS CONFERENCE
 BERNSTEIN STRATEGIC DECISIONS CONFERENCE September 28, 2017 Cécile Cabanis, CFO I 1 I This document contains certain forward-looking statements concerning Danone. In some cases, you can identify these
Hindustan Unilever Limited SQ 17 Results Presentation : 25 th Oct 2017
 Hindustan Unilever Limited SQ 17 Results Presentation : 25 th Oct 2017 1 Safe Harbor Statement This Release / Communication, except for the historical information, may contain statements, including the
John F. Brock CHAIRMAN & CEO. Nik Jhangiani SVP & CFO
 John F. Brock CHAIRMAN & CEO Nik Jhangiani SVP & CFO Forward-Looking Statements Included in this presentation are forward-looking management comments and other statements that reflect management s current
Business snapshot. ~50% of revenues comes from international businesses. Leading market share in home care, hair care and personal care
 May 24, 2016 Business snapshot Emerging markets FMCG leader Excellent track record of value creation among FMCG companies in India Growing presence in Asia, Africa and Latin America $ Leading market share
Henkel Our strategic priorities for the future. Hans Van Bylen / Carsten Knobel Press Conference, November 17, 2016
 Henkel 2020 + Our strategic priorities for the future Hans Van Bylen / Carsten Knobel Press Conference, November 17, 2016 Disclaimer This information contains forward-looking statements which are based
For personal use only
 Freedom Foods Group Limited Presentation to Morgan's Conference October 2016 Important Information This presentation is provided for information purposes only. The information contained in this presentation
Total Group Zone AMS Zone EMENA Zone AOA
 Press release Vevey, October 19, 2017 Follow today's event live 14:00 CEST Investor call audio webcast Full details: http://www.nestle.com/media/mediaeventscalendar/allevents/nine-month-sales-2017 reports
Hector Grisi. Country Head Mexico. Helping people and businesses prosper
 Hector Grisi Country Head Mexico Helping people and businesses prosper Banco Santander, S.A. ("Santander") cautions that this presentation contains statements that constitute forward-looking statements
Nestle India (NEST IN)
") (NEST IN) Rating: ACCUMULATE CMP: Rs9,569 TP: Rs11,129 October 26, 2018 Q3CY18 Result Update Change in Estimates Target Reco Change in Estimates Current Previous CY19E CY20E CY19E CY20E Rating ACCUMULATE
(NEST IN) Rating: ACCUMULATE CMP: Rs9,569 TP: Rs11,129 October 26, 2018 Q3CY18 Result Update Change in Estimates Target Reco Change in Estimates Current Previous CY19E CY20E CY19E CY20E Rating ACCUMULATE
McCormick & Company, Inc. 3rd Quarter 2017 Financial Results and Outlook September 28, 2017
 McCormick & Company, Inc. 3rd Quarter 2017 Financial Results and Outlook September 28, 2017 1 The following slides accompany a September 28, 2017 earnings release conference call. This information should
April 1, 2011 Barry Callebaut H1 2010/11 results presentation
 Half-Year Results 2010/11 Media presentation April 1, 2011 April 1, 2011 Barry Callebaut H1 2010/11 results presentation Cautionary note Certain statements in this presentation regarding the business of
9M CY2018 Unaudited Results Investor Briefing October 25, 2018
 9M CY2018 Unaudited Results Investor Briefing October 25, 2018 Irwin C. Lee President and CEO Mike P. Liwanag Senior Vice President AGENDA 1 9M CY2018 Unaudited Financial Results 2 Expectations & Updates
JQ 14 Results Presentation July 28, 2014
 JQ 14 Results Presentation July 28, 2014 1 Safe Harbor Statement This Release / Communication, except for the historical information, may contain statements, including the words or phrases such as expects,
Business snapshot. ~50% of revenues comes from international businesses. Leading market share in home care, hair care and personal care
 February 3, 2016 Business snapshot Emerging markets FMCG leader Excellent track record of value creation among FMCG companies in India Growing presence in Asia, Africa and Latin America $ Leading market
Conference Call First Quarter 2014 Financial Results. Presentation3
 Conference Call First Quarter 204 Financial Results Presentation3 May 2, 204 Agenda 2 Presentation3 Agenda 2 3 4 5 6 Opening Remarks Global Alimentos Acquisition Q4 Highlights Operating and Financial Review
2018 Annual Meeting. April 26, 2018
 2018 Annual Meeting April 26, 2018 Our vision and credo guide us: The destination Colleagues Mission To help our customers, colleagues and communities reach their potential Regulators Customers Investors
A purpose-driven, global, multichannel cosmetics group. Transaction close briefing 11th September 2017
 A purpose-driven, global, multichannel cosmetics group Transaction close briefing 11th September 2017 1 2 Three brands, one vision Guilherme Leal TODAY'S AGENDA A renewed governance and management structure
Business snapshot. 48% of revenue comes from international businesses. Leading market share in home care, hair care and personal care
 May 26, 2017 Business snapshot Emerging markets FMCG leader Excellent track record of value creation among FMCG companies in India Growing presence in Asia, Africa and Latin America Leading market share
Sector Manager: Richard Sparkes Senior Analyst: Patrick Folan Analysts: Cian Mulcahy, Marie-Louise O' Callaghan, Ioustina Martin
 Nestlé Pitch Sector Manager: Richard Sparkes Senior Analyst: Patrick Folan Analysts: Cian Mulcahy, Marie-Louise O' Callaghan, Ioustina Martin Introduction: Company Snapshot Nestlé one year share price
Market Access. Company Note. M&A Securities. Nestle Malaysia Berhad. Steering Away From Turbulence. Tuesday, June 21, 2016 HOLD (TP: RM79.
 M&A Securities Company Note PP14767/09/2012(030761) Nestle Malaysia Berhad Steering Away From Turbulence 1Q16 results review. To recap, Nestle Malaysia Berhad (Nestle) registered its 1Q16 revenue at RM1.3
AVI Limited presentation to shareholders & analysts for the year ended 30 June 2014
 AVI Limited presentation to shareholders & analysts for the year ended 30 June 2014 AGENDA Key features and results history Group financial results Performance and prospects Questions and answers KEY FEATURES
Full-year CY2017 Earnings Call
 Full-year CY2017 Earnings Call Lance Y. Gokongwei President and CEO Michael P. Liwanag Vice President AGENDA Full Year CY2017 Financial Performance and Business Updates Plans and Expectations for 2018