Provision of Flood Risk Information for sites on Duchess Street, Grimsby and Doughty Road, Grimsby.
|
|
|
- John James
- 6 years ago
- Views:
Transcription
1 Hassan Choudhry Our ref: CCN/217/66343 & Date: 2 November 217 Dear Hassan Provision of Flood Risk Information for sites on Duchess Street, Grimsby and Doughty Road, Grimsby. Thank you for your request to use our flood risk information in the development of the Flood Risk Assessment (FRA) for the above site. The information is set out below and attached. It is important you read any contextual notes on the maps provided. We aim to review our information on a regular basis, so if you are using this data more than twelve months from the date of this letter, please contact us again to check it is still valid. Flood Map The attached map includes the current Flood Map for your area. The Flood Map indicates the area at risk of flooding, assuming no flood defences exist, for a flood with a.5% chance of occurring in any year for flooding from the sea, or a 1% chance of occurring for fluvial (river) flooding. It also shows the extent of the Extreme Flood Outline which represents the extent of a flood with a.1% chance of occurring in any year, or the highest recorded historic extent if greater. In some locations, such as around the fens and the large coastal floodplains, showing the area at risk of flooding assuming no defences may give a slightly misleading picture in that if there were no flood defences, water would spread out across these large floodplains. This flooding could cover large areas of land but to relatively shallow depths and could leave pockets of locally slightly higher land as isolated dry islands. It is important to understand the actual risk of the flooding to these dry islands, particularly in the event of defence failure. The Flood Map also shows the location of formal raised flood defences and flood storage reservoirs. It represents areas at risk of flooding for present day only and does not take account of climate change. The Flood Map only indicates the extent and likelihood of flooding from rivers or the sea. It should also be remembered flooding may occur from other sources such as surface water sewers, road drainage, etc. History of Flooding With regards to the history of flooding I can advise we do not have any records of flooding in this area. It is possible other flooding may have occurred we do not have records for, and other organisations, such as the Local Authority or Internal Drainage Boards, may have records. Ceres House, Searby Road, Lincoln, LN2 4DW Customer services line: enquiries@environment-agency.gov.uk
2 Fluvial Flood Risk Information There are no formal flood defences reducing the risk of flooding to this site. The nearby main river channel reduces the risk of flooding to a 1% (1 in 1) chance of occurring in any year. Tidal Flood Risk Information Tidal Defence Information The tidal defences protecting this site consist of concrete floodwalls which are supplemented by saltmarsh to maintain foreshore levels. They are in good condition and reduce the risk of flooding to a 1% (1 in 1) chance of occurring in any year. We inspect these defences routinely to ensure potential defects are identified. Tidal Flood Levels The attached table shows our current best estimate for extreme tide levels. Levels for the Humber Estuary have an assessment date of 214, with others having an assessment date of 26, which should be used in any consideration of future increases due to climate change. Modelled Hazard Mapping For certain locations we have carried out modelling to map the maximum values of flood depth, velocity and hazard rating (danger to people) resulting from overtopping and / or breaching of defences at specific locations for a number of scenarios. At present this information is available along the full coastal / tidal floodplain, except the tidal Witham Haven in Boston (upstream of Hobhole) where only breaching and not overtopping has been modelled and the tidal River Welland upstream of Fosdyke Bridge where neither breaching nor overtopping are available. Hazard mapping is also available for fluvial flood risk in Northampton, Thrapston, Lincoln, Brigg, Wainfleet and some isolated rural locations. The number of locations we have this information for is expected to increase in time. Hazard Mapping Breaching The attached maps show the maximum values of flood depth, velocity and hazard rating (danger to people) resulting from breaching of the defences at specific locations for the scenarios below. For some locations the breach mapping also includes flooding from overtopping if this is expected in that scenario. The location of modelled tidal breaches is shown on a separate attached map. Year 26 Year 26 Year 2115 Year % (1 in 2) chance.1% (1 in 1) chance.5% (1 in 2) chance.1% (1 in 1) chance Ceres House, Searby Road, Lincoln, LN2 4DT Customer services line: enquiries@environment-agency.gov.uk
3 Hazard Mapping Overtopping The attached maps show the maximum values of flood depth, velocity and hazard rating (danger to people) resulting from simulated overtopping of defences for the following scenarios: Year 2115 Year % (1 in 2) chance.1% (1 in 1) chance Your site is not affected by overtopping of the defences for the present day (26) scenarios. Development Planning If you have requested this information to help inform a development proposal, then you should note the information on GOV.UK on the use of our information for Flood Risk Assessments. We recommend that you undertake a formal pre-application enquiry using the form available from the website. Climate change will increase flood risk due to overtopping of defences. Please note the climate change data included has an allowance for 2% increase in flow. Updated guidance on how climate change could affect flood risk to new development - Flood risk assessments: climate change allowances was published on GOV.UK in February 216. The appropriate updated climate change allowance should be applied in a Flood Risk Assessment. You should also consult the Strategic Flood Risk Assessment produced by your local planning authority. Supporting Information Please see the Standard Notice or licence for details of permitted use. The Standard Notice can be found at the link below. We respond to requests for recorded information we hold under the Freedom of Information Act 2 (FOIA) and the associated Environmental Information Regulations 24 (EIR). Further information on flood risk can be found on the GOV.UK website at: Other Flood Risk Management Authorities The information provided with this letter relates to flood risk from main river or the sea. Additional information may be available from your Lead Local Flood Authority (ie county council or unitary authority) or, where they exist, the Internal Drainage Board. Further Contact I hope we have correctly interpreted your request. If you are not satisfied with our response to your request for information, you can contact us within two calendar months to ask for our decision to be reviewed. Ceres House, Searby Road, Lincoln, LN2 4DT Customer services line: enquiries@environment-agency.gov.uk

4 If you have any queries or would like to discuss the content of this letter further please contact Robert Eames using the details below. Yours sincerely, FOR Claire Rose Partnerships and Strategic Overview Team Leader - South Humber and East Coast Direct dial Direct PSO_Coastal@environment-agency.gov.uk Enc. Flood Map Estimated Tide Levels Tidal Breach Locations Map Hazard Mapping Breaching (4 maps) Hazard Mapping Overtopping (2 maps) Awarded to Lincolnshire & Northamptonshire Area Ceres House, Searby Road, Lincoln, LN2 4DT Customer services line: enquiries@environment-agency.gov.uk
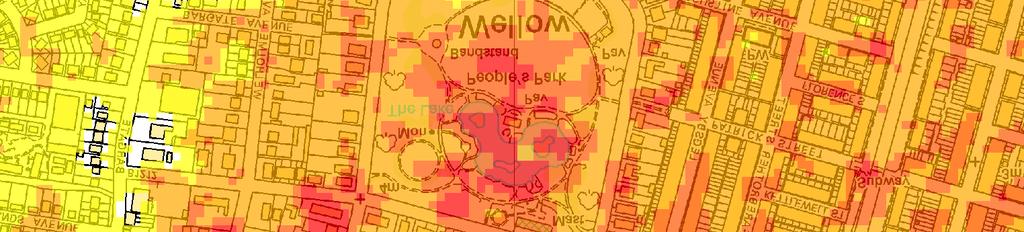
![Flood Map centred on TA 26997 9163 - created November 217 [Ref: CCN-217-66345] Scale 1:1, - Main River!](/docs-images/77/75696035/images/5-20.jpg "!!!!!!!!!!!!! Raised Defences Flood Storage Areas Area at Risk of Flooding from Rivers or The Sea Extreme Flood Outline Dark blue shows the area that could be affected by flooding, either from rivers")
5 Flood Map centred on TA created November 217 [Ref: CCN ] Scale 1:1, - Main River!!!!!!!!!!!!!! Raised Defences Flood Storage Areas Area at Risk of Flooding from Rivers or The Sea Extreme Flood Outline Dark blue shows the area that could be affected by flooding, either from rivers or the sea, if there were no flood defences. This area could be flooded: - from the sea by a flood that has a.5% (1 in 2) or greater chance of happening each year. - or from a river by a flood that has a 1% (1 in 1) or greater chance of happening each year. Light blue shows the extent of the Extreme Flood Outline, which represents the extent of a flood event with a.1% chance of occurring in any year, or the highest recorded historic extent if greater. These two colours show the extent of the natural floodplain if there were no flood defences or certain other manmade structures and channel improvements. Sites outside the two extents, but behind raised defences, may be affected by flooding if the defences are overtopped or fail. Created by the Partnerships and Strategic Overview Team, Lincoln Environment Agency copyright and / or database rights 217. All rights reserved. Crown Copyright and database right. All rights reserved. Environment Agency, 12638, 217. Contact Us: National Customer Contact Centre, PO Box 544, Rotherham, S6 1BY. Tel: (Mon-Fri 8-6). enquiries@environment-agency.gov.uk
 Lawyers Sluice Marsh Road (Welland Tidal) West Lighthouse Wisbech (Nene Tidal) Produced May 217 Produced by Partnerships & Strategic Overview Team Dog in a")
6 Tidal Level Location Map Lincolnshire & Northamptonshire Area H27 H25 H23 H22 H21 H2 H17 H15 H13 H1 South Ferriby Immingham H9 H8 H6 H5 H3 Great Eau Boygrift Burgh Sluice Grand Sluice (Witham Tidal) Hobhole Fosdyke Bridge (Welland Tidal) Lawyers Sluice Marsh Road (Welland Tidal) West Lighthouse Wisbech (Nene Tidal) Produced May 217 Produced by Partnerships & Strategic Overview Team Dog in a Doublet (Nene Tidal) Environment Agency copyright and / or database rights 217. All rights reserved. Crown Copyright and database right. All rights reserved. Environment Agency, 12638, 217.

7 Tidal Water Levels for the South Humber, East Coast and The Wash The table below shows still water levels for locations, from the above location map, around the South Humber Estuary, East Coast and The Wash. It is important to note the following: The base date for the data is 214 for the South Humber and 26 for the East Coast and The Wash. The data are still water levels. Depending on the use of the data it may be necessary to consider wave heights and / or joint probability analysis of water level and other variables. The water level quoted is the Best Estimate water level. Depending on the use of the data it may be necessary to carry out sensitivity testing. Upper and Lower 95% confidence bandings are available upon request. Levels for other annual chance scenarios are available if required. Ref Location Easting Northing Annual Chance ( 1 in x) of Tide Level metres ODN HUMBER H3 Tetney H5 Buck Beck H6 Grimsby H8 Haborough Marsh H9 Immingham H1 South Killingholme H13 North Killingholme H15 East Halton H17 Goxhill H2 New Holland H21 Barrow Haven H22 Ferriby H23 Winterton H25 Blacktoft H27 Goole East Coast ~ Great Eau ~ Boygrift ~ Burgh Sluice Wash ~ Hobhole ~ Lawyers Sluice ~ West Lighthouse ~ Grand Sluice ~ ~ Fosdyke Bridge ~ ~ Marsh Road ~ ~ Wisbech ~ ~ Dog In Doublet ~

, Depth and Velocity.")


8 Modelled Breach Locations This map indicates the location of where we have modelled the consequence of breaches in the defences along the coastline and tidal rivers. We have mapped the the maximum values of Hazard Rating (Danger to People), Depth and Velocity. We have not assumed that all breaches occur at the same time, but have modelled each breach individually and overlaid the results to find the maximum values. Our modelling only considers the consequences of a breach, it does not make any assumption about the likelihood of a breach occurring. Our defences generally provide a good standard of flood defence but a risk of breaching remains. Please contact the Environment Agency for information on how these maps are used in the management of flood risk. General Enquiries No: Weekday daytime calls cost 5p plus up to 6ppm from BT Weekend Unlimited. Mobile and other providers charges may vary Produced by th e Partnership and Strategic Overview Team, Lin coln General Enqui ries No: Northern Area Tidal Hazard Mapping Location of Modelled Breaches This map is reproduced by permission of Ordnance Survey on behalf of The Controller of Her Majesty's Stationary Office. Crown copyright. All rights reserved. Environment Agency 12638, 214 Unauthorised reproduction infringes Crown copyright and may lead to prosecution or civil proceedings.
 Max Depth (m) Between.75 and 1.25 (Danger for Some) Between 1.25 and 2.")
 Date Printed November Scenario year 217 - see also the accompanying plan \"Location of")
 CCN Number CCN-21766343 & 66345.4 Max Velocity.")


9 Max Depth.4 Modelled Breach Locations (Flood Risk to People : FD232) Less than.75 (Low Hazard) Max Depth (m) Between.75 and 1.25 (Danger for Some) Between 1.25 and 2. (Danger for Most) Greater than 2. (Danger for All) Date Printed November Scenario year see also the accompanying plan "Location of Modelled Breaches" 26 Max Velocity (m/s) Scenario Annual Chance.5% (1 in 2) CCN Number CCN & Max Velocity.4 This map shows the level of flood hazard to people (called a hazard rating) if our flood defences are breached at certain locations, for a range of scenarios. The hazard rating depends on the depth and velocity of floodwater, and maximum values of these are also mapped. The map is based on computer modelling of simulated breaches at specific locations. Each breach has been modelled individually and the results combined to create this map. Multiple breaches, other combinations of breaches, different sized tidal surges or flood flows may all give different results. The map only considers the consequences of a breach, it does not make any assumption about the likelihood of a breach occurring. The likelihood of a breach occurring will depend on a number of different factors, including the construction and condition of the defences in the area. A breach is less likely where defences are of a good standard, but a risk of breaching remains. General Enquiries No: providers charges may vary Weekday Daytime calls cost 5p plus up to 6p per minute from BT Weekend Unlimited. Mobile and other Lincolnshire and Northamptonshire Breach Hazard mapping Map Centred on TA This map is reproduced by permission of Ordnance Survey on behalf of The Controller of Her Majesty's Stationary Office. Crown copyright. All rights reserved. Environment Agency 12638, 217. Unauthorised reproduction infringes Crown copyright and may lead to prosecution or civil proceedings.
 Max Depth (m) Between.75 and 1.25 (Danger for Some) Between 1.")
 Date Printed November Scenario year 217 - see also the")

 if")


10 Max Depth.4 Modelled Breach Locations (Flood Risk to People : FD232) Less than.75 (Low Hazard) Max Depth (m) Between.75 and 1.25 (Danger for Some) Between 1.25 and 2. (Danger for Most) Greater than 2. (Danger for All) Date Printed November Scenario year see also the accompanying plan "Location of Modelled Breaches" 26 Max Velocity (m/s) Scenario.1% Annual (1 in 1) Chance CCN Number CCN & Max Velocity.4 This map shows the level of flood hazard to people (called a hazard rating) if our flood defences are breached at certain locations, for a range of scenarios. The hazard rating depends on the depth and velocity of floodwater, and maximum values of these are also mapped. The map is based on computer modelling of simulated breaches at specific locations. Each breach has been modelled individually and the results combined to create this map. Multiple breaches, other combinations of breaches, different sized tidal surges or flood flows may all give different results. The map only considers the consequences of a breach, it does not make any assumption about the likelihood of a breach occurring. The likelihood of a breach occurring will depend on a number of different factors, including the construction and condition of the defences in the area. A breach is less likely where defences are of a good standard, but a risk of breaching remains. General Enquiries No: providers charges may vary Weekday Daytime calls cost 5p plus up to 6p per minute from BT Weekend Unlimited. Mobile and other Lincolnshire and Northamptonshire Breach Hazard mapping Map Centred on TA This map is reproduced by permission of Ordnance Survey on behalf of The Controller of Her Majesty's Stationary Office. Crown copyright. All rights reserved. Environment Agency 12638, 217. Unauthorised reproduction infringes Crown copyright and may lead to prosecution or civil proceedings.

 Max Depth (m) Between.75 and 1.")
 Greater than 2.")


 CCN Number CCN-21766343 & 66345.")


11 Max Depth.4 Modelled Breach Locations (Flood Risk to People : FD232) Less than.75 (Low Hazard) Max Depth (m) Between.75 and 1.25 (Danger for Some) Between 1.25 and 2. (Danger for Most) Greater than 2. (Danger for All) Date Printed November Scenario year see also the accompanying plan "Location of Modelled Breaches" 2115 Max Velocity (m/s) Scenario Annual Chance.5% (1 in 2) CCN Number CCN & Max Velocity.4 This map shows the level of flood hazard to people (called a hazard rating) if our flood defences are breached at certain locations, for a range of scenarios. The hazard rating depends on the depth and velocity of floodwater, and maximum values of these are also mapped. The map is based on computer modelling of simulated breaches at specific locations. Each breach has been modelled individually and the results combined to create this map. Multiple breaches, other combinations of breaches, different sized tidal surges or flood flows may all give different results. The map only considers the consequences of a breach, it does not make any assumption about the likelihood of a breach occurring. The likelihood of a breach occurring will depend on a number of different factors, including the construction and condition of the defences in the area. A breach is less likely where defences are of a good standard, but a risk of breaching remains. General Enquiries No: providers charges may vary Weekday Daytime calls cost 5p plus up to 6p per minute from BT Weekend Unlimited. Mobile and other Lincolnshire and Northamptonshire Breach Hazard mapping Map Centred on TA This map is reproduced by permission of Ordnance Survey on behalf of The Controller of Her Majesty's Stationary Office. Crown copyright. All rights reserved. Environment Agency 12638, 217. Unauthorised reproduction infringes Crown copyright and may lead to prosecution or civil proceedings.

 Max Depth (m) Between.75 and 1.")
 Greater than 2.")


 Chance CCN Number CCN-21766343 &")


12 Max Depth.4 Modelled Breach Locations (Flood Risk to People : FD232) Less than.75 (Low Hazard) Max Depth (m) Between.75 and 1.25 (Danger for Some) Between 1.25 and 2. (Danger for Most) Greater than 2. (Danger for All) Date Printed November Scenario year see also the accompanying plan "Location of Modelled Breaches" 2115 Max Velocity (m/s) Scenario.1% Annual (1 in 1) Chance CCN Number CCN & Max Velocity.4 This map shows the level of flood hazard to people (called a hazard rating) if our flood defences are breached at certain locations, for a range of scenarios. The hazard rating depends on the depth and velocity of floodwater, and maximum values of these are also mapped. The map is based on computer modelling of simulated breaches at specific locations. Each breach has been modelled individually and the results combined to create this map. Multiple breaches, other combinations of breaches, different sized tidal surges or flood flows may all give different results. The map only considers the consequences of a breach, it does not make any assumption about the likelihood of a breach occurring. The likelihood of a breach occurring will depend on a number of different factors, including the construction and condition of the defences in the area. A breach is less likely where defences are of a good standard, but a risk of breaching remains. General Enquiries No: providers charges may vary Weekday Daytime calls cost 5p plus up to 6p per minute from BT Weekend Unlimited. Mobile and other Lincolnshire and Northamptonshire Breach Hazard mapping Map Centred on TA This map is reproduced by permission of Ordnance Survey on behalf of The Controller of Her Majesty's Stationary Office. Crown copyright. All rights reserved. Environment Agency 12638, 217. Unauthorised reproduction infringes Crown copyright and may lead to prosecution or civil proceedings.
 Max Depth (m)")
 Between 1.25 and 2.")
 Date Printed November")

 CCN Number CCN-21766343 & 66345.")


, and Welland (upstream of Fosdyke")


13 Max Depth.4 (Flood Risk to People : FD232) Max Depth (m) Less than.75 (Low Hazard) Between.75 and 1.25 (Danger for Some) Between 1.25 and 2. (Danger for Most) Greater than 2. (Danger for All) Date Printed November Scenario 217 year 2115 Max Velocity (m/s) Scenario Annual Chance.5% (1 in 2) CCN Number CCN & Max Velocity.4 The map is based on computer modelling of simulated overtopping of the main coastal defences for specific tidal scenarios. It does not include overtopping along the following tidal rivers which are currently being investigated: Witham Haven (upstream of Hobhole), and Welland (upstream of Fosdyke Bridge) The map only considers the consequences of overtopping of the defences, and does not show the possible consequences of breaches of the tidal defences. Separate maps of the flood extent from just breaching of the defences are available. For future climate change scenarios it is assumed that defences remain at 26 heights. These maps do not replace the flood zone maps used in the National Planning Policy Framework (NPPF) General Enquiries No: Weekday Daytime calls cost 5p plus up to 6p per minute from BT Weekend Unlimited. Mobile and other providers charges may vary Lincolnshire and Northamptonshire Overtopping Hazard Mapping Map Centred on TA This map is reproduced by permission of Ordnance Survey on behalf of The Controller of Her Majesty's Stationary Office. Crown copyright. All rights reserved. Environment Agency 12638, 217. Unauthorised reproduction infringes Crown copyright and may lead to prosecution or civil proceedings.
 Max")
 Between.75 and 1.")
 Greater than 2.")


, and")


 General")


14 Max Depth.4 (Flood Risk to People : FD232) Max Depth (m) Less than.75 (Low Hazard) Between.75 and 1.25 (Danger for Some) Between 1.25 and 2. (Danger for Most) Greater than 2. (Danger for All) Date Printed November Scenario 217 year 2115 Max Velocity (m/s) Scenario.1% Annual (1 in 1) Chance CCN Number CCN & Max Velocity.4 The map is based on computer modelling of simulated overtopping of the main coastal defences for specific tidal scenarios. It does not include overtopping along the following tidal rivers which are currently being investigated: Witham Haven (upstream of Hobhole), and Welland (upstream of Fosdyke Bridge) The map only considers the consequences of overtopping of the defences, and does not show the possible consequences of breaches of the tidal defences. Separate maps of the flood extent from just breaching of the defences are available. For future climate change scenarios it is assumed that defences remain at 26 heights. These maps do not replace the flood zone maps used in the National Planning Policy Framework (NPPF) General Enquiries No: Weekday Daytime calls cost 5p plus up to 6p per minute from BT Weekend Unlimited. Mobile and other providers charges may vary Lincolnshire and Northamptonshire Overtopping Hazard Mapping Map Centred on TA This map is reproduced by permission of Ordnance Survey on behalf of The Controller of Her Majesty's Stationary Office. Crown copyright. All rights reserved. Environment Agency 12638, 217. Unauthorised reproduction infringes Crown copyright and may lead to prosecution or civil proceedings.
Product 4 (Detailed Flood Risk) for Our Ref: OX_0748_01. Mill Lane, Somerford Keynes
 for Our Ref: OX_0748_01. Mill Lane, Somerford Keynes") Product 4 (Detailed Flood Risk) for Our Ref: OX_0748_01 Mill Lane, Somerford Keynes Product 4 is designed for developers where Flood Risk Standing Advice FRA (Flood Risk Assessment) Guidance Note 3 Applies.
Product 4 (Detailed Flood Risk) for Our Ref: OX_0748_01 Mill Lane, Somerford Keynes Product 4 is designed for developers where Flood Risk Standing Advice FRA (Flood Risk Assessment) Guidance Note 3 Applies.
FLOODING INFORMATION SHEET YOUR QUESTIONS ANSWERED
 The information in this document has been written in partnership by the Association of British Insurers and the Environment Agency 1. Flood risk and insurance Q1. How can I find out the flood risk affecting
Environment Agency pre-application advice incorporating Local Flood Risk Standing Advice from East Lindsey District Council
 Environment Agency pre-application advice incorporating Local Flood Risk Standing Advice from East Lindsey District Council Version 1 UNCLASSIFIED We are the Environment Agency. We protect and improve
Flood Risk Management: Modelling blockage and breach scenarios February 2015
 Flood Risk Management: Modelling blockage and breach scenarios February 2015 OGN100 Document Owner: Mark Pugh Page 1 of 6 Version History: Document Date Summary of Changes Version Published 1.0 DEC-2014
National Flood Risk Assessment Key facts. Environment Agency 1 NaFRA 2005 Key Facts
 National Flood Risk Assessment 2005 Key facts 1 NaFRA 2005 Key Facts We are The. It's our job to look after your environment and make it a better place - for you, and for future generations. Your environment
Kirkwall (Potentially Vulnerable Area 03/05) Local Plan District Local authority Main catchment Orkney Orkney Islands Council Orkney coastal Backgroun
 Local Plan District Local authority Main catchment Orkney Orkney Islands Council Orkney coastal Backgroun") Kirkwall (Potentially Vulnerable Area 03/05) Local Plan District Orkney Local authority Orkney Islands Council Main catchment Orkney coastal Summary of flooding impacts 490 residential properties 460 non-residential
Kirkwall (Potentially Vulnerable Area 03/05) Local Plan District Orkney Local authority Orkney Islands Council Main catchment Orkney coastal Summary of flooding impacts 490 residential properties 460 non-residential
LOW. Overall Flood risk. Flood considerations. Specimen Address, Specimen Town. Rivers and the Sea Low page 4. Historic Flood.
 Specimen Address, Specimen Town Overall Flood risk LOW Crown copyright and database rights 2018. Ordnance Survey licence 100035207 Groundsure Floodview complies with relevant Law Society practice notes
Glasgow City centre (Potentially Vulnerable Area 11/16) Local Plan District Local authority Main catchment Clyde and Loch Lomond Glasgow City Council
 Local Plan District Local authority Main catchment Clyde and Loch Lomond Glasgow City Council") Glasgow City centre (Potentially Vulnerable Area 11/16) Local Plan District Clyde and Loch Lomond Local authority Glasgow City Council Main catchment River Clyde Summary of flooding impacts At risk of
Glasgow City centre (Potentially Vulnerable Area 11/16) Local Plan District Clyde and Loch Lomond Local authority Glasgow City Council Main catchment River Clyde Summary of flooding impacts At risk of
Clyde south - Port Glasgow to Inchinnan (Potentially Vulnerable Area 11/09) Local Plan District Clyde and Loch Lomond Local authority Inverclyde Counc
 Local Plan District Clyde and Loch Lomond Local authority Inverclyde Counc") Clyde south - Port Glasgow to Inchinnan (Potentially Vulnerable Area 11/09) Local Plan District Clyde and Loch Lomond Local authority Inverclyde Council, Renfrewshire Council Main catchment Firth of Clyde
Clyde south - Port Glasgow to Inchinnan (Potentially Vulnerable Area 11/09) Local Plan District Clyde and Loch Lomond Local authority Inverclyde Council, Renfrewshire Council Main catchment Firth of Clyde
Risk of Flooding from Rivers and Sea
 Risk of Flooding from Rivers and Sea Product Description April 2015 RISK OF FLOODING FROM RIVERS AND SEA PRODUCT DESCRIPTION An assessment of flood risk for England produced using local data and expertise.
Frequently Asked Questions
 Frequently Asked Questions The West of Wales Shoreline Management Plan (SMP) provides a high level strategy for managing flood and erosion risk for the coastline and is a non statutory policy document
Flood Risk Assessment for Planning
 Flood Risk Assessment for Planning Report on: Sample Property, Sample Town, Sample Postcode Report prepared for: Report Reference: Report Date: Sample AEL-XXXX-FRA-XXXX 28 th October 2016 Client Reference:
Consider the risks to your own business as well as to your operations
 Hayley Bowman Flood and Coastal Risk Management Mapping, Modelling and Data 07919 544 551 Hayley.bowman@environment-agency.gov.uk DataInfo@environment-agency.gov.uk EA covers England only. Wales covered
Good Practice Guide. GPG 101 Document Owner: Steve Cook. Page 1 of 7.
 Good Practice Guide Producing flood risk hydraulic models and flood consequence assessments for development planning purposes Date Published: September 2015 GPG 101 Document Owner: Steve Cook Page 1 of
Creetown (Potentially Vulnerable Area 14/17) Local Plan District Local authority Main catchment Dumfries and Galloway Solway Moneypool Burn Council Ba
 Local Plan District Local authority Main catchment Dumfries and Galloway Solway Moneypool Burn Council Ba") Creetown (Potentially Vulnerable Area 14/17) Local Plan District Solway Local authority Dumfries and Galloway Council Main catchment Moneypool Burn Summary of flooding impacts 90 residential properties
Creetown (Potentially Vulnerable Area 14/17) Local Plan District Solway Local authority Dumfries and Galloway Council Main catchment Moneypool Burn Summary of flooding impacts 90 residential properties
Sample Site, Sample Street, Sample Town
 Telephone: 2 7261 191 Email: SitecheckFlood@rpsgroup.com Sample Site, Sample Street, Sample Town Prepared for: L And1 Landmark1 Account Landmark(Test Account) 6-7 Abbey Court, Sowton Ind Estate Exeter
Saturday, 14 April 2012
 Residential Property at Site Located at Grid Reference: 371914E 293168N Order Reference: 24011234_1 Your Reference: REDALLRISKSTEST_HCF Saturday, 14 April 2012 Requested by Landmark(Test Account) 6-7 Abbey
The AIR Coastal Flood Model for Great Britain
 The AIR Coastal Flood Model for Great Britain The North Sea Flood of 1953 inundated more than 100,000 hectares in eastern England. More than 24,000 properties were damaged, and 307 people lost their lives.
Development and Flood Risk - the Environment Agency s approach to PPS25. scrutinised before planning decisions are made
 Development and Flood Risk - the Environment Agency s approach to PPS25 Steve Cook Flood Risk Policy Advisor Stephen.cook@environment-agency.gov.uk Our role in PPS25 h Providing advice and information
Oban (Potentially Vulnerable Area 01/31) Local authority Main catchment Argyll and Bute Council Knapdale coastal Background This Potentially Vulnerabl
 Local authority Main catchment Argyll and Bute Council Knapdale coastal Background This Potentially Vulnerabl") Oban (Potentially Vulnerable Area 01/31) Local authority Argyll and Bute Council Main catchment Knapdale coastal Summary of flooding impacts 320 residential properties 310 non-residential properties 1.8
Oban (Potentially Vulnerable Area 01/31) Local authority Argyll and Bute Council Main catchment Knapdale coastal Summary of flooding impacts 320 residential properties 310 non-residential properties 1.8
Homecheck Flood. Click here. Overall Flood Risk. Insurability. Flood Defences. Individual Flood Risks.
 Homecheck Flood Overall Flood Risk PASSED The property is considered to be at minimal or no risk of flooding. However, you should ask the seller if the property has flooded in the past. The home buyer
Caol and Inverlochy (Potentially Vulnerable Area 01/24) Local Plan District Highland and Argyll Local authority The Highland Council Main catchment Fo
 Local Plan District Highland and Argyll Local authority The Highland Council Main catchment Fo") Caol and Inverlochy (Potentially Vulnerable Area 01/24) Local authority The Highland Council Main catchment Fort William coastal Summary of flooding impacts 170 residential properties 40 non-residential
Caol and Inverlochy (Potentially Vulnerable Area 01/24) Local authority The Highland Council Main catchment Fort William coastal Summary of flooding impacts 170 residential properties 40 non-residential
Nairn Central (Potentially Vulnerable Area 01/18) Local authority Main catchment The Highland Council Moray coastal Background This Potentially Vulner
 Local authority Main catchment The Highland Council Moray coastal Background This Potentially Vulner") Nairn Central (Potentially Vulnerable Area 01/18) Local authority The Highland Council Main catchment Moray coastal Summary of flooding impacts At risk of flooding 350 residential 30 non-residential 340,000
Nairn Central (Potentially Vulnerable Area 01/18) Local authority The Highland Council Main catchment Moray coastal Summary of flooding impacts At risk of flooding 350 residential 30 non-residential 340,000
Newton Stewart (Potentially Vulnerable Area 14/12) Local Plan District Local authority Main catchment Dumfries and Galloway Solway River Cree Council
 Local Plan District Local authority Main catchment Dumfries and Galloway Solway River Cree Council") Newton Stewart (Potentially Vulnerable Area 14/12) Local Plan District Solway Local authority Dumfries and Galloway Council Main catchment River Cree Summary of flooding impacts 210 residential properties
Newton Stewart (Potentially Vulnerable Area 14/12) Local Plan District Solway Local authority Dumfries and Galloway Council Main catchment River Cree Summary of flooding impacts 210 residential properties
Lowestoft Flood Risk Management Project
 Volume 1, Issue 1 Winter 2017 Lowestoft Flood Risk Management Project I N S I D E T H I S I S S U E : Welcome 1 Background to the project 2 What are we considering 2 and how has the project progressed?
STRATEGIC FLOOD RISK ASSESSMENT
 STRATEGIC FLOOD RISK ASSESSMENT FOR PROPOSED VARIATION NO. 1 (CORE STRATEGY) TO THE LONGFORD TOWN DEVELOPMENT PLAN 2009-2015 for: Longford Local Authorities Great Water Street, Longford, Co. Longford by:
Isle of Arran (Potentially Vulnerable Area 12/08) Local Plan District Local authority Main catchment Brodick to Kilmory Ayrshire North Ayrshire Counci
 Local Plan District Local authority Main catchment Brodick to Kilmory Ayrshire North Ayrshire Counci") Isle of Arran (Potentially Vulnerable Area 12/08) Local Plan District Ayrshire Local authority North Ayrshire Council Main catchment Brodick to Kilmory Arran coastal Summary of flooding impacts At risk
Isle of Arran (Potentially Vulnerable Area 12/08) Local Plan District Ayrshire Local authority North Ayrshire Council Main catchment Brodick to Kilmory Arran coastal Summary of flooding impacts At risk
Overall Opinion Passed. Flood Risks. Undefended Flood Risk. Low. Flood Defences. Yes. Effect. Low. Insurance Availability. Yes.
 Overall Opinion Passed This report is issued for the site Flood Risks The site is not considered to be at significant risk of flooding. No further action is considered necessary. It would be prudent to
Low. Yes. Low. Surface water. Other*
 Overall Opinion Passed The site is not considered to be at significant risk of flooding. No further action is considered necessary. However, it would be prudent to consider the measures outlined in the
Arbroath (Potentially Vulnerable Area 07/07) Local Plan District Local authority Main catchment Tay Estuary and Montrose Basin Angus Council Brothock
 Local Plan District Local authority Main catchment Tay Estuary and Montrose Basin Angus Council Brothock") Arbroath (Potentially Vulnerable Area 07/07) Local Plan District Tay Estuary and Montrose Basin Local authority Angus Council Main catchment Brothock Water Summary of flooding impacts 250 residential properties
Arbroath (Potentially Vulnerable Area 07/07) Local Plan District Tay Estuary and Montrose Basin Local authority Angus Council Main catchment Brothock Water Summary of flooding impacts 250 residential properties
Good Practice Guide. Technical guidance: Flood risk activity definitions October GPG 220 Document Owner: Flood Risk Strategy.
 Good Practice Guide Technical guidance: Flood risk activity definitions October 2016 GPG 220 Document Owner: Flood Risk Strategy Page 1 of 9 Version History: Document Date Summary of Changes Version Published
Overall Opinion. Flood Risks. Low. Flood Defences. Yes. Effect. Low. Insurance Availability. Yes. Development Risk.
 Overall Opinion Passed The site is not considered to be at a significant risk of flooding. No further action is considered necessary. It would be prudent to consider the measures outlined in the Recommendations
Kelso (Potentially Vulnerable Area 13/09) Local Plan District Local authority Main catchment Tweed Scottish Borders Council River Tweed Background Thi
 Local Plan District Local authority Main catchment Tweed Scottish Borders Council River Tweed Background Thi") Kelso (Potentially Vulnerable Area 13/09) Local Plan District Tweed Local authority Scottish Borders Council Main catchment River Tweed Summary of flooding impacts At risk of flooding 90 residential properties
Kelso (Potentially Vulnerable Area 13/09) Local Plan District Tweed Local authority Scottish Borders Council Main catchment River Tweed Summary of flooding impacts At risk of flooding 90 residential properties
HRPP 313. Developing a performance - based management system for flood and coastal defence assets
 HRPP 313 Developing a performance - based management system for flood and coastal defence assets Paul Sayers, Jonathan Simm, Michael Wallis, Foekje Buijs, Jaap Flikweert & Ben Hamer Reproduced from a paper
Joint Lincolnshire Flood Risk and Drainage Management Strategy: Draft v.6.0:consultation Draft, : Annexes A-F
 Lincolnshire Flood Risk and Drainage Management Partnership Framework Lincolnshire Joint Flood Risk and Drainage Management Strategy Draft v.6.0 Consultation Draft 23 rd May 2012 Annexes A-F Joint Lincolnshire
Moderate-High. Information panel: Search ID:SOL Date:Jan 28, Address: 7, Bryniau Road, LLandudno, LL30 2BL
 Moderate-High For further details please see Certificate page of this report. Information panel: Search ID:SOL-173599-262841 Date:Jan 28, 2015 Address: 7, Bryniau Road, LLandudno, LL30 2BL Your Reference:SOL-173599-262841
PROPERTY CODES COMPLIANCE BOARD COMPLIANCE NOTES CN02I: REGULATED FLOOD SEARCHES
 PROPERTY CODES COMPLIANCE BOARD COMPLIANCE NOTES CN02I: REGULATED FLOOD SEARCHES The Code s requirements 1. The 7 principles of the Search Code apply to regulated flood searches just as they apply to regulated
FLOOD SOLUTIONS Commercial
 FLOOD SOLUTIONS Commercial Overall Opinion PASSED Argyll's Overview The Site is not considered to be at a significant risk of flooding. This is as a result of flood defences in proximity to the Site which
Strategic Flood Risk Assessment. SFRA Report
 Strategic Flood Risk Assessment SFRA Report on Strandhill Mini-Plan Variation No.1 of the Sligo County Development Plan 2011-2017 Prepared by Contents 1. The context for the Flood Risk Assessment 1 2.
FLOOD SOLUTIONS Residence
 FLOOD SOLUTIONS Residence Report prepared on 22 Knighton Road, Liverpool, L4 9RD Report reference AEL028FLR022381 National grid reference 337815, 394462 Report prepared for Specimen Client Client reference
Fort William (Potentially Vulnerable Area 01/25) Local authority Main catchment The Highland Council Appin coastal Background This Potentially Vulnera
 Local authority Main catchment The Highland Council Appin coastal Background This Potentially Vulnera") Fort William (Potentially Vulnerable Area 01/25) Local authority The Highland Council Main catchment Appin coastal Summary of flooding impacts 100 residential properties 80 non-residential properties 520,000
Fort William (Potentially Vulnerable Area 01/25) Local authority The Highland Council Main catchment Appin coastal Summary of flooding impacts 100 residential properties 80 non-residential properties 520,000
Unique ID: (from PFRA database) Location: Bridgetown, Co. Clare. Stage 1: Desktop Review
 Location: Bridgetown, Co. Clare. Stage 1: Desktop Review") Location:, Co. Clare Unique ID: 250412 (from PFRA database) Initial OPW Designation APSR AFRR IRR Co-ordinates Easting: 164500 Northing: 168500 River / Catchment / Sub-catchment Black River / Shannon Type
Location:, Co. Clare Unique ID: 250412 (from PFRA database) Initial OPW Designation APSR AFRR IRR Co-ordinates Easting: 164500 Northing: 168500 River / Catchment / Sub-catchment Black River / Shannon Type
Unique ID: (from PFRA database) Location: Nenagh, Co. Tipperary. Stage 1: Desktop Review
 Location: Nenagh, Co. Tipperary. Stage 1: Desktop Review") Location: Nenagh, Co. Tipperary Unique ID: 250432 (from PFRA database) Initial OPW Designation APSR AFRR IRR Co-ordinates Easting: 186604 Northing: 178781 River / Catchment / Sub-catchment Nenagh River
Location: Nenagh, Co. Tipperary Unique ID: 250432 (from PFRA database) Initial OPW Designation APSR AFRR IRR Co-ordinates Easting: 186604 Northing: 178781 River / Catchment / Sub-catchment Nenagh River
FURTHER ACTION CLICK TO VIEW ONLINE VIEWER. Individual Flood Risks
 Homecheck Flood FURTHER ACTION Overall Flood Risk CLICK TO VIEW ONLINE VIEWER The property is at a significant risk of River, Surface Water and Other flooding. Further assessment is recommended to understand
Alyth (Potentially Vulnerable Area 08/04) Local Plan District Local authority Main catchment Tay Perth and Kinross Council Alyth Burn (River Tay) Back
 Local Plan District Local authority Main catchment Tay Perth and Kinross Council Alyth Burn (River Tay) Back") Alyth (Potentially Vulnerable Area 08/04) Local Plan District Tay Local authority Perth and Kinross Council Main catchment Alyth Burn (River Tay) Summary of flooding impacts 50 residential properties 20
Alyth (Potentially Vulnerable Area 08/04) Local Plan District Tay Local authority Perth and Kinross Council Main catchment Alyth Burn (River Tay) Summary of flooding impacts 50 residential properties 20
Climate Change and Flood Risk. Tim Reeder Regional Climate Change Programme Manager
 Climate Cange and Flood Risk Tim Reeder Regional Climate Cange Programme Manager Structure of talk Callenges of flood risk management in London & climate cange issues Te TE 2100 Project - Climate Cange
Ness, Isle of Lewis (Potentially Vulnerable Area 02/01) Local Plan District Outer Hebrides Local authority Comhairle nan Eilean Siar Main catchment Le
 Local Plan District Outer Hebrides Local authority Comhairle nan Eilean Siar Main catchment Le") Ness, Isle of Lewis (Potentially Vulnerable Area 02/01) Local Plan District Local authority Comhairle nan Eilean Siar Main catchment Lewis and Harris coastal Summary of flooding impacts At risk of flooding
Ness, Isle of Lewis (Potentially Vulnerable Area 02/01) Local Plan District Local authority Comhairle nan Eilean Siar Main catchment Lewis and Harris coastal Summary of flooding impacts At risk of flooding
Flood Risk Management Strategy. Shetland
 Flood Risk Management Strategy Shetland Publication date: 14 December 2015 Terms and conditions Ownership: All intellectual property rights for Flood Risk Management Strategies are owned by SEPA or its
Appendix C Additional Information to support the Flood Risk Assessment
 Appendix C Additional Information to support the Flood Risk Assessment Appendix C Part A Agreement to scope of sequential and exception tests C-1 From: David Tate [mailto:david.tate@n-somerset.gov.uk]
Ellon (Potentially Vulnerable Area 06/12) Local Plan District North East Local authority Aberdeenshire Council Main catchment River Ythan, Buchan coas
 Local Plan District North East Local authority Aberdeenshire Council Main catchment River Ythan, Buchan coas") Ellon (Potentially Vulnerable Area 06/12) Local Plan District North East Local authority Aberdeenshire Council Main catchment River Ythan, Buchan coastal Summary of flooding impacts 110 residential 40
Ellon (Potentially Vulnerable Area 06/12) Local Plan District North East Local authority Aberdeenshire Council Main catchment River Ythan, Buchan coastal Summary of flooding impacts 110 residential 40
Stirling (Raploch and Riverside) (Potentially Vulnerable Area 09/07) Local Plan District Local authority Main catchment Forth Stirling Council Stirlin
 (Potentially Vulnerable Area 09/07) Local Plan District Local authority Main catchment Forth Stirling Council Stirlin") Stirling (Raploch and Riverside) (Potentially Vulnerable Area 09/07) Local Plan District Forth Local authority Stirling Council Main catchment Stirling coastal Summary of flooding impacts At risk of flooding
Stirling (Raploch and Riverside) (Potentially Vulnerable Area 09/07) Local Plan District Forth Local authority Stirling Council Main catchment Stirling coastal Summary of flooding impacts At risk of flooding
Solway Local Plan District 1 Flood risk management in Scotland 1.1 What is a Flood Risk Management Strategy? Flood Risk Management Strategies have bee
 Flood Risk Management Strategy Solway Local Plan District Section 1: Flood Risk Management in Scotland 1.1 What is a Flood Risk Management Strategy?... 1 1.2 How to read this Strategy... 1 1.3 Managing
Managing flood risk on the Severn Estuary South Gloucestershire to Hinkley Point, Somerset. January 2011
 Managing flood risk on the Severn Estuary South Gloucestershire to Hinkley Point, Somerset January 2011 We are the Environment Agency. It s our job to look after your environment and make it a better place
Resilience to Flooding of Grid and Primary Substations
 PRODUCED BY THE OPERATIONS DIRECTORATE OF ENERGY NETWORKS ASSOCIATION Engineering Technical Report 138 Resilience to Flooding of Grid and Primary Substations www.energynetworks.org PUBLISHING AND COPYRIGHT
Inverurie and Kintore (Potentially Vulnerable Area 06/13) Local Plan District Local authority Main catchment North East Aberdeenshire Council River Do
 Local Plan District Local authority Main catchment North East Aberdeenshire Council River Do") Inverurie and Kintore (Potentially Vulnerable Area 06/13) Local Plan District North East Local authority Aberdeenshire Council Main catchment River Don Summary of flooding impacts 230 residential properties
Inverurie and Kintore (Potentially Vulnerable Area 06/13) Local Plan District North East Local authority Aberdeenshire Council Main catchment River Don Summary of flooding impacts 230 residential properties
Flood risk. Flood Risks. Undefended flood risk. Low. Insurability. Yes. Development. Flood Defences. Yes. Low. Effect.
 Overall Risk Passed Flood risk The site is not considered to be at a significant risk of flooding. No further action is considered necessary. It would be prudent to consider the measures outlined on page
Volume. 10c. Clare County Development Plan Strategic Flood Risk Assessment
 Volume 10c Clare County Development Plan 2017 2023 Strategic Flood Risk Assessment Elizabeth Russell 24 Grove Island Corbally Limerick Ireland This report describes work commissioned by Brian McCarthy,
Requirements for Mapping Levees Complying with Section of the NFIP Regulations
 FACT SHEET Requirements for Mapping Levees Complying with Section 65.10 of the NFIP Regulations As part of a mapping project, it is the levee owner s or community s responsibility to provide data and documentation
Derry City & Strabane District Council 17th July 2015, 3pm.
 Derry City & Strabane District Council 17th July 2015, 3pm Malcolm Calvert, (Principal Engineer, Mapping & Modelling Unit) Sean O Neill, (Regional Engineer - Western) Flood Hazard & Risk Mapping www.riversagencyni.gov.uk
Evidence for Environmental Audit Committee Enquiry on Sustainable Housing Submission by Association of British Insurers, May 2004
 Evidence for Environmental Audit Committee Enquiry on Sustainable Housing Submission by Association of British Insurers, May 2004 The Government s plans to tackle the country s profound housing shortage
Turriff (Potentially Vulnerable Area 06/07) Local Plan District Local authority Main catchment North East Aberdeenshire Council River Deveron Backgrou
 Local Plan District Local authority Main catchment North East Aberdeenshire Council River Deveron Backgrou") Turriff (Potentially Vulnerable Area 06/07) Local Plan District North East Local authority Aberdeenshire Council Main catchment River Deveron Summary of flooding impacts At risk of flooding
Turriff (Potentially Vulnerable Area 06/07) Local Plan District North East Local authority Aberdeenshire Council Main catchment River Deveron Summary of flooding impacts At risk of flooding
Elgin (Potentially Vulnerable Area 05/05) Local Planning District Local authority Main catchment Findhorn, Nairn and Speyside The Moray Council River
 Local Planning District Local authority Main catchment Findhorn, Nairn and Speyside The Moray Council River") Elgin (Potentially Vulnerable Area 05/05) Findhorn, Nairn and Speyside Local authority The Moray Council Main catchment River Lossie Summary of flooding impacts Summary of flooding impacts At risk of flooding
Elgin (Potentially Vulnerable Area 05/05) Findhorn, Nairn and Speyside Local authority The Moray Council Main catchment River Lossie Summary of flooding impacts Summary of flooding impacts At risk of flooding
The AIR Inland Flood Model for Great Britian
 The AIR Inland Flood Model for Great Britian The year 212 was the UK s second wettest since recordkeeping began only 6.6 mm shy of the record set in 2. In 27, the UK experienced its wettest summer, which
Guildford Borough Level 1 Strategic Flood Risk Assessment Summary Report. January 2016
 Guildford Borough Level 1 Strategic Flood Risk Assessment Summary Report January 2016 What is this document? This document provides a summary of Guildford Borough Strategic Flood Risk Assessment (SFRA,
Broad-Scale Assessment of Urban Flood Risk Mark G. E. Adamson 1
 Broad-Scale Assessment of Urban Flood Risk Mark G. E. Adamson 1 1 Office of Public Works, Trim, Co. Meath, Ireland Abstract The Directive on the assessment and management of flood risks (2007/60/EC The
Canada s exposure to flood risk. Who is affected, where are they located, and what is at stake
 Canada s exposure to flood risk Who is affected, where are they located, and what is at stake Why a flood model for Canada? Catastrophic losses Insurance industry Federal government Average industry CAT
Volusia County Floodplain Management Plan 2012
 Volusia County Floodplain Management Plan 2012 Introduction The National Flood Insurance Program (NFIP) provides federally supported flood insurance in communities that regulate development in floodplains.
Aberfeldy and Pitlochry (Potentially Vulnerable Area 08/03) Local Plan District Local authority Main catchment Tay Perth and Kinross Council River Tay
 Local Plan District Local authority Main catchment Tay Perth and Kinross Council River Tay") Aberfeldy and Pitlochry (Potentially Vulnerable Area 08/03) Local Plan District Tay Local authority Perth and Kinross Council Main catchment River Tay Summary of flooding impacts 240 residential properties
Aberfeldy and Pitlochry (Potentially Vulnerable Area 08/03) Local Plan District Tay Local authority Perth and Kinross Council Main catchment River Tay Summary of flooding impacts 240 residential properties
Forres (Potentially Vulnerable Area 05/06) Local Planning District Local authority Main catchment Findhorn, Nairn and Speyside The Moray Council Moray
 Local Planning District Local authority Main catchment Findhorn, Nairn and Speyside The Moray Council Moray") Forres (Potentially Vulnerable Area 05/06) Findhorn, Nairn and Speyside Local authority The Moray Council Main catchment Moray coastal Summary of flooding impacts Summary of flooding impacts At risk of
Forres (Potentially Vulnerable Area 05/06) Findhorn, Nairn and Speyside Local authority The Moray Council Main catchment Moray coastal Summary of flooding impacts Summary of flooding impacts At risk of
Flood Risk Assessment. Approved by RECOMMENDATIONS. Professional Opinion
 Flood Report Flood Risk Assessment Professional Opinion RECOMMENDATIONS 1. A prudent purchaser may wish to consider further assessment of the property to identify appropriate flood protection measures.
Combined Sources Product
 Combined Sources Product EA Data Advisory Group Selena Peters: FCRM Mapping, Modelling and Data 18 June 2015 selena.peters@environment-agency.gov.uk Assessing flood risk New Product What? Combined Sources
Derwent Catchment Flood Management Plan. Summary Report December managing flood risk
 Derwent Catchment Flood Management Plan Summary Report December 2010 managing flood risk We are the Environment Agency. It s our job to look after your environment and make it a better place for you, and
Planning and Flood Risk
 Planning and Flood Risk Patricia Calleary BE MEngSc MSc CEng MIEI After the Beast from the East Patricia Calleary Flood Risk and Planning Flooding in Ireland» Floods are a natural and inevitable part of
15. Natural Hazards. Submission No. and Point / Submitter Name. Plan Provision Summary of Submission Decision Requested. General
 15. Submission No. 2.4 Bluff Community Board 56.14 Jenny Campbell 64.33 Department of Conservation 116.3 Kylie Fowler 117.10 Southern District Health Board - tsunami There is a lack of information for
Contents Amendment Record
 Contents Amendment Record This report has been issued and amended as follows: Issue Revision Description Date Approved by 1 1 0 1 Draft for CSG review Consultation Draft 30 April 2010 30 July 2010 M Phillips
Dunblane and Bridge of Allan (Potentially Vulnerable Area 09/03) Local Plan District Local authority Main catchment Forth Stirling Council Allan Water
 Local Plan District Local authority Main catchment Forth Stirling Council Allan Water") Dunblane and Bridge of Allan (Potentially Vulnerable Area 09/03) Local Plan District Forth Local authority Stirling Council Main catchment Allan Water Summary of flooding impacts At risk of flooding 370
Dunblane and Bridge of Allan (Potentially Vulnerable Area 09/03) Local Plan District Forth Local authority Stirling Council Main catchment Allan Water Summary of flooding impacts At risk of flooding 370
National and regional levee systems analysis in the UK and relevance to USA
 National and regional levee systems analysis in the UK and relevance to USA Jonathan Simm Presentation for ASFPM Conference, Grand Rapids MI Overview UK background Overview of method and description of
Flood Risk Management in Ireland. The National CFRAM Programme & overview of the Capital Works Programme. Click to add text
 Flood Risk Management in Ireland The National CFRAM Programme & overview of the Capital Works Programme Click to add text Dr. John Martin Office of Public Works Engineers Ireland's Local Government Seminar
Managing flood risk on the Severn Estuary Gloucestershire. January 2011
 Managing flood risk on the Severn Estuary Gloucestershire January 2011 We are the Environment Agency. It s our job to look after your environment and make it a better place _ for you, and for future generations.
Queensborough Flood Construction Level (FCL) Review PHASE 1 REPORT. Submitted By:
 Review PHASE 1 REPORT. Submitted By:") Queensborough Flood Construction Level (FCL) Review PHASE 1 REPORT Submitted By: EB3774 - January 2013 1. SUMMARY... 1 2. INTRODUCTION... 2 3. STUDY AREA... 3 4. FLOOD PROBABILITY... 8 5. FLOOD CONSEQUENCE...
Queensborough Flood Construction Level (FCL) Review PHASE 1 REPORT Submitted By: EB3774 - January 2013 1. SUMMARY... 1 2. INTRODUCTION... 2 3. STUDY AREA... 3 4. FLOOD PROBABILITY... 8 5. FLOOD CONSEQUENCE...
Homecheck Professional. Flood Risk Assessment PASSED. Overall Flood Risk: LOW RISK IDENTIFIED. Insurability: YES. Flood Report. Professional Opinion
 Homecheck Professional Flood Report Flood Risk Assessment PASSED Professional Opinion The overall flood risk rating for the property is assessed to be 'Low'. No further action is considered necessary however
Flood Report Flood Risk Assessment
 Flood Report Flood Risk Assessment This report is issued for the property described as: PASSED Professional Opinion The Strand, Saundersfoot The overall flood risk rating for the property has been assessed
SAMPLE. Flood Residential <0.25Ha. Report Details. Subject Site. Professional Opinion. Flood. Requested by: Address: Grid Reference: E: N: 12345
 Report Details Subject Site Address: Sample, Sample Requested by: Test Grid Reference: E: 12345 N: 12345 Date: 13/04/2018 Report Reference: Report ID: SampleResi 1000072147 Professional Opinion 1.FLOOD
Assessing future flood risk across the UK
 Climate Change Risk Assessment: 2017 Assessing future flood risk across the UK (England, Wales, Scotland and Northern Ireland) Presentation to the FoRUM Workshop Paul Sayers and Matt Horritt 17 March 2015
Stirling (Cornton and Causewayhead) (Potentially Vulnerable Area 09/05) Local Plan District Forth Local authority Clackmannanshire Council, Stirling C
 (Potentially Vulnerable Area 09/05) Local Plan District Forth Local authority Clackmannanshire Council, Stirling C") Stirling (Cornton and Causewayhead) (Potentially Vulnerable Area 09/05) Local Plan District Forth Local authority Clackmannanshire Council, Stirling Council Main catchment River Forth Summary of flooding
Stirling (Cornton and Causewayhead) (Potentially Vulnerable Area 09/05) Local Plan District Forth Local authority Clackmannanshire Council, Stirling Council Main catchment River Forth Summary of flooding
Ross of Mull (Potentially Vulnerable Area 01/30) Local authority Main catchment Argyll and Bute Council Island of Mull coastal Background This Potenti
 Local authority Main catchment Argyll and Bute Council Island of Mull coastal Background This Potenti") Ross of Mull (Potentially Vulnerable Area 01/30) Local authority Argyll and Bute Council Main catchment Island of Mull coastal Summary of flooding impacts At risk of flooding
Ross of Mull (Potentially Vulnerable Area 01/30) Local authority Argyll and Bute Council Main catchment Island of Mull coastal Summary of flooding impacts At risk of flooding
Dornoch (Potentially Vulnerable Area 01/07) Local Plan District Highland and Argyll Local authority The Highland Council Main catchment Dornoch coasta
 Local Plan District Highland and Argyll Local authority The Highland Council Main catchment Dornoch coasta") Dornoch (Potentially Vulnerable Area 01/07) Local authority The Highland Council Main catchment Dornoch coastal Summary of flooding impacts
Dornoch (Potentially Vulnerable Area 01/07) Local authority The Highland Council Main catchment Dornoch coastal Summary of flooding impacts
Glossary. Annual Average Damages (AAD) Benefit cost ratio (BCR)
 Benefit cost ratio (BCR)") Glossary Term Accretion Actions Annual Average Damages (AAD) Appraisal Appraisal baseline Awareness raising Bathing waters Benefit cost ratio (BCR) Blue infrastructure Accumulation of sediment. Activities
Glossary Term Accretion Actions Annual Average Damages (AAD) Appraisal Appraisal baseline Awareness raising Bathing waters Benefit cost ratio (BCR) Blue infrastructure Accumulation of sediment. Activities
Chapter Flood Consequences
 Chapter 2.16. Flood Consequences 438 16. Flood Consequences 16.1. Introduction and Scope of Topic 16.1.1. This chapter identifies and describes the existing flood risk features along the route of the Scheme
IRISH FLOOD PREVENTION PROGRAMME Example of integrating climate change adaptation into projects
 IRISH FLOOD PREVENTION PROGRAMME Example of integrating climate change adaptation into projects JASPERS Networking Platform Event Climate Change Adaptation: Vulnerability and Risk Assessment and the Resilience
Conon Bridge and Muir of Ord (Potentially Vulnerable Area 01/16) Local authority Main catchment The Highland Council River Conon Background This Poten
 Local authority Main catchment The Highland Council River Conon Background This Poten") Conon Bridge and Muir of Ord (Potentially Vulnerable Area 01/16) Local authority The Highland Council Main catchment River Conon Summary of flooding impacts Summary of flooding impacts At risk of flooding
Conon Bridge and Muir of Ord (Potentially Vulnerable Area 01/16) Local authority The Highland Council Main catchment River Conon Summary of flooding impacts Summary of flooding impacts At risk of flooding
FOR TO THE GAELTACHT LOCAL AREA PLAN MARCH 2013
 APPENDIX II TO THE SEA ENVIRONMENTAL REPORT STAGE 2 STRATEGIC FLOOD RISK ASSESSMENT FOR PROPOSED AMENDMENT TO THE GAELTACHT LOCAL AREA PLAN 2008-2014 for: Galway County Council County Buildings Prospect
Please find attached your: FCI Flood Residential <0.25Ha
 Please find attached your: FCI Residential
STATUTORY INSTRUMENTS. S.I. No. 122 of EUROPEAN COMMUNITIES (ASSESSMENT AND MANAGEMENT OF FLOOD RISKS) REGULATIONS 2010.
 REGULATIONS 2010.") STATUTORY INSTRUMENTS. S.I. No. 122 of 2010. EUROPEAN COMMUNITIES (ASSESSMENT AND MANAGEMENT OF FLOOD RISKS) REGULATIONS 2010. (Prn. A10/0432) 2 [122] S.I. No. 122 of 2010. EUROPEAN COMMUNITIES (ASSESSMENT
STATUTORY INSTRUMENTS. S.I. No. 122 of 2010. EUROPEAN COMMUNITIES (ASSESSMENT AND MANAGEMENT OF FLOOD RISKS) REGULATIONS 2010. (Prn. A10/0432) 2 [122] S.I. No. 122 of 2010. EUROPEAN COMMUNITIES (ASSESSMENT
Strategic Flood Risk Assessment for SDCC Development Plan
 Strategic Flood Risk Assessment for SDCC Development Plan Detailed Report on Flood Risk in the Baldonnell Area 8 th May 2015 rpsgroup.com/ireland Strategic Flood Risk Assessment for SDCC Development Plan
Eddleston, Peebles, Innerleithen, Selkirk, Stow and Galashiels (Potentially Vulnerable Area 13/04) Local Plan District Local authority Main catchment
 Local Plan District Local authority Main catchment") Eddleston, Peebles, Innerleithen, Selkirk, Stow and Galashiels (Potentially Vulnerable Area 13/04) Local Plan District Tweed Local authority Scottish Borders Council Main catchment River Tweed Summary
Eddleston, Peebles, Innerleithen, Selkirk, Stow and Galashiels (Potentially Vulnerable Area 13/04) Local Plan District Tweed Local authority Scottish Borders Council Main catchment River Tweed Summary
BGC Project Memorandum
 Suite 500-1045 Howe Street, Vancouver, British Columbia, Canada. V6Z 2A9 Telephone (604) 684-5900 Fax (604) 684-5909 BGC Project Memorandum To: Attention: CANHUG Meeting Participants From: Kris Holm, BGC
Please find attached your: FCI Flood Commercial <0.25Ha
 Please find attached your: FCI Commercial
FLOOD SOLUTIONS Residence
 FLOOD SOLUTIONS Residence Overall Opinion PASSED Argyll's Overview The Site is located within an area which is susceptible to surface (pluvial) flooding. The defences identified are expected to protect
HRPP 358. Adapting flood risk management for an uncertain future: Flood management planning on the thames estuary. D. Ramsbottom & T.
 HRPP 358 Adapting flood risk management for an uncertain future: Flood management planning on the thames estuary D. Ramsbottom & T. Reeder Reproduced from a paper presented at: The 43rd Defra Flood and