Health, Health Insurance, and Disability Statistics from the Census Bureau
|
|
|
- Everett McKinney
- 6 years ago
- Views:
Transcription
1 Health, Health Insurance, and Disability Statistics from the Census Bureau Jennifer Cheeseman Day Nebraska Annual Data Users Conference 9:00 to 10:15 a.m., August 13, 2013 The U.S. Census Bureau Measures the Nation's People, Places, and Economy 1
2 What is health? 2


3 Health defined: 3


4 Google: 2,300,000,000+ results 4


5 5

6 Census Bureau mission: to serve as the leading source of quality data about the nation's people, places, and economy. 6

7 7
8 What questions on health can we answer with Census Bureau statistics? Social determinants of health Health care needs Health care expenses and financing Supply of health care workers
9 Census Bureau Statistics on Health Social Determinants of Health Age Ancestry Commuting patterns (distance/time) Disability Educational attainment Employer type (industry, class of work) Employment status Fertility Food stamps receipt Grandparents as caregivers Physical Determinants of Health Housing Age of housing Plumbing Heating Housing cost (monthly) Housing conditions Household and family composition Housing value Income and earnings amounts Labor force status Language spoken and English ability Marital status Mobility Nativity status/citizenship Number of children Other income sources Perceived Health status Health care costs and financing Health insurance (Insured/not) Types of health insurance Spells of health insurance Employer health insurance take up Reasons not covered Out of pocket spending (MOOP) Family Care Poverty Race and ethnicity School enrollment Sex Transportation to work Type of work (occupation) Veterans Disability Veterans status Wealth Well-being: basic needs, consumer durables, ability to get help, food security, fear of crime Health care services Accessability Health Care Workers Number of medical personnel Availability of medical offices/hospitals Types of medical Utilization of health services 9


10 Health care needs: Population Counts 10

11 Aging 11

12 Health Status Would you say (name's/your) health in general is excellent, very good, good, fair, or poor? Excellent Very good Good Fair Poor CPS SIPP 12


13 Health Status and Medical Utilization SIPP
, Table B 5; 2005 2007: Survey of Income and Program Participation, 2008 Panel, Wave 2.")
14 Fertility ACS CPS June supplement SIPP Women Working During First Pregnancy and Following Birth: and Source: : U.S. Census Bureau, Current Population Reports, Series P (Work and Family Patterns of American Women), Table B 5; : Survey of Income and Program Participation, 2008 Panel, Wave 2. Cumulative Percent Working During Pregnancy Working Following Birth Months before birth Birth Months following birth 14


15 ACS CPS SIPP 15


16 ACS Disability Questions 16

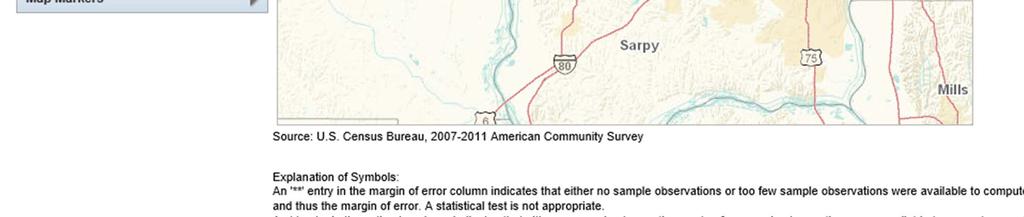
17 Disability Prevalence by State Source: U.S. Census Bureau, 2010 American Community Survey 17

18 18
19 Percentage of People with a Disability % 18.7% Percent 12.0% 12.6% 4.1% 4.4% With a disability Severe disability Needed assistance Source: U.S. Census Bureau, Survey of Income and Program Participation, 2004 and 2008 Panels, Adult and Child Functional Limitations Topical Module 19
20 Disability Prevalence by Age: 2010 Age Under to to to to to to to and over 8.4% 4.2% 10.2% 5.3% 11.0% 7.3% 19.7% 13.8% 28.7% 20.4% 35.0% 24.7% 42.6% 29.6% 37.5% With a disability Severe disability 53.6% 70.5% 55.8% Source: U.S. Census Bureau, Survey of Income and Program Participation, 2008 Panel, Adult and Child Functional Limitations Topical Module 20
21 Unemployment Rate Adults 16 to 64 with a Work Disability Note: People with a work disability represent a subset of the larger population of people with disabilities. Shaded areas indicate periods of recession as determined by NBER. Source: U.S. Census Bureau, Current Population Survey, March Supplement,


22 Employment to Population Ratios for People 18 to 64 years with a Disability by State Source: U.S. Census Bureau, 2010 American Community Survey 22


23 Veterans: Service Connected Disability Service Connected Disability Among Veterans: Has no service connected disability rating Has a service connected disability rating: Disability Rating Among Veterans with a Service Connected Disability ACS CPS Rating not reported 70 percent or higher 50 or 60 percent 30 or 40 percent 10 or 20 percent 0 percent
24 Health care expenses and financing Current Population Survey (CPS) At any time in 2011, (was/were) (you/ anyone in this household) covered by a health insurance plan provided through (their/your) current or former employer or union? What type of health insurance (was/were) (name/you) covered by in 2011? Up to six entries allowed Probe: Any Other Type Of Plan? Medicare Medicaid TRICARE CHAMPVA (CHAMPVA IS THE CIVILIA HEALTH AND MEDICAL PROGRAM OF THE DEPARTMENT OF VETERAN'S AFFAIRS) VA Military Health Care Children\'s Health Insurance Program (CHIP) Indian Health Service Other government health care Employer/union provided (policyholder) Employer/union provided (as dependent) Privately purchased (policyholder) Privately purchased (as dependent) Plan of someone outside the household Other Health Insurance by type and across time Percent of Population Under 65 Without Health Insurance: 1999 to 2011 U.S percent Nebraska 14.1 percent Source: US Census Bureau, Current Population Surveys, ASEC


25 Health Insurance by type, small geography, many variables American Community Survey (ACS) 25
 For States and Counties: Age groups: 0 64, 18 64,")
, Hispanic (any race) Income: less than or equal to: 138,")

26 Small Geography by Insured/Not insured Small Area Health Insurance Estimates (SAHIE) For States and Counties: Age groups: 0 64, 18 64, 40 64, Sex Race: White alone (non Hispanic), Black alone (non Hispanic), Hispanic (any race) Income: less than or equal to: 138, 200, 250, 400 percent of poverty threshold For Children (0 18): less than or equal to: 138, 200, 250, 400 percent of poverty threshold 26


27 Medical Out Of Pocket Expenses CPS, new in 2010 SIPP 27
28 Work Interruption for Family Care Sex of Caregivers (Percent distribution of employed workers who had work interruption for family care) 25 percent of employed women have taken an extended break from work of 6 months or longer to care for family members. Women Men Care for child Care for elder relative 6.9% Type of Family Care (Percent distribution of employed women who had work interruption for family care) 3.8% 93.1% 94.7% SIPP Care for disabled relative 1.5% Note: Among workers aged 25 to 62. Source: Survey of Income Program Participation, 2004 Panel, Wave 28 1.


29 Supply of health care workers Industry Industry and Occupation Occupation ACS SIPP CPS Write ins, coded SOC / NAICS 29
30 Nurse midwives Podiatrists Recreational therapists Occupational therapy assistants and aides Radiation therapists Health diagnosing and treating practitioners, all other Audiologists Nurse anesthetists Veterinary assistants and laboratory animal caretakers Pharmacy aides Optometrists Opticians, dispensing Chiropractors Physical therapist assistants and aides Medical transcriptionists Massage therapists Veterinarians Occupational therapists Dental hygienists Dietitians and nutritionists Phlebotomists Nurse practitioners Speech language pathologists Other healthcare practitioners and technical occupations Respiratory therapists Medical records and health information technicians Healthcare support workers, all other, including medical Miscellaneous health technologists and technicians Physician assistants Miscellaneous therapists, including exercise physiologists Dentists Physical therapists Emergency medical technicians and paramedics Dental assistants Pharmacists Diagnostic related technologists and technicians Clinical laboratory technologists and technicians Medical assistants Health practitioner support technologists and technicians Licensed practical and licensed vocational nurses Physicians and surgeons Nursing, psychiatric, and home health aides Registered nurses Health care occupations 0 500,000 1,000,000 1,500,000 2,000,000 Source: American Community Survey,
31 Program name Subnational Economic Data Sources About Businesses and Governments Metro areas Counties Cities 1 Zip codes Latest data Content Economic Census X X X X 2007 Sales, employment, payroll for establishments Survey of Business Owners X X X 2007 Building Permits X X X 2012 by size Sales, employment, payroll for firms by sex and ethnicity of owner Statistics of U.S. Businesses X X 2009 Employment and payroll for firms by employment size Statistics of U.S. Births, deaths, expansions, contractions for establishments Businesses X X 2009 County Business Patterns X X 2010 ZIP Code Business Patterns X 2010 Establishments by employment size by detailed industry Nonemployer Statistics X X 2010 Receipts for establishments with no paid employees Local Employment Dynamics X X 2011 Employment and payroll for establishments; employment size Quarterly employment, job creation, earnings by age, sex & sector Number of housing units authorized by building permits Governments X X X 2010 Federal, state, and local governments and activities NAICS Industry Code: 62 Health Care and Social Assistance 31

32 County Business Patterns 32

33 EEO Tabulation Shifting shares in occupations by sex 33

34 Disability Employment Tabulation 34


35 Which source best fits your needs? Decennial Census, Population Estimates American Community Survey Current Population Survey Survey of Income and Program Participation Small Area Poverty and Health Insurance Estimates (SAIPE, SAHIE) Economic Business data 35
36 Content and Geography Decennial Census & Estimates American Community Survey People Current Population Survey Survey of Income and Program Participation Small Area Poverty and Health Insurance Estimates (ACS) (CPS ASEC) (SIPP) (Modeled) Demographics Age X X X X X Sex X X X X X Race/ethnicity X X X X X Businesses Economic business data Geography Nation/Region X X X X X X State X X X X X X Substate X X X X Worksite X X Sample Census 3 million addresses 100,000 addresses 94,000 people modeled Business register 36


37 Census 2010 Demographics Across Geographies Number of people Where they live Age Sex Race Hispanic origin Relationship in household Rent or own home 37
38 Population Estimates Level of Geography Nation States Counties Cities and Towns (Incorporated Places and Minor Civil Divisions) Metropolitan and Micropolitan Statistical Areas Puerto Rico Commonwealth Puerto Rico Municipios Housing Units Level of Detail Total population Population by age, sex, race, and Hispanic origin Total population Population by age, sex, race, and Hispanic origin Total population Population by age, sex, race, and Hispanic origin Total population Total population Total population Population by age and sex Total population Population by age and sex Total 38
 Two year averages for states Historical So")
39 Current Population Survey Annual Social and Economic Supplement Official Poverty Rate Detailed income sources and amounts Health insurance and type Medical Out of Pocket expenses Health Status Labor force detail Household/family relationships (parent pointers) Two year averages for states Historical Source: U.S. Census Bureau, Current Population Survey, 2011 and 2012, Annual Social and Economic Supplements 39


40 American Community Survey: Content 40

41 Geography of ACS New in


42 Survey of Income and Program Participation Cross sectional and longitudinal Transitions, churning Core and Topical Module questions Focus on low income 3, 4, and 5 year panels, since 1984 Follows people when they move National level primarily, state Current panel started 2008 Re designed SIPP
43 Current Population Survey American Community Survey Survey of Income and Program Participation Small Area Health Insurance Estimates (CPS-ASEC) (ACS) (SIPP) (SAHIE) Decennial Census & Estimates Health care needs: Aging and population trends Disability Fertility Health status Utilization of health services Veterans Disability X X X X X X X X X X X X X X X X Health care costs and financing: Health insurance Have or not have health insurance X X X X Types of health insurance X X X Spells of health insurance X Health Insurance Unit (dependents) X X Reasons not covered Out of pocket spending (MOOP) Family Care Supply of health care workers: X X X X Health Care Workers X X X 43

44 Coming December 5, 2013 Health Insurance and Disability Statistics for all Geographies from the ACS 5-year file


45 Places

46 Counties

47 Counties


48 Counties

49 Douglas County

50 Census Tracts
51 Health Insurance Base Tables in ACS 5 year file ID Title B27001 Health Insurance Coverage Status By Sex By Age B27002 Private Health Insurance Status By Sex By Age B27003 Public Health Insurance Status By Sex By Age B27011 Health Insurance Coverage Status And Type By Employment Status By Age B27015 Health Insurance Coverage Status And Type By Household Income In The Past 12 Months B27019 Health Insurance Coverage Status And Type By Age By Educational Attainment B27020 Health Insurance Coverage Status And Type By Citizenship Status B27022 Health Insurance Coverage Status By Sex By Enrollment Status For Young Adults Aged 19 To 25 C27001A I C27004 C27005 C27006 C27007 C27008 C27009 C27010 C27012 C27016 Health Insurance Coverage Status By Age (for race and Hispanic Origin) Employer Based Health Insurance By Sex By Age Direct Purchase Health Insurance By Sex By Age Medicare Coverage By Sex By Age Medicaid/Means Tested Public Coverage By Sex By Age Tricare/Military Health Coverage By Sex By Age Va Health Care By Sex By Age Types Of Health Insurance Coverage By Age Health Insurance Coverage Status And Type By Work Experience By Age Health Insurance Coverage Status By Ratio Of Income To Poverty Level In The Past 12 Months By Age 51
52 Disability Base Tables in ACS 5 year file ID Title B18101 Sex By Age By Disability Status B18101A I Age By Disability Status (for race and Hispanic Origin) B18102 Sex By Age By Hearing Difficulty B18103 Sex By Age By Vision Difficulty B18104 Sex By Age By Cognitive Difficulty B18105 Sex By Age By Ambulatory Difficulty B18106 Sex By Age By Self Care Difficulty B18107 Sex By Age By Independent Living Difficulty B18135 Age By Disability Status By Health Insurance Coverage Status B18140 Median Earnings In The Past 12 Months By Disability Status By Sex For The Civilian Noninstitutionalized Population 16 Years And Over With Earnings C18108 C18120 C18121 C18130 C18131 Age By Number Of Disabilities Employment Status By Disability Status Work Experience By Disability Status Age By Disability Status By Poverty Status Ratio Of Income To Poverty Level In The Past 12 Months By Disability Status 52
53 How to access these data? Reports and Papers Subject Census web page Survey Census Web page: ACS, SIPP, CPS Working papers and conference papers Tables and Table packages Subject Area Census web page On-line data tools, e.g., American FactFinder (AFF) Unit Record Data -- PUMS files for ACS, SIPP, CPS DataFerret CPS Table Generator 53
54 Easy Access to Census Statistics American Fact Finder SAIHE Interactive Data and Mapping Tool API Easy Stats My Congressional District Quick facts 54


55


56 SAHIE Interactive Data Tool

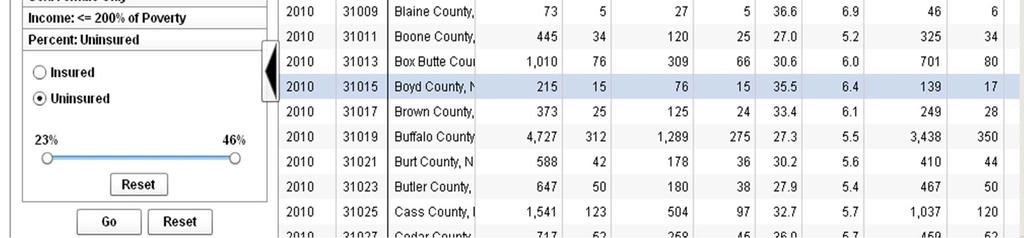
57 SAHIE Interactive Tool Data Tab

58 SAHIE Interactive Data Tool Map

59 SAHIE Interactive Data Tool Trends
60 Census API


61 APIs provide new methods of data dissemination Advanced Search Source Source Dataweb Source Source API Serves the Requested Data linked in the Dataweb Web Applications API enabled Mobile Applications Sunlight Foundation s Sitegeist


62 APIs: Spurring innovation around Census statistics How are we doing? API launched July 26, Million API calls to date 3,100 developer keys distributed High value data sets with thousands of data items American Community Survey 113 th Congressional District 1990, 2000, 2010 Census 850 members of the online developer forum

63 APIs: Online resources Website Technical documentation Example code Applications Example using age data Point to good apps that use the APIs Developer Forum Build a community around Census APIs. Feedback loop for enhancements, requests Let developers showcase their apps A place to suggest apps and collaborate on ideas

64 Easy Stats: Thematic access to ACS data Live on 64


65 65

66 My Congressional District 66

67 New QuickFacts Data Tool Tables, maps, charts. Customize, share, embed, download.
68 How do I find all this? 68

69 New Topic Based Web Pages 69

70 70

71 Nesting under broad topics 71

72 Health Page
73 Research and Future Enhancements 73
74 Health Insurance Question Changes in the CPS ASEC March 2013 CPS Content Test Redesign of health insurance coverage types Improve all year coverage measure Add point in time coverage measure New questions to measure Exchange participation Non employer based Employer based New questions on employer offered health insurance coverage 74
75 Small Area Estimates Development Project Use model based methods to combine the geographic detail from the ACS with the topical detail from a nationallevel survey State/County estimates of: Severe/not severe disability Wheelchair use Special Education Services Use ADL/IADLs 0thers An evaluation project To determine if this method can yield useful results Part of a larger effort in using/improving SAE methods
76 Upcoming Release Schedule 2011 Small Area Health Insurance Estimates August Estimates of health insurance for States and counties Income, Poverty, and Health Insurance: 2012 Tuesday, Sept. 17, Estimates of health insurance for nation and states American Community Survey one year statistics Thursday, Sept. 19, Estimates will be available for the nation, all 50 states, the District Columbia, Puerto Rico, every congressional district, every metropolitan area, and all counties and places with populations of 65,000 or more American Community Surveythree year statistics Thursday Oct. 24, The estimates will cover all geographic areas with populations of 20,000 or more. For the first time, comparison profiles will be available for the three year estimates. These will permit users to compare two non overlapping three year periods ( versus ) and see which changes were statistically significant American Community Survey five year statistics Thursday Dec. 5, These statistics are available for all areas regardless of population size, down to the block group. 76

77 For more information Jennifer Cheeseman Day Assistant Division Chief for Employment Characteristics Social, Economic, and Housing Statistics Division
Wyoming Economic and
 Wyoming Economic and Demographic Data Tools for your Toolbox Presented to: Wyoming Association of Municipal i Clerks and Treasurers (WAMCAT) 2011 Region VIII & WAMCAT Winter Workshop Jackson, Wyoming January
Small Area Health Insurance Estimates from the Census Bureau: 2008 and 2009
 October 2011 Small Area Health Insurance Estimates from the Census Bureau: 2008 and 2009 Introduction The U.S. Census Bureau s Small Area Health Insurance Estimates (SAHIE) program produces model based
2016 HEALTH INSURANCE COVERAGE ESTIMATES
 2016 HEALTH INSURANCE COVERAGE ESTIMATES SHADAC Webinar Featuring U.S. Census Bureau Experts September 19, 2017 1:00 PM EDT You will be connected to broadcast audio through your computer. You can also
How the Census Bureau Measures Poverty With Selected Sources of Poverty Data
 How the Census Bureau Measures Poverty With Selected Sources of Poverty Data Alemayehu Bishaw Poverty Statistics Branch Social, Economic and Housing Statistics Division U. S. Census Bureau November 15-16,
2014 HEALTH INSURANCE COVERAGE ESTIMATES
 2014 HEALTH INSURANCE COVERAGE ESTIMATES SHADAC Webinar Featuring U.S. Census Bureau Experts September 22, 2015, 2:00 PM EDT You will be connected to broadcast audio through your computer. You can also
Introduction to American Community Survey (ACS) Hsueh-Sheng Wu CFDR Workshop Series September 24, 2018
 Hsueh-Sheng Wu CFDR Workshop Series September 24, 2018") Introduction to American Community Survey (ACS) Hsueh-Sheng Wu CFDR Workshop Series September 24, 2018 1 Overview What is ACS? Content of ACS Different estimates of ACS Examples of using ACS data ACS PUMS
Introduction to American Community Survey (ACS) Hsueh-Sheng Wu CFDR Workshop Series September 24, 2018 1 Overview What is ACS? Content of ACS Different estimates of ACS Examples of using ACS data ACS PUMS
Click to edit Master text styles
 For those dialing in: All phones are muted Second Submit questions level using the chat window at any time during Third the level webinar Troubleshooting: Call Readytalk s help line: (800) 843-9166 Ask
An Interactive Overview of Small Area Health Insurance Estimates (SAHIE) Walter Lee Holmes Jr. U.S. Census Bureau September 20, 2013
 Walter Lee Holmes Jr. U.S. Census Bureau September 20, 2013") An Interactive Overview of Small Area Health Insurance Estimates (SAHIE) Walter Lee Holmes Jr. U.S. Census Bureau September 20, 2013 1 Presentation Overview About SAHIE Why SAHIE SAHIE Timeline Methodology
An Interactive Overview of Small Area Health Insurance Estimates (SAHIE) Walter Lee Holmes Jr. U.S. Census Bureau September 20, 2013 1 Presentation Overview About SAHIE Why SAHIE SAHIE Timeline Methodology
MEMORANDUM. Gloria Macdonald, Jennifer Benedict Nevada Division of Health Care Financing and Policy (DHCFP)
") MEMORANDUM To: From: Re: Gloria Macdonald, Jennifer Benedict Nevada Division of Health Care Financing and Policy (DHCFP) Bob Carey, Public Consulting Group (PCG) An Overview of the in the State of Nevada
MEMORANDUM To: From: Re: Gloria Macdonald, Jennifer Benedict Nevada Division of Health Care Financing and Policy (DHCFP) Bob Carey, Public Consulting Group (PCG) An Overview of the in the State of Nevada
American Community Survey 5-Year Estimates
 DP05 ACS DEMOGRAPHIC AND HOUSING ESTIMATES 2011-2015 American Community Survey 5-Year Estimates Supporting documentation on code lists, subject definitions, data accuracy, and statistical testing can be
American Community Survey 5-Year Estimates
 DP05 ACS DEMOGRAPHIC AND HOUSING ESTIMATES 2011-2015 American Community Survey 5-Year Estimates Supporting documentation on code lists, subject definitions, data accuracy, and statistical testing can be
Health Status, Health Insurance, and Health Services Utilization: 2001
 Health Status, Health Insurance, and Health Services Utilization: 2001 Household Economic Studies Issued February 2006 P70-106 This report presents health service utilization rates by economic and demographic
APPENDIX 6: CENSUS DATA BURLINGTON, VERMONT
 APPENDIX 6: CENSUS DATA BURLINGTON, VERMONT 2000 CENSUS DATA 2005-2007 AMERICAN COMMUNITY SURVEY Burlington city, Vermont - Fact Sheet - American FactFinder Page 1 of 2 FACT SHEET Burlington
Tell us what you think. Provide feedback to help make American Community Survey data more useful for you.
 DP05 ACS DEMOGRAPHIC AND HOUSING ESTIMATES 2016 American Community Survey 1-Year Estimates Supporting documentation on code lists, subject definitions, data accuracy, and statistical testing can be found
TABLE 1. PROFILE OF GENERAL DEMOGRAPHIC CHARACTERISTICS
 Waterloo city, Iowa TABLE 1. PROFILE OF GENERAL DEMOGRAPHIC CHARACTERISTICS Estimate Lower Bound Upper Bound Total population 66,659 64,093 69,225 SEX AND AGE Male 32,096 30,415 33,777 Female 34,563 33,025
ACS DEMOGRAPHIC AND HOUSING ESTIMATES American Community Survey 1-Year Estimates
 DP05 ACS DEMOGRAPHIC AND HOUSING ESTIMATES 2012 American Community Survey 1-Year Estimates Supporting documentation on code lists, subject definitions, data accuracy, and statistical testing can be found
Florida Health Care Expenditures Report
 Florida Health Care Expenditures Report 2015 Table of Contents Table of Contents... i Florida Health Care Expenditures in 2015... 1 Introduction... 1 Data and Methodology... 1 Findings... 2 Overall Trend...
CHAPTER 3 POPULATION AND ECONOMIC CHARACTERISTICS
 CHAPTER 3 POPULATION AND ECONOMIC CHARACTERISTICS INTRODUCTION Population trends in La Vista and its respective planning jurisdiction serve as valuable indicators of future development needs and patterns
INDUSTRY PROFILES. Health Care and Social Assistance Industry
 INDUSTRY PROFILES Health Care and Social Assistance Industry July 2010 Overview: The Health Care and Social Assistance industry 1 in Alberta includes establishments and services such as: hospitals, nursing
ACS DEMOGRAPHIC AND HOUSING ESTIMATES American Community Survey 1-Year Estimates
 DP05 ACS DEMOGRAPHIC AND HOUSING ESTIMATES 2010 American Community Survey 1-Year s Supporting documentation on code lists, subject definitions, data accuracy, and statistical testing can be found on the
American Community Survey 5-Year Estimates
 DP02 SELECTED SOCIAL CHARACTERISTICS IN THE UNITED STATES 2007-2011 American Community Survey 5-Year Estimates Supporting documentation on code lists, subject definitions, data accuracy, and statistical
An Introduction to the American Community Survey Health Insurance Coverage Estimates
 September 2009 An Introduction to the American Community Survey Health Insurance Coverage Estimates Introduction The American Community Survey (ACS) is a new source of data for health insurance coverage
Commission District 4 Census Data Aggregation
 Commission District 4 Census Data Aggregation 2011-2015 American Community Survey Data, U.S. Census Bureau Table 1 (page 2) Table 2 (page 2) Table 3 (page 3) Table 4 (page 4) Table 5 (page 4) Table 6 (page
Health Spending Explorer
 03.05.2015 DEFINITIONS Health Spending Explorer The following list is a quick reference to definitions of type-of-expenditure and source-of-fund categories used in the Health Spending Explorer. These and
County Health Economics Profile Oktibbeha County, MS extension.msstate.edu/economic-profiles
 County Health Economics Profile Oktibbeha County, MS extension.msstate.edu/economic-profiles Demographics Oktibbeha Mississippi United States Total Population, 2016 (Census) 49,729 2,989,390 320,896,618
Unemployment in Boston
 Unemployment in Boston Boston Redevelopment Authority Research Division September 2014 This report uses a variety of data sources from the U.S. Census Bureau, including the 2008-2012 and 2012 American
Northwest Census Data Aggregation
 Northwest Census Data Aggregation 2011-2015 American Community Survey Data, U.S. Census Bureau Table 1 (page 2) Table 2 (page 2) Table 3 (page 3) Table 4 (page 4) Table 5 (page 4) Table 6 (page 5) Table
Riverview Census Data Aggregation
 Riverview Census Data Aggregation 2011-2015 American Community Survey Data, U.S. Census Bureau Table 1 (page 2) Table 2 (page 2) Table 3 (page 3) Table 4 (page 4) Table 5 (page 4) Table 6 (page 5) Table
Saskatchewan Ministry of the Economy
 Saskatchewan Ministry of the Economy June 2014 SASKATCHEWAN WAGE SURVEY 2013 - HEALTH CARE AND SOCIAL ASSISTANCE INDUSTRY DETALED REPORT SASKATCHEWAN WAGE SURVEY 2013: HEALTH CARE AND SOCIAL ASSISTANCE
Zipe Code Census Data Aggregation
 Zipe Code 66101 Census Data Aggregation 2011-2015 American Community Survey Data, U.S. Census Bureau Table 1 (page 2) Table 2 (page 2) Table 3 (page 3) Table 4 (page 4) Table 5 (page 4) Table 6 (page 5)
Zipe Code Census Data Aggregation
 Zipe Code 66103 Census Data Aggregation 2011-2015 American Community Survey Data, U.S. Census Bureau Table 1 (page 2) Table 2 (page 2) Table 3 (page 3) Table 4 (page 4) Table 5 (page 4) Table 6 (page 5)
Poverty and Labor Force Statistics in the United States
 Poverty and Labor Force Statistics in the United States Marcella S. Jones-Puthoff Statistician, Age and Special Populations Branch Population Division U. S. Census Bureau Presentation for the Global Forum
REPORT OF THE COUNCIL ON MEDICAL SERVICE
 REPORT OF THE COUNCIL ON MEDICAL SERVICE CMS Report - I- Subject: Presented by: Defining the Uninsured and Underinsured Kay K. Hanley, MD, Chair ----------------------------------------------------------------------------------------------------------------------
Has the insured, in the last 10 years in business ever been without professional and/or general liability Insurance? 0 Yes 0 No
 Applicant Information Applicant Name: Mailing Address Location Address (If Different): County (ies) doing business in: Telephone Number: Corporate Structure: 0 Individual 0 Corporation 0 LLC 0 Other: 0
Your Guide to Kentucky HEALTH
 Your Guide to Kentucky HEALTH Your Guide to Kentucky HEALTH Kentucky has changed the way Medicaid works for some people. The state s new program is called Kentucky HEALTH. Kentucky HEALTH offers health
Economic Profile. Capital Crossroads. a vision forward
 Economic Profile Capital a vision forward This profile was prepared by: Liesl Eathington Department of Economics State University phone: (515) 294 2954 email: leathing@iastate.edu 5/23/2012 Distribution
American Community Survey 5-Year Estimates
 DP03 SELECTED ECONOMIC CHARACTERISTICS 2012-2016 American Community Survey 5-Year Estimates Supporting documentation on code lists, subject definitions, data accuracy, and statistical testing can be found
American Community Survey 5-Year Estimates
 DP03 SELECTED ECONOMIC CHARACTERISTICS 2012-2016 American Community Survey 5-Year Estimates Supporting documentation on code lists, subject definitions, data accuracy, and statistical testing can be found
American Community Survey 5-Year Estimates
 DP03 SELECTED ECONOMIC CHARACTERISTICS 2012-2016 American Community Survey 5-Year Estimates Supporting documentation on code lists, subject definitions, data accuracy, and statistical testing can be found
American Community Survey 5-Year Estimates
 DP03 SELECTED ECONOMIC CHARACTERISTICS 2012-2016 American Community Survey 5-Year Estimates Supporting documentation on code lists, subject definitions, data accuracy, and statistical testing can be found
American Community Survey 5-Year Estimates
 DP03 SELECTED ECONOMIC CHARACTERISTICS 2012-2016 American Community Survey 5-Year Estimates Supporting documentation on code lists, subject definitions, data accuracy, and statistical testing can be found
American Community Survey 5-Year Estimates
 DP03 SELECTED ECONOMIC CHARACTERISTICS 2012-2016 American Community Survey 5-Year Estimates Supporting documentation on code lists, subject definitions, data accuracy, and statistical testing can be found
American Community Survey 5-Year Estimates
 DP03 SELECTED ECONOMIC CHARACTERISTICS 2012-2016 American Community Survey 5-Year Estimates Supporting documentation on code lists, subject definitions, data accuracy, and statistical testing can be found
American Community Survey 5-Year Estimates
 DP03 SELECTED ECONOMIC CHARACTERISTICS 2012-2016 American Community Survey 5-Year Estimates Supporting documentation on code lists, subject definitions, data accuracy, and statistical testing can be found
American Community Survey 5-Year Estimates
 DP03 SELECTED ECONOMIC CHARACTERISTICS 2012-2016 American Community Survey 5-Year Estimates Supporting documentation on code lists, subject definitions, data accuracy, and statistical testing can be found
American Community Survey 5-Year Estimates
 DP03 SELECTED ECONOMIC CHARACTERISTICS 2012-2016 American Community Survey 5-Year Estimates Supporting documentation on code lists, subject definitions, data accuracy, and statistical testing can be found
American Community Survey 5-Year Estimates
 DP03 SELECTED ECONOMIC CHARACTERISTICS 2012-2016 American Community Survey 5-Year Estimates Supporting documentation on code lists, subject definitions, data accuracy, and statistical testing can be found
American Community Survey 5-Year Estimates
 DP03 SELECTED ECONOMIC CHARACTERISTICS 2012-2016 American Community Survey 5-Year Estimates Supporting documentation on code lists, subject definitions, data accuracy, and statistical testing can be found
American Community Survey 5-Year Estimates
 DP03 SELECTED ECONOMIC CHARACTERISTICS 2012-2016 American Community Survey 5-Year Estimates Supporting documentation on code lists, subject definitions, data accuracy, and statistical testing can be found
American Community Survey 5-Year Estimates
 DP03 SELECTED ECONOMIC CHARACTERISTICS 2012-2016 American Community Survey 5-Year Estimates Supporting documentation on code lists, subject definitions, data accuracy, and statistical testing can be found
American Community Survey 5-Year Estimates
 DP03 SELECTED ECONOMIC CHARACTERISTICS 2012-2016 American Community Survey 5-Year Estimates Supporting documentation on code lists, subject definitions, data accuracy, and statistical testing can be found
American Community Survey 5-Year Estimates
 DP03 SELECTED ECONOMIC CHARACTERISTICS 2012-2016 American Community Survey 5-Year Estimates Supporting documentation on code lists, subject definitions, data accuracy, and statistical testing can be found
American Community Survey 5-Year Estimates
 DP03 SELECTED ECONOMIC CHARACTERISTICS 2012-2016 American Community Survey 5-Year Estimates Supporting documentation on code lists, subject definitions, data accuracy, and statistical testing can be found
American Community Survey 5-Year Estimates
 DP03 SELECTED ECONOMIC CHARACTERISTICS 2012-2016 American Community Survey 5-Year Estimates Supporting documentation on code lists, subject definitions, data accuracy, and statistical testing can be found
American Community Survey 5-Year Estimates
 DP03 SELECTED ECONOMIC CHARACTERISTICS 2012-2016 American Community Survey 5-Year Estimates Supporting documentation on code lists, subject definitions, data accuracy, and statistical testing can be found
American Community Survey 5-Year Estimates
 DP03 SELECTED ECONOMIC CHARACTERISTICS 2012-2016 American Community Survey 5-Year Estimates Supporting documentation on code lists, subject definitions, data accuracy, and statistical testing can be found
American Community Survey 5-Year Estimates
 DP03 SELECTED ECONOMIC CHARACTERISTICS 2012-2016 American Community Survey 5-Year Estimates Supporting documentation on code lists, subject definitions, data accuracy, and statistical testing can be found
American Community Survey 5-Year Estimates
 DP03 SELECTED ECONOMIC CHARACTERISTICS 2012-2016 American Community Survey 5-Year Estimates Supporting documentation on code lists, subject definitions, data accuracy, and statistical testing can be found
American Community Survey 5-Year Estimates
 DP03 SELECTED ECONOMIC CHARACTERISTICS 2012-2016 American Community Survey 5-Year Estimates Supporting documentation on code lists, subject definitions, data accuracy, and statistical testing can be found
American Community Survey 5-Year Estimates
 DP03 SELECTED ECONOMIC CHARACTERISTICS 2012-2016 American Community Survey 5-Year Estimates Supporting documentation on code lists, subject definitions, data accuracy, and statistical testing can be found
American Community Survey 5-Year Estimates
 DP03 SELECTED ECONOMIC CHARACTERISTICS 2012-2016 American Community Survey 5-Year Estimates Supporting documentation on code lists, subject definitions, data accuracy, and statistical testing can be found
American Community Survey 5-Year Estimates
 DP03 SELECTED ECONOMIC CHARACTERISTICS 2012-2016 American Community Survey 5-Year Estimates Supporting documentation on code lists, subject definitions, data accuracy, and statistical testing can be found
Poverty Facts, million people or 12.6 percent of the U.S. population had family incomes below the federal poverty threshold in 2004.
 Poverty Facts, 2004 How Many People Are Poor? 36.6 million people or 12.6 percent of the U.S. population had family incomes below the federal poverty threshold in 2004. 1 How Much Money Do Families Need
Making the Case for Shared Prosperity: Using the New Poverty, Income, and Health Insurance Data
 Making the Case for Shared Prosperity: Using the New Poverty, Income, and Health Insurance Data September 6, 2012 With many thanks to the Annie E. Casey Foundation, George Gund Foundation, ELCA World Hunger
The coverage of young children in demographic surveys
 Statistical Journal of the IAOS 33 (2017) 321 333 321 DOI 10.3233/SJI-170376 IOS Press The coverage of young children in demographic surveys Eric B. Jensen and Howard R. Hogan U.S. Census Bureau, Washington,
Contact Name: Phone #:
 NEW BUSINESS APPLICATION MISCELLANEOUS HEALTHCARE FACILITIES PROGRAM Wholesaler: Location: City State Contact Name: Phone #: E-Mail : NOTE Coverage is not afforded by this policy to any resident, intern,
[THE STATUS OF THE ECONOMY IN SPARTANBURG COUNTY] Spartanburg Community Indicators Project Data Update, 2012
![[THE STATUS OF THE ECONOMY IN SPARTANBURG COUNTY] Spartanburg Community Indicators Project Data Update, 2012](/thumbs/82/85294455.jpg "[THE STATUS OF THE ECONOMY IN SPARTANBURG COUNTY] Spartanburg Community Indicators Project Data Update, 2012") 2012 Metropolitan Studies Institute at USC Upstate Kathleen Brady, PhD [THE STATUS OF THE ECONOMY IN SPARTANBURG COUNTY] Spartanburg Community Indicators Project Data Update, 2012 The Status of the Economy
2012 Metropolitan Studies Institute at USC Upstate Kathleen Brady, PhD [THE STATUS OF THE ECONOMY IN SPARTANBURG COUNTY] Spartanburg Community Indicators Project Data Update, 2012 The Status of the Economy
Beneficiaries with Medigap Coverage, 2013
 Beneficiaries with Medigap Coverage, 2013 JANUARY 2016 KEY TAKEAWAYS Forty-eight (48) percent of all noninstitutionalized Medicare beneficiaries without any additional insurance coverage (such as Medicare
Issue Brief. Sources of Health Insurance and Characteristics of the Uninsured: Analysis of the March 2007 Current Population Survey. No.
 Issue Brief Sources of Health Insurance and Characteristics of the Uninsured: Analysis of the March 2007 Current Population Survey By Paul Fronstin, EBRI No. 310 October 2007 This Issue Brief provides
What does your Community look like and how is it changing?
 What does your Community look like and how is it changing? Trends in the State population related to health and health determinants and where you can find this data to support your local work Who is Likely
Tell us what you think. Provide feedback to help make American Community Survey data more useful for you.
 DP03 SELECTED ECONOMIC CHARACTERISTICS 2016 American Community Survey 1-Year Estimates Supporting documentation on code lists, subject definitions, data accuracy, and statistical testing can be found on
FLORIDA HEALTH CARE EXPENDITURES REPORT
 FLORIDA HEALTH CARE EXPENDITURES REPORT 2013 5.5% 3.8% 6.2% 31.6% 14.5% HOUSEHOLDS 3.8% 5.4% 24.4% 4.8% 3.8% 5.5% 31.6% 6.2% 14.5% 24.4% Table of Contents Table of Contents... i Florida Health Care Expenditures
The Health of Jefferson County: 2010 Demographic Update
 The Health of : 2010 Demographic Update BACKGROUND How people live the sociodemographic context of their lives influences their health. People who have lower incomes may not have the resources to meet
County Health Economics Profile Leflore County, MS extension.msstate.edu/economic-profiles
 County Health Economics Profile Leflore County, MS extension.msstate.edu/economic-profiles Demographics Leflore Mississippi United States Total Population, 2016 (Census) 30,300 2,989,390 320,896,618 Percent
A Preliminary Evaluation of Health Insurance Coverage in the 2008 American Community Survey
 American Community Survey Research and Evaluation Program September 22, 2009 A Preliminary Evaluation Health Insurance Coverage in the 2008 American Community Survey FINAL REPORT JOANNA TURNER HOUSING
A Profile of the Working Poor, 2011
 Cornell University ILR School DigitalCommons@ILR Federal Publications Key Workplace Documents 4-2013 A Profile of the Working Poor, 2011 Bureau of Labor Statistics Follow this and additional works at:
In 2012, according to the U.S. Census Bureau, about. A Profile of the Working Poor, Highlights CONTENTS U.S. BUREAU OF LABOR STATISTICS
 U.S. BUREAU OF LABOR STATISTICS M A R C H 2 0 1 4 R E P O R T 1 0 4 7 A Profile of the Working Poor, 2012 Highlights Following are additional highlights from the 2012 data: Full-time workers were considerably
Small Area Estimates Produced by the U.S. Federal Government: Methods and Issues
 Small Area Estimates Produced by the U.S. Federal Government: Methods and Issues Small Area Estimation Conference Maastricht, The Netherlands August 17-19, 2016 John L. Czajka Mathematica Policy Research
Independence, MO Data Profile 2015
 , MO Data Profile 2015 5 year American Community Survey (ACS) Jackson County, Missouri Data sources: U.S. Census Bureau, American Community Survey (ACS), 2011 2015 (released December 8, 2016), compared
ISSUE BRIEF. poverty threshold ($18,769) and deep poverty if their income falls below 50 percent of the poverty threshold ($9,385).
 and deep poverty if their income falls below 50 percent of the poverty threshold ($9,385).") ASPE ISSUE BRIEF FINANCIAL CONDITION AND HEALTH CARE BURDENS OF PEOPLE IN DEEP POVERTY 1 (July 16, 2015) Americans living at the bottom of the income distribution often struggle to meet their basic needs
ASPE ISSUE BRIEF FINANCIAL CONDITION AND HEALTH CARE BURDENS OF PEOPLE IN DEEP POVERTY 1 (July 16, 2015) Americans living at the bottom of the income distribution often struggle to meet their basic needs
Population Age, Sex, and Race Language Employment Households, Income, and Poverty. Date last updated: Refresh cycle:
 Demographics Section Demographics Date last updated: Refresh cycle: Demographics are the statistical data of a population. Age, income, education, sex and race are all examples of demographic characteristics.
Tyler Area Economic Overview
 Tyler Area Economic Overview Demographic Profile. 2 Unemployment Rate. 4 Wage Trends. 4 Cost of Living Index...... 5 Industry Clusters. 5 Occupation Snapshot. 6 Education Levels 7 Gross Domestic Product
Insurance, Access, and Quality of Care Among Hispanic Populations Chartpack
 Insurance, Access, and Quality of Care Among Hispanic Populations 23 Chartpack Prepared by Michelle M. Doty The Commonwealth Fund For the National Alliance for Hispanic Health Meeting October 15 17, 23
Introduction to Current Population Survey (CPS) Hsueh-Sheng Wu Center for Family and Demographic Research November 14, 2016
 Hsueh-Sheng Wu Center for Family and Demographic Research November 14, 2016") Introduction to Current Population Survey (CPS) Hsueh-Sheng Wu Center for Family and Demographic Research November 14, 2016 1 Introduction Outline What is special about the CPS? Navigate CPS website Survey
Introduction to Current Population Survey (CPS) Hsueh-Sheng Wu Center for Family and Demographic Research November 14, 2016 1 Introduction Outline What is special about the CPS? Navigate CPS website Survey
How the Census Bureau Measures Poverty
 How the Census Bureau Measures Poverty Following the Office of Management and Budget's (OMB) Statistical Policy Directive 14, the Census Bureau uses a set of money income thresholds that vary by family
79th OREGON LEGISLATIVE ASSEMBLY Regular Session. Enrolled. House Bill 2341
 79th OREGON LEGISLATIVE ASSEMBLY--2017 Regular Session Enrolled House Bill 2341 Introduced and printed pursuant to House Rule 12.00. Presession filed (at the request of Kate Brown for Department of Consumer
American Community Survey 5-Year Estimates
 DP03 SELECTED ECONOMIC CHARACTERISTICS 2013-2017 American Community Survey 5-Year Estimates Supporting documentation on code lists, subject definitions, data accuracy, and statistical testing can be found
GAO GENDER PAY DIFFERENCES. Progress Made, but Women Remain Overrepresented among Low-Wage Workers. Report to Congressional Requesters
 GAO United States Government Accountability Office Report to Congressional Requesters October 2011 GENDER PAY DIFFERENCES Progress Made, but Women Remain Overrepresented among Low-Wage Workers GAO-12-10
Your Guide to Kentucky HEALTH
 Your Guide to Kentucky HEALTH Updated August 2018 Your Guide to Kentucky HEALTH Kentucky has changed the way Medicaid works for some people. The state s new program is called Kentucky HEALTH. Kentucky
Highlights of Women's Earnings in 2010
 Cornell University ILR School DigitalCommons@ILR Federal Publications Key Workplace Documents 7-2011 Highlights Women's Earnings in 2010 Bureau Labor Statistics Follow this and additional works at: http://digitalcommons.ilr.cornell.edu/key_workplace
Health, Health Insurance and Income/Poverty Data
 Health, Health Insurance and Income/Poverty Data Nebraska State Data Center 21 st Annual Conference David Drozd, Center for Public Affairs Research Tuesday, August 17, 2010 ddrozd@unomaha.edu 402-554-2132
Income and Poverty Among Older Americans in 2008
 Income and Poverty Among Older Americans in 2008 Patrick Purcell Specialist in Income Security October 2, 2009 Congressional Research Service CRS Report for Congress Prepared for Members and Committees
Gender Pay Differences: Progress Made, but Women Remain Overrepresented Among Low- Wage Workers
 Cornell University ILR School DigitalCommons@ILR Federal Publications Key Workplace Documents 10-2011 Gender Pay Differences: Progress Made, but Women Remain Overrepresented Among Low- Wage Workers Government
Economic Overview. Lawrence, KS MSA
 Economic Overview Lawrence, KS MSA March 5, 2019 DEMOGRAPHIC PROFILE... 3 EMPLOYMENT TRENDS... 5 UNEMPLOYMENT RATE... 5 WAGE TRENDS... 6 COST OF LIVING INDEX... 7 INDUSTRY SNAPSHOT... 8 OCCUPATION SNAPSHOT...
CRS Report for Congress Received through the CRS Web
 Order Code RL33387 CRS Report for Congress Received through the CRS Web Topics in Aging: Income of Americans Age 65 and Older, 1969 to 2004 April 21, 2006 Patrick Purcell Specialist in Social Legislation
Rifle city Demographic and Economic Profile
 Rifle city Demographic and Economic Profile Community Quick Facts Population (2014) 9,289 Population Change 2010 to 2014 156 Place Median HH Income (ACS 10-14) $52,539 State Median HH Income (ACS 10-14)
Chapter 4 Medicaid Clients
 Chapter 4 Medicaid Clients Medicaid covers diverse client groups. The Medicaid caseload is always changing because of economic and other factors discussed in this chapter. Who Is Covered in Texas Medicaid
SOUTH LOUISVILLE NEIGHBORHOOD PROFILE
 SOUTH LOUISVILLE NEIGHBORHOOD PROFILE July 2017 Prepared in Partnership Between the Kentucky State Data Center at the University of Louisville and Metro United Way Louisville s traditional urban neighborhoods
Basics of Economic Data
 Basics of Economic Data Between the Decennial Census Years Community and Regional Planning 511: Mar. 2006 Kevin Kargacin University of New Mexico Bureau of Business and Economic Research kargacin@unm.edu
In Baltimore City today, 20% of households live in poverty, but more than half of the
 Building Economic Opportunity in Baltimore: A Data Profile Baltimore Highlights In Baltimore City today, 20% of households live in poverty, but more than half of the city s population 55% is financially