Effective Revenue Cycles Are No Accident
|
|
|
- Miles Rodgers
- 5 years ago
- Views:
Transcription

1 Effective Revenue Cycles Are No Accident Physician Leadership Institute March 7,2015 Jerrie K. Weith, MBA, FHFMA, CMPE, CMOM
2 Learning Objectives Characteristics of Best Performers Efficient Encounters = Revenue Cycle Success Measuring Revenue Cycle Performance Physicians Role in Revenue Cycle Excellence
3 Effective Revenue Cycles Are No Accident Characteristics of Best Performers Investment and re-investment in technology The right staff Payer relationships Effective processes

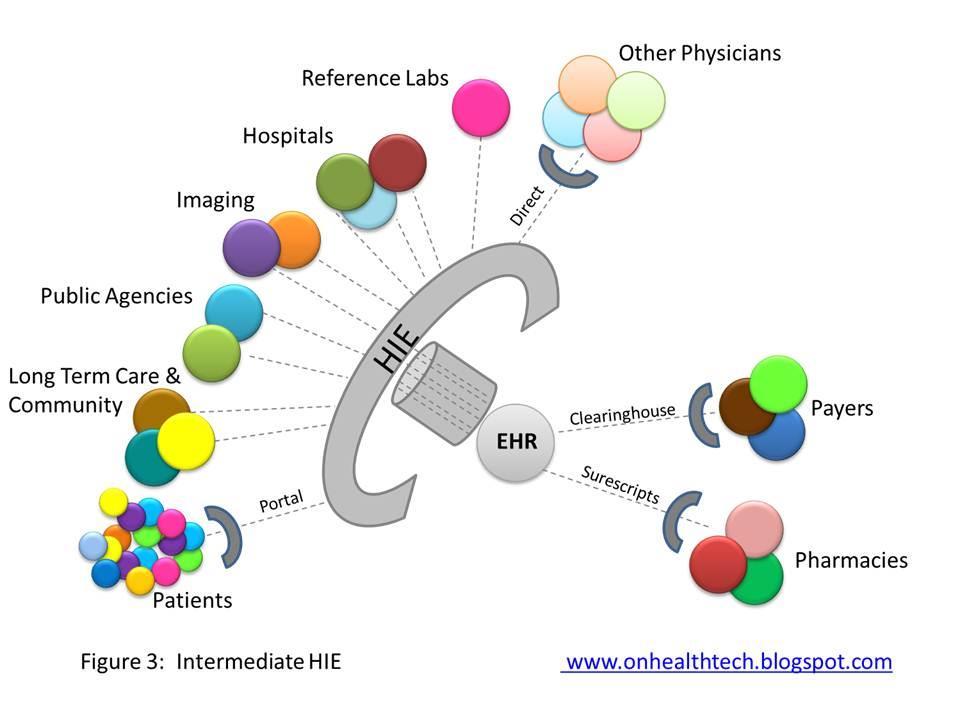
4 Characteristics of Best Performers Technology Systems HIE


5 Characteristics of Best Performers Technology EHR/PMS communicate Updated regularly Continued education


6 Characteristics of Best Performers Staff Right fit Productivity Re-invest Weekly meetings The Why factor
7 Characteristics of Best Performers The lowest level of performance by any employee, allowed to continue without corrective action, becomes the highest level of performance that can be required of any other employee in a similar position with the employer. Reference: Rosemarie Nelson MGMA Healthcare Consultant The ROI of IT: Best Billing Practices


8 Characteristics of Best Performers Payers Set-up Rules Options Changes Reference: AMA 2012 National Health Insurer Report Card

9 Characteristics of Best Performers Process Does it make sense? Uniform Set expectations Does the process help you meet them?

10 EFFICIENT ENCOUNTERS = REVENUE CYCLE SUCCESS
11 Efficient Encounters = Revenue Cycle Success Efficient encounters Scheduling Eligibility & benefits verification TOS Claims generation Payment processes Account resolution Collection process


12 Efficient Encounters = Revenue Cycle Success Patient demographics Capture the right information Account review Work #, cell phone, Insurance details Patient expectations Train your patients to be good patients We expect payment at the time of service. Guarantor details Ms. Smith, I see you have a past due amount of $ How would you like to take care of that Employer today? We information accept Visa, MasterCard, or do you have an FSA?


13 Efficient Encounters = Revenue Cycle Success Is it worth it? Automate Centralize Payer websites Choose your criteria: Services Payers Everything Use the information obtained! 3 days in advance
14 Efficient Encounters = Revenue Cycle Success Eligibility & benefits verification 51% providers knew what patient owed at TOS 78% patients knew what they owed at TOS It costs between $0.05 and $0.74 to check eligibility How much will your practice benefit to know what your patient owes at the TOS?
15 Efficient Encounters = Revenue Cycle Success Eligibility & benefits verification Faster payments Quicker to collect at TOS than through statement cycle Increase patient satisfaction No one likes a financial surprise after the visit! Increased efficiency Automate through clearinghouse and PMS
16 Efficient Encounters = Revenue Cycle Success Compare coverage to expected treatment & fee schedule Contact patient patient counseling Set alerts in system & schedule Collect at TOS


17 Efficient Encounters = Revenue Cycle Success TOS Confirm information Collect at check-in Collect at check-out How would you like to pay today? We accept Visa, MasterCard, cash and checks.


18 Efficient Encounters = Revenue Cycle Success Reference: InstaMed Trends in Healthcare Payments Annual Report: 2012
 Interface")
19 Efficient Encounters = Revenue Cycle Success TOS Complete record 24 hours Computer Assisted Coding (CAC) Interface charges


20 Efficient Encounters = Revenue Cycle Success Claim generation Charge lag 24 hours (48 hours out of office services) Claim scrubbing Edits Correction Do you update your claim edits on a regular basis?
21 Efficient Encounters = Revenue Cycle Success Utilize a clearinghouse 997 claim rejection report Submit charges within hours 277u claim status report Initial follow-up 24 hours Level 1 rejections

22 Efficient Encounters = Revenue Cycle Success Payment and Adjustment Processing EFT and ERA! Contractual Non-contractual Post all zero pays Utilize system automation Reconciliation
23 Efficient Encounters = Revenue Cycle Success Patient Balance Processing Electronic statements Save providers up to 42% compared to paper Make it convenient Only 4% of patients receive medical bills via Estimated $300 billion will be spent by consumers online in % consumers use online bill pay Shorten the cycle Day 0 Day 30 Collection letter Day 60 Day 75 turnover Reference: InstaMed Trends in Healthcare Payments Annual Report: 2012 Reference: Gartner Group, HFMA, and HH&N Research

24 Efficient Encounters = Revenue Cycle Success Account resolution Automate when possible 277/997 reports 24 hours after submission days clearinghouse 31+ days direct to payers Universal note area Appropriate reports Review notes & tasks Payer High $$$ Down DOS Group by Patient
25 Efficient Encounters = Revenue Cycle Success Should it be written off? Contractual versus non-contractual adjustment If Is so, a correction & resubmit! needed? Collect data, follow Should payer it process, be involve appealed? patient & track status

26 Efficient Encounters = Revenue Cycle Success Collection process Automate process Monitor results Write-off at turnover Use specific codes Create reports by code

27 Efficient Encounters = Revenue Cycle Success Where do you go from here? Decide what is right for your practice! Investigate your options Automate when possible Centralize processes Stay up-to-date on new options Partner with your clearinghouse Think outside the box Keep an open mind Reference:
28 MEASURING REVENUE CYCLE PERFORMANCE
29 Effective Revenue Cycles Are No Accident Measuring Revenue Cycle Performance What s important? Reporting Analysis Tracking and acting

30 Measuring Revenue Cycle Performance What is important? Collections Cash in the door Encounter rates or FFS Capitation/PMPM Production Units to produce the cash

31 Measuring Revenue Cycle Performance What is important? Collections! A/R Charges, payments, & adjustments Provider Practice Days outstanding Payer mix Collections per RVU Service line Provider

32 Measuring Revenue Cycle Performance What is important? Collections Payments Third party Underpayments Denials and rejections Patient TOS collections Commitment to payment plans

33 Measuring Revenue Cycle Performance What is important? Collections Credit balances Patient Third party Bad debt % bad debt to total revenue Collection agency recovery

34 Measuring Revenue Cycle Performance What is important? Production! CPT/RVU production Location Provider Case mix Location Provider

35 Measuring Revenue Cycle Performance

36 Measuring Revenue Cycle Performance Reporting and analysis Audience Content Presentation method Frequency

37 Measuring Revenue Cycle Performance Reporting and analysis Audience - Providers Short & sweet Personalized Audience - Executive Broader content Presentation method Narrative Columnar Graphical
38 Measuring Revenue Cycle Performance Reporting and analysis Daily Denials and rejections TOS collections Appointments with no charges EFT/ERA reconciliations Weekly Third party underpayments TOS collections
39 Measuring Revenue Cycle Performance Reporting and analysis Monthly Charges/payments/adjustments CPT/RVU utilization Denials and rejections summary Bad debt Credit balances Patient underpayments

40 Measuring Revenue Cycle Performance Reporting and analysis Quarterly Capitation plan performance Payer mix Charges Payments Annually Fee schedule assessment Capitation plan performance Budgeted revenue vs. actual revenue Budget production vs. actual production
41 Measuring Revenue Cycle Performance Tracking and acting KPI Data point or criteria Benchmark Type of KPI Data point to measure results against Internal or external
42 Measuring Revenue Cycle Performance Tracking and acting Why use KPI s? Measure what s important Identify trends Compare progress to expectations Incentivize desired behaviors
43 Measuring Revenue Cycle Performance Tracking and acting Which KPIs do you use? % Co-pays collected vs. total possible co-pays Charge lags Office visits Off-site services % clean claims Unbilled charges Staff production Non-contractual write-offs Payer mix

44 Measuring Revenue Cycle Performance Tracking and acting How do you use KPI s? Dashboard Snapshot summary of key results» Internal benchmarks Historical» External benchmarks Marketplace Industry
45 Measuring Revenue Cycle Performance Tracking and acting Dashboard Decide what s most important Identify the data point to measure Identify the benchmark for comparison Design dashboard to meet your practice s needs Populate dashboard Act on variances to the benchmark
46 Measuring Revenue Cycle Performance Key Indicators Indicator Calculation Significance Frequency Trend Gross Days Receivable Outstanding (DRO) Gross Calculation Ratio Net Collection Ratio % Insurance A/R 90+ Days Total A/R divided by Average Daily Charge Total YTD Payments divided by Total YTD Charges Total YTD Payments divided by Total YTD Charges less YTD Contractual Adjustments Insurance A/R greater than 90 days divided by Total Insurance A/R Indicates how long it takes to convert a claim into cash. Monthly Should be downward trend- Less than 30 Indicates proportion of charges that are converted to cash. Monthly Should be upward trend. Indicates effectiveness of collection efforts on potential dollars, including point of service payments. Monthly Low proportion indicates that accounts are collected effectively. Monthly Should be upward trend. 96% or greater. Should be downward trend- Less than 10%

47 Measuring Revenue Cycle Performance


48 Measuring Revenue Cycle Performance $140, Month Charges Adjustments Payments Feb-12 $ 52, $31, $47, Mar-12 $ 86, $37, $48, Apr-12 $105, $39, $54, May-12 $ 98, $46, $60, Jun-12 $ 96, $36, $47, Jul-12 $ 98, $51, $68, Aug-12 $ 99, $38, $53, Sep-12 $114, $31, $46, Oct-12 $120, $63, $78, Nov-12 $ 85, $41, $55, Dec-12 $ 99, $47, $60, Jan-13 $117, $47, $64, Feb-13 $ 84, $35, $47, $120, $100, $80, $60, $40, $20, $- Analyze charges, adjustments & payments monthly. Correlate with practice/provider production. Charges Adjustments Payments

 Date of Coding to Date of")
49 Measuring Revenue Cycle Performance Start here tracking results Date of Claim submission to Payer Adjudication Date of Payer Adjudication to Patient Statement/Denial Worked and resubmitted DOS to date of documentation (DOD) Date of Charge Entry to Claim Submission Total Lag Time from DOS to Fully Adjudicated Date of Documentation to date of coding (if not utilizing CAC) Date of Coding to Date of Charge Entry

50 Physicians Role in Revenue Cycle Excellence Where Do You Fit In?
51 Effective Revenue Cycles Are No Accident What Does an Effective Revenue Cycle Mean? Communication Efficient processes Effective procedures Optimal systems utilization Effective use of resources Attentive management
52 Effective Revenue Cycles Are No Accident Maximum return on investment in accounts receivables. More Revenue. More Quickly!
53 Anders Health Care Services Anders Health Care Services optimizes staff, resources and revenue for hospitals and physicians by offering solutions and direction to complex practice management issues. We provide an integrated approach from the financial, operational, compliance and strategic perspectives.
54 Anders Health Care Services Jerrie K. Weith, MBA, FHFMA, CMPE, CMOM
Understanding Benchmarking for Healthcare Organizations
 Understanding Benchmarking for Healthcare Organizations Melissa M. Meeker, CPA MSA, Accounting, Franklin University Tina R. Wright, CPA, CHBC BSBA, Accounting, The Ohio State University Benchmarking Basics
IMPROVING THE FINANCIAL HEALTH OF YOUR PRACTICE. D e b b i e R i c c i a n d D o n n a R u s s o
 IMPROVING THE FINANCIAL HEALTH OF YOUR PRACTICE D e b b i e R i c c i a n d D o n n a R u s s o Please silence or turn off all electronic devices at this time. THANK YOU Agenda Key Performance Indicators
Effective Billing and Collections. Copyright 2017 State Volunteer Mutual Insurance Company
 Effective Billing and Collections 1 Copyright 2017 State Volunteer Mutual Insurance Company Changing Environment Shift in responsibility, payment models and adjustments High deductible health plans (HDHP)
Point of Service Collections
 The Front-End Revenue Cycle Specialists Point of Service Collections Paul Shorrosh, MSW, MBA, CHAM CEO & Founder, AccuReg POS Collections What are we trying to do? Customers want three things: Product
EFFECTIVE REVENUE CYCLE MANAGEMENT IN YOUR NETWORK
 EFFECTIVE REVENUE CYCLE MANAGEMENT IN YOUR NETWORK 1 INTRODUCTION Revenue Cycle Management has become an even more complex issue with declining reimbursements, implementation of Electronic Health Records,
Physician groups what goes wrong, how do we avoid it? Subtitle: Physicians, Change, and Maximizing Employed Physician Performance
 Physician groups what goes wrong, how do we avoid it? Subtitle: Physicians, Change, and Maximizing Employed Physician Performance Thomas Ferkovic Managing Partner SS&G Healthcare Chicago tferkovic@ssandg.com
Benchmarking the Revenue Cycle Top 10 Revenue Cycle Best Practice Solutions
 Benchmarking the Revenue Cycle Top 10 Revenue Cycle Best Practice Solutions Sharon A. Shover, CPC, CEMC 2650 Eastpoint Parkway, Suite 300 Louisville, Kentucky 40223 502.992.3511 sshover@blueandco.com Revenue
Unlocking and Using Practice Performance Intelligence
 Unlocking and Using Practice Performance Intelligence Patti Peets, Director, Revenue Cycle Management CareCloud, Miami Patti Peets does not have a financial conflict to report at this time. 1 Learning
METHOD TO THE MADNESS TODAY S PRESENTER LEARNING OUTCOMES HTH FL Boot Camp. 10 payment collection strategies that work
 METHOD TO THE MADNESS METHOD TO THE MADNESS 10 payment collection strategies that work 10 payment collection strategies that work Visit availity.com to download the full e-book TODAY S PRESENTER Colleen
The Front-End Revenue Cycle Specialists. The Dilution of the Dollar
 The Front-End Revenue Cycle Specialists The Dilution of the Dollar The Silent Revenue Cycle Killer You are likely losing up to 40 cents on every dollar before you even render any patient services. By the
Centricity Healthcare User Group CHUG
 GE Healthcare Centricity Healthcare User Group CHUG Jason Whiteaker, Director Sales Engineering RemitDATA Terri Cipriano, HCM Analyst GE Healthcare Joe Heald, EDI Services Manager, GE Healthcare Imagination
Management Reports. June for PREPARED BY POWERED BY
 Management Reports for June 217 PREPARED BY POWERED BY Contents 1. Management Reports Cashflow Forecast Actual vs Budget P&L Forecast Where Did Our Money Go? Net Worth 2. Understanding your Reports 3.
NR614: Foundations of Health Care Economics, Accounting and Financial Management
 NR614: Foundations of Health Care Economics, Accounting and Financial Management WEEK 7: Budgeting SLIDE 1: Week 7: Week Seven Sample Problem: Budgeting... There is one sample problem provided in week
Financial Statements and Key Metrics No Margin, No Mission
 Financial Statements and Key Metrics No Margin, No Mission Physician Leadership Institute March 7, 2015 Brian M. McCook, CPA Learning Objectives Overview of Financial Statements Profit and Loss Balance
ACA Reporting E-File Errors, Penalties & Exchange Notices
 ACA Reporting E-File Errors, Penalties & Exchange Notices Agenda 1). Who is ACA Reporting Service? (quickly) 2). Setting the ACA Reporting Stage 3). The Process Leading up to E-Filing 4). E-Filing through
Financial Statements. Kit Carson County Health Service District. October 2018
 Financial Statements Kit Carson County Health Service District Kit Carson County Health Service District Rooted in excellence. Growing in trust. FINANCIAL STATEMENT SUMMARY Income Statement Summary Kit
Benchmarking the Revenue Cycle Top 10 Revenue Cycle Best Practice Solutions
 Benchmarking the Revenue Cycle Top 10 Revenue Cycle Best Practice Solutions Sharon A. Shover, CPC, CEMC 2650 Eastpoint Parkway, Suite 300 Louisville, Kentucky 40223 502.992.3511 sshover@blueandco.com Revenue
Financial & Business Highlights For the Year Ended June 30, 2017
 Financial & Business Highlights For the Year Ended June, 17 17 16 15 14 13 12 Profit and Loss Account Operating Revenue 858 590 648 415 172 174 Investment gains net 5 162 909 825 322 516 Other 262 146
The Financial Reporting Checklists Every Firm should be Doing
 The Financial Reporting Checklists Every Firm should be Doing Presented by Rebecca Kelley, CPA Maggie Kennedy, CPA FM34 4/5/2017 3:00 PM - 4:15 PM The handouts and presentations attached are copyright
Managed Care Readiness Training Series: Revenue Cycle Management 3 rd Learning Community Claim Submission and Payer follow-up
 Managed Care Readiness Training Series: Revenue Cycle Management 3 rd Learning Community Claim Submission and Payer follow-up Claim Submission and Payer follow-up Presenter: David Wawrzynek MS, MBA Managed
SUBJECT: Financial Statement and Fund Analysis for November & December 2006
 TAMPA WATER Supplying Water To The Region AGENDA ITEM IS DATE: February 1, 27 TO: J etr y L. Maxwell, General Manager FROM: Koni M. Cassini, Director of Finance and Administration" SUBJECT: Financial Statement
Sponsored by: Approved instructor
 Sponsored by: Approved About the Speaker Nancy M Enos, FACMPE, CPMA CPC-I, CEMC is an independent consultant with the MGMA Health Care Consulting Group. Mrs. Enos has 40 years of experience in the practice
Healthy Michigan Plan signing, September 2013
 Healthy Michigan Plan signing, September 2013 Richard Hirth, Ph.D. Professor & Chair Department of Health Management & Policy National Significance of Michigan Medicaid Expansion Model for compromise as
Report on the Economic Crisis: Initial Impact on Hospitals
 Report on the Economic Crisis: Initial Impact on Hospitals November 2008 Executive Summary The capital crunch is making it difficult and expensive for hospitals to finance facility and technology needs.
Affordable Care Act Implementation Alert
 CONTENTS > What is the PCORI Fee? What is the purpose of the PCORI fee? > What are the reporting and payment requirements? > How is the PCORI fee calculated? > What is the role of AmeriHealth Administrators?
Beginning Date: January 2016 End Date: June Managers in Zephyr: Benchmark: Morningstar Short-Term Bond
 Beginning Date: January 2016 End Date: June 2018 Managers in Zephyr: Benchmark: Manager Performance January 2016 - June 2018 (Single Computation) 11200 11000 10800 10600 10400 10200 10000 9800 Dec 2015
Beginning Date: January 2016 End Date: September Managers in Zephyr: Benchmark: Morningstar Short-Term Bond
 Beginning Date: January 2016 End Date: September 2018 Managers in Zephyr: Benchmark: Manager Performance January 2016 - September 2018 (Single Computation) 11400 - Yorktown Funds 11200 11000 10800 10600
Yang Jiang Sonji Harrington
 Yang Jiang Sonji Harrington NC TIDE, November 2016 Sonji Harrington NC TIDE, November 2016 dash board /'dashbôrd/ noun The panel facing the driver of a vehicle or the pilot of an aircraft, containing instruments
Dashboards Tools May 14 & 15, 2013 NonProfit Learning Center Discussion Leader: Kay Sohl
 Dashboards Tools May 14 & 15, 2013 NonProfit Learning Center Discussion Leader: Kay Sohl Dashboards Concise graphic presentations of key indicators Provide useful comparisons to visualize progress over
IQPR KPI Summary April 2018
 Workforce Finance Quality Performance IQPR KPI Summary April 218 Key Performance Indicator Feb 18 Mar 18 Apr 18 YTD** Our Trust Key Performance Indicator Feb 18 Mar 18 Apr 18 YTD** Incident Reporting Trend*
Financial Report As of June 30, 2017
 Financial Report As of Adventist HealthCare Financial Highlights For Period Ended June 30,2017 PROFITABILITY SUMMARY (in thousands) Month Year-to-Date Prior Year Budget Actual Entities Actual Budget Prior
XML Publisher Balance Sheet Vision Operations (USA) Feb-02
 Feb-02") Page:1 Apr-01 May-01 Jun-01 Jul-01 ASSETS Current Assets Cash and Short Term Investments 15,862,304 51,998,607 9,198,226 Accounts Receivable - Net of Allowance 2,560,786
Page:1 Apr-01 May-01 Jun-01 Jul-01 ASSETS Current Assets Cash and Short Term Investments 15,862,304 51,998,607 9,198,226 Accounts Receivable - Net of Allowance 2,560,786
INTERMEDIATE ADMINISTRATIVE SIMPLIFICATION CENTERS FOR MEDICARE & MEDICAID SERVICES. Online Guide to: ADMINISTRATIVE SIMPLIFICATION
 02 INTERMEDIATE» Online Guide to: CENTERS FOR MEDICARE & MEDICAID SERVICES Last Updated: February 2014 TABLE OF CONTENTS INTRODUCTION: ABOUT THIS GUIDE... i About Administrative Simplification... 2 Why
UWMC FY17 FINANCIAL PERFORMANCE. April 24, 2017
 UWMC FY17 FINANCIAL PERFORMANCE April 24, 2017 FY17 RESULTS THROUGH FEBRUARY UWMC has experienced significant financial losses YTD through February. Pressure from governmental as well as commercial payers
Measures of Performance
 Measures of Performance The Credit Research Foundation 4 th Edition MEASURES OF PERFORMANCE CREDIT, COLLECTIONS, & ACCOUNTS RECEIVABLE By: Rob Olsen, CCE The Credit Research Foundation acknowledges its
The Road to Value. Aric R. Sharp, MHA, CMPE, FACHE Vice President Accountable Care UnityPoint Health February 3, 2017
 The Road to Value Aric R. Sharp, MHA, CMPE, FACHE Vice President Accountable Care UnityPoint Health February 3, 2017 1,500 Physicians UnityPoint Clinic 17 hospitals + 15 rural network hospitals 35,000
Co pays and Deductibles: Polices and Procedures
 Co pays and Deductibles: Polices and Procedures :, Senior Operations and Management Consultant M.T.M. Services E-mail: michael.flora@mtmservices.org Web Site: www.mtmservices.org 1 MTM Publication Ordering
Review of Registered Charites Compliance Rates with Annual Reporting Requirements 2016
 Review of Registered Charites Compliance Rates with Annual Reporting Requirements 2016 October 2017 The Charities Regulator, in accordance with the provisions of section 14 of the Charities Act 2009, carried
QUESTION 2. QUESTION 3 Which one of the following is most indicative of a flexible short-term financial policy?
 QUESTION 1 Compute the cash cycle based on the following information: Average Collection Period = 47 Accounts Payable Period = 40 Average Age of Inventory = 55 QUESTION 2 Jan 41,700 July 39,182 Feb 18,921
TOP 10 METRICS TO MAXIMIZE YOUR PRACTICE S REVENUE
 TOP 10 METRICS TO MAXIMIZE YOUR PRACTICE S REVENUE Billing and Reimbursement for Physician Offices, Ambulatory Surgery Billings & Reimbursements Here are the Top Ten Metrics. The detailed explanations
Avocado Regional Composite. South Central Region
 Avocado Regional Composite South Central Region January March: 2009 vs. 2010 1 Methodology Sales and Market Data is obtained using CAST (Category Avocado Sales Trend) Information Resources Inc. gathers
PUBLISHED BY: CareCloud Corporation 5200 Blue Lagoon Drive, Suite 900 Miami, FL Phone: (877)
") PUBLISHED BY: CareCloud Corporation 5200 Blue Lagoon Drive, Suite 900 Miami, FL 33126 Phone: (877) 342-7519 Email: hello@carecloud.com Copyright 2015 CareCloud Corporation. All rights reserved. No part
PUBLISHED BY: CareCloud Corporation 5200 Blue Lagoon Drive, Suite 900 Miami, FL 33126 Phone: (877) 342-7519 Email: hello@carecloud.com Copyright 2015 CareCloud Corporation. All rights reserved. No part
Implementing a New Compensation Plan How did it go? Progress and Pitfalls
 Implementing a New Compensation Plan How did it go? Progress and Pitfalls J. Michael Scalzone, MD, MHCM Executive Vice President Medical Affairs The Guthrie Clinic Presentation Overview About The Guthrie
Avocado Regional Composite. South Central Region
 Avocado Regional Composite South Central Region January September: 2009 vs. 2010 1 Methodology Sales and Market Data is obtained using CAST (Category Avocado Sales Trend) Information Resources Inc. gathers
Cook County Health & Hospitals System. Finance Committee Meeting October Ekerete Akpan CFO
 Cook County Health & Hospitals System Finance Committee Meeting October 2018 Ekerete Akpan CFO 1 CCHHS Systems-wide Financial Statements 2 Agenda 1. System-wide Financials & Stats a. Financials b. Observations
Ethel Owen - Administrator Arthritis & Rheumatology Associates of Palm Beach, Inc. West Palm Beach, FL
 Ethel Owen - Administrator Arthritis & Rheumatology Associates of Palm Beach, Inc. West Palm Beach, FL Practice Structure Office Management Physician Encounter Billing Office Physicians & Administrator
Research Accounting & Analysis University of Washington
 Research Accounting & Analysis Grant & Contract Accounting? Management Accounting & Analysis Operational Performance Dashboard for November 2 Quarter 2 FY 2 (October - December 2) Grant and Contract Accounting
Effective Budgeting and Cost Control. Contents are subject to change. For the latest updates visit
 Effective Budgeting and Cost Page 1 of 9 Why Attend ning and budgeting are must-have skills for all professionals regardless of their function or managerial level. This course covers the concept of budgeting
Executive Summary. July 17, 2015
 Executive Summary July 17, 2015 The Revenue Estimating Conference adopted interest rates for use in the state budgeting process. The adopted interest rates take into consideration current benchmark rates
Spheria Australian Smaller Companies Fund
 29-Jun-18 $ 2.7686 $ 2.7603 $ 2.7520 28-Jun-18 $ 2.7764 $ 2.7681 $ 2.7598 27-Jun-18 $ 2.7804 $ 2.7721 $ 2.7638 26-Jun-18 $ 2.7857 $ 2.7774 $ 2.7690 25-Jun-18 $ 2.7931 $ 2.7848 $ 2.7764 22-Jun-18 $ 2.7771
The 2017 Texas MCO environment What you need to know to survive and thrive
 The 2017 Texas MCO environment What you need to know to survive and thrive Carrie Stroud Consultant/Owner, CC Consulting Danny King Director of Reimbursement, StoneGate Senior Living Jason Jones Chief
HUD NSP-1 Reporting Apr 2010 Grantee Report - New Mexico State Program
 HUD NSP-1 Reporting Apr 2010 Grantee Report - State Program State Program NSP-1 Grant Amount is $19,600,000 $9,355,381 (47.7%) has been committed $4,010,874 (20.5%) has been expended Grant Number HUD Region
The Revenue Cycle Contract Maze. Sandra J Gubbine, CPA, MBA, FHFMA, DBA AVP, Revenue Cycle
 The Revenue Cycle Contract Maze Sandra J Gubbine, CPA, MBA, FHFMA, DBA AVP, Revenue Cycle Bio AVP, Revenue Cycle In Healthcare since 1995 Hospital Revenue Cycle since 2001 CPA, MBA, FHFMA, DBA Revenue
Trade Finance, Letters of Credit and Bank Guarantees
 Trade Finance, Letters of Credit and Bank Guarantees Page 1 of 10 Why Attend Securing company s assets while transacting with local and international customers is critical for the success and sustainability
Making the Numbers Work
 Making the Numbers Work Using Data and Metrics to Improve Programs and Processes Sutter Health Who Are We? Sutter Health is a not-for-profit health system Provides health care services in more than 0 Northern
Business & Financial Services December 2017
 Business & Financial Services December 217 Completed Procurement Transactions by Month 2 4 175 15 125 1 75 5 2 1 Business Days to Complete 25 Jan Feb Mar Apr May Jun Jul Aug Sep Oct Nov Dec 217 Procurement
Performance Highlights. Prepared for. MEGALO Hospitality. CLIENT Restaurant Client. Period. Jun Created on 10th June 2017
 Performance Highlights Prepared for CLIENT Restaurant Client Period Jun 2017 Created on 10th June 2017 Executive Summary OBSERVATIONS Comparing Jun 2017 with the same month last year Jun 2016. REVENUE
Winning Under Reform: Strategies to Optimize your Revenue Cycle in 2013
 Winning Under Reform: Strategies to Optimize your Revenue Cycle in 2013 HFMA Kentucky Chapter March 15, 2013 PNC Healthcare Advisory Services Today s Presentation Goals 1. Provide some background on U.S.
WESTWOOD LUTHERAN CHURCH Summary Financial Statement YEAR TO DATE - February 28, Over(Under) Budget WECC Fund Actual Budget
 Budget WECC Fund Actual Budget") WESTWOOD LUTHERAN CHURCH Summary Financial Statement YEAR TO DATE - February 28, 2018 General Fund Actual A B C D E F WECC Fund Actual Revenue Revenue - Faith Giving 1 $ 213 $ 234 $ (22) - Tuition $ 226
WESTWOOD LUTHERAN CHURCH Summary Financial Statement YEAR TO DATE - February 28, 2018 General Fund Actual A B C D E F WECC Fund Actual Revenue Revenue - Faith Giving 1 $ 213 $ 234 $ (22) - Tuition $ 226
Accounts Receivable Risk Analysis for Acquisitions Due Diligence Business Rescue
 Jan 2015 Accounts Receivable Risk Analysis for Acquisitions Due Diligence Business Rescue 1 Contents 1. Introduction 2. Sample Historical Data Target Company 3. Traditional Analysis 4. DSOB Risk Analysis
THE B E A CH TO WN S O F P ALM B EA CH
 THE B E A CH TO WN S O F P ALM B EA CH C OU N T Y F LO R I D A August www.luxuryhomemarketing.com PALM BEACH TOWNS SINGLE-FAMILY HOMES LUXURY INVENTORY VS. SALES JULY Sales Luxury Benchmark Price : 7,
Financial Markets 11-1
 Financial Markets Laurent Calvet calvet@hec.fr John Lewis john.lewis04@imperial.ac.uk Topic 11: Measuring Financial Risk HEC MBA Financial Markets 11-1 Risk There are many types of risk in financial transactions
Managing AR to Keep the Cash Flowing in Ambulatory Care Settings Waystar, Inc. All Rights Reserved.
 Managing AR to Keep the Cash Flowing in Ambulatory Care Settings 2018 Waystar, Inc. All Rights Reserved. Our Client Focus The combination of Navicure and ZirMed uniquely positions Waystar to simplify and
TERMS OF REFERENCE FOR THE INVESTMENT COMMITTEE
 I. PURPOSE The purpose of the Investment Committee (the Committee ) is to recommend to the Board the investment policy, including the asset mix policy and the appropriate benchmark for both ICBC and any
Alameda Health System
 Alameda Health System Status Report Long Term Financial Planning Compliance with the Permanent Agreement March 9, 2015 Dan Boggan, Jr., Interim CEO David Cox, CFO 1 AHS Monthly Report Cash, Accounts Payable,
International Financial Reporting Standards (IFRS) and 2019 Updates
 and 2019 Updates") International Financial Reporting Standards (IFRS) and 2019 Updates Page 1 of 11 Why Attend Our 'International Financial Reporting Standards (IFRS) and 2019 Updates' course will help build the knowledge
International Financial Reporting Standards (IFRS) and 2019 Updates Page 1 of 11 Why Attend Our 'International Financial Reporting Standards (IFRS) and 2019 Updates' course will help build the knowledge
Common stock prices 1. New York Stock Exchange indexes (Dec. 31,1965=50)2. Transportation. Utility 3. Finance
2. Transportation. Utility 3. Finance") Digitized for FRASER http://fraser.stlouisfed.org/ Federal Reserve Bank of St. Louis 000 97 98 99 I90 9 9 9 9 9 9 97 98 99 970 97 97 ""..".'..'.."... 97 97 97 97 977 978 979 980 98 98 98 98 98 98 987 988
Digitized for FRASER http://fraser.stlouisfed.org/ Federal Reserve Bank of St. Louis 000 97 98 99 I90 9 9 9 9 9 9 97 98 99 970 97 97 ""..".'..'.."... 97 97 97 97 977 978 979 980 98 98 98 98 98 98 987 988
Research Accounting & Analysis University of Washington Operational Performance Dashboard
 Research Accounting & Analysis University of Washington Operational Performance Dashboard September 26 Quarter 1 - Fiscal Year 7 Grant and Contract Accounting Mission As a professional accounting team,
Improve your bottom line by reducing claim denials. Presented by: Mark R. Anderson, FHIMSS, CPHIMS CEO of AC Group, Inc.
 Improve your bottom line by reducing claim denials Presented by: Mark R. Anderson, FHIMSS, CPHIMS CEO of AC Group, Inc. Today s agenda Mark Anderson webinar presentation Polling and Q&A session Sponsor
Summary of contents. Operating environment. Levers of institutional growth. Re-affirming the Fund s Mission. Financial Highlights.
 Summary of contents Operating environment Levers of institutional growth Re-affirming the Fund s Mission Financial Highlights The future The Operating Environment 7.00% 6.00% 5.00% 4.00% 3.00% A calm assurance
Cook County Health and Hospitals System. Financial Statements for the Month Ended June 30, 2010
 Cook County Health and s System Financial Statements for the Month Ended June 30, 2010 As of August 10, 2010 Page 1 of 10 Page 1 of 17 Index 1. Mission Statement 2. Attestation Statement 3. Management
5 Steps to Reducing Administrative Costs in Physician Group Practices (A05)
") 5 Steps to Reducing Administrative Costs in Physician Group Practices (A05) Presenters: Kenneth Willman, Director Provider Interface, Humana Melissa Lukowski, Director Outreach, athenahealth Mary Kelley,
5 Steps to Reducing Administrative Costs in Physician Group Practices (A05) Presenters: Kenneth Willman, Director Provider Interface, Humana Melissa Lukowski, Director Outreach, athenahealth Mary Kelley,
Cook County Health & Hospitals System. Finance Committee Meeting November Ekerete Akpan CFO
 Cook County Health & Hospitals System Finance Committee Meeting November 2018 Ekerete Akpan CFO 1 Agenda 1. System-wide Financials & Stats a. Financials b. Observations c. Financial / Revenue Cycle metrics
Beginning Date: January 2016 End Date: February Managers in Zephyr: Benchmark: Morningstar Short-Term Bond
 Beginning Date: January 2016 End Date: February 2018 Managers in Zephyr: Benchmark: Manager Performance January 2016 - February 2018 (Single Computation) 11200 11000 10800 10600 10400 10200 10000 9800
Advanced Budgeting Workshop. Contents are subject to change. For the latest updates visit
 Advanced Budgeting Workshop Page 1 of 8 Why Attend 'Advanced Budgeting Workshop' is the second level course in budgeting after Meirc's 'Effective Budgeting and Cost ' course. It goes beyond the theory
Claim Submission. Molina Healthcare of Florida Inc. Marketplace Provider Manual
 Section 9. Claims As a contracted provider, it is important to understand how the claims process works to avoid delays in processing your claims. The following items are covered in this section for your
Knowing When to Fold Them: Advice for Maximizing Revenue Cycle Performance
 Judy Tutino Business & Medical Specialist TSI 170 Third St. Old Forge, Pa. 18518 Phone- 570-451-1828 www.tsico.com Cell- 570-840-3961 Fax- 570-457-7427 judy.tutino@transworldsystems.com Knowing When to
Division of Bond Finance Interest Rate Calculations. Revenue Estimating Conference Interest Rates Used for Appropriations, including PECO Bond Rates
 Division of Bond Finance Interest Rate Calculations Revenue Estimating Conference Interest Rates Used for Appropriations, including PECO Bond Rates November 16, 2018 Division of Bond Finance Calculation
Constructing a Cash Flow Forecast
 Constructing a Cash Flow Forecast Method and Worked Example A cash flow forecast shows the estimates of the timing and amounts of cash inflows and outflows over a period of time. The sections of a cash
PHOENIX ENERGY MARKETING CONSULTANTS INC. HISTORICAL NATURAL GAS & CRUDE OIL PRICES UPDATED TO July, 2018
 Jan-01 $12.9112 $10.4754 $9.7870 $1.5032 $29.2595 $275.39 $43.78 $159.32 $25.33 Feb-01 $10.4670 $7.8378 $6.9397 $1.5218 $29.6447 $279.78 $44.48 $165.68 $26.34 Mar-01 $7.6303 $7.3271 $5.0903 $1.5585 $27.2714
R o l l i n g F o r e c a s t i n g :
 R o l l i n g F o r e c a s t i n g : A S t r a t e g y f o r E f f e c t i v e F i n a n c i a l M a n a g e m e n t Debra Miller Vice President Client Success January 22, 2016 Discussion Topics Overview
Factor Leave Accruals. Accruing Vacation and Sick Leave
 Factor Leave Accruals Accruing Vacation and Sick Leave Factor Leave Accruals As part of the transition of non-exempt employees to biweekly pay, the UC Office of the President also requires standardization
Board of Directors October 2018 and YTD Financial Report
 Board of Directors October 2018 and YTD Financial Report Consolidated Financial Results Operating Margin October ($30,262) $129,301 ($159,563) Year-to-date $292,283 $931,358 ($639,076) Excess of Revenue
CIGNA FUNDING OPTIONS
 CIGNA FUNDING OPTIONS How the right choice can help your clients make the most of their health plans Lauren Stoddard Cigna Self-funding Product Manager Gerard Sessa Cigna New Business Manager FOR AGENT/BROKER
Research Accounting & Analysis Grant & Contract Accounting? Management Accounting & Analysis
 Research Accounting & Analysis Grant & Contract Accounting? Management Accounting & Analysis Operational Performance Dashboard for August 20 Quarter 3 FY 20 (April - June 20) Grant and Contract Accounting
HIPIOWA - IOWA COMPREHENSIVE HEALTH ASSOCIATION Unaudited Balance Sheet As of July 31
 Unaudited Balance Sheet As of July 31 Total Enrollment: 407 Assets: Cash $ 9,541,661 $ 1,237,950 Invested Cash 781,689 8,630,624 Premiums Receivable 16,445 299,134 Prepaid 32,930 34,403 Assessments Receivable
HIPIOWA - IOWA COMPREHENSIVE HEALTH ASSOCIATION Unaudited Balance Sheet As of January 31
 Unaudited Balance Sheet As of January 31 Total Enrollment: 371 Assets: Cash $ 1,408,868 $ 1,375,117 Invested Cash 4,664,286 4,136,167 Premiums Receivable 94,152 91,261 Prepaid 32,270 33,421 Assessments
BANNER HEALTH Investor Conference Call
 BANNER HEALTH Investor Conference Call Year Ended December 31, 2012 and Quarter Ended March 31, 2013 May 30, 2013 Dennis Dahlen, Senior Vice President / Chief Financial Officer Banner Health Snapshot 23
Performance Report: August 2018
 Performance Report: August 218 Reporting Our Performance Annual Cycle Quarterly: Board Report Strategic Measures / Surveys Operational Performance / Risk / Internal Audit / Business Plan Delivery /Finance
Review of Membership Developments
 RIPE Network Coordination Centre Review of Membership Developments 7 October 2009/ GM / Lisbon http://www.ripe.net 1 Applications development RIPE Network Coordination Centre 140 120 100 80 60 2007 2008
1.2 The purpose of the Finance Committee is to assist the Board in fulfilling its oversight responsibilities related to:
 Category: BOARD PROCESS Title: Terms of Reference for the Finance Committee Reference Number: AB-331 Last Approved: February 22, 2018 Last Reviewed: February 22, 2018 1. PURPOSE 1.1 Primary responsibility
Finance and Budgeting for NonFinance Professionals. Contents are subject to change. For the latest updates visit
 Finance and Budgeting for NonFinance Professionals Page 1 of 10 Why Attend To succeed at any employment level and position, knowledge of basic financial principles is critical. The course transforms financial
Surviving The Storm 10/6/2015. Physicians Are Feeling the Pain
 Surviving The Storm REMAINING AN INDEPENDENT PHYSICIAN PRACTICE Physicians Are Feeling the Pain Financially Squeezed Decline in reimbursement and loss of income Overhead, malpractice insurance and working
Earned Value Management An Overview March 2014
 Earned Value Management An Overview March 2014 SAVE International Cascadia Chapter Introduction What is Earned Value? Why is Earned Value important? What is required? Earned Value Definitions & Process
Will Boyd and Lindsay Campbell, BAYADA Home Health Care. Copyright
 Will Boyd and Lindsay Campbell, BAYADA Home Health Care Copyright 2017. 1 TODAY S SPEAKERS Will Boyd Director of Home Health Reimbursement Services BAYADA Home Health Lindsay Campbell Manager, Business
Fiscal Year 2018 Project 1 Annual Budget
 Fiscal Year 2018 Project 1 Annual Budget Table of Contents Table Page Summary 3 Summary of Costs Table 1 4 Treasury Related Expenses Table 2 5 Summary of Full Time Equivalent Table 3 6 Positions Cost-to-Cash
NH Community Behavioral Health Association Workforce Challenges and Opportunities
 NH Community Behavioral Health Association Workforce Challenges and Opportunities January 10, 2018 Prepared by Patrick Miller, Founder and Principal Pero Consulting Group, LLC 1 Topics of Discussion 1.
OTHER DEPOSITS FINANCIAL INSTITUTIONS DEPOSIT BARKAT SAVING ACCOUNT
 WEIGHTAGES JAN FEB MAR APR MAY JUN JUL AUG SEPT OCT NOV DEC ANNOUNCEMENT DATE 19.Dez.14 27.Jän.15 24.Feb.15 26.Mär.15 27.Apr.15 26.Mai.15 25.Jun.15 28.Jul.15 26.Aug.15 23.Sep.15 27.Okt.15 25.Nov.15 MUDARIB
The benefits of electronic claims submission improve practice efficiencies
 The benefits of electronic claims submission improve practice efficiencies Electronic claims submission vs. manual claims submission An electronic claim is a paperless patient claim form generated by computer
Performance Highlights
 Performance Highlights Prepared for Sample Hotel Period Jun 2017 Created on 9th August 2017 Executive Summary OBSERVATIONS Comparing Jun 2017 with the same month last year Jun 2016. REVENUE Total Revenue