Statistical Yearbook 2011
|
|
|
- Cameron Kennedy
- 5 years ago
- Views:
Transcription

1 STATISTICAL YEARBOOK 2011
2 Statistical Yearbook 2011
3 Introduction Statistical Yearbook 2011 Published by Statistics Denmark June th edition ISBN (internet version) ISSN (internet version) Statistical Yearbook Internet address: Editors Ulla Agerskov Tel.: Margrethe Pihl Bisgaard Tel.: Maps to which the National Survey & Cadastre own the copyright have been used with the consent of the agency. Type: Statistics Denmark, Copenhagen Only published on the Internet Photo: Torben Klint/Scanpix Statistics Denmark 2011 No part of this book may be duplicated or circulated without prior written consent from Statistics Denmark in accordance with the current Copyright Act. Exceptions are quotations; The Statistical Yearbook may be quoted when this edition is indicated as the source in accordance with good practice and to the extent that the purpose requires. Enquiries Statistics Denmark Sejrøgade 11 DK-2100 Copenhagen Ø Denmark Tel.: Internet: Statistical Yearbook 2011
4 Indledning Preface The Statistical Yearbook 2011 is a book about Denmark and the Danish people. The figures show the development of Danish society year by year. This has been the case every year since the first edition of the Statistical Yearbook, dating back to The Statistical Yearbook is the most comprehensive of the publications published by Statistics Denmark, and it reflects the majority of the statistics compiled by Statistics Denmark. Approximately 160 of the specialists working at Statistics Denmark contribute to the yearbook. Furthermore, the yearbook also includes data compiled by other Danish institutions. The yearbook is accessible, free of charge, in pdf format at Any changes or corrections made to the tables of the yearbook are also available on the website mentioned. Historical versions of the Statistical Yearbook from 1896 and up to the present day are available in pdf format at and it is possible to search for specific words. Since last year, all editions of the yearbook have been scanned and are now available at In addition, other older publications will regularly be scanned in on the website. The English version of the yearbook is available in pfd format at We always welcome any comments or suggestions from our users. Please your suggestions to mpb@dst.dk. Statistics Denmark, May 2011 Jan Plovsing / Leon Østergaard Statistisk Årbog 2011
5 Introduction Contents Denmark Page Table Geography and climate Area, nature, meteorological conditions Population and elections Population, immigrants and their descendants, fertility, mortality, names, family types, elections to the Folketing, elections to regional and municipal councils, European Parliament, referendums, elections to local church councils Education Institutes of education, students, level of education, education and employment Culture Books, newspapers, radio, TV, cinemas, libraries, museums, theatres, sports Labour market Employment, commuting, earnings, trade unions, daily cash benefits, unemployment, hours of work, labour market policy measures Social conditions, health and justice Institutions, expenditure, social assistance to children and young persons, maternity leave, child care, measures for elderly people, health insurance schemes, pension payments, sickness, criminal offences reported, convictions, imprisonment Income consumption and prices Family and personal incomes, accounts, detailed consumption expenditure, consumption of goods, beverages and tobacco, price trends, sales of real property General economic statistics Business statistics, industries, accounts statistics, workplaces, aggregate wage and salary costs, research and development Agriculture, forestry and fishing Farms, production, land use, crop production, livestock, environmental strain, official prices of barley and wheat, accounts statistics, felling, fishing vessels, fisheries Manufacturing industries Sales, production, exports, economic trends Construction and housing Building stock, building activity, residential construction, total area, construction cost index, construction employment, housing situation of population, types of dwelling, heating Statistical Yearbook 2011
6 Introduction Page Table Services sector and the information society Retail prices index, journeys, tourism and nights spent in hotels, etc., sales and exports of the services sector, ICT sectors, durable consumer goods, ICT and telephony Transport Infrastructure, means of transport, transport of passengers and goods, passenger cars, traffic accidents Environment and energy Pollution, extraction of raw materials, consumption of drinking water, pesticides, environmental taxes, energy balance sheet External trade Main figures, external trade by country, major imported and exported commodities National accounts and balance of payments Supply and demand balance, redistribution of income, sector financial accounts, output, employment, consumption, investments, gross domestic product, balance of payments Public finance Central government finance, assets and liabilities, sector accounts, taxes and duties, expenditure and revenue of general government, subsidies, Danish aid to developing countries The money and capital markets Money stock, banks and mortgage credit institutions, finance companies, shares, bonds, exchange rates Faroe Islands Greenland International statistics Annexes Faroe Islands and Greenland Summary tables of statistics showing the same subjects as those of Danish tables (e.g. area, population, incomes, fishery, construction, housing conditions, national accounts, etc.) International Statistics Area, population, fertility, mortality, education, unemployment, cultural conditions, employment, output, pollution, prices, infrastructure, gross domestic product, balance of payments Danish Industrial Classification Definitions and glossary Subject index Statistical Yearbook 2011
7 Symbols» Repetition. - Nil. Not applicable. 0 Less than 0.5 the final digit shown. 0,0 Less than 0.05 the final digit shown... Available information not conclusive or withheld owing to nondisclosure practice.... Data not available. * Provisional or estimated figures. Break in a series, which means that data above the line are not fully comparable with data below the line. Refers to a link to StatBank Denmark, where additional figures for the statistics in question are available, excluding figures covering several years. StatBank Denmark also stores information on methodology and contact persons. Refers from diagram in text section to table. Red writing Red writing refers to corrections made since the first published version of the Statistical Yearbook. Due to rounding, the figures given for individual items do not necessarily add up the corresponding totals show.

8 Statistical Yearbook is like the photo above that shows a small part of Copenhagen: A snapshot that reveals much about the Danes and the Danish society. Also, the yearbook describes the life in Denmark over time as regards population statistics, economy, culture, education, consumption etc.


")


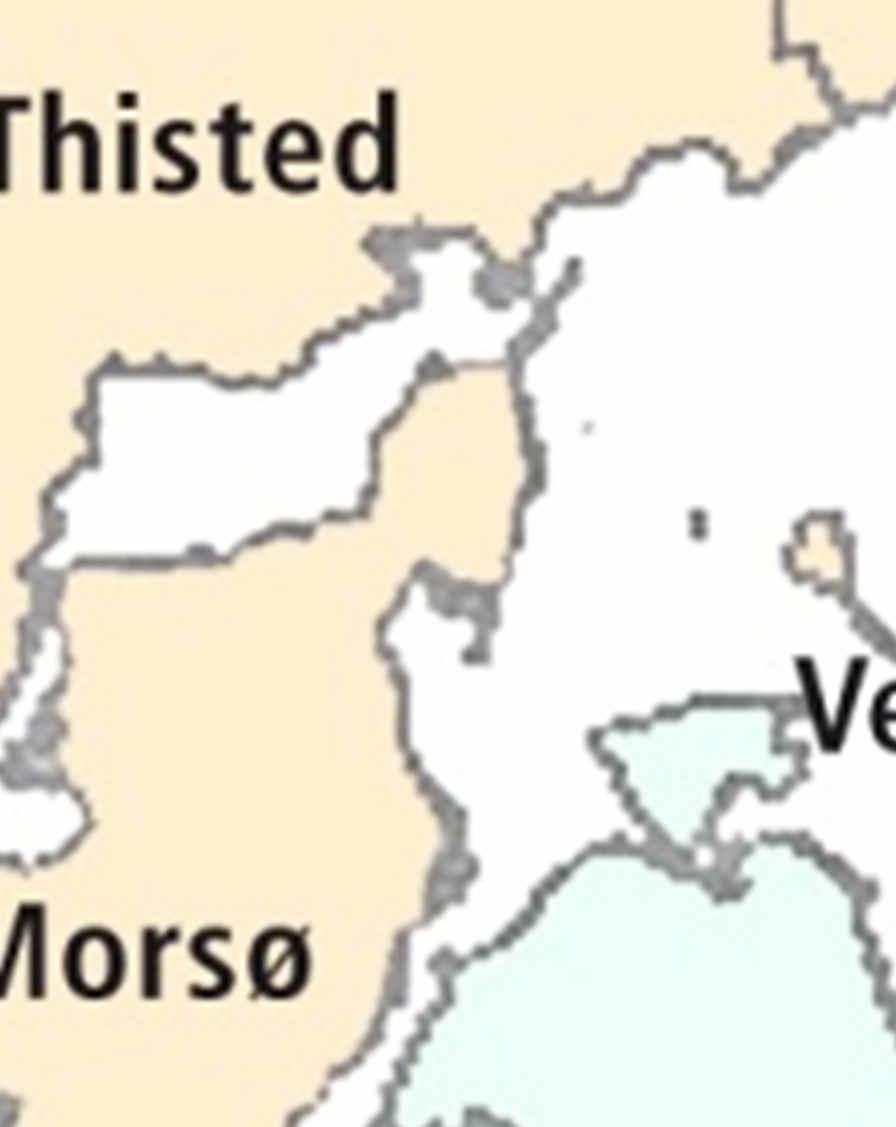
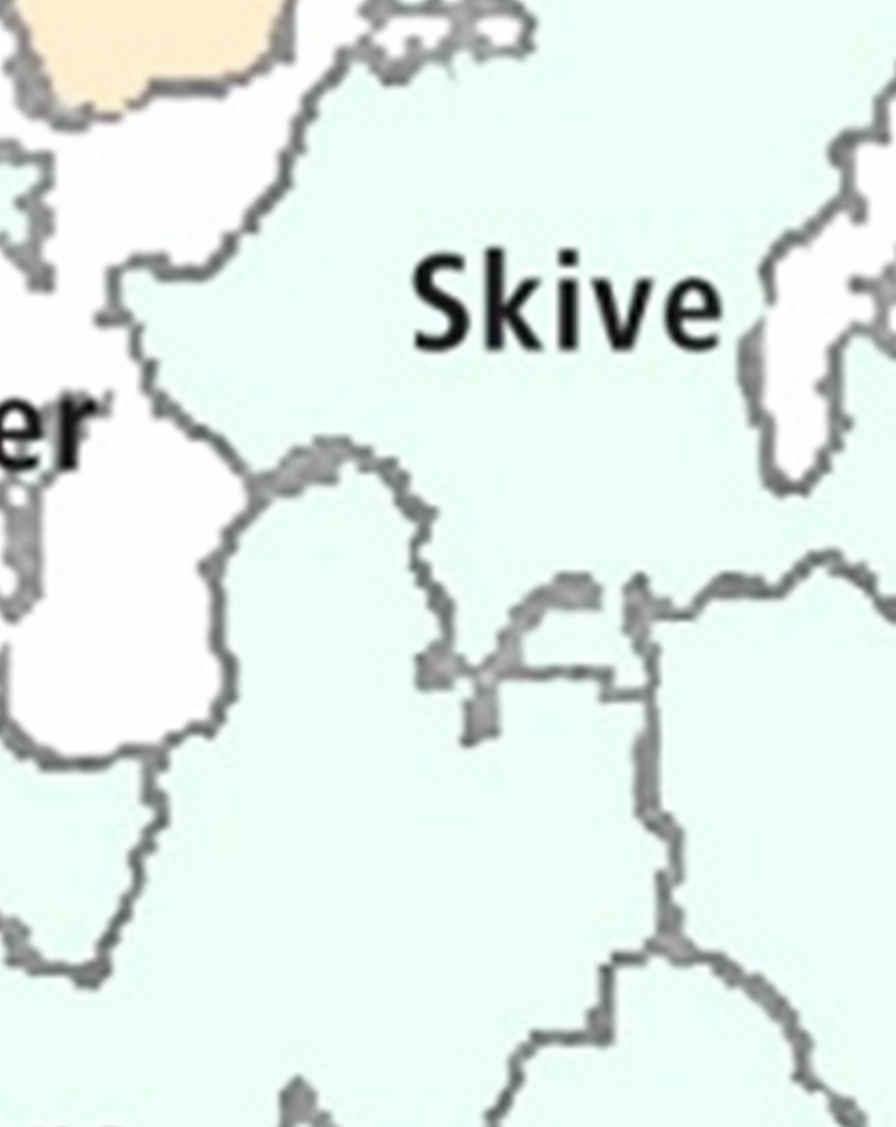
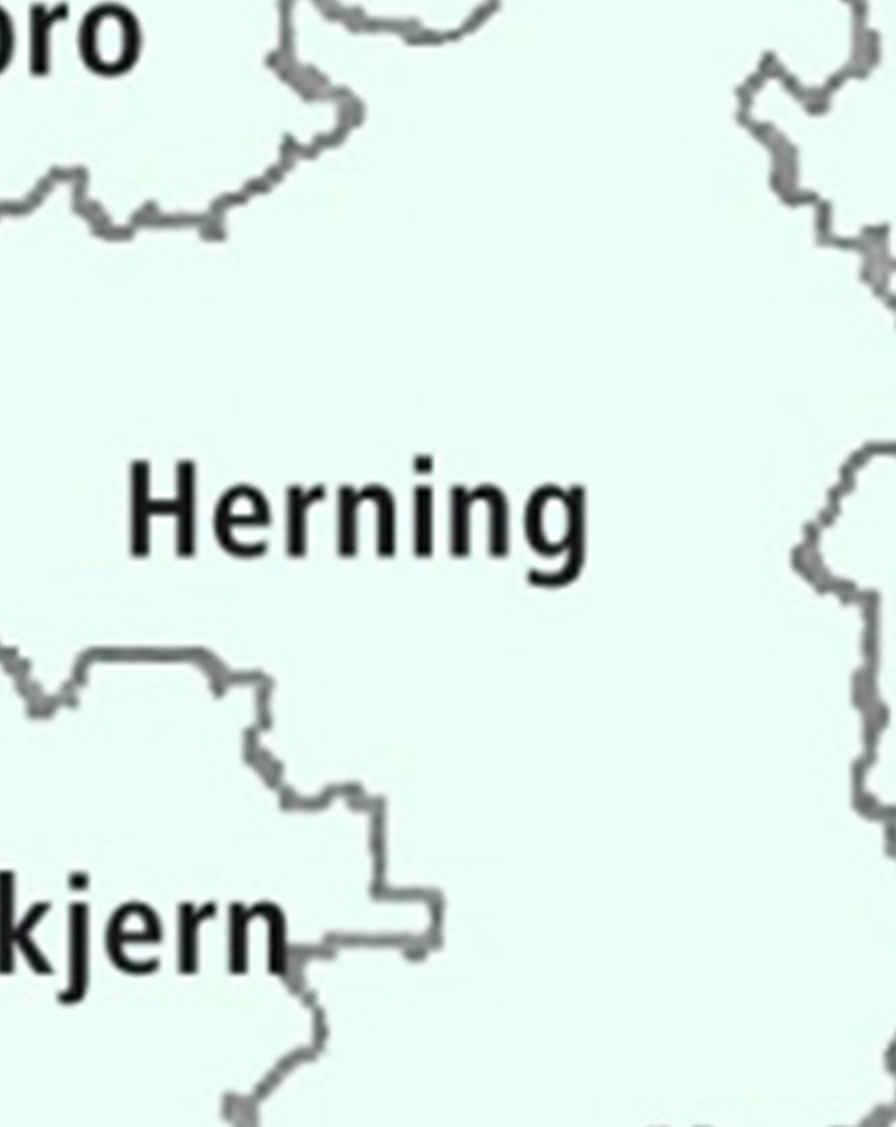


9 Microsoft Word 0H Map of Denmark NY.docx (X:100.0%, Y:100.0%) Created by Grafikhuset Publi PDF. Introduction Denmark D nmark Kort & Matrikelstyrelsen Statistical Yearbook
Statistical Yearbook 2010
 3 Statistical Yearbook 2010 4 Published by Statistics Denmark June 2010 114th edition ISBN 978-87-501-1844-2 (internet version) ISSN 1601-1058 (internet version) Statistical Yearbook Internet address:
Subject index. Figures refer to table number
 Figures refer to table number A abortions 22, 420 absence 194-195 private sector 194-195 accidental deaths 24-25, 27, 74, 103, 105-108 accidents occupational 74, 76 railway traffic 107 road traffic 24-25,
SDMX CONTENT-ORIENTED GUIDELINES LIST OF SUBJECT-MATTER DOMAINS
 SDMX CONTENT-ORIENTED GUIDELINES LIST OF SUBJECT-MATTER DOMAINS 2009 SDMX 2009 http://www.sdmx.org/ Page 2 of 10 SDMX list of statistical subject-matter domains 1 : Overview Domain 1: Demographic and social
Faroe Islands and Greenland
 1. Population of the Danish Kingdom If you want more information Since the first issue of the present Statistical Yearbook in 1896, Statistics has published figures for the. Today, the Faroe Islands and
Sheep - see agriculture Shipping: port traffic 264 Social welfare Stocks: in industry 201
 Alphabetical Index A Accidents: road 93-94 Age: at death 68 at marriage 72 at maternity 70 by nationality 16-17 by place of birth 16 of population 11-13 of travellers 14 Agriculture: accounts 185-186 area
CATALOGUE of statistical publications
 National Bureau for Statistics of the Republic of Moldova CATALOGUE of statistical publications 2008 Chisinau 2008 Contents pag. Services offered by NBS... 4 Annual publications Statistical Yearbook of
The Nordic countries in figures
 The Nordic countries in figures 09 Order your Nordic Statistica Yearbook 09 on www.norden.org The Nordic countries in figures 09 ANP 09:748 Nordic countries in figures 09 ANP 09:748 ISBN 978-92-893-1917-1
SUMMARY OF SELECTED ECONOMIC INDICATORS
 SUMMARY OF SELECTED ECONOMIC INDICATORS RECENT DATA GRAPHS HISTORICAL DATA GRAPHS P.E.I. CONSUMER PRICE INDEX P.E.I. LABOUR FORCE STATISTICS CANADA/P.E.I. GROSS DOMESTIC PRODUCT, INCOME-BASED CANADA /
Annex tables Nyt kapitel
 Nyt kapitel Table B.1 Demand, income and production 2016 2017 2018 2016 2017 2018 2016 2017 2018 DKK bn. Volume, per cent Prices, per cent Private consumption 979 1,011 1,048 1.9 2.0 2.0 0.5 1.3 1.6 Public
APPENDIX 2 TO ANNEX VIII ICELAND SCHEDULE OF SPECIFIC COMMITMENTS
 APPENDIX 2 TO ANNEX VIII ICELAND SCHEDULE OF SPECIFIC COMMITMENTS I. HORIZONTAL COMMITMENTS ALL SECTORS INCLUDED IN THIS SCHEDULE 3) All foreign investment and currency transfers must be reported to the
The CD-Direct database contains key information about all Danish VAT-registered companies.
 Contents 1 Introduction... 2 2 Available data description... 2 2.1 CD-Direct... 2 2.2 Supplementary data sources... 6 2.2.1 Statistics Denmark... 6 2.2.2 Center for Survey and Survey/Register Data... 9
TAX FACTS løggildir grannskoðarar
 TAX FACTS 2012 løggildir grannskoðarar Tax facts 2012 October 2012 www.spekt.fo The information contained in this publication is only of a general nature. Although we endeavour to provide accurate and
Private consumption 1,007 1,041 1, Residential investment
 Table B.1 Demand, income and production 2017 2018 2019 2017 2018 2019 2017 2018 2019 Volume, per cent Prices, per cent Private consumption 1,007 1,041 1,081 1.5 2.3 2.2 1.3 1.0 1.6 Public consumption 1)
Act on Statistics Denmark Unauthorized translation
 Consolidated Act No. 599 of June 22, 2000 of the Ministry of Economic and Business Affairs as subsequently amended in accordance with Consolidated Act No. 1272 of December 16, 2009 (inserted in italics)
BRIEF STATISTICS 2009
 BRIEF STATISTICS 2009 Finnish Tax Administration The Tax Administration is organized under the jurisdiction of the Ministry of Finance. The Tax Administration collects about two-thirds of the taxes and
Faroe Islands and Greenland. Faroe Islands. Syssel -border. Municipal border. National Survey and Cadastre
 Faroe Islands Syssel -border Municipal border National Survey and Cadastre (does not belong to a municipality) Municipal border National Survey and Cadastre 1 Population of the Danish Kingdom If you want
Preface. Best regards,, Abou Bakr M. El- Gendy CAPMAS President
 Preface CAPMAS is keen on providing the statistics and information that cover all the economic, social and environmental fields in the Arab Republic of Egypt so as to be issued in the appropriate time
Harmonized Indices of Consumer Prices (HICP)
") Harmonized Indices of Consumer Prices (HICP) Country-specific information on HICP compilation Author: National Statistical Institute of Sweden COUNTRY SWEDEN Last update of this document: June 2009 Last
Harmonized Indices of Consumer Prices (HICP) Country-specific information on HICP compilation Author: National Statistical Institute of Sweden COUNTRY SWEDEN Last update of this document: June 2009 Last
Tartu City Government
 Tartu in figures Symbols Arms of Tartu Flag of Tartu Logo of Tartu Tartu City Day June 29 Tartu is the second largest city in Estonia. Tartu first mentioned in written 1,030 The length of the River Emajõgi
Public sector expenditure Public Finances in Sweden 2006 Public sector expenditure is also distributed by function. Expenditures for similar purposes
 Public Finances in Sweden 2006 Public sector expenditure 6 Public sector expenditure In this Chapter we present public sector expenditure. The expenditure is reported in accordance with NA according to
Tartu in figures 2006
 Tartu in figures 2006 Sümbolid Arms of Tartu Flag of Tartu Logo of Tartu Tartu City Day June 29 Population Number of inhabitants (according to Inhabitants Registry Office) 1.01.2003 100,912 1.01.2004 100,482
Supplement to the Estimates. Fiscal Year Ending March 31, 2019
 Supplement to the Estimates Fiscal Year Ending March 3, 209 Supplement to the Estimates Fiscal Year Ending March 3, 209 British Columbia Cataloguing in Publication Data British Columbia. Estimates, fiscal
List of NSSO Data CDs Available in Data Bank
 List of NSSO Data CDs Available in Data Bank Sl. NSSO Round Title Contents Location / CD No. 1 NSS Round 38 th (1.0) Household Consumption Expenditure CD348 2 NSS Round 38 th (10) CD349 3 NSS Round 42nd
Harmonization of base years for index numbers Committee for the Coordination of Statistical Activities September 2004
 Harmonization s for index numbers for the Coordination Activities Title the index number Demography and population rement rement Comments related to Housing Labour Manufacturing Wage Indices ILO 1990 1999
General government expenditure by function
 Government Finance 2014 General government expenditure by function Ratio of total general government expenditure to gross domestic product grew in The ratio of total general government expenditure to gross
TAX FACTS løggildir grannskoðarar
 TAX FACTS 2016 løggildir grannskoðarar Tax facts 2016 2016 www.spekt.fo The information contained in this publication is only of a general nature. Although we endeavour to provide accurate and timely information,
CONSTITUENCY PROFILE: DUBLIN SOUTH-WEST
 CONSTITUENCY PROFILE: DUBLIN SOUTH-WEST CONTENTS Introduction 2 Glossary 3 Demographics 4 Families 8 Education 10 Employment 12 Households and housing 16 Voting and turnout 20 This profile is based on
NEW BRUNSWICK NOTES PROVINCIAL PROFILE. Simon Richards
 PROVINCIAL PROFILE New Brunswick s Economy in 2013 Gross domestic product (GDP): $31.9 billion GDP per capita: $42,200 Population: 756,000 Merchandise exports and imports: 98.0% of GDP New Brunswick s
YUKON NOTES PROVINCIAL PROFILE. Simon Richards
 PROVINCIAL PROFILE Yukon s Economy in 2013 Gross domestic product (GDP): $2.5 billion GDP per capita: $69,800 Population: 36,000 Merchandise exports and imports: 24.5% of GDP Yukon s Economic Activity
BRITISH COLUMBIA NOTES PROVINCIAL PROFILE. Simon Richards
 PROVINCIAL PROFILE British Columbia s Economy in 2013 Gross domestic product (GDP): $229.7 billion GDP per capita: $50,100 Population: 4.6 million Merchandise exports and imports: 37.5% of GDP British
BRITISH COLUMBIA NOTES BRITISH COLUMBIA S PROFILE. Simon Richards
 BRITISH COLUMBIA S PROFILE Economic Indicators in 2015 Gross domestic product (GDP): $250.0 billion GDP per capita: $53,300 Population: 4.7 million International merchandise exports and imports: 38.7%
Gross domestic product, 2008 (Preliminary estimation)
") Internet publication www.ksh.hu Hungarian September 2009 Central Statistical Office ISBN 978-963-235-266-4 Gross domestic product, 2008 (Preliminary estimation) Contents Summary...2 Tables...4 Methodological
Internet publication www.ksh.hu Hungarian September 2009 Central Statistical Office ISBN 978-963-235-266-4 Gross domestic product, 2008 (Preliminary estimation) Contents Summary...2 Tables...4 Methodological
NEWFOUNDLAND AND LABRADOR
 PROVINCIAL PROFILE Newfoundland and Labrador s Economy in 2013 Gross domestic product (GDP): $35.8 billion GDP per capita: $67,800 Population: 528,000 Merchandise exports and imports: 72.6% of GDP Newfoundland
Denmark. Sources: European Commission, Eurostat, and Directorate General for Economic and Financial Affairs. Updated: M ay 2018
 May 2018 Statistical Factsheet Denmark CONTENTS Main figures 1. KEY DATA 2. POPULATI ON & ECONOMY 3. FINANCIAL ASPECTS 4. ECONOMI C ACCOUNTS 5. AGRICULTURAL TRADE 6. FARM STRUCTURE 1 2 3 4-5 6-12 13-14
Instituto Nacional de Estatística Statistics Portugal ECONOMIC ACTIVITY. Estatísticas oficiais
 Instituto Nacional de Estatística Statistics Portugal ECONOMIC ACTIVITY 2014 Information available on 23 September 2015 e Estatísticas oficiais NATIONAL ACCOUNTS GROSS DOMESTIC PRODUCT 173 446 MILLION
1 statistics: and Protocols. List of Tier 1 statistics Published 282. aspx. Page 1 of 9. Notes for the list: the 2005 Tier 1 list.
 Tier 1 statisticss 2012 The following list of Tier1 statistics was approved by Cabinet in August 2012. Tier 1 statistics are the most important statistics, essential to understand how well New Zealand
Gross Domestic Product , preliminary figures for Aruba
 Gross Domestic Product 2000 2006, preliminary figures for Aruba Central Bureau of Statistics Aruba Oranjestad, December 2007 COPYRIGHT RESERVED Use of the contents of this publication is allowed, provided
Quarterly Statistical Digest
 Quarterly Statistical Digest February 2019 Volume 28, No. 1 The Statistical Digest is a quarterly publication of the Central Bank of The Bahamas, prepared by the Research Department for issue in February,
Harmonization of base years for index numbers Committee for the Coordination of Statistical Activities September 2003
 Harmonization s for index numbers Committee for the Coordination Activities Title the index number Demography and population Methodological comments related to Housing Labour Manufacturing Wage Indices
NOVA SCOTIA NOTES PROVINCIAL PROFILE. Simon Richards
 PROVINCIAL PROFILE Nova Scotia s Economy in 2013 Gross domestic product (GDP): $39.1 billion GDP per capita: $41,500 Population: 943,000 Merchandise exports and imports: 45.3% of GDP Nova Scotia s Economic
At IBISWorld, we know that industry intelligence is more than assembling facts: It's combining data and insight to answer the questions that
 At IBISWorld, we know that industry intelligence is more than assembling facts: It's combining data and insight to answer the questions that successful businesses ask IBISWorld Australia Business Environment
Budget key figures for the Norwegian economy main figures of the Fiscal Budget rates of direct and indirect taxes
 Budget 2004 key figures for the Norwegian economy main figures of the Fiscal Budget rates of direct and indirect taxes Main figures of the Fiscal Budget and the Government Petroleum Fund, excluding borrowing
The public sector's structure and use Public Finances in Sweden 2006 to further changes in the Swedish administrative model. Amongst other things, the
 Public Finances in Sweden 2006 The public sector's structure and use 8 The public sector's structure and use In this Chapter we provide an overview of the economy and activities in the subsectors of the
NEWFOUNDLAND AND LABRADOR
 PROVINCIAL PROFILE Newfoundland and Labrador s Economy in 2014 Gross domestic product (GDP): $33.5 billion GDP per capita: $63,300 Population: 529,000 Merchandise exports and imports: 72.0% of GDP Newfoundland
YUKON NOTES YUKON S PROFILE. Simon Richards
 YUKON S PROFILE Economic Indicators in 2015 Gross domestic product (GDP): $2.7 billion GDP per capita: $72,500 Population: 37,400 International merchandise exports and imports: 29.1% of GDP Economic Activity
INCOME TAX 877, , ,492 1,047,001 1,114,643 1,186,938 96,509 10%
 MINISTRY OF FINANCE Central Government 228,683 251,739 253,941 282,67 293,199 34,121 28,729 11% Other Public Sectors 12,554 12,949 117,75 129,127 138,774 149,142 11,376 1% Private Sectors 546,291 575,139
NORTHWEST TERRITORIES
 PROVINCIAL PROFILE Northwest Territories Economy in 2013 Gross domestic product (GDP): $4.4 billion GDP per capita: $100,600 Population: 44,000 Merchandise exports and imports: 57.7% of GDP Northwest Territories
ECONOMIC SURVEY OF LATIN AMERICA MONTSERRAT
 UN TED NATIIONS nt* ECONO I[C / Apiza) SOCIAL COUNCII_ Distr. LIMITED E/CEPAL/L.286/Add.24 June 1984 ORIGINAL: INGLES ECLA Economic Commission for Latin America BIBUCTECA EACTUNES MBAS MEM ECONOMIC SURVEY
NORTHWEST TERRITORIES
 TERRITORIAL PROFILE Northwest Territories Economy in 2014 Gross domestic product (GDP): $4.7 billion GDP per capita: $107,600 Population: 44,000 Merchandise exports and imports: 61.3% of GDP Northwest
Economic Impact Analysis of Fort Steele National Heritage Town. Final Report. By:
 Economic Impact Analysis of Fort Steele National Heritage Town Final Report By: The Canadian Tourism Research Institute The Conference Board of Canada April 30, 2008 WHAT'S INSIDE This study reports on
Gross Domestic Product
 Gross Domestic Product Following growth of 2.6 per cent in 2010, the Conference Board of Canada forecasts GDP growth of 1.5 per cent for 2011 and 1.4 per cent for 2012 for Prince Edward Island. Sources:
NOVA SCOTIA NOTES NOVA SCOTIA S PROFILE. Simon Richards
 NOVA SCOTIA S PROFILE Economic Indicators in 2015 Gross domestic product (GDP): $40.2 billion GDP per capita: $42,600 Population: 943,400 International merchandise exports and imports: 43.0% of GDP Economic
BULGARIA STATISTICAL PANORAMA
 BULGARIA 2008 - STATISTICAL PANORAMA Basic features and specific problems of the demographic, social and economic development, R & D and the environment s conditions in the country are presented in the
National accounts of the Netherlands
 National accounts of the Netherlands å 2014 National accounts of the Netherlands 2014 Explanation of symbols. Data not available * Provisional figure ** Revised provisional figure (but not definite) x
NOVA SCOTIA NOTES PROVINCIAL PROFILE. Alexandre Gauthier
 PROVINCIAL PROFILE Nova Scotia s Economy in 2014 Gross domestic product (GDP): $39.1 billion GDP per capita: $41,500 Population: 942,000 Merchandise exports and imports: 44.9% of GDP Nova Scotia s Economic
Kansas Department of Revenue Office of Policy and Research State Sales Tax Collections by NAICS
 January-10 February-10 March-10 April-10 111 Crop Production $ 26,331.97 $ 26,393.05 $ 69,200.44 $ 281,670.88 112 Animal Production $ 6,594.84 $ 6,705.43 $ 17,973.29 $ 8,190.77 114 Fishing, Hunting and
Supplementary Supply Estimates (No. 2) General Revenue Fund
 General Revenue Fund") 2016-17 Supplementary Supply s (No. 2) General Revenue Fund 2016-17 Supplementary Supply s (No. 2) General Revenue Fund Presented by the Honourable Joe Ceci President of Treasury Board and Minister of
2016-17 Supplementary Supply s (No. 2) General Revenue Fund 2016-17 Supplementary Supply s (No. 2) General Revenue Fund Presented by the Honourable Joe Ceci President of Treasury Board and Minister of
S T A T I S T I C A L A U T H O R I T Y. C a l e n d a r P R E S S R E L E A S E S
 H E L L E N I C S T A T I S T I C A L A U T H O R I T Y C a l e n d a r P R E S S R E L E A S E S 2 01 7 2 0 1 7 2 0 1 7 2 0 1 7 2 0 1 7 Statistical Information and Publications Division 46, Pireos and
International Monetary Fund Washington, D.C.
 2004 International Monetary Fund May 2004 IMF Country Report No. 04/140 January 29, 2001 January 29, 2001 January 29, 2001 January 29, 2001 January 29, 2001 Republic of Belarus: Statistical Appendix This
Quarterly Statistical Digest
 Quarterly Statistical Digest August Volume 27, No. 3 The Statistical Digest is a quarterly publication of the Central Bank of The Bahamas, prepared by the Research Department for issue in February, May,
Figures of Catalonia Generalitat de Catalunya Government of Catalonia
 www.idescat.cat Figures of Generalitat de Catalunya Government of POPULATION Population (1 000) 7 479 46 704 505 730 49.3 49.3 48.8 51.0 50.8 51.2 Structure () 0-14 years 15.9 15.2 15.6 15-24 years 9.4
Agency Resourcing Budget Paper No
 Agency Resourcing Budget Paper No. 4 204-5 Circulated by Senator the Honourable Mathias Cormann Minister for Finance of the Commonwealth of Australia For the information of honourable members on the occasion
Economic Indicators JUNE Prepared for the Joint Economic Committee by the Council of Economic Advisers. 113th Congress, 1st Session
 113th Congress, 1st Session Economic Indicators JUNE 2013 (Includes data available as of July 5, 2013) Prepared for the Joint Economic Committee by the Council of Economic Advisers UNITED STATES GOVERNMENT
THE PRELIMINARY AND FINAL FIGURES OF THE DANISH NATIONAL ACCOUNTS
 THE PRELIMINARY AND FINAL FIGURES OF THE DANISH NATIONAL ACCOUNTS Copenhagen, Denmark This paper compares preliminary estimates (available about four months after the close of the period to which they
Budget (Scotland) (No.2) Bill [AS INTRODUCED]
![Budget (Scotland) (No.2) Bill [AS INTRODUCED]](/thumbs/88/115246562.jpg "Budget (Scotland) (No.2) Bill [AS INTRODUCED]") Budget (Scotland) (No.2) Bill [AS INTRODUCED] CONTENTS Section PART 1 FINANCIAL YEAR 13/14 1 The Scottish Administration 2 Direct-funded bodies 3 Borrowing by statutory bodies Use of etc. The Scottish
Budget (Scotland) (No.2) Bill [AS INTRODUCED] CONTENTS Section PART 1 FINANCIAL YEAR 13/14 1 The Scottish Administration 2 Direct-funded bodies 3 Borrowing by statutory bodies Use of etc. The Scottish
CANADA MONTANA MONTANA S PROFILE NOTES. Clare Annett
 MONTANA S PROFILE Economic Indicators Gross domestic product (GDP): US$46.0 billion (2016) GDP per capita: US$44,100 (2016) Population: 1.0 million (2016) Merchandise exports to Montana: 22 nd among the
REPORT ON DENMARK S APPLICATION OF THE COMMISSION DECISION OF 20 DECEMBER 2011 ON SERVICES OF GENERAL ECONOMIC INTEREST
 Logo: Ministry of Business and Growth Denmark REPORT ON DENMARK S APPLICATION OF THE COMMISSION DECISION OF 20 DECEMBER 2011 ON SERVICES OF GENERAL ECONOMIC INTEREST June 2016 2/14 CONTENTS Introduction
CONSTITUENCY PROFILE: DÚN LAOGHAIRE
 CONSTITUENCY PROFILE: DÚN LAOGHAIRE CONTENTS Introduction 2 Glossary 3 Demographics 4 Families 8 Education 10 Employment 12 Households and housing 16 Voting and turnout 20 This profile is based on the
CANADA S MERCHANDISE TRADE WITH THE WORLD
 NOTES The Library of Parliament s Trade and Investment series provides information on Canada s trade and investment relationship with the world and with selected countries. It also describes the trade
Statistical Factsheet. France CONTENTS. Main figures - Year 2016
 June 2017 Statistical Factsheet France CONTENTS Main figures 2016 1. KEY DATA 2. POPULATION & ECONOMY 3. FINANCIAL ASPECTS 4. ECONOMIC ACCOUNTS 5. AGRICULTURAL TRADE 6. FARM STRUCTURE 1 2 3 4-5 6-12 13-14
Statistical Factsheet. Belgium CONTENTS. Main figures - Year 2016
 June 2017 Statistical Factsheet Belgium CONTENTS Main figures 2016 1. KEY DATA 2. POPULATION & ECONOMY 3. FINANCIAL ASPECTS 4. ECONOMIC ACCOUNTS 5. AGRICULTURAL TRADE 6. FARM STRUCTURE 1 2 3 4-5 6-12 13-14
Statistical Factsheet. Italy CONTENTS. Main figures - Year 2016
 June 2017 Statistical Factsheet Italy CONTENTS Main figures 2016 1. KEY DATA 2. POPULATION & ECONOMY 3. FINANCIAL ASPECTS 4. ECONOMIC ACCOUNTS 5. AGRICULTURAL TRADE 6. FARM STRUCTURE 1 2 3 4-5 6-12 13-14
Relative regional consumer price levels of goods and services, UK: 2016
 Article Relative regional consumer price levels of goods and services, UK: 2016 UK relative regional consumer price levels (RRCPLs) of goods and services for 2016. They provide an indication of a region's
POPULATION 3 MULLSJÖ KOMMUN
 POPULATION Population change - Population by age 9 9 9 + Age Share Population december st Population change after Age shares Year Population Net Net births migration W M Tot W M Tot W M Tot - - - - - 9
Statistical Factsheet. Lithuania CONTENTS. Main figures - Year 2016
 June 2017 Statistical Factsheet Lithuania CONTENTS Main figures 2016 1. KEY DATA 2. POPULATION & ECONOMY 3. FINANCIAL ASPECTS 4. ECONOMIC ACCOUNTS 5. AGRICULTURAL TRADE 6. FARM STRUCTURE 1 2 3 4-5 6-12
POPULATION 3 MULLSJÖ KOMMUN
 Share POPULATION 3 Population change 3-1 Population by age 1 7 1 7 1 7 1 7 7 7 7 7 9 9 3 7 9 11 1 3 7 9 1+ Age Population december 31st 1 Population change after 3 Age shares Year Population Net Net births
VAT Flat Rate Scheme. Who can join? How the scheme operates. When is the scheme not available?
 VAT Flat Rate Scheme The flat rate scheme for small businesses was introduced to reduce the administrative burden imposed when operating VAT. Under the scheme a set percentage is applied to the turnover
Third Quarter Finances
 2017 18 Third Quarter Finances Contents A. 2017 18 Fiscal Outlook... 1 B. Ontario s Economic Outlook... 5 C. Economic Performance... 7 D. Details of Ontario s Finances... 8 E. Ontario s 2017 18 Borrowing
IN FIGURES 2015/2016
 IN FIGURES 2015/2016 Symbols Population TARTU IN FIGURES 2015/2016 Arms of Tartu Tartu is the second largest city in Estonia Tartu first mentioned in written sources 1,030 Length of the Emajõgi River in
National Accounts (Income and Expenditure): Year ended March 2012
: Year ended March 2012") National Accounts (Income and Expenditure): Year ended March 2012 Embargoed until 10:45am 21 November 2012 Key facts In the year ended March 2012: Current price gross domestic product (GDP) increased 3.7
National Accounts (Income and Expenditure): Year ended March 2012 Embargoed until 10:45am 21 November 2012 Key facts In the year ended March 2012: Current price gross domestic product (GDP) increased 3.7
National Institute of Population and Social Security Research TOKYO JAPAN 2007
 IPSS: Statistical Report No.17 THE COST of SOCIAL SECURITY IN JAPAN Fiscal Year 2004 (April 2004 - March 2005) National Institute of Population and Social Security Research TOKYO JAPAN 2007 The statistics
Gross Domestic Product: June 2009 quarter
 Embargoed until 10:45am 23 September 2009 Highlights Gross domestic product (GDP): Economic activity was up 0.1 percent in the June 2009 quarter, following five quarters of contraction. Activity in the
National Accounts Estimates ( ) September 2018 issue
 September 2018 issue") National Accounts Estimates (2015 2018) September 2018 issue 1. INTRODUCTION This issue of Economic and Social Indicators presents National Accounts estimates for the period 2015 to 2018. Concepts and
National Accounts Estimates (2015 2018) September 2018 issue 1. INTRODUCTION This issue of Economic and Social Indicators presents National Accounts estimates for the period 2015 to 2018. Concepts and
Budget Highlights. Budget Overview. Departmental Spending
 Budget 2015 2016 Highlights Budget Overview Budget 2015-2016 holds the line on spending, restructures and reduces the size of government, and continues to clear the way for private-sector growth. The budget
Countries of the CIS
 Countries Socio-economic Statistics Key Publications A summary of key publications from (StatCommittee) comprising socio-economic statistics on the twelve countries of the Commonwealth of Independent States:
NATIONAL ACCOUNTS STATISTICS REPORT 2016
 NATIONAL ACCOUNTS STATISTICS REPORT 2016 STATISTICS REPORT. Private Bag 0024 Botswana Tel: (267) 367 1300. Toll Free: 0800 600 200. Fax: (267) 395 2201. Email: info@statsbots.org.bw Website: www.statsbots.org.bw
AN ANALYSIS OF WAGES AND SALARIES EXTRACTED FROM COLLECTIVE AGREEMENTS REGISTERED IN 2015
 INDUSTRIAL COURT OF TRINIDAD AND TOBAGO OFFICE OF ECONOMIC AND INDUSTRIAL RESEARCH AN ANALYSIS OF WAGES AND SALARIES EXTRACTED FROM COLLECTIVE AGREEMENTS REGISTERED IN 2015 2015 i A publication of the
NATIONAL ACCOUNTS STATISTICS 2014 AN OVERVIEW
 NATIONAL ACCOUNTS STATISTICS 2014 AN OVERVIEW 1. THE PUBLICATION 1.01 The Central Statistics Office (CSO), Ministry of Statistics and Programme Implementation, regularly compiles estimates of national
SYNOPSIS OF HONG KONG 2010/11 BUDGET
 SYNOPSIS OF HONG KONG 2010/11 BUDGET [ Tax & Business Advisory Division ] A. HIGHLIGHT OF FINANCIAL INDICATORS IN HONG KONG Economic outlook is cautiously optimistic. Uncertainties and potential pitfalls
This Press Release is embargoed against publication, telecast or circulation on internet till 5.30 pm today i.e. 31 st January, 2018.
 This Press Release is embargoed against publication, telecast or circulation on internet till 5.30 pm today i.e. 31 st January, 2018. PRESS NOTE ON FIRST REVISED ESTIMATES OF NATIONAL INCOME, CONSUMPTION
Netherlands. May 2018 Statistical Factsheet
 May 2018 Statistical Factsheet Netherlands CONTENTS Main figures 1. KEY DATA 2. POPULATI ON & ECONOMY 3. FINANCIAL ASPECTS 4. ECONOMI C ACCOUNTS 5. AGRICULTURAL TRADE 6. FARM STRUCTURE 1 2 3 4-5 6-12 13-14
Consumer Price Index March 2001
 12 April 2001 Consumer Price Index - all items Annual Percentage Change % 8.0 7.0 6.0 4.0 Consumer Price Index March 2001 All Items CPI Index % monthly % annual (Nov 96 = 100) change change Nov 113.3 +
Italy. May 2018 Statistical Factsheet
 May 2018 Statistical Factsheet Italy CONTENTS Main figures 1. KEY DATA 2. POPULATI ON & ECONOMY 3. FINANCIAL ASPECTS 4. ECONOMI C ACCOUNTS 5. AGRICULTURAL TRADE 6. FARM STRUCTURE 1 2 3 4-5 6-12 13-14 15-16
Austria. May 2018 Statistical Factsheet
 May 2018 Statistical Factsheet Austria CONTENTS Main figures 1. KEY DATA 2. POPULATI ON & ECONOMY 3. FINANCIAL ASPECTS 4. ECONOMI C ACCOUNTS 5. AGRICULTURAL TRADE 6. FARM STRUCTURE 1 2 3 4-5 6-12 13-14
Estonia. May 2018 Statistical Factsheet
 May 2018 Statistical Factsheet Estonia CONTENTS Main figures 1. KEY DATA 2. POPULATI ON & ECONOMY 3. FINANCIAL ASPECTS 4. ECONOMI C ACCOUNTS 5. AGRICULTURAL TRADE 6. FARM STRUCTURE 1 2 3 4-5 6-12 13-14
CANADA GERMANY GERMANY S PROFILE NOTES. Dylan Gowans
 GERMANY S PROFILE Economic Indicators Gross domestic product (GDP) at purchasing power parity (PPP): US$4.0 trillion (2016) GDP per capita at PPP: US$48,700 (2016) Population: 82.7 million (2016) International
France. May 2018 Statistical Factsheet
 May 2018 Statistical Factsheet France CONTENTS Main figures 1. KEY DATA 2. POPULATI ON & ECONOMY 3. FINANCIAL ASPECTS 4. ECONOMI C ACCOUNTS 5. AGRICULTURAL TRADE 6. FARM STRUCTURE 1 2 3 4-5 6-12 13-14
HEALTH AND SOCIAL SERVICES
 HEALTH AND SOCIAL SERVICES SUMMARY New New Resource Capital TOTAL RESOURCE AND CAPITAL (Excluding AME) Resource AME Capital AME TOTAL AME 7,813,088 2,300 7,815,388 0 0 0 373,096 0 373,096 338,488 0 338,488
CANADA SPAIN SPAIN S PROFILE NOTES. Florian Richard
 SPAIN S PROFILE Economic Indicators Gross domestic product (GDP) at purchasing power parity (PPP): US$1.7 trillion (2016) GDP per capita at PPP: US$36,300 (2016) Population: 46.4 million (2016) International
According to preliminary data, 91,600 children were born and 131,700 people died in 2017.
 Hungary 2017 Summary 1. Demographic snapshot On 1 January 2018, the population of Hungary was 9 million 771 thousand, 26.9 thousand fewer than a year earlier. Population, demographic trends In 2017, both