THIS REPORT CONTAINS ASSESSMENTS OF COMMODITY AND TRADE ISSUES MADE BY USDA STAFF AND NOT NECESSARILY STATEMENTS OF OFFICIAL U.S.
|
|
|
- Teresa Parrish
- 5 years ago
- Views:
Transcription

1 THIS REPORT CONTAINS ASSESSMENTS OF COMMODITY AND TRADE ISSUES MADE BY USDA STAFF AND NOT NECESSARILY STATEMENTS OF OFFICIAL U.S. GOVERNMENT POLICY Voluntary - Public Date: 12/21/2011 GAIN Report Number: E60078 EU-27 Post: Brussels USEU Post-Reform European Union Sugar - Prospects for the Future Report Categories: Sugar Approved By: Cynthia Guven Prepared By: Stephen Haley/ERS and Yvan Polet/FAS-USEU Report Highlights: With the EU on the eve of a new Common Agricultural Policy CAP after 2013 reform and a Commission proposal to abolish the sugar quota, this report looks back at the consequences of the 2006 Sugar Reform as part of the CAP reforms of 2003 and 2008 that decoupled European farm support from production and exposed EU producers to world market signals. This report analyses the success record of the sugar reform at a time of volatile world sugar markets and the challenges that lie ahead for the EU sugar sector in the new CAP.
2 Executive Summary: The European Union (EU) through its Common Agricultural Policy (CAP) has traditionally attempted to manage the markets and has been successful by and large but at a cost to consumers and taxpayers. The EU is now faced with markets that are more global and volatile than in the past and is being forced to adjust to this new reality. Sugar has traditionally been one of the more volatile commodities and presents a real challenge to the EU to moderate the price volatility while maintaining reasonable prices for producers, processors and consumers without adding to the CAP budget. This report reviews the effects of the policy reform on the EU sugar and sweetener industries, post-reform sugar production capacity and costs of production in the new international setting of projected higher world sugar prices. General Information: Sugar policy in the European Union (EU) is exercised by the European Commission through its control over the sugar and sweeteners supply-demand balance. [1] The EU Sugar Regime contains the principles under which the Commission is governed. The regime was created in 1968 and has been subject to review at 5-year intervals up through Until that time, rules governing sugar policy parameters were distinct from rules governing other commodities under the EU s Common Agricultural Policy (CAP) and the sugar rules witnessed few changes until The 2006 reform reduced support prices to sugarbeet growers and processors, and to compensate for lost revenue, sugarbeet payments became incorporated into the EU s Single Farm Payment system. [2] Production quota reduction was achieved through buy-outs and some efficiency gains were realized as efficient producers were allowed to buy renounced quota within member states. Under this system, support payments to growers became decoupled from production, with the purpose of allowing farmers more freedom to produce to market demand. Nonetheless, certain items from the earlier regime, such as minimum sugarbeet prices and production quotas (albeit, at lower levels) were carried over into the new regime. The Commission relies on various instruments to maintain internal EU sugar prices at or above regimebased reference levels. Although intervention purchases are no longer part of the regime, the Commission can force sugar processors to withdraw sugar from the market. Under certain conditions, the Commission can provide assistance to private storage systems. Trade policies such as providing for protection against non-preferential imports and the power to review import levels, are considered effective in managing price outcomes. The current CAP is set to expire after the 2014/15 marketing year. There is already debate to determine which elements to change and which to retain. The Sugar Regime, now part of the mainstream CAP, is also subject to examination. Major adjustments to the new regime could include abolition of production quotas by [3] This report reviews the differential effects of the last reform of the sugar regime across national industries within the EU to provide some context for understanding the potential timing, feasibility, and features of a second round of policy reforms. The report also examines current short- and longer run
3 market projections to ascertain if and how anticipated developments in global sugar markets create economic incentives for an additional round of EU reforms. Current EU Sugar Policy under the 2006 Reform Internal Support The current EU Sugar Regime was authorized under Council Regulation No. 318/2006. [4] This was subsequently subsumed into Common Market Organization (CMO) Council Regulation No. 1234/2007 as of October 1, [5] The covered quota years are 2006/07 through 2014/15. The products covered by the regime include sugar, isoglucose, inulin syrup (fructose from chicory), sugarbeets, sugarcane, molasses, maple sugar and syrup, artificial honey, certain sugar syrups, and beet pulp and other waste products of sugar manufacturer. Production quotas are defined for sugar, isoglucose, and inulin syrup. Current nation-specific volume totals are reported in table 1 for sugar (last column), and table 2 (last column) for isoglucose and inulin syrup. (As can be seen, all inulin syrup quotas were renounced during the reform transition period.) Quotas are not tradable across member states and transferability within member states is limited as well. In contrast to the pre-reform regime, there are no intervention prices they were replaced by reference prices around which wholesale sugar prices are meant to fluctuate. [6] The reference price for white sugar is per tonne, per tonne for raw sugar, and per tonne for sugarbeets. In order to reach the reference price, the Commission has the authority to require processors to withdraw sugar from the market and carry it forward to the next market year, where it counts as the first tranche of quota production in that year. The Commission also has the authority to reduce plantings but any announcement must be made by March 16, preceding the start of the planting season. There are provisions for sugar produced over quota amounts. The sugar can be used for certain industrial purposes, can be carried forward to the next marketing year, exported without subsidy but within WTO subsidized export volume limits, or destroyed. Out-of-quota sugar not used for these purposes is subject to a Surplus Levy of 500 per tonne. Other measures include private storage aid. If the EU market price is lower than 85 percent of the reference price and is expected to remain below that level for two months, private storage aid may be extended to processors of quota sugar. This provision is only effective from November 1 through June 30 of the marketing year in which aid is granted. To date, no private storage aid has been made available. The regime provides for a production charge on sugar of 12 per tonne and 6 per tonne for isoglucose. These charges represent a direct contribution to the general EU budget to cover the sugar regime s administrative cost. Reports of sales prices to the Commission are required for processors and sugar refiners on a monthly basis. The same requirement applies to industrial sugar users for monthly purchase prices.

4

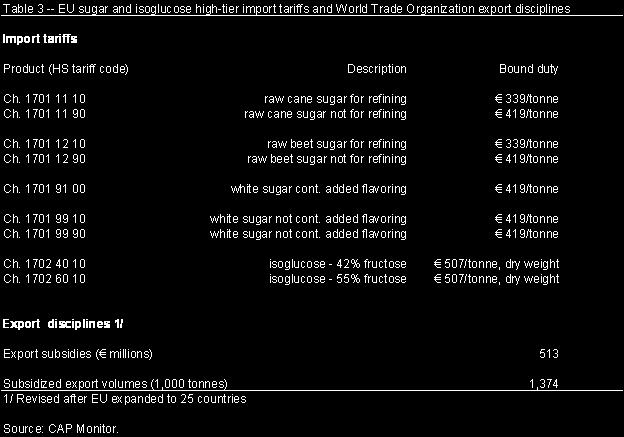
5 Current EU Sugar Policy Trade Measures The European Union charges import duties on all imports of sugar and isoglucose unless they are covered under preferential access arrangements. These duties, ranging from 339 per tonne for raw cane sugar for refining to 507 per tonne for isoglucose, are listed in table 3. These rates are those agreed to
6 in the Uruguay Round Agriculture Agreement and are bound in the World Trade Organization. There are additional import safeguards to cover situations when world prices are depressed. There are two sets of preferential sugar import arrangements. In the first, sugar can be imported dutyand quota-free under the Everything-But-Arms (EBAs) arrangements for the least developed countries (LDCs) and under the Economic Partnership Agreements (EPAs) with certain countries formerly granted special trade status under the ACP Sugar Protocol. [7] Countries and other details are listed in table 4. As seen in the left column, certain ACP countries are among the least developed countries qualifying for duty- and quota-free entry under the EBA. The non-ldc ACP countries are covered under the EPAs. Safeguards apply to imports covered by the EPAs. These are applicable when preferential imports from LDCs exceed 3.5 million tonnes and imports from non-ldc ACPs exceed regional thresholds, listed in the right column of table 4. When the safeguards apply, the imports from the non-ldc ACPs are to be limited. The safeguard arrangement applies until 2015, when it will be replaced by another which is less restrictive. At least through 2011/12, an importer of sugar under these arrangements pledges payment for the sugar of at least 90 percent of the reference price. The second set of preferential import arrangements is two-fold. The first is the CXL import quota that provides import access of 676,925 tonnes at a reduced duty of 98 per tonne, less than a third of the 339 duty levied on raw cane sugar from non-eba countries. This quota consists of pre-existing quotas that countries that became EU members through enlargement agreements had prior to EU membership (see top panel, table 5). Also included in this quota is 10,000 tonnes of sugar from India, which earlier had access under the ACP Protocol. The sugar from India has zero duty. All CXL sugar except that from India is raw cane sugar meant for refining in the European Union. The Balkan white sugar quota had its origin in 2000 but went through several transformations before reaching its current form in July Countries covered and quota allocations are listed in the bottom panel of table 5. The sugar enters the EU duty-free and there is no requirement for further processing or refining as with the CXL sugar. There is an additional quota being phased in for imports from Moldova. It started at 15,000 tonnes in 2008 and rises to 34,000 tonnes in These imports are also duty-free.
7
 CXL raw sugar import quotas 1/ Australia 9,925 98 Brazil 334,054 98 Cuba 68,969 98 Erga Omnes 253,977")
8 Table 5 -- European Union raw and white sugar import quotas 1/ Country Quota (metric tonnes) Import duty ( per tonne) CXL raw sugar import quotas 1/ Australia 9, Brazil 334, Cuba 68, Erga Omnes 253,977 98
9 India 2/ 10,000 - Total 676,925 Balkan and other import quotas for white sugar 3/ Albania 1,000 0 Bosnia and Herzegovina 12,000 0 Croatia 180,000 0 Macedonia 7,000 0 Serbia or Kosovo 180,000 0 Total 380,000 0 Moldova 4/ 34, / Negotiated in the World Trade Organization for existing suppliers to countries joining the European Union (e.g., Finland). 2/ Import can be either raw or refined sugar, duty is zero as a carryover from ACP Sugar Protocol. 3/ Sugar does not have to be used for refining. 4/ Provision part of European Policy Action Plan for Moldova. Quota started at 15,000 tonnes and tops out at 34,000 tonnes in Source: CAP Monitor. Exports Although there exists the authority for the European Union to use export subsidies (subject to the limits listed in table 3), these subsidies have not been used for sugar since 2008/09. Also discontinued have been export subsidies for sugar-containing products. Sugar can be exported without refund, but the volume must not exceed the volume limit set under the WTO. Effects of Reform on EU Transfers Both sugarbeet growers that renounced quota and processors that were forced out of business by the reforms received compensation from the EU budget. From over 5 billion euros were distributed to farmers renouncing quota and processors forced out of business due to lack of supply because of the reform. The EU Commission was forced to enhance the buyout amount as the first reform was insufficient to reach the lower production level anticipated by the EU. Additional funds were added and the subsequent renouncement of quota was substantial enough to reach the production level anticipated about 1/3 less sugar produced. Additional funds were transferred to those holding quota to compensate for the lower safety net price and these payments were incorporated into the single farm payment that had been introduced and adopted in the overall CAP reform of Market support fell dramatically from 3.5 billion euros to zero in 2010 in part because of high world prices and the dramatic drop (36 percent) in the support price. Nearly all of the previous transfers were from consumers to producers. Costs of the reform were in part mitigated by payments made by producers who bought up renounced quota. EU Sugar Supply and Use after Reform EU sugar reform had many aspects. Production quotas fell 24 percent to 13.3 million tonnes. The new institutional sugar price fell 36 percent to per tonne, and the minimum sugarbeet price fell 39.5
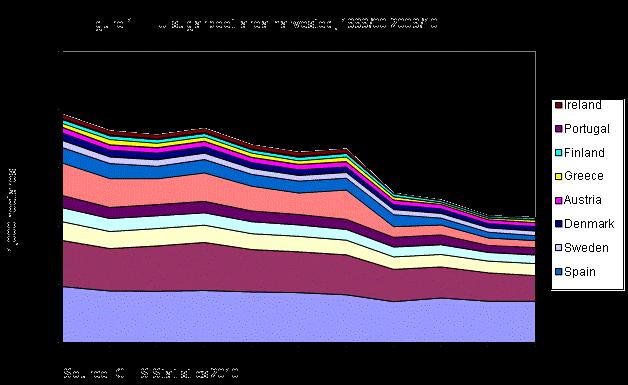
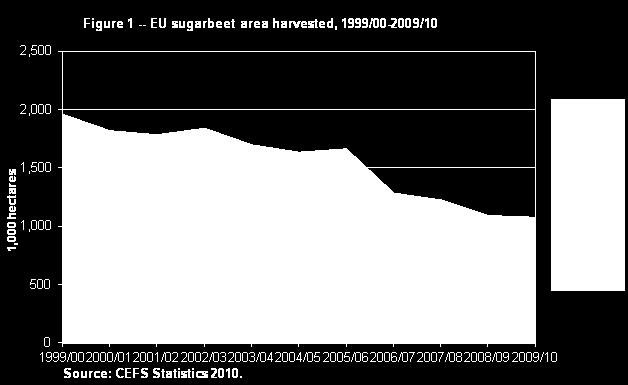
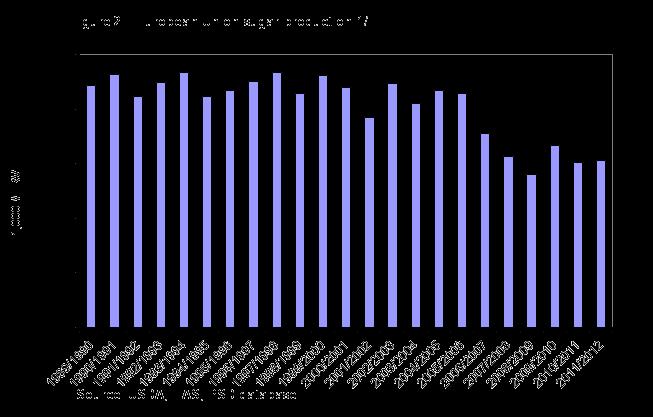
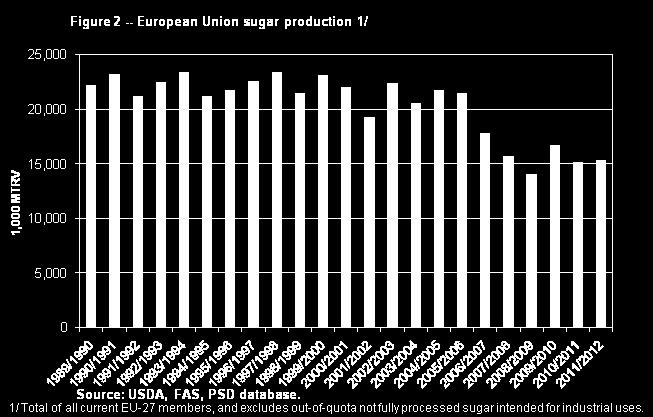
10 percent to per tonne. Sugar intervention buying was eliminated. As a result, the number of EU beet sugar-producing countries fell from 23 to 18 member states, and production is now more geographically concentrated, with France, Germany, Poland, and the United Kingdom accounting for 70 percent of sugar production in the 2009/2010 marketing year, compared with 50 percent in the 2005/06 marketing year. Italy, Spain, and Belgium produced significantly less sugar over the same period. In the core EU region of 15 countries, sugarbeet harvested area fell from million hectares in 1999/2000 to million hectares in 2009/10, a decrease of 45 percent (Fig.1). From 1989/90 through 2005/06, aggregate sugar production in the 27 member states averaged million tonnes this fell 30 percent to million tonnes averaged over 2008/ /11 (Fig. 2). Only Brazil exported more sugar than the EU prior to the reform; but since 2006, annual average exports fell from million tonnes per year from 1989/90 through 2005/06 to million tonnes averaged over 2008/ /11 (Fig.3). As seen in figure 3, the European Union has been a consistent sugar importer but reform emanating from the WTO panel decision eliminated the EU re-export of sugar equal to that imported from the ACP countries, about 1.6 million tonnes annually because of the panel finding that re-exports should be considered as EU subsidized exports. Immediately prior to reform, out-of-quota production constituted about 13 percent of total beet sugar production (Fig.4). Post-reform over-quota (2008/ /10) increased to about 20 percent of total production. Allowed uses for this sugar include unsubsidized exports, sugar carried-forward, sugar for bio-ethanol, the fermentation industry, and on-farm use (e.g., biogas). [8] According to beet sugar production data from Comite Europeen des Fabricants de Sucre (CEFS), French beet sugar production averaged million tonnes in 2008/ /10, about million tonnes over quota. For Germany, beet sugar production averaged million tonnes, about million tonnes over quota. EU sugar processing capacity has been much reduced during the reform period. Prior to reform there were 200 sugarbeet processing facilities and only 102 left at the end of the reform process. Table 6 and figure 5 show the pre-reform and post-reform slicing capacity distribution of processing plants. The number of low-capacity plants (slicing capacity of less than 5,000 tonnes per day) fell from 70 to 15. In Poland alone, the number of these factories decreased by 41. Factories within each size category decreased significantly, including the large capacity facilities (more than 15,000 tonnes per day) from 20 to 14. One consequence of fewer facilities is an increase in average processing campaign length (Fig. 6). In the 6 years before reform, the campaign length averaged 90 days. The post-reform average for 2008/ /10 was 113 days, and 125 days for 2009/10 alone. A longer campaign length entails more risk of sugarbeet deterioration but could also signal more efficient use of factory assets, lowering overall average processing costs.
11


12 Excludes Bulgaria, Romania, and cane sugar quotas. 1/


13 Table 6 -- EU sugar factories in countries, by daily slicing capacity, 2004/05 and 2009/10
14 Country < 5,000t 5,000t<8,000t 8,000<12,000t 12,000t<15,000t >15,000t Total 2004/0 2009/1 2004/0 2009/1 2004/0 2009/1 2004/0 2009/1 2004/0 2009/1 2004/ /1 0 EU-15 Austria Belgium Denmark Finland France Germany Greece Ireland Italy Netherlan ds Portugal Spain Sweden United Kingdom Total EU-10 Czech Republic Hungary Latvia Lithuania Poland Slovakia Slovenia Total Bulgaria Romania EU Source: CEFS Statistics 2010.


15 Sugar Production Costs after Reform The 2006 sugar reform was intended to restructure EU sugar industries, leading to significant reductions of unprofitable production capacity. Reducing about 6.0 million tonnes of inefficient production was supposed to improve the competitiveness of the EU sugar industry. Although small capacity sugar factories were eliminated and production in certain high-cost areas was completely abandoned (Bulgaria, Ireland, Latvia, Portugal, and Slovenia), it is not clear how efficient the remaining producers and processors are. An audit of the reform process found that quota abandonment occurred across all productivity categories. [9] Many processors in France, Germany, and Poland indicated the main reason for quota renunciation was the risk of facing a final uncompensated quota cut. The auditors estimated that 2.4 million tonnes of sugar quota renunciation occurred in regions considered by the European Commission to be the most competitive. The lack of targeting in the 2007 measures was considered to have been crucial for the failure to retire more quota by the less productive processors. Political concerns about domestic sugar supplies and the loss of labor in some member states also prevented further cutbacks by these less productive processors. One way to measure the effect of reform on current EU sugar productivity and efficiency is examine costs of sugar production before and after reform. LMC International provides estimates of world sugar and high fructose syrup (HFS) costs of production. [10] The data go back to 1979/80 and extend through 2009/10, with a preliminary forecast for 2010/11. Field, factory, and administrative costs are
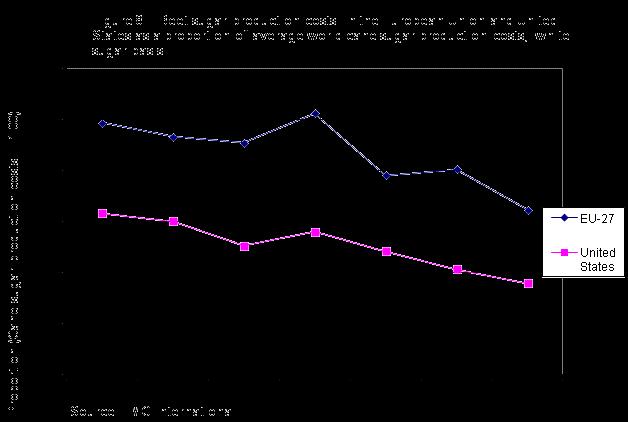
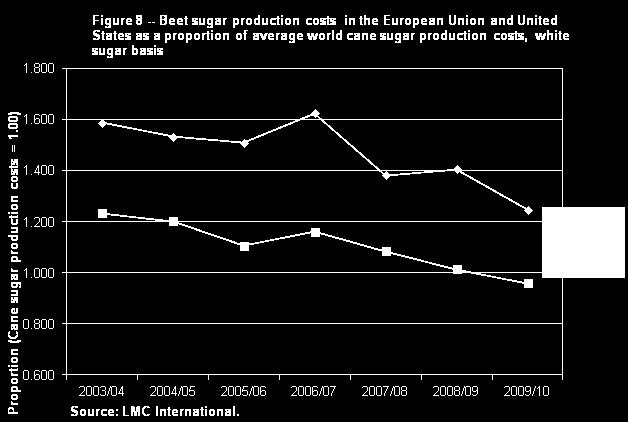
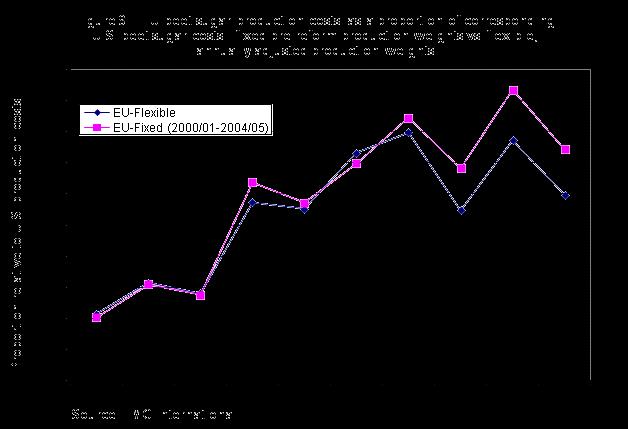
16 detailed for 35 beet producing countries and for 61 cane producing countries. HFS production costs are presented for 18 countries. Included in the set of data are estimates for most members of the European Union. Table 7 shows a beet sugar cost of production ranking of EU member states. The lowest cost areas are in The Netherlands and the United Kingdom under $525 per tonne. The three largest producing countries of France, Germany, and Poland are in the intermediate cost set with costs between $525 and $625. Those EU countries where processors renounced all of their quotas were either high cost ($625 - $850 per tonne) or very high cost (over $850 per tonne). Figure 7 shows EU sugar production across cost categories at the beginning and end of the reform period. The sum of production in countries having high cost and very high cost shares of production decreased from 25.1 percent of total production at the beginning of the reform period to 15.9 percent at the end. Average production in those countries fell from 4.8 million tonnes to 2.4 million tonnes, about a 49 percent reduction. Low cost countries increased their share of production from 12.2 percent to 13.2 percent. Likewise, medium cost countries increased their share from 62.7 percent to 70.9 percent. Even so, the low and medium cost countries were producing 1.4 million tonnes less sugar at the end of the reform period than at the beginning, about a 10 percent decrease. Figure 8 shows beet sugar production costs in the European Union and in the United States relative to the world weighted-average cane sugar production costs. EU costs are higher than those in the United States but costs in both regions have been declining since 2003/04 relative to cane sugar production costs. Although the most significant EU cost declines started after the reform began, U.S. costs were declining as well. Figure 9 shows two weighted-average comparisons of EU and U.S. production costs. The first comparison weights costs by each year s individual member states share of total annual production. This is termed EU-Flexible. The second uses a fixed weighting by averaging shares over the pre-reform 2000/ /05 period ( EU-Fixed ). The difference in the weighting schemes becomes noticeable after reform with the flexible cost line lying below the fixed cost line. The difference is attributable to a greater proportion of production occurring in more cost-efficient countries after the reform. There is not much difference in the pre-reform period because of reduced production variability in all sets of cost categories prior to quota renunciation. A calculation of average reduced production costs over 2007/ /10 attributable to the production shift to less costly producers as a result of the reform is about $35 per tonne, or a reduction of overall costs of about 5 percent. Figure 10 shows EU member states total and cash costs of sugar production, averaged over 2008/ /11. The cost lines are drawn such that each member state s sugar production is represented on the horizontal axis. The country ordering is from low cost states to progressively higher cost states. The costs are represented as proportions of the EU reference price. As can be seen, the EU reference price
17 exceeds the cash costs of production across most of the European Union. Total costs that include land rent and depreciation are above the reference price for all but about 3 million tonnes of production. This would indicate that over the longer term, producers may face some cost-cutting as part of their strategy to stay competitive. Most total costs and practically all cash costs would have been covered under the old intervention price. Table 7 -- European Union sugar producing countries, ranking by costs of production Low cost: under $525 per metric ton 1/ Netherlands, United Kingdom Medium cost: $525 - $625 per metric ton Austria, Belgium, Denmark, France, Germany, Poland High cost: $625 - $850 per metric ton Czech Republic, Hungary, Ireland, Latvia, Lithuania, Slovakia, Spain, Sweden Very high cost: over $850 per metric ton Bulgaria, Finland, Greece, Italy, Portugal, Romania 1/ white value, Olympic average (excludes highest and lowest cost years): 2005/ /11. Source: LMC International.

18

19


20 Prospects for the Future In 2010/11 the European Union faced sugar supply shortages due to the low level of imports from the EBA and EPA countries that export to the EU under preferential agreements. World sugar prices during this period were strong, actually above reference levels for most of 2010 and the first half of These higher world prices were a signal to EBA and EPA countries to divert their exports away from the European Union to more profitable export destinations. Unlike the situation in the United States during this time period, EU prices were flat and uncorrelated with world prices. [11] [12] With price stability being a highly regarded goal in the European Union, most sugar users had followed custom by negotiating long term sugar pricing contracts with their suppliers. This arrangement leads to very little sugar available for spot purchases at higher prices. The European Commission had to gradually step up measures to counter sugar shortages, from temporarily eliminating CXL quota import duties in November 2010 to agreeing on further emergency measures as of March These measures included an additional 300,000 tonnes increase in reduced-tariff imports, and a release for food of 500,000 tonnes of out-of-quota production originally meant for industrial uses. An additional 200,000 tonnes of reduced-duty imports were approved in May Finally, through reduced-duty tenders over 400,000 tonnes of additional sugar were imported. Because ending year stocks were expected to be very low in spite of these measures, the Commission attempted to stimulate increased sugarbeet planting for harvest in 2011/12 and expand imports in an
![attempt to bring domestic prices down. [13] As examined below, it is likely that world sugar prices will remain higher than in the past when the original reform measures were being considered.](/docs-images/86/94929637/images/21-0.jpg "Short-term measures such as those made in response to the 2010/11 high-price are probably too ad hoc to serve as a model for EU policy planning over the long term.")
, in partnership with the Food and Agriculture Organization (FAO),")
21 attempt to bring domestic prices down. [13] As examined below, it is likely that world sugar prices will remain higher than in the past when the original reform measures were being considered. Short-term measures such as those made in response to the 2010/11 high-price are probably too ad hoc to serve as a model for EU policy planning over the long term. Several perspectives about the factors affecting sugar policy and possible reform are examined below. Implications of the OECD/FAO Sugar Baseline Projections for the EU The Organization for Economic Co-operation and Development (OECD), in partnership with the Food and Agriculture Organization (FAO), produces world sugar projections of supply and use for major producing and consuming countries, and prices through [14] The OECD forecasts a 30 percent growth in world sugar production, about 48 million tonnes, through 2020/21. The sugarcane crop in Brazil is forecast to grow to 1.0 billion tonnes in 2020/21 but with an increasing share being allocated to ethanol production at the expense of sugar. World sugar consumption is projected to grow at an average 2.2 percent annual rate through 2020/21. Government policies that intervene in sugar markets are assumed to continue. The Indian production cycle and government policies are the main source contributing to an expected continuation of world sugar price variability. The world stocks-to-use ratio
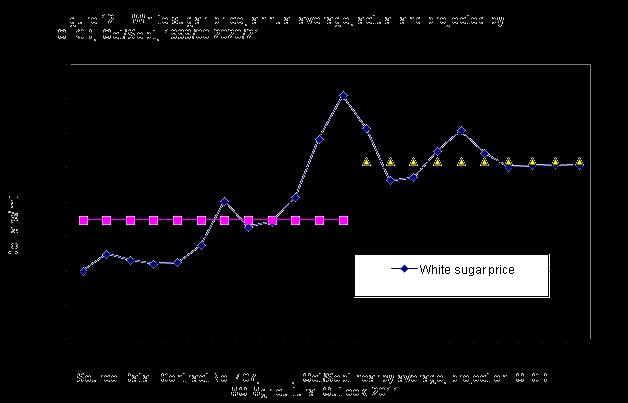
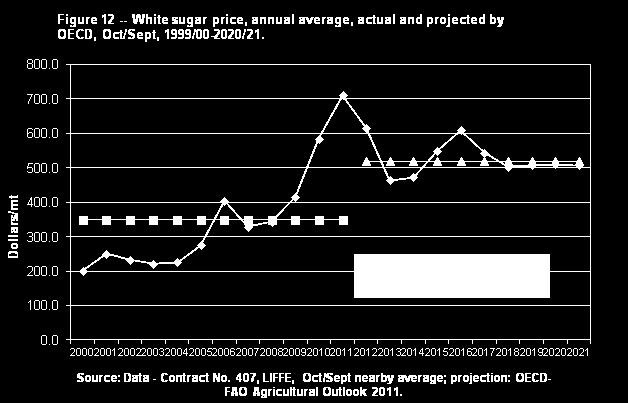
22 is expected to average lower through 2020/21 than in the previous decade. The lower ratio supports higher real sugar prices through 2020/21 than seen in the previous decade. Figure 12 shows world sugar prices (contract 407, LIFFE, Oct/Sept nearby averages) from 2000 through the first half of 2011, and also shows the OECD projections from 2011/12 through 2020/21. The average OECD projected price is $518.5 per tonne, 48 percent higher than the $349.5 per tonne average from the earlier period. The figure shows future price volatility, with a low of $464.1 per tonne in 2012/13 and a high of $608.7 per tonne in 2015/16. Figure 13 draws some implications for the European Union at different euro-dollar exchange rates. The figure charts the OECD world price against reference price levels denominated in dollars. The OECD assumed a constant rate of $1.39 per euro. The figure shows the dollar reference price for a 10 percent euro appreciation (top line = $617.8 per tonne) and for a 10 percent depreciation (bottom line = $505.5 per tonne). Low prices are expected in 2012/13 and 2013/14 that make a case for retaining the quota system during the period in which quota is being debated. Higher-than-average prices are forecast for the following three years, probably producing a situation like that in 2010/11 where imports are hard to attract. An appreciated euro relative to the dollar would ease the potential supply-use imbalance. A steady-state world price of $507 per tonne is forecast for the last 4 years of the projection period, about the same reference price level for 10-percent relative-to-the-base depreciated euro. Another implication of the OECD projections is that sugar consumption in Sub-Saharan Africa, where most EBA and EPA countries are located, is expected to grow at 3.63 percent against Sub-Saharan production growth of 2.99 percent. EU exports to the world market in 2020/21 that are projected at million tonnes are far below their imports projected at million tonnes. The European Union would be in strong competition for the Sub-Saharan African exports unless the euro appreciates above projected levels. The suggestion is that nimble changes in additional reduced-tariff imports may be increasingly called upon to keep available supply close to EU demand.
23
 Program in the United States.")
![Given that the dispersion of world prices for agricultural commodities, including sugar, has increased significantly in recent years, the next CAP Reform [15] will likely address the price volatility](/docs-images/86/94929637/images/24-1.jpg "issue as its domestic markets are less insulated from international price movements than under the more restrictive policy regimes of the past.")
24 External Factors Affecting EU Sugar Price volatility deeply concerns EU policy makers as the current CAP has no risk management policies analogous to those in other developed countries, such as the Average Crop Revenue Election (ACRE) Program in the United States. Given that the dispersion of world prices for agricultural commodities, including sugar, has increased significantly in recent years, the next CAP Reform [15] will likely address the price volatility issue as its domestic markets are less insulated from international price movements than under the more restrictive policy regimes of the past. [16] Although many factors directly affect world sugar price volatility, EU policymakers focus on volatility emanating from hard-to-predict oil prices. Petroleum prices affect the EU directly through domestic ethanol production derived from sugarbeets and through their effect on world sugar price levels and price volatility. In the EU sugar is processed into ethanol to help meet the EU s Renewable Energy Directive (RED). The RED mandates that 10 percent of transport fuel (in energy terms) must be comprised of renewable fuel by It has been estimated that 250,000 acres of sugarbeets are dedicated to sugar production outside of the sugar quota regime for industrial use producing ethanol. Returns from sugarbeet production become more variable through oil prices affecting incentives to produce ethanol. Oil price changes affect world sugar prices by influencing trade-offs in producing either sugar or ethanol in Brazil. Brazil is the largest sugar producer and exporter in the world as well as the second
25 largest ethanol producer. Both products are derived from sugarcane. When the world price of oil is high, Brazil has more incentive to produce ethanol and less sugar. Reduced sugar exports contribute to higher world sugar prices. Conversely, when world oil prices drop, less ethanol is produced and more sugar is available to the world, thereby lowering the world price. Added uncertainty comes from the uncompleted Doha Round of WTO trade negotiations. The Doha Round was intended to focus on market access, either through increased third-country direct access to the EU market or through lower over-quota tariff rates. If the EU were to declare sugar a sensitive product, then more flexibility in market access could be allowed through negotiation of a TRQ. If because of such an action, current sugar exporters to the EU under preferential terms were hurt by a new Doha Round agreement through lower export quantities or prices ( preference erosion ), the EU could possibly be required to compensate them for their losses. Internal Factors Affecting EU Sugar: Industry Perspectives The principal industry stakeholders in future reform of the EU sugar sector are the beet growers, food processors, confectioners, and industrial processors. The economic interests of each industry segment are likely to be affected by future reforms; with some favoring the status quo and others seeking changes that could further affect industry structure in the EU, as well as opportunities for trading partners. The beet growers association has stated that the 2006 sugar reform led to the closure of a large number of processing factories, the loss of over 140,000 sugarbeet farmers who ceased cultivating beets, and the loss of 16,500 jobs in rural areas. [17] The structure of the industry has changed dramatically as there are now only seven sugar manufacturers that control 80 percent of sugar production in the EU. There are currently about 168,000 growers in 18 EU member states with an average of 1,600 growers per factory. The seven manufacturers have also built or invested in sugar factories in countries with preferential trade agreements in sugar with the EU and are thus assured of a supply to their factories. EU sugar beet growers and processors agree that the 2006 sugar reform has been successful in increasing the efficiency of EU sugar production and improving the competitiveness of the EU sugar industry [18], [19]. However, they also point out that a stable EU domestic sugar market is a major objective and that supply control remains important in this respect. They insist on keeping the tools to manage the EU s sugar import needs, but at the same time they want to maintain access to exports in cases where a good crop and favorable world market conditions offer potential for profitable EU sugar exports, especially for out-of-quota sugar. More importantly, the growers are aware that much of the EU sugar exports are in the form of confectioner s exports that contain a high percentage of sugar and must compete on world markets and could require export subsidies to compete, albeit within WTO restrictions. They point out that sugar has traditionally been subject to above-average price volatility and that Brazil s sugar or ethanol choice could destabilize markets quickly. They state that they are in favor of maintaining the sugar quota at current levels as a prudent way to stabilize prices. Confectioners and other sugar users would benefit if the price of EU sugar goes down substantially as the EU sugar price has traditionally been higher than world prices and would certainly favor abolishing
26 the sugar quota and allow production to go to the least cost producers. [20] They must compete in world markets where low-cost producers provide difficult competition if export subsidies are not available. Hence, their stated preference is that the EU sugar price decline to world price levels. Industrial sugar users benefitted from the EU quota system through access to lower-priced out-of-quota sugar and it s expected they would benefit by retaining the current quota system. Internal Factors Affecting EU Sugar: European Parliament and Budget In previous CAP reforms the principal EU institutions that determined the outcome were the EU Commission, appointed by the EU heads of state, and the Council of Agriculture Ministers, appointed by the member states. When the Lisbon Treaty entered into force in 2009, the members of the European Parliament (EP) were granted co-decision powers with the Council of Ministers on agricultural matters, including the CAP. The inclusion of the EP in a co-decision role with the Council is intended to help bridge the democratic deficit in the EU. Whether the change in the EU governance structure for agricultural policy makes further reform more or less likely remains to be seen. However, the 18 member States that produce sugar have a clear majority of votes in the Parliament (647 votes of a total of 736) as well as in the Council of Ministers (239 of 345 total votes). For the first time in the history of the CAP, a decline in CAP spending in real terms has been proposed by the EU Commission. This was done with the background of financial crisis in many member states that has resulted in severe austerity measures imposed by several governments, even those such as Germany that is not under fiscal duress. It is estimated that the CAP would amount to billion compared to the current amount of 416 billion. [21] Any reform that would incur high compensation costs, buy-outs, export subsidies, storage costs, and the costs associated with the likely enlargement of the EU to include Croatia and Serbia [22] would incur careful scrutiny. While the CAP would remain a priority in the EU and the only policy carried out and paid for in common by all 27 member states, the EU budget itself will have less agriculture than ever before despite being the largest single budget item. Justification of the CAP to EU taxpayers in difficult financial times will be an issue in the discussion on the CAP reform of 2013, including for the future sugar regime, with our without the continuation of the sugar quota system. Concluding Thoughts The 2006 EU sugar reform produced many changes. Production declined significantly and the EU became a major net sugar importer, reversing its status of being one of the largest net exporters. Out-ofquota sugar production gained new importance, especially for bio-ethanol and fermentation industries. Much sugarbeet processing capacity was reduced and completely eliminated in certain member states. Nonetheless, reduced production quota occurred across all productivity categories with aggregate EU sugar production costs decreasing only about 5 percent more than what would have occurred otherwise. Although remaining trade restrictions unaffected by the reform provide protection to EU sugar producers, internal EU prices could not attract preferential imports to meet demand when world sugar prices became high. A stable set of domestic prices much favored by EU sugar users do not seem now
27 compatible with an increased reliance on imports. Looking ahead, the value of the Euro and increased demand from emerging market economies will likely have strong effects on EU sugar markets that policymakers cannot afford to ignore. On October 12, 2011, the European Commission published its proposals [23] for the CAP reform scheduled for implementation from January 1, The proposals are subject to approval by both the Council of Ministers and the European Parliament. Initial analysis of the proposals suggests that the reform would largely imply a refinement of the measures introduced by the 2008 CAP Health Check rather than a radical departure from the current arrangements. The major focus of the up-coming CAP reform will be on justifying what agriculture is contributing to EU citizens through mitigation of green house gasses, enhancing the environment, provision of healthy food at reasonable prices, and creation of jobs in rural areas. Sugar used to produce ethanol will be useful in this endeavor since green house gasses can be reduced significantly using sugar converted into ethanol. However, the budgetary restrictions over the period will limit what can be paid out to the various factions within EU agriculture and this will define what can be reformed and to what degree. The proposed abolition of the milk quotas in 2015 is a major undertaking and is another indication that the EU is looking to be more competitive in world markets. The Commission s proposals are already being criticized for not offering sufficient tools for addressing price volatility and sugar will be highlighted in this debate as its price is among the most volatile of EU crops. Because the EU s sugar reform has caused supply shortages and increased price volatility, EU analysts are warning other countries not to rely on the global market for a dependable supply. [24] Other EU and world crops have also faced unusual and historic price volatility the last few years that calls for risk insurance have become more frequent in the EU. This could entail additional costs to the budget in some form of risk insurance within the CAP. As mentioned, the sugar reform of did not always transfer quota to the least cost producers and this issue will likely be addressed in the context of the 2014 reform. The EU Commission s proposal, which includes abolishing all sugar quotas in 2015, will clearly address this, even if some mitigating measures may be decided in the final reform agreement. This liberalization proposal for the sugar regime is likely acceptable to processors, exporters, and consumers as long as supply is sufficient and prices are less volatile. The EU Commission has proposed that higher storage provisions would be part of a package to address the sugar shortages that occurred in the 2009/10 marketing year. The major sugar manufacturers that have invested in the countries that have preferential treatment in the EU market would be able to provide a sufficient supply of sugar to the EU s internal market both domestically and with raw sugar from abroad. Another consideration that could affect the EU s sugar market in the long run is the likely enlargement of the EU to include Croatia and Serbia. While neither are large sugar beet producers -- Serbia around three million tons and Croatia about two million tons -- both are net sugar importers. However, they have been granted loans to improve their sugar infrastructure and could become more efficient producers that could add to greater self sufficiency in EU sugar production in an EU of 30 member states [25].
28 Internationally, the role of Brazil will have to be carefully monitored in both sugar and ethanol exports as it is the major producer and exporter of sugar in the world and a major producer and exporter of ethanol made from sugar cane. The EU s approach to the sugar regime also takes into account the current WTO restrictions on support, export subsidies, and market access as well as the most likely future disciplines imposed by a possible agreement in the multilateral negotiations in the Doha Round. In the final analysis it is most likely that the EU will produce more sugar domestically and increase storage levels in part to reduce price volatility and ensure a consistent supply of sugar to the domestic market. The additional sugar produced will most likely be produced in least cost regions of the EU which would allow the EU to reduce its safety net price. The ability of the EBA countries to supply sugar at the lower EU price could also expand as the seven EU manufacturers of EU sugar continue their expansion into the EBA countries and reduce costs with new facilities that produce raw sugar. Reform of the sugar program along these lines would thus be compatible with the Commission s announced budget restrictions and vision for a more competitive sector; congruent with the European Parliament s interest in maintaining the capacity for production of sugar for food and energy uses and sugar-containing products in the EU; and consistent with current and potential WTO rules. The EU could then become a contributor to slightly more sugar price stability as it produces more sugar by shifting the quotas from higher cost to lower cost producers and allowing high cost producers to exit the industry and encouraging low cost producers to increase production by abolishing quotas. Higher storage payments would also allow producers to hold more stocks until market conditions improve (higher prices) domestically or on the global market. Effective risk insurance policies against production losses and low prices is another policy instrument that is being advocated by growers and processors alike and would be another means to ameliorate farm income losses and provide additional security to growers. Appendix EU Sugar and Sweetener Policy Reform The principal factors underlying the reform of the sugar program in 2006 were threefold. First, the CAP reforms of 2003/04 (that left sugar as the only major commodity unreformed) provided a mechanism to compensate farmers for income losses due to reform measures. The CAP reforms were designed to move support from the main EU commodities directly to farmers through direct payments. The core reform concept was the Single Payment Scheme that provided for payments to farmers independent of the level of production. The idea was to make farmers production decisions more responsive to market signals instead of policy interventions. [26] Although there were provisions for exceptions, payments were to be made without requirements for the production of any specific crop, only a minimum requirement to maintain the land in good agricultural condition. The level of direct support was tied to commodity-based payments made in
29 The second factor was the World Trade Organization (WTO) Panel ruling that found the EU sugar regime in violation of WTO export commitments. The Panel held that the EU s re-exporting of 1.6 million tonnes of sugar imported from the African, Caribbean, and Pacific (ACP) countries must be counted against the EU s export subsidy commitments made as part of the Uruguay Round Agreement on Agriculture (URAA). The WTO Panel also ruled that the EU s export of over-quota sugar production (or C-sugar) was cross-subsidized by the high guaranteed prices for A- and B-quota sugar and therefore should be counted in the URAA export subsidy commitments. At the time of the ruling, these commitments limited annual EU subsidized sugar export sales to the lesser of a volume binding of million tonnes or a value binding of 499 million. (With EU enlargement, these bindings were increased to million tonnes (volume) and 513 million (value).) Without a substantial reduction in support pricing, foregone exports forced back onto the domestic market would undermine sugar program operations. The third factor was the Everything But Arms (EBA) agreement, in which the EU agreed to phase out tariffs by 2009 on imported raw sugar from 48 of the least developed countries (LDC). The EBA agreement provided for the duty free entry of raw sugar imports into the EU by Without reform, high guaranteed sugar prices in the EU would likely attract very large quantities of duty-free EBA imports that would cause the high-price EU sugar regime to be undermined. By reducing EU support prices by 36 percent, there would be fewer EBA imports in the EU internal market and this would allow EU producers to be more competitive. These factors led to the EU Commission s June 2005 proposal to drastically reform the sugar regime. Intra-EU discussions led to a revised set of proposals in November The legislative proposals were designed to incorporate the new sugar regime with the recent reforms of the CAP and to meet its international obligations. The basic features of the proposal were: Sugar support price to be reduced by 36 percent from to per tonne over a 4-year phase-in period beginning in 2006/07. Minimum sugarbeet price to be reduced by 39.5 percent to 26.3/tonne over the phase-in period. Sugar production quotas not to be reduced except through a voluntary 4-year restructuring program where quota could be sold and retired. Member states allowed to buy some additional quota. The intention was to move some production from inefficient producers to efficient producers. Restructuring to be financed by quota levies on producers and processors who do not sell quota. Compensation to be made available to farmers at an average of 64.2 percent of the revenue lost due to the price cuts. The aid is included in the Single Farm Payment and is linked to payments for compliance with environmental and land management standards. Establishment of a prohibitive super levy to be applied to unallocated over-quota production. Other features essential to the proposed reform included phasing out of sugar intervention; merging A and B quotas and eliminating over-quota sugar exports; elimination of re-exports of sugar imported under preferential terms; institution of storage and carryover schemes; provision of compensatory funds
30 to assist high-cost developing countries with diversification or reconversion aid for loss of sugar export revenue; and an increase in the EU isoglucose quota. [27] The phasing-in of reform did not initially meet its intended goal of reducing the sugar quota, leading EU policymakers to rework the reform for the next year. [28] Nonetheless, final quotas in 2009/10 were much lower than at the start of the reform. Table 1 shows the EU production quota transition for sugar and table 2 shows the transition for isoglucose and inulin syrup. The transition is marked by substantial quota renunciation and also by additional quota purchased, especially by those countries where proportionally fewer quotas were renounced. Sugar quotas decrease 24 percent from initial levels to million tonnes (figure A-1); isoglucose quotas expanded 20.3 percent to 690,441 tonnes; and inulin quotas fell to zero. The EU sugar reform, with its much lower support prices, had a significant impact on the relationship between the European Union and the African, Caribbean, and Pacific (ACP) countries under the ACP Sugar Protocol. [29] Under this agreement dating back to 1975, 77 ACP countries had preferential access into the EU market at guaranteed prices much higher than world prices. Within the framework, ACP countries exported about 1.3 million tonnes of sugar to the European Union annually on an individual quota basis. Many ACP sugar producers would become uncompetitive at the new EU reference price for sugar. The European Union withdrew from the Protocol in September The framework s guaranteed prices and quantities were now inconsistent with new sugar reforms and intervention buying from ACP countries was being phased out as an integral part of the reform. [30] Also, WTO special exemption waivers that permitted the discriminatory access of ACP sugar into the European Union were to expire at the end of The ACP Protocol arrangement is being replaced by WTO compatible Economic Partnership Agreements (EPAs). [31] These EPAs are regional trade agreements meant to integrate ACP countries into the world economy. Although not all EPAs have been fully negotiated, interim EPAs have been established to cover sugar access into the European Union. There is a three-step transition period. The first step covered January 1, 2008 through September 30, 2009 that guaranteed prices and allowed for quotas. The second period lasts from October 1, 2009 through September 30, During this period, ACP countries have duty free access but with an automatic volume safeguard clause (discussed earlier in this report meant to guard against import surges into the EU). The third stage will be initiated on October 1, 2015, at which time all imports are duty- and quota-free, with a weaker safeguard provision. [1] The EU s decision-making process involves three institutions: the European Parliament, the Council of the European Union, and the European Commission. The Commission drafts proposals for new laws and manages day-to-day business of implementing EU policies. There are 27 Commissioners from each of the 27 Member States. For additional information, see: [2] The Single Payment Scheme was the central element of the June 2003 CAP reform. See:
The U.S. Sugar Industry Under the EU and Doha Trade Liberalization. Jose Andino, Richard Taylor, and Won Koo
 The U.S. Sugar Industry Under the EU and Doha Trade Liberalization Jose Andino, Richard Taylor, and Won Koo Center for Agricultural Policy and Trade Studies North Dakota State University Fargo, North Dakota
Pressures for reforms in the EU sugar regime due to the next WTO round on agriculture and the enlargement of the EU
 Pressures for reforms in sugar regime due to the next WTO round on agriculture and the enlargement of Pressures for reforms in sugar regime due to the next WTO round on agriculture and the enlargement
COMMISSION OF THE EUROPEAN COMMUNITIES
 COMMISSION OF THE EUROPEAN COMMUNITIES Brussels, 22.6.2005 COM(2005) 263 final 2005/0118 (CNS) 2005/0119 (CNS) 2005/0120 (CNS) Proposal for a COUNCIL REGULATION on the common organisation of the markets
The CAP reform process in perspective: issues of the post-2013 debate
 The CAP reform process in perspective: issues of the post-213 debate Tassos Haniotis Director - Economic Analysis, Perspectives and Evaluations DG for Agriculture and Rural Development European Commission
Draft Report on the ADVISORY GROUP ON SUGAR 12th March Item 1: Approval of the agenda and the minutes of the last meeting on 12th December 2012
 Draft Report on the ADVISORY GROUP ON SUGAR 12th March 2012 CHAIRMAN: Mr MARIHART Item 1: Approval of the agenda and the minutes of the last meeting on 12th December 2012 The agenda and the minutes from
EU sugar sector: Facts and figures
 MEMO/04/177 Brussels, 14 July 2004 EU sugar sector: Facts and figures Today, the European Commission tabled a radical overhaul of the EU sugar regime (for details on the reform proposal see IP/04/915).
Fiscal consequences of the abolition of sugar levies 1
 Economics and Business Review, Vol. 4 (18), No. 4, 2018: 83-96 DOI: 10.18559/ebr.2018.4.5 Fiscal consequences of the abolition of sugar levies 1 Maciej Cieślukowski 2, Mihai Mutascu 3 Abstract : From October
The Denunciation of the Sugar Protocol
 The Denunciation of the Sugar Protocol WTO Dispute Settlement, EU Domestic Reform, and the Legal Status of the Sugar Protocol WTO Appellate Body Research Series Geneva, February 28, 2008 Issue of Concern
REPORT ON THE FIRST QUARTER Q1_ AGRANA BETEILIGUNGS-
 REPORT ON THE FIRST QUARTER Q1_2006 07 AGRANA BETEILIGUNGS- AG Austria France Czech Republic USA Germany Sugar Hungary Argentina Mexico Denmark Slovakia Poland Starch Romania China Russia Serbia Fiji Ukraine
A. INTRODUCTION AND FINANCING OF THE GENERAL BUDGET. EXPENDITURE Description Budget Budget Change (%)
") DRAFT AMENDING BUDGET NO. 2/2018 VOLUME 1 - TOTAL REVENUE A. INTRODUCTION AND FINANCING OF THE GENERAL BUDGET FINANCING OF THE GENERAL BUDGET Appropriations to be covered during the financial year 2018
DRAFT AMENDING BUDGET NO. 2/2018 VOLUME 1 - TOTAL REVENUE A. INTRODUCTION AND FINANCING OF THE GENERAL BUDGET FINANCING OF THE GENERAL BUDGET Appropriations to be covered during the financial year 2018
Central and Eastern Europe: Overview of EU Enlargement and Its Impact on Primary Commodity Markets
 Central and Eastern Europe: Overview of EU Enlargement and Its Impact on Primary Commodity Markets USDA Agricultural Outlook Forum February 20 2003 Chris Horseman Agra Europe (London) Ltd. AGRA Agra Group
EU-28 RECOVERED PAPER STATISTICS. Mr. Giampiero MAGNAGHI On behalf of EuRIC
 EU-28 RECOVERED PAPER STATISTICS Mr. Giampiero MAGNAGHI On behalf of EuRIC CONTENTS EU-28 Paper and Board: Consumption and Production EU-28 Recovered Paper: Effective Consumption and Collection EU-28 -
REPORT ON THE FIRST THREE QUARTERS Q3_ AGRANA BETEILIGUNGS-
 REPORT ON THE FIRST THREE QUARTERS Q3_2006 07 AGRANA BETEILIGUNGS- AG Austria France Czech Republic USA Germany Sugar Hungary Argentina Mexico Denmark Slovakia Poland Starch Romania China Russia Serbia
EU Sugar after 2015: consequences of the new regulations
 INTERNATIONAL CONFEDERATION OF EUROPEAN BEET GROWERS EU Sugar after 2015: consequences of the new regulations ELISABETH LACOSTE CIBE General Secretary CIBE today Founded in 1927 23 MEMBERS (regional or
ANNEX CAP evolution and introduction of direct payments
 ANNEX 2 REPORT ON THE DISTRIBUTION OF DIRECT AIDS TO THE PRODUCERS (FINANCIAL YEAR 2005) 1. FOREWORD The Commission regularly publishes the breakdown of direct payments by Member State and size of payment.
EU Sugar Producers and Financial Market Regulation
 EU Sugar Producers and Financial Market Regulation Presentation to the Expert Group on agricultural commodity derivatives and spot markets 3rd October 2013 Norbert Dülks, Corporate Risk Manager Südzucker
Tobacco Growing in the European Union
 Tobacco Growing in the European Union Mr Johan van Gruijthuijsen 1, European Commission Study conducted as a technical document for The first meeting of the Ad Hoc Study Group on Alternative Crops established
ANNUAL REVIEW BY THE COMMISSION. of Member States' Annual Activity Reports on Export Credits in the sense of Regulation (EU) No 1233/2011
 No 1233/2011") EUROPEAN COMMISSION Brussels, 7.2.2017 COM(2017) 67 final ANNUAL REVIEW BY THE COMMISSION of Member States' Annual Activity Reports on Export Credits in the sense of Regulation (EU) No 1233/2011 EN EN
EUROPEAN COMMISSION Brussels, 7.2.2017 COM(2017) 67 final ANNUAL REVIEW BY THE COMMISSION of Member States' Annual Activity Reports on Export Credits in the sense of Regulation (EU) No 1233/2011 EN EN
With regard to the expenditure side, the following modifications are proposed:
 Council of the European Union Brussels, 8 November 2016 (OR. en) 13583/16 BUDGET 29 EXPLANATORY MEMORANDUM Subject: Draft amending budget No 4 to the general budget for 2016: Update of appropriations to
ILO World of Work Report 2013: EU Snapshot
 Greece Spain Ireland Poland Belgium Portugal Eurozone France Slovenia EU-27 Cyprus Denmark Netherlands Italy Bulgaria Slovakia Romania Lithuania Latvia Czech Republic Estonia Finland United Kingdom Sweden
Long Term Reform Agenda International Perspective
 Long Term Reform Agenda International Perspective Asta Zviniene Sr. Social Protection Specialist Human Development Department Europe and Central Asia Region World Bank October 28 th, 2010 We will look
Report on the distribution of direct payments to agricultural producers (financial year 2016)
") Report on the distribution of direct payments to agricultural producers (financial year 2016) Every year, the Commission publishes the distribution of direct payments to farmers by Member State. Figures
Report on the distribution of direct payments to agricultural producers (financial year 2016) Every year, the Commission publishes the distribution of direct payments to farmers by Member State. Figures
Economics Essay Sample
 Critically assess the main challenges facing the EU in 2013 and its capacity to meet them, with particular reference either to enlargement or to further integration. Introduction This brief essay aims
Composition of the European Parliament. The FPS-Method General information
 Composition of the European Parliament. The FPS-Method An intermediate formula between Cambridge Compromise and 0.5-DP V. Ramírez-González, University of Granada (Spain), vramirez@ugr.es General information
The Tax Burden of Typical Workers in the EU
 The Tax Burden of Typical Workers in the EU 28 2018 James Rogers Cécile Philippe Institut Économique Molinari, Paris Bruxelles TABLE OF CONTENTS Abstract... 3 Background... 3 Main Results... 4 On average,
Live Long and Prosper? Demographic Change and Europe s Pensions Crisis. Dr. Jochen Pimpertz Brussels, 10 November 2015
 Live Long and Prosper? Demographic Change and Europe s Pensions Crisis Dr. Jochen Pimpertz Brussels, 10 November 2015 Old-age-dependency ratio, EU28 45,9 49,4 50,2 39,0 27,5 31,8 2013 2020 2030 2040 2050
ANNUAL REVIEW BY THE COMMISSION. of Member States' Annual Activity Reports on Export Credits in the sense of Regulation (EU) No 1233/2011
 No 1233/2011") EUROPEAN COMMISSION Brussels, 17.3.2015 COM(2015) 130 final ANNUAL REVIEW BY THE COMMISSION of Member States' Annual Activity Reports on Export Credits in the sense of Regulation (EU) No 1233/2011 EN EN
EUROPEAN COMMISSION Brussels, 17.3.2015 COM(2015) 130 final ANNUAL REVIEW BY THE COMMISSION of Member States' Annual Activity Reports on Export Credits in the sense of Regulation (EU) No 1233/2011 EN EN
L 346/12 Official Journal of the European Union
 L 346/12 Official Journal of the European Union 20.12.2013 COUNCIL REGULATION (EU) No 1370/2013 of 16 December 2013 determining measures on fixing certain aids and refunds related to the common organisation
The EU: your questions answered
 1 The EU: your questions answered This booklet gives a brief overview of some of the issues and questions people have raised about the European Union. Many people have said that they don t have enough
Sugar Policy. Introduction. P. Lynn Kennedy, Louisiana State University
 Sugar Policy P. Lynn Kennedy, Louisiana State University Introduction The FAIR Act of 1996 continued support of U.S. sugar by means of a loan rate in addition to the use of import restrictions. The loan
Reforming the European Union Sugar Program: What Are the Market and Trade Implications? Aziz Elbehri and Johannes Umstaetter*
 Reforming the European Union Sugar Program: What Are the Market and Trade Implications? Aziz Elbehri and Johannes Umstaetter* Selected Paper prepared for presentation at the American Agricultural Economics
Enterprise Europe Network SME growth outlook
 Enterprise Europe Network SME growth outlook 2018-19 een.ec.europa.eu 2 Enterprise Europe Network SME growth outlook 2018-19 Foreword The European Commission wants to ensure that small and medium-sized
Enterprise Europe Network SME growth forecast
 Enterprise Europe Network SME growth forecast 2017-18 een.ec.europa.eu Foreword Since we came into office three years ago, this European Commission has put the creation of more jobs and growth at the centre
Recent Macroeconomic and Monetary Developments in the Czech Republic and Outlook
 Recent Macroeconomic and Monetary Developments in the Czech Republic and Outlook Miroslav Singer Governor, Czech National Bank FORECASTING DINNER 212, Czech CFA Society Prague, 22 February 212 M. Recent
Communication on the future of the CAP
 Communication on the future of the CAP The CAP towards 2020: meeting the food, natural resources and territorial challenges of the future Tassos Haniotis, Director Agricultural Policy Analysis and Perspectives
CANADA EUROPEAN UNION
 THE EUROPEAN UNION S PROFILE Economic Indicators Gross domestic product (GDP) at purchasing power parity (PPP): US$20.3 trillion (2016) GDP per capita at PPP: US$39,600 (2016) Population: 511.5 million
THE NEW EUROPEAN COMMISSION PROPOSAL ON COMMERCIAL FUEL DUTY
 CLTM/B3627/DVI Brussels, 6 April 2007 THE NEW EUROPEAN COMMISSION PROPOSAL ON COMMERCIAL FUEL DUTY Overview of the new Commission proposal for amening Council Directive 2003/96 concerning commercial diesel
IZMIR UNIVERSITY of ECONOMICS
 IZMIR UNIVERSITY of ECONOMICS Department of International Relations and the European Union TURKEY EU RELATIONS ( EU308) FOREIGN DIRECT INVESTMENT IN THE EUROPEAN UNION AND TURKEY Prepared By: Büke OŞAFOĞLU
January 2014 Euro area international trade in goods surplus 0.9 bn euro 13.0 bn euro deficit for EU28
 STAT/14/41 18 March 2014 January 2014 Euro area international trade in goods surplus 0.9 13.0 deficit for EU28 The first estimate for the euro area 1 (EA18) trade in goods balance with the rest of the
ANNEX CAP evolution and introduction of direct payments
 ANNEX 2 REPORT ON THE DISTRIBUTION OF DIRECT AIDS TO THE PRODUCERS (FINANCIAL YEAR 2004) 1. FOREWORD The Commission regularly publishes the breakdown of direct payments by Member State and size of payment.
Spain France. England Netherlands. Wales Ukraine. Republic of Ireland Czech Republic. Romania Albania. Serbia Israel. FYR Macedonia Latvia
 Germany Belgium Portugal Spain France Switzerland Italy England Netherlands Iceland Poland Croatia Slovakia Russia Austria Wales Ukraine Sweden Bosnia-Herzegovina Republic of Ireland Czech Republic Turkey
EU BUDGET AND NATIONAL BUDGETS
 DIRECTORATE GENERAL FOR INTERNAL POLICIES POLICY DEPARTMENT ON BUDGETARY AFFAIRS EU BUDGET AND NATIONAL BUDGETS 1999-2009 October 2010 INDEX Foreward 3 Table 1. EU and National budgets 1999-2009; EU-27
EUROPA - Press Releases - Taxation trends in the European Union EU27 tax...of GDP in 2008 Steady decline in top corporate income tax rate since 2000
 DG TAXUD STAT/10/95 28 June 2010 Taxation trends in the European Union EU27 tax ratio fell to 39.3% of GDP in 2008 Steady decline in top corporate income tax rate since 2000 The overall tax-to-gdp ratio1
8822/16 YML/ik 1 DG C 1
 Council of the European Union Brussels, 12 May 2016 (OR. en) 8822/16 OUTCOME OF PROCEEDINGS From: On: 12 May 2016 To: General Secretariat of the Council Delegations No. prev. doc.: 8530/16 Subject: DEVGEN
COMMISSION STAFF WORKING DOCUMENT Accompanying the document
 EUROPEAN COMMISSION Brussels, 30.11.2016 SWD(2016) 420 final PART 4/13 COMMISSION STAFF WORKING DOCUMENT Accompanying the document REPORT FROM THE COMMISSION TO THE EUROPEAN PARLIAMENT, THE COUNCIL, THE
The Architectural Profession in Europe 2012
 The Architectural Profession in Europe 2012 - A Sector Study Commissioned by the Architects Council of Europe Chapter 2: Architecture the Market December 2012 2 Architecture - the Market The Construction
PUBLIC PROCUREMENT INDICATORS 2011, Brussels, 5 December 2012
 PUBLIC PROCUREMENT INDICATORS 2011, Brussels, 5 December 2012 1. INTRODUCTION This document provides estimates of three indicators of performance in public procurement within the EU. The indicators are
The Interaction between the EU s Domestic Policy for Sugar and its Imports of Sugar from the ACP and Least Developed Countries.
 The Interaction between the EU s Domestic Policy for Sugar and its Imports of Sugar from the ACP and Least Developed Countries. Adress by David Roberts, former Deputy Director General in DG Agri, European
74 ECB THE 2012 MACROECONOMIC IMBALANCE PROCEDURE
 Box 7 THE 2012 MACROECONOMIC IMBALANCE PROCEDURE This year s European Semester (i.e. the framework for EU policy coordination introduced in 2011) includes, for the first time, the implementation of the
International Statistical Release
 International Statistical Release This release and additional tables of international statistics are available on efama s website (www.efama.org) Worldwide Investment Fund Assets and Flows Trends in the
The regional analyses
 The regional analyses EU & EFTA On average, in the EU & EFTA region, the case study company has a Total Tax Rate of 41.1%, made 13.1 tax payments and took 179 hours to comply with its tax obligations in
DG TAXUD. STAT/11/100 1 July 2011
 DG TAXUD STAT/11/100 1 July 2011 Taxation trends in the European Union Recession drove EU27 overall tax revenue down to 38.4% of GDP in 2009 Half of the Member States hiked the standard rate of VAT since
English - Or. French EUROPEAN CONFERENCE OF MINISTERS OF TRANSPORT COUNCIL OF MINISTERS
 For Official Use For Official Use Conférence Européenne des Ministres des Transports European Conference of Ministers of Transport 21-Jun-2001 English - Or. French EUROPEAN CONFERENCE OF MINISTERS OF TRANSPORT
34 th Associates Meeting - Andorra, 25 May Item 5: Evolution of economic governance in the EU
 34 th Associates Meeting - Andorra, 25 May 2012 - Item 5: Evolution of economic governance in the EU Plan of the Presentation 1. Fiscal and economic coordination: how did it start? 2. Did it work? 3. Five
Comparing pay trends in the public services and private sector. Labour Research Department 7 June 2018 Brussels
 Comparing pay trends in the public services and private sector Labour Research Department 7 June 2018 Brussels Issued to be covered The trends examined The varying patterns over 14 years and the impact
June 2014 Euro area international trade in goods surplus 16.8 bn 2.9 bn surplus for EU28
 127/2014-18 August 2014 June 2014 Euro area international trade in goods surplus 16.8 bn 2.9 bn surplus for EU28 The first estimate for the euro area 1 (EA18) trade in goods balance with the rest of the
Central and Eastern Europe
 In partnership with 2017 Central and Eastern Europe Private Equity Statistics June 2018 Disclaimer The information contained in this report has been produced by Invest Europe, based on data collected as
The current state of the electricity market in Bulgaria
 The current state of the electricity market in Bulgaria Towards market liberalization Current state of the market Generation 42 TWh Export - 18% Losses - 9% Regulated market 33% Domestic free market -
Fiscal rules in Lithuania
 Fiscal rules in Lithuania Algimantas Rimkūnas Vice Minister, Ministry of Finance of Lithuania 3 June, 2016 Evolution of National and EU Fiscal Regulations Stability and Growth Pact (SGP) Maastricht Treaty
European Advertising Business Climate Index Q4 2016/Q #AdIndex2017
 European Advertising Business Climate Index Q4 216/Q1 217 ABOUT Quarterly survey of European advertising and market research companies Provides information about: managers assessment of their business
International Statistical Release
 International Statistical Release This release and additional tables of international statistics are available on efama s website (www.efama.org). Worldwide Investment Fund Assets and Flows Trends in the
TAXATION OF TRUSTS IN ISRAEL. An Opportunity For Foreign Residents. Dr. Avi Nov
 TAXATION OF TRUSTS IN ISRAEL An Opportunity For Foreign Residents Dr. Avi Nov Short Bio Dr. Avi Nov is an Israeli lawyer who represents taxpayers, individuals and entities. Areas of Practice: Tax Law,
INTERNAL AND EXTERNAL PRESSURES
 1 DG EXTERNAL POLICIES OF THE UNION DIRECTORATE B, POLICY DEPARTMENT Brussels, 4 August 2004 MB D(04) 34787 INTERNAL AND EXTERNAL PRESSURES FOR EU SUGAR SECTOR REFORM This note has been prepared for the
THE INVERTING PYRAMID: DEMOGRAPHIC CHALLENGES TO THE PENSION SYSTEMS IN EUROPE AND CENTRAL ASIA
 THE INVERTING PYRAMID: DEMOGRAPHIC CHALLENGES TO THE PENSION SYSTEMS IN EUROPE AND CENTRAL ASIA 1 Anita M. Schwarz Lead Economist Human Development Department Europe and Central Asia Region World Bank
The Reform of the Common Agricultural Policy Implementation. Catherine Combette DG Agriculture and Rural Development European Commission
 The Reform of the Common Agricultural Policy 2014-2020 Implementation Catherine Combette DG Agriculture and Rural Development European Commission catherine.combette@ec.europa.eu Agriculture and Rural Development
Quarterly Gross Domestic Product of Montenegro 3 rd quarter 2017
 MONTENEGRO STATISTICAL OFFICE R E L E A S E No: 224 Podgorica, 22 December 2017 When using the data, please name the source Quarterly Gross Domestic Product of Montenegro 3 rd quarter 2017 The release
Fiscal sustainability challenges in Romania
 Preliminary Draft For discussion only Fiscal sustainability challenges in Romania Bucharest, May 10, 2011 Ionut Dumitru Anca Paliu Agenda 1. Main fiscal sustainability challenges 2. Tax collection issues
P3: Causes of Globalisation
 Learning Aim B P3: Causes of Globalisation The main features of globalisation e.g. trading blocs, international mobility of labour and capital, international currencies, multinational corporations, international
Preliminary results of International Trade in 2014: in nominal terms exports increased by 1.8% and imports increased by 3.
 International Trade Statistics 7 July, 215 Preliminary results of International Trade in : in nominal terms exports increased by 1.8% and imports increased by 3.2% vis-à-vis 213 In, exports of goods increased
GOVERNMENT RESPONSE TO THE HOUSE OF LORDS EUROPEAN UNION COMMITTEE S REPORT ON THE EU SUGAR REGIME
 GOVERNMENT RESPONSE TO THE HOUSE OF LORDS EUROPEAN UNION COMMITTEE S REPORT ON THE EU SUGAR REGIME Introduction From the start of the current negotiations on the reform of the Common Agricultural Policy
Defining Issues. EU Audit Reforms: The Countdown Begins. April 2016, No Key Facts for U.S. Companies
 Defining Issues April 2016, No. 16-12 EU Audit Reforms: The Countdown Begins Only two months remain before the European Union (EU) audit reforms come into full effect. These reforms will affect many U.S.
23 January Special Report No 16/2017. Rural Development Programming: less complexity and more focus on results needed
 23 January 2018 EP Com. on Agriculture and Rural Development Special Report No 16/2017 Rural Development Programming: less complexity and more focus on results needed Janusz Wojciechowski ECA Member Page
Drafting Effective International Contracts: Workshop-seminar on International Sales, Agency and Distributorship Contracts
 Drafting Effective International Contracts: Workshop-seminar on International Sales, Agency and Distributorship Contracts Goodwill Indemnity and Similar Rights in Agency and Distributorship Contracts:
Survey on the access to finance of enterprises (SAFE)
") Survey on the access to finance of enterprises (SAFE) Analytical Report 2017 Written by Ton Kwaak, Martin Clarke, Irena Mikolajun and Carlos Raga Abril November 2017 EUROPEAN COMMISSION Directorate-General
Survey on the access to finance of enterprises (SAFE) Analytical Report 2017 Written by Ton Kwaak, Martin Clarke, Irena Mikolajun and Carlos Raga Abril November 2017 EUROPEAN COMMISSION Directorate-General
Courthouse News Service
 14/2009-30 January 2009 Sector Accounts: Third quarter of 2008 Household saving rate at 14.4% in the euro area and 10.7% in the EU27 Business investment rate at 23.5% in the euro area and 23.6% in the
KPMG s Individual Income Tax and Social Security Rate Survey 2009 TAX
 KPMG s Individual Income Tax and Social Security Rate Survey 2009 TAX B KPMG s Individual Income Tax and Social Security Rate Survey 2009 KPMG s Individual Income Tax and Social Security Rate Survey 2009
Electricity & Gas Prices in Ireland. Annex Business Electricity Prices per kwh 2 nd Semester (July December) 2016
 2016") Electricity & Gas Prices in Ireland Annex Business Electricity Prices per kwh 2 nd Semester (July December) 2016 ENERGY POLICY STATISTICAL SUPPORT UNIT 1 Electricity & Gas Prices in Ireland Annex Business
Electricity & Gas Prices in Ireland Annex Business Electricity Prices per kwh 2 nd Semester (July December) 2016 ENERGY POLICY STATISTICAL SUPPORT UNIT 1 Electricity & Gas Prices in Ireland Annex Business
May 2012 Euro area international trade in goods surplus of 6.9 bn euro 3.8 bn euro deficit for EU27
 108/2012-16 July 2012 May 2012 Euro area international trade in goods surplus of 6.9 3.8 deficit for EU27 The first estimate for the euro area 1 (EA17) trade in goods balance with the rest of the world
SETTING THE TARGETS. Figure 2 Guidebook Overview Map: Objectives and targets. Coalition for Energy Savings
 I SETTING THE TARGETS Part I: provides an overview of the EED and its objectives and targets. It explains how targets should be established and used to drive efficiency measures. Figure 2 Guidebook Overview
BULGARIAN TRADE WITH EU IN THE PERIOD JANUARY - APRIL 2017 (PRELIMINARY DATA)
") BULGARIAN TRADE WITH EU IN THE PERIOD JANUARY - APRIL 2017 (PRELIMINARY DATA) In the period January - April 2017 Bulgarian exports to the EU increased by 8.6% 2016 and amounted to 10 418.6 Million BGN
BULGARIAN TRADE WITH EU IN THE PERIOD JANUARY - APRIL 2017 (PRELIMINARY DATA) In the period January - April 2017 Bulgarian exports to the EU increased by 8.6% 2016 and amounted to 10 418.6 Million BGN
BULGARIAN TRADE WITH EU IN THE PERIOD JANUARY - MAY 2017 (PRELIMINARY DATA)
") BULGARIAN TRADE WITH EU IN THE PERIOD JANUARY - MAY 2017 (PRELIMINARY DATA) In the period January - May 2017 Bulgarian exports to the EU increased by 10.8% 2016 and added up to 13 283.0 Million BGN (Annex,
BULGARIAN TRADE WITH EU IN THE PERIOD JANUARY - MAY 2017 (PRELIMINARY DATA) In the period January - May 2017 Bulgarian exports to the EU increased by 10.8% 2016 and added up to 13 283.0 Million BGN (Annex,
First estimate for 2011 Euro area external trade deficit 7.7 bn euro bn euro deficit for EU27
 27/2012-15 February 2012 First estimate for 2011 Euro area external trade deficit 7.7 152.8 deficit for EU27 The first estimate for the euro area 1 (EA17) trade in goods balance with the rest of the world
CFA Institute Member Poll: Euro zone Stability Bonds
 CFA Institute Member Poll: Euro zone Stability Bonds I. About the Survey... 2 a. Background... 2 b. Purpose and Methodology... 2 II. Full Results... 2 Q1: Requirement of common issuance of sovereign bonds...
STAT/12/ October Household saving rate fell in the euro area and remained stable in the EU27. Household saving rate (seasonally adjusted)
") STAT/12/152 30 October 2012 Quarterly Sector Accounts: second quarter of 2012 Household saving rate down to 12.9% in the euro area and stable at 11. in the EU27 Household real income per capita fell by
STAT/12/152 30 October 2012 Quarterly Sector Accounts: second quarter of 2012 Household saving rate down to 12.9% in the euro area and stable at 11. in the EU27 Household real income per capita fell by
Lithuania: in a wind of change. Robertas Dargis President of the Lithuanian Confederation of Industrialists
 Lithuania: in a wind of change Robertas Dargis President of the Lithuanian Confederation of Industrialists 2017 06 15 Lithuanian Confederation of Industrialists - the largest business organisation in Lithuania
Statistics Brief. Inland transport infrastructure investment on the rise. Infrastructure Investment. August
 Statistics Brief Infrastructure Investment August 2017 Inland transport infrastructure investment on the rise After nearly five years of a downward trend in inland transport infrastructure spending, 2015
COMMUNICATION FROM THE COMMISSION
 EUROPEAN COMMISSION Brussels, 20.2.2019 C(2019) 1396 final COMMUNICATION FROM THE COMMISSION Modification of the calculation method for lump sum payments and daily penalty payments proposed by the Commission
Approach to Employment Injury (EI) compensation benefits in the EU and OECD
 compensation benefits in the EU and OECD") Approach to (EI) compensation benefits in the EU and OECD The benefits of protection can be divided in three main groups. The cash benefits include disability pensions, survivor's pensions and other short-
Approach to (EI) compensation benefits in the EU and OECD The benefits of protection can be divided in three main groups. The cash benefits include disability pensions, survivor's pensions and other short-
The parties subsequently entered into a book-out agreement, which effectively extinguished the delivery obligation:
 Annex 10 Commodity Derivative Definitions USA In the USA, the G20 commitments on derivatives have built on decades of commodity derivative regulation and been implemented through the Dodd Frank Act. Dodd-Frank
June 2012 Euro area international trade in goods surplus of 14.9 bn euro 0.4 bn euro surplus for EU27
 121/2012-17 August 2012 June 2012 Euro area international trade in goods surplus of 14.9 0.4 surplus for EU27 The first estimate for the euro area 1 (EA17) trade in goods balance with the rest of the world
TRADE IN GOODS OF BULGARIA WITH EU IN THE PERIOD JANUARY - JUNE 2018 (PRELIMINARY DATA)
") TRADE IN GOODS OF BULGARIA WITH EU IN THE PERIOD JANUARY - JUNE 2018 (PRELIMINARY DATA) In the period January - June 2018 the exports of goods from Bulgaria to the EU increased by 10.7% 2017 and amounted
TRADE IN GOODS OF BULGARIA WITH EU IN THE PERIOD JANUARY - JUNE 2018 (PRELIMINARY DATA) In the period January - June 2018 the exports of goods from Bulgaria to the EU increased by 10.7% 2017 and amounted
August 2012 Euro area international trade in goods surplus of 6.6 bn euro 12.6 bn euro deficit for EU27
 146/2012-16 October 2012 August 2012 Euro area international trade in goods surplus of 6.6 12.6 deficit for EU27 The first estimate for the euro area 1 (EA17) trade in goods balance with the rest of the
BULGARIAN TRADE WITH EU PRELIMINARY DATA
 BULGARIAN TRADE WITH EU PRELIMINARY DATA During the period January - June 2010 the Bulgarian exports to EU increased by 17.4% compared to the corresponding period of the previous year and amounted to 8
Financial situation by the end of Table 1. ECPGR Contributions for Phase IX received by 31 December 2016 (in Euro)...3
...3") European Cooperative Programme for Plant Genetic Resources (ECPGR) Phase IX (2014 2018) Financial Report CONTENTS Financial situation by the end of...2 Table 1. ECPGR Contributions for Phase IX received
European Cooperative Programme for Plant Genetic Resources (ECPGR) Phase IX (2014 2018) Financial Report CONTENTS Financial situation by the end of...2 Table 1. ECPGR Contributions for Phase IX received
Serbian Tax Card 2018
 Serbian Tax Card 2018 KPMG d.o.o. Beograd kpmg.com/rs CORPORATE INCOME TAX A resident is a legal entity which is incorporated or has a place of effective management and control on the territory of Serbia.
FIJI/FAO 2012 Asia Pacific Sugar Conference. ACP perspectives on the Implementation of EPA- EBA Sugar Arrangements
 FIJI/FAO 2012 Asia Pacific Sugar Conference ACP perspectives on the Implementation of EPA- EBA Sugar Arrangements Key Issues ACP (EPA-EBA) Sugar Structure Transitional Phase Sugar Protocol to EPAs Sugar
SELECTED MAJOR SOCIAL SECURITY PENSION REFORMS IN EUROPE, Source: ISSA Databases
 SELECTED MAJOR SOCIAL SECURITY PENSION REFORMS IN EUROPE, 1995-2014 Source: ISSA Databases COUNTRY AREA YR SUMMARY OBJECTIVE POSSIBLE EVALUATION CRITERIA* United Kingdom Pensions 2014 Replacing public
Council conclusions on "First Annual Report to the European Council on EU Development Aid Targets"
 COUNCIL OF THE EUROPEAN UNION Council conclusions on "First Annual Report to the European Council on EU Development Aid Targets" 3091st FOREIGN AFFAIRS Council meeting Brussels, 23 May 2011 The Council
SUGAR. STARCH. FRUIT.
 REPORT ON THE FIRST THREE QUARTERS Q3 2004 05 AGRANA BETEILIGUNGS- AG SUGAR. STARCH. FRUIT. DEAR SHAREHOLDER, DEAR SIR OR MADAM, The Extraordinary General Meeting of Shareholders held on 5 November 2004
Measuring financial protection: an approach for the WHO European Region
 Division of Health Systems and Public Health WHO Regional Office for Europe Measuring financial protection: an approach for the WHO European Region Jon Cylus WHO Barcelona Office for Health Systems Strengthening