METRO VANCOUVER REGIONAL DISTRICT PERFORMANCE AND AUDIT COMMITTEE
|
|
|
- Ferdinand Barnett
- 5 years ago
- Views:
Transcription
1 METRO VANCOUVER REGIONAL DISTRICT PERFORMANCE AND AUDIT COMMITTEE REGULAR MEETING Wednesday, April 11, :00 a.m. th 28 Floor Committee Room, 4730 Kingsway, Burnaby, British Columbia R E V I S E D A G E N D A1 1. ADOPTION OF THE AGENDA April 11, 2018 Regular Meeting Agenda That the adopt the agenda for its regular meeting scheduled for April 11, 2018 as circulated. ADOPTION OF THE MINUTES 2.1 February 1, 2018 Regular Meeting Minutes That the adopt the minutes of its regular meeting held February 1, 2018 as circulated. 3. DELEGATIONS 4. INVITED PRESENTATIONS 5. REPORTS FROM COMMITTEE OR STAFF On Table 5.1 replacement 1 Audited 2017 Financial Statements Designated Speaker: Phil Trotzuk a) That the MVRD Board approve the Audited 2017 Consolidated Financial Statements for the Metro Vancouver Regional District; b) That the GVS&DD Board approve the Audited 2017 Financial Statements for the Greater Vancouver Sewerage and Drainage District; c) That the GVWD Board approve the Audited 2017 Financial Statements for the Greater Vancouver Water District; d) That the MVHC Board approve the Audited 2017 Financial Statements for the Metro Vancouver Housing Corporation. Note: Recommendation is shown under each item, where applicable. April 11, 2018
2 Regular Agenda April 11, 2018 Agenda Page 2 of Financial Results Year-End Designated Speaker: Phil Trotzuk That the MVRD Board receive for information the report dated April 3, 2018, titled 2017 Financial Results Year-End. 5.3 Greater Vancouver Sewerage and Drainage District Development Cost Charge Reserve Fund Expenditure Bylaw No. 313, 2018 Designated Speaker: Dean Rear That the GVS&DD Board: a) give first, second and third reading to Greater Vancouver Sewerage and Drainage District Development Cost Charge Reserve Fund Expenditure Bylaw No. 313, 2018; and b) pass and finally adopt Greater Vancouver Sewerage and Drainage District Development Cost Charge Reserve Fund Expenditure Bylaw No. 313, Semi-Annual Report on GVS&DD Development Cost Charges Designated Speaker: Dean Rear That the receive for information the report dated April 3, 2018 titled Semi-Annual Report on GVS&DD Development Cost Charges. 5.5 Status of Water, Liquid Waste and Solid Waste Capital Expenditures to December 31, 2017 Designated Speaker: Dean Rear That the receive for information the report dated April 3, 2018, titled Status of Water, Liquid Waste and Solid Waste Capital Expenditures to December 31, Operating, Statutory and Discretionary Reserves Policy Designated Speaker: Phil Trotzuk That the endorse the Operating, Statutory and Discretionary Reserves Policy as presented in the attached report, dated March 28, 2018, titled Operating, Statutory and Discretionary Reserves Policy. 5.7 Procurement Process and Reporting Designated Speaker: Roy Moulder That the receive for information the report dated March 20, 2018, titled Procurement Process and Reporting. 5.8 Tender/Contract Award Information December 2017 to February 2018 Designated Speaker: Roy Moulder That the receive for information the report dated March 26, 2018, titled Tender/Contract Award Information December 2017 to February
3 Regular Agenda April 11, 2018 Agenda Page 3 of Manager s Report Designated Speaker: Phil Trotzuk That the receive for information the report dated March 28, 2018, titled Manager s Report. INFORMATION ITEMS 6.1 Public Engagement Policy 7. OTHER BUSINESS 8. BUSINESS ARISING FROM DELEGATIONS 9. RESOLUTION TO CLOSE MEETING That the close its regular meeting scheduled for April 11, 2018 pursuant to the Community Charter provisions, Section 90 (1) (j) as follows: 90 (1) A part of the meeting may be closed to the public if the subject matter being considered relates to or is one or more of the following: (j) information that is prohibited, or information that if it were presented in a document would be prohibited, from disclosure under section 21 of the Freedom of Information and Protection of Privacy Act; (l) discussions with regional district officers and employees respecting regional district objectives, measures and progress reports for the purposes of preparing an annual report under section 98 [annual municipal report] of the Charter. 10. ADJOURNMENT/CONCLUSION That the adjourn/conclude its regular meeting of April 11, Membership: Walton, Richard (C) North Vancouver District Gill, Tom Surrey Baldwin, Wayne (VC) White Rock Jordan, Colleen Burnaby Bell, Don North Vancouver City Loo, Alexa - Richmond Duncan, Kiersten Maple Ridge McEwen, John Anmore Fox, Charlie Langley Township O Neill, Terry Coquitlam Smith, Michael West Vancouver Stevenson, Tim Vancouver Williams, Lorrie New Westminster
4 2.1 METRO VANCOUVER REGIONAL DISTRICT PERFORMANCE AND AUDIT COMMITTEE Minutes of the Regular Meeting of the Metro Vancouver Regional District (MVRD) Performance and Audit Committee held at 9:03 a.m. on Thursday, February 1, 2018 in the 28th Floor Committee Room, 4730 Kingsway, Burnaby, British Columbia. MEMBERS PRESENT: Chair, Mayor Richard Walton, North Vancouver District Vice Chair, Mayor Wayne Baldwin, White Rock Councillor Don Bell, North Vancouver City Councillor Kiersten Duncan, Maple Ridge (arrived at 9:24 a.m.) Councillor Charlie Fox, Langley Township Councillor Tom Gill, Surrey Councillor Colleen Jordan, Burnaby Councillor Alexa Loo, Richmond Mayor John McEwen, Anmore Councillor Terry O Neill, Coquitlam Mayor Michael Smith, West Vancouver Councillor Tim Stevenson, Vancouver (arrived at 9:04 a.m.) Councillor Lorrie Williams, New Westminster MEMBERS ABSENT: None. STAFF PRESENT: Phil Trotzuk, Chief Financial Officer Carol Mason, Chief Administrative Officer Genevieve Lanz, Legislative Services Coordinator, Board and Information Services 1. ADOPTION OF THE AGENDA 1.1 February 1, 2018 Regular Meeting Agenda It was MOVED and SECONDED That the adopt the agenda for its regular meeting scheduled for February 1, 2018 as circulated. CARRIED 9:04 a.m. Councillor Stevenson arrived at the meeting. Minutes of the Regular Meeting of the MVRD held on Thursday, February 1, 2018 Page 1 of 5
5 2. ADOPTION OF THE MINUTES 2.1 October 6, 2017 Regular Meeting Minutes It was MOVED and SECONDED That the adopt the minutes of its regular meeting held October 6, 2017 as circulated. CARRIED 3. DELEGATIONS No items presented. 4. INVITED PRESENTATIONS No items presented. 5. REPORTS FROM COMMITTEE OR STAFF Agenda Varied The order of the agenda was varied to consider Item 5.2 at this point. 5.2 MVRD Audit Plan from BDO Canada LLP Report dated January 15, 2018 from Dean Rear, Director, Financial Planning and Operations, providing the with the plan for the completion of the annual external audit for the Metro Vancouver Districts and Housing Corporation for the 2017 fiscal year. It was MOVED and SECONDED That the receive for information the report dated January 15, 2018, titled MVRD Audit Plan from BDO Canada LLP. CARRIED Agenda Order Resumed The order of the agenda resumed with Item 5.1 being before the Committee Priorities and Work Plan Report dated January 23, 2018 from Phil Trotzuk, Chief Financial Officer, providing the with the priorities and work plan for the year Members were provided with a presentation on the 2018 Work Plan, highlighting the annual financial statement audit, and potential policy reviews and development. 9:24 a.m. Councillor Duncan arrived at the meeting. Minutes of the Regular Meeting of the MVRD held on Thursday, February 1, 2018 Page 2 of 5
6 The Committee discussed the benefit of providing new members with financerelated Board policies directly related to the Committee Work Plan. Discussion ensued on the status of expenditures as it relates to the MetroTower III building move and improvements. Request of Staff Staff was requested to report on the status of expenditures as it relates to the MetroTower III building move and improvements at a future meeting. In response to questions, members were updated on the MFA borrowing risks and credit rating, the development cost charge (DCC) program review, and the development of the affordable housing waiver bylaw. Presentation material titled 2018 Priorities and Work Plan is retained with the February 1, 2018 Performance and Audit Committee agenda. It was MOVED and SECONDED That the endorse the work plan as presented in the report dated January 23, 2018, titled 2018 Performance and Audit Committee Priorities and Work Plan. CARRIED Councillor Duncan absent at the vote. 5.2 MVRD Audit Plan from BDO Canada LLP This item was previously considered. 5.3 City of White Rock Metro Vancouver Regional District Security Issuing Bylaw No. 1258, 2018 Report dated January 23, 2018 from Dean Rear, Director, Financial Planning and Operations, presenting a borrowing request from the City of White Rock for the spring 2018 MFA long term debt issue, for the amount of 2,274,850 for water treatment facility design and construction. Minutes of the Regular Meeting of the MVRD held on Thursday, February 1, 2018 Page 3 of 5
7 It was MOVED and SECONDED That the MVRD Board: a) pursuant to Sections 182(1)(b) and 182(2)(a) of the Community Charter, give consent to the request for financing from the City of White Rock in the amount of 2,274,850; and b) give first, second and third reading to Metro Vancouver Regional District Security Issuing Bylaw No. 1258, 2018 being a bylaw to authorize the entering into an Agreement respecting financing between the Metro Vancouver Regional District and the Municipal Finance Authority of British Columbia; and c) pass and finally adopt Metro Vancouver Regional District Security Issuing Bylaw No. 1258, 2018 ; and d) forward Metro Vancouver Regional District Security Issuing Bylaw No. 1258, 2018 to the Inspector of Municipalities for Certificate of Approval. CARRIED 5.4 Investment Position and Returns September 1 to December 31, 2017 Report dated January 18, 2018 from Dean Rear, Director, Financial Planning and Operations, providing the with an update on investment performance. In response to questions, members were informed of the benchmarking of investments and returns, and requested a presentation on and future review of the investment policy. Request of Staff The Committee requested a presentation on the benchmarking of investments and returns, and a future review of the investment policy. It was MOVED and SECONDED That the receive for information the report dated January 18, 2018, titled Investment Position and Returns September 1 to December 31, CARRIED 5.5 Tender/Contract Award Information September to November 2017 Report dated January 17, 2018 from Roy Moulder, Division Manager, Purchasing and Risk Management, Financial Services, informing the Performance and Audit Committee of contracts valued at or in excess of 500,000 (exclusive of taxes) handled by Purchasing and Risk Management division. Members commented on the procurement process and evaluation criteria. Request of Staff Staff was requested to report back to the next meeting on the procurement process, highlighting evaluation criteria and staff considerations in general and specific to RFP No Minutes of the Regular Meeting of the MVRD held on Thursday, February 1, 2018 Page 4 of 5
8 It was MOVED and SECONDED That the receive for information the report dated January 17, 2018, titled Tender/Contract Award Information September to November CARRIED 5.6 Manager s Report Report dated January 23, 2018 from Phil Trotzuk, Chief Financial Officer, providing the with status of the 2018 Work Plan. It was MOVED and SECONDED That the receive for information the report dated January 23, 2018, titled Manager s Report. CARRIED 6. INFORMATION ITEMS No items presented. 7. OTHER BUSINESS No items presented. 8. BUSINESS ARISING FROM DELEGATIONS No items presented. 9. RESOLUTION TO CLOSE MEETING No items presented. 10. ADJOURNMENT/CONCLUSION It was MOVED and SECONDED That the conclude its regular meeting of February 1, CARRIED (Time: 10:38 a.m.) Genevieve Lanz, Legislative Services Coordinator Richard Walton, Chair FINAL Minutes of the Regular Meeting of the MVRD held on Thursday, February 1, 2018 Page 5 of 5
9 5.1 To: From: Phil Trotzuk, Chief Financial Officer Date: April 3, 2018 Subject: Audited 2017 Financial Statements Meeting Date: April 11, 2018 RECOMMENDATION a) That the MVRD Board approve the Audited 2017 Consolidated Financial Statements for the Metro Vancouver Regional District; b) That the GVS&DD Board approve the Audited 2017 Financial Statements for the Greater Vancouver Sewerage and Drainage District; c) That the GVWD Board approve the Audited 2017 Financial Statements for the Greater Vancouver Water District; d) That the MVHC Board approve the Audited 2017 Financial Statements for the Metro Vancouver Housing Corporation. PURPOSE To present, for approval, the Audited 2017 Financial Statements for the Metro Vancouver Districts and the Metro Vancouver Housing Corporation. BACKGROUND Legislation requires that annual Audited Financial Statements be prepared for the Metro Vancouver Districts and Metro Vancouver Housing Corporation and presented at a public meeting of the Board of Directors. The Audited Financial Statements for 2017 have been prepared by management in accordance with Canadian public sector accounting standards ( PSAS ) and have received an unqualified audit opinion by the external auditors, BDO Canada LLP FINANCIAL STATEMENT HIGHLIGHTS Under PSAS regulations, governments are required to present four statements with explanatory notes - Statement of Financial Position (Exhibit A), Statement of Operations (Exhibit B), Statement of Net Debt (Exhibit C) and Statement of Cash Flows (Exhibit D). The District also includes a number of schedules for additional reference. It is important to note that there are differences between the presentation in these financial statements and the annual Metro Vancouver budget, which is prepared to determine the annual revenue requirements to meet expenditure obligations. These differences are outlined in note 17 of the consolidated statements. The complete set of 2017 Audited Financial Statements is attached. These are presented for the Boards approval and include: Audited 2017 Consolidated Financial Statements for the Metro Vancouver Regional District Audited 2017 Financial Statements for the Greater Vancouver Sewerage and Drainage District Audited 2017 Financial Statements for the Greater Vancouver Water District Audited 2017 Financial Statements for the Metro Vancouver Housing Corporation
10 Audited 2017 Financial Statements Regular Committee Meeting Date: April 11, 2018 Page 2 of 7 The consolidated financial statements combine the accounts of the Metro Vancouver Regional District, Greater Vancouver Sewerage and Drainage District, Greater Vancouver Water District and the Metro Vancouver Housing Corporation. To highlight the information presented in these financial statements, the following provides relevant explanations pertaining to the Summarized Consolidated Statement of Financial Position (Appendix 1) and the Consolidated Statement of Operations (Appendix 2). These two statements are the foundation of the audited financial statements. They are similar to the Balance Sheet and Income Statement in private organizations. Summarized Consolidated Statement of Financial Position The purpose of the Consolidated Statement of Financial Position (Appendix 1) is to present the organization s assets, liabilities, net debt position and accumulated surplus or equity position. The accumulated surplus could also be interpreted as the net worth of the organization. Relevant explanations pertaining to the Summarized Consolidated Statement of Financial Position are as follows: Accumulated surplus The key performance indicator on Statement of Financial Position is the Accumulated Surplus. The accumulated surplus for the District is favourable at 4.1 billion, which indicates that the organization owns (Financial and Non-Financial Assets) more than it owes (Liabilities). This amount is often referred to in private organizations as Net Worth, and reflects the member municipalities net investment in the District s consolidated entity. It comprises reserve balances of 3.5 million and the investment in non-financial assets (assets less debt owing) of 3.8 billion. The accumulated surplus increased by million in 2017 which represents the annual surplus for the year, calculated as the difference between revenues and expenses and detailed in Appendix 2. For PSAS purposes, annual surplus does not include contributions to and from reserves, capital contributions or principal payments on long-term debt. Financial Assets Cash, Cash Equivalents and Investments Accounts Receivable Cash, cash equivalents and investments consist of cash and both long and short-term investments. The 2017 balance was significantly higher than 2016 as a result of favourable operating results and due to a million grant received from the Province for the construction of the new North Shore Wastewater Treatment plant. Accounts receivable are amounts due through the normal course of District business and are net of any allowance for doubtful accounts which is minimal. The balance at December 31, 2017 comprises tipping fees due from commercial solid waste haulers, development cost charge (DCC) income, industrial sewer charges from commercial
11 Audited 2017 Financial Statements Regular Committee Meeting Date: April 11, 2018 Page 3 of 7 customers and payments due from our member municipalities for water sales. The amount is higher than 2016, primarily due to the timing of receipts. Asset held for sale At December 31, 2017, Metro Vancouver s two former head office properties were available for sale, as a result, the net book value (historical cost less accumulated depreciation) of the properties has been transferred from non-financial assets (tangible capital assets) to financial assets. Debt Reserve Fund The debt reserve fund represents the amount required, under agreement with the Municipal Finance Authority (MFA), as security for debt service obligations related to MFA debentures issued to the Districts and its members. This represents 1% of the debenture issues. These amounts are refundable, with interest, upon debenture maturity. This balance fluctuates upward with new debt issues and downward as issues mature. The total debt reserve fund balance can be segregated into two components: 1) Member Municipalities and Translink (37.2 million) - This amount is the related to debt service obligations for these organizations and is fully refundable to them. Therefore, it has no impact on Metro Vancouver s financial position. 2) Metro Vancouver (19.7 million) related to debt incurred to fund infrastructure. Liabilities Accounts Payable and Other Liabilities Accounts payable and other liabilities consists of amounts owing: to suppliers for goods received and services rendered, primarily those relating to capital projects; to employees for future benefits which represent the potential payments to employees of entitled benefits, such as banked vacation; to MFA and mortgage providers for interest accrued on debt; and for the District s share of landfill closure and post closure costs at the Vancouver and Cache Creek landfills. The increase of 23.4 million is mostly a result of: 20.6 million in construction holdbacks and trade payables as a result of the increase in capital project spending from million in 2016 to million in 2017; 1.0 million in contaminated sites and landfill liability mainly due changes in assumptions associated with the Vancouver landfill and; 2.1 million for estimated costs to remediate contaminated soils for two properties in GVWD, which is expected to be substantially completed in 2018.
12 Audited 2017 Financial Statements Regular Committee Meeting Date: April 11, 2018 Page 4 of 7 Deferred Revenue and Refundable Deposits Deferred revenue and refundable deposits include: million of restricted funds raised through the collection of development cost charges (DCC s) which will be used to fund future liquid waste growth capital projects; million for Provincial grant associated with the construction of the new North Shore Wastewater Treatment plant; 6.5 million of restricted funds in MVHC which will be used for the replacement of equipment and specified building components and to offset future operating deficits in specific programs; 2.4 million in security deposits in MVHC and Parks; and 4.7 million from miscellaneous deferred grants and revenues in the Regional District. The increase during the year is due mainly to the Provincial grant for the North Shore Wastewater Treatment Plant and additional DCC revenues collected and related interest earned. Debt TransLink and Member Municipalities Debt, net of sinking funds reflects the amount of long term borrowing outstanding at the end of Sinking funds consist of principal payments made over the term of the debt issue. These payments are invested which along with the interest earned will offset the debt repayment at maturity. The debt owing to MFA for TransLink and member municipalities reflects borrowing on behalf of these entities to fund major capital projects. The amount is completely offset reflecting the fact that these entities are responsible for the debt. Therefore, the impact on Metro Vancouver s financial position is nil. Overall debt for these entities decreased by 14.2 million. New long term borrowing during the year totaled 80.5 million relating to debt borrowed by Langley Township (66.0 million), City of White Rock (8.3 million), District of West Vancouver (5.7 million) and the Village of Lions Bay (.5 million). This increase is offset by debt and sinking fund payments of 58.6 million and sinking fund interest earned of 36.1 million. In addition, there was million in debt maturities with an equal offsetting amount of sinking fund retirements. Metro Vancouver The debt owing on behalf of the Metro Vancouver Districts and Metro Vancouver Housing Corporation reflects borrowing to fund major infrastructure projects. The net amount owing for Metro Vancouver at the end of 2017 is million. To put this in context, Metro Vancouver has tangible capital assets of 4.8 billion and an
13 Audited 2017 Financial Statements Regular Committee Meeting Date: April 11, 2018 Page 5 of 7 investment in non-financial assets (assets less debt owing) of 3.8 billion. The debt increased by 39.6 million. New long term borrowing was million borrowed on behalf of GVS&DD (100.0 million) and GVWD (50.0 million). This increase is offset by debt and sinking fund payments of 85.4 million and sinking fund interest earned of 25.0 million. In addition, there was 10.7 million in debt maturities with an equal offsetting amount of sinking fund retirements. Net Debt The net debt position indicates the amount by which the organizations liabilities exceed the financial assets. Although the amount appears as unfavourable, the vast majority of the organization s liabilities are long-term debt which is repayable over several years. The organization s financial assets are more than sufficient to offset the amount of short-term obligations. The current ratio which is current assets divided by current liabilities and is a measure of an organization s liquidity is 5.2 to 1. A ratio of 2 to 1 is considered to be a measure of favourable liquidity. Despite the increase in tangible capital assets of 321 million, the net debt position decreased by 13.8 million, which indicates that more of the District s investment in capital infrastructure is being funded through operations and reserves rather than debt. Overall, the net debt position has been decreasing over the years (634.4 million in 2017 versus million in 2010). Non-Financial Assets Non-financial assets represent the value of tangible capital assets, inventories of supplies held by the organization, the prepaid portion of land leases on housing properties, and prepaid expenses for items such as insurance. The Tangible Capital Assets balance represents the historical cost of the asset less accumulated amortization. The increase in 2017 is the direct result of the capital expenditures made during the year, the majority of which were for water and sewer infrastructure projects. Consolidated Statement of Operations The Consolidated Statement of Operations (Appendix 2) identifies the results of the organization s financial activities for the year by presenting revenues less expenses, which is the annual surplus. This statement consolidates the revenues and expenses of the Districts and MVHC. The annual surplus of million serves as the 2017 addition to the organization s overall accumulated surplus position or net worth of 4.1 billion. The accumulated surplus in this statement is also articulated in the Summarized Consolidated Statement of Financial Position and Equity (Appendix 1).
14 Audited 2017 Financial Statements Regular Committee Meeting Date: April 11, 2018 Page 6 of 7 As noted above, the annual surplus as presented under PSAS is different from the annual surplus as determined in the context of the annual budget. The primary difference is that PSAS excludes contributions to and from reserves as well as capital contributions and principal payments on long term debt. These excluded items form a significant part of the annual approved budget. To put this difference in context, the 2017 surplus consistent with the budget is 44.2 million. Relevant explanations pertaining to the Consolidated Statement of Operations are as follows: Revenues Metered Sale of Water Metered water sales for 2017 was higher 2.8 million higher than anticipated due to slightly higher increase in consumption and 13.3 million higher than prior year as a result of the higher consumption and increase in rates of 3.1%. Tipping fees Tipping fee revenues in Solid Waste were 13.2 million higher than expected, due primarily to higher than expected waste flows in the system during Development cost charges Development cost charges applied against growth capital projects are lower than budget due to debt service costs on growth capital expenditures being less than budget. Property Rentals Property rentals in the Housing Corporation were higher than budget and prior year due to lower vacancy rates and rental rates achieved were higher than expected. Grants and other contributions Grants and other contributions of 9.2 million include subsidies and contributions received by MVHC (8.4 million), grants in-lieu of taxes (0.6 million) and miscellaneous grants received in Parks and Regional functions (.2 million). The amount is higher than budget mainly due to funds related to MVHC s Section 27 properties no longer being restricted and recognized as revenue. Grants were lower than prior year due to a one-time asset granted to Parks in User fees, recoveries and other revenue User fees, recoveries and other revenue were 11.5 million higher than budget mainly in GVS&DD and GVWD as a result of higher amounts received for cost sharing recoveries related to capital projects and amounts received for commercial leases and rentals that were not anticipated during budget preparation. Sinking fund Income and interest income Sinking fund income and interest income pertains to Metro Vancouver sinking funds and investments balances. The income is 7.7 million higher than anticipated and 3.6 million higher than 2016, mainly due to higher reserve balances due to favourable operational results and because of the 193 million grant received from the Province in 2017 for the construction of the new North
15 Audited 2017 Financial Statements Regular Committee Meeting Date: April 11, 2018 Page 7 of 7 Shore Wastewater Treatment plant, which has resulted in higher than anticipated cash and investment balances during the year. Sinking fund income, member and TransLink Expenses Sinking fund income, member and TransLink relates to income earned on sinking funds for debt incurred on behalf of these organizations. This income, although recognized in the Financial Statements, is income attributed to the other organizations. There is an offsetting item under expenses, so the net impact to Metro Vancouver is nil. Details relating to the various expenses can be reviewed in a separate report titled 2017 Financial Results Year-End. ALTERNATIVES These financial statements are a statutory requirement prepared in accordance to specific accounting principles. No alternatives are presented. FINANCIAL IMPLICATIONS There are no financial implications relative to the approval of the Audited 2017 Financial Statements. SUMMARY / CONCLUSION The financial statements are part of the legislated reporting requirements for 2017 and staff recommends their approval. As noted in the Auditors Report, it is the Auditors opinion that these Financial Statements present fairly the financial position of the Metro Vancouver Districts and the Metro Vancouver Housing Corporation as of December 31, 2017, and the results of their financial activities and changes in their financial position for the year then ended in accordance with Canadian public sector accounting standards. Attachments: Appendix 1 - Summarized Consolidated Statement of Financial Position Appendix 2 - Consolidated Statement of Operations Attachment 1 - Metro Vancouver Districts, and Metro Vancouver Housing Corporation Financial Statements for the year ended December 31,
16 APPENDIX 1 METRO VANCOUVER REGIONAL DISTRICT Summarized Consolidated Statement of Financial Position Year ended December 31, Financial Assets Cash, cash equivalents and investments Accounts receivable Asset held for sale Debt reserve fund Total debt reserve fund Less Debt reserve fund, member municipalities and Translink Debt reserve fund, Metro Vancouver Districts 830,609, ,159,964 22,850, ,733,544 98,012,317-56,874,264 (37,220,722) 19,653,542 56,785,649 (38,808,653) 17,976, ,273, ,722, ,709,199 (20,725,606) 162,983, ,292,061 (20,472,302) 139,819, ,220, ,688,704 1,680,758,864 10,925,277 (640,441,917) 1,051,242,224 (1,051,242,224) - 1,743,414,082 11,030,999 (688,990,924) 1,065,454,157 (1,065,454,157) - 1,576,561,985 9,800,329 (631,327,999) 955,034,315 1,452,174,975 9,441,303 (546,138,604) 915,477,674 1,615,238,870 1,332,986,137 Net Debt (634,965,352) (648,263,280) Non-Financial Assets Tangible capital assets Prepaids and inventories 4,765,487,071 17,433,295 4,549,205,879 16,845,724 4,782,920,366 4,566,051,603 Accumulated Surplus (Equity) 4,147,955,014 3,917,788,323 Accumulated Surplus (Equity), beginning of year 3,917,788,323 3,724,397,631 Liabilities Accounts payable and other liabilities Less accrued interest on debt (included in debt below) Accounts payable and other liabilities Deferred revenue and refundable deposits Debt, Translink and member municipalities Total debt, Translink and member municipalities Accrued interest on debt Less sinking funds Due from Translink and member municipalities Debt, Metro Vancouver Total debt, Metro Vancouer Accrued interest on debt Less sinking funds 2016 Revenue Expenses 798,819, ,652, ,125, ,735,212 Annual surplus 230,166, ,390,692 4,147,955,014 3,917,788,323 Accumulated Surplus (Equity), end of year Accumulated Surplus (Equity) consists of Reserves Non-financial assets (net of debt and capital funds) 349,179, ,422,260 3,798,775,564 3,599,366,063 4,147,955,014 3,917,788,323
17 APPENDIX 2 METRO VANCOUVER REGIONAL DISTRICT Consolidated Statement of Operations Year ended December 31, Budget Revenue MVRD property tax requisitions Metered sale of water Sewerage and drainage levy Tipping fees BODTSS industrial charges Steam and electricity sales Development cost charges Trucked liquid waste fees Source control fees Housing property rentals Grants and other contributions User fees, recoveries and other revenue Sinking fund and interest income Sinking fund income, members and TransLink Expenses Sewer operations Waste disposal, recycling and regulatory services Water operations Building operations Housing rental operations General government services Regional parks Air quality Labour relations 911 emergency telephone system Electoral areas Regional global positioning system Sasamat volunteer fire department Regional planning Integrated Partnership for Regional Emergency Management Corporate costs Sinking fund income attributed to members and TransLink Annual surplus Accumulated surplus, beginning of year Accumulated surplus, end of year 52,242, ,710, ,889,658 85,373,222 8,658,686 5,719,900 6,809,038 1,002,175 1,402,066 36,761,446 7,689,701 23,882,051 24,749,598 22,607, Actual 52,242, ,484, ,889,658 98,635,607 9,838,338 5,642,942 5,201,933 1,042,436 1,458,531 38,566,301 9,235,091 35,353,379 32,459,266 30,769, Actual 49,226, ,217, ,250,619 93,504,371 8,495,783 5,796,681 6,045,889 1,023,542 1,178,808 36,828,554 11,841,641 25,586,191 28,837,639 30,291, ,497, ,819, ,125, ,973,031 90,774, ,107,960 20,108,121 34,149,846 5,023,578 29,394,759 8,725,075 2,409,741 4,105, , , ,496 3,535, ,000 49,835,409 22,607, ,853,456 97,562, ,984,262 16,759,703 26,325,365 4,424,441 28,376,649 8,655,317 2,128,059 4,102, , , ,651 2,586, ,344 50,013,047 30,769, ,263,323 99,837, ,011,787 13,199,312 34,119,770 3,360,879 27,077,972 7,386,300 1,949,153 4,019, , , ,903 2,664, ,292 47,441,583 30,291, ,512, ,652, ,735, ,985, ,166, ,390,692 3,917,788,323 3,917,788,323 3,724,397,631 4,069,773,357 4,147,955,014 3,917,788,323
18 ATTACHMENT 1 METRO VANCOUVER DISTRICTS AND METRO VANCOUVER HOUSING CORPORATION (OPERATING AS METRO VANCOUVER) Financial Statements Year ended December 31, 2017 DRAFT April 4, 2018
19 Consolidated Financial Statements of METRO VANCOUVER REGIONAL DISTRICT (OPERATING AS METRO VANCOUVER) Year ended December 31, 2017 DRAFT April 4, 2018
20 METRO VANCOUVER REGIONAL DISTRICT Index to Consolidated Financial Statements December 31, 2017 Exhibit Independent Auditor's Report Management Report Consolidated Statement of Financial Position A Consolidated Statement of Operations B Consolidated Statement of Change in Net Debt C Consolidated Statement of Cash Flows D Notes to Consolidated Financial Statements Schedule Unaudited Consolidated Schedules of: Operating Fund 1 Capital and Other Funds 2
21 Independent Auditor s Report To the members of the Board of Directors of the Metro Vancouver Regional District We have audited the accompanying financial statements of the Metro Vancouver Regional District, which comprise the Statement Financial Position as at December 31, 2017, and the Statements of Operations, Change in Net Debt and Cash Flows for the year then ended, and a summary of significant accounting policies and other explanatory information. Management's Responsibility for the Financial Statements Management is responsible for the preparation and fair presentation of these financial statements in accordance with Canadian public sector accounting standards, and for such internal control as management determines is necessary to enable the preparation of financial statements that are free from material misstatement, whether due to fraud or error. Auditor's Responsibility Our responsibility is to express an opinion on these financial statements based on our audit. We conducted our audit in accordance with Canadian generally accepted auditing standards. Those standards require that we comply with ethical requirements and plan and perform the audit to obtain reasonable assurance about whether the financial statements are free from material misstatement. An audit involves performing procedures to obtain audit evidence about the amounts and disclosures in the financial statements. The procedures selected depend on the auditor's judgment, including the assessment of the risks of material misstatement of the financial statements, whether due to fraud or error. In making those risk assessments, the auditor considers internal control relevant to the entity's preparation and fair presentation of the financial statements in order to design audit procedures that are appropriate in the circumstances, but not for the purpose of expressing an opinion on the effectiveness of the entity's internal control. An audit also includes evaluating the appropriateness of accounting policies used and the reasonableness of accounting estimates made by management, as well as evaluating the overall presentation of the financial statements. We believe that the audit evidence we have obtained is sufficient and appropriate to provide a basis for our audit opinion. Opinion In our opinion, the financial statements present fairly, in all material respects, the financial position of the Metro Vancouver Regional District as at December 31, 2017 and the results of its operations, change in net debt and cash flows for the year then ended in accordance with Canadian public sector accounting standards. Chartered Professional Accountants Vancouver, British Columbia April 27, 2018
22 METRO VANCOUVER DISTRICTS AND METRO VANCOUVER HOUSING CORPORATION (Operating as Metro Vancouver) MANAGEMENT REPORT The Consolidated Financial Statements contained in this report have been prepared by management in accordance with Canadian public sector accounting standards. The integrity and objectivity of these statements are management s responsibility. Management is responsible for all the statements and schedules, and for ensuring that this information is consistent, where appropriate, with the information contained in the financial statements. Management is also responsible for implementing and maintaining a system of internal controls to provide reasonable assurance that reliable financial information is produced. The Metro Vancouver Regional District s Board of Directors is responsible for approving the consolidated financial statements and for ensuring that management fulfills its responsibilities for financial reporting and internal control and exercises this responsibility through the Performance and Audit Committee of the Board. The external auditors, BDO Canada LLP, conduct an independent examination, in accordance with Canadian Auditing Standards, and express their opinion on the consolidated financial statements. Their examination does not relate to the other schedules and statements required by the Financial Information Act. The Independent Auditor s Report outlines the scope of the audit for the year ended December 31, On behalf of the Metro Vancouver Regional District, Greater Vancouver Sewerage & Drainage District, Greater Vancouver Water District and Metro Vancouver Housing Corporation. Phil Trotzuk, Chief Financial Officer Date: April 27, 2018
23 METRO VANCOUVER REGIONAL DISTRICT Exhibit A Consolidated Statement of Financial Position Year ended December 31, Financial Assets Cash and cash equivalents Accounts receivable (note 2) Due from TransLink and member municipalities (note 3) Investments (note 4) Assets held for sale (note 5) Debt reserve fund (note 6) 126,356, ,159,964 1,051,242, ,252,466 22,850,898 56,874,264 39,672,708 98,012,317 1,065,454, ,060,836 56,785,649 2,068,736,464 1,788,985, ,600,841 13,424,900 31,683, ,220,962 37,220, ,925,665 13,658,500 30,707, ,688,704 38,808, ,233,986 1,040,316,947 1,985,550,933 2,703,701, ,036,374 1,054,423,155 1,960,459,529 2,437,248,947 (634,965,352) (648,263,280) 4,765,487,071 6,734,534 5,841,498 4,857,263 4,782,920,366 4,549,205,879 5,829,543 6,036,297 4,979,884 4,566,051,603 4,147,955,014 3,917,788,323 Liabilities Accounts payable and accrued liabilities (note 7) Employee future benefits (note 8) Landfill closure and postclosure liability (note 9) Deferred revenue and refundable deposits (note 10) Debt reserve fund, member municipalities and TransLink (note 6) Debt (net of sinking funds) (note 11) Metro Vancouver Districts and Housing Corporation Translink and member municipalities Total debt Net Debt NonFinancial Assets Tangible capital assets (note 12) Inventories of supplies Prepaid land leases (note 13) Prepaid expenses Accumulated Surplus (note 14) Commitments (note 15) Contingencies (note 16) The accompanying notes are an integral part of these consolidated financial statements. Chief Financial Officer Board Chair
24 METRO VANCOUVER REGIONAL DISTRICT Exhibit B Consolidated Statement of Operations Year ended December 31, Budget (note 17) Revenue (note 18) MVRD property tax requisitions Metered sale of water Sewerage and drainage levy Tipping fees BODTSS industrial charges Electricity sales Development cost charges Trucked liquid waste fees Source control fees Housing property rentals Grants and other contributions User fees, recoveries and other revenue Sinking fund and interest income Sinking fund income, members and TransLink Expenses (note 18) Sewer operations Waste disposal, recycling and regulatory services Water operations Housing rental operations General government services Regional parks Air quality Regional employers services 911 emergency telephone system Electoral areas Regional global positioning system Sasamat volunteer fire department Regional planning Integrated Partnership for Regional Emergency Management Homelessness Partnering Strategy Corporate program costs Building operations Sinking fund income attributed to members and TransLink Annual surplus Accumulated surplus, beginning of year Accumulated surplus, end of year 52,242, ,710, ,889,658 85,373,222 8,658,686 5,719,900 6,809,038 1,002,175 1,402,066 36,761,446 7,689,701 23,882,051 24,749,598 22,607, Actual 52,242, ,484, ,889,658 98,635,607 9,838,338 5,642,942 5,201,933 1,042,436 1,458,531 38,566,301 9,235,091 35,353,379 32,459,266 30,769, Actual 49,226, ,217, ,250,619 93,504,371 8,495,783 5,796,681 6,045,889 1,023,542 1,178,808 36,828,554 11,841,641 25,586,191 28,837,639 30,291, ,497, ,819, ,125, ,973,031 90,774, ,107,960 34,149,846 5,023,578 29,394,759 8,725,075 2,409,741 4,105, , , ,496 3,535, ,000 10,411,745 49,835,409 20,108,121 22,607, ,853,456 97,562, ,984,262 26,325,365 4,424,441 28,376,649 8,655,317 2,128,059 4,102, , , ,651 2,586, ,344 11,072,419 50,013,047 16,759,703 30,769, ,263,323 99,837, ,011,787 34,119,770 3,360,879 27,077,972 7,386,300 1,949,153 4,019, , , ,903 2,664, ,292 8,725,922 47,441,583 13,199,312 30,291, ,512, ,652, ,735, ,985, ,166, ,390,692 3,917,788,323 3,917,788,323 3,724,397,631 4,069,773,357 4,147,955,014 3,917,788,323 The accompanying notes are an integral part of these consolidated financial statements.
25 METRO VANCOUVER REGIONAL DISTRICT Exhibit C Consolidated Statement of Change in Net Debt Year ended December 31, Budget (note 16) Annual surplus Change in tangible capital assets Acquisition of tangible capital assets Amortization of tangible capital assets Transfer of assets held for sale Disposal of tangible capital assets Change in other nonfinancial assets Acquisition of prepaid expenses Use of prepaid expenses Amortization of prepaid land leases Acquisition of inventories of supplies Consumption of inventories of supplies 2017 Actual 2016 Actual 151,985, ,166, ,390,692 (425,757,386) 77,835,646 (347,921,740) (321,020,991) 78,028,209 22,850,898 3,860,692 (216,281,192) (237,318,540) 74,994,413 2,178,085 (160,146,042) 194, ,799 (3,131,454) 3,254, ,799 (6,734,534) 5,829,543 (587,571) (3,210,632) 3,214, ,799 (5,829,543) 5,933, ,583 Change in net debt (195,741,907) 13,297,928 33,547,233 Net debt, beginning of year (648,263,280) (648,263,280) (681,810,513) (844,005,187) (634,965,352) (648,263,280) Net debt, end of year The accompanying notes are an integral part of these consolidated financial statements.
26 METRO VANCOUVER REGIONAL DISTRICT Exhibit D Consolidated Statement of Cash Flows Year ended December 31, ,166, ,390,692 Cash provided by (used in): Operating transactions: Annual surplus Items not involving cash Amortization of tangible capital assets Amortization of prepaid land leases Sinking fund income Debt reserve fund income Accrued interest and unamortized premium or discount Loss on disposal of tangible capital assets Employee future benefit expense Employee future benefits paid Change in landfill closure and postclosure liability Change in noncash assets and liabilities Accounts receivable Due from Translink and member municipalities Accounts payable and accrued liabilities Deferred revenue and refundable deposits Debt reserve fund, member municipalities and TransLink Inventories of supplies Prepaid expenses Net change in cash from operating transactions 78,028, ,799 (61,340,722) (1,115,359) (1,207,069) 1,748,275 2,615,200 (2,848,800) 975,562 74,994, ,799 (52,728,352) (1,578,037) (1,234,731) 1,910,226 1,807,700 (1,905,200) (904,463) (9,147,647) 14,211,933 22,675, ,532,258 (1,587,931) (904,991) 122, ,118,205 18,455,191 51,283,457 (18,590,479) 19,585,093 (902,850) 104,224 3, ,885,243 Capital transactions: Proceeds on sale of tangible capital assets Acquisition of tangible capital assets (net) Net change in cash from capital transactions 2,112,417 (321,020,991) (318,908,574) 267,859 (237,318,540) (237,050,681) Investing transactions: Acquisition of investments Investment maturities Net change in cash from investing transactions (484,298,546) 310,313,985 (173,984,561) (380,755,680) 277,142,878 (103,612,802) Financing transactions: Debenture debt and mortgages issued Debt reserve fund issuances Debt reserve fund maturity Sinking fund payments Principal repayments on housing mortgages and serial debt maturity Sinking fund retirement Debenture debt maturity Net change in cash from financing transactions 231,045,712 (2,304,460) 3,331,204 (124,398,743) (20,214,843) (149,099,080) 149,099,080 87,458, ,772,377 (1,497,724) 2,970,302 (130,824,806) (16,969,306) 139,234,070 (139,234,070) 58,450,843 Net change in cash and cash equivalents 86,683,940 1,672,603 Cash and cash equivalents, beginning of year 39,672,708 38,000,105 Cash and cash equivalents, end of year 126,356,648 The accompanying notes are an integral part of these consolidated financial statements. 39,672,708
27 METRO VANCOUVER REGIONAL DISTRICT Notes to Consolidated Financial Statements, page 1 Year ended December 31, Significant Accounting Policies The Metro Vancouver Regional District s (the District ) (operating as Metro Vancouver) consolidated financial statements reflect the assets, liabilities, revenues and expenses of four legal entities: the Metro Vancouver Regional District ( MVRD ), the Greater Vancouver Sewerage and Drainage District ( GVS&DD ), the Greater Vancouver Water District ( GVWD ) and the Metro Vancouver Housing Corporation ( MVHC ). The MVRD was established under the Local Government Act of British Columbia. It provides a number of specific and agreed upon services directly to the public and its member municipalities, the major one of which is the ownership and operation of a network of regional parks. Its Board of Directors comprises mayors and councilors from the member municipalities appointed for that purpose by the municipalities. The number of directors, and the number of votes each may cast, is based upon the population of the municipality. Under the legislation, all staff, even if their work is under the authority of the related legal entities, are employees of the MVRD. The District serves as the borrowing conduit between member municipalities (excluding the City of Vancouver) and the Municipal Finance Authority of British Columbia (MFA). The GVS&DD and GVWD also access MFA through the MVRD. Prior to the enactment of the South Coast British Columbia Transportation Authority (SCBCTA) in 2007, the District also served as the borrowing conduit for the Greater Vancouver Transportation Authority (GVTA), commonly referred to as TransLink. The District is no longer the borrowing conduit for TransLink; however, under the terms of the SCBCTA Act, the District, SCBCTA and the municipalities in the transportation service region are jointly and severally liable for obligations arising under a security issued by the District on behalf of TransLink. The GVS&DD was established by an Act of the same name in Its two principal responsibilities are the collection, treatment and discharge of liquid waste for the municipalities of the MVRD, and the disposal of solid waste for the municipalities of the MVRD and the public. GVS&DD owns and operates wastewater treatment plants and a related collection network connected to the municipal collection systems, and several solid waste facilities including a waste to energy facility. Its Board of Directors comprises the same councilors and mayors as appointed to the MVRD Board by the participating municipalities. The member municipalities, under the Act, are jointly and severally liable for debts of GVS&DD. The GVWD was established by an Act of the same name in Its primary responsibility is the supply of potable water to its member municipalities. Its Board of Directors comprises the same councilors and mayors as appointed to the MVRD Board by the participating municipalities. GVWD owns or holds under a 999 year lease from the Province, an extensive closed watershed network as its source of supply. It owns a series of dams, reservoirs, water treatment plants and a distribution network connecting to the municipal distribution systems. The member municipalities, under the Act, are jointly and severally liable for debts of GVWD. GVWD also owns and is responsible for operating and maintaining office buildings that are leased to MVRD and its related entities. The MVHC is a whollyowned subsidiary of the MVRD. The MVHC was incorporated under the Business Corporations Act (British Columbia) to own and operate housing sites within the Lower Mainland for the purpose of providing affordable rental housing on a nonprofit basis.
28 METRO VANCOUVER REGIONAL DISTRICT Notes to Consolidated Financial Statements, page 2 Year ended December 31, Significant Accounting Policies (continued) The consolidated financial statements of the District are prepared by management in accordance with Canadian public sector accounting standards ( PSAS ). Significant accounting policies adopted by the District are as follows: Basis of Consolidation The consolidated financial statements reflect the combined assets, liabilities, revenues and expenses of the reporting entity. The reporting entity comprises the MVRD, the GVS&DD, the GVWD and the MVHC. These organizations are controlled by the District. All transactions and balances between these entities have been eliminated on consolidation. Basis of Accounting The District follows the accrual method of accounting for revenue and expenses. Revenue is normally recognized in the year in which it is earned and measurable. Expenses are recognized as they are incurred and measurable as a result of the receipt of goods or services and/or the legal obligation to pay. Government Transfers Government transfers, are recognized as revenue in the financial statements when the transfer is authorized and any eligibility criteria are met, except to the extent that transfer stipulations give rise to an obligation that meets the definition of a liability. The transfer of revenue is initially deferred and then recognized in the statement of operations as the stipulation liabilities are settled. When the District is deemed the transferor, the transfer expense is recognized when the recipient is authorized and has met the eligibility criteria. Deferred Revenue, Refundable Deposits and Restricted Contributions Deferred revenue represents licenses, permits, development cost charges, security deposits, restricted contributions and other fees which have been collected, but for which the related services or obligations have yet to be performed. These amounts will be recognized as revenue in the fiscal year the services are performed or obligations and stipulations have been met. Sinking Fund, Debt Retirement and Interest Income Sinking fund, debt retirement and interest income is reported as revenue in the period earned. When required, based on external restrictions, interest income earned on deferred revenue is added to and forms part of the deferred revenue balance and is recognized into income when related stipulations are met.
29 METRO VANCOUVER REGIONAL DISTRICT Notes to Consolidated Financial Statements, page 3 Year ended December 31, Significant Accounting Policies (continued) Debenture Issue Costs Debenture issue costs are recorded as an expense in operations as incurred. Cash Equivalents Cash equivalents include highly liquid financial instruments with a term to maturity of ninety days or less at the date of acquisition. Cash equivalents are recorded at the lower of cost plus accrued interest and market value. Investments Investments consist of both long and shortterm instruments and are recorded at amortized cost. Shortterm investments consist primarily of money market instruments with an original maturity greater than ninety days at the date of acquisition but less than one year. Longterm investments consist primarily of bonds and fixed income securities with maturity greater than one year at the date of acquisition. Employee Future Benefits The District and its employees participate in the Municipal Pension Plan. The Municipal Pension Plan is a multiemployer contributory defined benefit pension plan. Payments made in the year are expensed. Under the terms of various collective agreements and compensation policies, the District provides paid sick leave to eligible employees and in certain agreements allows unused sick days to accumulate. There are no payouts of unused sick days at termination. In addition, employees acquire certain employee benefits on termination and retirement. These include days for severance based on years of service, vacation based on years of service, Worker s Compensation topup, and a full year s vacation entitlement in the year of retirement. The costs of these benefits are actuarially determined based on service and best estimates of retirement ages and expected future salary and wage increases. The obligation under these benefit plans is accrued based on projected benefits as the employees render services necessary to earn the future benefits. Actuarial gains and losses are amortized over the expected average remaining service period of the related employee group, commencing the year after the gain or loss arises. Landfill Closure and PostClosure Liability The estimated present value of landfill closure and postclosure costs is recognized as a liability. This liability is recognized based on estimated future expenses, including estimated inflation discounted to the current date and accrued based on the proportion of the total capacity of the landfill used as of the date of the statement of financial position. The change in this estimated liability during the year is recorded as an expense in operations. These estimates are reviewed and adjusted annually and any changes are recorded on a prospective basis.
30 METRO VANCOUVER REGIONAL DISTRICT Notes to Consolidated Financial Statements, page 4 Year ended December 31, Significant Accounting Policies (continued) NonFinancial Assets Tangible Capital Assets Nonfinancial assets are not available to discharge existing liabilities and are held for use in the provision of services. They have useful lives extending beyond the current year and are not intended for sale in the ordinary course of operations. Tangible capital assets are recorded at cost which includes amounts that are directly attributable to acquisition, construction, development or betterment of the asset. The cost, less residual value, of the tangible capital assets, except land, is amortized over their estimated useful lives. All assets are amortized on a straight line basis as follows: Asset Buildings Housing Parks Watershed Corporate Head Office Infrastructure Sewer o Wastewater treatment, pumping stations o Interceptors and trunk sewer, drainage Solid Waste Water o Dams, reservoirs o Supply mains o Distribution systems, drinking water treatment Parks o Bridges, culverts, fencing o Trails o Roads, erosion protection, water and sewer systems Information technology systems and networks Vehicles Machinery, Equipment, Furniture and Fixtures Useful Life Years
31 METRO VANCOUVER REGIONAL DISTRICT Notes to Consolidated Financial Statements, page 5 Year ended December 31, Significant Accounting Policies (continued) NonFinancial Assets (continued) Tangible Capital Assets a. Annual amortization Annual amortization begins when the asset is put in service and is expensed over its useful life. Assets under construction are transferred to the appropriate asset class and are amortized from the date the asset is put into productive use. b. Contributions of tangible capital assets Contributions of tangible capital assets are recorded at their fair value at the date of receipt and as contribution revenue. c. Works of art and cultural and historic assets Works of art and cultural and historic assets are not recorded as assets in these financial statements. d. Interest capitalization The Districts do not capitalize interest costs associated with the acquisition or construction of a tangible capital asset. Inventories of Supplies Inventories of supplies held for consumption are recorded at the lower of weightedaverage cost and replacement cost. Prepaid Land Leases Prepaid land leases are recorded at historical cost less accumulated amortization. Upon expiration of the lease contract, the property will revert to the lessor. Prepaid land leases are amortized on a straightline basis over the lease term. Revenue Recognition Property tax revenues and sewerage and drainage revenues from member municipalities are recognized in the year they are levied. Metered sale of water, tipping fees, permits, cost sharing and other revenue are recognized as revenue on an accrual basis according to the usage and rates approved and set by the Board. Housing property rental revenue is recognized over the rental period once the tenant commences occupancy, rent is due and collection is assured. Segmented Information A segment is defined as a distinguishable activity or group of activities of a government for which it is appropriate to separately report financial information to achieve the objectives of the standard. The District has provided definitions of the District s segments as well as presented financial information in segmented format in note 18.
32 METRO VANCOUVER REGIONAL DISTRICT Notes to Consolidated Financial Statements, page 6 Year ended December 31, Significant Accounting Policies (continued) Liability for Contaminated Sites A liability for remediation of a contaminated site is recognized when the site is no longer in productive use and the following criteria are satisfied: an environmental standard exists; contamination exceeds the standard; the District is either directly responsible or has accepted responsibility for remediation; it is expected that future economic benefits will be given up and a reasonable estimate of the liability can be made. Liabilities for contaminated sites is reported in accounts payable and accrued liabilities (note 7). Use of Estimates The preparation of these financial statements requires management to make estimates and assumptions that affect the reported amounts of assets and liabilities and disclosure of contingent assets and liabilities at the date of the financial statements, and the reported amounts of revenues and expenses during the period. These estimates and assumptions are based on management s best information and judgment and may differ from actual results. Adjustments, if any, will be reflected in the financial statements in the period that the change in estimate is made, as well as in the period of settlement if the amount is different. Significant areas requiring the use of management s judgment relate to the determination of accrued liabilities, contaminated sites liabilities, the employee future benefits liability, the amortization rates for tangible capital assets, the landfill closure and postclosure liability in GVS&DD and the assessment of all contingencies. 2. Accounts Receivable 2017 GVWD GVS&DD MVHC MVRD 55,887,752 44,443, ,052 6,459, ,159, ,062,184 37,983, ,267 6,486,467 98,012,317
33 METRO VANCOUVER REGIONAL DISTRICT Notes to Consolidated Financial Statements, page 7 Year ended December 31, Due from TransLink and Member Municipalities The District is reimbursed for amounts paid to the MFA for the obligations incurred on behalf of its member municipalities and TransLink whose undertakings were financed out of the proceeds of these obligations (refer to note 11). The amount recoverable is net of sinking funds and includes accrued interest as follows: TransLink Member Municipalities Net Debt Recoverable Accrued Interest 490,125, ,191,631 1,040,316,947 5,712,873 5,212,404 10,925, ,838, ,404,035 1,051,242, ,173, ,280,333 1,065,454, ,890, ,667,264 (1,805,560) 489,752, ,000,000 27,500, ,252,466 74,328, ,764,943 (3,012,629) 374,080, ,000,000 4,980,050 5,000, ,060, Investments Yields Maturity Dates Bonds: Government % September 2018 March 2031 Corporate % January 2018 December Unamortized premium or discount Term deposits % 0.86% Money market 1.72% 2.21% GICs Total January 2018 August 2019 February 2017 May 2018 November 2019 Government bonds include debt securities issued by the federal and provincial governments of Canada, and the Municipal Finance Authority of British Columbia. Corporate bonds include Schedule I and II chartered banks of Canada. Market value of investments at December 31, 2017 was 704,809,975 ( ,609,625). 5. Assets Held for Sale During 2017, head office operations for MVRD and its related entities were relocated. As at December 31, 2017, the two former head office buildings were made available for sale. The net book value of assets held for sale previously classified in tangible capital assets is as follows: 2017 Land Building 10,253,864 12,597,034 22,850,
34 METRO VANCOUVER REGIONAL DISTRICT Notes to Consolidated Financial Statements, page 8 Year ended December 31, Debt Reserve Fund The MFA provides financing for regional districts and member municipalities. The MFA is required to establish a Debt Reserve Fund for each debenture issue equal to onehalf the average annual installment of principal and interest. The debt reserve fund is comprised of cash deposits equal to 1% of the principal amount borrowed and a noninterest bearing demand note for the remaining requirement. Cash deposits held by the MFA are payable with interest to the ultimate borrower when the final obligations under the respective loan agreements have been made. If, at any time, the District has insufficient funds to meet payments due on its obligations to MFA, the payments will be made from the debt reserve fund. The demand notes are callable only if there are additional requirements to be met to maintain the level of the debt reserve fund. At December 31, 2017, 94,933,241 ( ,527,519) in callable demand notes were outstanding and have not been recorded in the statement of financial position Cash deposits held by MFA on behalf of: Translink and member municipalities Metro Vancouver Districts ,220,722 19,653,542 38,808,653 17,976,996 56,874,264 56,785, Accounts Payable and Accrued Liabilities 2017 Trade accounts Construction holdbacks Accrued interest on debt Wage accruals Contaminated sites (a) Other 88,029,421 14,865,152 20,725,606 12,664,673 2,125, , ,600, ,039,265 6,801,938 20,472,302 12,445, , ,925,665 a) The District accrued 2,125,350 for estimated current costs to remediate contaminated soils for two properties. Plans for remediation of the sites is underway and expected to be substantially completed in 2018.
35 METRO VANCOUVER REGIONAL DISTRICT Notes to Consolidated Financial Statements, page 9 Year ended December 31, Employee Future Benefits The employee future benefits have been based on the results of an actuarial valuation done by an independent actuarial firm. A full valuation was performed as of December 31, Information about liabilities for the District s employee benefit plans is as follows: 2017 Accrued benefit liability: Accrued benefit obligation, end of year Unamortized actuarial loss Accrued benefit liability, end of year 18,117,800 (4,692,900) 13,424, Accrued benefit obligation: Balance, beginning of year Current service cost Interest cost Benefits paid Actuarial (gain) / loss Accrued benefit obligation, end of year 18,970,500 1,508, ,300 (2,848,800) (70,200) 18,117, Employee future benefit expense: Current service cost Interest cost Amortization of the actuarial loss (gain) 1,508, , ,900 2,615, ,970,500 (5,312,000) 13,658, ,409,600 1,014, ,700 (1,905,200) 2,940,000 18,970, ,014, , ,600 1,807,700 The significant actuarial assumptions adopted in measuring the District s accrued benefit obligation are as follows: Discount rates Expected future inflation rates Expected average remaining service period % 1.80% 11 years % 1.80% 11 years
36 METRO VANCOUVER REGIONAL DISTRICT Notes to Consolidated Financial Statements, page 10 Year ended December 31, Landfill Closure and PostClosure Liability The District is responsible for its share of closure and postclosure costs at the four landfill sites, Vancouver, Cache Creek, Coquitlam and Port Mann. The closure and postclosure liability associated with these landfills is as follows: 2017 Vancouver Cache Creek Total closure and postclosure liability ,071, ,000 31,683,458 30,107, ,000 30,707,896 a) The Vancouver landfill is located in Delta, BC. In accordance with an agreement with the City of Vancouver, the District is responsible for its proportionate share of the closure and postclosure liability based on usage. The present value of the District s estimated future liability for these expenses is recognized as the landfill site s capacity is used follows: 2017 Opening Balance Impact due to changes in: Utilization Assumptions Discount rate Closing balance ,107,896 26,746,521 1,822,750 (2,854,153) 1,944,965 31,071,458 1,910,136 1,229, ,494 30,107,896 The closure and postclosure liability and annual expense is calculated based on the ratio of actual utilization to total expected utilization of the site s capacity at the date of closure. It is based on estimates and assumptions with respect to events extending over the remaining life of the Vancouver landfill, including provisions contained in Metro Vancouver s Integrated Solid Waste and Resource Management Plan. The significant estimates and assumptions adopted in measuring the District s share of the closure and postclosure liability are as follows: Current actual utilization (in tonnes) Expected utilization at closure (in tonnes) Permitted capacity (in tonnes) Proportionate share of liability Percent of utilization at closure Discount rate Expected postclosure period Expected closure date ,847,920 26,012,639 33,039, % 78.7% 3.12% 30 years December 31, ,227,644 25,505,982 33,039, % 75.4% 3.68% 30 years December 31, 2037
37 METRO VANCOUVER REGIONAL DISTRICT Notes to Consolidated Financial Statements, page 11 Year ended December 31, Landfill Closure and PostClosure Liability (continued) b) The Cache Creek landfill is located in the Village of Cache Creek, BC. The landfill permit obligates the Village of Cache Creek and a third party service provider to undertake closure and postclosure activities. The District, in accordance with an agreement with the Village, is required to contribute quarterly to a trust fund, held with the Province of British Columbia, to a Post Closure Maintenance and Repair Fund at rates consistent with the operational certificate for the landfill. The agreement indemnifies the Village for any post closure liabilities which are not covered by this fund. At December 31, 2017, the trust had 15,422,726 ( ,833,227). The Cache Creek landfill was closed July The closure and postclosure liability and annual expense is calculated based on the ratio of actual utilization to total expected utilization of the site s capacity at the date of closure. In 2017, no closure costs were paid by the District. (2016 4,083,002). The present value of the District s estimated future liability for closure and postclosure is as follows: 2017 Opening balance Closure costs paid Impact due to change in: Utilization Assumptions Closing balance Less postclosure fund Closure liability ,433,227 19,226,069 (4,083,002) 601,499 16,034,726 (15,422,726) 612,000 62, ,046 15,433,227 (14,833,227) 600,000 The liability is based on significant estimates and assumptions adopted in measuring the closure and postclosure liability and are as follows: Current actual utilization (in tonnes) Expected utilization at closure (in tonnes) Permitted capacity (in tonnes) Percent of utilization at closure Discount rate Expected postclosure period Expected closure date ,318,780 10,318,780 10,371, % 3.12% 30 years n/a ,318,780 10,318,780 10,371, % 3.68% 30 years n/a c) The Coquitlam landfill and Port Mann Landfill were closed in 1983 and 1997, respectively and there are no further closure and postclosure liabilities.
38 METRO VANCOUVER REGIONAL DISTRICT Notes to Consolidated Financial Statements, page 12 Year ended December 31, Deferred Revenue and Refundable Deposits The deferred revenue reported on the consolidated statement of financial position consists of the following: 2017 MVHC restricted funds (a) i) Rental operations Section 27 i) Rental operations BCHMC agreements ii) Replacement projects GVS&DD development cost charges (b) Provincial grant to fund capital expenditures (c) Facility rental security deposits Other Total 1,834,915 4,656,334 6,491, ,702, ,933,312 2,414,141 4,679, ,220, ,473,106 1,799,364 6,662,922 11,935, ,907,487 1,906,906 2,938, ,688,704 a) Amounts received under the following MVHC programs have been recorded as deferred revenue: i) Section 27 Rental Operations: In 2017, MVRD paid 5,909,096 on behalf of MVHC for an early payout of five mortgages related to Section 27 agreements with British Columbia Housing Management Commission ( BCHMC ); MVHC refinanced these mortgages with MVRD at a variable internal rate; in addition, funds deferred under these agreements were no longer restricted and recorded as revenue in the Statement of Operations. ii) Section 95 Rental Subsidy: Pursuant to Section 95 of the National Housing Act ("NHA") a portion of the funds received from rental operations to a cumulative maximum of 500 per unit are restricted and can only be used by MVHC according to the terms of the agreement with BCHMC. The amounts are recorded as deferred revenue and are used when expenditures exceed revenue in the program. iii) Replacement Projects: Under operating agreements entered into with Canada Mortgage and Housing Corporation ( CMHC ) and administered by BCHMC, a portion of the funds received from rental operations are restricted for the replacement of equipment and specified building components. These funds are deferred until spent on approved items. In accordance with the original CMHC agreements (Section 95), from the inception of a project, a maximum of 1% per annum of the original construction cost of the building is restricted and recorded as deferred revenue. With the administrative approval of BCHMC, the potential of restricted contributions may be adjusted from time to time based on an asset life cycle analysis. Expenditures funded from deferred revenue are periodically reviewed by BCHMC, and are restricted to the replacement of equipment and specified building components. In accordance with BCHMC agreements (Homes BC and Seniors project), any receipts in excess of expenses are restricted for approved projected capital repairs and replacements for each project. These revenues are deferred until spent on approved items.
39 METRO VANCOUVER REGIONAL DISTRICT Notes to Consolidated Financial Statements, page 13 Year ended December 31, Deferred Revenue and Refundable Deposits (continued) b) The GVS&DD Act restricts the District to applying money raised from development cost charges to funding sewer capital projects, including the repayment of debt raised to fund such projects. The balance of these amounts at December 31, 2017 is 290,635,638 ( ,907,487) and is included in deferred revenue until spent on approved purposes. c) In 2017, the GVS&DD received a grant from the Province of British Columbia in the amount of 193,000,000 for future costs associated with the construction of the new Lions Gate Wastewater Treatment Plant Facility. Included in deferred revenue is 195,933,312 which represents the full amount of the grant funding plus interest earned. Continuity of deferred revenue and refundable deposits is as follows: 2017 Balance, beginning of year Externally restricted contributions received: GVS&DD development cost charges MVHC restricted funds Provincial government grant Interest earned Other grants and deposits Total contributions received Contributions used and recognized in revenue Net change in externally restricted contributions Change in deposits and other deferred revenues Balance, end of year 277,688, ,103,611 26,836,133 5,791, ,000,000 8,093,951 2,209, ,931,670 (16,525,131) 219,406, ,719 22,232,062 3,638,266 4,917, ,484 31,451,776 (11,968,136) 19,483, , ,532,258 19,585, ,220, ,688, Debt a) All monies borrowed are upon the District s credit at large and, in the event of any default, would constitute an indebtedness for which its members are jointly and severally liable. Debt servicing requirements comprising sinking fund contributions, serial and mortgage principal repayments and interest are funded as incurred by revenue earned during the year.
40 METRO VANCOUVER REGIONAL DISTRICT Notes to Consolidated Financial Statements, page 14 Year ended December 31, Debt (continued) b) In addition to debt incurred directly by the District, the District has also incurred longterm debt on behalf of its member municipalities and TransLink through agreements with the MFA. Under the terms of these agreements, the District is required to provide for and pay to the MFA certain sums. Debt incurred on behalf of others is also presented as due from TransLink and member municipalities (note 3). Where the MFA has determined that sufficient resources exist to retire a debenture on its maturity date without further installments, debenture installments are suspended by the MFA. If the sums provided for are not sufficient, such deficiency shall be a liability of the District to the MFA until legally extinguished. The District is reimbursed for amounts paid to the MFA for the obligations incurred on behalf of the member municipalities and TransLink whose undertakings were financed out of the proceeds of these obligations. The following summarizes the debt incurred by the District as well as debt incurred on behalf of the member municipalities and TransLink. Mortgages and Debenture Debt MVRD GVS&DD GVWD MVHC TransLink Member Municipalities 1,235, ,000,000 1,264,550,930 46,776,055 1,576,561,985 Less Sinking Funds 1,081,585 60,917, ,328, ,327,999 Net Debt , ,082, ,222,076 46,776, ,233,986 Net Debt , ,611, ,446,528 61,689, ,036,374 1,011,581, ,455, ,125, ,957, ,177,735 1,680,758, ,986, ,441, ,191,631 1,040,316, ,465,414 1,054,423,155 3,257,320,849 1,271,769,916 1,985,550,933 1,960,459,529 c) Sinking fund installments are invested by the MFA and earn income which, together with principal payments, are expected to be sufficient to retire the sinking fund debt at maturity. For sinking fund agreements, the MFA has established either a normal sinking fund or a capital repayment equalization fund. d) Debt (net of sinking funds) reported on the statement of financial position is comprised of the following and includes varying maturities up to 2047, with interest rates ranging from 0.03% to 7.20%.
41 METRO VANCOUVER REGIONAL DISTRICT Notes to Consolidated Financial Statements, page 15 Year ended December 31, Debt (continued) Issue number Interest rate % Authorized to be issued Maturity date Municipal Finance Authority ("MFA") Debt Sinking Fund Agreements November 10, 2019 April 24, 2017 November 5, 2017 November 5, 2022 March 24, 2018 September 24, 2018 June 1, 2019 December 1, 2019 June 1, 2020 December 1, 2020 June 1, 2021 December 1, 2021 June 1, 2022 December 3, 2022 June 3, 2023 October 3, 2018 April 22, 2019 December 2, 2024 December 2, 2024 October 13, 2025 April 2, 2026 April 19, 2036 October 19, 2026 October 19, 2026 December 1, 2027 April 23, 2023 November 20, 2028 June 3, 2029 October 13, 2039 April 8, 2030 October 6, 2035 April 4, 2036 April 11, 2042 June 29, 2022 October 4, 2037 April 8, 2043 September 26, 2043 April 7, 2034 October 14, 2029 April 8, 2035 April 19, 2046 October 5, 2031 April 7, 2047 October 4, 2047 Total sinking fund agreements (carried forward) Debt Outstanding ,282,400 36,292,080 83,303,000 15,000,000 63,140, ,270,000 66,635, ,436,535 55,690,000 61,200, ,122,526 62,405, ,100,000 89,252,000 74,024, ,000,000 47,220,000 69,760,000 50,000,000 10,900,000 50,000, ,000,000 66,300, ,000, ,395,000 40,000,000 56,280,930 68,300, ,600,000 60,730,000 74,775, ,292,000 96,000,000 2,000,000 74,961,330 3,000, ,209, ,415,000 50,000, ,500, ,772,377 55,000, ,463,123 77,982, ,000 15,000,000 1,305,000 13,270,000 1,235,000 50,436,535 2,650,000 1,200,000 90,000,000 55,880,000 99,100,000 1,252,000 23,024, ,000,000 20,520,000 59,760,000 50,000,000 5,900,000 50,000, ,000,000 66,300, ,000, ,395,000 40,000,000 56,280,930 68,300, ,000,000 60,730,000 74,775, ,292,000 96,000,000 2,000,000 72,286,330 3,000, ,209, ,415,000 50,000, ,500, ,772,377 55,000, ,463,123 77,982, ,000 3,586,080 3,303,000 15,000,000 1,305,000 13,270,000 1,235,000 50,436,535 2,650,000 48,135,000 90,000,000 55,880,000 99,100,000 11,252,000 23,024, ,000,000 20,520,000 59,760,000 50,000,000 5,900,000 50,000, ,000,000 66,300, ,000, ,395,000 40,000,000 56,280,930 68,300, ,600,000 60,730,000 74,775, ,292,000 96,000,000 2,000,000 74,961,330 3,000, ,209, ,415,000 50,000, ,500, ,772,377 55,000,000 4,196,010,325 3,161,984,775 3,080,637,832
42 METRO VANCOUVER REGIONAL DISTRICT Notes to Consolidated Financial Statements, page 16 Year ended December 31, Debt (continued) Issue number Interest rate % Total sinking fund agreements (brought forward) Serial Debt Authorized to be issued Maturity date ,196,010,325 3,161,984,775 79,014,000 3,000,000 6,300,914 1,999,000 3,141,602 38,665,857 1,782,591 4,177,580 1,499,250 2,434,742 42,533,074 1,974,161 4,563,926 1,599,200 2,591,822 93,455,516 48,560,019 53,262,183 59,648,400 (12,872,345) 46,776,055 68,984,971 (7,295,923) 61,689,048 April 7, 2027 October 1, 2025 March 29, 2026 November 1, 2032 March 28, 2033 Total debenture debt MVHC Mortgages 1.00 to 4.87 Less GVRD financed mortgages Total MVHC Mortgages Debt Outstanding January 2018 to October 2038 Total debt 3,257,320,849 Less sinking funds (1,271,769,916) Total net debt e) 3,080,637,832 1,985,550,933 3,195,589,063 (1,235,129,534) 1,960,459,529 Principal payments and sinking fund installments due within the next five years and thereafter are as follows: Total LongTerm Debt Payments Thereafter Estimated sinking fund income Total 144,186, ,415, ,599, ,704, ,808, ,260,199 1,303,974, ,576,066 1,985,550,933 Less Recoverable from TransLink and Member Municipalities Net Debt Payments 57,223,114 53,418,859 51,861,346 51,867,514 49,825, ,931, ,127, ,188,967 86,962,919 76,996,878 69,738,538 69,837,466 59,982, ,328, ,846, ,387,099 1,040,316, ,233,986
43 1,912,640,507 2,463,975,283 1,055,468, ,600,002 5,686,684,626 Totals 2017 Sewer and Drainage District Water District Regional District Metro Vancouver Housing Corporation 321,020, ,131, ,652,063 15,749,448 1,488, ,020, ,392,745 (191,888,278) 3,897, ,238 (47,770,700) 296,893 7,566,841 2,864, ,949 11,389,430 3,389,394 3,389,394 34,339, ,339 34,492,162 23,745, ,153,677 3,795, ,694,672 13,696, ,000 1,650,033 15,826,033 Additions Cost (65,900,373) (16,626,925) (44,194,346) (2,772,889) (2,306,213) (65,900,373) (655,549) (21,935) (677,484) (15,817,522) (62,278) (279,030) (16,158,830) (153,854) (1,919,234) (2,073,088) (33,878,741) (255,100) (2,027,183) (36,161,024) (514,342) (514,342) (10,315,605) (10,315,605) Disposals and Transfers 5,941,805,244 2,073,144,875 2,546,433,000 1,068,445, ,781,976 5,941,805, ,926, ,879,910 11,540,744 2,952, ,299,755 11,344,309 12,039,916 19,398,540 6,382,063 49,164,828 29,625,981 29,625, ,636,376 27,204, ,173, ,014,593 1,507,374,004 2,086,172, ,788,580 3,697,335,175 79,499,774 44,704, ,886,550 52,274,381 1,053,364,912 Balance at December 31, ,137,478, ,249, ,290,732 86,044, ,894,128 1,137,478,747 20,893,959 3,112,578 13,150,838 4,670,615 41,827, ,854 19,914,801 20,068,655 21,210,985 7,895, ,223, ,329, ,201, ,967,169 45,083, ,252,547 Balance at December 31, 2016 (39,188,783) (13,084,115) (21,281,707) (2,516,748) (2,306,213) (39,188,783) (12,930,261) (62,278) (279,030) (13,271,569) (153,854) (1,831,770) (1,985,624) (21,281,707) (108,358) (2,027,183) (23,417,248) (514,342) (514,342) 78,028,209 29,495,914 35,378,735 9,577,330 3,576,230 78,028,209 1,049, ,472 1,173, ,940 2,913,906 2,486,412 2,486,412 3,103, ,720 3,218,290 6,891,802 28,446,656 31,941,471 5,347,962 65,736,089 Accumulated amortization Disposals and Amortization Transfers Expense Included in net disposals in 2017 is 22,850,898 for assets held for sale (note 2). Write offs related to discontinued projects were 655,549 in 2017 (368,178 in 2016). 5,686,684, ,189, ,768,188 7,665,084 2,125, ,747,939 26,864,938 4,473,075 16,596,071 6,000,144 53,934, ,854 28,155,821 28,309, ,175,294 27,307, ,200, ,683,455 1,483,628,349 1,810,018, ,507,582 3,394,154,845 65,803,774 54,539, ,236,517 52,274,381 1,047,854,484 Balance at December 31, 2016 Construction in progress Sewer and Drainage District Water District Regional District Metro Vancouver Housing Corporation Machinery, equipment, furniture & fixtures Sewer and Drainage District Water District Regional District Metro Vancouver Housing Corporation Vehicles Sewer and Drainage District Water District Regional District Metro Vancouver Housing Corporation Buildings Sewer and Drainage District Water District Regional District Metro Vancouver Housing Corporation Infrastructure Sewer and Drainage District Water District Regional District Metro Vancouver Housing Corporation Land Sewer and Drainage District Water District Regional District Metro Vancouver Housing Corporation Year ended December 31, ,176,318, ,661, ,387,760 93,104, ,164,145 1,176,318,173 9,012,956 3,446,050 14,261,796 4,749,525 31,470,327 20,569,443 20,569,443 3,033,070 8,356, ,414, ,804, ,648, ,908,640 49,917, ,474,294 Balance at December 31, ,765,487,071 1,472,483,497 2,237,045, ,340,503 80,617,831 4,765,487, ,926, ,879,910 11,540,744 2,952, ,299,755 2,331,353 8,593,866 5,136,744 1,632,538 17,694,501 9,056,538 9,056, ,603,306 18,848,579 23,758, ,210, ,725,582 1,783,263,951 53,871,348 2,752,860,881 79,499,774 44,704, ,886,550 52,274,381 1,053,364,912 Net Book Value December 31, 2017 METRO VANCOUVER REGIONAL DISTRICT Notes to Consolidated Financial Statements, page 17 Year ended December 31, Tangible Capital Assets
44 5,455,716,569 1,791,936,438 2,370,790,993 1,039,229, ,759,603 5,455,716,569 Totals 2016 Sewer and Drainage District Water District Regional District Metro Vancouver Housing Corporation 289,182, ,937,523 6,256,172 1,935, ,311,360 28,532,789 4,473,075 16,021,975 5,492,485 54,520, ,854 26,025,528 26,179, ,154,451 23,056, ,200, ,411,250 1,408,263,629 1,653,936,132 94,156,841 3,156,356,602 65,803,774 52,289, ,712,622 52,131,443 1,043,937,651 Balance at December 31, 2015 Construction in progress Sewer and Drainage District Water District Regional District Metro Vancouver Housing Corporation Machinery, equipment, furniture & fixtures Sewer and Drainage District Water District Regional District Metro Vancouver Housing Corporation Vehicles Sewer and Drainage District Water District Regional District Metro Vancouver Housing Corporation Buildings Sewer and Drainage District Water District Regional District Metro Vancouver Housing Corporation Infrastructure Sewer and Drainage District Water District Regional District Metro Vancouver Housing Corporation Land Sewer and Drainage District Water District Regional District Metro Vancouver Housing Corporation Year ended December 31, ,662,713 93,556,353 19,923,915 1,175, ,318, ,318,540 47,007,200 (64,829,234) 2,788, ,802 (14,844,095) 290, , ,819 2,051,045 3,449,313 3,449,313 20,843 4,384,502 4,405,345 75,364, ,114,744 6,853, ,333,057 2,250,000 1,530, ,938 3,923,875 Additions Cost (1,958,644) (372,063) (3,684,616) (335,160) (6,350,483) (6,350,483) (340,101) (1,379,225) (1,719,326) (1,958,644) (343,337) (335,160) (2,637,141) (1,319,020) (1,319,020) (133,140) (133,140) (31,962) (502,852) (534,814) (7,042) (7,042) Disposals and Transfers 1,912,640,507 2,463,975,283 1,055,468, ,600,002 5,686,684,626 5,686,684, ,189, ,768,188 7,665,084 2,125, ,747,939 26,864,938 4,473,075 16,596,071 6,000,144 53,934, ,854 28,155,821 28,309, ,175,294 27,307, ,200, ,683,455 1,483,628,349 1,810,018, ,507,582 3,394,154,845 65,803,774 54,539, ,236,517 52,274,381 1,047,854,484 Balance at December 31, ,951, ,846,812 79,542, ,315,446 1,066,656,732 1,066,656,732 20,102,171 2,897,930 12,465,059 4,571,316 40,036, ,854 19,315,173 19,469,027 18,798,435 7,439, ,744, ,982, ,695, ,150,447 40,322, ,168,782 Balance at December 31, 2015 (1,663,448) (13,157) (2,160,633) (335,160) (4,172,398) (4,172,398) (1,663,448) (316,631) (335,160) (2,315,239) (1,248,175) (1,248,175) (92,975) (92,975) (13,157) (502,852) (516,009) 29,961,316 31,457,077 8,662,178 4,913,842 74,994,413 74,994,413 2,455, ,648 1,002, ,459 4,106,753 1,847,803 1,847,803 2,412, ,150 4,479,383 7,440,083 27,506,080 28,829,879 5,263,815 61,599,774 Accumulated amortization Disposals and Amortization Transfers Expense 584,249, ,290,732 86,044, ,894,128 1,137,478,747 1,137,478,747 20,893,959 3,112,578 13,150,838 4,670,615 41,827, ,854 19,914,801 20,068,655 21,210,985 7,895, ,223, ,329, ,201, ,967,169 45,083, ,252,547 Balance at December 31, ,328,390,928 2,168,684, ,424,526 82,705,874 4,549,205,879 4,549,205, ,189, ,768,188 7,665,084 2,125, ,747,939 5,970,979 1,360,497 3,445,233 1,329,529 12,106,238 8,241,020 8,241, ,964,309 19,412,702 26,976, ,353, ,426,583 1,539,051,745 55,423,970 2,514,902,298 65,803,774 54,539, ,236,517 52,274,381 1,047,854,484 Net Book Value December 31, 2016 METRO VANCOUVER REGIONAL DISTRICT Notes to Consolidated Financial Statements, page 18 Year ended December 31, Tangible Capital Assets (continued)
45 METRO VANCOUVER REGIONAL DISTRICT Notes to Consolidated Financial Statements, page 19 Year ended December 31, Prepaid Land Leases 2017 Balance, beginning of year Amortization ,036,297 (194,799) Balance, end of year 6,231,096 (194,799) 5,841,498 6,036,297 The lease terms for the properties are as follows: Asset Buildings Habitat Villa Lease Expiry Dates Walnut Gardens Other prepaid land leases Lease Term (Years) February May May 2036 to June Accumulated Surplus Accumulated surplus consists of individual fund surplus and reserves as follows: 2017 Reserves Investment in tangible capital assets 349,179,450 3,798,775,564 Total 4,147,955,014 The continuity of reserves is as follows: ,422,260 3,599,366,063 3,917,788,323
46 METRO VANCOUVER REGIONAL DISTRICT Notes to Consolidated Financial Statements, page 20 Year ended December 31, Accumulated Surplus (continued) December 31, 2016 Metro Vancouver Regional District General reserves (brought forward) 24,329,089 Capital reserves Regional parkland acquisition Regional parks legacy fund Regional parks capital maintenance Regional parks capital replacement Regional parks site reclamation Cultural grants Sasamat volunteer fire department Other reserves Asset and equipment replacement Self insurance Greater Vancouver Water District Office building capital improvements Sustainability innovation fund Equipment replacement Lower Seymour Conservation Reserve GVWD debt reserve Greater Vancouver Sewerage and Drainage District Building and equipment replacement District sinking fund reserve Waste to energy facility Landfill post closure Sustainability innovation funds Other Metro Vancouver Housing Corporation Total designated reserves Non-designated (operating) reserves Liquid waste Solid waste Water Regional parks General government Air quality Regional employer services Regional planning 911 telephone Global positioning system West Nile Virus Integrated Partnership for Regional Emergency Management Corporate programs Total non-designated reserves Total reserves Interest 465,459 Annual Operating Surplus Contributions from/ (to) Contributions December 31, operations to Capital ,587 (5,925,041) - 19,312,094 11,713,439 2,613, ,022 8,636, ,267 2,333,727 1,131,978 27,271, ,524 50,580 11, ,742 4,619 63,565 22, ,451 34,651 34,651 3,770,000 (53,000) (132,552) 1,682,000 (110,000) (483,580) 4,672,868 (1,704,907) (117,120) (2,448,766) (138,070) (4,408,863) 14,024,056 2,611, ,550 8,038, ,816 2,287, ,270 28,136,549 8,957,719 2,684,287 11,642,006 63,242, ,038 50, ,372 1,214,282 4,757,401 (154,220) 4,603,181 5,080,419 (1,252,173) (6,992,698) (6,992,698) (11,401,561) 6,854,460 2,580,401 9,434,861 56,883, ,933 10,484, , ,816 7,600,144 19,375,074 10, ,221 10,379 3, , , ,073 46, ,073 (612,280) (612,280) 11,235, , ,221 7,747,158 19,731,233 23,956,722 40,699,761 10,222,838 7,620,473 26,910,890 15,861, ,271,972 12,292, ,181,953 1,086, , , , ,132 2,308, ,657 4,273,576 1,060,483 6,140, ,683 2,624, ,137 1,961,870 6,218,827 12,540,085 18,095,812 (15,441,689) 15,441,689 (827,238) (12,841,079) 8,515,033 57,227,817 11,101,988 10,443,225 28,377,717 18,133, ,799,070 25,437, ,851,164 27,471,313 11,537,826 26,976,541 1,985,171 1,946,842 1,479,303 1,655, , , , , , , ,869 38,325 39,175 27,745 32,243 10,512 12,482 14,614 6,429 8,741,781 10,824,768 17,212,251 1,054,357 1,173, , , , , ,676 (525,371) (648,563) (1,189,655) (8,321,202) (2,764,601) (10,857,831) - 28,715,091 19,783,052 33,194,459 2,429,290 3,159, ,500 1,901,387 1,068, , , , ,177 22,623,926 6, ,667 3,208,214 (38,345) (5,916,199) 98,240,307 1,705,851 43,412,775 (8,087,013) (160,556) - (21,943,634) 290,040 20,428, ,328, ,422,260 5,979,427 49,553,677 10,008,799 (34,784,713) 349,179,450
47 METRO VANCOUVER REGIONAL DISTRICT Notes to Consolidated Financial Statements, page 21 Year ended December 31, Accumulated Surplus (continued) Investment in tangible capital assets is calculated as follows: 15. Commitments As at December 31, 2017, the District had the following commitments relating to projects in progress. Authorized and Outstanding Projects GVS&DD GVWD MVRD MVHC Total 2,063,966, ,600,000 7,247,500 5,650,000 2,947,463,877 Expended at December 31 Total 2017 (589,911,391) (554,000,000) (4,643,845) (2,952,313) 1,151,507,549 1,474,054, ,600,000 2,603,655 2,697,687 1,795,956,328 Total ,165, ,300,000 2,965,214 4,641,635 1,003,072,831
48 METRO VANCOUVER REGIONAL DISTRICT Notes to Consolidated Financial Statements, page 22 Year ended December 31, Contingencies Lawsuits As at December 31, 2017, there were various lawsuits pending against the District arising in the ordinary course of business. The District has retained legal counsel to defend against these lawsuits for which the outcomes are not possible to reasonably determine at this time and therefore no accrual has been recognized. Management is of the opinion that the losses, if any, in connection with these lawsuits can be sufficiently funded by reserve funds or covered by insurance. Any ultimate losses are recorded as expenses at the time the amounts are reasonably determinable. Self Insurance Fund A self insurance fund has been established within accumulated surplus to cover losses resulting from uninsured liability exposures of the District. Each year a review is undertaken to determine if it would be beneficial to purchase additional liability insurance. The District transfers amounts to the reserve depending on the fund s adequacy to cover retained liability risk. An estimate is made for all costs of investigating and settlement of claims annually and an adjustment is made to the fund to maintain an adequate balance to cover potential losses in excess of recorded liabilities. These estimates are changed as additional information becomes known during the course of claims settlement. Any potential costs would be recorded as expenses at the time the losses are known and the amounts are reasonably determinable. Municipal Pension The District and its employees contribute to the Municipal Pension Plan (the Plan Plan), a jointly trusteed pension plan. The board of trustees, representing plan members and employers, is responsible for administering the Plan, including investment of the assets and administration of benefits. The Plan is a multiemployer defined pension plan. Basic pension benefits provided are based on a formula. The plan has about 189,000 active members and approximately 85,000 retired members. Active members include approximately 37,000 contributors from local government. Every three years, an actuarial valuation is performed to assess the financial position of the plan and the adequacy of plan funding. The actuary determines an appropriate combined employer and member contribution rate to fund the plan. The actuary determines an appropriate combined employer and member contribution rate to fund the plan. The actuary s calculated contribution rate is based on the entryage normal cost method, which produces the longterm rate of member and employer contributions sufficient to provide benefits for average future entrants to the plan. This rate is then adjusted to the extent there is amortization of any funding deficit.
49 METRO VANCOUVER REGIONAL DISTRICT Notes to Consolidated Financial Statements, page 23 Year ended December 31, Contingencies (continued) Municipal Pension Plan (continued) The most recent actuarial valuation for the Municipal Pension Plan as of December 31, 2015, indicated a 2,224 million funding surplus for basic pension benefits on a going concern basis. The District paid 13,255,516 for employer contributions ( ,569,504) while employees contributed 11,514,699 ( ,992,408) to the Plan in fiscal The next valuation will be at December 31, 2018 with results available in Employers participating in the plan record their pension expense as the amount of employer contributions made during the fiscal year (defined contribution pension plan accounting). This is because the plan records accrued liabilities and accrued assets for the plan in aggregate resulting in no consistent and reliable basis for allocating the obligation, assets and cost to individual employers participating in the plan. BC Homes Repayable Assistance Under the Umbrella Agreement with BCHMC, the accumulated balance of the repayable assistance is forgiven on a straight line basis over the term of the agreement. As of December 31, 2017 the repayable assistance balance is zero and has been fully forgiven. Debt Reserve Fund The MFA is required to establish a Debt Reserve Fund for each debenture which is comprised of cash deposits and a noninterest bearing demand note (refer to note 6). If, at any time, the District has insufficient funds to meet payments due on its obligations to MFA, the payments will be made from the debt reserve fund. The demand notes are callable only if there are additional requirements to be met to maintain the level of the debt reserve fund, and therefore have not been recorded in the statement of financial position.
50 METRO VANCOUVER REGIONAL DISTRICT Notes to Consolidated Financial Statements, page 24 Year ended December 31, Budget Information The annual budget presented in these financial statements is based upon the 2017 operating and capital budgets approved by the District s Board in October 2016, with additional approval in April 2017 for adjustments to the budget as a result of the 2016 fiscal year end results. The budget is based on operational and capital expenditure requirements and their associated funding. Amortization is a noncash item that is not funded for budget purposes. Alternatively, PSAS do not allow presentation of fund balances nor the appropriations of accumulated surplus. Therefore, contributions to or from reserves and debt principal repayments are removed from the approved budget for financial statement presentation. The schedule below reconciles the approved budget to the budget figures reported in these financial statements. Capital expenditures of 413,970,000 were included in the capital budget approved by the Board in April Budget Budgeted annual surplus per Exhibit B Statement of Operations Additional transfers from reserves, approved by Board April ,074, ,059,527 Adjusted annual surplus, based on October approved budget Items not included in the operating budget Amortization of tangible capital assets Amortization of prepaid land leases Sinking fund and debt retirement income Reserve interest Contributions from deferred revenue BCHMC operating subsidy 77,835, ,799 (18,781,212) (5,929,275) (3,382,578) (116,046) Items included in budget but not in financial statements MVHC's capital replacement expenses per approved budget Sinking fund and debt retirement payments Transfers to capital fund Transfers from reserve funds Transfer to reserve funds Annual surplus per approved budget 151,985,034 6,974,446 (75,362,043) (133,488,754) 11,609,384 (13,613,894)
51 METRO VANCOUVER REGIONAL DISTRICT Notes to Consolidated Financial Statements, page 25 Year ended December 31, Segmented Information The District is a diversified municipal government organization that provides a wide range of services directly to the public and its member municipalities through its four legal entities: the MVRD, the GVS&DD, the GVWD and the MVHC. For management reporting purposes, the District s operations and activities are organized and reported by service areas within the legal entities. The salaries and benefits reported in the segmented information below do not include 19,331,934 ( ,118,163) directly attributable to the construction of tangible capital assets which have been capitalized and included in tangible capital assets in the Statement of Financial Position. The legal entities disclosed in the segmented information, along with the service areas provided are as follows: MVRD General Government General Government includes services responsible for overall direction and monitoring and regional initiatives. This area comprises the Regional Board & Committee Remuneration, Corporate Secretary s Office, Audit, Legal and Insurance costs, Innovation, Regional Emergency Management, Regional Cultural Strategy and External Contributions. Regional Parks Regional Parks is responsible for managing, maintaining and protecting a diverse network of 24 Regional Parks and an expanding land base of reserves, ecological conservancy areas and greenways, located throughout the Region. Air Quality Air Quality is responsible for monitoring air quality in the region, controlling industrial, commercial and some residential emissions, creating longterm plans and conducting emission inventories. Regional Employee Services Regional Employee Services provides collective bargaining, job evaluation, research and other related labour relations services to those MVRD municipalities who are members of the function. 911 Emergency Telephone Service The District contracts with EComm Corporation to provide 911 service for all municipalities within the region as well as the community of Whistler and the Sunshine Coast Regional District.
52 METRO VANCOUVER REGIONAL DISTRICT Notes to Consolidated Financial Statements, page 26 Year ended December 31, Segmented Information (continued) MVRD (continued) Electoral Areas The District is responsible for providing general and local services to Electoral Area A. Electoral Area A includes the following: the west side of Pitt Lake the northern portion of Indian Arm a portion of land between the District of West Vancouver and Squamish Lillooet Regional District (excluding the Village of Lions Bay) the islands of Bowyer, Passage and Barnston the University Endowment Lands (including Pacific Spirit Regional Park) the University of British Columbia General services provided include a variety of taxsupported, regional services that are provided to other member municipalities, such as 91 1 emergency telephone, air quality, labour relations, regional parks, strategic planning and general government. Local services provided are specific to the needs of communities within the Electoral Area and include building permit and inspection, local planning, land use planning, election and general administration. Regional Global Positioning System The District s Global Positioning System (GPS) RealTime Service is offered to member municipalities and to the public in partnership with the B.C. Crown Registry and Geographic Base (CRGB) Branch. Sasamat Volunteer Fire Department The Sasamat Volunteer Fire Department provides volunteer fire department services to the Villages of Anmore and Belcarra. The cost to support this function is borne completely by the members who receive the service. Regional Planning Regional Planning s core responsibilities are focused on regional growth management, utility management and air quality management. Primary activities include development and implementation of a wide range of innovative policies and plans, extensive research, modeling and technical analysis, regulation, business demand management and community education. Integrated Partnership for Regional Emergency Management Integrated Partnership for Regional Emergency Management ( IPREM ) is an intergovernmental partnership between the Province of British Columbia and Metro Vancouver (on behalf of the 23 local authorities). IPREM was formed to coordinate regional emergency management planning activities. IPREM is designed to collaboratively engage all levels of government and private sector agencies in regional emergency planning initiatives for the Metro Vancouver region.
53 METRO VANCOUVER REGIONAL DISTRICT Notes to Consolidated Financial Statements, page 27 Year ended December 31, Segmented Information (continued) MVRD (continued) West Nile Virus The West Nile Virus program provides a proactive approach to the potential arrival of the virus. On lands that it owns, the District controls mosquitoes that may carry the virus. Regionally, the District provides participating member municipalities with communication and program implementation, leadership and facilitation. Corporate Programs Corporate Programs include departments that provide centralized services to the Districts. These departments include the Corporate Planning, External Relations, Financial Services, Human Resources, Legal and Legislative Services and Corporate Services. Costs for these programs are allocated to GVWD, GVS&DD, MVHC and MVRD, and are eliminated upon consolidation of the entities. GVS&DD Liquid Waste Management Services The Liquid Waste Management Service is responsible for the collection, treatment and discharge of liquid waste for member municipalities. It operates a number of wastewater treatment plants and a related collection network connected to the member municipalities systems. Solid Waste Management Services The Solid Waste Management Service is responsible for the disposal of solid waste both for the member municipalities and the public. It owns and operates several solid waste facilities including a waste to energy facility. GVWD Water Operations Water Operations is responsible for the supply of potable water to its member municipalities. It owns a series of dams, reservoirs, water treatment plants and a distribution network connected to the member municipalities systems. Building Operations Building Operations is responsible for operating and maintaining office buildings owned by GVWD. These facilities are leased to MVRD and its related entities for its head office operations as well as to external parties. MVHC Metro Vancouver Housing Corporation is a whollyowned subsidiary of MVRD, which owns and operates housing sites within the Lower Mainland for the purpose of providing affordable rental housing on a nonprofit basis through various housing programs, some federally and some provincially funded. MVHC s portfolio consists of rentgearedto income, partial rent assistance, and lowendofmarket units.
54 Annual surplus Expenses Salaries and benefits Consulting, contracted and professional services Asset repairs and maintenance Materials and supplies Utilities, permits and taxes Corporate costs Other Amortization of tangible capital assets and prepaid land leases Loss on disposal of tangible capital assets Interest on longterm debt Revenue MVRD property tax requisitions Metered sale of water Sewerage and drainage levy Tipping fees BODTSS industrial charges Electricity sales Development cost charges Trucked liquid waste fees Source control fees Housing property rentals Grants and other contributions User fees, recoveries and other revenue Sinking fund and interest income Sinking fund income, members and TransLink 3,112,753 9,577,330 94,054 97,824,615 64,874,649 2,379,368 48,294, ,988, ,855,222 59,471,031 25,292,370 4,001,879 4,013,168 1,482,792 (45,793,424) 39,685,415 52,242, ,082 14,162,436 2,888,355 30,769, ,937,368 97,219, ,612,975 17,764,332 21,326,915 21,462,982 41,545,637 30,507, ,484, ,889,658 98,635,607 9,838,338 5,642,942 5,201,933 1,042,436 1,458,531 30,323,609 29,325, ,843,309 Other Districts (note 18(b)) Regional District (note 18(c)) 3,771,029 2,001,698 34,780,867 5,134, ,420 11,711,414 62,062 6,129,533 4,124,930 1,241,601 38,566,301 8,359,684 7,660, ,630 54,979,583 20,198,716 Metro Vancouver Housing Corporation (147,703) (16,941,002) (3,964,034) 122,857 (12,952,122) (16,793,299) (147,703) (16,941,002) Interdistrict Adjustments 78,223,008 2,379,368 50,242, ,652, ,825, ,509,765 29,513,591 25,402,145 29,075,307 58,482,090 52,242, ,484, ,889,658 98,635,607 9,838,338 5,642,942 5,201,933 1,042,436 1,458,531 38,566,301 9,234,766 35,353,714 32,459,256 30,769, ,819, ,166,691 Consolidated Actual ,835,646 86,226, ,512, ,469, ,730,464 34,540,753 31,916,416 29,792,324 31,001,372 52,242, ,710, ,889,658 85,373,222 8,658,686 5,719,900 6,809,038 1,002,175 1,402,066 36,761,446 7,689,701 23,882,040 24,749,609 22,607, ,497, ,985,034 Consolidated Budget ,994,413 49,869, ,735, ,907, ,738,706 29,397,459 25,755,620 25,429,294 58,642,877 50,291, ,217, ,250,619 93,504,371 8,495,783 5,796,681 6,045,889 1,023,542 1,178,373 36,828,554 11,841,641 24,521,650 28,837,639 30,291, ,125, ,390,692 Consolidated Actual 2016 METRO VANCOUVER REGIONAL DISTRICT Notes to Consolidated Financial Statements, page 28 Year ended December 31, Segmented Information (continued) a) Total Consolidated
55 Annual surplus Expenses Salaries and benefits Consulting, contracted and professional servic Asset repairs and maintenance Materials and supplies Utilities, permits and taxes Corporate costs Other Amortization of tangible capital assets Loss on disposal of tangible capital assets Interest on longterm debt Revenue Metered sale of water Sewerage and drainage levy to members Tipping fees BODTSS industrial charges Electricity sales Development cost charges Trucked liquid waste fees Source control fees Sinking fund and interest income User fees, recoveries and other revenue 64,954,891 54,890,741 22,389,067 11,864,867 12,511,483 11,627,842 19,588,472 8,327,499 23,877, ,549 6,509, ,242, ,889,658 9,838,338 5,201,933 1,042,436 1,458,531 3,897,623 1,869, ,197,851 Liquid Waste 9,762,606 5,444,364 74,577, ,546 44, ,061 5,207,822 8,491,717 5,618,412 1,723,819 (534,410) 101,672,344 98,635,607 5,642,942 1,850,034 5,306, ,434,950 Solid Waste 74,717,497 60,335,105 96,966,509 12,645,413 12,556,054 11,945,903 24,796,294 16,819,216 29,495,914 2,379,368 5,975, ,915, ,889,658 98,635,607 9,838,338 5,642,942 5,201,933 1,042,436 1,458,531 5,747,657 7,175, ,632,801 Total Sewerage & Drainage District 126,432,770 36,149,870 9,371,859 3,485,676 8,706,031 7,721,769 22,156,643 11,200,954 32,241,398 36,847, ,881, ,484,281 23,099,186 6,731, ,314,508 Water Operations 734,845 1,274,607 1,696,795 64,830 1,795,310 2,584,832 3,137,337 5,471,147 16,759, ,131 21,985,527 22,464,658 5,704,955 Building Operations (5,568,658) (5,407,300) (97,806) (63,552) (5,568,658) (5,568,658) Elimination Entry 132,137,725 36,884,715 10,646,466 5,118,919 8,770,861 9,517,079 16,749,343 13,687,980 35,378,735 42,318, ,072, ,484,281 23,578,317 23,147, ,210,508 Total Water District 206,855,222 97,219, ,612,975 17,764,332 21,326,915 21,462,982 41,545,637 30,507,196 64,874,649 2,379,368 48,294, ,988, ,484, ,889,658 98,635,607 9,838,338 5,642,942 5,201,933 1,042,436 1,458,531 29,325,974 30,323, ,843,309 Total Other Districts Actual ,714, ,543, ,792,801 18,583,418 25,797,737 21,568,747 41,440,234 23,461,596 64,011,666 61,379, ,579, ,710, ,889,658 85,373,222 8,658,686 5,719,900 6,809,038 1,002,175 1,402,066 22,759,084 19,969, ,294,242 Total Other Districts Budget ,372,538 96,016, ,483,668 16,309,182 21,850,233 18,027,938 48,914,975 22,650,347 61,418,393 47,222, ,893, ,217, ,250,619 93,504,371 8,495,783 5,796,681 6,045,889 1,023,542 1,178,373 26,755,469 23,997, ,266,102 Total Other Districts Actual 2016 METRO VANCOUVER REGIONAL DISTRICT Notes to Consolidated Financial Statements, page 29 Year ended December 31, Segmented Information (continued) b) Total Other Districts
56 Annual surplus Expenses Salaries and benefits Consulting, contracted and professional services Asset repairs and maintenance Materials and supplies Utilities, permits and taxes Corporate costs Other Amortization of tangible capital assets Interest on longterm debt Revenue MVRD property tax requisitions Grants and other contributions User fees, recoveries and other revenue Sinking fund and interest income Sinking fund income, members and TransLink Regional Parks Air Quality 4,589,545 1,199,116 1,385, ,947 3,215,317 3,911,481 1,576,065 94,054 32,203,547 1,473,434 8,848 32,001 1, , ,145 4,976,485 1,785, , , , , , ,969 9,245,821 5,614,377 8,728,131 4,694,136 83,619 25,910 2,283 5,722 2, ,775 96,422 2,420,834 1,994,816 2,369,224 1,282,621 32,243 4,077,591 25,266 82,115 4,184,972 4,197,582 66,426 12,482 26, ,300 32,329 12, , , ,288 13,584 34, ,709 9,716 62,421 3, , , , ,279 14,614 54,187 86,132 25,826 20,078 6,571 11,560 25, ,223 22, ,453 15,000 22,221 1,842,211 4,550,258 (517,690) (51,610) 12, , , ,230 15,576,449 36,753,805 2,198, ,066 2,290,684 6,818,696 (26,584) 1,194,142 Regional Planning IPREM 780 2,844 15,000 27, , , ,208 6, ,246 (32,136) 600,298 3,347 4,169 1, ,616 90,190 2,822,781 1,886,336 3,400,027 13,850 34,408 6,429 6,429 31,062,452 (4,739,038) (5,566,321) 827,283 1,970,890 2,571,393 2,290, ,865 (50,879,116) 3,750,880 7,547,264 (1,026,966) Corporate Programs Regional District Actual ,292,370 4,001,879 4,013,168 1,482,792 (45,793,424) 39,685,415 9,577,330 94,054 97,824,615 59,471,031 30,769, ,937,368 14,162,436 2,888,355 3,112,753 30,769,251 30,769,251 30,769,251 30,769,251 52,242, ,082 Members and TransLink, Sinking Fund Income 6,429 (3,712,072) 10,687, ,037 11,072, ,815 11,072,419 11,072,419 Homelessness Partnering West Nile Strategy Virus 325,232 3,351, , ,000 Sasamat Regional 911 Volunteer Global Emergency Fire Telephone Electoral Positioning System Department Service Areas 5,003,653 33,916,446 3,950,376 1,054,360 4,118, , ,485 19,267 58,330 General Government Regional Employee Services (7,190,141) 22,578,363 6,019,915 5,932,848 1,606,143 (41,020,844) 10,808,303 10,236,666 22,789, ,283,626 62,333,092 22,607,356 94,093,485 16,480,318 1,777,733 52,242, ,834 Regional District Budget ,221,913 21,765,686 3,136,730 3,835,548 1,373,698 (43,003,588) 38,157,812 8,662, ,127 90,357,429 56,278,238 30,291, ,579,342 15,276,147 1,786,032 49,226,433 5,998,845 Regional District Actual 2016 METRO VANCOUVER REGIONAL DISTRICT Notes to Consolidated Financial Statements, page 30 Year ended December 31, Segmented Information (continued) c) Total Regional District
57 METRO VANCOUVER REGIONAL DISTRICT Notes to Consolidated Financial Statements, page 31 Year ended December 31, Comparative Figures Certain comparative figures have been reclassified to conform with current year s presentation.
58 On-Table Replacement Item 5.1 Attachment 1 METRO VANCOUVER REGIONAL DISTRICT Schedule 1 Consolidated Schedule of Operating Fund (unaudited) Year ended December 31, Budget Revenue MVRD property tax requisitions Metered sale of water Sewerage and drainage levy Tipping fees BODTSS industrial charges Electricity sales Development cost charges Trucked liquid waste fees Source control fees Housing property rentals Grants and other contributions Sinking fund and interest income User fees, recoveries and other revenue Expenses Core functions Sewer operations Waste disposal, recycling and regulatory services Water operations Housing rental operations General government services Regional parks Air quality Regional employers services 911 emergency telephone system Electoral areas Regional global positioning system Sasamat volunteer fire department Integrated Partnership for Regional Emergency Management Homelessness Partnering Strategy Regional planning Revised Corporate functions Corporate services Building operations Corporate planning Legal and legislative services External relations Financial services Human resources Self insurance Annual surplus, operating fund Application of surplus and transfers Principal repayment on long-term debt Transfers from (to): Capital and other funds Investment in non-financial assets Sinking and debt retirement funds Reserve funds for: Reserves - Operating results Reserves 2017 Actual 52,242, ,710, ,889,658 85,373,222 8,658,686 5,719,900 6,809,038 1,002,175 1,402,066 36,761,446 7,689, ,335 23,882, ,373, Actual 52,242, ,484, ,889,658 98,635,607 9,838,338 5,642,942 5,201,933 1,042,436 1,458,531 38,566,301 9,235, ,488 30,693, ,704,669 49,226, ,217, ,250,619 93,504,371 8,495,783 5,796,681 6,045,889 1,023,542 1,178,808 36,828,554 6,713,039 (270,297) 24,527, ,539, ,994,667 85,105, ,035,239 30,562,532 5,023,578 27,791,046 8,356,835 2,409,741 4,105, , , , ,000 10,411,745 3,535, ,651, ,320,405 90,220, ,742,864 26,274,376 4,424,441 26,800,584 8,226,348 2,128,059 4,102, , , , ,344 11,072,419 2,586, ,912, ,599,852 92,991,437 99,865,858 29,205,928 3,360,879 25,539,369 7,154,109 1,949,153 4,019, , , , ,292 8,725,922 2,664, ,450,071 15,835,165 16,815, ,699 3,213,379 5,719,645 11,528,405 4,429,752 58,418, ,069,870 14,243,466 11,413, ,551 2,241,992 5,582,153 10,938,379 4,360, ,220 49,754, ,667,205 17,771,626 10,888,164 1,543,933 2,570,338 4,752,367 10,162,767 4,233,345 76,303 51,998, ,448, ,303, ,037, ,090,262 (10,064,327) (9,603,587) (12,386,900) (136,441,427) 194,799 (64,965,043) (137,491,031) 249,346 (70,629,716) (126,265,499) 241,227 (65,043,585) (4,890,152) 10,862,744 (49,553,677) (10,008,799) (30,719,106) 1,083,601 Change in accumulated surplus from operating fund Operating fund, beginning of year Operating fund, end of year - - -
59 METRO VANCOUVER REGIONAL DISTRICT Schedule 2 Consolidated Schedule of Capital and Other Funds (unaudited) Year ended December 31, Budget Revenues Grants and other contributions Gain (loss) on disposal of assets Debt reserve fund and interest income Other income Expenses Amortization of tangible capital assets Debenture and mortgage expense 2017 Actual (1,748,275) 446,684 1,819, , Actual 4,985,664 (1,910,226) 782,933 2,808,445 6,666,816 77,835,646 77,835,646 78,028, ,689 78,627,898 74,994,413 74,994,413 (77,835,646) (78,109,857) (68,327,597) 190,425, ,398,488 20,283,898 5,650, ,757,386 (77,835,646) 194, ,116, ,131, ,652,063 15,749,448 1,488, ,020,991 (78,028,209) 249,346 (22,850,898) (3,860,692) 216,530, ,662,713 93,556,353 19,923,915 1,175, ,318,540 (74,994,413) 241,227 (2,178,085) 160,387, ,605, ,000, ,000, ,441,427 40,717, ,764, ,491,031 34,784, ,875, ,265,499 28,098, ,363,624 80,648, ,344, ,976,355 Change in capital and other funds 2,812,538 28,235,038 80,648,758 Fund balances, beginning of year (43,803,463) (43,803,463) (124,452,221) Annual deficit, capital and other funds Nonfinancial assets transactions Acquisition of tangible capital assets Sewer and Drainage District Water District Regional District Housing Corporation Amortization of tangible capital assets Change in prepaid expenses and leases Transfer of asset held for sale Disposal of tangible capital assets Financing Debenture debt issued Transfers from: Operating funds Reserve funds Fund balances, end of year Capital and Other Funds consists of: Prepaid land leases Temporary financing from working capital (40,990,925) (15,568,425) (43,803,463) 5,841,498 (21,409,923) (15,568,425) 6,036,297 (49,839,761) (43,803,464)
60 Financial Statements of GREATER VANCOUVER SEWERAGE AND DRAINAGE DISTRICT Year ended December 31, 2017 DRAFT April 4, 2018
61 GREATER VANCOUVER SEWERAGE AND DRAINAGE DISTRICT Index to Financial Statements December 31, 2017 Exhibit Independent Auditor's Report Management Report Statement of Financial Position A Statement of Operations B Statement of Change in Net Financial Assets (Net Debt) C Statement of Cash Flows D Notes to Financial Statements Schedule Unaudited Schedules of: Operating Fund 1 Capital and Other Funds 2
62 Independent Auditor s Report To the members of the Board of Directors of the Greater Vancouver Sewerage and Drainage District We have audited the accompanying financial statements of the Greater Vancouver Water District, which comprise the Statement Financial Position as at December 31, 2017, and the Statements of Operations, Change in Net Debt and Cash Flows for the year then ended, and a summary of significant accounting policies and other explanatory information. Management's Responsibility for the Financial Statements Management is responsible for the preparation and fair presentation of these financial statements in accordance with Canadian public sector accounting standards, and for such internal control as management determines is necessary to enable the preparation of financial statements that are free from material misstatement, whether due to fraud or error. Auditor's Responsibility Our responsibility is to express an opinion on these financial statements based on our audit. We conducted our audit in accordance with Canadian generally accepted auditing standards. Those standards require that we comply with ethical requirements and plan and perform the audit to obtain reasonable assurance about whether the financial statements are free from material misstatement. An audit involves performing procedures to obtain audit evidence about the amounts and disclosures in the financial statements. The procedures selected depend on the auditor's judgment, including the assessment of the risks of material misstatement of the financial statements, whether due to fraud or error. In making those risk assessments, the auditor considers internal control relevant to the entity's preparation and fair presentation of the financial statements in order to design audit procedures that are appropriate in the circumstances, but not for the purpose of expressing an opinion on the effectiveness of the entity's internal control. An audit also includes evaluating the appropriateness of accounting policies used and the reasonableness of accounting estimates made by management, as well as evaluating the overall presentation of the financial statements. We believe that the audit evidence we have obtained is sufficient and appropriate to provide a basis for our audit opinion. Opinion In our opinion, the financial statements present fairly, in all material respects, the financial position of the Greater Vancouver Sewerage and Drainage District as at December 31, 2017 and the results of its operations, change in net debt and cash flows for the year then ended in accordance with Canadian public sector accounting standards. Chartered Professional Accountants Vancouver, British Columbia April 27, 2018
63 METRO VANCOUVER SEWERAGE & DRAINAGE DISTRICT MANAGEMENT REPORT The Financial Statements contained in this report have been prepared by management in accordance with Canadian public sector accounting standards. The integrity and objectivity of these statements are management s responsibility. Management is responsible for all the statements and schedules, and for ensuring that this information is consistent, where appropriate, with the information contained in the financial statements. Management is also responsible for implementing and maintaining a system of internal controls to provide reasonable assurance that reliable financial information is produced. The Greater Vancouver Sewerage & Drainage District s Board of Directors is responsible for approving the financial statements and for ensuring that management fulfills its responsibilities for financial reporting and internal control and exercises this responsibility through the Performance and Audit Committee of the Board. The external auditors, BDO Canada LLP, conduct an independent examination, in accordance with Canadian Auditing Standards, and express their opinion on the financial statements. Their examination does not relate to the other schedules and statements required by the Financial Information Act. The Independent Auditor s Report outlines the scope of the audit for the year ended December 31, On behalf of Greater Vancouver Sewerage & Drainage District. Phil Trotzuk, Chief Financial Officer Date: April 27, 2018
64 GREATER VANCOUVER SEWERAGE AND DRAINAGE DISTRICT Exhibit A Statement of Financial Position Year ended December 31, Financial Assets Cash Accounts receivable Due from Metro Vancouver Regional District Debt reserve fund (note 2) Liabilities Accounts payable and accrued liabilities (note 3) Landfill closure and postclosure liability (note 4) Deferred revenue (note 5) Debt (net of sinking funds) (note 6) Net Financial Assets (Net Debt) NonFinancial Assets Tangible capital assets (note 7) Inventories of supplies Prepaid expenses Accumulated surplus (note 8) 44,321,035 44,443, ,829,441 3,051, ,644, ,003,249 69,470,508 31,683, ,635, ,082,440 53,019,506 30,707, ,907, ,611, ,872, ,246,689 (39,227,072) 30,756,560 1,472,483,497 4,341,637 1,728,411 1,478,553,545 65,822 37,983, ,780,240 2,173,788 1,439,326,473 Commitments (note 9) Contingencies (note 10) The accompanying notes are an integral part of these financial statements. Chief Financial Officer Board Chair 1,328,390,928 3,678,141 1,783,347 1,333,852,416 1,364,608,976
65 GREATER VANCOUVER SEWERAGE AND DRAINAGE DISTRICT Exhibit B Statement of Operations Year ended December 31, Budget (note 11) Revenue (note 12) Sewerage and drainage levy to members Tipping fees BODTSS Industrial Charges Electricity sales Development cost charges (note 5) Trucked liquid waste fees Source control fees Sinking and debt retirement fund income Interest income User fees, recoveries and other revenue Expenses (note 12) Liquid waste Solid waste Annual surplus Accumulated surplus, beginning of year Accumulated surplus, end of year 213,889,658 85,373,222 8,658,686 5,719,900 6,809,038 1,002,175 1,402,066 2,515,334 3,043,150 4,684, ,097, Actual 213,889,658 98,635,607 9,838,338 5,642,942 5,201,933 1,042,436 1,458,531 2,751,567 2,996,090 7,175, ,632, Actual 200,250,619 93,504,371 8,495,783 5,796,681 6,045,889 1,023,542 1,178,808 3,248,236 2,977,829 8,932, ,454, ,561,502 94,645, ,242, ,672, ,632, ,675, ,206, ,915, ,308,529 51,890,805 74,717,497 58,146,161 1,364,608,976 1,364,608,976 1,306,462,815 1,416,499,781 1,439,326,473 1,364,608,976 The accompanying notes are an integral part of these financial statements.
66 GREATER VANCOUVER SEWERAGE AND DRAINAGE DISTRICT Exhibit C Statement of Change in Net Financial Assets (Net Debt) Year ended December 31, Budget (note 11) Annual surplus Change in tangible capital assets: Acquisition of tangible capital assets Amortization of tangible capital assets Disposal of tangible capital assets 51,890,805 (190,425,000) 29,646,787 (160,778,213) Change in other nonfinancial assets: Acquistion (use) of prepaid expenses (net) Acquisition of inventories of supplies Consumption of inventories of supplies Net financial assets, beginning of year 74,717, Actual 58,146,161 (177,131,293) 29,495,914 3,542,810 (144,092,569) (122,662,713) 29,961, ,196 (92,406,201) 54,936 (4,341,637) 3,678,141 (608,560) (14,095) (3,678,141) 3,754,854 62,618 (108,887,408) (69,983,632) (34,197,422) 30,756,560 30,756,560 64,953,982 Changes in net financial assets Net financial assets (net debt), end of year 2017 Actual (78,130,848) The accompanying notes are an integral part of these financial statements. (39,227,072) 30,756,560
67 GREATER VANCOUVER SEWERAGE AND DRAINAGE DISTRICT Exhibit D Statement of Cash Flows Year ended December 31, Cash provided by (used in): Operating transactions: Annual surplus Items not involving cash: Amortization Sinking fund income Debt reserve fund income Loss on disposal of tangible capital assets Change in landfill closure and postclosure liability Change in noncash assets and liabilities: Accounts receivable Prepaid expenses Accounts payable and accrued liabilities Deferred revenue Inventories of supplies 74,717,497 58,146,161 29,495,914 (2,751,567) (71,237) 2,379, ,562 29,961,316 (3,248,236) (57,954) 253,127 (904,463) (6,459,967) 54,936 16,451, ,728,151 (663,496) 178,103 (14,095) 1,319,629 21,104,137 76, ,856, ,814,438 1,163,442 (177,131,293) 42,069 (122,662,713) Net change in cash from capital transactions (175,967,851) (122,620,644) Financing transactions: Due from Metro Vancouver Regional District Debenture debt issued Debt reserve fund issuance Debt reserve fund maturity Sinking fund payments Debenture debt maturity Sinking fund retirement (207,049,201) 100,000,000 (1,000,000) 193,895 (8,777,793) (10,000,000) 10,000,000 (31,651,212) 55,000, ,964 (7,859,692) (44,000,000) 44,000,000 (116,633,099) 15,748,060 Net change in cash from operating transactions Capital transactions: Proceeds on sale of tangible capital assets Acquisition of tangible capital assets Net change in cash from financing transactions Net change in cash and cash equivalents Cash and cash equivalents, beginning of year Cash and cash equivalents, end of year 44,255,213 (58,146) 65,822 44,321,035 The accompanying notes are an integral part of these financial statements. 123,968 65,822
68 GREATER VANCOUVER SEWERAGE AND DRAINAGE DISTRICT Notes to Financial Statements, page 1 Year ended December 31, Significant Accounting Policies The Greater Vancouver Sewerage and Drainage District (the District ) was established by an Act of the same name in Its two primary responsibilities are the collection, treatment and discharge of liquid waste for the municipalities of the Metro Vancouver Regional District ( MVRD ), and the disposal of solid waste both for the municipalities of the MVRD and the public. The District owns and operates a number of wastewater treatment plants and a related collection network connected to the municipal collection systems, and several solid waste facilities including a waste to energy facility. Its Board of Directors comprises the same councilors and mayors as appointed to the MVRD Board by the participating municipalities. The member municipalities under the Act are jointly and severally liable for its debts. The District s financial statements are prepared by management in accordance with Canadian public sector accounting standards. Significant accounting policies adopted by the District are as follows: Basis of Accounting The District follows the accrual method of accounting for revenues and expenses. Revenues are normally recognized in the year in which they are earned and measurable. Expenses are recognized as they are incurred and measurable as a result of receipt of goods or services and/or the legal obligation to pay. Government Transfers Government transfers are recognized as revenue in the financial statements when the transfer is authorized and any eligibility criteria are met, except to the extent that transfer stipulations give rise to an obligation that meets the definition of a liability. The transfer of revenue is initially deferred and then recognized in the statement of operations as the stipulation liabilities are settled. When the District is deemed the transferor, the transfer expense is recognized when the recipient is authorized and has met the eligibility criteria. Deferred Revenue Deferred revenue represents development cost charges and a Province of BC Grant which have been collected, but for which the related services or obligations have yet to be performed. These amounts will be recognized as revenue in the fiscal year the services are performed or obligations and stipulations have been met. Sinking Fund, Debt Retirement and Interest Income Sinking fund, debt retirement and interest income is reported as revenue in the period earned. When required, based on external restrictions, interest income earned on deferred revenue is added to and forms part of the deferred revenue balance and is recognized into income when related stipulations are met.
69 GREATER VANCOUVER SEWERAGE AND DRAINAGE DISTRICT Notes to Financial Statements, page 2 Year ended December 31, Significant Accounting Policies (continued) Debenture Issue Costs Cash and Investments Employee Future Benefits Debenture issue costs are recorded as an expense in operations as incurred. In order to improve cash management, the general practice of the Metro Vancouver Districts is to accumulate cash and investment transactions in pooled accounts held by the MVRD. Investments held by the MVRD consist of bonds issued by governments and Canadian chartered banks, money market instruments and term deposits. Interest earned on GVS&DD s fund balances is included in the amount owing from MVRD and is recorded as interest income in the Statement of Operations. Employees who provide services for the District are employees of the MVRD. Employee related costs are allocated by the MVRD to the District based on services rendered. These costs are shown as expenses in the financial statements and are included in amounts owing from MVRD. Postemployment benefits of the MVRD, including accumulated banked sick and vacation pay, retirement severance and Worker s Compensation topup benefits for employees pursuant to certain policies and union agreements, are actuarially determined based on service and best estimates of retirement ages and expected future salary and wage increases. The obligation under these benefit plans is allocated to the District based on projected benefits as the employees render services necessary to earn the future benefits and included in amounts owing to MVRD. Landfill Closure and PostClosure Liability The estimated present value of landfill closure and postclosure costs is recognized as a liability. This liability is recognized based on estimated future expenses, including estimated inflation discounted to the current date and accrued based on the proportion of the total capacity of the landfill used as of the date of the statement of financial position. The change in this estimated liability during the year is recorded as an expense in operations. These estimates are reviewed and adjusted annually and any changes are recorded on a prospective basis. NonFinancial Assets Nonfinancial assets are not available to discharge existing liabilities and are held for use in the provision of services. They generally have useful lives extending beyond the current year and are not intended for sale in the ordinary course of operations.
70 GREATER VANCOUVER SEWERAGE AND DRAINAGE DISTRICT Notes to Financial Statements, page 3 Year ended December 31, Significant Accounting Policies (continued) NonFinancial Assets (continued) Tangible Capital Assets Tangible capital assets are recorded at cost which includes amounts that are directly attributable to acquisition, construction, development or betterment of the asset. The cost, less residual value, of the tangible capital assets, except land, is amortized over their estimated useful lives. All assets are amortized on a straight line basis as follows: Asset Infrastructure Interceptors and trunk sewers, drainage Wastewater treatment, pumping stations Solid Waste incinerators, transfer stations Solid Waste landfills Information technology systems and networks Vehicles Machinery, Equipment, Furniture and Fixtures Useful Life Years a. Annual amortization: Annual amortization begins when the asset is put into service and is expensed over its useful life. Assets under construction are transferred to the appropriate asset class and are amortized from the date the asset is put into productive use. b. Contributions of tangible capital assets: Contributions of tangible capital assets are recorded at their fair value at the date of receipt and as contribution revenue. c. Interest capitalization: The District does not capitalize interest costs associated with the acquisition or construction of a tangible capital asset. Inventories of Supplies Inventories of supplies held for consumption are recorded at the lower of weightedaverage cost and replacement cost.
71 GREATER VANCOUVER SEWERAGE AND DRAINAGE DISTRICT Notes to Financial Statements, page 4 Year ended December 31, Significant Accounting Policies (continued) Revenue Recognition Tipping fees, levies, electricity sales, permits, user fees and other revenue are recognized as revenue on an accrual basis according to the usage and rates approved and set by the Board in various fees and charges bylaws. Segmented Information A segment is defined as a distinguishable activity or group of activities of a government for which it is appropriate to separately report financial information to achieve the objectives of the standard. Definitions of the District s segments and their related financial information are presented in note 12. Liability for Contaminated Sites A liability for remediation of a contaminated site is recognized when the site is no longer in productive use and the following criteria are satisfied: an environmental standard exists; contamination exceeds the standard; the District is either directly responsible or has accepted responsibility for remediation; it is expected that future economic benefits will be given up and a reasonable estimate of the liability can be made. Use of Estimates The preparation of these financial statements requires management to make estimates and assumptions that affect the reported amounts in the financial statements and the disclosure of contingent liabilities. These estimates and assumptions are based on management s best information and judgment and may differ from actual results. Adjustments, if any, will be reflected in the financial statements in the period that the change in estimate is made, as well as in the period of settlement if the amount is different. Significant areas requiring the use of management s judgment relate to the determination of landfill closure and post closure liability, contaminated sites liabilities and accrued liabilities, the useful lives of tangible capital assets and the assessment of all contingencies.
72 GREATER VANCOUVER SEWERAGE AND DRAINAGE DISTRICT Notes to Financial Statements, page 5 Year ended December 31, Debt Reserve Fund The Municipal Finance Authority ( MFA ) provides financing for regional districts and member municipalities. The MFA is required to establish a Debt Reserve Fund for each debenture issue equal to onehalf the average annual installment of principal and interest. The debt reserve fund is comprised of cash deposits equal to 1% of the principal amount borrowed and a non interest bearing demand note for the remaining requirement. Cash deposits held by the MFA are payable with interest to the ultimate borrower when the final obligations under the respective loan agreements have been made. If, at any time, the District has insufficient funds to meet payments due on its obligations to MFA, the payments will be made from the debt reserve fund. The demand notes are callable only if there are additional requirements to be met to maintain the level of the debt reserve fund. At December 31, 2017, 8,666,384 (2016 5,893,758) in callable demand notes were outstanding and have not been recorded in the statement of financial position. 3. Accounts Payable and Accrued Liabilities 2017 Trade accounts Construction holdbacks Accrued interest on debt Other 60,725,006 6,975,404 1,721,620 48,478 69,470, ,668,449 4,284,530 1,031,689 34,838 53,019,506
73 GREATER VANCOUVER SEWERAGE AND DRAINAGE DISTRICT Notes to Financial Statements, page 6 Year ended December 31, Landfill Closure and PostClosure Liability The District is responsible for its share of closure and postclosure costs at the four landfill sites, Vancouver, Cache Creek, Coquitlam and Port Mann. The closure and postclosure liability associated with these landfills is as follows: 2017 Vancouver Cache Creek Total closure and postclosure liability 31,017, ,000 31,683, ,107, ,000 30,707,896 a) The Vancouver landfill is located in Delta, BC. In accordance with an agreement with the City of Vancouver, the District is responsible for its proportionate share of the closure and postclosure liability based on usage. The present value of the District s estimated future liability for these expenses is recognized as the landfill site s capacity is used follows: 2017 Opening Balance Impact due to changes in: Utilization Assumptions Discount rate Closing balance ,107,896 26,746,521 1,822,750 (2,854,153) 1,994,965 31,071,458 1,910,136 1,229, ,494 30,107,896 The closure and postclosure liability and annual expense is calculated based on the ratio of actual utilization to total expected utilization of the site s capacity at the date of closure. It is based on estimates and assumptions with respect to events extending over the remaining life of the Vancouver landfill, including provisions contained in Metro Vancouver s Integrated Solid Waste and Resource Management Plan. The significant estimates and assumptions adopted in measuring the District s share of the closure and postclosure liability are as follows: 2017 Current actual utilization (in tonnes) Expected utilization at closure (in tonnes) Permitted capacity (in tonnes) Proportionate share of liability Percent of utilization at closure Discount rate Expected postclosure period Expected closure date 19,847,920 26,012,639 33,039, % 78.7% 3.12% 30 years December 31, ,227,644 25,505,982 33,039, % 75.4% 3.68% 30 years December 31, 2037
74 GREATER VANCOUVER SEWERAGE AND DRAINAGE DISTRICT Notes to Financial Statements, page 7 Year ended December 31, Landfill Closure and PostClosure Liability (continued) b) The Cache Creek landfill is located in the Village of Cache Creek, BC. The landfill permit obligates the Village of Cache Creek and a third party service provider to undertake closure and postclosure activities. The District, in accordance with an agreement with the Village, is required to contribute quarterly to a trust fund, held with the Province of British Columbia, to a Post Closure Maintenance and Repair Fund at rates consistent with the operational certificate for the landfill. The agreement indemnifies the Village for any post closure liabilities which are not covered by this fund. At December 31, 2017, the trust had 15,422,726 ( ,833,227). The Cache Creek landfill was closed July The closure and postclosure liability and annual expense is calculated based on the ratio of actual utilization to total expected utilization of the site s capacity at the date of closure. In 2017, no closure costs were paid by the District (2016 4,083,002). The present value of the District s estimated future liability for closure and postclosure is as follows: 2017 Opening balance Closure costs paid Impact due to change in: Utilization Assumptions Closing balance Less postclosure fund Closure liability ,433,227 19,226,069 (4,083,002) 601,499 16,034,726 (15,422,726) 612,000 62, ,046 15,433,227 (14,833,227) 600,000 The liability is based on significant estimates and assumptions adopted in measuring the closure and postclosure liability and are as follows: 2017 Current actual utilization (in tonnes) Expected utilization at closure (in tonnes) Permitted capacity (in tonnes) Percent of utilization at closure Discount rate Expected postclosure period Expected closure date 10,318,780 10,318,780 10,371, % 3.12% 30 years n/a ,318,780 10,318,780 10,371, % 3.68% 30 years n/a c) The Coquitlam landfill and Port Mann Landfill were closed in 1983 and 1997, respectively and there are no further closure and postclosure liabilities.
75 GREATER VANCOUVER SEWERAGE AND DRAINAGE DISTRICT Notes to Financial Statements, page 8 Year ended December 31, Deferred Revenue The deferred revenue reported on the statement of financial position consists of following: 2017 a) the 2016 Development cost charges (a) Provincial grant to fund capital expenditures (b) 287,702, ,933, ,907,487 Total 483,635, ,907,487 The GVS&DD Act restricts the District to applying money raised from development cost charges to funding sewer capital projects, including the repayment of debt raised to fund such projects. The balance of these amounts is included in deferred revenue until spent on approved purposes. b) In 2017, the District received a grant from the Province of British Columbia in the amount of 193,000,000 for future costs associated with the construction of the new Lions Gate Wastewater Treatment Plant Facility. Included in deferred revenue is the full amount of the grant funding plus interest earned. Continuity of deferred revenue is as follows: 2017 Balance, beginning of year Deferred grant received in the year Development cost charges received Interest earned Amounts spent and recognized as revenue Total change in deferred revenue Balance, end of year 260,907, ,000,000 26,836,133 8,093,951 (5,201,933) 222,728, ,635, ,803,350 22,232,062 4,917,964 (6,045,889) 21,104, ,907, Debt a) All borrowings for the District are obtained from MFA by the MVRD on the District s behalf, although the District maintains the right to finance debt without MFA involvement. Debt, debentures or other security issued by the District is a direct, joint and several obligation and liability of the District and each and every member municipality. Debt servicing requirements comprising sinking fund contributions, serial repayments and interest are funded as incurred by revenue earned during the year.
76 GREATER VANCOUVER SEWERAGE AND DRAINAGE DISTRICT Notes to Financial Statements, page 9 Year ended December 31, Debt (continued) b) Debt (net of sinking funds) reported on the statement of financial position comprises the following and includes varying maturities up to 2032 with interest rates ranging from 1.75% to 5.15%. Issue number Sinking fund Interest rate % Debentures authorized to be issued Maturity Date December 3, 2017 June 3, 2018 October 3, 2018 April 22, 2019 October 19, 2021 November 20, 2023 October 13, 2024 April 4, 2026 April 11, 2027 October 5, 2031 April 7, 2032 October 4, 2032 Total debt Debenture debt outstanding ,000,000 4,000,000 10,000,000 10,000,000 15,000,000 20,000,000 20,000,000 20,000,000 55,000,000 50,000,000 50,000,000 10,000,000 4,000,000 10,000,000 10,000,000 15,000,000 20,000,000 20,000,000 20,000,000 55,000,000 50,000,000 50,000,000 10,000,000 10,000,000 4,000,000 10,000,000 10,000,000 15,000,000 20,000,000 20,000,000 20,000,000 55,000, ,000, ,000, ,000,000 Less sinking funds (60,917,560) Total net debt 203,082,440 (59,388,200) 114,611,800 c) Principal payments and sinking fund installments due within the next five years and thereafter are as follows: Thereafter Subtotal Estimated sinking fund income Total 13,691,028 13,042,236 12,578,814 12,578,814 12,079,403 92,117, ,087,491 46,994, ,082,440 d) Sinking fund installments are invested by the MFA and earn income which, together with principal payments, are expected to be sufficient to retire the sinking fund debt at maturity. For sinking fund agreements, the MFA has established either a normal sinking fund or a capital repayment equalization fund.
77 336,189,590 1,912,640,507 26,864, ,854 1,477,372,191 6,256,159 65,803,774 Balance at December 31, 2016 Assets under construction Machinery, equipment, furniture & fixtures Vehicles Infrastructure Utilities Information technology Land Year ended December 31, ,182,390 1,791,936,438 28,532, ,854 1,402,007,471 6,256,159 65,803,774 Balance at December 31, 2015 Cost 47,007, ,662, ,793 75,364,720 Additions Cost 139,392, ,131, ,893 23,745,655 13,696,000 Additions (Net of Transfers) Writeoffs in 2017 were 655,549 related to discontinued projects ( ,077). Assets under construction Machinery, equipment, furniture & fixtures Vehicles Infrastructure Utilities Information technology Land Year ended December 31, 2017 (1,958,644) (1,958,644) Disposals (655,549) (16,626,925) (15,817,522) (153,854) Disposals 336,189,590 1,912,640,507 26,864, ,854 1,477,372,191 6,256,159 65,803,774 Balance at December 31, ,926,786 2,073,144,875 11,344,310 1,501,117,846 6,256,159 79,499,774 Balance at December 31, ,951,711 20,102, , ,439,527 6,256,159 Balance at December 31, ,249,579 20,893, , ,945,607 6,256,159 Balance at December 31, ,495,914 1,049,258 (1,663,448) (1,663,448) Disposals 28,446,656 Amortization Expense 29,961,316 2,455,236 27,506,080 Amortization Expense Accumulated amortization (13,084,115) (12,930,261) (153,854) Disposals Accumulated amortization 584,249,579 20,893, , ,945,607 6,256,159 Balance at December 31, ,661,378 9,012, ,392,263 6,256,159 Balance at December 31, ,189,590 1,328,390,928 5,970, ,426,584 65,803,774 Net book value December 31, ,926,786 1,472,483,497 2,331, ,725,583 79,499,774 Net book value December 31, 2017 GREATER VANCOUVER SEWERAGE AND DRAINAGE DISTRICT Notes to Financial Statements, page 10 Year ended December 31, Tangible Capital Assets
78 GREATER VANCOUVER SEWERAGE AND DRAINAGE DISTRICT Notes to Financial Statements, page 11 Year ended December 31, Accumulated Surplus Accumulated surplus consists of individual fund surplus and reserves as follows: Reserves Investment in tangible capital assets 182,297,213 1,257,029,260 Total 1,439,326, ,281,111 1,200,327,865 1,364,608,976 Continuity of reserves is as follows: December 31, 2016 Designated reserves Building and equipment replacement General debt reserve fund Waste to energy facility Landfill postclosure Sustainability innovation funds Other Nondesignated reserves Liquid Waste operating Solid waste operating Total Reserves 23,956,722 40,699,761 10,222,837 7,620,473 26,910,891 15,861,288 Interest Annual Operating Surplus Contributions from/(to) operations Contributions to capital 1,086, , , , , ,683 2,624, ,137 1,961, ,271,972 2,308,271 6,218,827 27,471,313 11,537, , ,059 8,741,781 10,824, ,676 (8,321,202) (2,764,601) 28,715,091 19,783,052 6,610,503 (11,085,803) 182,297, ,281,111 2,924,853 19,566,549 (15,441,689) 15,441,689 December 31, ,515,033 57,227,817 11,101,987 10,443,225 28,377,718 18,133, ,799,070
79 GREATER VANCOUVER SEWERAGE AND DRAINAGE DISTRICT Notes to Financial Statements, page 12 Year ended December 31, Accumulated Surplus (continued) Investment in tangible capital assets is calculated as follows: Tangible capital assets Amounts financed by: Longterm debt Working capital (temporary financing) Change in the investment in tangible capital assets Acquisition of tangible capital assets Disposal of tangible capital assets Amortization of tangible capital assets ,472,483,497 1,328,390,928 (203,082,440) (12,371,797) 1,257,029,260 (114,611,800) (13,451,263) 1,200,327, ,131,293 (3,542,810) (29,495,914) 144,092, ,662,713 (295,196) (29,961,316) 92,406,201 (8,777,793) (2,751,567) 100,000,000 (1,079,466) 87,391,174 44,000,000 (7,859,692) (3,248,236) 55,000,000 (44,000,000) (1,560,436) 42,331,636 56,701,395 50,074,565 1,200,327,865 1,150,253,300 1,257,029,260 1,200,327,865 Less funding of tangible capital assets Sinking fund debt maturity Sinking fund and debt retirement Sinking fund and debt retirement income Debenture debt issued Debenture debt maturity Decrease in temporary financing Change in investment in tangible capital assets Investment in tangible capital assets, beginning of year Investment in tangible capital assets, end of year
80 GREATER VANCOUVER SEWERAGE AND DRAINAGE DISTRICT Notes to Financial Statements, page 13 Year ended December 31, Commitments As at December 31, 2017 the District had the following commitments outstanding related to capital projects in progress: Authorized for outstanding projects Expended at December 31 2,063,966,377 (589,911,391) 1,123,207,377 (434,041,395) Commitment remaining 1,474,054, ,165, Contingencies Lawsuits As at December 31, 2017, there were various lawsuits pending against the District arising in the ordinary course of business. The District has retained legal counsel to defend against these lawsuits for which the outcomes are not possible to reasonably determine at this time and therefore no accrual has been recognized. Management is of the opinion that the losses, if any, in connection with these lawsuits can be sufficiently funded by reserve funds or covered by insurance. Any ultimate losses are recorded as expenses at the time the amounts are reasonably determinable. Self Insurance Fund A self insurance fund has been established within accumulated surplus of the MVRD to cover losses resulting from uninsured liability exposures of the District, other Metro Vancouver Districts and the MVHC. Each year a review is undertaken to determine if it would be beneficial to purchase additional liability insurance. The District, other Metro Vancouver Districts and the MVHC transfer amounts to the reserve depending on the fund's adequacy to cover retained liability risk. An estimate is made for all costs of investigating and settlement of claims annually and an adjustment is made to the fund to maintain an adequate balance to cover potential losses in excess of recorded liabilities. These estimates are changed as additional information becomes known during the course of claims settlement. Any potential costs would be recorded as expenses at the time the losses are known and the amounts are reasonably determinable.
81 GREATER VANCOUVER SEWERAGE AND DRAINAGE DISTRICT Notes to Financial Statements, page 14 Year ended December 31, Contingencies (continued) Debt Reserve Fund The MFA is required to establish a Debt Reserve Fund for each debenture which is comprised of cash deposits and a noninterest bearing demand note (refer to note 2). If, at any time, the District has insufficient funds to meet payments due on its obligations to MFA, the payments will be made from the debt reserve fund. The demand notes are callable only if there are additional requirements to be met to maintain the level of the debt reserve fund, and therefore have not been recorded in the statement of financial position. First Nations Negotiations The District is currently involved in negotiations with First Nations regarding compensation for the use of their land on which District assets reside. The compensation associated with these negotiations cannot be reasonably determined at this time and therefore no liabilities have been recorded at December 31, Budget Information The annual budget presented in these financial statements is based upon the 2017 operating and capital budgets approved by the District s Board in October 2016, with additional approval in April 2017 for adjustments to the budget as a result of the 2016 fiscal year end results. The budget is based on operational and capital expenditure requirements and their associated funding. Amortization is a noncash item that is not funded for budget purposes. In addition, PSAS do not allow the presentation of fund balances nor the appropriations of accumulated surplus. Therefore, contributions to or from reserves and debt principal repayments are removed from the approved budget for financial statement presentation. The schedule below reconciles the approved budget to the budget figures reported in these financial statements. Capital expenditures of 163,675,000 were included in the capital budget approved by the Board in April 2017.
82 GREATER VANCOUVER SEWERAGE AND DRAINAGE DISTRICT Notes to Financial Statements, page 15 Year ended December 31, Budget Information (continued) 2017 Budget Budgeted annual surplus per Exhibit B Statement of Operations 51,890,805 Additional transfers from reserves, approved by Board April 2017 Adjusted annual surplus, based on October approved budget 51,890,805 Items not included in the operating budget Amortization of tangible capital assets Sinking and debt retirement fund income Reserve interest 29,646,787 (2,515,334) (3,043,150) Items included in the budget but not in financial statements Debt principal payments Transfers to capital Transfers from reserves Annual surplus per approved budget (8,777,793) (64,788,365) (2,412,950) 12. Segmented Information The District s primary responsibilities are the collection, treatment and discharge of liquid waste for the municipalities of the MVRD and the disposal of solid waste both for the municipalities of the MVRD and the public. For management reporting purposes, the District s operations and activities are organized and reported by these two primary areas of service. The information reported in the segmented information does not include 6,647,569 (2016 5,732,138) of salaries and benefits directly attributable to the construction of tangible capital assets which have been included in the cost of tangible capital assets in the Statement of Financial Position. The services disclosed in the Segmented Information are as follows: Liquid Waste Management Services The Liquid Waste Management Service is responsible for the collection, treatment and discharge of liquid waste for member municipalities. It operates a number of wastewater treatment plants and a related collection network connected to the member municipalities systems. Solid Waste Management Services The Solid Waste Management Service is responsible for the disposal of solid waste both for the member municipalities and the public. It owns and operates several solid waste facilities including a waste to energy facility.
83 GREATER VANCOUVER SEWERAGE AND DRAINAGE DISTRICT Notes to Financial Statements, page 16 Year ended December 31, Segmented Information (continued) 2017 Total Budgeted Revenue Sewerage and drainage levy to members Tipping fees BODTSS Industrial Charges Electricity sales Development cost charges Trucked liquid waste fees Source control fees Sinking fund and debt retirement income Interest income User fees, and other income Grants andrecoveries contributions Expenses Salaries and benefits Consulting, contracted and professional services Asset repairs and maintenance Materials and supplies Utilities, permits and taxes Corporate costs Other Amortization of tangible capital assets Loss on disposal of tangible capital assets Interest on longterm debt Annual surplus Liquid Waste 213,889, ,889,658 85,373,222 8,658,686 9,838,338 5,719,900 6,809,038 5,201,933 1,002,175 1,042,436 1,402,066 1,458,531 2,515,334 1,728,160 3,043,150 2,169,463 4,684,350 1,869,332 Solid Waste 98,635,607 5,642,942 1,023, ,627 5,306, Total 2016 Total 213,889,658 98,635,607 9,838,338 5,642,942 5,201,933 1,042,436 1,458,531 2,751,567 2,996,090 7,175, ,250,619 93,504,371 8,495,783 5,796,681 6,045,889 1,023,542 1,178,373 3,248,236 2,977,829 8,933, ,097, ,197, ,434, ,632, ,454,690 63,131, ,082,628 11,846,605 14,486,713 10,909,050 24,690,885 13,689,626 29,646,787 10,723, ,206,774 54,890,741 22,389,067 11,864,867 12,511,483 11,627,842 19,588,472 8,327,499 23,877, ,549 6,509, ,242,960 5,444,364 74,577, ,546 44, ,061 5,207,822 8,491,717 5,618,412 1,723,819 (534,410) 101,672,344 60,335,105 96,966,509 12,645,413 12,556,054 11,945,903 24,796,294 16,819,216 29,495,914 2,379,368 5,975, ,915,304 59,805, ,495,279 12,537,075 13,160,885 11,241,907 25,050,515 12,977,529 29,961, ,127 4,825, ,308,529 51,890,805 64,954,891 9,762,606 74,717,497 58,146,161
84 GREATER VANCOUVER SEWERAGE AND DRAINAGE DISTRICT Schedule 1 Schedule of Operating Fund (unaudited) Year ended December 31, Budget Revenue Sewerage and drainage levy to members Tipping fees BODTSS Industrial Charges Electricity sales Development cost charges Trucked liquid waste fees Source control fees User fees, recoveries and other revenue 2017 Actual 213,889,658 85,373,222 8,658,686 5,719,900 6,809,038 1,002,175 1,402,066 4,684, ,539,095 Expenses Liquid waste Solid waste Corporate costs Interest on longterm debt Annual surplus, operating fund Application of surplus and transfers Transfers from (to): Capital Sinking and debt retirement funds Reserve funds for: Reserves Operating results Reserves 2016 Actual 213,889,658 98,635,607 9,838,338 5,642,942 5,201,933 1,042,436 1,458,531 6,370, ,080, ,250,619 93,504,371 8,495,783 5,796,681 6,045,889 1,023,542 1,178,808 8,361, ,657, ,691,915 83,453,824 24,690,885 10,723, ,559, ,611,500 89,653,309 24,796,294 5,978, ,040, ,435,738 93,784,659 25,050,515 4,823, ,094,086 75,979, ,040,103 81,563,223 (64,788,365) (8,777,793) (65,085,258) (8,777,793) (60,541,480) (7,859,692) (4,890,152) 2,477,202 (19,566,549) (6,610,503) (11,907,004) (1,255,047) Change in operating fund Operating fund, beginning of year Operating fund, end of year
85 GREATER VANCOUVER SEWERAGE AND DRAINAGE DISTRICT Schedule 2 Schedule of Capital Fund (unaudited) Year ended December 31, Budget Revenue Interest on debt reserve fund Other income Expenses Amortization of tangible capital assets Loss on disposal of tangible capital asset Annual deficit, capital fund Tangible capital assets transactions Acquisition of tangible capital assets Amortization of tangible capital assets Disposal of tangible capital assets Financing Debenture debt issued Transfers from: Operating fund Reserve funds Change in capital fund Capital fund balance, beginning of year Capital fund balance, end of year 2017 Actual 71, , , Actual 57, , ,270 29,646,787 29,646,787 29,495,914 2,379,368 31,875,282 29,961, ,127 30,214,443 (29,646,787) (30,999,026) (29,585,173) 190,425,000 (29,646,787) 160,778, ,131,293 (29,495,914) (3,542,810) 144,092, ,662,713 (29,961,316) (295,196) 92,406, ,315, ,000,000 55,000,000 64,788,365 8,321, ,425,000 65,085,258 11,085, ,171,061 60,541,480 8,010, ,551,810 29,646,787 32,078,492 31,145,609 1,079,466 1,560,436 (13,451,263) (15,011,699) (12,371,797) (13,451,263) (13,451,263) (13,451,263)
86 Financial Statements of GREATER VANCOUVER WATER DISTRICT Year ended December 31, 2017 DRAFT April 4, 2018
87 GREATER VANCOUVER WATER DISTRICT Index to Financial Statements December 31, 2017 Exhibit Independent Auditor's Report Management Report Statement of Financial Position A Statement of Operations B Statement of Change in Net Debt C Statement of Cash Flows D Notes to Financial Statements Schedule Unaudited Schedules of: Operating Fund 1 Capital and Other Funds 2
88 Independent Auditor s Report To the members of the Board of Directors of the Greater Vancouver Water District We have audited the accompanying financial statements of the Greater Vancouver Water District, which comprise the Statement Financial Position as at December 31, 2017, and the Statements of Operations, Change in Net Debt and Cash Flows for the year then ended, and a summary of significant accounting policies and other explanatory information. Management's Responsibility for the Financial Statements Management is responsible for the preparation and fair presentation of these financial statements in accordance with Canadian public sector accounting standards, and for such internal control as management determines is necessary to enable the preparation of financial statements that are free from material misstatement, whether due to fraud or error. Auditor's Responsibility Our responsibility is to express an opinion on these financial statements based on our audit. We conducted our audit in accordance with Canadian generally accepted auditing standards. Those standards require that we comply with ethical requirements and plan and perform the audit to obtain reasonable assurance about whether the financial statements are free from material misstatement. An audit involves performing procedures to obtain audit evidence about the amounts and disclosures in the financial statements. The procedures selected depend on the auditor's judgment, including the assessment of the risks of material misstatement of the financial statements, whether due to fraud or error. In making those risk assessments, the auditor considers internal control relevant to the entity's preparation and fair presentation of the financial statements in order to design audit procedures that are appropriate in the circumstances, but not for the purpose of expressing an opinion on the effectiveness of the entity's internal control. An audit also includes evaluating the appropriateness of accounting policies used and the reasonableness of accounting estimates made by management, as well as evaluating the overall presentation of the financial statements. We believe that the audit evidence we have obtained is sufficient and appropriate to provide a basis for our audit opinion. Opinion In our opinion, the financial statements present fairly, in all material respects, the financial position of the Greater Vancouver Water District as at December 31, 2017 and the results of its operations, change in net debt and cash flows for the year then ended in accordance with Canadian public sector accounting standards. Chartered Professional Accountants Vancouver, British Columbia April 27, 2018
89 GREATER VANCOUVER WATER DISTRICT MANAGEMENT REPORT The Financial Statements contained in this report have been prepared by management in accordance with Canadian public sector accounting standards. The integrity and objectivity of these statements are management s responsibility. Management is responsible for all the statements and schedules, and for ensuring that this information is consistent, where appropriate, with the information contained in the financial statements. Management is also responsible for implementing and maintaining a system of internal controls to provide reasonable assurance that reliable financial information is produced. The Greater Vancouver Water District s Board of Directors is responsible for approving the financial statements and for ensuring that management fulfills its responsibilities for financial reporting and internal control and exercises this responsibility through the Performance and Audit Committee of the Board. The external auditors, BDO Canada LLP, conduct an independent examination, in accordance with Canadian Auditing Standards, and express their opinion on the financial statements. Their examination does not relate to the other schedules and statements required by the Financial Information Act. The Independent Auditor s Report outlines the scope of the audit for the year ended December 31, On behalf of Greater Vancouver Water District. Phil Trotzuk, Chief Financial Officer Date: April 27, 2018
90 GREATER VANCOUVER WATER DISTRICT Exhibit A Statement of Financial Position Year ended December 31, Financial Assets Cash Accounts receivable Assets held for sale (note 2) Debt reserve fund (note 3) Liabilities Accounts payable and accrued liabilities (note 4) Due from Metro Vancouver Regional District Debt (net of sinking funds) (note 5) Net Debt NonFinancial Assets Tangible capital assets (note 6) Inventories of supplies Accumulated surplus (note 7) 5,480,762 55,887,752 22,850,898 16,576, ,796, ,447,050 19,094, ,222, ,763,872 28,823,477 26,759, ,446, ,029,048 (649,967,694) (713,503,235) 2,237,045,239 2,392,897 2,239,438,136 2,701,631 53,062,184 15,761,998 71,525,813 1,589,470,442 2,168,684,550 2,151,402 2,170,835,952 Commitments (note 8) Contingencies (note 9) The accompanying notes are an integral part of these financial statements. Chief Financial Officer Board Chair 1,457,332,717
91 GREATER VANCOUVER WATER DISTRICT Exhibit B Statement of Operations Year ended December 31, Budget (note 10) Revenue (note 11) Metered sale of water Sinking fund and debt retirement income Interest income Building income from Metro Vancouver Districts Building income from external parties Other revenue Net gain on disposal of tangible capital assets Expenses (note 11) Water operations Building operations Annual surplus Accumulated surplus, beginning of year Accumulated surplus, end of year 261,710,765 16,265, ,722 8,117,712 5,989,450 1,178, ,196, Actual 264,484,281 22,434,635 1,143,682 10,765,388 5,749,287 6,094, , ,210, Actual 251,217,868 19,259,571 1,269,833 2,221,516 6,362,136 7,092, ,423, ,264,614 22,806, ,372, ,313,080 16,759, ,072, ,997,756 13,199, ,197, ,823, ,137, ,226,377 1,457,332,717 1,457,332,717 1,342,106,340 1,558,156,656 The accompanying notes are an integral part of these financial statements. 1,589,470,442 1,457,332,717
92 GREATER VANCOUVER WATER DISTRICT Exhibit C Statement of Change in Net Debt Year ended December 31, Budget (note 10) Annual surplus Change in tangible capital assets: Acquisition of tangible capital assets Amortization of tangible capital assets Transfer of asset held for sale Disposal of tangible capital assets 100,823,939 (209,398,488) 34,364,879 (175,033,609) Change in other nonfinancial assets: Acquisition of inventories of supplies Consumption of inventories of supplies Net debt, beginning of year 132,137, Actual 115,226,377 (126,652,063) 35,378,735 22,850,898 61,741 (68,360,689) (93,556,353) 31,457, ,906 (61,740,370) (2,392,897) 2,151,402 (241,495) (2,151,402) 2,178,913 27,511 (74,209,670) 63,535,541 53,513,518 (713,503,235) (713,503,235) (767,016,753) (787,712,905) (649,967,694) (713,503,235) Changes in net financial assets Net debt, end of year 2017 Actual The accompanying notes are an integral part of these financial statements.
93 GREATER VANCOUVER WATER DISTRICT Exhibit D Statement of Cash Flows Year ended December 31, Cash provided by (used in): Operating transactions: Annual surplus Items not involving cash: Amortization Sinking fund and debt retirement income Debt reserve fund income Gain on disposal of tangible capital assets Change in noncash assets and liabilities: Accounts receivable Accounts payable and accrued liabilities Inventories of supplies 132,137, ,226,377 35,378,735 (22,434,635) (314,768) (538,326) 31,457,077 (19,259,571) (425,645) 358,906 (2,825,568) 7,623,573 (241,495) 19,570,328 (25,050,414) 27, ,785, ,904, ,067 (126,652,063) (93,556,353) Net change in cash from capital transactions (126,051,996) (93,556,353) Financing transactions: Due from Metro Vancouver Regional District Debenture debt issued Debt reserve fund issuance Debt reserve fund maturity Sinking fund payments (7,664,300) 50,000,000 (500,000) (61,789,814) (67,772,864) 100,000,000 (1,000,000) 192,111 (57,091,541) (19,954,114) (25,672,294) Net change in cash and cash equivalents 2,779,131 2,675,922 Cash and cash equivalents, beginning of year 2,701,631 25,709 Net change in cash from operating transactions Capital transactions: Proceeds on sale of tangible capital assets Acquisition of tangible capital assets Net change in cash from financing transactions Cash and cash equivalents, end of year 5,480,762 The accompanying notes are an integral part of these financial statements. 2,701,631
94 GREATER VANCOUVER WATER DISTRICT Notes to Financial Statements, page 1 Year ended December 31, Significant Accounting Policies The Greater Vancouver Water District (the District ) was established by an Act of the same name in Its primary responsibility is the supply of potable water to its member municipalities. Its Board of Directors comprises the same councillors and mayors as appointed to the Metro Vancouver Regional District ( MVRD ) Board by the participating municipalities. The District owns or holds under a 999year lease from the Province an extensive closed watershed network as its source of supply. It owns a series of dams, reservoirs, water treatment plants and a distribution network connecting to the municipal distribution systems. The member municipalities under the Act are jointly and severally liable for its debts. The District also owns and is responsible for operating and maintaining office buildings that are leased to MVRD and its related entities. The District s financial statements are prepared by management in accordance with Canadian public sector accounting standards ( PSAS ). Significant accounting policies adopted by the District are as follows: Basis of Accounting The District follows the accrual method of accounting for revenues and expenses. Revenues are normally recognized in the year in which they are earned and measurable. Expenses are recognized as they are incurred and measurable as a result of the receipt of goods or services and/or the legal obligation to pay. Government Transfers Government transfers are recognized as revenue in the financial statements when the transfer is authorized and any eligibility criteria are met, except to the extent that transfer stipulations give rise to an obligation that meets the definition of a liability. The transfer of revenue is initially deferred and then recognized in the statement of operations as the stipulation liabilities are settled. When the District is deemed the transferor, the transfer expense is recognized when the recipient is authorized and has met the eligibility criteria. Sinking Fund, Debt Retirement and Interest Income Sinking fund, debt retirement and interest income are reported as revenue in the period earned. When required, based on external restrictions, interest income earned on deferred revenue is added to and forms part of the deferred revenue balance and is recognized into income when related stipulations are met. Debenture Issue Costs Debenture issue costs are recorded as an expense in operations as incurred.
95 GREATER VANCOUVER WATER DISTRICT Notes to Financial Statements, page 2 Year ended December 31, Significant Accounting Policies (continued) Cash and Investments In order to improve cash management, the general practice of the Metro Vancouver Districts is to accumulate cash and investment transactions in pooled accounts held by the MVRD. Investments held by the MVRD consist of bonds issued by governments and Canadian chartered banks, money market instruments and term deposits. Interest earned on GVWD s fund balances is included in the amount owing from the MVRD and is recorded as interest income in the Statement of Operations. Employee Future Benefits Employees who provide services for the District are employees of the MVRD. Employee related costs are allocated by the MVRD to the District based on services rendered. These costs are shown as expenses in the financial statements and are included in amounts owing to MVRD. Postemployment benefits of the MVRD, including accumulated banked sick and vacation pay, retirement severance and Worker s Compensation topup benefits for employees pursuant to certain policies and union agreements, are actuarially determined based on service and best estimates of retirement ages and expected future salary and wage increases. The obligation under these benefit plans is allocated to the District based on projected benefits as the employees render services necessary to earn the future benefits and included in amounts owing to MVRD. NonFinancial Assets Nonfinancial assets are not available to discharge existing liabilities and are held for use in the provision of services. They have useful lives extending beyond the current year and are not intended for sale in the ordinary course of operations.
96 GREATER VANCOUVER WATER DISTRICT Notes to Financial Statements, page 3 Year ended December 31, Significant Accounting Policies (continued) NonFinancial Assets (continued) Tangible Capital Assets Tangible capital assets are recorded at cost which includes amounts that are directly attributable to acquisition, construction, development or betterment of the asset. The cost, less residual value, of the tangible capital assets, excluding land, is amortized on a straight line basis over the estimated useful lives of the assets as follows: Asset Useful Life Years Buildings Corporate head office 40 Watershed 25 Infrastructure Dams and reservoirs 150 Supply mains 100 Distribution systems, drinking water treatment 50 Bridges and roads 50 Vehicles 5 10 Machinery, Equipment, Furniture and Fixtures 5 20 a. Annual amortization: Annual amortization begins when the asset is put into service and is expensed over its useful life. Assets under construction are transferred to the appropriate asset class and are amortized from the date the asset is put into productive use. b. Contributions of tangible capital assets: Contributions of tangible capital assets are recorded at their fair value at the date of receipt and as contribution revenue. c. Interest capitalization: The District does not capitalize interest costs associated with the acquisition or construction of a tangible capital asset. Inventories of Supplies Inventories of supplies held for consumption are recorded at the lower of weightedaverage cost and replacement cost.
97 GREATER VANCOUVER WATER DISTRICT Notes to Financial Statements, page 4 Year ended December 31, Significant Accounting Policies (continued) Revenue Recognition Metered sale of water, building income from external tenants, MVRD s Districts and Housing Corporation, and other income are recognized as revenue on an accrual basis according to the usage and rates approved and set by the Board. Use of Estimates The preparation of these financial statements requires management to make estimates and assumptions that affect the reported amounts in the financial statements and the disclosure of contingent liabilities. These estimates and assumptions are based on management s best information and judgment and may differ from actual results. Adjustments, if any, will be reflected in the financial statements in the period that the change in estimate is made, as well as in the period of settlement if the amount is different. Significant areas requiring the use of management s judgment relates to the determination of accrued liabilities and contaminated sites liabilities, the amortization rates of tangible capital assets and the assessment of all contingencies. Segmented Information A segment is defined as a distinguishable activity or group of activities of a government for which it is appropriate to separately report financial information to achieve the objectives of the standard. Definitions of the District s segments and their related financial information are presented in note 11. Liabilities for Contaminated Sites A liability for remediation of a contaminated site is recognized when the site is no longer in productive use and the following criteria are satisfied: an environmental standard exists; contamination exceeds the standard; the District is either directly responsible or has accepted responsibility for remediation; it is expected that future economic benefits will be given up and a reasonable estimate of the liability can be made. Liabilities for contaminated sites are reported in accounts payable and accrued liabilities (note 4).
98 GREATER VANCOUVER WATER DISTRICT Notes to Financial Statements, page 5 Year ended December 31, Assets Held for Sale During 2017, head office operations for MVRD and its related Districts were relocated. As at December 31, 2017, the two former head office buildings were made available for sale. The net book value of assets held for sale previously classified in tangible capital assets is as follows: 2017 Land Building 10,253,864 12,597,034 22,850, Debt Reserve Fund The Municipal Finance Authority ( MFA ) provides financing for regional districts and member municipalities. The MFA is required to establish a Debt Reserve Fund for each debenture issue equal to onehalf the average annual installment of principal and interest. The debt reserve fund is comprised of cash deposits equal to 1% of the principal amount borrowed and a non interest bearing demand note for the remaining requirement. Cash deposits held by the MFA are payable with interest to the ultimate borrower when the final obligations under the respective loan agreements have been made. If, at any time, the District has insufficient funds to meet payments due on its obligations to MFA, the payments will be made from the debt reserve fund. The demand notes are callable only if there are additional requirements to be met in order to maintain the level of the debt reserve fund. At December 31, 2017, 44,131,036 ( ,586,871) in callable demand notes were outstanding and have not been recorded in the statement of financial position. 4. Accounts Payable and Accrued Liabilities 2017 Trade accounts Construction holdbacks Accrued interest on debt Contaminated sites (a) Other 18,355,843 7,889,748 7,953,934 2,125, ,175 36,447, ,387,648 2,517,408 7,796, ,528 28,823,477 a) The District accrued 2,125,350 for estimated current costs to remediate contaminated soils for two properties. Plans for remediation of the sites is underway and expected to be substantially completed in 2018.
99 GREATER VANCOUVER WATER DISTRICT Notes to Financial Statements, page 6 Year ended December 31, Debt a) All borrowings for the District are obtained from MFA by the MVRD on the District s behalf, although the District maintains the right to finance debt without MFA involvement. Debt, debentures or other security issued by the District is a direct, joint and several obligation and liability of the District and each and every member municipality. Debt servicing requirements comprising sinking fund contributions, serial repayments and interest are funded as incurred by revenue earned during the year. b) Principal payments and sinking fund installments due within the next five years and thereafter are as follows: Total Payments Thereafter Subtotal Estimated sinking fund income Total 64,478,143 52,593,809 50,391,623 50,198,368 47,201, ,037, ,901, ,320, ,222,076 c) Sinking fund installments are invested by the MFA and earn income that, together with principal payments, are expected to be sufficient to retire the sinking fund debt at maturity. For sinking fund agreements, the MFA has established either a normal sinking fund or a capital repayment equalization fund.
100 GREATER VANCOUVER WATER DISTRICT Notes to Financial Statements, page 7 Year ended December 31, Debt (continued) d) Debt (net of sinking funds) reported on the Statement of Financial Position comprises the following and includes varying maturities up to 2032 with interest rates ranging from 1.75% to 5.15%. Issue Bylaw number number Sinking fund PB BB C A B Total debt Interest rate % Debentures authorized to be issued Maturity date June 3, 2018 October 3, 2018 April 22, 2019 April 22, 2019 December 02, 2019 October 13, 2020 April 19, 2021 April 19, 2021 October 19, 2021 November 5, 2022 November 5, 2022 December 1, 2022 April 23, 2023 November 20, 2023 June 3, 2024 October 13, 2024 April 8, 2025 October 6, 2025 April 4, 2026 April 11, 2027 October 4, 2027 September 26, 2028 April 7, 2029 October 14, 2029 April 8, 2030 April 19, 2031 April 19, 2031 April 7, 2032 Debenture debt outstanding ,800, ,000,000 8,548,000 1,972,000 37,000,000 3,600,000 15,630,930 4,369,070 40,000,000 14,294, ,000 80,000,000 40,000,000 35,630,930 60,000,000 80,000,000 50,000,000 70,000,000 30,000,000 70,000,000 20,000,000 70,000,000 60,000,000 50,000,000 60,000,000 80,000,000 20,000,000 50,000,000 12,800, ,000,000 8,548,000 1,972,000 37,000,000 3,600,000 15,630,930 4,369,070 40,000,000 14,294, ,000 80,000,000 40,000,000 35,630,930 60,000,000 80,000,000 50,000,000 70,000,000 30,000,000 70,000,000 20,000,000 70,000,000 60,000,000 50,000,000 60,000,000 80,000,000 20,000,000 50,000,000 12,800, ,000,000 8,548,000 1,972,000 37,000,000 3,600,000 15,630,930 4,369,070 40,000,000 14,294, ,000 80,000,000 40,000,000 35,630,930 60,000,000 80,000,000 50,000,000 70,000,000 30,000,000 70,000,000 20,000,000 70,000,000 60,000,000 50,000,000 60,000,000 80,000,000 20,000,000 1,264,550,930 1,264,550,930 1,214,550,930 Less sinking funds Total net debt (569,328,854) 695,222,076 (485,104,405) 729,446,525
101 382,768,187 2,463,975,282 4,473, ,175,294 1,810,018,914 54,539,812 Balance at December 31, 2016 (191,888,278) 126,652,063 7,566,841 34,339, ,153, ,000 Additions Cost (44,194,346) (33,878,741) (10,315,605) Disposals and Transfers 190,879,909 2,546,432,999 12,039, ,636,376 2,086,172,591 44,704,207 Balance at December 31, ,290,732 3,112,578 21,210, ,967,169 Balance at December 31, 2016 (21,281,707) Assets under construction Machinery, equipment, furniture & fixtures Buildings Infrastructure Land Year ended December 31, ,937,522 2,370,790,992 4,473, ,154,451 1,653,936,132 52,289,812 Balance at December 31, 2015 (64,829,234) 93,556,353 20, ,114,744 2,250,000 Additions Cost (340,101) (372,063) (31,962) Disposals 382,768,187 2,463,975,282 4,473, ,175,294 1,810,018,914 54,539,812 Balance at December 31, ,846,812 2,897,930 18,798, ,150,447 Balance at December 31, 2015 (21,281,707) (13,157) (13,157) Disposals 31,457, ,648 2,412,550 28,829,879 Amortization Expense Accumulated amortization 35,378, ,472 3,103,792 31,941,471 Accumulated amortization Disposals and Amortization Transfers Expense Included in net disposals in 2017 is 22,850,898 for assets held for sale (note 2). Write offs related to discontinued projects were nil in 2017 ( ,101). Assets under construction Machinery, equipment, furniture & fixtures Buildings Infrastructure Land Year ended December 31, ,290,732 3,112,578 21,210, ,967,169 Balance at December 31, ,387,760 3,446,050 3,033, ,908,640 Balance at December 31, ,768,187 2,168,684,550 1,360, ,964,309 1,539,051,745 54,539,812 Net book value December 31, ,879,909 2,237,045,239 8,593, ,603,306 1,783,263,951 44,704,207 Net book value December 31, 2017 GREATER VANCOUVER WATER DISTRICT Notes to Financial Statements, page 8 Year ended December 31, Tangible Capital Assets
102 GREATER VANCOUVER WATER DISTRICT Notes to Financial Statements, page 9 Year ended December 31, Accumulated Surplus Accumulated surplus consists of individual fund surplus and reserves as follows: Reserves Investment in tangible capital assets 52,925,692 1,536,544,750 46,351,615 1,410,981,102 Accumulated surplus, end of year 1,589,470,442 1,457,332,717 Continuity of reserves is as follows: December 31, 2016 Designated reserves Office building capital improvements Sustainability innovation fund Laboratory equipment Lower Seymour Conservation Reserve General debt reserve fund Nondesignated reserves Operating reserve Total Reserves Interest Annual Operating Surplus Contributions from / (to) operations Contributions to capital December 31, ,933 10,484, , ,816 7,600,144 10, ,221 10,379 3, , ,073 46,000 (612,280) 11,235, , ,221 7,747,158 19,375, , ,073 (612,280) 19,731,233 26,976, ,869 17,212,251 (525,371) (10,857,831) 33,194,459 46,351, ,235 17,212,251 (11,470,111) 52,925,692 63,702 Investment in tangible capital assets is calculated as follows: 2017 Tangible capital assets Amounts financed by: Longterm debt Working capital (temporary financing) 2,237,045,239 (695,222,076) (5,278,413) 1,536,544, ,168,684,550 (729,446,525) (28,256,923) 1,410,981,102
103 GREATER VANCOUVER WATER DISTRICT Notes to Financial Statements, page 10 Year ended December 31, Accumulated Surplus (continued) The change in the investment in tangible capital assets is as follows: 2017 Change in the investment in tangible capital assets Acquisition of tangible capital assets Disposal of tangible capital assets Transfer of asset held for sale Amortization of tangible capital assets 126,652,063 (61,741) (22,850,898) (35,378,735) 68,360,689 Less funding of tangible capital assets Sinking fund debt maturity Sinking fund and debt retirement Sinking fund and debt retirement income Debenture debt issued Debenture debt maturity Decrease in temporary financing Investment in tangible capital assets, end of year 93,556,353 (358,906) (31,457,077) 61,740,370 (61,789,814) (22,434,635) 50,000,000 (22,978,510) (57,202,959) 10,449,070 (57,091,541) (19,259,571) 100,000,000 (10,449,070) (78,949,050) (55,300,162) 125,563, ,040,532 1,410,981,102 1,293,940,570 Change in investment in tangible capital assets Investment in tangible capital assets, beginning of year ,536,544,750 1,410,981, Commitments As at December 31, 2017, the District had the following commitments outstanding related to capital projects in progress: 2017 Authorized for outstanding projects Expended at December 31 Commitment remaining 870,600,000 (554,000,000) 316,600, ,012,800,000 (706,500,000) 306,300,000
104 GREATER VANCOUVER WATER DISTRICT Notes to Financial Statements, page 11 Year ended December 31, Contingencies Lawsuits: As at December 31, 2017, there were various lawsuits pending against the District arising in the ordinary course of business. The District has retained legal counsel to defend against these lawsuits for which the outcomes are not possible to reasonably determine at this time and therefore no accrual has been recognized. Management is of the opinion that the losses, if any, in connection with these lawsuits can be sufficiently funded by reserve funds or covered by insurance. Any ultimate losses are recorded as expenses at the time the amounts are reasonably determinable. Self Insurance Fund: A self insurance fund has been established within accumulated surplus of the MVRD to cover losses resulting from uninsured liability exposures of the District, other Metro Vancouver Districts and the MVHC. Each year a review is undertaken to determine if it would be beneficial to purchase additional liability insurance. The District, other Metro Vancouver Districts and the MVHC transfer amounts to the reserve depending on the fund s adequacy to cover retained liability risk. An estimate is made for all costs of investigating and settlement of claims annually and an adjustment is made to the fund to maintain an adequate balance to cover potential losses in excess of recorded liabilities. These estimates are changed as additional information becomes known during the course of claims settlement. Any potential costs would be recorded as expenses at the time the losses are known and the amounts are reasonably determinable. Debt Reserve Fund: The MFA is required to establish a Debt Reserve Fund for each debenture which is comprised of cash deposits and a noninterest bearing demand note (refer to note 3). If, at any time, the District has insufficient funds to meet payments due on its obligations to MFA, the payments will be made from the debt reserve fund. The demand notes are callable only if there are additional requirements to be met to maintain the level of the debt reserve fund, and therefore have not been recorded in the statement of financial position.
105 GREATER VANCOUVER WATER DISTRICT Notes to Financial Statements, page 12 Year ended December 31, Budget Information The annual budget presented in these financial statements is based upon the 2017 operating and capital budgets approved by the District s Board in October 2016, with additional approval in April 2017 for adjustments to the budget as a result of the 2016 fiscal year end results. The budget is based on operational and capital expenditure requirements and their associated funding. Amortization is a noncash item that is not funded for budget purposes. Alternatively, PSAS do not allow presentation of fund balances nor the appropriations of accumulated surplus. Therefore, contributions to or from reserves and debt principal repayments are removed from the approved budget for financial statement presentation. The schedule below reconciles the approved operating budget to the budget figures reported in these financial statements. Capital expenditures of 206,700,000 were included in the capital budget approved by the Board in April Budget Budgeted annual surplus per Exhibit B Statement of Operations 100,823,939 Additional transfers from reserves, approved by Board April ,159 Adjusted annual surplus, based on October approved budget 101,694,098 Items not included in the operating budget Amortization of tangible capital assets Sinking and debt retirement fund income Reserve interest 34,364,879 (16,265,878) (934,722) Items included in the budget but not in financial statements Debt principal payments Transfers to capital Transfers from reserve funds Transfers to reserve funds (56,125,141) (63,221,631) 1,257,395 (769,000) Annual surplus per approved budget
106 GREATER VANCOUVER WATER DISTRICT Notes to Financial Statements, page 13 Year ended December 31, Segmented Information The District s primary responsibilities are the supply of potable water to the municipalities of the MVRD and the property management of the office buildings owned by the District. For management reporting purposes, the District s operations and activities are organized and reported by these two primary areas of service. The information reported in the segmented information does not include 11,132,520 ( ,118,512) of salaries and benefits directly attributable to the construction of tangible capital assets which have been included in the cost of tangible capital assets in the Statement of Financial Position. The services disclosed in the Segmented Information are as follows: Water Operations Water Operations is responsible for the supply of potable water to the District s member municipalities. The District owns a series of dams, reservoirs, water treatment plants and a distribution network connected to the member municipalities systems. Building Operations Building Operations is responsible for operating and maintaining office buildings owned by the District. These facilities are leased to MVRD and its related entities for its head office operations as well as to external parties Budget Revenue Metered sale of water Net gain on disposal of tangible capital assets Sinking fund and debt retirement income Interest income Building income from Metro Vancouver Districts Building income from external parties Other income Expenses Salaries and benefits Consulting, contracted and professional services Asset repairs and maintenance Materials and supplies Utilities, permits and taxes Corporate costs Other Amortization of tangible capital assets Loss on disposal of tangible capital assets Interest on longterm debt Annual surplus (deficit) Water Operations Building Operations 261,710,765 16,265, ,722 8,117,701 5,989,461 1,178, ,196, ,484, ,326 21,965,851 1,133,335 6,192, ,314, ,784 10,347 16,236,240 5,749,287 22,464,658 37,412,255 15,710,173 6,736,813 11,311,024 10,659,697 19,601,761 6,919,569 34,364,879 50,656, ,372,735 36,149,870 9,371,859 3,485,676 8,706,031 7,721,769 25,425,938 7,931,659 32,241,398 36,847, ,881, ,845 1,274,607 1,696,795 64,830 1,795,310 2,584,832 3,137,337 5,471,147 16,759, ,823, ,432,770 5,704,955 InterProgram Adjustments (5,470,852) (97,806) (5,568,658) (63,552) (5,407,300) (97,806) (5,568,658) 2017 Total 2016 Total 264,484, ,326 22,434,635 1,143,682 10,765,388 5,749,287 6,094, ,210, ,217,868 19,259,571 1,269,833 2,221,516 6,362,136 7,092, ,423,445 36,884,715 10,646,466 5,118,919 8,770,861 9,517,079 20,018,638 10,418,685 35,378,735 42,318, ,072,783 36,211,430 8,988,389 3,772,107 8,689,348 6,786,031 23,864,460 9,672,818 31,457, ,906 42,396, ,197, ,137, ,226,377
107 GREATER VANCOUVER WATER DISTRICT Schedule 1 Schedule of Operating Fund (unaudited) Year ended December 31, Budget Revenue Metered sale of water Building income from Metro Vancouver Districts Building income from external parties Other income 2017 Actual 261,710,765 8,117,712 5,989,450 1,178, ,996,074 Expenses Water Operations: Water operations and maintenance Watershed operations Water policy and planning Administration Interest on longterm debt Corporate costs: Head Office building operations Head Office building capital maintenance Transfer to Other Districts Other corporate costs Annual surplus, operating fund Application of surplus and transfers Transfers from (to): Capital Sinking and debt retirement funds Reserve funds for: Reserves Operating results Reserves 2016 Actual 264,484,281 10,765,388 5,749,287 5,080, ,079, ,217,868 2,221,516 6,362,136 4,695, ,496,826 61,583,507 11,089,124 4,940,992 6,914,165 40,914, ,442,533 55,941,188 10,347,734 4,142,572 6,043,307 36,847, ,322,339 54,008,801 10,164,422 3,912,852 6,034,048 42,396, ,516,625 18,815,974 1,650,000 (3,650,000) 16,749,349 33,565,323 11,413,521 2,208,845 16,749,343 30,371,709 5,167,423 15,303 18,681,734 23,864, ,007, ,694, ,381, ,988, ,385, ,115,741 (63,221,631) (56,125,141) (63,319,437) (61,789,814) (55,250,455) (57,091,541) 1,358,554 (117,988,218) (17,212,251) (63,702) (142,385,204) (11,158,674) (615,071) (124,115,741) Change in operating fund Operating fund, beginning of year Operating fund, end of year
108 GREATER VANCOUVER WATER DISTRICT Schedule 2 Schedule of Capital Fund (unaudited) Year ended December 31, Budget Revenue MFA sinking fund surplus Net gain on disposal of tangible capital assets Other income Interest income Expenses Amortization of tangible capital assets Loss on disposal of tangible capital asset Annual deficit, capital fund Tangible capital assets transactions Acquisition of tangible capital assets Amortization of tangible capital assets Transfer of asset held for sale Disposal of tangible capital assets Financing Debenture debt issued Transfers from: Operating fund Reserve funds Change in capital fund 538,326 1,014, ,447 1,928, Actual 303,024 2,094, ,955 2,819,170 34,364,879 34,364,879 35,378,735 35,378,735 31,457, ,906 31,815,983 (34,364,879) (33,450,349) (28,996,813) 209,398,488 (34,364,879) 175,033, ,652,063 (35,378,735) (22,850,898) (61,741) 68,360,689 93,556,353 (31,457,077) (358,906) 61,740, ,290,422 50,000, ,000,000 63,221,631 11,886, ,398,488 63,319,437 11,470, ,789,548 55,250,455 14,435, ,686,233 34,364,879 56,428, ,945,863 22,978,510 78,949,050 (28,256,923) (107,205,973) (5,278,413) (28,256,923) (28,256,923) Capital fund balance, beginning of year Capital fund balance, end of year 2017 Actual (28,256,923)
109 Financial Statements of METRO VANCOUVER HOUSING CORPORATION Year ended December 31, 2017 DRAFT April 4, 2018
110 METRO VANCOUVER HOUSING CORPORATION Index to Financial Statements December 31, 2017 Exhibit Independent Auditor s Report Management Report Statement of Financial Position A Statement of Operations B Statement of Change in Net Debt C Statement of Cash Flows D Notes to Financial Statements Schedule Unaudited Schedules of: Operating Fund 1 Capital and Other Funds 2
111 Independent Auditor s Report To the members of the Board of Directors of the Metro Vancouver Housing Corporation We have audited the accompanying financial statements of the Metro Vancouver Housing Corporation, which comprise the Statement Financial Position as at December 31, 2017, and the Statements of Operations, Change in Net Debt and Cash Flows for the year then ended, and a summary of significant accounting policies and other explanatory information. Management's Responsibility for the Financial Statements Management is responsible for the preparation and fair presentation of these financial statements in accordance with Canadian public sector accounting standards, and for such internal control as management determines is necessary to enable the preparation of financial statements that are free from material misstatement, whether due to fraud or error. Auditor's Responsibility Our responsibility is to express an opinion on these financial statements based on our audit. We conducted our audit in accordance with Canadian generally accepted auditing standards. Those standards require that we comply with ethical requirements and plan and perform the audit to obtain reasonable assurance about whether the financial statements are free from material misstatement. An audit involves performing procedures to obtain audit evidence about the amounts and disclosures in the financial statements. The procedures selected depend on the auditor's judgment, including the assessment of the risks of material misstatement of the financial statements, whether due to fraud or error. In making those risk assessments, the auditor considers internal control relevant to the entity's preparation and fair presentation of the financial statements in order to design audit procedures that are appropriate in the circumstances, but not for the purpose of expressing an opinion on the effectiveness of the entity's internal control. An audit also includes evaluating the appropriateness of accounting policies used and the reasonableness of accounting estimates made by management, as well as evaluating the overall presentation of the financial statements. We believe that the audit evidence we have obtained is sufficient and appropriate to provide a basis for our audit opinion. Opinion In our opinion, the financial statements present fairly, in all material respects, the financial position of the Metro Vancouver Housing Corporation as at December 31, 2017 and the results of its operations, change in net debt and cash flows for the year then ended in accordance with Canadian public sector accounting standards. Chartered Professional Accountants Vancouver, British Columbia April 27, 2018
112 METRO VANCOUVER HOUSING CORPORATION ( MVHC ) MANAGEMENT REPORT The Financial Statements contained in this report have been prepared by management in accordance with Canadian public sector accounting standards and the integrity and objectivity of these statements are management s responsibility. Management is responsible for all the statements and schedules, and for ensuring that this information is consistent, where appropriate, with the information contained in the financial statements. Management is also responsible for implementing and maintaining a system of internal controls to provide reasonable assurance that reliable financial information is produced. The Board of Directors is responsible for approving the financial statements and for ensuring that management fulfills its responsibilities for financial reporting and internal control. The external auditors, BDO Canada LLP, conduct an independent examination, in accordance with Canadian Auditing Standards, and express their opinion on the financial statements. Their examination does not relate to the other schedules and statements required by the Financial Information Act. The Independent Auditor s Report outlines the scope of the audit for the year ended December 31, On behalf of Metro Vancouver Housing Corporation. Phil Trotzuk, Chief Financial Officer Date: April 27, 2018
113 METRO VANCOUVER HOUSING CORPORATION Exhibit A Statement of Financial Position Year ended December 31, Financial Assets Accounts receivable Due from British Columbia Housing Management Commission Due from Metro Vancouver Regional District 369,052 36,274,219 2,990,775 8,649,038 59,648,400 2,903,291 14,078,072 68,984,971 71,288,213 85,966,334 (34,644,942) (57,112,298) 80,617,831 5,841, ,899 82,705,874 6,036, ,697 Contingencies (note 9) The accompanying notes are an integral part of these financial statements. Director Director 355, ,379 28,373,769 28,854,036 NonFinancial Assets Tangible capital assets (note 6) Prepaid land leases (note 7) Prepaid expenses Accumulated surplus (note 8) 36,643,271 Liabilities Accounts payable and accrued liabilities (note 3) Deferred revenue and refundable deposits (note 4) Mortgages and debentures payable (note 5) Net Debt ,895,228 52,250,286 89,163,868 32,051,570
114 METRO VANCOUVER HOUSING CORPORATION Exhibit B Statement of Operations Year ended December 31, Budget (note 10) Revenue Property rental Contributions: Canada Mortgage and Housing Corporation British Columbia Housing Management Commission Restricted contributions Interest income Other revenues Expenses Asset repairs and maintenance Amortization of tangible assets and prepaid land leases Utilities, permits and taxes Salaries and benefits Interest and fees on longterm debt Corporate costs Consulting, contracted and professional services Other Materials and supplies Annual surplus Accumulated surplus, beginning of year Accumulated surplus, end of year 36,761, Actual 38,566, Actual 36,828,554 1,877,089 1,444,200 3,382, ,670 1,057,078 1,698,475 1,217,066 5,444, ,630 7,660,968 2,398,553 1,394,270 1,907, ,493 1,227,982 44,956,061 54,979,583 44,208,887 14,865,867 3,587,314 6,617,434 5,592,554 2,278,690 4,124, , , ,831 11,711,414 3,771,029 6,129,533 5,134,180 2,601,387 4,124, , ,912 62,062 13,836,924 5,108,641 6,027,658 5,612,353 2,652,652 2,084, , ,801 69,839 38,300,831 34,780,867 36,412,646 6,655,230 20,198,716 7,796,241 32,051,570 32,051,570 24,255,329 38,706,800 52,250,286 The accompanying notes are an integral part of these financial statements. 32,051,570
115 METRO VANCOUVER HOUSING CORPORATION Exhibit C Statement of Change in Net Debt Year ended December 31, Budget (note 10) Annual surplus Change in tangible capital assets Acquisition of tangible capital assets Amortization of tangible capital assets Change in other nonfinancial assets Payment of prepaid expenses Use of prepaid expenses Amortization of prepaid land leases Change in net debt Net debt, beginning of year Net debt, end of year 6,655, Actual 20,198, Actual 7,796,241 (5,650,000) 3,587,314 (1,488,187) 3,576,230 (1,175,559) 4,913,842 (2,062,686) 2,088,043 3,738, ,799 (435,899) 421, ,799 (421,697) 388, , ,799 4,787, ,597 22,467, ,791 11,696,315 (57,112,298) (57,112,298) (68,808,613) (52,324,955) (34,644,942) (57,112,298) The accompanying notes are an integral part of these financial statements.
116 METRO VANCOUVER HOUSING CORPORATION Exhibit D Statement of Cash Flows Year ended December 31, Cash provided by (used in): Operating transactions: Annual surplus Items not involving cash Amortization of tangible capital assets Amortization of prepaid land leases Change in noncash assets and liabilities Accounts receivable Due from British Columbia Housing Management Commission Accounts payable and accrued liabilities Deferred revenue and refundable deposits Prepaid expenses 20,198,716 7,796,241 3,576, ,799 4,913, ,799 (13,164) 124,379 87,484 (5,429,034) (14,202) 155 (84,083) 178,917 (1,836,102) (33,008) 18,725,208 11,130,761 (1,488,187) (1,175,559) (1,488,187) (1,175,559) (7,900,450) 599,689 (9,936,260) 2,764,371 (12,719,573) (17,237,021) (9,955,202) Net change in cash and cash equivalents Cash and cash equivalents, beginning of year Net change in cash from operating transactions Capital transactions: Acquisition of tangible capital assets Net change in cash from capital transactions Financing transactions: Due from Metro Vancouver Regional District Mortgages issued Principal repayments on mortgages and debentures Net change in cash from financing transactions Cash and cash equivalents, end of year The accompanying notes are an integral part of these financial statements.
117 METRO VANCOUVER HOUSING CORPORATION Notes to Financial Statements, page 1 Year ended December 31, Significant Accounting Policies The Metro Vancouver Housing Corporation ( MVHC or the Corporation ) is a whollyowned subsidiary of the Metro Vancouver Regional District ( MVRD ). The MVHC is incorporated under the Business Corporations Act (British Columbia) as a notfor profit corporation for the purpose of supplying public rental accommodation, and is exempt from income taxes. The Corporation s financial statements are prepared by management in accordance with Canadian public sector accounting standards ( PSAS ). Significant accounting policies adopted by the MVHC are as follows: Basis of Accounting The Corporation follows the accrual method of accounting for revenue and expenses. Revenue is normally recognized in the year in which they are earned and measurable. Expenses are recognized as they are incurred and measurable as a result of the receipt of goods or services and/or the legal obligation to pay. Government Transfers Government transfers are recognized as revenue in the financial statements when the transfer is authorized and any eligibility criteria are met, except to the extent that transfer stipulations give rise to an obligation that meets the definition of a liability. The transfer of revenue is initially deferred and then recognized in the statement of operations as the stipulation liabilities are settled. When the Corporation is deemed the transferor, the transfer expense is recognized when the recipient is authorized and has met the eligibility criteria. Deferred Revenue, Refundable Deposits and Restricted Funds Deferred revenues represent tenant security deposits, restricted contributions and revenues, and rental income which have been collected, but which the related services or obligations have yet to be performed. These amounts will be recognized as revenues in the fiscal year the services are performed or obligations have been met. Amounts received under the following programs have been recorded as deferred revenue: i) Section 27 Rental Operations: In 2017, MVHC optioned an early payout of five mortgages related to Section 27 agreements with British Columbia Housing Management Commisssion ( BCHMC ); as a result funds related to Section 27 projects were no longer restricted.
118 METRO VANCOUVER HOUSING CORPORATION Notes to Financial Statements, page 2 Year ended December 31, Significant Accounting Policies (continued) Deferred Revenue, Refundable Deposits and Restricted Funds (continued) ii) Section 95 Rental Subsidy: Pursuant to Section 95 of the National Housing Act ("NHA"), a portion of the funds received from rental operations to a cumulative maximum of 500 per unit, are restricted and can only be used by MVHC according to the terms of the agreement with BCHMC. The amounts are recorded as deferred revenue and used when expenditures exceed revenue in the program. iii) Replacement Projects: Under operating agreements entered into with Canada Mortgage and Housing Corporation ( CMHC ) and administered by BCHMC, a portion of the funds received from rental operations are restricted for the replacement of equipment and specified building components. These funds are deferred until spent on approved items. In accordance with the original CMHC agreements (Section 95), from the inception of a project, a maximum of 1% per annum of the original construction cost of the building is restricted and recorded as deferred revenue. With the administrative approval of BCHMC, the potential of restricted contributions may be adjusted from time to time based on an asset life cycle analysis. Expenditures funded from deferred revenue are periodically reviewed by BCHMC, and are restricted to the replacement of equipment and specified building components. In accordance with BCHMC agreements (Homes BC and Seniors project), any receipts in excess of expenses are restricted for approved projected capital repairs and replacements for each project. These revenues are deferred until spent on approved items. Interest Income Interest income is reported as revenue in the period earned. When required, based on external requirements, interest income earned on deferred revenue and refundable deposits is added to and forms part of the deferred revenue and refundable deposit balance. Cash and Investments In order to improve cash management, the general practice of the Metro Vancouver Districts and MVHC is to accumulate cash and investment transactions in pooled accounts held by the MVRD. Investments held by the MVRD consist of bonds issued by governments and Canadian chartered banks, money market instruments, guaranteed investment certificates and term deposits. Interest earned on MVHC s fund balances is included in the amount owing from MVRD and is recorded as interest income in the Statement of Operations.
119 METRO VANCOUVER HOUSING CORPORATION Notes to Financial Statements, page 3 Year ended December 31, Significant Accounting Policies (continued) Employee Future Benefits Employees who provide services for MVHC are employees of the MVRD. Employee related costs are allocated by the MVRD to MVHC based on services rendered. These costs are shown as expenses in the financial statements and are included in amounts owing from MVRD. Postemployment benefits of the MVRD, including accumulated banked sick and vacation pay, retirement severance and Worker s Compensation topup benefits for employees pursuant to certain policies and union agreements, are actuarially determined based on service and best estimates of retirement ages and expected future salary and wage increases. The obligation under these benefit plans is allocated to MVHC based on projected benefits as the employees render services necessary to earn the future benefits and included in amounts owing to the MVRD. Nonfinancial assets Tangible Capital Assets Nonfinancial assets are not available to discharge existing liabilities and are held for use in the provision of services. They have useful lives extending beyond the current year and are not intended for sale in the ordinary course of operations. Tangible capital assets are recorded at cost, which includes amounts that are directly attributable to acquisition, construction, development or betterment of the asset. The cost, less residual value, of the tangible capital assets, excluding land, is amortized on a straight line basis over the estimated useful lives of the assets as follows: Asset Buildings Manor House and Regal Hotel Other buildings Furniture and fixtures Useful Life Years ) Annual amortization: Annual amortization begins when the asset is put into service and is expensed over its useful life. Assets under construction are transferred to the appropriate asset class and are amortized from the date the asset is put into productive use. 2) Interest capitalization: The MVHC capitalizes, at cost, all housing rental property expenditures, including interest and property taxes incurred to the date of completion of the project.
120 METRO VANCOUVER HOUSING CORPORATION Notes to Financial Statements, page 4 Year ended December 31, Significant accounting policies (continued) Nonfinancial assets (continued) Prepaid Land Leases Financial Instruments Prepaid land leases are recorded at historical cost less accumulated amortization. Upon expiration of the lease contract, the property will revert to the lessor. Prepaid land leases are amortized on a straightline basis over the lease term. Financial instruments are recorded at fair value on initial recognition. All other financial instruments are subsequently recorded at cost or amortized cost unless management has elected to carry the instruments at fair value. Unrealized changes in fair value are recognized in the Statement of Remeasurement Gains and Losses until they are realized, when they are transferred to the Statement of Operations. Transaction costs incurred on the acquisition of financial instruments measured subsequently at fair value are expensed as incurred. All other financial instruments are adjusted by transaction costs incurred on acquisition and financing costs, which are amortized using the straight line method. All financial assets are assessed for impairment on an annual basis. When a decline is determined to be other than temporary, the amount of the loss is reported in the statement of operations and any unrealized gain is adjusted through the Statement of Remeasurement Gains and Losses. When the asset is sold, the unrealized gains and losses previously recognized in the Statement of Remeasurement Gains and Losses are reversed and recognized in the Statement of Operations. There are no financial instruments carried at fair value as at year end and as a result, the statement of remeasurement gains and losses has not been prepared.
121 METRO VANCOUVER HOUSING CORPORATION Notes to Financial Statements, page 5 Year ended December 31, Significant Accounting Policies (continued) Functional and Segmented Presentation of Revenue and Expenses A segment is defined as a distinguishable activity or group of activities of a government for which it is appropriate to separately report financial information to achieve the objectives of the standard. Management believes that MVHC s activities comprise of only one segment and hence no additional disclosure is required. Furthermore, as the operations of MVHC are comprised of a single function, supply of public rental accommodation, the Statement of Operations presents revenue and expenses by object. Revenue Recognition Property rental income, contributions and other revenues are recognized as revenue on an accrual basis. Housing property rental revenue is recognized over the rental period once the tenant commences occupancy, rent is due and collection is assured. Annual property rental increases are based on rates established by provincial tenancy legislation. Contributions from CMHC and BCHMC are based on provisions set in agreements and outlined in Note 2. Liability for Contaminated Sites A liability for remediation of a contaminated site is recognized when the site is no longer in productive use and the following criteria are satisfied; an environmental standard exists; contamination exceeds the standard; MVHC is either directly responsible or has accepted responsibility for remediation; it is expected that future economic benefits will be given up and a reasonable estimate of the liability can be made. Use of Estimates The preparation of these financial statements requires management to make estimates and assumptions that affect the reported amounts and disclosure of contingent liabilities, in the financial statements. These estimates and assumptions are based on management s best information and judgment and may differ from actual results. Adjustments, if any, will be reflected in the financial statements in the period that the change in estimate is made, as well as in the period of settlement if the amount is different. Significant areas requiring the use of management s judgment relate to the determination of accrued liabilities and contaminated sites liabilities, the amortization rates of tangible capital assets and the assessment of all contingencies.
122 METRO VANCOUVER HOUSING CORPORATION Notes to Financial Statements, page 6 Year ended December 31, Senior Government Assistance BCHMC is the administrator and provides the related government assistance for all of MVHC s Federal programs (Section 95) and Provincial operating agreements (Homes BC and Seniors programs). In 2007, CMHC devolved its operations relating to the MVHC s federal programs to BCHMC, which provides BCHMC with the authority to manage MVHC s federal programs. Details of senior government assistance are as follows: BCHMC Umbrella Agreement The MVHC entered into an agreement with BCHMC commencing January 1, 2013, with a term of five years, expiring January 1, 2018, which consolidates the following five distinct housing programs under one agreement (the Umbrella Agreement ) Section 95, Federal/Provincial Seniors, Homes BC, Homes BC Homeless at Risk and the one Section 82.1(a) Disabled program (Guildford Glen). A fixed amount of assistance is provided monthly, in advance, as prescribed by BCHMC. Under terms of the agreement, the monthly fixed funding payment may be adjusted as a result of changes in mortgage payments, mortgage expiration or maturity, the removal of a project from the portfolio or by mutual agreement between MVHC and BCHMC. CMHC financing assistance on NHA Section 27 projects In 2017, MVHC optioned an early payout of the five mortgages under Section 27 projects, in the amount of 5,909,096, and refinanced the debt from MVRD at the variable internal interst rate. One condition of the early payout resulted in an expense of 599,689 relating to the loss of future CMHC financing assistance for those properties; this has been included as an expense in the Statement of Operations. CMHC mortgage insurance Pursuant to Section 6 of the NHA, CMHC has undertaken to insure mortgages payable by the MVHC. NHA Section 82.1(a) and 82.1(b) subsidy Rental supplements are authorized under Section 82.1(a) and 82.1(b) of the NHA and are funded jointly by BCHMC on behalf of the both the Federal Government and the Province of British Columbia.
123 METRO VANCOUVER HOUSING CORPORATION Notes to Financial Statements, page 7 Year ended December 31, Accounts Payable and Accrued Liabilities 2017 Trade accounts Accrued interest on mortgages and debenture debt Other 2,850, ,625 18,007 2,990, ,291, ,881 10,236 2,903, Deferred Revenue and Refundable Deposits 2017 Externally restricted funds: Rental operations: Programs under BCHMC Umbrella Agreement Section 27 rental operations Replacement provisions: Programs under BCHMC Umbrella Agreement Section 27 MVHC tenant security deposits Rent and subsidies received in advance Total 1,834,915 1,799,364 3,473,106 4,656,334 3,818,449 2,844,473 6,491,249 1,946, ,088 11,935,392 1,906, ,774 8,649,038 14,078, Balance, beginning of year Net increase from unspent operating funds Contributions received for capital replacement Contributions used and recognized as revenue Transfer of Section 27 to MVHC reserves Change in security deposits and prepaid rents Balance, end of year 14,078,072 3,968,619 1,823,140 (4,918,323) (6,317,579) (5,444,143) 15,109 15,109 8,649, ,914,174 1,844,369 1,793,897 (5,545,300) (1,907,034) 70,932 (1,836,102) 14,078,072
124 METRO VANCOUVER HOUSING CORPORATION Notes to Financial Statements, page 8 Year ended December 31, Mortgages and Debentures Payable a) MVHC s mortgages for Cedarwood, Crown Manor, Earle Adams, Euclid Square, Grandview Gardens, Kelly Court, Manor House Regal Hotel and Semlin Terrace are financed through the MVRD at MVRD s internal variable rate which was 1.92% in 2017 ( %). b) Mortgages, upon renewal, are expected to be renegotiated on a longterm basis. Annual principal repayments with and without renewal are as follows: Thereafter Assuming no renewal of mortgages 9,927,315 12,480,518 7,913,919 8,190,372 1,814,981 19,321,295 59,648,400 Assuming long term renewal of mortgages 6,964,320 4,421,906 3,202,027 3,186,254 3,263,129 38,610,764 59,648,400 c) Mortgages payable with respect to projects constructed pursuant to Section 95 of the NHA are collateralized by specific charges on rental properties as well as a general assignment of rents and a chattel mortgage on the fixtures and equipment. Properties funded by BCHMC mortgages are collateralized by a general assignment of rents and the benefit of all covenants and agreements included in any lease. d) Mortgages reported on the Statement of Financial Position comprises the following and includes varying maturities up to 2038 with interest rates ranging from 1.0% to 4.87%.
125 METRO VANCOUVER HOUSING CORPORATION Notes to Financial Statements, page 9 Year ended December 31, Mortgages and Debentures Payable (continued) Rental Property Interest Rate % NHA Section 95 projects: Mortgages payable: Adelaide Court Ashdown Gardens Eastburn Square Epsom Downs Evergreen Downs Greystone Village Hemlock Court Knightsbridge I Knightsbridge II London Square Lynden Court Malaspina Village Maple Vine Court McBride Place Moffatt Park Moray Place Ozada Village Pinewood Place Ran Beamish Place Somerset Gardens I Somerset Gardens II Somerset Gardens III Strathearn Court Sutton Place Tivoli Gardens Walnut Gardens Total NHA Section 95 projects NHA Section 27 projects: Debentures payable to CMHC : Earle Adams Village Euclid Square Grandview Gardens Kelly Court Semlin Terrace Total NHA section 27 projects Seniors projects: Mortgages payable: Alderwood Place Cedarwood Place Cedarwood Place Total Seniors projects December 1, Expected Maturity Date September 1, 2017 December 1, 2017 February 1, 2019 July 1, 2017 December 1, 2017 February 1, 2019 December 1, 2019 March 1, 2018 March 1, 2019 January 1, 2018 January 1, 2018 October 1, 2017 April 1, 2018 February 1, 2020 July 1, 2019 May 1, 2018 August 1, 2017 October 1, 2020 April 1, 2019 August 1, 2017 August 1, 2017 June 1, 2017 May 1, 2019 October 1, 2017 May 1, 2017 January 1, , , , , ,473 23,698 23, ,263 1,014, , , , , , ,114 5,464, , , , , ,744 1,040, , , , , , , ,538 1,475, , , , ,599 1,442, , , ,470 1,140, , , ,410 12,820,877 July 1, 2028 September 1, 2028 September 1, 2026 January 1, 2029 September 1, ,550, , ,828 1,035, ,566 5,584, internal variable September 1, 2018 March 1, 2018 July 1, 2019 July 1, 2027 January 1, 2023 June 1, ,423, ,199 4,334,365 7,559,754 2,632, ,287 4,540,765 8,113, June 1, 2027 November 1, 2019 December 1, 2020 October 1, 2020 May 1, 2027 August 1, 2026 July 1, 2035 November 1, 2036 December 1, 2035 October 1, 2038 May 1, 2037 August 1, ,148,900 2,239,905 3,738,670 6,056,755 2,796,275 5,338,012 28,318,517 8,438,558 2,333,764 3,881,202 6,242,735 2,896,622 5,571,087 29,363,968 internal variable internal variable internal variable internal variable internal variable internal variable internal variable internal variable 3.29 July 15, 2019 July 15, 2038 January 1, 2027 January 1, 2027 January 1, 2027 January 1, 2027 March 15, 2038 July 1, 2031 October 1, 2031 March 15, 2038 January 1, 2027 October 1, ,904 2,650, , ,699 1,102,776 1,346,806 5,957,256 3,439, , , ,174 18,305, ,578 1,411,453 6,322,544 3,632, , ,076 13,102,646 59,648,400 68,984,971 Homes BC projects: Mortgages payable: Chateau de Ville Claude Douglas Fraserwood Inlet Centre Residences Maplewood Odlinwood Total Homes BC projects MVHC projects: Mortgages payable: Crown Manor Earle Adams Village Euclid Square Grandview Gardens Kelly Court Manor House Meridian Village Minato West Regal Place Hotel Semlin Terrace St. Andrews Place Total MVHC projects Renewal Date Total mortgages and debentures payable March 15, 2019 September 1, 2026 October 1, 2021 March 15, 2019 October 1, 2021
126 Furniture & fixtures Buildings Land 1,175, , , ,938 Additions Cost 1,488, , ,949 Additions Cost (335,160) (335,160) Disposals (2,306,213) (279,030) (2,027,183) Disposals There was no writedown of tangible capital assets during the year (2016 nil). 253,759,603 1,935,273 Construction in progress 194,200,402 52,131,443 5,492,485 Balance at December 31, ,600,002 2,125,075 6,000, ,200,402 52,274,381 Balance at December 31, 2016 Furniture & fixtures Buildings Land Year ended December 31, 2016 Construction in progress Year ended December 31, ,600,002 2,125,075 6,000, ,200,402 52,274,381 Balance at December 31, ,781,976 2,952,313 6,382, ,173,219 52,274,381 Balance at December 31, ,315,446 4,571, ,744,130 Balance at December 31, ,894,128 4,670, ,223,513 Balance at December 31, ,576,230 (335,160) (335,160) Disposals 357,940 3,218,290 Amortization Expense 4,913, ,459 4,479,383 Amortization Expense Accumulated amortization (2,306,213) (279,030) (2,027,183) Disposals Accumulated amortization 171,894,128 4,670, ,223,513 Balance at December 31, ,164,145 4,749, ,414,620 Balance at December 31, ,705,874 2,125,075 1,329,529 26,976,889 52,274,381 Net book value December 31, ,617,831 2,952,313 1,632,538 23,758,599 52,274,381 Net book value December 31, 2017 METRO VANCOUVER HOUSING CORPORATION Notes to Financial Statements, page 10 Year ended December 31, Tangible Capital Assets
127 METRO VANCOUVER HOUSING CORPORATION Notes to Financial Statements, page 11 Year ended December 31, Prepaid Land Leases Balance, beginning of year ,036,297 6,231, , ,799 5,841,498 6,036,297 Amortization Balance, end of year The lease terms for the properties are as follows: Asset Buildings Habitat Villa Lease Expiry Dates February May May 2036 to June Walnut Gardens Other prepaid land leases Lease Term (Years) 8. Accumulated Surplus Accumulated surplus consists of authorized and issued 2,000 common shares with a par value of 1 per share and individual fund surplus and reserves as follows: 2017 Reserves Investment in tangible capital assets and land leases Share capital 25,437,357 26,810,929 2,000 52,250, ,292,370 19,757,200 2,000 32,051,570 Continuity of reserves is as follows: 2017 Balance, beginning of year Interest Contribution from (to) operations Contribution to capital Annual operating surplus 12,292, ,657 12,540,085 (827,238) 1,060,483 25,437, ,282, ,784 (1,324,060) (189,802) 229,828 12,292,370
128 METRO VANCOUVER HOUSING CORPORATION Notes to Financial Statements, page 12 Year ended December 31, Accumulated Surplus (continued) Investment in tangible capital assets is calculated as follows: 2017 Tangible capital assets Prepaid land leases Amounts financed by: Longterm debt ,617,831 5,841,498 82,705,874 6,063,297 (59,648,400) 26,810,929 (68,984,971) 19,757,200 The change in investment in tangible capital assets is as follows: Change in the investment in tangible capital assets Acquisition of tangible capital assets Amortization of tangible capital assets Less financing of tangible capital assets Payment of longterm debt Mortgage from Metro Vancouver Regional District Amortization of prepaid land leases Change in investment in tangible capital assets Investment in tangible capital assets, beginning of year Investment in tangible capital assets, end of year ,488,187 (3,576,230) (2,088,043) 1,175,559 (4,913,842) (3,738,283) (9,936,260) 599, ,799 (9,141,772) (12,719,573) 194,799 (12,524,774) 7,053,729 8,786,491 19,757,200 10,970,709 26,810,929 19,757,200
129 METRO VANCOUVER HOUSING CORPORATION Notes to Financial Statements, page 13 Year ended December 31, Contingencies Lawsuits As at December 31, 2017 there were various lawsuits pending against the MVHC arising in the ordinary course of business. The MVHC has retained legal counsel to defend against these lawsuits for which the outcomes are not possible to reasonably determine at this time and therefore no accrual has been recognized. Management is of the opinion that the losses, if any, in connection with these lawsuits can be sufficiently funded by reserve funds or covered by insurance. Any ultimate losses are recorded as expenses at the time the amounts are reasonably determinable. Self Insurance Fund A self insurance fund has been established within accumulated surplus of MVRD to cover losses resulting from uninsured liability exposures of the Metro Vancouver Districts and the MVHC. Each year a review is undertaken to determine if it would be beneficial to purchase liability insurance. The MVRD, its related Districts and the MVHC transfer amounts to the reserve depending on the fund's adequacy to cover retained liability risk. An estimate is made for all costs of investigating and settlement of claims incurred annually and an adjustment is made to the fund to maintain an adequate balance to cover potential losses in excess of recorded liabilities. These adjustments are changed as additional information becomes known during the course of claims settlement. Any potential costs would be recorded as an expense of MVHC at the time the losses are known and the amounts are reasonably determinable. BC Homes Repayable Assistance Under the Umbrella Agreement with BCHMC, the accumulated balance of the repayable assistance is forgiven on a straight line basis over the term of the agreement. As of December 31, 2017, the repayable assistance balance is nil and has been fully forgiven. BCHMC Umbrella Agreement Under the terms of the agreements the funding partner performs an annual review of expenditures, and certain expenditures may be considered ineligible. Management is of the opinion that the outcome and amount of an assessment is undeterminable and if any amounts are determined to be ineligible they will be funded from existing reserves in the year of assessment.
130 METRO VANCOUVER HOUSING CORPORATION Notes to Financial Statements, page 14 Year ended December 31, Budget Information The annual budget presented in these financial statements is based upon the 2017 operating and capital budgets approved by the Corporation s Board in October 2016, with additional approval in April 2017 for adjustments to the budget as a result of the 2016 fiscal year end results. The budget is based on operational and capital expenditure requirements and their associated funding. Amortization is a noncash item that is not funded for budget purposes. Alternatively, PSAS do not allow presentation of fund balances nor the appropriations of accumulated surplus. Therefore, contributions to or from reserves and debt principal repayments are removed from the approved budget for financial statement presentation. The schedule below reconciles the approved budget to the budget figures reported in these financial statements. Capital expenditures of 5,650,000 were included in the Capital Budget approved by the Board in April Budget Budgeted annual surplus per Exhibit B 6,655,230 Additional transfers from reserves, approved by Board April ,655,230 Adjusted annual surplus, based on October approved budget Items not included in the operating budget Amortization of tangible capital assets Transfer from deferred revenue for replacement Transfer to deferred operating surplus Reserve interest BCHMC operating subsidy 3,587,314 (3,929,108) 546,530 (373,670) (116,046) Items included in the budget but not in financial statements Capital replacement expenses Debt principal payments Transfers from (to) reserves Annual surplus per approved budget 6,974,446 (10,397,000) (2,947,696)
131 METRO VANCOUVER HOUSING CORPORATION Schedule 1 Schedule of Operating Fund (unaudited) Year ended December 31, 2017 Revenue Property rental Contributions Canada Mortgage and Housing Corporation British Columbia Housing Management Commission Restricted contributions Interest Other revenues Expenses Asset repairs and maintenance Utilities, permits and taxes Salaries and benefits Interest on longterm debt Management fees and net corporate costs Consulting, contracted and professional services Materials and supplies Other Annual surplus, operating fund Application of surplus and transfers Mortgages and debt retirement Transfers from (to): Capital Reserve funds for: Reserves operating results Reserves Change in operating fund 2017 Budget 2017 Actual 36,761,446 38,566,301 36,828,554 1,877,089 1,444,200 3,382, ,213 1,057,078 44,775,604 1,698,475 1,217,066 5,444,143 20,973 7,660,968 54,607,926 2,398,553 1,394,270 1,907, ,709 1,085,044 43,772,165 14,865,867 6,617,434 5,592,554 2,278,690 4,124, , , ,935 34,713,517 11,711,414 6,129,533 5,134,180 2,001,698 4,124, ,420 62, ,912 30,410,149 13,836,924 6,027,658 5,612,353 2,652,652 2,084, ,352 69, ,801 31,304,005 10,062,087 24,197,777 12,468,160 (10,397,000) (9,936,260) (12,719,573) (660,949) (842,819) 334,913 (1,660,172) (11,940,396) (229,828) 1,324,060 Operating fund, beginning of year Operating fund, end of year 2016 Actual
132 METRO VANCOUVER HOUSING CORPORATION Schedule 2 Schedule of Capital and Other Funds (unaudited) Year ended December 31, Budget Revenue Other income Expenses Mortgage Financing Fee related to Section 27 buyout Amortization of tangible capital assets Amortization of prepaid land lease 2017 Actual 2016 Actual 142, ,938 3,587, , ,689 3,576, ,799 4,913, ,799 Annual deficit, capital fund (3,782,113) (4,370,718) (4,965,703) Nonfinancial asset transactions Acquisition of tangible capital assets Amortization of tangible capital assets 5,650,000 (3,587,314) 1,488,187 (3,576,230) 1,175,559 (4,913,842) 2,062,686 (2,088,043) (3,738,283) 599,689 Financing Mortgages issued Transfers from (to): Operating fund Reserve funds Nonfinancial asset transactions and financing Change in capital and other funds Capital and other funds balance, beginning of year Capital and other funds balance, end of year 5,650,000 5,650,000 (3,587,314) 660, ,238 2,087,876 (4,175,919) 842, ,802 1,032,621 (4,770,904) (194,799) (194,799) (194,799) 6,036,297 6,036,297 6,231,096 5,841,498 5,841,498 6,036,297
133 5.2 To: From: Dean Rear, Director - Financial Planning & Operations Date: April 3, 2018 Subject: 2017 Financial Results Year-End Meeting Date: April 11, 2018 RECOMMENDATION That the MVRD Board receive for information the report dated April 3, 2018, titled 2017 Financial Results Year-End. PURPOSE To present the Board with the final report on financial performance for the year ending December 31, 2017 as compared to the 2017 annual budget. BACKGROUND The Terms of Reference requires that the Committee be provided, three times per year, an update on the actual financial performance of the Metro Vancouver Districts and Metro Vancouver Housing Corporation with the report on the year-end results also sent to the Board. This is the third and final report for 2017, with the final results for the year in terms of comparison to the annual budget. HIGHLIGHTS Operating Results 2017 operations of the Metro Vancouver Districts and Metro Vancouver Housing Corporation produced an overall surplus position of 44.2 million as compared to budget. This is broken down further as a result of higher than expected revenues (primarily due to Solid Waste tipping fees) of 16.8 million, underspends in operating costs of 18.5 million and lower than expected debt service costs of 8.9 million. All of Metro Vancouver s Districts and functions were in surplus positions for the 2017 fiscal year. The overall projected surplus is mainly due to the deferral of some operating and capital projects, staff vacancies, lower miscellaneous operating costs and slightly lower debt service costs in the utilities. The breakdown of the overall 44.2 million 2017 surplus, by district/function is as follows: Regional District million Water District million Liquid Waste million Solid Waste million Housing million
134 2017 Financial Results Year-End Regular Committee Meeting Date: April 11, 2018 Page 2 of 5 Budgets are set and approved based on the best information available at that time. Throughout the course of the year, changing operational priorities or unforeseen operational constraints along with pursuing alternate paths and looking for operational efficiencies can lead to actual results that differ from original expectations. Financial surpluses generated from operations are used for the benefit of either the District or the function from which the surplus was generated. That benefit is the reduction of future funding requirements. Board policy sets out the use of operating surpluses which is first used to avoid or pay down debt. Should this not be feasible due to the nature of the function, then the surpluses will be used for one-time future expenditures or to reduce future tax requisitions, levies or fees to the member municipalities. An overview of the 2017 financial performance is provided below with more details, including explanations and a trend analysis of some key financial indicators, provided in the attachment. The results for 2017, by District, are as follows: Millions Regional District Water District Sewerage & Drainage: Liquid Waste Services Solid Waste Services MV Housing Corporation Revenues Surplus/(Deficit) ( 0.5) 5.2 (3.5) Operating Expenditures Surplus/(Deficit) Debt Service Costs Surplus/(Deficit) (4.1) Total Surplus/(Deficit) Regional District: The operating surplus in the Regional District can be mainly attributed to underspends resulting from staff vacancies in Regional Parks/Planning, Air Quality, Labour Relations, lower Board and Committee meeting and international travel costs, the deferral of several Regional Parks/Planning, Air Quality operations/consulting project initiatives along with higher interest and filming revenues. Water District: The operating surplus is largely due to additional water sales and lease revenues, underspends on, and the delay/deferral of, some operating projects, lower labour costs due to staff vacancies, and underspends in water treatment residuals, water supply, and consulting. In addition, debt service costs were lower due to delays in some major capital projects along with the application of operations surplus from the prior year and favourable terms on the re-financing of some existing debt. Liquid Waste: The operating surplus is primarily due to deferral of some minor capital work and lower debt service costs due to the application of operational surplus from the prior year favourable terms on the re-financing of some existing debt. In addition, there were additional underspends in miscellaneous operational/project costs offset slightly by less reserve funding. Solid Waste: Higher than expected waste flows and revenues combined with management of expenditures has led to final results more favourable than anticipated when compared to the approved 2017 budget. Initially, a surplus of 4.9 million was budgeted to be contributed to
135 2017 Financial Results Year-End Regular Committee Meeting Date: April 11, 2018 Page 3 of 5 reserves. However, as a result of the higher waste flows and controlled management of operations, the function generated an overall surplus of 10.8 million. MV Housing Corporation: The surplus position for the year is primarily due to higher than expected net rental/other revenues in addition to lower net operating expenditure levels than that budgeted. In addition to the above, centralized support programs are in a surplus position for 2017 of approximately 3.3 million primarily due to underspending due to some staff vacancies as recruitment continues along with less debt service, repairs and maintenance at Kingsway/Kathleen. Budget Surplus Compared to Financial Statement Surplus Metro Vancouver is required to prepare balanced budgets by its enabling legislation, however the budget information reported on the financial statements must be per public sector accounting standards. This creates a difference between the reported annual surplus on the financial statements and the annual surplus as compared to the approved budget. The table below reconciles that difference: Annual surplus per Exhibit B Items not included in the operating budget: Amortization of tangible capital assets Loss on disposal of assets Sinking fund and debt retirement income Reserve interest Contributions from deferred revenue MVHC's capital replacement expenses per approved budget Capital grants and other income Corporate programs revenue (excludes reserve funding) Items included in budget but not in financial statements: Sinking fund and debt retirement payments Transfers to capital fund Transfers from reserve funds Annual surplus per Financial Performance Report 230,166,691 78,223,008 1,748,275 (25,259,657) (6,054,466) (11,645,932) 5,708,265 (1,855,074) (7,811,395) (81,163,252) (128,404,695) (9,443,658) 44,208,110 Capital Results Overall capital expenditures for Metro Vancouver for 2017 were under budget by million. The majority of the variance is related to the utilities. The underspend in capital is a key contributor to the lower debt servicing costs noted above. The resulting surpluses will be applied to avoid future debt requirements.
136 2017 Financial Results Year-End Regular Committee Meeting Date: April 11, 2018 Page 4 of 5 The summary of 2017 Capital Expenditures is as follows: Capital Expenditures Regional Parks Water District Sewerage & Drainage: Liquid Waste Services Solid Waste Services MV Housing Corporation Millions 2017 Budget Actual Variance (4.1) Regional Parks: In Regional Parks there were some design and construction project delays in the Capital Replacement and Development Projects program. In addition, there were less than expected parkland acquisitions as priorities are being assessed. Water District: In the Water District, there were unexpected delays related to design, permitting, land acquisition, operational requirements and tendering for a number of projects. Examples of include South Delta Main No 1 Replacement construction, Coquitlam Water Treatment Plant Ozone Generation Upgrades, and Capilano Raw Water Pump Station Back-up Power construction. Liquid Waste: Planned capital spending activities in the Liquid Waste function were relatively close to budget in 2017 with the exception of some delays in some planned projects in the Infrastructure Resilience, Maintenance and Opportunity capital programs which was offset by greater progress on components of the Annacis Wastewater Treatment Plant Stage V expansion project than was planned for Board approval for capital expenditures related to the multi-year Annacis Stage V Expansion Phase 1 was received in October 2014 and a multi-year construction contract, within that budget, was subsequently approved by the Board. As a result of favourable conditions, the work under this contract was able to advance faster than the estimated spending for the 2017/2016/2015 years. While exceeding the 2017 estimated spending, the capital expenditures incurred were within the total project spending approved by the Board. The project is expected to be completed on budget. Solid Waste: Capital projects that were either delayed or not implemented as planned in 2017 include some transfer station replacement/development work, waste to energy facility program project work as well as some minor program delays in several Coquitlam landfill upgrade projects. MV Housing Corporation: Capital budgets for Housing development were underspent in This is due to the substantial delay in the commencement of expenditures associated with the redevelopment of Heather Place into 2018 which had expenditures of 5.65M budgeted for 2017.
137 2017 Financial Results Year-End Regular Committee Meeting Date: April 11, 2018 Page 5 of 5 FINANCIAL INDICATORS The table below summarizes the list of financial indicators used to show Metro Vancouver s ability to provide services to the region on a sustainable basis. Detailed calculations and explanations are included in Attachment Actual Actual Municipal Property Tax and Levies/Total Revenue Current Ratio (current asset to current liabilities) Debt Service Costs/Total Revenue Interest Costs/Total Revenue Operating Reserves/Total Revenue Total Municipal Taxes, Water, Sewer and Solid Waste Charges Per Capita 36.6% 37.0% 4.2 to to % 18.1% 6.6% 6.9% 10.9% 12.9% ALTERNATIVES This report is provided for information. No alternatives are presented. FINANCIAL IMPLICATIONS This report provides information on the results of 2017 operations which generated a surplus of 44.2 million. This surplus is available in future years to either avoid debt or pay for regional projects thereby reducing the funding requirements. SUMMARY / CONCLUSION Overall, the 2017 financial results for the Metro Vancouver entities and functions were favourable to budget with a surplus of 44.2 million. Attachments: Attachment Financial Performance as of December
138 ATTACHMENT 1 Metro Vancouver Districts 2017 Financial Performance As of December 31, 2017 April 2018
139 Table of Contents Statement of Surplus/(Deficit) District Summaries Regional District Summary Water District Summary... 5 Sewerage & Drainage District Summaries Liquid Waste... 6 Solid Waste... 7 Housing Corporation Summary... 8 Corporate Programs... 9 Financial Indicators
140 Page 1 Metro Vancouver Districts Statement of Surplus (Deficit) For the period ending December 31, Year End Year End Variance % Variance to Budget Annual* Budget Year End Actuals Regional District Revenue Expenditure Surplus (Deficit) 65,570,380 65,570,380-64,978,659 61,403,669 3,574,990 Water District Revenue Expenditure Surplus (Deficit) 265,082, ,082, ,269, ,057,624 17,212,251 5,186,950 12,025,301 17,212,251 Sewerage and Drainage District Liquid Waste Revenue 236,257,900 Expenditure 236,257,900 Surplus (Deficit) - 232,718, ,977,160 8,741,782 (3,538,958) 12,280,740 8,741,782 (1.5%) 5.2% 3.7% 94,396,195 94,396, ,353,638 97,528,870 10,824,768 13,957,443 (3,132,675) 10,824, % (3.3%) 11.5% 41,083,767 41,083,767-42,701,040 38,846,722 3,854,319 1,617,273 (2,237,046) 3,854, % (5.4%) 9.4% - 44,208,110 44,208,110 DISTRICT / CORPORATION Solid Waste Revenue Expenditure Surplus (Deficit) MV Housing Corporation Revenue Expenditure Surplus (Deficit) Consolidated Surplus (Deficit) (591,721) 4,166,711 3,574,990 * 2017 Budget includes reserve and surplus carry-forward applications as approved b y the Board. (0.9%) 6.4% 5.5% 2.0% 4.5% 6.5% 6.3%
 4,187,876 4,187,876-4,185,100 4,184,972 128 (2,776) 2,904 128 (0.1%) 0.")
 6,176,153 6,176,153-6,750,264 5,577,017 1,173,247 574,111 599,136 1,173,247 Labour Relations Revenue Expenditure Surplus (Deficit)")
141 Page 2 Metro Vancouver Districts Regional Function's Surplus (Deficit) For the period ended December 31, Year End Annual* Budget Year End Actuals Year End Variance % Variance to Budget FUNCTION E911 Emergency Telephone Revenue Expenditure Surplus (Deficit) 4,187,876 4,187,876-4,185,100 4,184, (2,776) 2, (0.1%) 0.1% 0 10,251,794 10,251,794-9,227,712 9,086, ,107 (1,024,082) 1,165, ,107 (10.0%) 11.4% 1.4% General Government Revenue Expenditure Surplus (Deficit) 6,176,153 6,176,153-6,750,264 5,577,017 1,173, , ,136 1,173,247 Labour Relations Revenue Expenditure Surplus (Deficit) 2,703,516 2,703,516-2,654,809 2,421, ,975 (48,707) 281, ,975 (1.8%) 10.4% 8.6% Regional Emergency Management Revenue Expenditure Surplus (Deficit) 397, , , ,345 0 (58,655) 58,655 0 (14.8%) 14.8% 0 Regional GPS Revenue Expenditure Surplus (Deficit) 370, , , , ,621 28, , , % 30.5% 38.2% Regional Parks Revenue Expenditure Surplus (Deficit) 36,233,073 36,233,073-36,536,983 35,482,626 1,054, , ,447 1,054, % 2.1% 2.9% Regional Planning Revenue Expenditure Surplus (Deficit) 3,771,769 3,771,769-3,524,093 2,822, ,317 (247,676) 948, ,317 (6.6%) 25.2% 18.6% Electoral Area Revenue Expenditure Surplus (Deficit) 582, , , ,575 95,587 (121,406) 216,993 95,587 (20.8%) 37.2% 16.4% Sasamat Fire Protection Service Revenue Expenditure Surplus (Deficit) 895, , , ,261 34,651 5,000 29,651 34, % 3.3% 3.9% - 3,574,990 3,574, % Air Quality Revenue Expenditure Surplus (Deficit) Regional Surplus (Deficit) * 2017 Budget includes reserve and surplus carry-forward applications as approved b y the Board. 9.3% 9.7% 19.0%
142 Page 3 Metro Vancouver Districts 2017 Financial Performance District Summaries Metro Vancouver Regional District The Regional District is in a surplus position of approximately 3.6 million for This surplus is due primarily to underspends from staff vacancies in Regional Parks, Regional Planning, Air Quality and Labour Relations functional areas along with reduced Board and Committee meetings and international travel costs in General Government function, underspends from delayed operational and consulting projects in Regional Parks, Regional Planning and Air Quality, lower than expected legal costs in Labour Relations and interest/filming revenue earnings greater than budget. E911 Emergency Telephone E911 was essentially on budget at the end of the year. Air Quality Air Quality ended the year with a 141,000 surplus mainly due to several staff vacancies during the year and some 2017 planned projects delayed to 2018 offset by less than planned permitting revenues. General Government General Government realized a surplus of approximately 1,173,000 for the year due primarily to approximately 200,000 in savings as a result of less Board and Committee meetings than planned, close to 300,000 savings in International Engagement program travel due to no study missions in 2017, and close to 700,000 additional revenues due to interest income earnings greater than expected. Labour Relations (Regional Employer Services) Labour Relations is in a surplus position of close to 233,000 for 2017 due to lower than expected expenditures on legal fees due to settlements not requiring interest arbitrations and salary underspends over the course of the year due to vacant positions with ongoing recruitment efforts. Regional Emergency Management (REM) Regional Emergency Management has an expenditure surplus of approximately 59,000 at year end. This is due primarily to a temporarily vacant consulting position and its related project and development costs with the expense surplus offset by an equal amount of reduced reserve funding. Regional Global Positioning System (GPS) The GPS function had a surplus of close to 142,000 due primarily to equipment purchases and other service expenditures under budget and subscription revenues higher than budget.
143 Page 4 Regional Parks Regional Parks is in a surplus position of approximately 1,054,000 at the end of the 2017 fiscal year. The main contributing factors to the surplus position include delays in filling staff vacancies, the deferral of some consulting work and greater than budget filming revenue due to more activity. Overall Regional Parks expenditures were under budget by 750,000. This was mainly due to staff vacancies, salary step differentials and the deferral of some consulting work. The deferral in some work at Burns Bog including the Delta Nature Reserve, and legal costs for the Colony Farm litigation were less than expected. Total revenues were 304,000 greater than budget due primarily to more filming revenues as favorable economic factors are stimulating filming activities in the Region. The 2017 Parks Capital Maintenance program has an annual budget of 2,620,000. As at the end of 2017, close to 3,080,000 was expended on project priorities within the Capital Maintenance program offset by some underspends in the Parks Capital Replacement and Development Program. For the Capital Replacement and Development program, for 2017 close to 2,600,000 has been spent of the 4,675,000 total budget approved for the year. A few smaller projects have been deferred along with the scope of the Aldergrove management plan capital project being reduced. For the Regional Heritage Parkland Acquisition program, close to 1,700,000 has been spent at the end of the 2017 fiscal year of the 4,000,000 parkland acquisition expenditure approved budget. In addition, there were less than expected parkland acquisitions in 2017 as priorities are being assessed and a parkland acquisition strategy is being reviewed with the Regional Parks Committee. Regional Planning Regional Planning is in a surplus position of close to 700,000 primarily due to salary underspends from staff vacancies during 2017 along with reduced consulting expenditures due to project delays. Electoral Areas Electoral Areas is in a surplus position of approximately 96,000 mainly due to salary underspends. Sasamat Fire Protection Service The function had a surplus of close to 35,000 primarily due to being under budget for materials and supplies by approximately 10,000 and for asset purchases and maintenance by 7,000 along with more revenue due to an unexpected, unbudgeted grant from BC Hydro received in early 2017.
144 Page 5 Greater Vancouver Water District The Water District is in a surplus position of approximately 17.2 million for the 2017 fiscal year. Water District revenues, overall, have exceeded expectation by 5.2 million for the year due primarily to water sales better than budget by 2.8 million due to water consumption levels being slightly above budget, some unbudgeted lease/miscellaneous revenues of 3.8 million offset by less reserve utilization than budget of 1.4 million due to several delayed projects and right of way acquisitions, and equipment (laboratory) purchases funded by reserves. Total Water District expenditures for 2017 are 12.0 million below budget of which approximately 7.9 million is due primarily to savings on, and the delay/deferral of, some minor capital and other projects due to the re-allocation of resources to higher priority work, some operating staff vacancies and some other under expenditures for water treatment residuals, water supply and consulting. The under expenditure includes lower debt servicing costs of close to 4.1 million for the year due to the deferral of some major capital projects which are debt financed, along with the additional contribution to capital from the application of the 2016 operational surplus to avoid new debt, as well as favourable terms on the re-financing of some existing Water debt. The 2017 generated operations surplus will be applied to capital to avoid future debt requirements.
145 Page 6 Greater Vancouver Sewerage and Drainage District Liquid Waste Liquid Waste realized a surplus of close to 8.7 million primarily due to operational expenditure surpluses of 8.4 million, debt surplus of 3.8 million offset by slightly lower than budget revenues of 3.5 million. The breakdown of the surpluses to each of the Sewerage areas and Drainage is as follows: Vancouver Sewer Area million, North Shore Sewer Area million, Lulu Island West Sewer Area million, Fraser Sewer Area million and Drainage areas million. Function revenues came in under budget by close to 3.5 million primarily due to applications from reserves not fully utilized. Delays in several Sustainability Innovation Fund (SIF) projects accounted for 1.4 million of the total while the Iona residuals program work accounted for the remainder of 2.5 million. Transfers from the Development Cost Charge (DCC) deferred revenues were under budget by close to 1.6 million primarily due to debt service costs on growth capital expenditures being less than budget which was offset by more than budget BOD-TSS industrial permittee/other miscellaneous revenues which, when combined, were in excess of planned revenues by close to 2 million. Debt service costs were approximately 3.8 million under budget for the year due to additional contribution to capital from the application of 2016 operations surplus to avoid some new debt, the financing terms on the issuance of new long term borrowing being favourable to budget along with favourable terms on the re-financing of some existing debt. The function s operational costs were under budget by close to 8.4 million. The primary contributors to this surplus was from reduced minor capital works costs due to the cancellation of several planned projects, lower than budget residuals program work and maintenance costs along with some miscellaneous planning costs which came in under budget and some research and innovation project work being delayed. Three of the function s programs contributed the majority of the operational surplus: Research and Innovation at 1.4 million, Residuals at 3.3 million and Minor Capital projects at 2.1 million. The LWS Research and Innovation surplus was mostly due to the delay in the commencement of SIF projects due to contract development challenges, the Residuals program was under budget due mainly to the deferral of Iona Lagoon Dewatering and some Minor Capital projects which were not undertaken or were delayed to partially help offset expenditures in other program areas such as the additional sludge hauling work undertaken at Northwest Langley WWTP. The 2017 operational surplus will be applied to capital per policy to avoid future debt requirements.
146 Page 7 Solid Waste The Solid Waste function for 2017 had a 10.8M surplus. Higher than expected waste flows combined with management of expenditures has led to final results being higher than anticipated when compared to the approved 2017 budget. The function s net operational gains resulted in the surplus of 10.8 million, 5.9 million higher than the budgeted surplus of 4.9 million. The system experienced higher waste flows of approximately 100,000 tonnes compared to budget. Year over year increase from 2016 to 2017 was 6,000 tonnes. A number of factors impacted waste flows in 2017, including some reductions in recycling of organics and construction and demolition materials due to local processing facility challenges. Higher than budget waste flows resulted in increased revenues. Increased expenses are primarily related to increased contingency landfill quantities waste that cannot be managed at the Solid Waste function s Waste-to-Energy Facility or at the Vancouver Landfill and is being shipped to remote landfills for disposal. The above system activity had an impact on both expenditures and revenues for the year. Overall operational expenses were higher by 4.1 million of which the primary driver was higher contingency disposal costs of 7.6 million, lower fly ash and bottom disposal costs of close to 2.0 million and lower contract costs of close to 1.7 million. This was offset somewhat by lower debt servicing costs of 0.9 million. Revenues were 14.0 million higher primarily due to higher waste flows increasing revenues by 13.3 million. The 2017 operational surplus will be applied to capital per policy to avoid future debt requirements.
147 Page 8 Metro Vancouver Housing Corporation (MVHC) MVHC had a net surplus from operations of 5 million, which was approximately 3.8 million higher than planned for in the budget, for the year ended December 31, Revenues were greater than budget by approximately 1.6 million, due to higher than budgeted net rental revenues and other revenues combined with less BC Housing subsidies received. Expenditures overall were approximately 2.2 million less than budget by year end due to revisions of some maintenance contracts, maintenance efficiency gains, deferral/re-scheduling of some expenditures planned in budget along with some labour underspends on some position vacancies. The 2017 Housing Capital Replacement program s annual budget was 7.0 million for the year. By year end, 5.7 million had been spent for capital replacement expenses which was close to 1.3 million less than budget due to delays in/re-scheduling of some of the program s planned projects. With respect to Housing Development program capital, close to 827,000 of 5.7 million budget was spent, primarily on site preparation for the Heather Place redevelopment. The construction of Heather Place redevelopment did not begin until after year end. The budgeted expenditures not incurred in 2017 will be incurred in The delay in beginning Heather Place construction was due to the delay in receiving confirmation from BC Housing regarding their financial commitment to the project. All expenses incurred to date have been funded by the Housing Development Reserve.
148 Page 9 Corporate Programs Overall, Corporate Programs are in a surplus position of close to 3.3 million due primarily to staffing vacancies in External Relations, Financial Services, Legal and Legislative Services and a controlled reduction of head office repairs and maintenance at the Kingsway and Kathleen buildings. Corporate Planning Corporate Planning is 55,000 under budget primarily as a result of one temporary vacant position. External Relations External Relations is in a surplus position of approximately 137,000 primarily due to underspends on staffing temporary vacant positions during the year. Human Resources The Human Resources department has a surplus of approximately 74,000 due to lower than anticipated legal costs. Financial Services The Financial Services department is in a surplus position of approximately 660,000 for 2017 due to existing staff vacancies held unfilled until the implementation of the new Financial Management System (FMS) and other positions currently being recruited and an unexpected rebate from the corporate purchase card program. Legal and Legislative Services Legal and Legislative Services is in a surplus position of approximately 567,000 for 2017 due to delayed expenditures pertaining to the Information Management program and ongoing recruitment for the In House Legal program and less than anticipated use of external legal services. Corporate Services Head Office Operations as a whole, including Debt, Operations and Capital Debt generated a net surplus of 1.56 million. The surplus is primarily due to less debt and operations underspends at the Kingsway/Kathleen buildings. Only the necessary repairs were undertaken during the year as Metro Vancouver prepared for move from old Head Office to Metrotower III towards the end of the year. The Corporate Safety, Security and Emergency Management programs are underspent by close to 196,000 primarily due to savings in SSEM Regulatory Training consulting expenses due to increased efficiencies in course offerings and a decrease in contracted security cost at various sites. As well, Information Technology (IT) services was underspent by 1.8 million primarily due to asset purchases in network and telecommunication infrastructure for the new building was less than anticipated, and a drop in laptop replacement costs and the timing of a FMS software payment. The underspends on infrastructure and hardware was offset by less reserve funding being utilized. Information Technology (IT) services finished 2017 with a (net) surplus position of close to 74,000.
149 Page 10 Metro Vancouver Districts Financial Indicators These ratios are intended to help indicate the Metro Vancouver Districts financial ability to continue to provide services to the region on a sustainable basis. This involves evaluating a number of factors, including the ongoing ability to ensure revenues meet expenditures, ability to meet debt obligations, and the flexibility to address unexpected contingencies. Forecast ratios can help to identify potential financial problems in advance. 1) Municipal Property Tax and Levies / Total Revenue This ratio is a measure of the diversification of revenues. A high ratio indicates a reliance on property tax related levies / fees. A low ratio illustrates a greater range of revenues which is seen as beneficial. However, other revenue streams may not be sustainable or fluctuate more than tax requisitions Actual Total Property tax/levies Total Revenue** 232,429, ,970, Actual 35.5% 239,867, ,212, % 2016 Actual 2017 Budget 2017 Actual 250,542, % 684,548, ,131, % 702,391, ,131, % 719,022,155 The MVRD has a reasonably well diversified revenue base. Some revenue streams such as Water Sales and Solid Waste User Fees are subject to fluctuations during the year. 2) Current Ratio This is one measure of liquidity the ability of the local government to meet current obligations through existing current assets. A high ratio indicates a greater ability to respond to and meet budgeted and unexpected expenditures Actual Current Assets Current Liabilities 2015 Actual 722,478, to 1 578,680, to 1 201,276, ,884, Actual 666,745, ,292, Actual 4.2 to 1 960,619, ,709, to 1 **2017 Budget includes budgeted reserve, surplus carry-forward items or other additional reserve applications as approved by the Board.
150 Page 11 3) i) Debt Service Costs/ Total Revenue This is the percentage of revenue committed to payment of interest and principal on temporary and long-term debt for the regional, sewer, solid waste and water operations. A high percentage indicates greater use of revenues for the repayment of debt, and less ability to adjust to unplanned events and changing circumstances Actual Debt Service Costs Total Revenue** 3) ii) 122,877, ,970, % 2015 Actual 2016 Actual 2017 Budget 2017 Actual 121,415, % 666,212, ,585, % 684,548, ,718, % 702,391, ,794, % 719,022,155 Interest Costs/ Total Revenue This is the percentage of revenue committed to payment of interest on temporary and long-term debt for the regional, sewer, solid waste and water operations. A high percentage indicates greater use of revenues for servicing interest on outstanding debt, and less ability to adjust to unplanned events and changing circumstances Actual Interest Costs Total Revenue** 49,744, ,970, Actual 7.6% 46,884, ,212, Actual 7.0% 45,154, ,548, Budget 6.6% 63,919, ,391, Actual 9.1% 49,782, % 719,022,155 Both debt service costs and interest costs as a percentage of revenue are down compared to current budget indicating less of revenues are required to service outstanding debt (principal and interest) and more is available to fund priority projects. **2017 Budget includes budgeted reserve, surplus carry-forward items or other additional reserve applications as approved by the Board.
151 Page 12 4) Operating Reserves/ Total Revenues Reserve levels are an indicator of financial strength since they provide the ability to meet unforeseen expenditures or revenue losses Actual Operating Reserves Total Revenue** 77,547, ,970, % 2015 Actual 2016 Actual 2017 Budget 71,660, % 666,212,758 74,874, % 684,548,274 48,612, ,391, Actual 6.9% 92,617, % 719,022,155 Actual operating reserve levels are slightly higher than that projected in the current budget but are comparable to prior years actual reserve level once the increased operating surpluses are considered. The level of operating reserves remains adequate to meet any unexpected contingencies. 5) Total Municipal Taxes, Water, Sewer and Solid Waste Charges / Per Capita This indicator is a representation of the per capita cost impact of the regions tax payer supported services. These costs are passed on to the tax payer through our member municipalities. The 2017 population is assumed to increase at a rate of 1.5% over Actual Total Tax Revenue *** Total Population **** Per Capita 559,403, ,487, Actual Per Capita 571,024, ,519, Actual Per Capita 595,144, ,562, Budget 613,215,889 2,592,227 Per Capita Actual 629,251,790 2,592,227 The resultant increase in the actuals over the budget for 2017 is primarily a result of an increase in the actual revenues for Solid Waste User Fees. ** *** **** 2017 Budget includes budgeted reserve, surplus carry-forward items or other additional reserve applications as approved by the Board. Total Tax Revenue is defined as Regional District Tax Requisitions, Water Sales, Sewerage & Drainage Levies and Solid Waste User Fees. Based on Demographic Analysis Section, BC Stats, Ministry of Technology, Innovation and Citizens Services, Government of British Columbia, December Per Capita 243
152 5.3 To: From: Dean Rear, Director, Financial Planning and Operations Date: April 3, 2018 Subject: Greater Vancouver Sewerage and Drainage District Development Cost Charge Reserve Fund Expenditure Bylaw No. 313, 2018 Meeting Date: April 11, 2018 RECOMMENDATION That the GVS&DD Board: a) give first, second and third reading to Greater Vancouver Sewerage and Drainage District Development Cost Charge Reserve Fund Expenditure Bylaw No. 313, 2018; and b) pass and finally adopt Greater Vancouver Sewerage and Drainage District Development Cost Charge Reserve Fund Expenditure Bylaw No. 313, PURPOSE To meet the statutory requirements to use Development Cost Charges (DCC s) for funding of the liquid waste growth capital program. This bylaw completes the authority for the required transfer of DCC s to fund the 2017 growth capital projects. BACKGROUND The regional sewer development cost charges are governed under the GVS&DD Act and was introduced in 1997, pursuant to the philosophy that growth should pay for growth. DCC revenues are used to fund growth related capital projects only. Funds received through the collection of DCC s are set aside as deferred revenue in reserve accounts on a sewerage area basis for the funding of sewerage area projects and on a regional basis for regional liquid waste projects. Under the Act, transfers of any revenues collected out of the DCC Reserve Funds can only be for the restricted purposes, and must be authorized by bylaw. This report brings forward the bylaw required for the authority to transfer DCC revenues to fund the 2017 growth capital projects DCC RESERVE APPLICATIONS The annual financial plan from the inception of the DCC bylaw in 1997 estimates the DCC revenues collected that are required to fund the projected sinking fund payments on debt related to growth capital expenditures. Growth related capital expenditures are those that increase system capacity, thereby accommodating the increasing population in the region. DCC s are collected based on development in the region, held in reserve and applied as capital expenditures are incurred to enhance system capacity. The balances in the DCC deferred revenue reserves at December 31, 2017, after application of the growth funding amounts contemplated in this bylaw, are as follows:
153 GVS&DD Development Cost Charge Reserve Fund Expenditure Bylaw No. 313, 2018 Regular Committee Meeting Date: April 11, 2018 Page 2 of Fraser Sewer Area Vancouver Sewer Area Lulu Island Sewer Area North Shore Sewer area Regional 120,141,386 29,384,771 12,281,359 4,554, ,340, ,702, ,256,181 26,929,813 11,577,881 3,863, ,280, ,907,486 Early in the following year, as part of the year-end accounting processes, the actual DCC revenue requirements are determined and Board authority for the necessary reserve fund transfers is requested through the attached bylaw. The above reserve balances include the 2016 funding requirements. As a result of the volume of capital projects undertaken within the Liquid Waste function, long-term funding is not secured on a project by project basis but rather on a pooled basis by expenditure type (i.e. growth projects) by sewer area. The funding required for 2017, as set out in the annual financial statements, is 5,201,933 and is summarized by area as follows: Regional 0 No growth projects currently require funding. Fraser Sewer Area 5,017,522 This funding relates to a series of growth related projects primarily due to the required expansion of the liquid waste collection system throughout the Fraser Sewer Area. Lulu Island West Sewer Area 113,583 This funding is related to upgrades at the Lulu Island WWTP. North Shore Sewer area 70,828 This funding is related to upgrades at the Lions Gate WWTP. Vancouver Sewer Area 0 This use of DCC funding reduces the reliance on the sewer levy which is generated directly from member municipalities.
154 GVS&DD Development Cost Charge Reserve Fund Expenditure Bylaw No. 313, 2018 Regular Committee Meeting Date: April 11, 2018 Page 3 of 3 ALTERNATIVES 1. That the GVS&DD Board: a) give first, second and third reading to Greater Vancouver Sewerage and Drainage District Development Cost Charge Reserve Fund Expenditure Bylaw No. 313, 2018; and b) pass and finally adopt Greater Vancouver Sewerage and Drainage District Development Cost Charge Reserve Fund Expenditure Bylaw No. 313, That the GVS&DD Board receive for information the report titled Greater Vancouver Sewerage and Drainage District Development Cost Charge Reserve Fund Expenditure Bylaw No. 313, 2018, dated April 3, 2018 and provide alternate direction. FINANCIAL IMPLICATIONS This bylaw as presented under alternative one finalizes the required DCC funding as contemplated in the 2017 Liquid Waste budgeted revenues. Should this bylaw be amended or not approved, sewer levy funding may need to be used to fund debt on growth related capital expenditures rather that DCC s as intended a part of the DCC program. This would reduce the funding available for the other areas of the service and likely lead to an increase in the levy to member municipalities. SUMMARY / CONCLUSION The adoption of the bylaw as included under alternative one is recommended. The 2017 budget contemplated the transfer of DCC revenues collected to meet actual debt charge funding requirements related to the Liquid Waste growth capital program. This bylaw completes that process. Attachment: Greater Vancouver Sewerage and Drainage District Development Cost Charge Reserve Fund Expenditure Bylaw No. 313,
155 ATTACHMENT GREATER VANCOUVER SEWERAGE AND DRAINAGE DISTRICT BYLAW NUMBER 313, 2018 DEVELOPMENT COST CHARGE RESERVE FUND EXPENDITURE BYLAW WHEREAS: (1) The Greater Vancouver Sewerage and Drainage District (the Corporation ) enacted Development Cost Charge Bylaw 254, 2010, (further amended by Greater Vancouver Sewerage and Drainage District Amending Bylaws 286, 2014 and 292, 2015) which was effective as of April 23, 2010 (replacing repealed Development Cost Charge Bylaw 187, 1996, which was effective as of January 1, 1997), pursuant to which the Corporation has imposed development cost charges to assist the Corporation in paying capital costs incurred to provide, construct, alter or expand sewerage facilities to service development; (2) The Corporation has established a Development Cost Charge Reserve Fund pursuant to Greater Vancouver Sewerage and Drainage District Development Cost Charge Reserve Fund Bylaw No. 188, 1997, which was enacted pursuant to Section 58.6 of the Greater Vancouver Sewerage and Drainage District Act, into which fund the Corporation has deposited and continues to deposit the monies collected pursuant to Development Cost Charge Bylaw 254, 2010 (further amended by Greater Vancouver Sewerage and Drainage District Amending Bylaws 286, 2014 and 292, 2015) which was effective as of April 23, 2010 (replacing repealed Development Cost Charge Bylaw 187, 1996 which was effective as of January 1, 1997); (3) The Development Cost Charge Reserve Fund is divided into 5 separate accounts, pursuant to Greater Vancouver Sewerage and Drainage District Development Cost Charge Reserve Fund Bylaw No. 188, 1997, being the Regional Account, the Fraser Area Account, the Lulu Island West Area Account, the North Shore Area Account and the Vancouver Area Account; and (4) The Corporation is authorized to pay from the Development Cost Charge Reserve Fund the capital costs of providing, constructing, altering or expanding sewerage facilities that relate to development within the area of the Corporation or principal and interest on a debt incurred by the Corporation as a result of an expenditure for the capital costs of providing, constructing, altering or expanding sewerage facilities that relate to development within the area of the Corporation. The Board of the Greater Vancouver Sewerage and Drainage District in open meeting assembled enacts as follows: 1. The sum of 0 held in the Regional Account shall be paid out of such account and used to pay the portion of the principal on the debt incurred by the Corporation that has been apportioned to the Regional Area, which debt was incurred by the Corporation to pay for the capital costs of providing, constructing, altering or expanding sewerage facilities that relate to development within that area of the Corporation. Greater Vancouver Sewerage and Drainage District Development Cost Charge Reserve Fund Expenditure Bylaw No. 313, Page 1 of 2
156 2. The sum of 5,017,522 held in the Fraser Area Account shall be paid out of such account and used to pay the portion of the principal on the debt incurred by the Corporation that has been apportioned to the Fraser Sewerage Area, which debt was incurred by the Corporation to pay for the capital costs of providing, constructing, altering or expanding sewerage facilities that relate to development within that area of the Corporation. 3. The sum of 113,583 held in the Lulu Island West Area Account shall be paid out of such account and used to pay the portion of the principal on the debt incurred by the Corporation that has been apportioned to the Lulu Island West Sewerage Area, which debt was incurred by the Corporation to pay for the capital costs of providing, constructing, altering or expanding sewerage facilities that relate to development within that area of the Corporation. 4. The sum of 70,828 held in the North Shore Area Account shall be paid out of such account and used to pay the portion of the principal on the debt incurred by the Corporation that has been apportioned to the North Shore Sewerage Area, which debt was incurred by the Corporation to pay for the capital costs of providing, constructing, altering or expanding sewerage facilities that relate to development within that area of the Corporation. 5. The sum of 0 held in the Vancouver Area Account shall be paid out of such account and used to pay the portion of the principal on the debt incurred by the Corporation that has been apportioned to the Vancouver Sewerage Area, which debt was incurred by the Corporation to pay for the capital costs of providing, constructing, altering or expanding sewerage facilities that relate to development within that area of the Corporation. This bylaw may be cited for all purposes as Greater Vancouver Sewerage and Drainage District Development Cost Charge Reserve Fund Expenditure Bylaw No. 313, Read a first time this day of, Read a second time this day of, Read a third time this day of, Passed and finally adopted this day of, Greg Moore, Chair Chris Plagnol, Corporate Officer Greater Vancouver Sewerage and Drainage District Development Cost Charge Reserve Fund Expenditure Bylaw No. 313, Page 2 of 2
157 To: From: Dean Rear, Director - Financial Planning & Operations Date: April 3, 2018 Subject: Semi-Annual Report on GVS&DD Development Cost Charges Meeting date: April 11, 2018 RECOMMENDATION That the receive for information the report dated April 3, 2018 titled Semi-Annual Report on GVS&DD Development Cost Charges. PURPOSE To report on the 2017 GVS&DD Development Cost Charge (DCC) revenues and any implications on their adequacy, as required in the Board s policy. BACKGROUND Regional GVS&DD Development Cost Charges (DCC s) are collected on behalf of Metro Vancouver, as set out in the Board approved DCC Bylaw, by member municipalities and remitted twice a year. DCC s are used to fund growth related capital expenditures. Board policy requires that the DCC collections be reported to the Committee on a semi-annual basis. This is the second and final report for DCC COLLECTIONS The collections received for 2017 have increased by million (or 20.7 % overall) over that for Despite some modest increases in a few Areas, the collections still highlight a fairly consistent and, in some Areas, an elevated level of on-going regional development activity. DCC collections received by area are as follows: ( millions) 2017 TOTAL 2016 TOTAL Fraser Lulu N. Shore Vancouver Regional Total Currently, DCC collections are in excess of the actual annual funding requirements for growth related projects. However, as illustrated in the Financial Plan endorsed by the Board last fall, DCC utilization due to growth projects is expected to increase significantly, likely exceeding collections at current rates by The 2017 funding applications to be approved through Greater Vancouver Sewerage and Drainage District Development Cost Charge Reserve Fund Expenditure Bylaw No. 313, 2018 are show below: 2017 DCC s Applied 2016 DCC s Applied Fraser Lulu N. Shore Vancouver Regional Total
158 Semi-Annual Report on GVS&DD Development Cost Charges Regular Committee Meeting Date: April 11, 2018 Page 2 of 2 Each year, the sewerage growth capital projects that are undertaken are funded through long term debt financing utilizing a 15-year amortization period, for which the DCC s received are used to pay the principal portion of the borrowing. Excess DCC collections are maintained as deferred revenues for future application as required. The DCC deferred revenue balances as at December 31, 2017 were as follows: Fraser Sewer Area Lulu Island Sewer Area North Shore Sewer Area Vancouver Sewer Area Regional 120,141,386 12,281,359 4,554,756 29,384, ,340, ,702,326 A review of the DCC program has recently been completed which will see the implementation of new rates effective May 1, 2018 allowing sufficient future funding of regional growth requirements. ALTERNATIVES This is an information report. No alternatives are presented. FINANCIAL IMPLICATIONS The DCC program was established pursuant to the concept of Development Pays for Growth. Should the collections be inadequate to fund the Sewerage growth related projects, the funding burden would default to Sewer levies collected from the GVS&DD member municipalities. SUMMARY / CONCLUSION DCC collections for 2017 were million. DCC s received are used to pay the principal portion of the borrowing for growth related GVS&DD projects. As the requirement for capital projects related to growth is substantial and continues to grow, a review of the DCC program rates was recently completed which will see rates increased effective May ensuring the long term adequacy of the DCC program revenues to adequately fund the future growth capital requirements. In the medium term, current DCC revenue levels as well as the deferred revenues appear adequate
159 5.5 To: From: Dean Rear, Director - Financial Planning and Operations Date: April 3, 2018 Subject: Status of Water, Liquid Waste and Solid Waste Capital Expenditures to December 31, 2017 Meeting Date: April 11, 2018 RECOMMENDATION That the receive for information the report dated April 3, 2018, titled Status of Water, Liquid Waste and Solid Waste Capital Expenditures to December 31, PURPOSE To report on the status of the capital projects for Water, Liquid Waste and Solid Waste. These capital projects are typically multi-year in nature, therefore, this report provides a comparison between the total project budgets and total projected expenditures to project completion. BACKGROUND The Capital Expenditure reporting process as approved by the Board provides for regular status reports on capital expenditures with interim reports sent to the Utilities and Zero Waste Committees prepared by the respective departments in June and October and a final year-end report to the Committees and Board in April. The capital projects are separated into two types: Ongoing and Completed. Narrative information is provided describing key aspects of specific projects and each project is presented in the context of Total Projected Project Costs to Completion as compared to the Total Approved Budget. The approved budget represents the maximum expenditure authority extended by the Board. If it is projected that the total expected project expenditures will exceed the approved authority, additional approval will be sought from the Board. Appendix A contains summary financial information on Ongoing Projects and Completed Projects. The information presented is for Total Projected Completion which will generally cover multiple years. Capital project budgets typically include a minimum contingency of 10%. Individual project financial information included as follows: Schedule 1 Water, Schedule 2 Sewerage and Drainage (Liquid Waste) and Schedule 3 Sewerage and Drainage (Solid Waste). Appendix B provides narrative information for specific projects. The is provided a summary report for all utility capital including the respective appendices and schedules. ALTERNATIVES This report is provided for information. No alternatives are presented.
160 Status of Water, Liquid Waste and Solid Waste Capital Expenditures to December 31, 2017 Regular Committee Meeting Date: April 11, 2018 Page 2 of 2 FINANCIAL IMPLICATIONS Net capital expenditures, after applying available pay-as-you-go financing, are funded through longterm debt from the Municipal Finance Authority. This results in debt service costs, for the term of the debt, which must be funded annually through the water rate, sewer levy or development cost charges (in the case of growth capital), or tipping fee as appropriate. If capital expenditures are lower than budget for the year, the result is less required borrowing leading to a budget surplus due to savings in debt service costs. The surplus, by policy, will be applied to fund future capital expenditures thereby reducing the need to borrow. Any favourable variances to budget for approved capital projects is not redirected to other projects but is essentially dollars not spent. Each project proceeds on the individual projects approved expenditure budgets. Ongoing Capital Projects: The Water District is projecting to spend 33.6 million (3.9 %) less than the approved total project budgets for those projects in progress and included in Schedule 1. The Sewerage and Drainage District - Liquid Waste Services is projecting to spend 33.1 million (1.7 %) less than the approved total project budgets for those projects in progress and included in Schedule 2. The Sewerage and Drainage District - Solid Waste Services is projecting to spend 2.9 million (3.5 %) less than the approved total project budgets for those projects currently in progress and included in Schedule 3. Completed Capital Projects: These are projects that have been completed during 2017, some of which may have extended over multiple years. Overall, the Water District, Sewerage and Drainage District - Liquid Waste projects and Sewerage and Drainage District Solid Waste projects in this category are under spent by 4.9 million (6.8 %), 5.5 million (22.9 %) and 0.01 million (0.7%) respectively. SUMMARY / CONCLUSION This is the third in a series of three capital expenditure progress reports for The Board will see this information through individual reports to the Utilities and Zero Waste Committees. Both the Water District and Sewerage and Drainage District were under or essentially on budget for those projects completed as at December 31, 2017 and are projecting the same for ongoing projects when they complete. Economic Impact While a significant investment in infrastructure for the GVWD and GVS&DD, the projects identified in Schedules 1 and 2 represent approximately 5,770 person years of employment and, over their life (development and construction) and make up approximately 506 million of the Gross Domestic Product of the region. Attachments: Appendix A: Appendix B: Schedule 1: Schedule 2: Schedule 3: Capital Expenditure Summary Information as at December 31, 2017 Capital Project Status Information as at December 31, 2017 Water District Capital Expenditures Sewerage & Drainage District - Liquid Waste Capital Expenditures Sewerage & Drainage District - Solid Waste Capital Expenditures
161 APPENDIX A Capital Expenditure Summary Information As at December 31, 2017 Ongoing Projects Total Projected Expenditures to Completion ACE/ Total Budget Projected Variance Water 837,050, ,629,822 33,579,822 Liquid Waste 1,946,667,377 1,979,816,377 33,149,000 81,220,000 84,150,000 2,930,000 Total Ongoing Projects: 2,864,937,377 2,934,596,199 69,658,822 Completed Projects Total Actual Expenditures ACE/ Total Budget Solid Waste Water Variance 67,690,818 72,610,000 4,919,182 Liquid Waste 18,449,832 23,928,000 5,478,168 Solid Waste 1,042,788 1,050,000 7,212 87,183,438 97,588,000 10,404,562 Total Completed Projects:
162 Capital Project Status Information December 31, 2017 APPENDIX B 1. GREATER VANCOUVER WATER DISTRICT (Water Services) Major GVWD capital projects are generally proceeding on schedule and within budget. The following capital program items and exceptions are highlighted: i) Infrastructure Growth Program Coquitlam Intake No. 2 A new intake, transmission tunnel and treatment facilities are proposed at the Coquitlam Reservoir to increase the supply and transmission capacity from this source. Options for the intake, conveyance and treatment facilities are being assessed under the project definition work. The Project Definition Report is anticipated to be complete by mid Port Mann Main No. 2 (North) This 2.5 km long, 1.5 m diameter steel water main will twin the existing Port Mann Main to meet growing water demand south of the Fraser River. Construction of the new main between the Cape Horn Pump Station and Reservoir near Mariner Way and the new Port Mann Water Supply Tunnel is nearing completion. All contract piping has been installed and hydro testing is scheduled in early Tie-ins are planned to commence in March Port Mann Main No.2 (South) This 3.5 km long, 1.5 m diameter steel main will twin the existing Port Mann Main between the south shaft of the Port Mann Water Supply Tunnel and the Whalley Reservoir in the City of Surrey. The project is required to meet growing water demand south of the Fraser River. Detailed design of the project is 75% complete with the installation tender planned for late Fleetwood Reservoir Phase 1 of the Fleetwood Reservoir project includes a 13.6 ML reservoir, chamber, piping, access building and associated work located at Meagan Ann MacDougall Park in the City of Surrey. Detailed design was completed in 2017 and the construction tender is scheduled to close in March, South Delta Main No. 1 Replacement Phase 1 and 2 -This project comprises replacement of the existing water main with a new main on 52nd Street from 12th Avenue to 28th Avenue. Pipe installation has been completed and cleaning, disinfection and system tie-ins are to be completed by Spring Annacis Water Supply Tunnel A 2.3 km long, 4.5 m diameter water supply tunnel is required under the Fraser River to meet growing water demand south of the Fraser and to provide increased system resiliency. Detailed design was awarded to Hatch Corporation and work began in mid Geotechnical drilling is now complete. Property acquisition for the shaft sites in New Westminster and Surrey continues. Demolition of an old building on the north shaft site is underway. Capilano Main No. 5 (Stanley Park Section) This 1.4 km long steel water main will replace
163 the existing Capilano Main No 4 through Stanley Park to meet growing water demand and provide increased system resiliency. The public engagement on the conceptual tunnel design was conducted between September and November Park Board approval to commence design on the project has been secured and the Request for Proposals for preliminary and detailed design engineering services is planned to be issued in early Jericho Reservoir Phase 1 of the Jericho Reservoir project includes a 20.6 ML reservoir, chambers, piping and associated work located in the Township of Langley. Detailed design is 77% complete. Preparation of the tender documents for construction is underway. Annacis Main No. 5 (South) This project comprises approximately 3.0 km of 1.8 m diameter steel pipe connecting the Kennedy Reservoir to the south shaft of the Annacis Water Supply Tunnel in the City of Surrey. The preliminary design is nearing completion with detailed design commencing in early Kennedy Newton Main This project comprises approximately 9.0 km of 1.8 m diameter steel pipe connecting the Kennedy Reservoir to the Newton Reservoir in the City of Surrey. The preliminary design is nearing completion with detailed design commencing in early Whalley Main - This 2.5 km long, 1.5 m diameter steel main will twin the existing Whalley Clayton main between the Whalley Reservoir and the Whalley Kennedy Link Main at 96th Ave in the City of Surrey. Detailed design of the project is 65% complete with the construction tender planned for late ii) Infrastructure Maintenance Program Douglas Road Main No. 2 Still Creek Section This project comprises approximately 2.5 km of 1.5 m diameter steel pipe with trenchless crossings of Highway 1, Still Creek and the BNSF rail line. The water main alignment has been finalized. Preliminary design is anticipated to be complete in mid Douglas Road Main No. 2 Vancouver Heights Section This project comprises approximately 2.0 km of 1.5 m diameter steel pipe connecting the Vancouver Heights Reservoir to the Douglas Road Main No. 2 pre-build section at Beta Ave and Albert Street in the City of Burnaby. The project is currently in detailed design and construction is planned to start in early Fisherman s Trail Bridge Crossing Project Detailed design for the Suspension Bridge, Temporary Bridge, and Canyon Creek Bridge was completed by Associated Engineering in May The three bridges were re-tendered as a single procurement package in December Construction is scheduled for summer/fall of E2 Shaft Replacement The E2 Shaft, which has controlled ground water pressures in the East Abutment of Cleveland Dam since the 1950 s is nearing the end of its service life and needs to be replaced by a system of horizontal drains. Up to six (6) production drains may be required. A contract to drill three (3) production drains was awarded to Jensen Drilling and is now complete. The completed drains are being monitored and evaluated to determine if additional drains are required.
164 Cleveland Dam - Spillway Concrete Repairs Construction - The Cleveland Dam is a concrete gravity structure that has been in service since The spillway allows the discharge from Capilano Lake, and the training walls on either side of the spillway direct and confine the flow of water. As part of an ongoing maintenance program for the Cleveland Dam, the spillway training walls and a section on the spillway will be repaired. Repairs include the application of a cementitious coating on the training walls and minor resurfacing on the spillway. iii) Infrastructure Resilience Program Port Mann Main No. 1 Marine Crossing Removal A Port Mann Water Supply Tunnel permitting requirement of Vancouver Fraser Port Authority, was to remove the existing marine crossing from the river bed. Golder Associates have been contracted to undertake a feasibility assessment. Braid Street Main No. 2 This project consists of 2 km of 600mm diameter ductile iron pipe that will replace the existing Braid Street Main in the City of New Westminster. Construction commenced in fall 2017 and is anticipated to be complete in early Tie-ins are planned for fall Coquitlam Bulk Sodium Hypochlorite Conversion This project comprises the conversion of the existing gaseous chlorine storage, feed, and injection systems with a new liquid sodium hypochlorite storage and feed system. The existing system has been decommissioned and removed and the new feed system is in service using the temporary tanks. Remaining work includes the permanent feed system piping, tanks and restoration, and is scheduled for completion in 2nd quarter Second Narrows Water Supply Tunnel A 1.1 km long, 6 m diameter water supply tunnel is required under Burrard Inlet, between North Vancouver and Burnaby, to increase the reliability of supply in the event of a major seismic event and provide additional long term supply capacity. Detailed design is now substantially complete. Permitting and land acquisition discussions continue with District of North Vancouver and City of Burnaby. The procurement process for construction is underway. A Request for Qualifications was issued in early December. Burnaby Mountain Reservoir Seismic Upgrade This project involves seismically upgrading the existing reservoir to comply with the latest code requirements. The construction includes perimeter wall thickening, shear walls and access improvements. Construction started on May 2017 and is scheduled to complete in March Mackay Creek Debris Flow Mitigation Detailed design for this project was awarded to BGC Engineering Inc. Detailed design is now substantially complete and construction procurement is underway, with the issuing of a Request for Qualifications. Tree clearing has been completed at the site. Marine Crossings Phase 1 Conceptual Design In the fall of 2015 an assignment was awarded for Phase 1 conceptual design for two new marine water supply crossings; CambieRichmond crossing of the north arm of the Fraser River between Vancouver and Richmond and the Haney Main crossing of the Pitt River between Port Coquitlam and Pitt Meadows. The draft
165 conceptual design report review is complete and comments have been provided to the consultant team. Clayton Reservoir This project includes a new 22.5 ML reservoir located at 72nd Avenue and 190th Street in Surrey that will increase the storage capacity, meet current seismic standards and replace the existing Clayton Tank. Construction is well underway with completion anticipated by summer iv) Infrastructure Upgrade Program Queensborough Main Ewen Ave Replacement This project consists of replacing the existing Queensborough Main No. 1 with 2 km of new 600mm diameter ductile iron pipe. Phases 1 and 2 of the work are substantially complete with tieins to the existing system anticipated to be completed in Spring South Delta Main No. 1 Replacement- Phase 3 This project consists of replacement of the existing South Delta Main No. 1 on 53rd Street from 28th Avenue to 34B Avenue, and on 28th Avenue between 52nd Street and 53rd Street. Phase 3 consists of approximately 1.6 km of 900 mm diameter welded steel pipe, a crossover valve chamber at the intersection of 28th Avenue and 53rd Street, and a crossing of the BC Rail tracks at Deltaport Way. Phase 3 construction is scheduled to commence in mid Coquitlam Ozone Upgrade This project consists of replacing the PLCs for the ozone destruct units and upgrading the ozone generators. Equipment procurement documents are being prepared and equipment fabrication is anticipated to commence in Summer 2018.
166 2. GREATER VANCOUVER SEWERAGE & DRAINAGE DISTRICT (Liquid Waste Services) Major GVS&DD liquid waste capital projects are generally proceeding on schedule and within budget. The following capital program items and exceptions are highlighted: i) Infrastructure Growth Program FSA Burnaby Lake North Interceptor Construction of the twinning of the Sperling Section including final repaving was complete in Preliminary design of Phase 2 (Sperling to Phillips Ave) and Phase 3 (Phillips to Piper Ave) and stakeholder engagement are underway. Alignment alternatives within Burnaby Lake Park and a tunneling option under Winston Street were investigated. An assessment of alignment alternatives was completed including traffic, environmental and business disruption impacts and constructability challenges and a recommendation to select Winston Street Tunneling as a preferred option was made. Preliminary design of the preferred alignment will be finalized in early 2018, to be followed by detailed design. FSA South Surrey Interceptor Johnston Road Section Construction of the twinning of Phase 1 started in March 2017 and includes installation of approximately 625m of 3m diameter corrosion resistant concrete sewer pipe. Phase 1 is scheduled to be complete by mid Phase 2 comprises of tunnel and open cut sections. Tunnel section construction is scheduled to start in the summer of Detailed design of the open cut section is underway and is scheduled to be complete in 2018, to be followed by construction in FSA Annacis Island WWTP Outfall This project involves implementing solutions for the transient/surge impacts that may occur in the wastewater collection and treatment plant influent system in the event of a power outage, and increasing the capacity of the outfall to support growth. Detailed design of a new 4.2m diameter outfall is complete. The tunnel will be constructed at a depth of approximately 40 m, and convey treated effluent approximately 1 km from the AIWWTP to the Fraser River where it will discharge from a 2.5 m (id), 250 m long diffuser manifold buried in the river bed. The application to the Port of Vancouver for the Project Environmental Review has been submitted, and the Stage 2 Environmental Impact Assessment, including diffuser design/dilution modelling reports, will be submitted to the Ministry of Environment shortly. Construction is scheduled to start in 2019 and be completed in ii) Infrastructure Maintenance Program LSA Gilbert Trunk Sewer Twinning Construction of Phase 1 is complete. Design work for Phases 2, 3 and 4 (from Hollybridge Road to the Lulu Island WWTP) is 90% complete. Staff and the City of Richmond analyzed timing of adjacent City works, and developed a project schedule with Phase 2 construction starting in mid-2018, followed by Phases 3 and 4 in VSA Iona Island WWTP Solids Handling Upgrade This project involves improving the existing grit removal and sludge screening systems, increasing sludge thickening capacity, and improving the digester mixing systems. Refurbishment of the existing sludge thickener was initiated in October 2015 and was completed on schedule by April 2016 and is back in full
167 operation. The new Screening, Degritting and Thickening facility is commissioned and in operation. The Digester Mixing Upgrade contract started in November 2015, and is expected to be complete in Digester No. 2 upgrades are complete and the digester is back in service. The contractor is currently working on Digester No. 4. FSA Annacis Island WWTP Secondary Clarifier Corrosion Repair This project involves replacing 12 secondary clarifier mechanisms that have been damaged by corrosion and are at the end of their useful life. This project also includes the installation of 12 new influent flow balancing gates, and replacement of 3 existing secondary bypass gates. Six mechanisms have now been replaced and work to replace one more unit is scheduled for the summer of A contract is being prepared for the remainder of the units, scheduled to be issued in late 2018 for construction work in timeframe, in co-ordination with the Stage 5 Expansion construction. iii) Infrastructure Risk Management Program FSA Annacis Island WWTP Cogeneration System Detailed design and construction tender documents were completed in the summer of Four (4) pre-qualified construction tender bids were received and the lowest bidder was selected and approved by the GVS&DD Board in the fall of Their scope includes removal of the existing cogens and installation of the new cogens and stand-by diesel generators (SDG s), the supply and installation of new or modified electrical and air handling systems as well as ground improvements and structural upgrades to the existing cogen building. Project completion is anticipated to be in the fall of iv) Infrastructure Upgrade Program FSA Sapperton Pump Station FSA Sapperton Pump Station Construction is well underway following contract award in September Work is expected to be substantially complete by the end of As of December 31 the work is approximately 35% complete, with the below grade concrete structure nearing the surface. FSA Sperling Pump Station - The Sperling Pump Station Upgrading Project provides for a totally refurbished and expanded pump station by upgrading the existing aging and under capacity facility. NAC Constructors Ltd. is the successful tenderer and started construction in February Various chambers and a micro-piling system for the new building have been constructed. The main station bypass system is being completed for final testing, so that upgrading work on the main Sperling pump station can commence. The project is expected to be complete towards the middle of VSA Iona Island WWTP Temporary Biosolids Dewatering Facility Decommissioning of the existing digested sludge lagoons and biosolids land drying area must occur prior to the construction of the new secondary treatment plant. A temporary mechanical dewatering facility will be needed to dewater on-going plant production of biosolids so that they can be hauled away for disposal. A feasibility study by Black & Veatch recommended centrifuge technology and a design-build (D-B) methodology to expedite schedule since the facility must be up and running no later than December An Owner s Engineer (OE) was retained in October 2017 to assist MV prepare the indicative design and the D-B RFQ/RFP/ Agreement documents. The OE will also support MV during the detailed design and construction phases to
168 ensure the D-B contractor complies with the specifications in the D-B Agreement. An RFQ to seek pre-qualified D-B bidders is planned for January 2018 followed by the D-B RFP package in April 2018 with an anticipated award date in February 2019 following GVS&DD Board approval in January The target facility completion date is December v) Annacis Stage 5 Expansion Program FSA- Annacis Island WWTP Stage 5 Expansion Phase 1 This work involves expansion of treatment process units including primary sedimentation tanks, secondary clarifiers, solid contact tanks and odour control facilities. The 253 million construction contract has been executed between Metro Vancouver and Graham and AECON Joint Venture in April Construction of the Phase 1 main contract is 15% completed and the anticipated substantial completion date is May 19, Construction of the three-story CDAC and Laboratory Building under a separate contract with Kenaidan is complete.
169 3. GREATER VANCOUVER SEWERAGE & DRAINAGE DISTRICT - Solid Waste Services Major GVS&DD solid waste capital projects are generally proceeding on schedule and within budget. The following capital program exceptions are highlighted: 1) Transfer Station Program The Coquitlam Transfer Station relocation project will begin construction in the spring of Detailed design was completed through 2017 and early 2018, a development permit application submitted to the City of Coquitlam on November 7, 2017 and the first tender for work relating to site grading was released on February 23, Commissioning of a new transfer station is scheduled for the end of ) Landfills Program After completion of an engineering assessment, the Phase 2 collection system upgrade (for the new Coquitlam transfer station) will be a combination of an active system at buildings and a passive system over the remainder of the facility. A new control room is required and this work is planned for second half of ) Waste to Energy Program The bottom ash processing project received approval from the GVS&DD Board in October Approval to proceed with construction of the project has been given to Covanta. The City of Burnaby building permit was issued in February Completion of the work is scheduled for Q

170 SCHEDULE 1
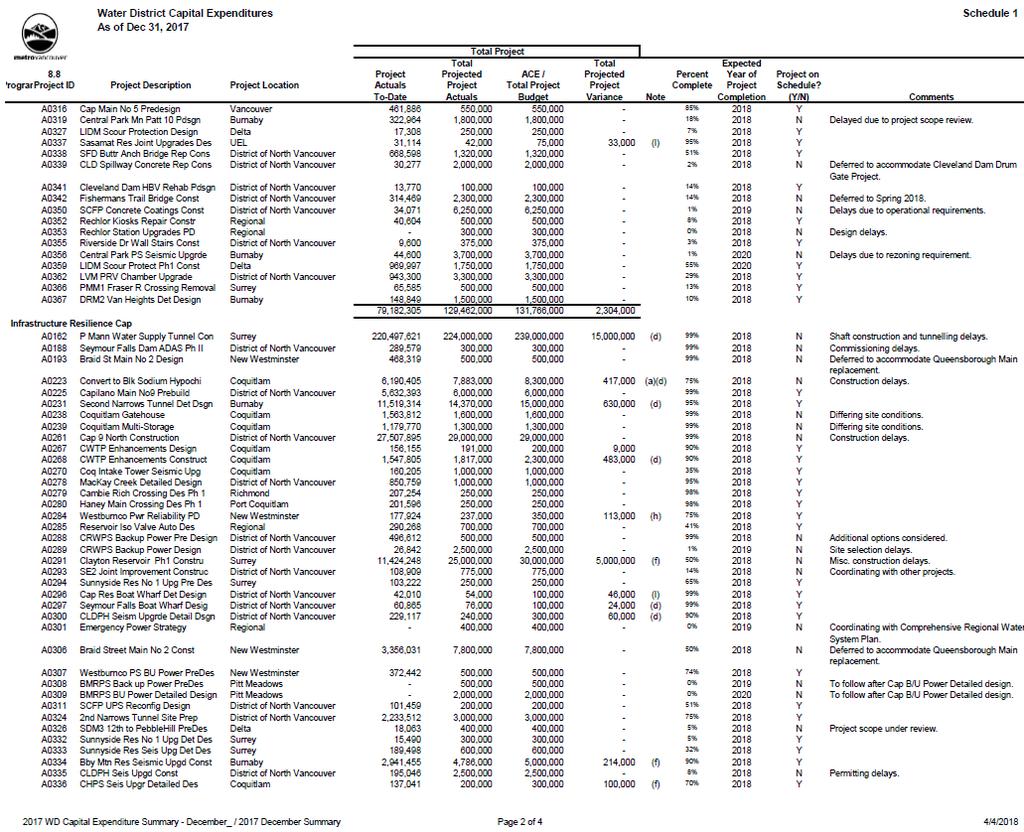
171
172
173
174 SCHEDULE 2
175
176
177 99%
178
179
180 SCHEDULE 3
181 5.6 To: From: Phil Trotzuk, Chief Financial Officer Date: March 28, 2018 Subject: Operating, Statutory and Discretionary Reserves Policy Meeting Date: April 11, 2018 RECOMMENDATION That the endorse the Operating, Statutory and Discretionary Reserves Policy as presented in the attached report, dated March 28, 2018, titled Operating, Statutory and Discretionary Reserves Policy. The responsibilities as included in the Committee Terms of Reference includes the following: Reviewing financial policies and recommending to the Finance and Intergovernment Committee on proposed new policies and policy amendments The proposed Operating, Statutory and Discretionary Reserves Policy is presented to the Performance and Audit Committee for review and comment prior to consideration at the Finance and Intergovernment Committee on April 20, Attachments: 1. Finance and Intergovernment Committee Report dated March 28, 2018 titled Operating, Statutory and Discretionary Reserves Policy. 2. Operating, Statutory and Discretionary Reserves Policy Projected Reserve Balances
182 ATTACHMENT 1 To: Finance and Intergovernment Committee From: Phil Trotzuk, Chief Financial Officer Date: March 28, 2018 Subject: Operating, Statutory and Discretionary Reserves Policy Meeting Date: April 20, 2018 RECOMMENDATION That the MVRD, GVWD, GVS&DD and MVHC Board approve the Operating, Statutory and Discretionary Reserves Policy as presented in the attached report, dated March 28, 2018, titled Operating, Statutory and Discretionary Reserves Policy. PURPOSE To present for Committee and Board consideration the Operating, Statutory and Discretionary Reserves Policy which will guide the establishment, use and management of reserves for Metro Vancouver s four legal entities and statutory functions. BACKGROUND Reserves are an essential component of the financial sustainability of the Metro Vancouver entities. Metro Vancouver has, over the years, consistently followed established practices regarding the establishment, use and management of reserves. During the 2018 to 2022 five year financial planning process there was discussion at several Standing Committee meetings regarding the application of reserves. As part of the 2018 Finance and Intergovernment Committee work plan, staff have been directed to develop a proposed Reserve Policy that will guide the establishment, use and management of reserves for Metro Vancouver s four legal entities and statutory functions. This report presents a draft policy for the Committee and Board s consideration which addresses the three types of reserves that are used within Metro Vancouver Operating, Statutory and Discretionary Reserves. METRO VANCOUVER RESERVE STRUCTURE Metro Vancouver comprises four legal entities, Greater Vancouver Water District (GVWD), Greater Vancouver Sewerage and Drainage District (GVS&DD), Metro Vancouver Housing Corporation (MVHC) and Metro Vancouver Regional District (MVRD) and within the MVRD there are separate statutory functions for Affordable Housing, Air Quality, Electoral Area, General Government, Labour Relations, Regional Global Positioning System (GPS), Regional Parks, Regional Planning, E911 Emergency Telephone Service, Regional Emergency Management and Sasamat Fire Protection Service. Each are accounted for as separate legal entities. The revenues generated by each entity or function are only permitted to be expended for business operations of that entity or function. Consistent with this, any revenues retained for use in the future (i.e. reserves) are also restricted to the given entity
183 Operating, Statutory and Discretionary Reserves Policy Finance and Intergovernment Committee Meeting Date: April 20, 2018 Page 2 of 5 or function. As a result of the Metro Vancouver s legal structure, reserves must be maintained separately for each entity and function. PROPOSED POLICY As part of the Operating, Statutory and Discretionary Reserves Policy development process, Metro Vancouver s current process and framework was examined along with practices adopted by other local municipalities within British Columbia such as: City of Victoria, City of Burnaby, Regional District of Nanaimo, Fraser Valley Regional District, City of West Kelowna and District of Mission. The results from the examination indicated that Metro Vancouver s current practice is in line with best practices with the other local municipalities, however, a formalized policy for Metro Vancouver is an appropriate next step to ensure Board oversight in the establishment and management of reserves. The proposed policy supports the following principles: Financial stability, security and sustainability Consistent with long term financial plans, Board and Corporate strategic goals In accordance with legal requirements under applicable legislation The policy outlines general requirements that govern Metro Vancouver reserves, which are all reserve contributions and applications must be approved by the Board and that all reserves exclusively belong to a specific legal entity or statutory function and can only be applied to fund business activities of that legal entity or statutory function. Reserves will earn interest annually based on the internal rate of return on investments. Furthermore, Financial Services is responsible for the stewardship and oversight of all Metro Vancouver reserves. Under this policy, Metro Vancouver will maintain three types of reserves: Operating Reserves, Statutory Reserves and Discretionary Reserves. OPERATING RESERVES Operating Reserves are established within the policy for each legal entity and statutory function to serve as a measure of financial security against an unforeseen financial loss, such as a revenue shortfall or unexpected expenditures. The policy requires that each legal entity and statutory function maintain a minimum level of Operating Reserve as a financial safeguard. The amount of that minimum is based on the inherent risk of incurring a financial loss. The inherent risk is a factor of business volume which can be represented as a percentage of the legal entity and statutory function s prior year s operating expenditures net of reserve contributions, contributions to capital and debt service costs. The risk of an unforeseen financial loss also increases with the volatility associated with the business activity. The greater the volatility, the higher the representative percentage. The inherent volatility associated with business activity for purposes of determining an appropriate level of operating reserve is assessed as high, moderate or low. The GVWD and the Solid Waste function within the GVS&DD have higher revenue uncertainty as both are based on volume times a unit rate and actual volumes could be adversely impacted by uncontrollable factors. As a result, of
184 Operating, Statutory and Discretionary Reserves Policy Finance and Intergovernment Committee Meeting Date: April 20, 2018 Page 3 of 5 this higher potential risk, the policy sets a required Operating Reserve equal to 15% of net operating expenditures representing about 2 months of operations. The Liquid Waste function within the GVS&DD has moderate risk associated with business activities due primarily to the volume of activity as there is little risk regarding revenues with the primary source being the sewer levy collected from member jurisdictions. The MVHC also has a moderate level of risk. While MVHC is dependent on rental revenues for funding of operations, the vacancy rate is normally quite low and expenditures can be managed should revenue availability dictate such. With a moderate level of risk, the policy sets a required Operating Reserve equal to 10% of net operating expenditures representing about 1 month of operations. Finally, the functions within the MVRD have low risk relative to business activities. The nature of business activities within these functions are relatively consistent from year to year and the primary revenue source is tax requisitions collected from member jurisdictions. As a result, this policy sets a required Operating Reserve, for each MVRD Statutory function, equal to 5% of net operating expenditures representing about 0.5 of a month of operations. The minimum Operating Reserve requirements included under this policy can be summarized as follows: Legal Entity/Function GVWD GVS&DD - Solid Waste GVS&DD - Liquid Waste MVHC MVRD Minimum Operating Reserve 15% of Net Operating 15% of Net Operating 10% of Net Operating 10% of Net Operating 5% of Net Operating STATUTORY RESERVES Statutory Reserves are reserves that require a legal framework which governs their composition and application. Statutory Reserves are set aside for a legal entity and statutory function for a specific purpose in accordance with the applicable terms and conditions within the legal framework as follows: 1. Legal Statute - required by specific legislation. 2. A Board Approved Bylaw - sets out the purpose, sources of funds, uses and management of the specific reserve. 3. Governing Agreement - an arrangement with another level of government or entity, in which the terms and conditions of the reserves will be outlined. This involves prescribing the sources of funding, contribution sources, use and management. Contributions to Statutory Reserves are made through annual budget contributions and the appropriation of the annual surplus generated from operations in accordance with legal statute, the Board approved bylaw, or governing agreement.
185 Operating, Statutory and Discretionary Reserves Policy Finance and Intergovernment Committee Meeting Date: April 20, 2018 Page 4 of 5 DISCRETIONARY RESERVES Discretionary Reserves are reserves established by the Board for legal entities and statutory functions as follows: to meet a known or anticipated future financial obligation, or for general future usage. An important policy requirement is that the usage of Discretionary Reserves will be included, where applicable, within the five-year financial plan. This involves reporting on Discretionary Reserves opening balance, forecasting the contributions, uses and ending balance, which will be included as part of the five year financial planning process. Appropriation of Annual Surplus The application of an annual surplus, the excess of revenues over expenditures, once ensuring that all Operating Reserves meet the minimum balances and that all requirements for Statutory and Discretionary Reserves are met, will be prioritized as follows: 1. Fund capital expenditures or pay down existing debt. 2. Fund one-time expenditures. 3. Rate stabilization for a legal entity or statutory function. This involves smoothing out utility rates, levies or tax requisitions resulting from operating budget expenditures. Usage of reserves for rate stabilization is only used in circumstances where priorities 1) and 2) are not applicable, or have been met. This application is discretionary and may not be applicable. If not applicable, then move to priority Maintain as a Discretionary or Statutory Reserve. This can represent an addition to an existing Statutory or Discretionary Reserve or the establishment of a new Discretionary Reserve based on new information regarding a future financial obligation. Management of Reserves When the Board has approved the use of reserves to fund expenditures, the funding must be spent for the intended purpose within the year of approval, or the following year. If the money has not been spent within the given time frame, the legal entity or statutory function must receive reapproval from the Board to use the reserves. ALTERNATIVES 1. That the MVRD, GVWD, GVS&DD and MVHC Board approve the Operating, Statutory and Discretionary Reserves Policy as presented in the attached report, dated March 28, 2018, titled Operating, Statutory and Discretionary Reserves Policy. 2. That the MVRD, GVWD, GVS&DD and MVHC Board receive for information the report dated March 28, 2018, titled Operating, Statutory and Discretionary Reserves Policy and provide alternate direction. FINANCIAL IMPLICATIONS If the Board approves alternative one, the minimum Operating Reserve balances for Metro Vancouver entities and functions is projected to be 50.2 million for 2018 with Solid Waste increasing by 5% or approximately 4.0 million and the MVHC by approximately 700,000 which will result in an
186 Operating, Statutory and Discretionary Reserves Policy Finance and Intergovernment Committee Meeting Date: April 20, 2018 Page 5 of 5 appropriate measure of financial security for each entity or function. The Statutory and Discretionary Reserves are maintained as required and consistent with current practice. The approval of alternative one will ensure that Metro Vancouver has a formal policy that outlines a prudent and risk based approach to the establishment, use and management of reserves. The approval of alternative two will require that the financial implications be quantified accordingly depending on the direction provided. SUMMARY / CONCLUSION Reserves are a critical component of long term financial planning and management in ensuring a strong financial position. The approval of this reserves policy, as attached, will provide clear Board direction for the principles and requirements associated with the establishment, use and management of Metro Vancouver reserves. Staff recommend that the Board approve alternative one. Attachments 1. Operating, Statutory and Discretionary Reserves Policy Projected Reserves
187 ATTACHMENT 2 BOARD POLICY OPERATING, STATUTORY AND DISCRETIONARY RESERVES Effective Date: Approved By: PURPOSE To outline principles and requirements that guide the establishment, use and management of Metro Vancouver reserves. DEFINITIONS Annual Surplus means excess of revenues over expenditures for the current year. Legal Entity means Greater Vancouver Water District (GVWD), Greater Vancouver Sewerage and Drainage District (GVS&DD), which includes the legal functions of Liquid Waste and Solid Waste, Metro Vancouver Housing Corporation (MVHC) and Metro Vancouver Regional District (MVRD). Statutory Functions mean functions related to the Metro Vancouver Regional District, which include: Affordable Housing, Air Quality, Electoral Area, General Government, Labour Relations, Regional Global Positioning System (GPS), Regional Parks, Regional Planning, E911 Emergency Telephone Service, Regional Emergency Management and Sasamat Fire Protection Service. POLICY Reserves are funds that are appropriated as a means of providing financial security against an unforeseen financial loss, such as a revenue shortfall and unexpected expenditures, or for meeting future financial obligations. They are a key element of Metro Vancouver s long term financial sustainability and they provide a mechanism to ensure a strong financial position. Metro Vancouver reserves are categorized as Operating, Statutory or Discretionary. Metro Vancouver s Reserves Policy supports the following principles: Financial stability, security and sustainability Consistent with long term financial plans, Board and Corporate strategic goals In accordance with legal requirements under applicable legislation In addition to these guiding principles, reserves shall be established and managed in accordance with the following: All reserve contributions and applications must be approved by the Board All reserve balances will earn interest at a rate based on Metro Vancouver s average return on investments All reserves exclusively belong to a specific legal entity or statutory function and can only be applied to fund business activities of that legal entity or statutory function. Financial Services is responsible for the stewardship and oversight of all Metro Vancouver reserves OPERATING, STATUTORY AND DISCRETIONARY RESERVES PAGE 1 OF 6
188 1. OPERATING RESERVES Operating Reserves are established for each legal entity and statutory function to serve as a measure of financial security should there be an unforeseen financial loss beyond the control of the organization. A legal entity or statutory function s inherent risk of experiencing an unforeseen financial loss increases both with the level of business activity as well as the nature of that business activity. Operating expenditures serve as a measure of an entity or function s level of business activity; therefore, the greater the business activity the greater the risk of an unforeseen financial event. Risk of an unforeseen financial loss also increases with volatility associated with the business activity. Minimum Reserve. The minimum required Operating Reserve amount for a legal entity or statutory function shall be determined as a percentage of the legal entity or statutory function s prior year operating expenditures net of reserve contributions, contributions to capital and debt service costs and is based on the inherent risk of incurring a financial loss. As noted above, the higher the level of inherent risk, the higher the required reserve minimum balance. Operating Reserve balances must be maintained at the established minimum amounts in order to ensure security against unforeseen financial impacts as this financial security is paramount to financial sustainability. Should the Operating Reserve balance fall below the established minimum, the Operating Reserve must be replenished to the minimum level within two budget years. Contributions to Reserve. Contributions to Operating Reserves are made through the appropriation of annual surpluses generated from operations within a legal entity and statutory function. Usage of Reserve. The usage of Operating Reserve balances will only be contemplated for the funding of unforeseen revenue shortfalls or expenditures obligations where other sources of funding is not available. a) Greater Vancouver Water District (GVWD) Operating Reserve The required Operating Reserve for the Water Services function is equal to 15% of net operating expenditures representing approximately two months of operating costs. The GVWD is an entity whose primary revenue source is the sale of water based on a unit rate per cubic metre of water consumed within the region. The unit rate is set at a rate to cover annual expenditures and based on an estimated volume of overall regional consumption. The actual level of consumption, however, may vary from expectation due to many factors including weather, effectiveness of conservation measures and the implementation of watering restrictions. This potential volatility in consumption and that the majority of expenditures are not variable with the level of consumption and cannot easily be adjusted should there be a drop in consumption, results in the GVWD having a higher relative level of inherent risk associated with their business activities. b) Greater Vancouver Sewerage and Drainage District (GVS&DD) Solid Waste The required Operating Reserve for the Solid Waste function is equal to 15% of net operating expenditures representing approximately two months of operating costs OPERATING, STATUTORY AND DISCRETIONARY RESERVES PAGE 2 OF 6
189 Solid Waste is a function whose primary revenue source is Tipping Fee revenue based on a unit rate per cubic tonne of waste disposed of within the region. The unit rate is set to cover annual expenditures and is based on an estimated volume of overall regional waste tonnage. The actual level of waste tonnage, however, may vary from expectation due to many factors including level of construction and demolition, effectiveness of waste diversion activities and waste migration. While some expenditures in Solid Waste are somewhat variable with waste volumes, many are fixed. This along with the potential volatility in waste volumes leads to Solid Waste having a higher relative level of inherent risk associated with their business activities. c) Greater Vancouver Sewerage and Drainage District (GVS&DD) Liquid Waste The required Operating Reserve for the Liquid Waste function is equal to 10% of net operating expenditures representing approximately one month of operating costs. Liquid Waste is a function whose primary revenue source is an annual sewer levy collected from member jurisdictions and as a result are low risk in terms of collection. While the majority of revenues in Liquid waste carry a high level of certainty, the nature of the business of collecting and treating sewage has operating risks including weather related overflows, impacts from power interruption and infrastructure failure. As a result, Liquid Waste has a moderate relative level of inherent risk associated with their business activities. d) Metro Vancouver Housing Corporation (MVHC) The required Operating Reserve for the Housing Corporation function is equal to 10% of net operating expenditures representing approximately one month of operating costs. The MVHC is reliant on tenant rents to support the annual expenditures to provide affordable housing. The level of rental revenue has some inherent risk of volatility due to factors including vacancy rates, tenant turnover and rental losses caused by required repairs and maintenance activities. The nature of the housing complexes being of wood construction, include a level of risk of unforeseen significant maintenance requirements. As a result, the MVHC has a moderate relative level of inherent risk associated with their business activities. e) Metro Vancouver Regional District (MVRD) The required Operating Reserve for each MVRD Statutory function is equal to 5% of net operating expenditures representing approximately one half of one month of operating costs. The statutory functions of the MVRD are reliant on tax requisition collected from member jurisdictions and therefore, have low risk in terms of revenue collection. In addition, the MVRD statutory function s operating expenditures are relatively consistent annually and quite predictable. As a result, the MVRD statutory functions have a low relative level of inherent risk associated with their business activities OPERATING, STATUTORY AND DISCRETIONARY RESERVES PAGE 3 OF 6
190 SUMMARY OF OPERATING RESERVE MINIMUMS Legal Entity/Statutory Function Operating Reserve Amount Greater Vancouver Water District 15% of prior year s net operating expenditures (approximately 2 months of operating costs) Greater Vancouver Sewerage and Drainage District Solid Waste Greater Vancouver Sewerage and Drainage District Liquid Waste Metro Vancouver Housing Corporation 15% of prior year s net operating expenditures (approximately 2 months of operating costs) Metro Vancouver Regional District Affordable Housing Air Quality E911 Emergency Telephone Service Electoral Area Service General Government Labour Relations Regional Emergency Management Regional Global Positioning System Regional Parks Regional Planning Sasamat Fire Protection Service 5% of prior year s net operating expenditures (approximately 0.5 month of operating costs) 10% of prior year s net operating expenditures (approximately 1 month of operating costs) 10% of prior year s net operating expenditures (approximately 1 month of operating costs) 2. STATUTORY RESERVES Statutory Reserves are established where reserves are required within a legal framework which governs their composition and application. Statutory Reserves are reserves set aside for a legal entity and statutory function for a specific purpose in accordance with the applicable terms and conditions within the establishing legal framework as follows: Legal statute Board approved bylaw Governing agreement with another level of government or entity Examples of Statutory Reserves include Liquid Waste Development Cost Charges, Cultural Grants and Park Land Acquisition. Contributions to Reserve. Contributions to Statutory Reserves are made through annual budget contributions and the appropriation of the annual surplus generated from operations in accordance with legal statute, Board approved bylaw, or governing agreement OPERATING, STATUTORY AND DISCRETIONARY RESERVES PAGE 4 OF 6
191 Usage of Reserves. The usage of Statutory Reserve balances will only be authorized for the purpose designated by the Statutory Reserve and must be withdrawn in accordance with legal statute, Board approved bylaw, or governing agreement. 3. DISCRETIONARY RESERVES Discretionary Reserves are established by the Board for legal entities and statutory functions as an appropriation of annual surplus to meet a known or anticipated future financial obligation. Contributions to Reserve. Contributions to Discretionary Reserves are made through the appropriation of the annual surplus generated from operations for a known or anticipated future financial obligation, or for general future usage in accordance with the priority sequence as outlined under Appropriation of Annual Surplus. Usage of Reserves. The usage of Discretionary Reserve balances will fund expenditures as an additional annual revenue source to support Metro Vancouver s goals and priorities in reducing the need for revenue from rates, levies and tax requisitions. The usage of Discretionary Reserves will be included, where applicable, within the five-year financial plan. 4. APPROPRIATION OF ANNUAL SURPLUS After ensuring that all Operating Reserves meet the minimum balances as established under this Policy and that all requirements for Statutory Reserves and Discretionary Reserves are met, any annual surplus remaining will be utilized in accordance with the following priority sequence: 5. Fund capital expenditures or pay down existing debt. This is consistent with debt avoidance and the mitigation of future financial obligations 6. Fund one-time expenditures. This includes but is not limited to funding equipment purchases and consulting initiatives and projects. 7. Rate stabilization for a legal entity or statutory function. This involves smoothing out utility rates, levies or tax requisitions resulting from operating budget expenditures. Usage of reserves for rate stabilization is only used in circumstances where priorities 1) and 2) are not applicable, or have been met. This application is discretionary and may not be applicable. If not applicable, then move to priority Maintain as a Statutory or Discretionary Reserve. This can represent an addition to an existing Statutory or Discretionary Reserve or the establishment of a new Discretionary Reserve based on new information regarding a future financial obligation. Management of Reserves When the Board has approved the use of reserves to fund expenditures, the funding must be spent for the intended purpose within the year of approval, or the following budget year. Although reserves are to only be used for their intended purpose, there may be instances when shortterm internal borrowing from reserves is financially beneficial or required. Internal borrowing is permitted to temporarily finance funding requirements to avoid external temporary borrowing or to fund emergencies as required, in accordance with the applicable legislation. If money from one OPERATING, STATUTORY AND DISCRETIONARY RESERVES PAGE 5 OF 6
192 reserve is used for temporary financing purposes, there must be repayment of the amount used to the reserve, plus interest within five years of borrowing. Internal borrowing and transferring of funds from Reserves must be approved by the Board OPERATING, STATUTORY AND DISCRETIONARY RESERVES PAGE 6 OF 6
193 ATTACHMENT PROJECTED RESERVE BALANCES OPERATING RESERVES WATER LIQUID WASTE SOLID WASTE MVHC AFFORDABLE HOUSING AIR QUALITY E911 ELECTORAL AREA A GENERAL GOVERNMENT LABOUR RELATIONS REGIONAL EMERGENCY MANAGEMENT GPS REGIONAL PARKS REGIONAL PLANNING SASAMAT FIRE PROTECTION SERVICES WEST NILE VIRUS TOTAL OPERATING DISCRETIONARY RESERVES WATER General Debt Reserve Fund Lower Seymour Conservation Reserve LIQUID WASTE Biosolids Inventory Reserve General Debt Reserve Fund Lions Gate Contingency SOLID WASTE Solid Waste General Reserve Landfill Post Closure Reserve MVHC Capital Replacement Reserve Capital Development Reserve AIR QUALITY Air Quality General Reserve E911 E911 General Reserve ELECTORAL AREA A Electoral Area General Reserve GENERAL GOVERNMENT General Government General Reserve LABOUR RELATIONS Labour Relations General Reserve REGIONAL EMERGENCY MANAGEMENT (REM) REM General Reserve REGIONAL PARKS Regional Parks Legacy Fund REGIONAL PLANNING Regional Planning General Reserve CENTRALIZED SUPPORT FLEET VEHICLE RESERVE TOTAL DESIGNATED STATUTORY RESERVES WATER Laboratory Equipment Reserve Sustainability Innovation Fund LIQUID WASTE DCC Reserve Fund Laboratory Equipment Reserve Sustainability Innovation Fund AFFORDABLE HOUSING Affordable Housing Reserve ELECTORAL AREA A Community Works Reserve GENERAL GOVERNMENT Sustainability Innovation Fund Cultural Grants Reserve Fund GPS GPS Reserve REGIONAL PARKS Regional Parks Capital Reserve Parkland Acquisition Reserve Fund Delta Airpark Reserve SASAMAT FIRE PROTECTION SERVICES Capital Reserve Communications Reserve Fund Emergency Equipment Reserve Fund SELF-INSURANCE FUND TOTAL STATUTORY GRAND TOTAL 2017 RESERVE BALANCE 15,982,208 19,973,308 8,958,284 1,834, , ,889 1,986,007 1,676, ,781 1,374, , ,369 54,229, SURPLUS INTEREST 17,212,251 8,741,782 10,824,768 3,854, , , ,587 1,173, , ,621 1,054, ,177 34,651 44,208,110 FUND CAPITAL TRANSFER TO/ 2018 NET BUDGETED DIRECTLY FROM RESERVE CONTRIBUTIONS 434, , , ,785 5,763 9,170 13,140 1,912 63,185 38,190 18,088 48,586 15, ,767 1,478,362 (17,609,317) (13,822,714) (6,838,401) (38,270,432) (3,257,005) (256,171) 44,920 (460,764) (76,662) (2,930,981) (1,812,492) 12,350 (903,954) (1,062,911) (645,556) (22,687) (11,371,914) 2018 PROJECTED RESERVE BALANCE - 16,019,534 15,350,121 13,195,982 2,546,014 37, , ,394 20, , ,176 12,350 18,536 1,414, ,857 12, ,136 50,273,336 7,747, ,221-51,648 3,584 (7,798,806) ,805 16,288,678 57,227,817 1,378, , ,519 27,577 (57,609,336) ,614,452 1,406,451 37,946,235 10,430, , , ,705,160 10,638,679 13,180,531 16,313, , ,269-3,556,291-71,126 - (44,920) - 3,582, , ,764 1,545,827-30,917-76,662-1,653,406 1,094,951-21,899-2,930,981-4,047, ,812,492-1,812, ,040-5,801 - (12,350) - 283,491 2,611,206-52, ,663,430 1,334,596 20,427,696 5,111, ,664,165-26, , ,230 3,066, ,048 11,235, ,702, ,739 16,236,138-11, ,716 5,754,047 9, , (65,408,142) 3,257, ,556 9,126,190 1,719,533-18,420,680 16,639, ,982 2,518,515 2,006,844 20,836,250 6,012, ,967, , , ,429 12,183, ,788 1,127, ,456, ,842 17,687,861 1,000,000 1,256, ,490-8, , ,474 11,291,125 2,287, ,823 45, ,000-11,863,948 2,333,038 30, ,954 8,508,725 14,024,056 56, ,734 54,291 25,245 2,580, ,069, ,962,958 44,208, , ,481 1,123 12,515 1, ,608 7,121,392 11,666, ,954-1,062,911 - (4,143,000) 3,570,000 23,000 5,598,811 17,874,537 80,290 22,687 2,245,724-52,100 2,986,722 5,505, ,036 55,377 25,750 2,632, ,423, ,664,436 (103,678,573) ,171
194 5.7 To: From: Roy Moulder, Division Manager, Purchasing and Risk Management, Financial Services Department Date: March 20, 2018 Subject: Procurement Process and Reporting Meeting Date: April 11, 2018 RECOMMENDATION That the receive for information the report dated March 20, 2018, titled Procurement Process and Reporting. PURPOSE To provide the with information on procurement processes and the reporting of procurement activities carried out by Metro Vancouver staff. BACKGROUND At the February 1, 2018 meeting of the, after consideration of the Tender/Contract Award Information September to November 2017 Report, the committee passed the following resolution: That staff report back to the next meeting on the procurement process, highlighting evaluation criteria and staff considerations. This report provides the Committee with the requested information. PROCUREMENT PROCESS Policy Procurement activities at Metro Vancouver are conducted in accordance with the Board s Procurement and Real Property Contracting Authority Policy ( Policy ) and are consistent with the requirements outlined in the Laws of Competitive Bidding and the various legislated trade agreements. Metro Vancouver s primary goal in the procurement process is to attain best value, using processes that are competitive, open and transparent, non-discriminatory and support Metro Vancouver s commitment to sustainability. The type of competition required for Metro Vancouver procurement is based on the dollar value and the nature of the specific procurement transaction. Staff conduct procurement activities in line with the Policy, the Employee Code of Ethics policy and the Procurement and Contracting Employee Procedures manual ( Manual ). The Employee Code of Ethics policy addresses the need for staff to avoid both conflict of interest and the acceptance of gifts from individuals or firms which are interested in doing business with Metro Vancouver.
195 Procurement Process and Reporting Regular Meeting Date: April 11, 2018 Page 2 of 3 The Manual lays out the process by which staff will execute the requirements of the Policy. The Manual provides instruction on topics such as general procurement methods, the handling of unsolicited proposals, application of First Nations engagement in procurement, duties of fairness in the evaluation process, debriefing of unsuccessful proponents and reporting to the Performance and Audit Committee. The Competition Process All procurement activities in excess of 5,000 commence with the creation of an electronic purchase requisition. Prior to any further procurement efforts, the requisition is reviewed to ensure that there is appropriate authorization to initiate the procurement and that sufficient budget is available to complete the request. The requisition is then passed to Purchasing staff to manage the procurement process. The Purchasing staff s role in the procurement process is to: 1. Collaborate with the client to select the most advantageous procurement instrument, 2. Administer the competitive selection process, 3. Assemble the competition documents for publishing on Metro Vancouver and BC Bid websites. The client s input in the creation of these documents is key as they are the subject matter experts in the application of the good or service. 4. Become the single point of contact during the competition to ensure that dissemination of information related to the competition is accurate and provided to all interested parties, 5. Facilitate the evaluation process to ensure fairness in the process, and 6. Act as the single point of contact relating to award notification, issuing regret letters and scheduling debriefs when requested by the unsuccessful competitors. Staff have a variety of procurement instruments at their disposal in order to run open and transparent competitions. The two (2) most common instruments are: 1. Invitation to Tender ( ITT ): ideally suited to a formal competition where there are clearly defined specifications/requirements. Evaluation is based solely on price. Lowest compliant bid wins. 2. Request for Proposal ( RFP ): ideally suited to a formal competition where there are other factors than merely price. Award is made to the proponent that best meets the stated outcomes based on the disclosed evaluation criteria. Integrity in the process is bolstered through a strong evaluation process. During the competitive selection process, Purchasing staff work with clients to select necessary evaluation criteria to ensure best value. The process includes both business and Purchasing representation with business providing the technical expertise and Purchasing staff ensuring that the process is consistent with Metro Vancouver Policies and any legislated requirements. In accordance to policy, the process also receives oversight from senior management for procurement activities in excess of 500,000. In order to ensure an unbiased review of the proposals, evaluations are conducted by at least three (3) departmental representatives along with a representative from Purchasing to review the financial component and also to facilitate the evaluation review and consensus scoring.
196 Procurement Process and Reporting Regular Meeting Date: April 11, 2018 Page 3 of 3 Awarding of a Contract A competition is recommended for award based on compliance and low bid for ITT s and based on the highest scoring proposal as determined by an evaluation team through review of the compliant RFP s. An award recommendation Memorandum is prepared for sign-off by various levels of internal department management based on the value of the award. The recommendation is reviewed by appropriate contracting authority within Purchasing and escalated to the Chief Financial Officer (CFO), Chief Administrative Officer (CAO) and Board for further approval according to policy approval thresholds. In the case of awards related to RFP s, where recommendations can be made to the proposal that is highest ranked but not lowest fee, and the value of the award is greater than 500,000 all award recommendations require the CAO s approval prior to award. There are various levels of approval throughout the award process whereby staff are questioned as to the veracity of the recommendation to ensure all considerations have been exhausted before a contract is awarded. Reporting to the As per policy, the Finance Department reports to the, on a quarterly basis, all awards and contract amendments that exceed 500,000. This reporting identifies the successful vendor, the award amount and pricing from all compliant bidders/proponents. Each award and amendment appendix provides a brief description as to the reason for the award selection or contract amendment. Going forward, a greater explanation will be provide on awards where the low fee is not selected and the awarded value is 25% greater and 250,000 greater than the lowest compliant fee. ALTERNATIVES This is an information report. No alternatives are presented. FINANCIAL IMPLICATIONS As this report is for information purposes only, there are no financial implications. SUMMARY / CONCLUSION Procurement activities at Metro Vancouver are conducted in accordance with the Board s Procurement and Real Property Contracting Authority Policy ( Policy ) and are consistent with the requirements outlined in the Laws of Competitive Bidding and the various legislated trade agreements. Metro Vancouver maintains a procurement process with various points of oversight throughout that ensure each award has been conducted with the intent of achieving best value for the organization. While achieving best value, the process also ensures that the competition meets the organization s other procurement principles to seek competition in the marketplace and remain open, transparent, and non-discriminatory with those that compete for Metro Vancouver opportunities
197 5.8 To: From: Roy Moulder, Division Manager, Purchasing and Risk Management, Financial Services Department Date: March 26, 2018 Subject: Tender/Contract Award Information December 2017 to February 2018 Meeting Date: April 11, 2018 RECOMMENDATION That the receive for information the report dated March 26, 2018, titled Tender/Contract Award Information December 2017 to February PURPOSE To provide the information with regards to contracts, handled through the Purchasing and Risk Management Division, with a total anticipated value at or in excess of 500,000 (exclusive of taxes). BACKGROUND The Purchasing and Risk Management Division of Metro Vancouver awards contracts for goods, services and construction in accordance with the Officers and Delegation Bylaws 1208, 284 and (Bylaws), and the Procurement and Real Property Contracting Authority Policy (Policy) adopted by the Board of Directors on July 11, 2014, effective September 1, These Bylaws and Policy outline thresholds for competitive bidding and contracting authorities. Contracts in excess of 500,000 will be reported to the to align with the thresholds outlined in the Policy. Capital projects may result in the awarding of one or more contracts to complete the project. All contracts are always within budget authority. NEW CONTRACTS - 500,000 to 5,000,000 The following contracts were awarded during the months of December 2017 to February 2018 (Details attached as APPENDIX A): (Exclusive of taxes) 1. Envirowest Consultants Inc. RFQ No Sewer Overflow Receiving Environment Water Sampling 1,000,000 GVS&DD 2. Morrison Hershfield Limited RFQ No Consulting Engineering Services for the Design and Construction Management of the Surrey Small Vehicle Drop Off Facility 2,469,010 GVS&DD
198 Tender/Contract Award Information December 2017 to February 2018 Regular Meeting Date: April 11, 2018 Page 2 of 6 3. Halton Recycling Ltd. dba Emterra Environmental RFP No Waste, Organics, and Recycling Collection Services 4,100,204 MVHC 4. Miller Pipeline, LLC RFP No Design and Installation Services for Internal Rubber Joint Seals on Seymour Main No ,025 GVWD 5. Hatch Corporation RFP No Consulting Engineering Services Seismic Assessment of the Cleveland Dam 598,668 GVWD 6. PW Trenchless Construction Inc. RFP No Construction of Douglas Road Main No. 1 Sliplining Project 699,743 GVWD 7. SGS AXYS Analytical Services Ltd. RFP No Chemical Analytical Services for Municipal Wastewater and Solids 560,000 GVS&DD 8. Akash Industries RFP No Transportation of Source Separated Organics 936,000 GVS&DD 9. Jacob Bros. Construction Inc. Tender No Civil Construction and Installation of Solid Waste System Weigh Scale Upgrades 1,106,400 GVS&DD 10. Metro Concrete Restoration Ltd. Tender No Construction of Rehabilitation of Cleveland Dam Spillway Training Walls 1,990,179 GVWD 11. Schneider Electric Canada RFP No Supply and Delivery of Power Quality Monitoring (PQM) Meters and the PQM System - Wastewater Treatment Plants 1,351,062 GVS&DD 12. WSP Canada Inc. RFP No Annacis Island Wastewater Treatment Plant Stage 5 Expansion Construction Speciality Inspection Services 1,702,062 GVS&DD
199 Tender/Contract Award Information December 2017 to February 2018 Regular Meeting Date: April 11, 2018 Page 3 of Brenntag Canada Inc. RFP No Supply and Delivery of Sodium Bisulphite Solution (38% SBS) 2,203,033 GVS&DD 14. Opus International Consultants (Canada) Limited RFP No Consulting Engineering Services for Newton Pump Station 3,999,850 GVWD 15. A. Lanfranco and Associates Inc. RFP No Manual Stack Testing Service - Waste-to-Energy Facility 862,912 GVS&DD 16. Ocean Pipe, a Div. of Lehigh Hanson Materials Ltd. Tender No Pipe Supply and Delivery for Gilbert Trunk Sewer No. 2 Gilbert Road North Section 2,480,197 GVS&DD 17. Surespan Construction Ltd. Tender No Construction Services for Fisherman s Trail and Riverside Drive Bridges 2,256,614 GVWD 18. Associated Engineering (B.C.) Ltd. RFP No Detailed Design, Construction and Post-Construction Engineering Services for Sunnyside Reservoir Unit No. 1 Upgrades 528,295 GVWD NEW CONTRACTS BOARD APPROVED The following contracts were authorized for execution by the GVS&DD or the GVWD or the MVRD Boards of Directors or MVHC during the months of December 2017 to February 2018 (as such no further information is included in this report): (Exclusive of taxes) 1. Waste Management of Canada Corporation RFP No Contingency Disposal Services Standing Offer Agreements 25,000,000 GVS&DD 2. Republic Services of British Columbia, Inc. RFP No Contingency Disposal Services Standing Offer Agreements 21,000,000 GVS&DD
200 Tender/Contract Award Information December 2017 to February 2018 Regular Meeting Date: April 11, 2018 Page 4 of 6 3. Turner Construction Company Tender No Construction of Heather Place 22,028,225 MVHC NEW STANDING OFFER AGREEMENTS There were no Standing Offer Agreements issued during the months of December 2017 to February APPENDIX B: AMENDED CONTRACTS The following not previously reported contract was amended during the months of December 2017 to February 2018 (Details attached as APPENDIX C): Value of Total Amended Amendment(s) Value of Contract 1. AMEC Foster Wheeler RFP No South Delta Main No. 1 Replacement Geotechnical, Environmental & Archaeological Consulting Services 256, ,704 The following previously reported contracts were amended during the months of December 2017 to February 2018 (Details attached as APPENDIX D): Value of Amendment(s) Total Amended Value of Contract 1. Waste Management Inc. RFP No Contingency Disposal of Municipal Solid Waste (Short-Term) 2,525,000 4,950, Republic Services RFP No Contingency Disposal of Municipal Solid Waste (Short-Term) 2,250,000 4,050, Tetra Tech EBA Inc. RFP No Detailed Design of E2 Shaft Replacement/Remediation at Cleveland Dam East Abutment ,492, CH2M Hill Canada Limited. RFP No Consulting Engineering Services for the South Surrey Interceptor Delta Section Odour Control Facility 935,583 1,149,974
201 Tender/Contract Award Information December 2017 to February 2018 Regular Meeting Date: April 11, 2018 Page 5 of 6 5. Morrison Hershfield Ltd. RFP No Consulting Engineering Services for the Design and Construction Administration of the Coquitlam Transfer Station 3,550,687 5,063, AECOM Canada Ltd. RFP No Consulting Engineering Services for the Primary Air Management Facility - Highbury Interceptor 711,708 1,496, OPUS DaytonKnight Ltd. RFP No Coquitlam Sodium Hypochlorite Conversion Project Engineering Services 559,207 2,893,165 The following Contracts originally approved by Board (Details attached as APPENDIX D): Value of Amendment(s) Total Amended Value of Contract 8. Maple Reinders Inc. ITT No Coquitlam Water Treatment Plant Improvement Project 547,267 6,366, JJM Construction Ltd. ITT No South Delta Main No. 1 Replacement - Phase 2-28th Avenue to 12th Avenue 1,058,979 8,883, Maple Reinders Inc. RFP No Iona Island Wastewater Treatment Plant Solids Handling Package 3 - Digester Mixing Project 1,337,288 12,624, CH2M Hill Canada Limited RFP No Consulting Engineering Services for Northwest Langley Wastewater Treatment Plant Expansion, Phase 1 - Project Definition and Staging 1,058,409 7,733,939 COMPETITIVE SELECTION PACKAGES - anticipated to be greater than 500,000 to 5,000,000 (Issued but not awarded) (Details attached as APPENDIX E) ALTERNATIVES This is an information report. No alternatives are presented.
202 Tender/Contract Award Information December 2017 to February 2018 Regular Meeting Date: April 11, 2018 Page 6 of 6 FINANCIAL IMPLICATIONS The contracts presented herein are consistent within Budget Authority. SUMMARY / CONCLUSION The contracts presented herein were awarded in accordance with the Officers and Delegation Bylaws 1208, 284 and (Bylaws) and the Procurement and Real Property Contracting Authority Policy (Policy) and comply with competitive bidding laws and applicable legislation. Further, the competitive selection packages were carefully crafted by teams of subject matter experts resulting in the award of contracts that are fiscally responsible, and balance risk, economic, ethical and legal obligations. Attachments: APPENDIX A: Information with regard to newly awarded contracts - 500,000 to 5,000,000 APPENDIX B: Information with regard to Standing Offer Agreements APPENDIX C: Contracts amended to a value of more than 500,000 but not previously reported to the APPENDIX D: Previously reported contracts that have been amended APPENDIX E: Competitive Selection Packages Anticipated to be greater than 500,000 (Issued but not awarded)
203 Appendix A No. 1 AWARD OF CONTRACT RFQ NO A contract was awarded, December 12, 2017 for the Greater Vancouver Sewerage and Drainage District. To: Envirowest Consultants Inc. in the anticipated amount of up to 1,000,000 (exclusive of taxes) for Sewer Overflow Receiving Environment Water Sampling over a five (5) year period. The initial award is limited to 2018 services only at a cost of 200,000, with possible one (1) year extensions to a maximum of five (5) years. The contract price is within the overall budget. 2. Proponents were invited by Metro Vancouver (MV) & BC Bid web sites and private invitation on March 6, 2017 Closing Date: April 4, Response received (exclusive of taxes): Envirowest Consultants Inc ,000 Proposals reviewed by: Contractual: Purchasing and Risk Management Division Staff Technical: Liquid Waste Department Staff RFQ No closed with only one submission so staff moved into direct negotiation with Envirowest Consultants Inc.
204 Appendix A No. 2 AWARD OF CONTRACT RFQ NO A contract was awarded, December 19, 2017 for the Greater Vancouver Sewerage and Drainage District. To: Morrison Hershfield Limited in the anticipated amount of up to 2,469,010 (exclusive of taxes) for Consulting Engineering Services for the Design and Construction Management of the Surrey Small Vehicle Drop Off Facility over a two (2) year period. The initial award is limited to Phase A Site Evaluation and Concept Design and Phase B Preliminary Design at a cost of 847,057 and subsequent phases of the work will be awarded subject to mutual agreement. The contract price is within the overall budget. 2. Respondents were invited by Metro Vancouver (MV) & BC Bid web sites and private invitation on March 28, Four (4) responses were received and after evaluations the highest ranked responded was invited to submit a proposal. Closing Date: April 18, Proposal received (exclusive of taxes): Morrison Hershfield Limited ,469,010 Proposal reviewed by: Contractual: Purchasing and Risk Management Division Staff Technical: Solid Waste Services Department Staff Five (5) staff from Solid Waste Services evaluated the submissions to the Request for Qualifications. Morrison Hershfield Limited scored considerably higher than the other respondents in both firm and staff experience in similar projects. As such, it was decided to directly negotiate with Morrison Hershfield Limited.
205 Appendix A No. 3 AWARD OF CONTRACT RFP NO A contract was awarded, December 19, 2017 for the Metro Vancouver Housing Corporation. To: Halton Recycling Ltd. dba Emterra Environmental in the anticipated amount of up to 4,100,204 (exclusive of taxes) for Waste, Organics, and Recycling Collection Services at 46 Metro Vancouver Housing Corporation multifamily housing complexes, and in addition recycling and organics collection services for select sites for three (3) years with an option to extend for an additional two (2), two (2) year extension options subject to mutual written agreement. The initial award is for a three (3) year period based on fixed unit rates for the initial term. The contract price is within the overall budget. 2. Proponents were invited by Metro Vancouver (MV) & BC Bid web sites and private invitation on October 26, Closing Date: November 16, Proposal received (exclusive of taxes): Halton Recycling Ltd. Dba Emterra Enviornmental Proposal reviewed by: Contractual: Purchasing and Risk Management Division Staff Technical: Metro Vancouver Housing Department Staff Award was made to the sole compliant bidder. 4,100,204
206 Appendix A No. 4 AWARD OF CONTRACT RFP NO A contract was awarded, December 5, 2017 for the Greater Vancouver Water District. To: Miller Pipeline, LLC in the anticipated amount of up to 746,025 (exclusive of taxes) for Design and Installation Services for Internal Rubber Joint Seals on Seymour Main No. 2. The initial award is limited to Phase A internal rubber joint seal design and pipe segment inspection at a cost of 170,775 and subsequent phases of the work will be awarded subject to mutual agreement. The contract price is within the overall budget. 2. Proponents were invited by Metro Vancouver (MV) & BC Bid web sites and private invitation on August 11, 2017 Closing Date: September 21, Proposals received (exclusive of taxes): Miller Pipeline, LLC Jewel Holdings Ltd. Michels Canada Co ,025 1,263,006 4,275,000 Proposals reviewed by: Contractual: Purchasing and Risk Management Division Staff Technical: Water Services Department Staff Award was made to the highest ranked proponent and lowest cost based on the evaluation criteria established in the RFP.
207 Appendix A No. 5 AWARD OF CONTRACT RFP NO A contract was awarded, January 17, 2018 for the Greater Vancouver Water District. To: Hatch Corporation In the anticipated amount of up to 598,668 (exclusive of taxes) for Consulting Engineering Services Seismic Assessment of the Cleveland Dam. The anticipated amount is a combination of the successful consultants proposed price of 158,893 and an additional 439,775 to account for issues identified during negotiations as allowed for in the RFP. The contract price is within the overall budget. 2. Respondents were invited by Metro Vancouver (MV) & BC Bid web sites and private invitation on March 7, Closing Date: March 30, Proposal received (exclusive of taxes): Hatch Corporation SNC Lavalin Klohn Crippen Berger , , ,143 Proposal reviewed by: Contractual: Purchasing and Risk Management Division Staff Technical: Water Services Department Staff Award was made to the highest ranked proponent and lowest cost based on the evaluation criteria established in the RFP. All three (3) proponents acknowledged that the prescribed hours in the RFP were for evaluation purposes only and would be insufficient to complete the services. Therefore, it was anticipated that the 2nd and 3rd ranked proponents would also have increased their fee by a similar amount during any negotiation.
208 Appendix A No. 6 AWARD OF CONTRACT RFP NO A contract was awarded, January 5, 2018 for the Greater Vancouver Water District. To: PW Trenchless Construction Inc. in the anticipated amount of up to 699,743 (exclusive of taxes) for the Construction of Douglas Road Main No. 1 Sliplining Project. The contract price is within the overall budget. 2. Proponents were invited by Metro Vancouver (MV) & BC Bid web sites and private invitation on November 24, Closing Date: December 12, Proposals received (exclusive of taxes): PW Trenchless Construction Inc. Merletti Construction (1999) Ltd , ,700 Proposals reviewed by: Contractual: Purchasing and Risk Management Division Staff Technical: Water Services Department Staff Award was made to the highest ranked proponent and lowest cost based on the evaluation criteria established in the RFP.
209 Appendix A AWARD OF CONTRACT No. 7 RFP NO A contract was awarded, August 31, 2017 for the Greater Vancouver Sewerage and Drainage District. To: SGS AXYS Analytical Services Ltd. in the anticipated amount of up to 560,000 (exclusive of taxes) for Chemical Analytical Services for Municipal Wastewater and Solids over a two (2) year total period. The initial award is limited to a cost of 280,000 for the first year and subsequent extension of the program for an additional year will be awarded based on approval of the Corporation s annual budget and upon mutual agreement. The contract price is within the overall budget. 2. Proponents were invited by Metro Vancouver (MV) & BC Bid web sites and private invitation on July 6th, Closing Date: August 1st, Proposals received*: SGS AXYS Analytical Services Ltd. ALS Environmental CARO Analytical Services AGAT Laboratories 4. Proposals reviewed by: Contractual: Purchasing and Risk Management Division Staff Technical: Liquid Waste Services Department Staff 5. As all Proponents did not provide for all analyte classes, a report on comparable prices did not prove meaningful. 6. *Award was made to SGS AXYS Analytical Services Ltd. in the anticipated amount of up to 560,000 over a two (2) year period and to ALS Environmental in the anticipated amount of up to 60,000 over a two (2) year period.
210 Appendix A No. 8 AWARD OF CONTRACT RFP NO A contract was awarded, January 17, 2018 for the Greater Vancouver Sewerage and Drainage District. To: Akash Industries A unit price contract for the Transportation of Source Separated Organics, in the anticipated amount of up to 936,000 (exclusive of taxes) over a two (2) year period. The initial award is for one (1) year at an anticipated cost of 418,000 and subsequent extension option of the work for an additional year will be awarded subject to mutual agreement. The contract price is within the overall budget. 2. Proponents were invited by Metro Vancouver (MV) & BC Bid web sites and private invitation on November 16, Closing Date: December 5, Proposals received (exclusive of taxes): Akash Industries Super Fast Trucking Ltd. Arrow Transportation Systems Inc. Ground X Site Services Ltd , , , ,050 Proposals reviewed by: Contractual: Purchasing and Risk Management Division Staff Technical: Solid Waste Services Department Staff Award was made to the highest ranked proponent and lowest cost based on the evaluation criteria established in the RFP.
211 Appendix A No. 9 AWARD OF CONTRACT TENDER NO A contract was awarded, January 17, 2018 for the Greater Vancouver Sewerage and Drainage District. To: Jacob Bros. Construction Inc. in the amount of 1,106,400 (exclusive of taxes) for Civil Construction and Installation of Solid Waste System Weigh Scale Upgrades. The contract price is within the overall budget. 2. Tenders were invited by Metro Vancouver (MV) & BC Bid web sites and private invitation on November 24, Closing Date: December 21, Tender received (exclusive of taxes): Jacob Bros. Construction Inc Tender reviewed by: Contractual: Purchasing and Risk Management Division Staff Technical: Solid Waste Services Department Staff Award was made to the sole compliant bidder. 1,106,400
212 Appendix A No. 10 AWARD OF CONTRACT TENDER NO A contract was awarded, January 24, 2018 for the Greater Vancouver Water District. To: Metro Concrete Restoration Ltd. in the amount of 1,990,179 (exclusive of taxes) for the Construction of Rehabilitation of Cleveland Dam Spillway Training Walls. The contract price is within the overall budget. 2. Three (3) Respondents were shortlisted as a result of RFQ No (publicly advertised on Metro Vancouver & BC Bid web sites) and invited to bid on Tender No by private invitation on March 8, Closing Date: May 11, Tenders received (exclusive of taxes): Metro Concrete Restoration Ltd. Polycrete Restorations Ltd. Retro Specialty Contractors Tenders reviewed by: Contractual: Purchasing and Risk Management Division Staff Technical: Water Services Department Staff Award was made to the lowest compliant bidder. 1,990,179 2,423,990 3,233,020
213 Appendix A No. 11 AWARD OF CONTRACT RFP NO A contract was awarded, January 19, 2018 for the Greater Vancouver Sewerage and Drainage District. To: Schneider Electric Canada in the anticipated amount of up to 1,351,062 (exclusive of taxes) for the Supply and Delivery of Power Quality Monitoring (PQM) Meters and the PQM System Wastewater Treatment Plants. The anticipated amount is a combination of the successful consultants proposed price of 1,796,026 less 444,964 to account for issues identified during negotiations as allowed for in the RFP. The initial award is limited to Phase 1 Lulu Island Wastewater Treatment Plant and Iona Island Wastewater Treatment Plant at a cost of 764,791 and subsequent phases of the work will be awarded subject to future funding approval and mutual agreement. The contract price is within the overall budget. 2. Proponents were invited by Metro Vancouver (MV) & BC Bid web sites and private invitation on November 9, Closing Date: January 19, Proposals received (exclusive of taxes): Magna IV Engineering Westburne Electric SEL Schweitzer Laboratories Inc. Schneider Electric Canada Siemens Canada Limited ,223 1,207,909 1,790,938 1,796,026 2,550,672 Proposals reviewed by: Contractual: Purchasing and Risk Management Division Staff Technical: Liquid Waste Services Department Staff 5. Award was made to the highest ranked proponent based on the evaluation criteria established in the RFP. 6. Schneider Electric Canada were the highest ranked proponent due to being the only proposal which provided all the requested information. Their proposal indicated no technical exceptions, met the requirements of the technical specifications, and provided detailed and comprehensive information about their components and systems.
214 Appendix A No. 12 AWARD OF CONTRACT RFP NO A contract was awarded, February 1, 2018 for the Greater Vancouver Sewerage and Drainage District. To: WSP Canada Inc. in the anticipated amount of up to 1,702,062 (exclusive of taxes) for Annacis Island Wastewater Treatment Plant Stage 5 Expansion Construction Speciality Inspection Services over a three (3) year period. The anticipated amount is a combination of the sole consultants proposed price of 1,900,703 less 327,441, as a result of negotiations a number of inspection tests were reduced and the overall price lessened to 1,573,262 including an additional 128,800 to account for a provisional item which may be awarded at a future date. The contract price is within the overall budget. 2. Proponents were invited by Metro Vancouver (MV) & BC Bid web sites and private invitation on August 21, Closing Date: September 28, Proposal received (exclusive of taxes): WSP Canada Inc ,900,703 Proposal reviewed by: Contractual: Purchasing and Risk Management Division Staff Technical: Liquid Waste Services Department Staff Award was made to the sole responding Proponent deemed to provide comprehensive services and sound value.
215 Appendix A Page No. 13 AWARD OF CONTRACT RFP NO A contract was awarded, February 2, 2018 for the Greater Vancouver Sewerage and Drainage District. To: Brenntag Canada Inc. in the anticipated amount of up to 2,203,033 (exclusive of taxes) for the Supply and Delivery of Sodium Bisulphite Solution (38% SBS) over a five (5) year period. The initial award is for a four (4) year term at an anticipated cost of 1,706,233 with an option to extend the contact for one (1) additional year upon mutual agreement. The contract price is within the overall budget. 2. Proponents were invited by Metro Vancouver (MV) & BC Bid web sites and private invitation on July 28, Closing Date: August 29, Proposals received (exclusive of taxes): Brenntag Canada Inc. Univar Canada Ltd. Two Rivers Terminal, LLC ,706,233 2,470,084 2,783,340 Proposals reviewed by: Contractual: Purchasing and Risk Management Division Staff Technical: Liquid Waste Services Department Staff Award was made to the highest ranked proponent and lowest cost based on the evaluation criteria established in the RFP.
216 Appendix A No. 14 AWARD OF CONTRACT RFP NO A contract was awarded, February 16, 2018 for the Greater Vancouver Water District. To: Opus International Consultants (Canada) Limited in the anticipated amount of up to 3,999,850 (exclusive of taxes) for Consulting Engineering Services for Newton Pump Station. The anticipated amount is a combination of the successful consultants proposed price of 3,999,873 less 23 to account for reallocation of hours and resources between phases, identified during negotiations as allowed for in the RFP. The initial award is limited to Phase A Preliminary Design at a cost of 890,397 and subsequent phases of the work will be awarded subject to mutual agreement. The contract price is within the overall budget. 2. Four (4) firms were shortlisted as a result of RFQ No (publicly advertised on Metro Vancouver & BC Bid web sites) and invited to bid on RFP No on August 2, Closing Date: September 28, Proposals received (exclusive of taxes): Opus International Consultants (Canada) Limited Stantec Consulting Ltd ,999,873 4,114,095 Proposals reviewed by: Contractual: Purchasing and Risk Management Division Staff Technical: Water Services Department Staff Award was made to the highest ranked proponent and lowest cost based on the evaluation criteria established in the RFP.
217 Appendix A No. 15 AWARD OF CONTRACT RFP NO A contract was awarded, January 5, 2018 for the Greater Vancouver Sewerage and Drainage District. To: A. Lanfranco and Associates Inc. in the anticipated amount of up to 862,912 (exclusive of taxes) for Manual Stack Testing Service - Waste-to-Energy Facility over a five (5) year period. The initial award of an anticipated amount of 508,503 is for a three (3) year term with an option to extend for a further two (2) years subject to mutual agreement. The contract price is within the overall budget. 2. Proponents were invited by Metro Vancouver (MV) & BC Bid web sites and private invitation on September 18, 2017 Closing Date: October 10, Proposals received (exclusive of taxes): A. Lanfranco and Associates Inc. Ortech Consulting Inc Price based on up to 5 years of services 862,912 1,013,343 Proposals reviewed by: Contractual: Purchasing and Risk Management Division Staff Technical: Solid Waste Department Staff Award was made to the highest ranked proponent and lowest cost based on the evaluation criteria established in the RFP.
218 Appendix A No. 16 AWARD OF CONTRACT TENDER NO A contract was awarded, February 27, 2018 for the Greater Vancouver Sewerage and Drainage District. To: Ocean Pipe, a Div. of Lehigh Hanson Materials Ltd. in the amount of 2,480,197 (exclusive of taxes) for Pipe Supply and Delivery for Gilbert Trunk Sewer No. 2 - Gilbert Road North Section. The contract price is within the overall budget. 2. Tenders were invited by Metro Vancouver (MV) & BC Bid web sites and private invitation on January 16, Closing Date: February 6, Tenders received (exclusive of taxes): Ocean Pipe, a Div. of Lehigh Hanson Materials Ltd. Langley Concrete LP Tenders reviewed by: Contractual: Purchasing and Risk Management Division Staff Technical: Liquid Waste Services Department Staff Award was made to the lowest compliant bidder. 2,480,197 2,748,640
219 Appendix A No. 17 AWARD OF CONTRACT TENDER NO A contract was awarded, February 20, 2018 for the Greater Vancouver Water District To: Surespan Construction Ltd. in the amount of 2,256,614 (exclusive of taxes) for the Construction Services for Fisherman s Trail and Riverside Drive Bridges. The contract price is within the overall budget. 2. Tenders were invited by Metro Vancouver (MV) & BC Bid web sites and private invitation on December 11, 2017 Closing Date: January 30, Tenders received (exclusive of taxes): Surespan Construction Ltd. HRC Construction (2012) Inc. Neel-Co Builders (2014) Ltd. Kingston Construction Ltd. Online Constructors Ltd Tenders reviewed by: Contractual: Purchasing and Risk Management Division Staff Technical: Water Services Department Staff Award was made to the lowest compliant bidder. 2,256,614 2,313,527 2,398,200 2,594,745 2,719,200
220 Appendix A No. 18 AWARD OF CONTRACT RFP NO A contract was awarded, February 28, 2018 for the Greater Vancouver Water District. To: Associated Engineering (B.C.) Ltd. in the anticipated amount of up to 528,295 (exclusive of taxes) for Detailed Design, Construction and Post-Construction Engineering Services for Sunnyside Reservoir Unit No. 1 Upgrades Project. The anticipated amount is a combination of the successful consultants proposed price of 403,162 and an additional 125,133 to account for issues identified during negotiations as allowed for in the RFP. The initial award is limited to Phase A Detailed Design at a cost of 349,457 and subsequent Phase B of the work will be awarded subject to mutual agreement. The contract price is within the overall budget. 2. Two (2) firms were shortlisted as a result of RFQ No (publicly advertised on Metro Vancouver & BC Bid web sites) and invited to bid on RFP No on October 24, Closing Date: November 28, Proposals received (exclusive of taxes): Associated Engineering (B.C.) Ltd. Ausenco Engineering Canada Inc , ,180 Proposals reviewed by: Contractual: Purchasing and Risk Management Division Staff Technical: Water Services Department Staff Award was made to the highest ranked proponent and lowest cost based on the evaluation criteria established in the RFP. Both proponents indicated on their proposals that the prescribed hours in the RFP would be insufficient to complete the required services.
221 Appendix C No. 1 CONTRACTS AMENDED TO A VALUE OF MORE THAN 500,000 BUT NOT PREVIOUSLY REPORTED TO THE PERFORMANCE AND AUDIT COMMITTEE RFP No PURCHASE ORDER NO A AMEC Foster Wheeler South Delta Main No. 1 Replacement Geotechnical, Environmental & Archaeological Consulting Services for the Greater Vancouver Water District 1. Original Value of Contract: 261, Amendment Value: 256, Amendment Number: Total Amended Value of Contract: 517, Budget Status: This contract is funded within the capital budget for this project. 6. Reasons for Amendment to Contract: AMEC was awarded the Geotechnical, Environmental, and Archaeological Consulting Services for the design and construction phases for the South Delta Main No. 1 (SDM1) Replacement Project, Phases 1 & 2, under RFP No in May Additional funding is required for ongoing vibration monitoring and additional geotechnical and environmental services provided due to an extended construction schedule.
222 Appendix D No. 1 AMENDMENT TO A PREVIOUSLY REPORTED CONTRACT RFP No PURCHASE ORDER NO Contingency Disposal of Municipal Solid Waste (Short-Term) for the Greater Vancouver Sewerage & Drainage District 1. Name of Contractor: Waste Management Inc. 2. Date Contract Reported: October Original Anticipated Awarded Value of Contract (exclusive of taxes): 2,425,000* 4. Amendment Number: Value of Amendment (exclusive of taxes): 2,525, Amendment Type: Additional Services 7. Total Revised Anticipated Amended Value of Contract (exclusive of taxes): 4,950, Budget Status: This contract is funded within the capital budget for this program. 9. Amendment No. 01 is the result of an additional five and a half months to allow completion of the procurement process currently in progress for a three-year contingency disposal contract. *This amount was previously reported as 2,350,000 (exclusive of taxes). Due to forecasted unit rate expenditures the actual amount should have been 2,425,000.
223 Appendix D AMENDMENT TO A PREVIOUSLY REPORTED CONTRACT No. 2 RFP No PURCHASE ORDER NO Contingency Disposal of Municipal Solid Waste (Short-Term) for the Greater Vancouver Sewerage & Drainage District 1. Name of Contractor: Republic Services 2. Date Contract Reported: October Original Anticipated Awarded Value of Contract (exclusive of taxes): 1,800,000* 4. Amendment Number: Value of Amendment (exclusive of taxes): 2,250, Amendment Type: Additional Services 7. Total Revised Anticipated Amended Value of Contract (exclusive of taxes): 4,050, Budget Status: This contract is funded within the capital budget for this program. 9. Amendment No. 01 is the result of an additional five and a half months to allow completion of the procurement process currently in progress for a three-year contingency disposal contract. *This amount was previously reported as 2,550,000 (exclusive of taxes). Due to forecasted unit rate expenditures the actual amount should have been 1,800,000.
224 Appendix D AMENDMENT TO A PREVIOUSLY REPORTED CONTRACT Page No. 3 RFP No PURCHASE ORDER NO Detailed Design of E2 Shaft Replacement/Remediation at Cleveland Dam East Abutment for the Greater Vancouver Water District 1. Name of Contractor: Tetra Tech Canada Inc. 2. Date Contract Reported: November Original Anticipated Reported Value of Contract (exclusive of tax): 401, Amendment Number: Value of Amendment (exclusive of tax): 690, Amendment Type: Additional Services 7. Total Revised Anticipated Amended Value of Contract (exclusive of tax): 3,492,072 (includes value of previously reported Amendment No in the amount of 2,400,330) 8. Previous Amendment Explanation (Reported to October, 2017) Amendment Nos included: additional services in 2001 related to the E3 seep and scope changes to site investigation including field drilling services, pump well installation and testing and detailed design of permanent pumping wells (3); additional design and construction supervision services to implement the Technical Review Board s 3-phase solution to the E2 Drainage Shaft remediation as reported to the GVWD Board in September 2002; construction supervision of permanent pump wells (3); support for Capilano Main No. 4 design; rehabilitation of the E2 Drainage Shaft; detailed design related to Phase 3 of the work and engineering field services during the horizontal test drain/well construction program, and included costs for construction engineering services related to the Stage 2 production drains program. 9. Budget Status: This contract is funded within the capital budget for this program. 10. Reason for Amendment to Contract: Amendment No. 08 primarily covers additional costs for an extended monitoring period required for the 3 completed production horizontal drains until after full pool is reached in the Capilano Reservoir and related data review and reporting. This information will be used to determine if additional production drains are required.
225 Appendix D AMENDMENT TO A PREVIOUSLY REPORTED CONTRACT No. 4 RFP No PURCHASE ORDER NO Consulting Engineering Services for the South Surrey Interceptor Delta Section Odour Control Facility for the Greater Vancouver Sewerage & Drainage District 1. Name of Contractor: CH2M Hill Canada Limited. 2. Date Contract Reported: April Original Awarded Reported Value of Contract (exclusive of taxes): 214,391* 4. Amendment Number: Value of Current Amendment (exclusive of taxes): 935, Amendment Type: Phase Award 7. Total Revised Anticipated Amended Value of Contract (exclusive of taxes): 1,149, Budget Status: This contract is funded within the capital budget for this program. 9. Amendment No. 01 includes Phases C & D resulting from a need for a larger, more complex and sophisticated facility than envisioned during the original RFP. *The original anticipated reported value was 572,194, however, only Phases A & B were originally awarded for 214,391.
226 Appendix D AMENDMENT TO A PREVIOUSLY REPORTED CONTRACT No. 5 RFP No PURCHASE ORDER NO Consulting Engineering Services for the Design and Construction Administration of the Coquitlam Transfer Station for the Greater Vancouver Sewerage & Drainage District 1. Name of Contractor: Morrison Hershfield Ltd. 2. Date Contract Reported: July Original Anticipated Reported Value of Contract (exclusive of taxes): 1,513, Amendment Number: Value of Amendment (exclusive of taxes): 3,550, Amendment Type: Additional Services 7. Total Revised Anticipated Amended Value of Contract (exclusive of taxes): 5,063, Budget Status: This contract is funded within the capital budget for this program. 9. Amendment No. 01 is the result of awarding Phase C Detailed Design and Phase D Construction Administration and Post Construction Services.
227 Appendix D AMENDMENT TO A PREVIOUSLY REPORTED CONTRACT No. 6 RFP No PURCHASE ORDER NO Consulting Engineering Services for the Primary Air Management Facility - Highbury Interceptor for the Greater Vancouver Sewerage & Drainage District 1. Name of Contractor: AECOM Canada Ltd. 2. Date Contract Reported: July Original Anticipated Reported Value of Contract (exclusive of taxes): 118, Amendment Number: Value of Amendment (exclusive of taxes): 711, Amendment Type: Additional Services 7. Total Revised Anticipated Amended Value of Contract (exclusive of taxes): 1,496,908 (includes value of previously reported Amendments No. 1 and No ,568) 8. Previous Amendment Explanation (Reported to Finance Committee July 2014) Amendment No. 01 covered additional work including on site fan testing which was contemplated in the original RFP, and baseline noise measurements and odour testing which was optional work presented in the original proposal but not requested in the RFP. Amendment No. 02 covers Phase B Detailed Design Services. 9. Budget Status: This contract is funded within the capital budget for this program. 10. Reason for Amendment to Contract: Amendment No. 03 is the result of additional design work and Phase C Construction Services as contemplated in the original RFP.
228 Appendix D AMENDMENT TO A PREVIOUSLY REPORTED CONTRACT No. 7 RFP No PURCHASE ORDER NO Coquitlam Sodium Hypochlorite Conversion Project Engineering Services for the Greater Vancouver Water District 1. Name of Contractor: OPUS DaytonKnight Ltd. 2. Date Contract Reported: April Original Anticipated Reported Value of Contract (exclusive of taxes): 2,045, Actual Value of Contract (exclusive of taxes): 2,333, Amendment Number: Value of Amendment (exclusive of taxes): 559, Amendment Type: Additional Services 8. Total Revised Anticipated Amended Value of Contract (exclusive of taxes): 2,893, Budget Status: This contract is funded within the capital budget for this program. 10. Amendment No. 01 includes the cost of additional design and field services such as additional environmental investigations and monitoring due to unforeseen site conditions, and additional construction management services for an extended construction period due to operational concerns with the capacity of the temporary system during peak water demand season and construction delays due to changed conditions.
229 Appendix D AMENDMENT TO A PREVIOUSLY REPORTED CONTRACT No. 8 ITT No PURCHASE ORDER NO Coquitlam Water Treatment Plant Improvement Project for the Greater Vancouver Water District (GVWD) 1. Name of Contractor: Maple Reinders Inc. 2. Date Contract Reported: February Original Anticipated Reported Value of Contract (exclusive of taxes): 5,226, Amendment Number: Value of Amendment (exclusive of taxes): 547, Amendment Type: Additional Services 7. Total Revised Anticipated Amended Value of Contract (exclusive of taxes): 6,366,770 (includes value of previously reported Amendment No ,503) 8. Original Contract Approved by Board: January 29, Previous Amendment Explanation (Reported to July, 2017) Amendment No. 01 primarily includes design changes (i.e. electrical, seismic, utility conflicts), and additional Operations & Maintenance requirements. 10. Budget Status: This contract is funded within the capital budget for this program. 11. Amendment No. 02 includes additional cost associated with revised project scheduling to address Metro Vancouver operational concerns with the capacity of the temporary hypochlorite system during peak water demand season and delays due to changed conditions. The amendment also covers design changes to address piping and electrical conflicts and provide additional operational redundancies.
230 Appendix D AMENDMENT TO A PREVIOUSLY REPORTED CONTRACT No. 9 ITT No PURCHASE ORDER NO South Delta Main No. 1 Replacement - Phase 2-28th Avenue to 12th Avenue for the Greater Vancouver Water District 1. Name of Contractor: JJM Construction Ltd. 2. Date Contract Reported: October Original Anticipated Reported Value of Contract (exclusive of taxes): 7,825, Amendment Number: Value of Amendment (exclusive of taxes): 1,058, Amendment Type: Additional Services 7. Total Revised Anticipated Amended Value of Contract (exclusive of taxes): 8,883, Original Contract Approved by Board: September 23, Budget Status: This contract is funded within the capital budget for this program. 10. Amendment No. 01 covers the cost of additional traffic control measures requested by the City of Delta, to be undertaken by the contractor, along with additional construction effort related to redesign of the pipe alignment and tie-ins to the regional and municipal water distribution systems.
231 Appendix D AMENDMENT TO A PREVIOUSLY REPORTED CONTRACT No. 10 RFP No PURCHASE ORDER NO Iona Island Wastewater Treatment Plant Solids Handling Package 3 - Digester Mixing Project for the Greater Vancouver Sewerage & Drainage District 1. Name of Contractor: Maple Reinders Inc. 2. Date Contract Reported: November Original Anticipated Reported Value of Contract (exclusive of taxes): 9,915, Amendment Number: Value of Amendment (exclusive of taxes): 1,337, Amendment Type: Additional Services 7. Total Revised Anticipated Amended Value of Contract (exclusive of taxes): 12,624,975 (includes value of previously reported Amendment No. 1 1,372,387) 8. Original Contract Approved by Board: September 18, Previous Amendment Explanation (Reported to April 2017) Amendment No. 01 is the result of structural floor modifications required to Digester No. 2 in order to prevent uplift due to high groundwater table and structural damage during installation of the digester mixing systems and to allow safe entry to the digesters by plant staff to conduct future maintenance activities. 10. Budget Status: This contract is funded within the capital budget for this program. 11. Amendment No. 02 is the result of additional effort during the construction of Iona Island WWTP Solids Handling Upgrades Digester Mixing Upgrades. The construction cost has increased due to additional waterproofing, soffit repairs and roof modifications. This is required in order to ensure successful gas tightness testing of the Digester No. 2, as per BC Safety Authority requirements.
232 Appendix D AMENDMENT TO A PREVIOUSLY REPORTED CONTRACT No. 11 RFP No PURCHASE ORDER NO Consulting Engineering Services for Northwest Langley Wastewater Treatment Plant Expansion, Phase 1 - Project Definition and Staging for the Greater Vancouver Sewerage and Drainage District 1. Name of Contractor: CH2M Hill Canada Limited 2. Date Contract Reported: February Original Anticipated Reported Value of Contract (exclusive of taxes): 6,675, Amendment Number: Value of Amendment (exclusive of taxes): 1,058, Amendment Type: Additional Services 7. Total Revised Anticipated Amended Value of Contract (exclusive of taxes): 7,733, Original Contract Approved by Board: January 27, Budget Status: This contract is funded within the capital budget for this program. 10. Amendment No. 01 is the result of the culmination of change orders 1-12 for the Project Definition Report (PDR) portion of the Northwest Langley Waste Water Treatment Plant, River Crossing and Outfall, including the preliminary design of the new Golden Ears pump station, preliminary design of the river crossing and detailed design of ground improvements for the new treatment plant.
233 Appendix E April 3, 2018 Competitive Selection Packages Anticipated to be greater than 500,000 (Issued but not awarded) Note: All contracts listed below are within the project budgets approved by the Board of Directors Tender/RFP Closing Date RFP No Supply, Delivery and Commissioning of Uninterruptible Power Supply and Static Transfer Switch Systems for Seymour Capilano Filtration Plant October 26, 2017 RFP No Supply and Delivery of a Construction Power Substation at the Annacis Island Wastewater Treatment Plant (Awarded less than 500K) October 20, 2017 RFP No Design, Supply, Delivery and Installation of Debris Barrier and Floating Dock at Capilano Reservoir October 6, 2017 RFP No Supply and Delivery of Wash Water Recovery Polymer to the Seymour Capilano Filtration Plant November 23, 2017 RFP No Supply and Delivery of Belt Press Polymer for the Seymour Capilano Filtration Plant December 19, 2017 RFSO No Electrical, Instrumentation and Control (EIC) Engineering Consulting Services for Small Automation Projects (Awarded less than 500K) December 12, 2017 RFP No Supply, Delivery and Installation of an Ultra High Performance Liquid Chromatography Mass Spectrometry (LCMS/MS) (Awarded less than 500K) December 1, 2017 Tender No Geotechnical Exploration Services for the Northwest Langley Wastewater Treatment Plant Projects January 26, 2018 RFP No Lions Gate Receiving Environment Monitoring Program - Sediment Effects Survey (Awarded less than 500K) January 25, 2018
234 RFP No Iona Deep Sea Outfall Receiving Environment Monitoring Program Sediment Effects Survey (Awarded less than 500K) January 25, 2018 RFP No Consulting Engineering Services for the Detailed Design and Construction of the Golden Ears Pump Station & Sanitary Sewer Overflow Tank January 25, 2018 RFP No Supply and Delivery of Safety Equipment and First Aid Supplies January 23, 2018 RFP No Installation of Front Street Sewer Upgrade - Utilities Relocation February 28, 2018 RFP No Construction of South Surrey Interceptor Johnston Road Section - Trenchless Segments February 27, 2018 RFP No Installation of Front Street Sewer Upgrade February 23, 2018 RFP No North Shore Wastewater Treatment Plant Conveyance February 22, 2018 RFP No Consulting Engineering Services for Capilano Main No. 5 Stanley Park Water Supply Tunnel February 22, 2018 RFP No Supply and Delivery of Dry Polymer to Wastewater Treatment Plants February 15, 2018 Tender No Early Works - Coquitlam Transfer Station March 29, 2018 RFP No Installation of Gilbert Trunk Sewer No. 2 Gilbert Road North Section March 27, 2018 Tender No Construction of Cape Horn Pumping Stations No. 1 and No. 2 Seismic Upgrade March 20, 2018 Tender No Northwest Langley Wastewater Treatment Plant Control System Replacement March 15, 2018
235 RFSO No Chemical Analytical Services for Freshwater and Marine Sediment Samples (Awarded less than 500K) March 8, 2018 Tender No Construction - Fleetwood Reservoir Phase 1 March 1, 2018 Tender No Construction of Mackay Creek and Grouse Creek Debris Flow Mitigation Works April 26, 2018 RFP No Iona Island Wastewater Treatment Plan Project Definition Construction Advisor Services April 12, 2018 RFP No Iona Island Wastewater Treatment Plan Project Definition Procurement Advisor Services April 12, 2018 RFP No Architect and Design Services for Kingston Gardens April 5, 2018 RFP No Engineering Drawings Storage System April 5, 2018 RFSO No Geotechnical Engineering Consulting Services April 5, 2018 RFP No Annacis Island Wastewater Treatment Plant (AIWWTP) Trickling Filter Media, Distributor Arms and Ducting Replacement Engineering Services April 4, 2018 RFP No Property Management Services for Metro Vancouver s Head Office Location April 4, 2018 RFP No Consulting Engineering Services for the Northwest Langley Wastewater Treatment Plant River Crossing Project May 3, 2018 RFP No Construction of Douglas Trunk Sewer May 2, 2018
236 5.9 To: From: Phil Trotzuk, Chief Financial Officer Date: March 28, 2018 Subject: Manager s Report Meeting Date: April 11, 2018 RECOMMENDATION That the receive for information the report dated March 28, 2018, titled Manager s Report. 1. Work Plan Update Attachment 1 is the 2018 Work Plan indicating the status of the Committee s key priorities. 2. Affordable Housing Development Cost Charge Waiver Bylaw Update 3. MFA Spring Borrowing Attachments: Work Plan
237 ATTACHMENT Work Plan Report Date: March 28, 2018 Committee Priority Status FIRST QUARTER: Review and Endorse Committee 2018 Priorities and Work Plan Complete Review 2017 External Audit Plan Complete Review 2017 Final Results: Investment Review Position and Returns Complete Municipal Borrowing Requests for MFA Spring 2018 Issue Complete Tender / Contract Award Information Complete SECOND QUARTER: 2017 Audited Financial Statements In Progress 2017 External Audit Findings Report In Progress Review 2017 Final Results: Operating Results vs Budget In Progress Review 2017 Final Results: Capital Expenditures vs Budget In Progress Affordable Housing Development Cost Charge Waiver Bylaw In Progress Reserves Policy In Progress Financial Planning Policy In Progress Review 2017 Final Results: Development Cost Charges Collected In Progress GVS&DD DCC Revenue Fund Expenditure Bylaw In Progress Procurement Process and Reporting In Progress Tender / Contract Award Information In Progress THIRD QUARTER: Review First 2018 Progress: Investment Review Position and Returns to April 30, 2018 Pending Review First 2018 Progress: Operating Results vs Budget to April 30, 2018 Pending Review First 2018 Progress: Capital Expenditures vs Budget to April 30, 2018 Pending Municipal Borrowing Requests for MFA Fall 2018 Issue (If Applicable) Pending Performance Dashboard Update Pending Review of Debt Management Principles Pending Tender / Contract Award Information Pending FOURTH QUARTER: Review Second 2018 Progress: Investment Review Position and Returns to August 31, Pending 2018 Review Second 2018 Progress: Operating Results vs Budget to August 31, 2018 Pending Review Second 2018 Progress: Capital Expenditures vs Budget to August 31, 2018 Pending Review First 2018 Progress: Development Cost Charges Collected to June 30, 2018 Pending Asset Management Policy In Progress Municipal Borrowing Requests for MFA Spring 2019 Issue (If Applicable) Pending Tender / Contract Award Information Pending
238 6.1 To: Date: March 27, 2018 Subject: Public Engagement Policy Meeting Date: April 11, 2018 The attached Public Engagement Policy report is presented here to the Performance and Audit committee for its information. At its meeting of March 23, 2018, the MVRD, GVS&DD, GVWD and MVHC Boards approved the Public Engagement Policy. The policy aims to improve public engagement processes and create consistency across all Metro Vancouver functions by outlining Metro Vancouver s approach for the planning, implementation and reporting of engagement processes. The Public Engagement Flow Chart outlines the process for public engagement at Metro Vancouver. The Public Engagement Policy describes the organization s guiding principles, the levels in which engagement is undertaken, and the roles and responsibilities of the Board and staff. The Public Engagement Guide is a resource for staff to assist in scoping engagement initiatives and preparing engagement strategies for the public. Standing Committees that oversee public engagement processes can expect to see more consistent reporting from staff in both seeking authorization for engagement processes and reporting back on engagement results. Attachment Report dated March 7, 2018, titled Public Engagement Policy (Doc # )
239 ATTACHMENT To: Finance and Intergovernment Committee From: Vanessa Anthony, Program Manager, Public Involvement, Water Services; Megan Gerryts, Corporate Projects Coordinator, Legal and Legislative Services; and Andrea Winkler, Program Manager, Public Involvement, Liquid Waste Services Date: March 7, 2018 Subject: Public Engagement Policy Meeting Date: March 16, 2018 RECOMMENDATION That the MVRD/GVS&DD/GVWD/MVHC Board approve the Public Engagement Policy as presented in the report dated March 7, 2018, titled Public Engagement Policy. PURPOSE To present the Public Engagement Policy for consideration and approval. BACKGROUND Public engagement across Metro Vancouver can take on a wide variety of forms depending on the potential impact and complexity of a project or initiative. In order to improve engagement processes and create consistency across all Metro Vancouver functions, staff have developed a Public Engagement Policy that outlines Metro Vancouver s approach for the planning and implementation of engagement processes. The proposed policy is aligned with the Metro Vancouver Board Strategic Plan which emphasizes the importance of being accountable, transparent and responsive in order to maintain an effective federation. Metro Vancouver regularly engages with the public and key stakeholders to gather information to influence decision-making. This report presents for Committee and Board consideration a proposed Public Engagement Policy to ensure that Metro Vancouver is consistent and effective in its public engagement activities (Attachment 1). An accompanying Public Engagement Flow Chart and Public Engagement Guide are also included with this report which are intended to assist staff in the administration and application of the proposed Policy (Attachments 2 & 3). PROPOSED PUBLIC ENGAGEMENT POLICY The Public Engagement Policy as drafted outlines Metro Vancouver s approach to public engagement by describing the organization s guiding principles, the levels in which engagement is undertaken, and the roles and responsibilities of the Board and staff. The Public Engagement Flow Chart and Guide describe the process for undertaking responsible public engagement in accordance with the guiding principles. Increasingly, municipalities are defining their engagement practices in policy and including an accompanying Guide for staff. There are many benefits to having engagement practices defined in
240 Public Engagement Policy Finance and Intergovernment Committee Regular Meeting Date: March 16, 2018 Page 2 of 4 policy, including ensuring that engagement initiatives are reflective of organizational values and that the principles that guide engagement are properly articulated and are agreed upon at the Board level. Guiding Principles The proposed Policy articulates five guiding principles that direct Metro Vancouver s engagement processes. These guiding principles are based on industry best practices and seek to set a standard of excellence in carrying out engagement processes. 1. Accountability Metro Vancouver upholds the commitments it makes to the public and demonstrates that the results and outcomes of the engagement processes are consistent with the approved plans for engagement. 2. Inclusiveness Metro Vancouver makes its best efforts to reach, involve and hear from those who are impacted. Plain language will be used in all engagement materials. 3. Transparency Metro Vancouver provides clear and timely information, and endeavours to ensure decision processes, procedures, and constraints are understood. 4. Commitment Metro Vancouver, within its ability and work plans, allocates sufficient resources for effective engagement. 5. Responsiveness Metro Vancouver seeks to understand and be receptive to the public s input. Spectrum of Engagement The International Association of Public Participation (IAP2) spectrum of engagement is a widely used tool amongst municipalities. Metro Vancouver has been using the spectrum for many years to help identify the public s role in the decision-making process. The adapted spectrum described in the policy outlines three engagement levels: Consult, Involve and Collaborate. Each of these levels corresponds to the level of influence the public has in the decision-making process. The Policy directs staff to use the Engage Assessment in the Public Engagement Guide (Attachment 3, p. 12) to determine if their project or initiative requires engagement. If engagement is required, the assessment will help staff determine which level of engagement is the most appropriate based on the potential impact and complexity of the project or initiative. Roles and Responsibilities The Policy outlines the roles and responsibilities of the Board of Directors in making decisions informed by public input. Three criteria are articulated in the Policy and Guide to determine if reporting to Standing Committees and the Board is required. In general, engagement reports will be sent to Committee when a project or initiative fulfills all of the following three criteria: The Board will be making the ultimate decision/providing the final approval regarding the project or initiative; The project or initiative has the potential to impact the public and/or stakeholders; and, There are decisions within the project or initiative that will be open to input from the public. These criteria have been developed in order to ensure that the Board has the opportunity to review the scope of the engagement process before engagement is initiated on projects where they provide
241 Public Engagement Policy Finance and Intergovernment Committee Regular Meeting Date: March 16, 2018 Page 3 of 4 final approval. Additionally, these criteria ensure that engagement is meaningful, since engagement is only initiated if decisions within the project or initiative are open to input from the public. Staff are responsible for following the process described in the Public Engagement Guide. The Public Engagement Flow Chart (Attachment 2) articulates when Board reporting should take place, if required. PUBLIC ENGAGEMENT GUIDE The Public Engagement Guide is intended to support the proposed Public Engagement Policy by directing staff in scoping engagement processes and preparing engagement strategies for the public. The engagement process established in the Public Engagement Flow Chart and detailed in the Guide is supported by tools and worksheets. The Guide is intended for use by Metro Vancouver staff and can be used by any member of staff regardless of their engagement expertise. OTHER PUBLIC ENGAGEMENT PROCESSES As noted in the Public Engagement Guide, the Policy and Guide are not intended to apply to First Nation engagement which is prescribed in separate processes and primarily relevant to construction projects. In addition, Metro Vancouver s Environmental Regulation and Enforcement Division has separate notification processes that are connected to the issuance of permits and licenses. To assist in ensuring that the public is fully informed on various Metro Vancouver initiatives, a variety of online tools and information is available to support public engagement. Specific initiatives are frequently featured on the website and the Performance Monitoring Dashboard has been developed and is maintained to provide up-to-date information across all functions within Metro Vancouver. ALTERNATIVES 1. That the MVRD/GVS&DD/GVWD/MVHC Board approve the Public Engagement Policy as presented in the report dated March 7, 2018, titled Public Engagement Policy. 2. That the Finance and Intergovernment Committee receive for information the report dated March 7, 2018, titled Public Engagement Policy and provide alternate direction to staff. FINANCIAL IMPLICATIONS If the Board approves alternative one, the Public Engagement Policy will provide direction to staff in undertaking public engagement processes. The Policy is expected to improve processes and is not anticipated to result in increased costs for engagement. Any budgetary impacts resulting from this Policy will be included in the budget approval process under the corresponding function and division. SUMMARY / CONCLUSION The Board Strategic Plan emphasizes the importance of being accountable, transparent and responsive in order to maintain an effective federation. The proposed Public Engagement Policy aims to improve public engagement processes and create consistency across all Metro Vancouver functions by outlining Metro Vancouver s approach for the planning and implementation of engagement processes. The Policy and accompanying Flow Chart and Guide provide direction on carrying out engagement processes consistently and responsibly. Staff recommend approving alternative one.
242 Public Engagement Policy Finance and Intergovernment Committee Regular Meeting Date: March 16, 2018 Page 4 of 4 Attachments 1. Public Engagement Policy (Doc # ) 2. Public Engagement Flow Chart (Doc # ) 3. Public Engagement Guide (Doc # )
243 ATTACHMENT 1 BOARD POLICY PUBLIC ENGAGEMENT Effective Date: March 23, 2018 Approved By: MVRD/GVS&DD/GVWD/MVHC Boards PURPOSE To outline Metro Vancouver s approach for the development and implementation of engagement processes to achieve the following: Effective engagement processes that are clear, consistent, and carried out responsibly; Opportunities for public input to influence decision-making; Strong relationships with the communities that Metro Vancouver serves; and, Board decisions that are informed by input from the public. This Policy applies to all public engagement initiatives with the exception of First Nation engagement, which is prescribed in separate processes. This Policy does not apply to the Statutory Notification Process. DEFINITIONS Engagement means purposeful dialogue between Metro Vancouver, member jurisdictions, residents, businesses and special interest groups to gather information to influence decision-making. Engagement Spectrum means a spectrum that helps to provide -clarity on terminology, process, level of promise and expectation for engagement. Engagement Support means the group responsible for assisting the project manager in scoping the engagement process, and preparing and executing the engagement strategy. The group may consist of staff from External Relations, Public Involvement or external consultants depending on the department structure. International Association of Public Participation (IAP2) means an international association that promotes the practice of public participation. IAP2 has set out core values and a spectrum of participation to create a common understanding of the engagement practice. Plain Language means clear, concise communication designed so the audience can easily understand the message. Public means a broad grouping of residents and/or businesses and/or special interest groups. Stakeholder means any member of the public interested in or potentially impacted by a project or initiative Public Engagement Policy Page 1 of 3
244 BOARD POLICY POLICY As articulated in the Board Strategic Plan, Metro Vancouver is committed to informing, educating, and engaging the public in decision-making and providing the public with opportunities to influence decisions that impact their lives. This Policy sets out the guiding principles and procedures for ensuring that all engagement initiatives are carried out consistently and responsibly. GUIDING PRINCIPLES Accountability Metro Vancouver upholds the commitments it makes to the public and demonstrates that the results and outcomes of the engagement processes are consistent with the approved plans for engagement. Inclusiveness Metro Vancouver makes its best efforts to reach, involve and hear from those who are impacted. Plain language will be used in all engagement materials. Transparency Metro Vancouver provides clear and timely information, and endeavours to ensure decision processes, procedures, and constraints are understood. Commitment Metro Vancouver, within its ability and work plans, allocates sufficient resources for effective engagement. Responsiveness Metro Vancouver seeks to understand and be receptive to the public s input. SPECTRUM OF ENGAGEMENT Metro Vancouver applies an adapted International Association of Public Participation (IAP2) Engagement Spectrum to help identify the public s role in the decision-making process, and to clearly lay out the corresponding level of engagement with examples of appropriate techniques. Metro Vancouver will use the Engage Assessment as found in the Public Engagement Guide to determine the appropriate level of engagement required for each initiative. The different levels of engagement correspond to the level of influence the public has in the decision making process and the level of ownership Metro Vancouver has over the decision-making process and end decision. Consult The consult level of engagement consists of raising awareness, sharing information about projects, and providing opportunities for feedback. The commitment to the public is to keep them informed, listen to and acknowledge concerns and aspirations, and provide feedback on how public input influenced the decision. Decisions are made by the authorized decision-maker with input from the public or relevant stakeholders Public Engagement Policy Page 2 of 3
245 BOARD POLICY Involve The involve level of engagement consists of involving the public to make sure that concerns and aspirations are considered and understood. The commitment to the public is to work with them to ensure concerns and aspirations are directly reflected in the alternatives developed and provide feedback on how public input influenced the decision. Decisions are made by the authorized decisionmaker after involving the public to explore possible alternatives to an issue or opportunity at hand. Collaborate The collaborate level of engagement consists of collaborating with the public in each aspect of decision-making. The commitment to the public is to look to them for advice and innovation in formulating solutions and incorporate their advice and decisions to the maximum extent possible. Decisions are made by authorized decision-makers after Metro Vancouver and the public have worked together to explore possible alternatives to an issue or decision and prioritize the preferred solution(s). ROLES AND RESPONSIBILITIES The Metro Vancouver Board of Directors is responsible for authorizing engagement processes and hearing public input reported to them through Standing Committee and Board reports, and making decisions informed by public input. Not all engagement processes will require reports to Standing Committees and the Board. In general, engagement reports will be sent to Committee when a project or initiative fulfills all of the following three criteria: The Board will be making the ultimate decision/providing the final approval regarding the project or initiative; The project or initiative has the potential to impact the public and/or stakeholders; and, There are decisions within the project or initiative that will be open to input from the public. Metro Vancouver staff are responsible for adhering to the Public Engagement Guide and for carrying out engagement initiatives in accordance with the guiding principles. Staff will prepare reports to Standing Committees and the Boards that are informed by research, data, and analytical tools in addition to input from the public that is representative of the breadth of input received. The Public Engagement Flow Chart shows the engagement process including the role of the Board Public Engagement Policy Page 3 of 3
246 ATTACHMENT 2 Public Engagement Flow Chart Engagement support will carry out the following steps in coordination with the project team: Engage Assessment Determine whether or not engagement is needed Project Planning Develop engagement plan with scope, participants, budget, timelines, roles and responsibilities Engagement authorization report to the Board, as required Engagement Implement engagement plan Engagement results report to the Board, as required Communicate Results Report back to participants and decision makers on what was asked, what was heard, and how feedback was used Evaluate Engagement Process Evaluate the engagement process based on the engagement objectives


247 ATTACHMENT 3 PUBLIC ENGAGEMENT GUIDE A Guide for Metro Vancouver Staff March
248 Public Engagement Guide: A Guide for Metro Vancouver Staff TABLE OF CONTENTS INTRODUCTION WHAT IS ENGAGEMENT? ENGAGEMENT GUIDING PRINCIPLES WORKING WITH STANDING COMMITEES AND THE BOARD... 6 IS ENGAGEMENT NEEDED? INTRODUCTION TO THE ASSESSMENT TOOL OVERVIEW OF THE ENGAGEMENT PROCESS... 8 ENGAGEMENT TOOLS AND WORKSHEETS...11 A. ASSESS ENGAGE ASSESSMENT TOOL B. PLAN SCOPING PROJECTS & STAKEHOLDERS C. CONNECT ENGAGEMENT METHODS D. REPORT BACK E. EVALUATE PROCESS EVALUATION APPENDIX A REPORTS SEEKING AUTHORIZATION APPENDIX B REPORTS DESCRIBING RESULTS
249 Public Engagement Guide: A Guide for Metro Vancouver Staff The Metro Vancouver Public Engagement Guide supports Metro Vancouver s Public Engagement Policy and provides more detail on the process described in the Public Engagement Flow Chart. The Guide is intended to direct staff in scoping engagement processes and preparing engagement strategies for the public. This Guide does not apply to First Nation engagement, which is prescribed in separate processes. The process described in the Public Engagement Policy and Guide does not apply to Metro Vancouver s Statutory Notification Process. 1. INTRODUCTION Metro Vancouver is committed to informing, educating, and engaging the public about decisions that impact their lives and livelihoods. Meaningful engagement allows us to make better quality decisions and improve our relationships with residents, businesses, special interest groups, and municipalities. The purpose of this Public Engagement Guide is to help Metro Vancouver employees across all departments deepen their understanding of engagement and ensure the consistent delivery of and reporting out on engagement processes at Metro Vancouver. It is designed to help you determine when to seek public input, what methods to use, and how to know if the process was a success. This Guide will help clarify key terms and best practices in engagement, as well as introduce you to the guiding principles that direct Metro Vancouver s engagement efforts. It will take you through the steps of designing, implementing, and evaluating your engagement efforts and offers practical tools and resources to incorporate into your projects. The Guide also includes an interactive assessment tool. This tool will help you decide whether engagement is needed for your project and what level of engagement is required. It is designed to support you in scoping projects, selecting engagement methods, and navigating approval steps. The Guide is not meant to be a substitute for working with an engagement support team. Your engagement support will work with you to develop and implement the engagement process. 1.1 WHAT IS ENGAGEMENT? Engagement is based on the premise that people have the right to participate in decision-making processes that affect them on the individual or community level. The Metro Vancouver Public Engagement Policy defines engagement as: Purposeful dialogue between Metro Vancouver, member jurisdictions, residents, businesses, and special interest groups to gather information to influence decision-making. For efficiency, throughout this Guide and in the Policy these groups are collectively referred to as the public. 3
250 Public Engagement Guide: A Guide for Metro Vancouver Staff Engagement presents participants with opportunities to learn about Metro Vancouver projects, contribute feedback, inform decision-making, and be informed of the outcomes. The purpose of engagement is not to make everyone happy with the outcome. Instead, a successful process means that participants can live with an outcome, because they understand that the engagement process was defensible, with an appropriate level of engagement delivered in a timely and logical way. When engagement is done well, benefits can include: Reducing risk by understanding impacts and issues ahead of time by engaging early, potentially negative impacts on the community can be addressed early, which can save money, time and relationships in the long run. Create better projects and plans with local knowledge: Communities and interest groups have local knowledge and possibly different ways of viewing issues. Metro Vancouver benefits from the diverse viewpoints and new ideas raised through engagement to make better quality and responsive decisions. Develop champions in the community who can end up becoming ambassadors for the project if they feel community issues have been listened and responded to. These champions help establish credibility and trust within the community. Help elected officials make good decisions by engaging with the right people and groups, asking clear questions and reporting back on what we heard, elected officials are able to make informed decisions with a better understanding of the community s perspectives on an issue. Metro Vancouver offers an array of engagement activities, ranging from information sessions to collaborating on solutions. Metro Vancouver has adapted the International Association of Public Participation s (IAP2) Spectrum of Public Participation1 to provide a clear framework on the public s role in the decision-making process and the most suitable engagement techniques and tools to match the level. This spectrum is internationally recognized and used by municipalities across North American and internationally. It provides a common framework and language for assessing and determining the appropriate level of engagement. 1 IAP2 is an international member association which seeks to promote and improve the practice of public participation or community engagement, incorporating individuals, governments, institutions and other entities that affect the public interest throughout the world. 4


251 Public Engagement Guide: A Guide for Metro Vancouver Staff Example techniques Promise to the Public Public Participation Goal IAP2 Spectrum To obtain public feedback on analysis, issues, alternatives and decision. We will keep you informed, listen to and acknowledge concerns and aspirations, and provide feedback on how public input influenced the decision. Public Comments Focus Groups Surveys Public Meetings To work with the public to make sure that concerns and aspirations are considered and understood. We will work with you to ensure that your concerns and aspirations are directly reflected in the alternatives developed and provide feedback on how public input influenced the decision. Workshops Deliberative Polling To partner with the public in each aspect of the decision-making. We will look to you for advice and innovation in formulating solutions and incorporate your advice and recommendations into the decisions to the maximum extent possible. Citizen Advocacy Committees Consensus-Building Participatory Decision Making A more detailed description of the Consult through Collaborate levels, and appropriate tools to use at each level is included in C. CONNECT - Engagement Methods (p 22). 5
252 Public Engagement Guide: A Guide for Metro Vancouver Staff 1.2 ENGAGEMENT GUIDING PRINCIPLES Metro Vancouver s engagement processes are guided by the following five principles: Accountability Metro Vancouver upholds the commitments it makes to the public and demonstrates that the results and outcomes of the engagement processes are consistent with the approved plans for engagement. Inclusiveness Metro Vancouver makes its best efforts to reach, involve, and hear from those who are impacted. Plain language will be used in all engagement materials. Transparency Metro Vancouver provides clear and timely information, and endeavours to ensure decision processes, procedures, and constraints are understood. Commitment Metro Vancouver, within its ability and work plans, allocates sufficient resources for effective engagement. Responsiveness Metro Vancouver seeks to understand and be receptive to the public s input. Keeping the public and the Board of Directors informed about Metro Vancouver s engagement processes is essential for ensuring that engagement processes are carried out responsibly and in accordance with these guiding principles. 1.3 WORKING WITH STANDING COMMITEES AND THE BOARD For the Board of Directors to make effective decisions, they need to be supplied with well written reports that are informed by research, data, and analytical tools in addition to input from the public. For further information on the practices for Board and Standing Committee processes and agenda management refer to the Standing Committee Agenda Management Policy. For specific direction on writing engagement reports, please refer to Appendices A and B. 6
253 Public Engagement Guide: A Guide for Metro Vancouver Staff 2. IS ENGAGEMENT NEEDED? 2.1 INTRODUCTION TO THE ASSESSMENT TOOL Not every Metro Vancouver project or decision is going to require engagement. Generally, the more complex and/or impactful the issue or project, the greater the need for public engagement. The required level of engagement will vary for each project, depending on the scale of impact and complexity. The Metro Vancouver Engage Assessment (see p 12) was created to help Metro Vancouver staff determine: If the initiative requires engagement; What an appropriate level of engagement is based on how input from the public will be used; What an appropriate scope of engagement is based on the impact and complexity of the initiative; Whether Board authorization and reporting is required prior to proceeding with the engagement process; and, The appropriate internal and external resources to use throughout the engagement process. Some examples of Metro Vancouver projects that typically have an impact on the public: Plans, Policies, Programs, and Regulations, such as the Regional Growth Strategy, air quality and climate change plans, the Grease Interceptor Bylaw, Emissions Regulations, or Pollution Prevention Plans Regulation. Service Provision, such as drinking water, wastewater treatment, and solid waste management; regional parks and affordable housing services. This guide refers to your engagement process as your project, understanding that it could be a program, project, regulation, plan, service, or something else. 7
254 Public Engagement Guide: A Guide for Metro Vancouver Staff 2.2 OVERVIEW OF THE ENGAGEMENT PROCESS The following process establishes a clear and consistent approach for Metro Vancouver staff to follow. The engagement process helps us to define a process, avoid role confusion, set out achievable and logical steps, and deliver on our commitment to the Guiding Principles. This overview describes the five steps of an engagement process, cross-referencing to worksheets to support you at each step. The next section of this guide contains the worksheets. Please note that the process will be iterative you will design a process, identify participants, and brainstorm engagement activities before engagement begins, but ongoing reporting and evaluation may require you to update these materials throughout the process. The Engage Assessment (p 12) is intended to help you determine whether your project will benefit from engagement. This tool will clarify: If engagement is required and why, the level of engagement required, roles and responsibilities and engagement steps. Once the Engage Assessment is completed, the engagement support can develop an engagement plan. The engagement plan is a critical tool to create a shared understanding with your team and consultant(s) on engagement scope, stakeholders, budget, timelines, roles and responsibilities. This is also the step where you prepare the materials that are needed to share information with your audience. Tool: PLAN Scoping Projects and Stakeholders Worksheet (p 18). You are now ready to implement your engagement plan. Successful engagement events depend on providing sufficient notice about when and where engagement is taking place to ensure good turn-out at the event. The events are an opportunity to connect with our audience(s) in an honest, open, and meaningful manner. Tool: CONNECT - Engagement Methods (p 22). Metro Vancouver s commitment to accountability and transparency is demonstrated when you communicate the results of our engagement efforts back to participants and decision makers in a timely and accessible manner and explain how feedback was used. Tool: REPORT BACK - Engagement Summary Worksheet (p 24). After connecting with participants and reporting back on their input, the next step is to evaluate whether the engagement process is still working. Building an evaluation into the engagement process helps ensure that Metro Vancouver resources are being used efficiently and effectively. Tool: EVALUATE Process Evaluation Worksheet (p 26). 8

255 Public Engagement Guide: A Guide for Metro Vancouver Staff This diagram shows an example Metro Vancouver engagement process against these five steps. This example project is to develop a new bylaw. Project Engagement Lead: Jane Chan Overall Engagement Level: Consult Engagement Objectives: To explain the issues that Metro Vancouver is trying to address through a new bylaw To learn about how the proposed bylaw would impact stakeholders To ensure the bylaw can be implemented effectively Stakeholders: Special interest groups, industry associations, enforcement officers, municipal representatives, general public Timeline: accounts for scoping, Board authorization, engagement on proposed requirements (Phase 1), bylaw development, engagement on finalizing requirements (Phase 2), Board approval Materials: Webpage, Key Messages, FAQs, Notification Letters, Interview, site visit and workshop guides Engagement Activities: Key Informant Interviews Site Visits Stakeholder workshops Newsletter update Engagement report summarizing the engagement activities and findings delivered to the technical leads of the project for first review, and if deemed appropriate, added as an attachment to Committee and Board report. Engagement evaluation takes place through debrief with the project teams on an ongoing basis. 9

256 Public Engagement Guide: A Guide for Metro Vancouver Staff 2.3 ROLES AND RESPONSIBILTIES The following diagram shows typical roles and responsibilities for projects. General Manager / Director Responsible for strategic decisions Project Manager Responsible for on-time, on-budget delivery of the project that integrates an engagement process. Engagement Support * Responsible for assisting the Project Manager in scoping the engagement process and preparing and executing the engagement strategy. * Engagement Support may consist of staff from External Relations, Public Involvement, or external consultants, depending on the department structure. 10
257 Public Engagement Guide: A Guide for Metro Vancouver Staff 3. ENGAGEMENT TOOLS AND WORKSHEETS This section of the guide contains the Engage Assessment Tool and a series of worksheets and tip sheets designed to help you make strategic decisions throughout the five-step engagement process. Please print out and use these worksheets. Going through the strategic thinking steps in the worksheets will prepare you for writing an engagement plan for your project. Please seek the advice of your engagement support if you cannot answer a question. The tools and worksheets include: A. ASSESS Engage Assessment Tool: An interactive worksheet to determine whether engagement is needed and what level of engagement is appropriate for your project. It has three parts: Do you need engagement? Do you need Board approval? What level of engagement is appropriate? B. PLAN Scoping Projects and Stakeholders Worksheet: This worksheet has two parts. The first will help you clarify what decision is being made, how engagement will influence the decision, and what contextual issues may affect the decision and people s perceptions of it. The second will help you understand the participants who need to be involved in your process. C. CONNECT Engagement Methods: This resource offers examples of tools and techniques that you may want to use in your engagement processes. D. REPORT BACK Engagement Summary Worksheet: This resource outlines how to approach the Engagement Summary. E. EVALUATE Process Evaluation Worksheet: This resource provides strategic questions to consider when designing an engagement process, so that you have the tools to evaluate the process at key points. 11
258 Public Engagement Guide: A Guide for Metro Vancouver Staff A. ASSESS ENGAGE ASSESSMENT TOOL Part 1 IS ENGAGEMENT NEEDED? Please use this tool to test whether your project needs engagement, and if engagement is required, what level of engagement is appropriate. Section 1. Project Definition What is the project? Please describe: What is the desired outcome of the project? (e.g. a new policy or regulation, new infrastructure, changes to an existing service; etc.) Please describe: What decisions have already been made? Please describe: Section 2. Engagement Requirement Are there decisions within the project or initiative that will be open to input from the public? Yes if yes, what do you want public input on? No If decisions are not open to input, engagement is not appropriate for your project. To be genuine and meaningful, engagement projects must ask questions where input can influence the outcome. Is there a legislative, regulatory, Ministry, and/or Statutory requirement for engagement for this project? Yes No Does the project or initiative have the potential to impact the public? Yes No If you answered yes to one or more of the above questions (in green), engagement is required for your project. Please fill out Section 3 then continue to Part 2. If engagement is not required, you may still be required to inform the public about your project. Please coordinate with your engagement support to develop a communications and outreach strategy. 12
259 Public Engagement Guide: A Guide for Metro Vancouver Staff Section 3. Board authorization and reporting Are there decisions within the project or initiative that will be open to input from the public? Yes No Does the project or initiative have the potential to impact the public and/or key stakeholders? Yes No Is the Board the ultimate decision maker/providing the final approval regarding the specific project or initiative? Yes No If you answered yes to ALL of the questions above (in green), Board reporting is required for your project and you must seek Board authorization for initiation of an engagement process. Please refer to Appendices A and B for more specific guidance on report writing. Sign off on this Engage Assessment Tool varies department by department. Please confirm your specific requirements with your manager. 13
260 Public Engagement Guide: A Guide for Metro Vancouver Staff A. ASSESS ENGAGE ASSESSMENT TOOL Part 2 WHAT LEVEL OF ENGAGEMENT IS NEEDED? Each project has factors that affect what level of engagement is required. The appropriate level depends on a careful analysis of your project s impact and complexity. Level of Impact Assessing the level of impact means looking at who will be affected by the decisions made and how deeply the impact will be felt. For example, is the impact limited to a select few stakeholders or is it region wide? Will the resulting decision impact people s quality of life or their business operations? Answer the following questions to help determine likely level of impact of your project. You may have to take your best guess at this time. IMPACT (real or perceived) Is the project controversial or unpopular? ASSIGN 0 POINTS ASSIGN 1 POINT ASSIGN 2 POINTS ASSIGN 3 POINTS For each checked box For each checked box For each checked box For each checked box Not Applicable The public are not likely to be concerned. Some issues are anticipated. Will the decision have financial impacts? Not Applicable Somewhat likely, with a negligible or indirect impact. More likely, with Very likely, with a potentially potentially high direct impact. moderate direct impact. Will the project or decision significantly affect health and safety? Not Applicable Somewhat likely, with a negligible or indirect impact. More likely, with Very likely, with a potentially potentially high direct impact. moderate direct impact. Will the project or decision affect the environment? Not Applicable Low, temporary, High, temporary High, long-term and/or local local or regional local or regional effect. effect. effect. Will the project or decision affect quality of life? (e.g. noise, odour, views, congestion, access, change in land use) SUM CHECKED BOXES Multiply the results Not Applicable Low, temporary, High, temporary High, long-term, and/or local local or regional local or regional effect. effect. effect. X 0 points X 1 points X 2 points Many issues. At least one significant group that is opposed. X 3 points 14
261 Public Engagement Guide: A Guide for Metro Vancouver Staff If your total points are between: Total points: 0 to 5 points: Your Impact Number is 1 6 to 9 points: Your Impact Number is 2 10 to 15 points: Your Impact Number is 3 Impact Number: 15
262 Public Engagement Guide: A Guide for Metro Vancouver Staff Level of Complexity Assessing the level of complexity looks at how unique or challenging the initiative is. For example, does the project have a variety of phases or components? Are there likely to be opposing public opinions about the issue or project? Answer the following questions to help determine likely level of complexity of your project. You may have to take your best guess at this time. COMPLEXITY ASSIGN 0 POINTS ASSIGN 1 POINT ASSIGN 2 POINTS ASSIGN 3 POINTS For each checked box For each checked box For each checked box For each checked box How divergent is public opinion on your project? Not Applicable Little disagreement or positions can be easily managed. There will be a few competing positions, but they can be managed with some effort. Competing positions by multiple groups or more than a few different strongly held positions. What is the likely level of public understanding of the issue or project? Not Applicable Relatively simple issue and / or strong level of public understanding. Moderately complex issue and / or limited level of public understanding. Highly complex issue and / or low public understanding. Have we done something like this before? Not Applicable Standard / routine. Unique or pilot project. Precedentsetting or brand new. How long will this project take? Not Applicable Less than a year. One to three years. Three years or more, or ongoing. SUM CHECKED BOXES Multiply the results X 0 points X 1 points X 2 points X 3 points If your total points are between: Total points: 0 to 4 points: Your Complexity Letter is A 5 to 8 points: Your Complexity Letter is B 8 to 12 points: Your Complexity Letter is C Complexity Letter: Combine your Impact Number with your Complexity Letter and find the corresponding box on the next page. 16
263 Public Engagement Guide: A Guide for Metro Vancouver Staff LEVEL OF COMPLEXITY Use your Impact Number and Complexity Letter in the table below to locate where on the Engagement Spectrum your project falls. 1C: Low impact, high complexity Spectrum: Consult to Involve 2C: Medium impact, high 3C: High impact, high complexity complexity Spectrum: Consult to Spectrum: Collaborate Involve 1B: Low impact, medium complexity Spectrum: Consult 2B: Medium impact, medium complexity Spectrum: Consult 3B: High impact, medium complexity Spectrum: Involve to Collaborate 1A: Low impact, low complexity Spectrum: Consult 2A: Medium impact, low complexity Spectrum: Consult 3A: High impact, low complexity Spectrum: Involve LEVEL OF IMPACT 17
264 Public Engagement Guide: A Guide for Metro Vancouver Staff B. PLAN SCOPING PROJECTS & STAKEHOLDERS Part 1 SCOPING PROJECTS WORKSHEET Please use this worksheet to clarify what you will be engaging on. In most Board authorized engagement processes, issues will be explored and researched, people will be asked input on options and ideas, and then a staff recommendation to the Board for a decision (Appendix B) will be made. B1. What decision is being made? Please be as specific as possible. Examples include: Choosing the location of a new park or facility, introducing a new bylaw or regulation, or construction of new pipes and a pump station. B2. What is the context for this decision? Describe the history of this project or issue. What are the main opportunities? What areas will be most contentious? What past or planned future activities/policies are relevant and could affect this project? What legislative direction is there for this project? What technical constraints exist? Why is this engagement process happening now? B3. What is the role of engagement? Please describe how engagement will impact the final decision being made. Over the course of your engagement project, your ask will vary depending on the project needs. Do you want to: Raise awareness? Identify potential issues, conflicts, or project benefits? Change attitudes or beliefs? Build support for a project? Build trust? Gain local insight and ideas? Evaluate options? Evaluate a program, policy, or service? Build support for implementation? Something else? How do those asks change by stakeholder or change over time? 18
265 Public Engagement Guide: A Guide for Metro Vancouver Staff B4. What is off the table for engagement? Please describe topics, issues, or decisions that are not open to engagement. This is important in order to manage the expectations of participants and explain where their feedback will have the most effect. Are there any other nonnegotiables or constraints? B5. What factors are driving your engagement timeline? Please describe any requirements, commitments, or realities that are driving the timeline for your engagement project. How have you considered engagement needs around school holidays, elections, or other times of year that are not appropriate for engagement? B6. What does success look like? If the engagement process is successful, what will result from your process? For example, success may be: homeowners affected by the construction of a new reservoir will understand why the project is needed and will accept the construction impacts, even though they are directly affected. Or, a new policy or regulation is adopted that has strong support for implementation. 19
266 Public Engagement Guide: A Guide for Metro Vancouver Staff B. PLAN SCOPING PROJECTS & STAKEHOLDERS Part 2 UNDERSTANDING STAKEHOLDERS WORKSHEET This worksheet will help you understand who to involve in your process. The various participants will have different information, logistical, and other engagement needs. B7. Who is most affected by and interested in your project? Identify individuals and groups who are most interested in and most affected by the process. Who is not likely to participate, but would add value if they did? Please describe specific geographic, age, gender, economic, businesses, or other groups who need to be represented. 20
267 Public Engagement Guide: A Guide for Metro Vancouver Staff The Public Engagement Policy defines Public as a broad grouping of residents and/or businesses and/or special interest groups. Any member of the public interested in or potentially impacted by the project is considered a stakeholder. Possible stakeholders could include: individuals; public interest groups (ethnic community associations, stewardship societies); specific demographic groups (youth, seniors); marginalized and hard-to-reach populations and/or their representative groups; industry associations and individual industries; scientific, professional, educational, and voluntary associations; school boards; and other jurisdictions, levels of governments and their agencies, such as public health agencies. The following table shows an example plan for stakeholder engagement. Name Sector How to reach Potential Barrier(s)? Local Homeowners Individuals One-on-one meetings, phone calls, maildrop flyers, neighbourhood signs, Community Liaison Officer contacts Assisted Living Facility Seniors Make a presentation during lunch at the facility Trucking Representative Industry Associations Breakfast stakeholder meeting; present at existing Board meeting; phone calls; webinar Immigrant Services Organization Public Interest Group Set up introductory meeting to explain project and organization s role; keep organization updated and request they share materials with member groups. Working around their availability, explaining what s in it for them to participate. Account for people with vision or hearing impairment in presentation. May require plenty of advance time to schedule a meeting. May require translated materials and translation facilitators at events. 21

268 Public Engagement Guide: A Guide for Metro Vancouver Staff C. CONNECT ENGAGEMENT METHODS Part 1 ENGAGEMENT PLANNING TIPS & CONSIDERATIONS This resource offers examples of tools and techniques that you may want to use in your engagement process. They are sorted into the IAP2 Public Participation Spectrum levels to show which tools support informing stakeholders versus which tools better support a dialogue with stakeholders. Consult At this level, communication becomes a two-way exchange. When you consult, you raise awareness, share information about your project, and provide opportunities for feedback. Your goal is to gather feedback to inform your decisions, and you are not necessarily committing to using all the feedback. Your commitment to the public is to keep them informed, listen to and acknowledge their ideas, and close the loop on how input influenced the decision being made. This level of engagement is appropriate when technical solutions are clear and routine. Example consult tools include: Open Houses: display boards, exhibits, unstructured discussions or conversations. Town Hall / Public Meetings: Information sessions, Question and Answer sessions. Survey: telephone/online/intercept survey or research poll that is demographically representative. Questionnaire: Hard copy paper or online questionnaire that participants opt-in to take (not necessarily demographically representative). or Mail: Input link on website to receive letters. Small Sessions: Interviews, One-on-One meetings, moderated small discussions or focus groups. Experts: Panel presentations, Moderated discussion after a presentation. Involve The involve level adds iteration to the engagement process; at this level you are committing to demonstrating that you understand public concerns and have considered them. Over multiple stages, you need to show what you heard in the process, how that input was used and was not used (and why), and what the next step is. At each step, there is an opportunity to go deeper with participants to explore past their positions on issues and better understand the personal values that drive their decision-making. At this level you do commit to developing and gathering input on options/alternatives that reflect public input from a previous engagement step. This level of engagement is appropriate when there is no clear solution to an issue. 22
269 Public Engagement Guide: A Guide for Metro Vancouver Staff Example involve tools include: Workshops: Interactive working sessions, small group brainstorming, World Café, and other small group, dialog-based engagement methods. Charrettes: An intensive structured design-first workshops that bring in designers, engineers, planners, and other cross-disciplinary experts to design options and alternatives with stakeholders over the course of one to five days. Collaborate When you collaborate, you commit to partnering with the public on each aspect of decision-making. This can include designing the engagement process with the public to ensure that it will be effective. At the collaboration level, you commit to incorporating advice and recommendations to the maximum extent possible. This level of engagement is appropriate when the scope and definition of the issue is unclear, meaning that there is also no clear solution. Consensus Building and Participatory Decision Making: inclusion of consensus-building facilitation techniques into groups, meetings, panels, and workshops. Advisory Committee or Task Force: Ongoing engagement of stakeholders through an advisory committee that has some authority over the design of the engagement process, definition of deliverables, and oversight of deliverables and the process. 23
270 Public Engagement Guide: A Guide for Metro Vancouver Staff D. REPORT BACK TO STAKEHOLDERS Part 1 WORKSHEET This resource outlines how to approach the engagement summary and report back. Information about reporting to Boards and Committees is included in Appendices A and B. Closing the loop with participants is a fundamental part of any engagement process. This lets people know you are listening, that their time was well-spent, and their input is being used to influence decisions. While specific reporting requirements will vary depending on the type of project, an engagement summary report should: Describe the activities before, during, and after the engagement process; Identify how the process contributed to the project; Provide a summary of key ideas and priorities that emerged including, themes, and trends in the data; and Explain how feedback was incorporated. If you are reporting out to a Metro Vancouver Board through a Committee, once the Committee agenda package is posted online, advise stakeholders of the meeting date, location, time, provide a link to the agenda package, and information on how to sign-up as a speaker. For issues that have a high degree of stakeholder interest, you may also consider advising stakeholders when the Board agenda package is published including the same information plus the time by which speakers must submit delegation requests. D1. How has the feedback from participants been incorporated into the project? D2. Who needs to know the outcome and decisions of this engagement process? 24
271 Public Engagement Guide: A Guide for Metro Vancouver Staff D3. How will the findings from the engagement process be shared and in what format? (e.g. online, electronic or printed report, detailed or summary document). D4. What findings will be presented? Are there any findings that are potentially controversial or newsworthy? How well is the decision being made aligning with public input? What hasn t been addressed and why? Are there any ways to simplify the report-back so that key findings stand out? 25
272 Public Engagement Guide: A Guide for Metro Vancouver Staff E. EVALUATE PROCESS EVALUATION WORKSHEET This resource provides strategic questions to consider when designing an engagement process, so that you have the tools to evaluate the process at key points. Evaluation helps ensure that our projects are efficient and effective. It also provides us the opportunity to try new things, learn from mistakes, and improve our engagement practices as individuals and as an organization. At the beginning of your process, you should discuss with your team what success looks like. Then, develop some evaluation metrics so that you can check in during and after the process to see if you are on track. Evaluation typically happens at four key points: At process design: ensure that the results you wish to achieve can be observed and measured. At each event and input opportunity: include a feedback form for attendees and make time for a quick debrief with staff at the end of the event. At the end of each engagement phase: Conduct a formal evaluation across the team (including Project Managers, event and support staff, communications and decision makers). Take note of challenges and update your plan accordingly for the next phase of engagement. At the end of the project: Conduct a formal evaluation across the team (including Project Managers, event and support staff, communications and decision makers). Save helpful resources and processes in a central location, so that you have templates, checklists, and other materials ready for your next engagement project. The list of questions below can be used to evaluate your process: E1. How did public input affect the decision being made? What feedback was incorporated and why? What feedback was not incorporated and why? How did you communicate this to participants? 26
273 Public Engagement Guide: A Guide for Metro Vancouver Staff E2. What were the original goals for the engagement? Did the team achieve what it set out to do? This is easy to answer when you take a moment early on to ensure that the results you wish to achieve can be observed and measured. E3. Were all affected staff, stakeholders, and members of the public reached? If not, why? Did participants receive a report back on how their input was used? E4. Were the engagement tools and approaches effective? How does your data demonstrate this? E5. Were participants satisfied with the process? How does your data demonstrate this? E6. Were the key issues addressed? What issues or challenges emerged and how could they have been prevented? E7. Were the Metro Vancouver Engagement Principles demonstrated in each step of the process? 27
274 Public Engagement Guide: A Guide for Metro Vancouver Staff Appendix A Reports Seeking Authorization This section is intended to give direction on producing reports for Committee and Board consideration that seek authorization to proceed with an engagement process. A.1 PURPOSE OF REPORT The aim of these types of reports is to inform elected officials of relevant information related to the project or initiative and receive approval to proceed with the engagement process in the way described in the report. Generally, reports seeking authorization to proceed with an engagement process will outline the key issues surrounding the project or initiative, explain why engagement is necessary, describe how input from the public will be used, and define the proposed scope (e.g., timeframe) and methods of the engagement process. The tools and worksheets contained in this guide will assist you in developing this information. This type of report does not necessarily need to be a standalone report, but could be part of a larger overall report. For example, a report seeking authorization to proceed with engagement on amendments to an existing bylaw would also describe the history of the bylaw, why amendments are necessary, and describe possible amendment options. This report can also be used in communications to those being engaged. 28
275 Public Engagement Guide: A Guide for Metro Vancouver Staff A.2 REPORT SEEKING AUTHORIZATION GUIDE For more direction on putting together a committee report, refer to the Guidelines on Report Writing Format. Include the following information in your committee report seeking authorization to proceed with an engagement process. Insert these sections into the Report Template. RECOMMENDATION That the MVRD/MVHC/GVWD/GVS&DD Board approve the scope of the proposed <Name of Project or Initiative> and authorize staff to proceed with the engagement process as presented in the report dated Month Day, Year, titled <Name of Project or Initiative> Public Engagement Process. PURPOSE To seek approval of the scope of the <Name of Project or Initiative> and to receive authorization to begin engagement on the project/initiative. BACKGROUND Outline why this project or initiative is being brought forward now (e.g. board motion, committee work plan, Board Strategic Plan), some examples are included below Briefly summarize relevant background information on the project or initiative, such as how the project or initiative arose, when a plan/bylaw or strategy first came into effect, the changes being proposed and why they are needed etc. End this section: This report presents the scope of the <Name of Project or Initiative> for approval, along with a proposed engagement process that allows stakeholders to provide input on the <project or initiative>. At the November 25, 2016 meeting of the GVS&DD Board, the following motion was passed: That the GVS&DD Board direct staff to proceed with public and stakeholder consultation on the proposed changes to the Development Cost Charge Program following the adoption of the 5-year financial plan in March 2017, and direct staff to report back, prior to the consultation, on phasing of and potential strategies to mitigate the impact of the rate increases. Initiating consultation on potential regulatory mechanisms to reduce emissions from indoor residential wood burning was identified as a priority action in the Climate Action Committee s 2017 work plan. The Metro Vancouver Board Strategic Plan directs staff to identify the key threats to the region s air quality and their sources, and pursue appropriate means for reducing or eliminating identified threats. 29
276 Public Engagement Guide: A Guide for Metro Vancouver Staff <NAME OF PROJECT OR INITIATIVE> Describe the project or initiative in as much detail as is necessary Give relevant background information e.g. describe current practices, the changes that are being proposed and why they are needed Subheadings may be required if certain issue areas need to be explained further ENGAGEMENT PROCESS Metro Vancouver is committed to engaging with stakeholders that have the potential to be impacted by <project or initiative> and approaches engagement in a manner that incorporates feedback from stakeholders into project plans where possible. Metro Vancouver will provide a variety of forums, listed below, to learn about stakeholders interests and concerns related to the <project or initiative>. This information will inform the <project or initiative> and be reported back at the end of the process along with staff recommendations. Scope of the Engagement Metro Vancouver will be seeking input on the following aspects of the <project or initiative> Bullet the areas you are seeking input on or describe in paragraph format (e.g. bylaw requirements, parkland uses, building design and impacts on a neighbourhood etc.). Be as specific as possible. Stakeholders Staff have identified the following stakeholders who may be impacted by, or have an interest in, the project or initiative. Use a bulleted list for when stakeholders consist of specific groups or use a paragraph format to describe more broadly the groups that will be engaged Methods and Timing In order to engage with the identified stakeholders, the following methods are being proposed as part of the engagement strategy: Method Purpose Timing Insert detail Insert detail Insert detail Insert detail Insert detail Insert detail The methods included below are provided as an example: Metro Vancouver website Provide up to date information about the engagement process Letter/ notification and Provide notification that engagement is updates beginning, provide information on Ongoing beginning Spring 2018 Spring 2018 Summer 2018 Fall
277 Public Engagement Guide: A Guide for Metro Vancouver Staff Method Purpose Timing opportunities to engage, deliver updates on what we heard Winter 2018 Working group Provide an opportunity for in-depth regular discussions with key stakeholders Spring 2018 Winter 2018 (quarterly meetings) Multi-lingual focus groups Provide an opportunity for education and engagement for those stakeholders that are not comfortable conversing in English Summer 2018 Online survey Provide a quick and easy option for stakeholder who wish to participate remotely Fall / Winter 2018 Site visits/interviews Provide an opportunity for in-person education and engagement during visits Fall / Winter 2018 FINANCIAL IMPLICATIONS Begin: If the Board/Committee approves alternative one Identify whether the alternative is included in the budget, and under which function, division or program budget Where applicable, reference the function that will be financially impacted by the alternative Where applicable, reference the household impact Separate the cost of the project/initiative from the cost of carrying out the engagement process If alternative two is to provide alternate direction to staff, indicate that further analysis may be required to determine the resulting financial impacts SUMMARY / CONCLUSION Repeat the purpose of the report, including why the report is coming forward now Summarize the main points of the report in the context of the alternatives End by recommending alternative one Attachments Appropriate attachments include discussion papers or other relevant background information. 31

278 Public Engagement Guide: A Guide for Metro Vancouver Staff Appendix B Reports Describing Results This section is intended to give direction on producing reports for Committee and Board consideration that report back on the results of an engagement process. B.1 REPORT PURPOSE Primarily, reports that describe the results of an engagement process should give elected officials an accurate summation of what was heard from the public. Generally, reports of this nature need to do three things: Describe the engagement process that was undertaken, including what was asked; Outline what was heard, using sufficient detail; and, Describe how this input will affect the project or initiative going forward. Depending on what was heard from the public, the report may confirm the existing direction of the initiative proposed by staff; recommend minor or major changes to the initiative; or recommend further engagement with a redefined scope. In each of these instances it is important to communicate the rationale for the recommendation being made to committee. Issues/Response Tables or Issues/Communication Trackers can be a useful attachment for giving Board and Committee members a sense of the breadth of feedback that was received and how Metro Vancouver staff are responding to the issues, comments or questions that are raised by the public. An example issues response table is included below. Figure 1: Issues response table for Preliminary Consultation on a Residential Wood Smoke Regulation for Metro Vancouver 32
metrovancouver METRO VANCOUVER FINANCIAL INFORMATION ACT FILING STATEMENT OF FINANCIAL INFORMATION FOR THE YEAR ENDED DECEMBER 31, 2016
 metrovancouver METRO VANCOUVER FINANCIAL INFORMATION ACT FILING STATEMENT OF FINANCIAL INFORMATION FOR THE YEAR ENDED DECEMBER 31, 2016 THIS STATEMENT OF FINANCIAL INFORMATON INCLUDES THE ACCOUNTS OF:
METRO VANCOUVER REGIONAL DISTRICT PERFORMANCE AND AUDIT COMMITTEE
 METRO VANCOUVER REGIONAL DISTRICT PERFORMANCE AND AUDIT COMMITTEE REGULAR MEETING Friday, July 7, 2017 9:00 a.m. 2 nd Floor Boardroom, 4330 Kingsway, Burnaby, British Columbia. 1. ADOPTION OF THE AGENDA
GREATER VANCOUVER REGIONAL DISTRICT PERFORMANCE AND PROCUREMENT COMMITTEE
 GREATER VANCOUVER REGIONAL DISTRICT PERFORMANCE AND PROCUREMENT COMMITTEE REGULAR MEETING Friday, November 13, 2015 9:00 a.m. 2 nd Floor Boardroom, 4330 Kingsway, Burnaby, British Columbia. 1. ADOPTION
GREATER VANCOUVER REGIONAL DISTRICT PERFORMANCE AND PROCUREMENT COMMITTEE
 GREATER VANCOUVER REGIONAL DISTRICT PERFORMANCE AND PROCUREMENT COMMITTEE REGULAR MEETING Friday, July 17, 2015 9:00 a.m. 2 nd Floor Boardroom, 4330 Kingsway, Burnaby, British Columbia. 1. ADOPTION OF
METRO VANCOUVER REGIONAL DISTRICT FINANCE AND INTERGOVERNMENT COMMITTEE
 METRO VANCOUVER REGIONAL DISTRICT FINANCE AND INTERGOVERNMENT COMMITTEE REGULAR MEETING Friday, October 12, 2018 9:00 a.m. 28 th Floor Committee Room, 4730 Kingsway, Burnaby, British Columbia A G E N D
METRO VANCOUVER HOUSING CORPORATION (MVHC) BOARD OF DIRECTORS
 BOARD OF DIRECTORS") Meeting 2 of 8 METRO VANCOUVER HOUSING CORPORATION (MVHC) BOARD OF DIRECTORS REGULAR BOARD MEETING Friday, May 25, 2018 9:00 A.M. 28 th Floor Boardroom, 4730 Kingsway, Burnaby, British Columbia Membership
Meeting 2 of 8 METRO VANCOUVER HOUSING CORPORATION (MVHC) BOARD OF DIRECTORS REGULAR BOARD MEETING Friday, May 25, 2018 9:00 A.M. 28 th Floor Boardroom, 4730 Kingsway, Burnaby, British Columbia Membership
GREATER VANCOUVER REGIONAL DISTRICT FINANCE COMMITTEE
 GREATER VANCOUVER REGIONAL DISTRICT FINANCE COMMITTEE REGULAR MEETING Friday, February 14, 2014 9:00 a.m. 2 nd Floor Boardroom, 4330 Kingsway, Burnaby, British Columbia. A G E N D A 1 1. ADOPTION OF THE
METRO VANCOUVER REGIONAL DISTRICT UTILITIES COMMITTEE
 METRO VANCOUVER REGIONAL DISTRICT UTILITIES COMMITTEE Minutes of the Regular Meeting of the Metro Vancouver Regional District (MVRD) Utilities Committee held at 9:02 a.m. on Thursday, July 12, 2018 in
REPORT Finance and Information Technology
 REPORT Finance and Information Technology To: Mayor Coté and Members of Council Date: 6/11/2018 From: Colleen Ponzini, CPA, CGA Acting Chief Financial Officer File: Item #: 253/2018 Subject: 2017 Statement
METRO VANCOUVER REGIONAL DISTRICT FINANCE AND INTERGOVERNMENT COMMITTEE
 METRO VANCOUVER REGIONAL DISTRICT FINANCE AND INTERGOVERNMENT COMMITTEE REGULAR MEETING Friday, April 20, 2018 1:00 p.m. 28 th Floor Committee Room, 4730 Kingsway, Burnaby, British Columbia A G E N D A
METRO VANCOUVER REGIONAL DISTRICT FINANCE AND INTERGOVERNMENT COMMITTEE
 METRO VANCOUVER REGIONAL DISTRICT FINANCE AND INTERGOVERNMENT COMMITTEE REGULAR MEETING Friday, May 18, 2018 9:00 a.m. 28 th Floor Committee Room, 4730 Kingsway, Burnaby, British Columbia R E V I S E D
City of Coquitlam. Statement of Financial Information 2016
 City of Coquitlam Statement of Financial Information 2016 June 10, 2017 Notice to Reader The Financial Information Act requires municipalities and other Government organizations to prepare annual financial
METRO VANCOUVER REGIONAL DISTRICT REGIONAL PLANNING COMMITTEE
 METRO VANCOUVER REGIONAL DISTRICT REGIONAL PLANNING COMMITTEE REGULAR MEETING Friday, October 13, 2017 9:00 a.m. 2nd Floor Boardroom, 4330 Kingsway, Burnaby, British Columbia A G E N D A1 1. ADOPTION OF
METRO VANCOUVER REGIONAL DISTRICT FINANCE AND INTERGOVERNMENT COMMITTEE AND HOUSING COMMITTEE
 METRO VANCOUVER REGIONAL DISTRICT FINANCE AND INTERGOVERNMENT COMMITTEE AND HOUSING COMMITTEE SPECIAL JOINT MEETING Wednesday, July 19, 2017 1:00 p.m. 2 nd Floor Boardroom, 4330 Kingsway, Burnaby, British
STATEMENT OF FINANCIAL INFORMATION
 INCLUDING BOARDS AND COMMISSIONS BRITISH COLUMBIA STATEMENT OF FINANCIAL INFORMATION DECEMBER 31, 2016 FINANCIAL STATEMENTS SCHEDULE OF DEBTS SCHEDULE OF GUARANTEE AND INDEMNITY AGREEMENTS SCHEDULE OF
THE CORPORATION OF THE VILLAGE OF LUMBY
 THE CORPORATION OF THE VILLAGE OF LUMBY CONSOLIDATED FINANCIAL STATEMENTS December 31, 2016 December 31, 2016 CONTENTS Page INDEPENDENT AUDITORS' REPORT 3 FINANCIAL STATEMENTS Consolidated Statement of
GREATER VANCOUVER REGIONAL DISTRICT INTERGOVERNMENT AND FINANCE COMMITTEE
 GREATER VANCOUVER REGIONAL DISTRICT INTERGOVERNMENT AND FINANCE COMMITTEE Minutes of the Regular Meeting of the Greater Vancouver Regional District (GVRD) lntergovernment and Finance Committee held at
2017 Budget In Brief June 2017
 2017 Budget In Brief June 2017 TABLE OF CONTENTS INTRODUCTION 201 7 BUDGET General Overview... 2-3 Financial Overview... 4-7 SUPPLEMENTARY INFORMATION Where the Money Comes From... 8 Where We Spend the
General Manager, Finance, Risk and Supply Chain Management
 ADMINISTRATIVE REPORT Report Date: March 19, 2018 Contact: Melanie Kerr Contact No.: 604.871.6281 RTS No.: 12247 VanRIMS No.: 08-2000-20 Meeting Date: April 17, 2018 TO: FROM: SUBJECT: Vancouver City Council
TOWN OF MORINVILLE. Financial Statements For the Year Ended December 31, 2017
 Financial Statements For the Year Ended December 31, 2017 INDEPENDENT AUDITORS' REPORT To the Mayor and Council of the Town of Morinville We have audited the accompanying financial statements of the Town
Financial Report. Corporation of the City of Thorold
 Financial Report Corporation of the City of Thorold 2015 Contents Page Corporation of the City of Thorold Independent Auditor s Report 1-2 Consolidated Statement of Financial Position 3 Consolidated Statement
REGIONAL DISTRICT OF NORTH OKANAGAN
 REGIONAL DISTRICT OF NORTH OKANAGAN FINANCIAL STATEMENTS FOR THE YEAR ENDED DECEMBER 31, 2014 CONTENTS Management's Statement of Responsibility 1 Independent Auditor's Report 2 Financial Statements Statement
THE CORPORATION OF THE VILLAGE OF ALERT BAY FINANCIAL STATEMENTS DECEMBER 31, 2013
 THE CORPORATION OF THE VILLAGE OF ALERT BAY FINANCIAL STATEMENTS DECEMBER 31, 2013 THE CORPORATION OF THE VILLAGE OF ALERT BAY 2013 ELECTED OFFICIALS Councilor D. Aberley Councilor K. Gordon Mayor M. Berry
TOWN OF MORINVILLE FINANCIAL STATEMENTS FOR THE YEAR ENDED DECEMBER 31, 2015
 FINANCIAL STATEMENTS FOR THE YEAR ENDED DECEMBER 31, 2015 INDEPENDENT AUDITORS' REPORT To the Mayor and Council of the Town of Morinville We have audited the accompanying financial statements of the Town
CITY OF VANCOUVER BRITISH COLUMBIA ANNUAL FINANCIAL REPORT
 CITY OF VANCOUVER BRITISH COLUMBIA ANNUAL FINANCIAL REPORT 2016 TABLE OF CONTENTS Mayor and Council... 1 City of Vancouver Organizational Chart... 2 Financial Statements Report of the Director of Finance...
ADMINISTRATIVE REPORT
 ADMINISTRATIVE REPORT Report Date: March 19, 2018 Contact: Melanie Kerr Contact No.: 604.871.6281 RTS No.: 12820 VanRIMS No.: 08-2000-20 Meeting Date: April 2, 2019 TO: FROM: SUBJECT: Vancouver City Council
City of Kamloops Consolidated Financial Statements For the year ended December 31, 2016
 Consolidated Financial Statements For the year ended Tel: 250 372 9505 Fax: 250 374 6323 www.bdo.ca BDO Canada LLP 300 275 Lansdowne Street Kamloops BC V2C 6J3 Independent Auditor's Report To the Members
Financial Statements of SUNSHINE COAST REGIONAL HOSPITAL DISTRICT
 Financial Statements of SUNSHINE COAST REGIONAL HOSPITAL DISTRICT For the Year Ended December 31, 2014 Management's Responsibility for Financial Reporting The financial statements are the responsibility
Proposed 2015 Budget. Board Budget Workshop October 16, 2014
 Proposed 2015 Budget Board Budget Workshop October 16, 2014 10320532 Introduction 2015 Budget Process Budget process initiated in 2013 with further enhancements for developing 2015 Budget Development of
CORPORATION OF THE TOWNSHIP OF ADELAIDE METCALFE. Financial Statements. December 31, 2016
 CORPORATION OF THE TOWNSHIP OF ADELAIDE METCALFE Financial Statements December 31, 2016 Financial Statements Table of Contents PAGE Independent Auditors' Report 1 Statement of Financial Position 2 Statement
TOWN OF LA RONGE FINANCIAL STATEMENTS. December 31, 2016
 TOWN OF LA RONGE FINANCIAL STATEMENTS December 31, 2016 Deloitte LLP 767, 801 15th Street East Prince Albert, SK S6V 0C7 Canada Tel: (306) 763-7411 Fax: (306) 763-0191 www.deloitte.ca INDEPENDENT AUDITOR
County of Wetaskiwin No. 10 Consolidated Financial Statements For the year ended December 31, 2016
 Consolidated Financial Statements For the year ended ConsoLidated Financial Statements For the year ended Contents Independent Auditors Report 1 Consolidated Financial Statements Statement of Financial
STATEMENT OF FINANCIAL INFORMATION
 CITY OF SURREY STATEMENT OF FINANCIAL INFORMATION Year Ended December 31, 2010 (In Compliance with the Public Bodies Financial Information Act Statutes of British Columbia, Chapter 140) Table of Contents
CITY OF KAMLOOPS. Financial Statements for the Year-Ended 2013 December 31. Page 1 of 66
 CITY OF KAMLOOPS Financial Statements for the Year-Ended 2013 December 31 Page 1 of 66 CONSOLIDATED FINANCIAL STATEMENTS TABLE OF CONTENTS 2 Independent Auditor's Report 3-4 Management's Responsibility
CORPORATION OF THE TOWNSHIP OF ADELAIDE METCALFE. Financial Statements. December 31, 2015
 CORPORATION OF THE TOWNSHIP OF ADELAIDE METCALFE Financial Statements December 31, 2015 Financial Statements Table of Contents PAGE Independent Auditors' Report 1 Statement of Financial Position 2 Statement
Grant Thornton. Financial statements. Village of Forestburg. December 31, 2016
 Grant Thornton Financial statements December 31, 2016 Contents Management's responsibility for financial reporting Page Independent Auditors' Report to the Mayor and Council Consolidated Statement of Operations
METRO VANCOUVER HOUSING CORPORATION (MVHC) BOARD OF DIRECTORS
 BOARD OF DIRECTORS") Meeting 4 of 10 METRO VANCOUVER HOUSING CORPORATION (MVHC) BOARD OF DIRECTORS REGULAR BOARD MEETING Friday, October 28, 2016 9:00 A.M. 2 nd Floor Boardroom, 4330 Kingsway, Burnaby, British Columbia Membership
Meeting 4 of 10 METRO VANCOUVER HOUSING CORPORATION (MVHC) BOARD OF DIRECTORS REGULAR BOARD MEETING Friday, October 28, 2016 9:00 A.M. 2 nd Floor Boardroom, 4330 Kingsway, Burnaby, British Columbia Membership
STATEMENT OF FINANCIAL INFORMATION
 STATEMENT OF FINANCIAL INFORMATION FOR THE YEAR ENDED DECEMBER 31, 2016 (In compliance with the Financial Information Act of British Columbia, Chapter 140) poi REGIONAL glib DISTRICT 1 OF NANAIMO The information
The Municipality of North Perth Consolidated Financial Statements For the year ended December 31, 2016
 Consolidated Financial Statements For the year ended Consolidated Financial Statements For the year ended Contents Independent Auditors' Report 1 Consolidated Financial Statements Consolidated Statement
TOWNSHIP OF SOUTH GLENGARRY FINANCIAL STATEMENTS
 FINANCIAL STATEMENTS December 31, 2017 December 31, 2017 CONTENTS Page INDEPENDENT AUDITORS' REPORT 1 FINANCIAL STATEMENTS Statement of Financial Position 2 Statement of Financial Activities 3 Statement
SPECIAL MEETING Financial Plan Metro Vancouver Districts and Housing Corporation Financial Plan Standing Committee Reports
 Meeting 1 of 1 METRO VANCOUVER DISTRICT BOARDS (Joint special meeting of the Metro Vancouver Regional District, Greater Vancouver Sewerage & Drainage District, Greater Vancouver Water District and Metro
Financial Statements. Woodlands County December 31, 2012
 Financial Statements INDEPENDENT AUDITORS' REPORT To the Members of Council of We have audited the accompanying financial statements of, which comprise the statement of financial position as at and the
Village of Caroline Consolidated Financial Statements For the year ended December 31, 2017
 Consolidated Financial Statements For the year ended Consolidated Financial Statements For the year ended Contents Auditor's Report 1 Consolidated Financial Statements Consolidated Statement of Financial
Consolidated Financial Statements of. The City of Spruce Grove
 Consolidated Financial Statements of The City of Spruce Grove CONTENTS Independent Auditors' Report Management's Report...1 Consolidated Statement of Financial Position...2 Consolidated Statement of Operations
Financial Statements of SUNSHINE COAST REGIONAL HOSPITAL DISTRICT
 Financial Statements of SUNSHINE COAST REGIONAL HOSPITAL DISTRICT For the Year Ended December 31, 2016 Tel: 604 688 5421 Fax: 604 688 5132 vancouver@bdo.ca www.bdo.ca BDO Canada LLP 600 Cathedral Place
SUMMER VILLAGE OF SUNSET BEACH Consolidated Financial Statements Year Ended December 31, 2015
 Consolidated Financial Statements Index to Consolidated Financial Statements INDEPENDENT AUDITOR'S REPORT 1 Page CONSOLIDATED FINANCIAL STATEMENTS Consolidated Statement of Financial Position 2 Consolidated
2016 Statement of Financial Information. City of Burnaby. For the fiscal year ended December 31, British Columbia, Canada
 City of Burnaby British Columbia, Canada 2016 Statement of Financial Information For the fiscal year ended December 31, 2016 Contents Statement of Financial Information Approval...4 Management Report...5
Village of Empress CONSOLIDATED FINANCIAL STATEMENTS FOR THE YEAR ENDED DECEMBER 31, 2014
 CONSOLIDATED FINANCIAL STATEMENTS FOR THE YEAR ENDED DECEMBER 31, 2014 Auditor's Report To the Members of Council: Report on the Consolidated Financial Statements We have audited the accompanying consolidated
STATEMENT OF FINANCIAL INFORMATION
 CITY OF SURREY STATEMENT OF FINANCIAL INFORMATION Year Ended December 31, 2012 (In Compliance with the Public Bodies Financial Information Act Statutes of British Columbia, Chapter 140) Table of Contents
 CITY OF GRANDE PRAIRIE FINANCIAL STATEMENTS FOR THE YEAR ENDED DECEMBER 31, 2012 Auditor's Report To the Members of Council of the City of Grande Prairie: Report on the Consolidated Financial Statements
2017 Financial Statements For the year ended December 31, 2017
 2017 Financial Statements For the year ended December 31, 2017 Kelowna, British Columbia, Canada Kelowna International Airport Contents Page Independent Auditors Report 1 Statement of Financial Position
Consolidated Financial Statements. City of Camrose. December 31, 2016
 Consolidated Financial Statements City of Camrose December 31, 2016 December 31, 2016 Contents Consolidated Financial Statements Management's Responsibility for Financial Reporting 1 Independent Auditors'
TOWN OF MORINVILLE MORINVILLE, ALBERTA FINANCIAL STATEMENTS FOR THE YEAR ENDED DECEMBER
 MORINVILLE, ALBERTA FINANCIAL STATEMENTS FOR THE YEAR ENDED DECEMBER 31, 2012 Hawkings Epp DumontLLP Chartered Accountants Hawkings Epp Dumont LLP Chartered Accountants 10476 Mayfield Road Telephone: 780-489-9606
R E P O R T Finance and Information Technology
 R E P O R T Finance and Information Technology To: From: Subject: Mayor Coté and Members of Council in Open Council Workshop Gary Holowatiuk, CPA, CA Director of Finance and Information Technology 2015
BURK'S FALLS, ARMOUR AND RYERSON TRI R COMMITTEE
 FINANCIAL STATEMENTS DECEMBER 31, 2015 CONTENTS Page Independent Auditor's Report 1-2 Statement of Financial Position Statements of Operations and Accumulated Deficit Statement of Change in Net Debt Statement
BURK'S FALLS, ARMOUR AND RYERSON TRI R COMMITTEE
 FINANCIAL STATEMENTS DECEMBER 31, 2013 CONTENTS Page Independent Auditor's Report 12 Statement of Financial Position Statements of Operations and Accumulated Deficit Statement of Change in Net Debt Statement
CORPORATION OF THE TOWNSHIP OF MALAHIDE. Consolidated Financial Statements
 CORPORATION OF THE TOWNSHIP OF MALAHIDE Consolidated Financial Statements December 31, 2015 Consolidated Financial Statements Table of Contents PAGE Independent Auditors' Report 1 Consolidated Statement
Village of Empress FINANCIAL STATEMENTS FOR THE YEAR ENDED DECEMBER 31, 2015
 FINANCIAL STATEMENTS FOR THE YEAR ENDED DECEMBER 31, 2015 Auditor's Report To the Members of Council: Report on the Financial Statements We have audited the accompanying financial statements of the, which
Consolidated Financial Statements of CAPILANO UNIVERSITY. Year ended March 31, 2017
 Consolidated Financial Statements of STATEMENT OF MANAGEMENT RESPONSIBILITY Management is responsible for the preparation of the annual financial statements, and has prepared the accompanying consolidated
SUMMER VILLAGE OF LARKSPUR AUDITED FINANCIAL STATEMENTS DECEMBER 31, 2017
 AUDITED FINANCIAL STATEMENTS DECEMBER 31, 2017 DECEMBER 31, 2017 CONTENTS Page INDEPENDENT AUDITOR'S REPORT 1 FINANCIAL STATEMENTS Consolidated Statement of Financial Position 2 Consolidated Statement
Town of New Sampleford. Financial Statement Presentation for December 31, Introduction and Sample
 Financial Statement Presentation for December 31, Introduction and Sample Applicable Accounting Standards The Municipal Government Act requires a municipality to prepare annual audited financial statements
THE CORPORATION OF THE TOWNSHIP OF RYERSON
 THE CORPORATION OF THE TOWNSHIP OF RYERSON CONSOLIDATED FINANCIAL STATEMENTS DECEMBER 31, 2014 CONTENTS Page Independent Auditor's Report 1-2 Consolidated Statement of Financial Position 3 Consolidated
SUMMER VILLAGE OF BONDISS Consolidated Financial Statements Year Ended December 31, 2017
 Consolidated Financial Statements Index to Consolidated Financial Statements INDEPENDENT AUDITOR'S REPORT 1 Page CONSOLIDATED FINANCIAL STATEMENTS Consolidated Statement of Financial Position 2 Consolidated
Bowen Island Municipality Financial Statements For the year ended December 31, 2015
 Financial Statements For the year ended Financial Statements For the year ended Contents Management s Responsibility for the Financial Statements 2 Independent Auditor's Report 3 Financial Statements Statement
Independent Auditors Report
 Independent Auditors Report To the Reeve and Members of Council of Rocky View County: We have audited the accompanying financial statements of Rocky View County, which comprise the statement of financial
APPENDIX A. Financial Statements. City of Toronto Sinking Funds December 31, 2016
 APPENDIX A Financial Statements City of Toronto Sinking Funds December 31, 2016 DRAFT July @@, 2017 Independent Auditor s Report To the Members of Council of City of Toronto We have audited the accompanying
CORPORATION OF THE MUNICIPALITY OF TRENT LAKES CONSOLIDATED FINANCIAL STATEMENTS DECEMBER 31, 2015
 CORPORATION OF THE MUNICIPALITY OF TRENT LAKES CONSOLIDATED FINANCIAL STATEMENTS DECEMBER 31, 2015 CORPORATION OF THE MUNICIPALITY OF TRENT LAKES CONSOLIDATED FINANCIAL STATEMENTS DECEMBER 31, 2015 TABLE
REPORT. To: Chair and Directors Date: 13 March COMMUNICATIONS CONSIDERATION(S): Must make public by June 30 th.
: Must make public by June 30 th.") REPORT To: Chair and Directors Date: 13 March 2018 From: Kim Frech, Chief Financial Officer Subject: 2017 Financial Statement RECOMMENDATION(S): [All Directors Corporate Unweighted] 1. THAT the Regional
REPORT To: Chair and Directors Date: 13 March 2018 From: Kim Frech, Chief Financial Officer Subject: 2017 Financial Statement RECOMMENDATION(S): [All Directors Corporate Unweighted] 1. THAT the Regional
MD OF GREENVIEW NO. 16
 FINANCIAL STATEMENTS FOR THE YEAR ENDED DECEMBER 31, 2015 INDEPENDENT AUDITORS' REPORT To the Reeve and Council of MD of Greenview No. 16 We have audited the accompanying financial statements of MD of
THOMPSON REGIONAL HOSPITAL DISTRICT. Financial Statements. December 31, 2014
 THOMPSON REGIONAL HOSPITAL DISTRICT Financial Statements December 31, 2014 Financial Statements of THOMPSON REGIONAL HOSPITAL DISTRICT Year ended December 31, 2014 Index to Financial Statements Year ended
APPENDIX A. Financial Statements. City of Toronto Sinking Funds December 31, 2011
 APPENDIX A Financial Statements City of Toronto Sinking Funds December 31, 2011 July [x], 2012 Independent Auditor s Report To the Chair of the City of Toronto Sinking Funds Committee We have audited the
Corporation of the. City of Pembroke. Consolidated Financial Statements. For the Year Ended December 31,2016. CHARTERCD PHOFEHeiONAL Abcduntantb
 Corporation of the City of Pembroke Consolidated Financial Statements For the Year Ended December 31,2016 TTDTR! CHARTERCD PHOFEHeiONAL Abcduntantb MANAGEMENT REPORT Management's Responsibility for the
2016 Financial Statements
 2016 Financial Statements The Corporation of the District of Saanich British Columbia Fiscal year ended December 31, 2016 Prepared by: District of Saanich Finance Department saanich.ca June 13, 2017 Mayor
TORONTO AND REGION CONSERVATION AUTHORITY
 Financial Statements of TORONTO AND REGION CONSERVATION AUTHORITY KPMG LLP Vaughan Metropolitan Centre 100 New Park Place, Suite 1400 Vaughan ON L4K 0J3 Canada Tel 905-265-5900 Fax 905-265-6390 INDEPENDENT
Bowen Island Municipality Financial Statements For the year ended December 31, 2014
 Financial Statements For the year ended Financial Statements For the year ended Contents Management s Responsibility for the Financial Statements 2 Independent Auditor's Report 3 Financial Statements Statement
JUSTICE INSTITUTE OF BRITISH COLUMBIA
 Financial Statements of KPMG LLP Chartered Accountants Metrotower II 4720 Kingsway, Suite 2400 Burnaby, BC V5H 4N2 Telephone (604) 527-3600 Fax (604) 527-3636 Internet www.kpmg.ca INDEPENDENT AUDITORS
THE REGIONAL MUNICIPALITY OF NIAGARA CONSOLIDATED STATEMENT OF FINANCIAL POSITION
 CONSOLIDATED STATEMENT OF FINANCIAL POSITION As at December 31, 2017 (In thousands of dollars) 2017 2016 FINANCIAL ASSETS Cash $ 143,765 $ 102,524 Investments (note 2) $ 480,130 $ 438,585 Accounts receivable
LEDUC COUNTY CONSOLIDATED FINANCIAL STATEMENTS
 CONSOLIDATED FINANCIAL STATEMENTS Year Ended December 31, 2014 INDEPENDENT AUDITORS' REPORT To the Mayor and Council of Leduc County We have audited the accompanying financial statements of Leduc County,
Financial Statements. Calgary Roman Catholic Separate School District No. 1 August 31, 2016
 Financial Statements Calgary Roman Catholic Separate School District No. 1 RESPONSIBILITY FOR FINANCIAL REPORTING The accompanying financial statements of Calgary Roman Catholic Separate School District
Corporation of the Municipality of Red Lake Consolidated Financial Statements For the year ended December 31, 2017
 Corporation of the Municipality of Red Lake Consolidated Financial Statements For the year ended December 31, 2017 Contents Management's Responsibility for the Financial Statements 2 Independent Auditor's
The Finance & Technology Department recommend that Council approve the following:
 CORPORATE REPORT NO: R148 COUNCIL DATE: June 27, 2016 REGULAR COUNCIL TO: Mayor & Council DATE: June 10, 2016 FROM: General Manager, Finance & Technology FILE: 1880-20 SUBJECT: 2015 Statement of Financial
MD OF GREENVIEW NO. 16
 FINANCIAL STATEMENTS FOR THE YEAR ENDED DECEMBER 31, 2013 INDEPENDENT AUDITORS' REPORT To the Reeve and Council of MD of Greenview No. 16 We have audited the accompanying financial statements of MD of
TOWN OF DRUMHELLER Consolidated Financial Statements For the Year Ended December 31, 2014
 Consolidated Financial Statements For the Year Ended Index to Consolidated Financial Statements Year Ended INDEPENDENT AUDITORS REPORT 1 CONSOLIDATED FINANCIAL STATEMENTS Consolidated Statement of Financial
COMMUNITY SOCIAL SERVICES EMPLOYERS ASSOCIATION OF BRITISH COLUMBIA
 Financial Statements of COMMUNITY SOCIAL SERVICES EMPLOYERS ASSOCIATION OF BRITISH COLUMBIA KPMG LLP Metro Tower I 4710 Kingsway, Suite 2400 Burnaby BC V5H 4M2 Canada Telephone (604) 527-3600 Fax (604)
School District No. 36 (Surrey) June 30, 2015
 June 30, 2015") Financial Statements June 30, 2015 June 30, 2015 Table of Contents Management Report... 1 Independent Auditors' Report... 2-3 Statement of Financial Position - Statement 1... 4 Statement of Operations
Financial Statements June 30, 2015 June 30, 2015 Table of Contents Management Report... 1 Independent Auditors' Report... 2-3 Statement of Financial Position - Statement 1... 4 Statement of Operations
TOWN OF ECKVILLE. Consolidated Financial Statements and Independent Auditor's Report. December 31, 2012
 Consolidated Financial Statements and Independent Auditor's Report INDEPENDENT AUDITOR'S REPORT To the Members of Council of Town of Eckville Report on Financial Statements We have audited the accompanying
2011 Financial Statements
 2011 Financial Statements A Message from the Chief Financial Officer marked the completion of the District of West Kelowna s fourth full year of operation. Taxation is a major revenue source for the General
TORONTO AND REGION CONSERVATION AUTHORITY
 Financial Statements of TORONTO AND REGION CONSERVATION AUTHORITY KPMG LLP Vaughan Metropolitan Centre 100 New Park Place, Suite 1400 Vaughan ON L4K 0J3 Canada Tel 905-265-5900 Fax 905-265-6390 INDEPENDENT
net book value of the tangible capital assets is a low percentage of the total cost of the tangible capital assets May 5, 2017
 May 5, 2017 District of Oak Bay Warren Jones, Director of Corporate Services 2167 Oak Bay Avenue, Victoria BC V8R 1G2 electronic transmission Mayor in Council: Re: Funding Capital Projects through Reserve
City of Lacombe Consolidated Financial Statements For the year ended December 31, 2017
 Consolidated Financial Statements For the year ended Consolidated Financial Statements For the year ended Contents Auditors' Report 1 Consolidated Financial Statements Consolidated Statement of Financial
Financial Statements of VANCOUVER ECONOMIC COMMISSION
 Financial Statements of VANCOUVER ECONOMIC COMMISSION Year Ended December 31, 2017 1 KPMG LLP Metro Tower I 4710 Kingsway, Suite 2400 Burnaby BC V5H 4M2 Canada Telephone (604) 527-3600 Fax (604) 527-3636
Thorhild County Consolidated Financial Statements. December 31, 2015
 Consolidated Financial Statements December 31, 2015 Independent Auditors' Report To the Reeve and Councillors of : We have audited the accompanying consolidated financial statements of, which comprise
ST. MICHAEL'S CENTRE COMBINED FINANCIAL STATEMENTS 31 MARCH 2018
 COMBINED FINANCIAL STATEMENTS 31 MARCH 2018 Combined Financial Statements Contents Independent Auditors' Report Combined Statement of Financial Position 4 Combined Statement of Changes in Net Assets 5
Consolidated Financial Statements of CITY OF LANGFORD. Year ended December 31, 2009
 Consolidated Financial Statements of British Columbia Canada Municipal Council Mayor Councillors Stewart Young Denise Blackwell Matt Sahlstrom Lanny Seaton Winnie Sifert Lillian Szpak Roger Wade Municipal
The Corporation of the City of Victoria Financial Statements For the year ended December 31, 2017
 Financial Statements For the year ended Financial Statements For the year ended Contents Management's Responsibility for the Financial Statements 1 Independent Auditor's Report 2 Financial Statements Statement
Committee of the Whole Agenda
 1 Committee of the Whole Agenda The agenda for the Freestanding Committee of the Whole (Corporate Administration & Finance Committee - Budget) meeting to be held in the Council Chambers of the Municipal
Financial Statements. Trade Centre Limited March 31, 2015
 Financial Statements Trade Centre Limited MANAGEMENT S REPORT The financial statements have been prepared by management in accordance with Canadian public sector accounting standards and the integrity
NET TAXABLE RESIDENTIAL ASSESSED VALUES MUNICIPALITY INCREASE
 Village of Belcarra 2011 2015 Five Year Financial Plan Presentation ti Outline 1. Property Assessment Values 2. 2011 Municipal Revenues & Expenditures 3. 2011 2015 Financial Plan 4. Municipal Property
Motor Vehicle Parking
 Motor Vehicle Parking TransLink Tax Bulletin Bulletin 105 Issued by the South Coast British Columbia Transportation Authority (TransLink) under the South Coast British Columbia Transportation Authority
John Howard Society of the Central and South Okanagan Financial Statements For the year ended March 31, 2017
 Financial Statements For the year ended Contents Independent Auditor's Report 2 Financial Statements Statement of Financial Position 3 Statement of Operations 4 Statement of Changes in Net Assets (Debt)