BOARD OF DIRECTORS JOINT MEETING MONDAY, JULY 19, :00 AM 1201 EAST 7 TH AVENUE, 3RD FLOOR FLORIDA CONFERENCE ROOM AGENDA
|
|
|
- Alexina Carr
- 5 years ago
- Views:
Transcription


1 HILLSBOROUGH TRANSIT AUTHORITY & TAMPA HISTORIC STREETCAR INC. BOARD OF DIRECTORS JOINT MEETING MONDAY, JULY 19, :00 AM 1201 EAST 7 TH AVENUE, 3RD FLOOR FLORIDA CONFERENCE ROOM AGENDA DISCUSSION ITEMS a. HART FY2011 Proposed Streetcar Budget and Status of Endowment Fund ~ David Persaud b. Potential Revenue Enhancement And Cost Saving Opportunities ~ Olga Gonzalez ADJOURNMENT THE HART/THS BOARD PACKET IS AVAILABLE ON HART S WEBSITE AT
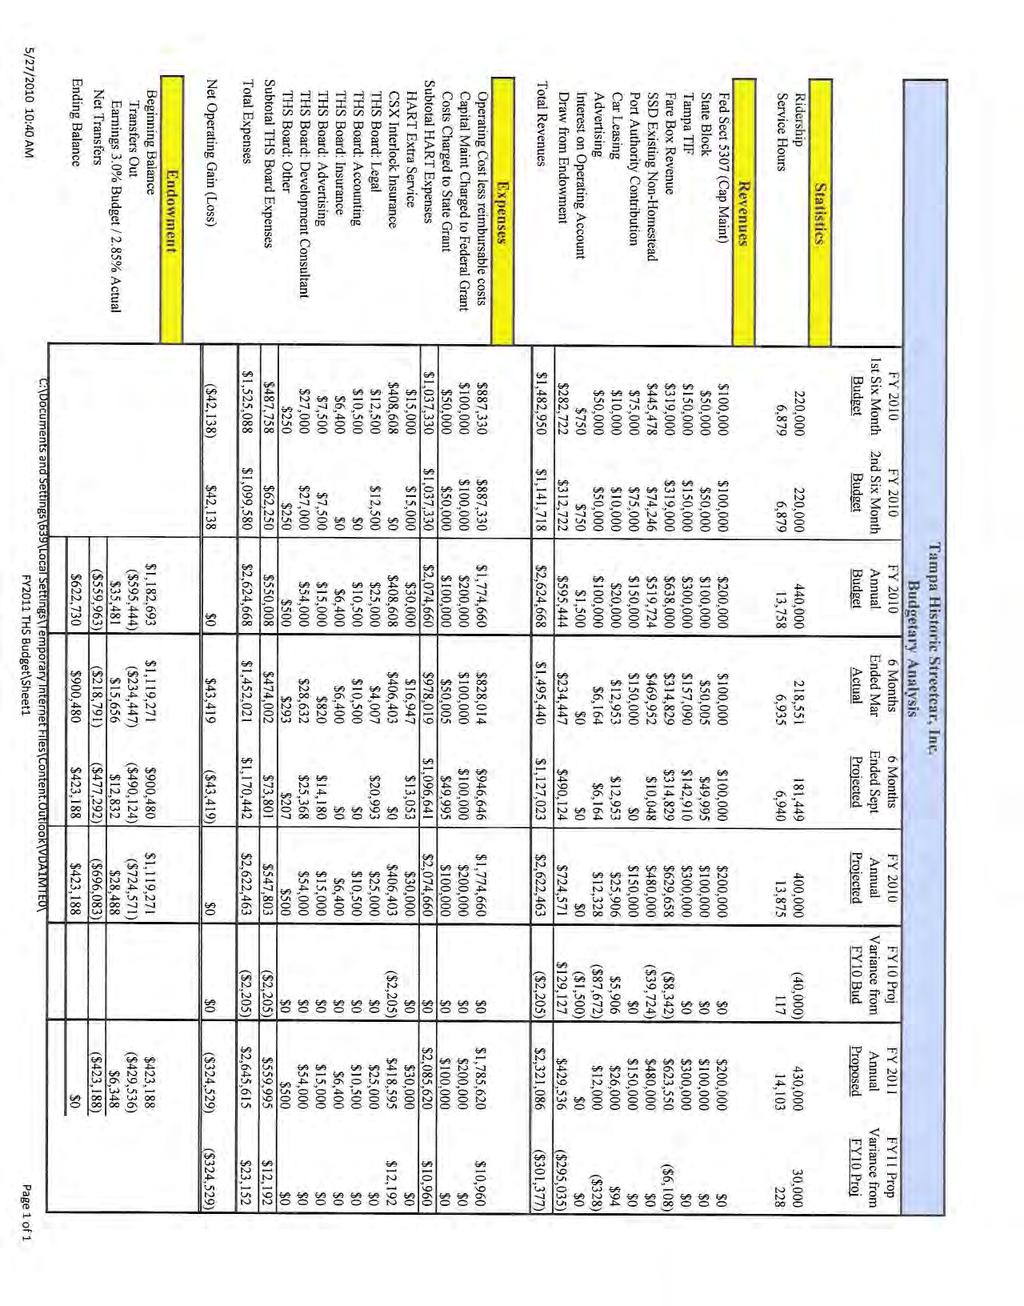
2 Hillsborough Transit Authority HART/THS Board of Directors Joint Meeting July 19, 2010 DISCUSSION ITEM HART FY2011 Proposed Streetcar Budget and Status of Endowment Fund The purpose of this report is to present the Board with HART FY2011 Proposed Streetcar Budget. DISCUSSION The HART FY2011 Proposed Streetcar Budget is being transmitted to the THS, Inc. Board members for review and discussion. The FY2011 Budget reflects $2,085,620 in operating expenses which is $10,960 or 0.5 percent over the FY2010 budget. Detailed narrative and budget variances are presented in the attached report. A companion report on the THS, Inc. FY2010 Budget-to-actual through March 31, 2010, is also presented with assumptions through September 30, 2010, and a projection for FY2011. These projections are based on HART staff assumption as described in the report with the Endowment being exhausted and a projected shortfall in FY2011 of $324,529. RECOMMENDATION The THS, Inc. Board reviews the budget and advises HART on the proposed budget for FY2011 compared to FY2010. Review the THS, Inc. financial projections for FY2011 and the projected deficit of $325,000 and the impact on funding the Streetcar operations for FY2011. Prepared by: David Persaud, Director of Finance Reviewed by: Brenda Mowen, Chief Administrative Officer Approved by: David Armijo, Chief Executive Officer Attachments: HART FY2011 Proposed Streetcar Budget HART Projections on THS, Inc. Operations and Endowment for FY2010 & FY2011.
3 ATTACHMENT I SECTION VI TECO LINE STREETCAR SYSTEM HART -- FY2011 & FY2012 Proposed Operating & Capital Budgets Page
. This chapter provides a description of the system, how it is funded, performance goals for FY2010 and both capital and operating plans for future years.")
4 HILLSBOROUGH TRANSIT AUTHORITY FY2011 & FY2012 BUDGETS STREETCAR SYSTEM OVERVIEW HART operates the TECO Line Streetcar System in Tampa, Florida, under contract with the Tampa Historic Streetcar, Inc. (THS, Inc.). This chapter provides a description of the system, how it is funded, performance goals for FY2010 and both capital and operating plans for future years. The first phase of the TECO Line Streetcar System began operation October 19, The streetcar system is an electrically powered rail transit system approximately 2.4 miles in length. The initial segment functions as a single-track, bidirectional system with passing tracks to permit the passing of vehicles traveling in opposite directions. The streetcar tracks do not share vehicle travel lanes, and are separated from traffic by low barriers, warning signs, pavement striping, and/or landscaping. At signalized intersections, a separate signal for the streetcar motormen is linked to the traffic control system. In late 2009 a planned.3 mile extension was begun which will take the streetcar system to the south side of downtown Tampa. The new extension will open by December of 2010 with its track extending from Dick Greco Plaza going North along Franklin Street and ending at Whiting Street. HART -- FY2011 & FY2012 Proposed Operating & Capital Budgets Page
5 Ybor Station Ybor Station (car barn) occupies the ground and mezzanine levels of the HART Raymond C. Miller building, the top floor is occupied by the HART administrative office. The streetcar facility includes a yard and support services for rolling stock maintenance and a base of operation for the streetcar system. The site is located in Ybor City on the block bounded by 6 th Avenue to the south, 13 th Street on the east, 7 th Avenue to the north, and Nuccio Parkway on the west. Ybor Station was designed to be constructed in phases. The first phase has sufficient capacity to accommodate the storage and maintenance of up to twelve streetcars. In addition to the yard and the building to support maintenance and operation of the system, the site includes a small park known as Rough Riders Park, and pedestrian improvements. The facility includes administrative offices, locker rooms, rest room facilities, storage space for supplies, an automatic vehicle wash system, two undercarriage work pits, hydraulic jacks, and equipment to maintain the fleet. Some heavy repairs are contracted out. HART owns a trailer to transport the vehicles when necessary for major maintenance and emergency evacuation. Dick Greco/Southern Transportation Plaza The Southern Transportation Plaza is an intermodal facility that provides access and connection among pedestrians, the streetcar system, HART buses (Route 96 In-Town Downtown Trolley, Route 97 Weekend Downtown Evening Shuttle), tour buses, and taxis. The facility is located on the southern half of the block (approximately) bounded by Old Waters Street to the south, Florida Avenue on the east, Channelside Drive to the north, and Franklin Street on the west directly in front of the Convention Center. The streetcar alignment crosses the site diagonally to allow for a later extension of the system north into the Central Business District (CBD). The design of this station stop differs from the other nine station stops in a number of ways. It is much larger due to its location and usage, and it includes bus bays and a taxi queuing area, extensive landscaping and pedestrian pathways, and space for vendors. Vehicles HART initially purchased eight historic Birney replica streetcars for the system. An additional replica Birney streetcar was received in A Gomaco replica Breezer streetcar was received in 2004 and purchased in The streetcars closely resemble the double-truck Birney or Breezer cars that operated in Tampa during the heyday of streetcar service. Each vehicle is approximately 46 feet long and 8 feet 6 inches wide. The vehicles are steel-framed with double, four-wheeled trucks and four 27-hp GE type traction motors mounted on MCB style trucks from ATM of Milan, Italy. The streetcars operate on 600 volts of direct current provided by an overhead power distribution system. Each vehicle weighs approximately 48,000 pounds and has a maximum operating speed of 30 miles per hour. The capacity of each vehicle is 44 seated, with space for 40 standing passengers. The system permits up to 7.5 minute headways, or a vehicle in each direction every 7.5 minutes. Currently, headways vary from 15 to 30 minutes, typically 15 and 20 minute headways are used. HART -- FY2011 & FY2012 Proposed Operating & Capital Budgets Page
6 STREETCAR OPERATION & RIDERSHIP HART manages and operates the TECO Line Streetcar System under a contract with Tampa Historic Streetcar, Inc. (THS) a nonprofit corporation formed by the City of Tampa. HART provides three types of service for the system. Each is defined and discussed below. Base Service is the day-to-day service frequency and hours of operation. The THS Board, in its original corporate business plan, established the service frequency and hours of operation for basic service as presented below. Hours of Service Service Frequency Sunday 12:00 pm to 8:00 pm every 20 minutes Monday 11:00 am to 10:00 pm every 20 minutes Tuesday 11:00 am to 10:00 pm every 20 minutes Wednesday 11:00 am to 10:00 pm every 20 minutes Thursday 11:00 am to 10:00 pm every 20 minutes Friday 11:00 am to 3:00 pm every 20 minutes 3:00 pm to 1:00 am* every 15 minutes 1:00 am to 2:00 am * every 30 minutes Saturday 9:00 am to 11:00 am every 30 minutes 11:00 am to 1:00 am* every 15 minutes 1:00 am to 2:00 am * every 30 minutes * am next day. This schedule results from trials of higher operating speeds and reduced car numbers (i.e. 2 cars 20 minute) and is sufficient for current and short-term projected patronage demand. Additional efficiencies may not be achieved until the streetcars' environment (road crossings, traffic signals, manual fare system) are transitioned. A higher operating speed and reduced number of cars translates into approximately 14,103 billable hours of service annually. Extra service is defined as service that exceeds the Base Service level. Extra service includes the use of additional vehicles to provide more capacity or increase service frequency to meet patronage requirements. Note: Assumes no operation on Thanksgiving and Christmas HART -- FY2011 & FY2012 Proposed Operating & Capital Budgets Page
7 SERVICE RATES PER VEHICLE HOUR SERVICE RATES FY2007 Actual FY2008 Actual FY2009 Actual FY2010 Budget FY2011 Proposed FY2012 Planned Base Service Rate $ $ $ $ $ $ Extra Service Rate (within Base Service $66.72 $76.97 $81.06 $74.64 $74.59 $76.13 Period) Extra Service Rate (outside Base $86.63 $99.09 $ $ $ $ Service Period) Special Service Rate $ $ $ $ $ $ (Does not include THS Profit) Base Service Cost Base Service Hours 17,204 17,256 13,780 13,758 14,103 14,103 Base Service Rate $ $ $ $ $ $ Base Service Cost to THS $2,204,693 $2,435,512 $1,996,171 $2,074,660 $2,085,620 $2,119,760 Credit of Revenue from Grant $300,000 $300,000 $300,000 $300,000 $300,000 $300,000 Total Cost to THS $1,904,693 $2,135,512 $1,696,171 $1,774,660 $1,785,620 $1,819,760 HART -- FY2011 & FY2012 Proposed Operating & Capital Budgets Page
8 Ridership Ridership for FY2009 was 462,461 boardings. Total FY 2010 Streetcar ridership through March 2010 averaged 36,425, down 22.4 percent from the comparable period in FY2009. FY 2009 ridership was greatly aided by Super Bowl XLIII. 90,000 80,000 70,000 60,000 50,000 40,000 30,000 20,000 10,000 0 Streetcar Ridership FY 2009 & FY 2010 Oct. Nov. Dec. Jan.* Feb. Mar. Apr. May June July Aug. Sept. *Super Bowl XLIII Jan FY 2009 FY 2010 Challenges and Opportunities in FY2011 Streetcar operations will be challenged with the potential of service reductions in order to manage the projected deficit in streetcar endowment funding. Several saving options have been identified and can be immediately implemented, such as reductions in headways, service hours and service days. Streetcar operations management staff will continue to explore all potential operational cost saving efficiencies. HART will be completing the 1/3 mile southern extension of the line to further travel into the CBD. Streetcar operations management staff will assist with this project as needed. With the extension scheduled to be complete in December 2010, HART anticipates an increase in ridership. FINANCIAL PLAN FOR OPERATIONS Assessment District - In February 2000, the City of Tampa created an assessment district that includes downtown Tampa, central business district, the Channel District and Ybor City to provide financial support for the operation of the streetcar system. The assessment district generated $596,986 in FY2009. The City of Tampa estimates collections of $519,724 for A new Special Assessment District formed in Channelside started with collections in To generate this revenue, all properties within the district that do not have a homeowner s exemption are taxed at a rate of one-third mil. These funds are collected by the City and then transferred to the not-for-profit corporation. HART -- FY2011 & FY2012 Proposed Operating & Capital Budgets Page
9 Endowment Fund - An endowment fund was created from funds generated from the termination of a little used people mover system, the sale of system naming rights, vehicle naming rights, station naming rights, and seats in the streetcars. Tampa Historic Streetcar, Inc. invests and manages the fund. Income derived from the fund is used to support the operation of the system. The fund had a balance of $1.248 million as of September 30, Fares - The Board of Tampa Historic Streetcar, Inc. sets the fare policy and HART as the contract operator collects the fares. Advertising - HART and THS administer the advertising program for the streetcar system. Each vehicle has space on the inside and designated vehicles on the outside to allow for advertising. Grants and Public Sector State, Federal grants and local funds were used to construct the system and purchase the streetcars. Additional grant funding is programmed for a proposed future extension. The streetcar system generates additional state and federal formula funding for HART, a portion of which is used to offset its operating cost. The Tampa Port Authority also contributes operating funds to the system. Service Policy Three types of service have been identified by the THS Board. Each is defined and discussed below. Base Service Base service is defined as the day-to-day service frequency and hours of operation. The approved annual Operation Budget defines the service frequency and hours of operation for basic service as approved by the THS Board. The Base Service Level is the basis for the Operation Budget. All anticipated functions, manpower needs, and direct and indirect costs in the budget are based on this service level. Extra Service Extra service is defined as service that exceeds the Base Service level. Extra Service includes the use of additional vehicles to provide more capacity or increase service frequency; or additional hours of service, either starting earlier or operating later than required to provide Base Service; or a combination of the two. The rate for this service within the Base Service hours and the rate for Extra Service outside of the Base Service hours are recalculated annually and approved as part of the annual operating budget. HART has been authorized by THS to run extra service for additional patronage at all times. If the extra service will require motormen to be scheduled in advance, HART is required to get authorization from the THS Board. Extra service is reported to the THS Board on a monthly basis. HART -- FY2011 & FY2012 Proposed Operating & Capital Budgets Page
10 Special Service Special service is defined as third-party sponsored service. Requests for service are made to HART; THS sets the rate for the service and receives payment. HART reports to the THS Board the number of streetcars used for the service, the length of the service, and the number of riders. The ability to provide service is dependent on the availability of vehicles. HART bills THS for Special Service at the fully allocated service rate (as required by the FTA for Charter Service) times the number of hours with a one hour minimum. In addition to HART s annually calculated cost to provide this service, THS adds a small profit. Base Hours STREETCAR HOURS OF SERVICE Base Rate Extra Service (Inside Rate) Extra Service (Outside Rate) Special 2003 Actual 16,358 $77.15 $43.69 $54.62 $ Actual 17,260 $94.55 $54.50 $67.00 $ Actual 17,212 $ $58.42 $71.82 $ Actual 17,204 $ $59.50 $72.73 $ Actual 17,204 $ $64.61 $90.59 $ Actual 17,256 $ $63.86 $91.96 $ Actual 13,780 $ $81.06 $ $ Budget 13,758 $ $74.64 $ $ Proposed 14,103 $ $76.13 $ $ Planned 14,103 $ $76.13 $ $ HART -- FY2011 & FY2012 Proposed Operating & Capital Budgets Page
11 STREETCAR RIDERSHIP AND FARE REVENUES Year Ridership % of Change Fare Revenue % of Change 2003 Actual 421, % $0 0.00% 2004 Actual 425, % $448, % 2005 Actual 434, % $451, % 2006 Actual 389, % $475, % 2007 Actual 437, % $607, % 2008 Actual 440, % $628, % 2009 Actual 462, % $652, % 2010 Budget 440, % $638, % 2011 Proposed 430, % $623, % 2012 Planned 450, % $659, % Operator s Agreement for the TECO Streetcar The agreement dated October 8, 2006, between HART and the Tampa Historic Streetcar, Inc. is for five (5) years and is scheduled to terminate on September 30, 2011 ( ). The City of Tampa, THS and HART are also parties to a Tri-Party Agreement dated October 1, 2001, (the Tri-Party Agreement). The Tri-Party Agreement contemplates that THS would engage a third party to operate the Streetcar System. THS has engaged HART as the operator of the Streetcar System. HART -- FY2011 & FY2012 Proposed Operating & Capital Budgets Page
12 HILLSBOROUGH TRANSIT AUTHORITY PROPOSED FY2011 SUMMARY BUDGET WITH FY2010 TO FY2011 CHANGES STREETCAR MODE FY2008 FY2009 Mar YTD FY2010 FY2010 FY2011 Change From FY2010 to FY2011 Actual Actual Actual Budget Proposed Dollar Percent Operating Revenues: Fare Revenues $446,137 $441,276 $212,921 $438,000 $432,930 ($5,070) -1.2% Pass Revenues $182,089 $211,069 $103,767 $200,000 $190,620 ($9,380) -4.7% Total Fare & Pass Revenues $628,226 $652,345 $316,688 $638,000 $623,550 ($14,450) -2.3% Advertising $450 $0 $0 $0 $0 $0 0.0% Other Income $2,435 $12,363 $1,767 $0 $0 $0 0.0% Total System Revenues $2,885 $12,363 $1,767 $0 $0 $0 0.0% Federal Operating Grants $200,000 $200,000 $100,000 $200,000 $200,000 $0 0.0% State Operating Grants $100,000 $100,000 $50,000 $100,000 $100,000 $0 0.0% Local Operating Grants $150,000 $150,000 $300,000 $300,000 $300,000 $0 0.0% Tampa Historic Streetcar $1,126,807 $902,835 $430,179 $836,660 $862,070 $25, % Total Operating Grants $1,576,807 $1,352,835 $880,179 $1,436,660 $1,462,070 $25, % Total Operating Revenues $2,207,918 $2,017,543 $1,198,634 $2,074,660 $2,085,620 $10, % Operating Expenses: Salaries $1,221,152 $1,164,931 $573,421 $1,064,870 $1,034,000 ($30,870) -2.9% Fringe Benefits $365,682 $367,258 $193,005 $346,200 $397,540 $51, % Fuel and Oil $2,446 $1,357 $1,021 $9,700 $8,700 ($1,000) -10.3% Parts and Supplies $186,493 $174,604 $43,517 $295,440 $295,040 ($400) -0.1% Operational Services $32,157 $25,047 $7,658 $26,650 $23,470 ($3,180) -11.9% Administrative Services $707 $6,398 $0 $10,000 $3,900 ($6,100) -61.0% Marketing and Printing $36,278 $33,282 $13,929 $50,000 $50,000 $0 0.0% HART -- FY2011 & FY2012 Proposed Operating & Capital Budgets Page
13 FY2008 FY2009 Mar YTD FY2010 FY2010 FY2011 Change From FY2010 to FY2011 Actual Actual Actual Budget Proposed Dollar Percent Insurance Costs $78,452 $56,479 $9,743 $81,000 $84,100 $3, % Utilities $167,776 $172,304 $63,348 $164,600 $161,900 ($2,700) -1.6% Taxes and Fees $0 $0 $0 $70 $0 ($70) % Other Expenses $26,953 ($5,474) $8,404 $26,130 $26,970 $ % Total Operating Expenses $2,118,096 $1,996,186 $914,046 $2,074,660 $2,085,620 $10, % Revenues over (Under) Expenses $89,822 $21,357 $284,588 $0 $0 $0 0.0% HART -- FY2011 & FY2012 Proposed Operating & Capital Budgets Page
14 HILLSBOROUGH TRANSIT AUTHORITY FY2011 & FY2012 BUDGETS SUMMARY OF REVENUES & EXPENSES FY2011 STREETCAR BUDGET Streetcar Revenues Fare & Pass Revenues Fare and pass revenue is expected to decrease by 2.3 percent or $14,450 under FY2010. THS, Inc. revenue is increasing $25,410 or 3 percent due to the Streetcar budget increase of $10,960. Streetcar Expenses Salaries Salaries expense is expected to decrease by 2.9 percent or $31,000 under FY2010. This decrease is primarily related to the cost of providing dispatch services. Fringe Benefits Fringe benefit expense is expected to increase by 15 percent or $51,000 over FY2010. This increase is primarily due to a 12 percent increase in insurance costs and funding for the Florida Retirement System of 10 percent. Parts and Supplies Parts and Supplies expense is expected to be flat as compared to FY2010. Operational Services Operational Services expense is expected to decrease by $3,180 over FY2010. Administrative Services Administrative Services expense is expected to decrease by $6,100 under FY2010. Marketing and Printing Marketing and Printing expense is expected to be flat as compared to FY2010. Utilities Utilities expense is expected to decrease by $2,700 under FY2010. HART -- FY2011 & FY2012 Proposed Operating & Capital Budgets Page
15 HILLSBOROUGH TRANSIT AUTHORITY STREETCAR OPERATIONS & MAINTENANCE BY FUNCTION Streetcar Management Maintenance & Engineering Administration Operations Administration Vehicle Maintenance Passenger Amenities and Facility Maintenance Transit Services Management Streetcar Vehicle Maintenance Streetcar Passenger Amenities Maintenance Streetcar Operations Streetcar Vehicle Servicing Streetcar Facility Maintenance Streetcar Motormen HART -- FY2011 & FY2012 Proposed Operating & Capital Budgets Page
16 **STREETCAR** Position Title FY2006 Budget FY2007 Budget FY2008 Budget FY2009 Budget FY2010 Budget FY2011 Proposed FY2012 Planned Manager of Streetcar Assistant Manager of Streetcar Administrative Assistant I Dispatcher Road Supervisor Conductor Motorman Generals Conductor Motorman Assistant Manager of Streetcar Maintenance Supervisor of Streetcar Maintenance Mechanics Facilities Maintenance Technicians General Maintenance Technicians Service Attendants TOTAL HART -- FY2011 & FY2012 Proposed Operating & Capital Budgets Page
17 HILLSBOROUGH TRANSIT AUTHORITY FY2011 & FY2012 BUDGETS STREETCAR TRENDS AND STATISTICS FY FY2012 STATISTICS FY 2005 ACTUAL FY 2006 ACTUAL FY 2007 ACTUAL FY 2008 ACTUAL FY 2009 ACTUAL FY 2010 BUDGET FY 2011 PROPOSED FY 2012 PLANNED Total Streetcar Miles 84,944 88,334 88,663 82,032 74,913 70,790 79,367 80,562 Revenue Streetcar Miles 83,709 87,496 87,147 81,856 74,604 70,567 78,631 79,755 Total Passengers (including PSA's and 434, , , , , , , ,000 Companions) Total Passengers Revenue $451,903 $539,845 $607,423 $628,226 $652,345 $638,000 $623,550 $659,080 Total System Revenue $1,771,721 $1,956,624 $634,546 $631,111 $664,708 $638,000 $623,550 $659,080 Total Operating Expenses $1,648,750 $1,947,470 $2,041,902 $2,118,096 $1,996,186 $2,074,660 $2,085,620 $2,119,760 Total Operating Subsidy ($122,971) ($9,154) $1,407,356 $1,486,985 $1,331,478 $1,436,660 $1,462,070 $1,460,680 RATIOS Operating Cost per Total Mile $19.41 $22.05 $23.03 $25.82 $26.65 $29.31 $26.28 $26.31 Operating Cost per Revenue Mile $19.70 $22.26 $23.43 $25.88 $26.76 $29.40 $26.52 $26.58 Passengers per Revenue Mile Operating Cost per Passenger $3.79 $5.00 $4.67 $4.81 $4.32 $4.72 $4.85 $4.71 Operating Subsidy per Passenger ($0.28) ($0.02) $3.22 $3.37 $2.88 $3.27 $3.40 $3.25 Average Passenger Fare $1.04 $1.38 $1.39 $1.43 $1.41 $1.45 $1.45 $1.46 Percentage of Operating Cost Recovered 27.4% 27.7% 29.7% 29.7% 32.7% 30.8% 29.9% 31.1% from Passenger Revenues Percentage of Operating Cost Recovered from Total System Revenues 107.5% 100.5% 31.1% 29.8% 33.3% 30.8% 29.9% 31.1% **Note: Includes all revenue for the System, including passenger fares, THS, Inc. reimbursement to the Authority, and miscellaneous income. HART -- FY2011 & FY2012 Proposed Operating & Capital Budgets Page
18 Revenue Recovery Ratio Streetcar per Contract with HART STREETCAR REVENUE RECOVERY Year Operating Fare Revenue Recovery Ratio Expenses 2004 Actual $1,439,960 $448, % 2005 Actual $1,648,750 $451, % 2006 Actual $1,947,470 $475, % 2007 Actual $2,041,902 $607, % 2008 Actual $2,118,096 $628, % 2009 Actual $1,996,186 $652, % 2010 Budget $2,074,660 $638, % 2011 Proposed $2, $623, % 2012 Planned $2,119,760 $659, % Category FY2007 FY 2008 STREETCAR Cash Fare $2.00 $2.50 Discount Cash Fare $1.00 $ Day Unlimited Ride $4.00 $ Day Unlimited Ride Discount $2.00 $ Day Unlimited Ride $9.75 $ Day Unlimited Ride Discount $8.00 $ Ride Pass $25.00 Annual Pass $ FARE STRUCTURE FOR FY2007 THROUGH FY2011 FY 2009 Effective 11/2/2008 FY2009 Change % over FY2008 FY 2010 No Changes FY2010 Change % over FY2009 FY 2011 No Changes FY2011 Change % over FY2010 HART -- FY2011 & FY2012 Proposed Operating & Capital Budgets Page
19 ATTACHMENT II
20
21 Hillsborough Transit Authority HART/THS Board of Directors Joint Meeting July 19, 2010 DISCUSSION ON POTENTIAL REVENUE ENHANCEMENT AND COST SAVING OPPORTUNITIES RECOMMENDED ACTION That the Hillsborough Area Regional Transit and TECO Historic Streetcar Board of Directors consider the following potential revenue enhancing and cost saving opportunities and staff direction as appropriate pursuant to this discussion. THS BUDGET SNAPSHOT HART staff has presented a balanced budget for the FY 2011 Streetcar Operating Budget; however a drop in fare and advertising revenues needs to be addressed for the upcoming budget cycle. A presentation of the THS Budget and Status of the Endowment Fund is part of this meeting agenda. Previously the THS Board implemented several changes to decrease expenditures which were put into place in July 2009 and the current proposed budget reflects those changes. Baselines have been lowered but no changes have been made since last July. Other potential changes to reduce costs could include trimming service back or going dark some days. REVENUE ENHANCEMENT OPTIONS The THS Board is in the process of exploring cross marketing opportunities with other businesses in the area to enhance revenue. At a June 9 meeting, THS Board met with representatives from Tampa Bay & Company and HDR Engineering, Inc, HART s marketing consultant firm to discuss opportunities to promote local attractions and offer public transportation options to area visitors. The Board has recently considered marketing opportunities via interactive kiosks and the internet and working with the visitor s bureau to promote the streetcar and other transit options to convention or conference attendees and event planners. ADVERTISING PLAN On June 16, the THS Board directed staff to coordinate with HDR, HART s advertising and marketing contractor, to develop an Advertising Plan for the streetcar. Staff recommends that THS continue to mirror HART in advertising policies for ease and convenience of crossmarketing, but will proceed as directed by the THS Board. HDR will develop an advertising plan for the six stations not currently named, the new station at Whiting and Franklin, the interior ad space on 9 cars, the two panel car topper available on 1 car, the front and back exterior available on 9 cars, and naming rights for 9 streetcars. HDR s
22 Hillsborough Transit Authority HART/THS Board of Directors Joint Meeting July 19, 2010 advertising plan will also include opportunities for cross promotion with area attractions and with promotions run on HART services. It is important to note that there are currently two streetcars with car topper advertising space and on May 19, the THS Board approved entering into a one-year contract with the Seminole Hard Rock Hotel and Casino for a two-panel car-topper advertisement in the amount of $13,500 thereby committing that ad space for one-year on one car. Request from THS to Allow Alcohol and/tobacco Advertising on Streetcar At its May 19, meeting, the THS Board of Directors passed a motion to formally request the HART Board of Directors to allow THS to adopt an advertising policy thereby allowing the THS Board to approve the advertising of alcohol and/or tobacco products on the streetcars as an income revenue generating source. This request was reported to the HART Board via the Chief Executive Officer s report on the June 7 Board Agenda, but no comments were received from the HART Board. As a bit of background the THS Board has engaged in several efforts to increase advertising revenues. The THS Board lately has discussed the possibility of advertising alcohol and tobacco products on the streetcars as a source to generate more income for the agency. In order for the THS Board to advertise alcohol and/or tobacco products on the streetcar, the specific approval from the HART Board of Directors is required. Prepared by: Olga Gonzalez, Manger of Executive Policy & Board Relations Reviewed by: Katharine Eagan, Chief of Service Development David Persaud, Director of Finance Approved by: David Armijo, Chief Executive Officer
Financial Report - FY 2017 Year to Date May 31, 2017
 Financial Report - FY 2017 Year to Date July 19, 2017 1 Major Highlights Revenue Sales tax remittances received through YTD April 2017 are 4.2% higher than YTD April 2016 Plaza Saltillo lease income budgeted
August 31, 2016 Financial Report
 August 31, 2016 Financial Report Capital Metropolitan Transportation Authority 10/14/2016 Table of Contents SUMMARY REPORTS Budgetary Performance - Revenue 2 - Sales Tax Revenue 6 - Operating Expenses
February 2016 Financial Report
 2016 February 2016 Financial Report Capital Metropolitan Transportation Authority 4/13/2016 Table of Contents SUMMARY REPORT Budgetary Performance - Revenue 2 - Sales Tax Revenue 5 - Operating Expenses
April 30, 2016 Financial Report
 2016 April 30, 2016 Financial Report Capital Metropolitan Transportation Authority 6/15/2016 Table of Contents SUMMARY REPORT Budgetary Performance - Revenue 2 - Sales Tax Revenue 6 - Operating Expenses
Westshore Circulator Study. Westshore Alliance Transportation Committee Meeting
 Westshore Circulator Study Westshore Alliance Transportation Committee Meeting November 14, 2012 Agenda Study Purpose Existing Conditions Analysis Needs Assessment Implementation Plan Study Purpose Explore
Executive Summary - Fiscal Year 2016 Valley Metro Rail Preliminary Annual Operating and Capital Budget
 Executive Summary - Fiscal Year 2016 Valley Metro Rail Preliminary Annual Operating and Capital Budget Valley Metro Rail, Inc. (VMR) is a public non-profit corporation whose members are the cities of Chandler,
METRO. Monthly Board Report. June 2006
 METRO Monthly Board Report Operating Capital Service Performance June 26 7/17/26 June 26 MONTHLY BOARD REPORT INDEX Section A Section B Section C Section D Section E Section F Section G Operating Budget
HART Financial Snapshot. HART Finance and Audit Committee January 23, 2017
 HART Financial Snapshot HART Finance and Audit Committee January 23, 2017 1 Requested January 3, 2017 Cash flow management overview Fund balance update including year end fund balance reported in the past
Cash & Liquidity The chart below highlights CTA s cash position at August 2018 compared to August 2017.
 To: Chicago Transit Authority Board From: Jeremy Fine, Chief Financial Officer Re: Financial Results for August 2018 Date: October 10, 2018 I. Summary CTA s financial results are favorable to budget for
METRO. Fiscal Year 2012 Monthly Board Report. September 2012 (Fourth Quarter Fiscal Year-to-Date)
") METRO Fiscal Year 2012 Monthly Board Report Revenue Expense Ridership Performance (Fourth Quarter Fiscal Year-to-Date) This report is based on a preliminary closing of the year-end financials for FY2012
METRO Fiscal Year 2012 Monthly Board Report Revenue Expense Ridership Performance (Fourth Quarter Fiscal Year-to-Date) This report is based on a preliminary closing of the year-end financials for FY2012
May 31, 2016 Financial Report
 2016 May 31, 2016 Financial Report Capital Metropolitan Transportation Authority 7/13/2016 Table of Contents SUMMARY REPORTS Budgetary Performance - Revenue 2 - Sales Tax Revenue 6 - Operating Expenses
METRO MONTHLY BOARD REPORT
 METRO Revenue Expenses Service Performance Fiscal Year FY2011 Table of Contents Section A Section B Section C Section D Section E Section F Section G Section H Summary Sales Tax Revenue Fare Revenue Operating
HILLSBOROUGH TRANSIT AUTHORITY FISCAL YEAR 2013 ADOPTED OPERATING & CAPITAL BUDGETS
 HILLSBOROUGH TRANSIT AUTHORITY FISCAL YEAR 2013 ADOPTED OPERATING & CAPITAL BUDGETS Table of Contents HART Board of Directors Page # Section I Preface Preparation... 1 FY2013 Budget Calendar... 2 Budget
METRO. Fiscal Year 2013 Monthly Board Report. December 2012 (First Quarter Fiscal Year-to-Date)
") METRO Fiscal Year 2013 Monthly Board Report Revenue Expense Ridership Performance (First Quarter Fiscal Year-to-Date) 1/14/2013 Table of Contents Section A Section B Section C Section D Section E Section
METRO Fiscal Year 2013 Monthly Board Report Revenue Expense Ridership Performance (First Quarter Fiscal Year-to-Date) 1/14/2013 Table of Contents Section A Section B Section C Section D Section E Section
Cash & Liquidity The chart below highlights CTA s cash position at June 2018 compared to June 2017.
 To: Chicago Transit Authority Board From: Jeremy Fine, Chief Financial Officer Re: Financial Results for June 2018 Date: August 15, 2018 I. Summary CTA s financial results are unfavorable to budget for
METRO. Fiscal Year 2013 Monthly Board Report. November 2012
 METRO Fiscal Year 2013 Monthly Board Report Revenue Expense Ridership Performance 12/13/2012 Table of Contents Section A Section B Section C Section D Section E Section F Section G Section H Section I
FY2014 Operating Budget Performance Report
 Finance & Administration Committee Information Item IV-C September 11, 2014 FY2014 Operating Budget Performance Report Washington Metropolitan Area Transit Authority Board Action/Information Summary Action
Cash & Liquidity The chart below highlights CTA s cash position at July 2016 compared to July 2015.
 To: Chicago Transit Authority Board From: Jeremy Fine, Chief Financial Officer Re: Financial Results for July 2016 Date: September 14, 2016 I. Summary CTA s financial results are $0.4 million favorable
METRO. Fiscal Year 2013 Monthly Board Report. January 2013
 METRO Fiscal Year 2013 Monthly Board Report Revenue Expense Ridership Performance 2/14/2013 Table of Contents Section A Section B Section C Section D Section E Section F Section G Section H Section I Section
QUALITY TRANSPORTATION SUMMARY
 QUALITY TRANSPORTATION SUMMARY Quality Transportation Overview... 126 Department of Transportation... 127 Traffic Field Operations... 129 Winston-Salem Transit Authority... 131 Quality Transportation Non-Departmental...
Budget Process Overview and Cost Allocation Methodology
 Budget Process Overview and Cost Allocation Methodology 1 Cost Allocation Agreement Guiding Principles Operate a consolidated regional public transportation system within and between the Participating
Financial Plan. Section 8 STATUS QUO PLAN STATUS QUO PLAN ASSUMPTIONS STATUS QUO PLAN BUDGET ITEMS
 Section 8 Financial Plan This final section of the TDP contains the financial information with regard to the improvements described in Section 7, Alternatives. The financial information is divided into
METRO. Fiscal Year 2014 Monthly Board Report. May 2014
 METRO Fiscal Year 2014 Monthly Board Report Revenue Expense Ridership Performance 7/11/2014 Table of Contents Section A Section B Section C Section D Section E Section F Section G Section H Section I Section
Cash & Liquidity The chart below highlights CTA s cash position at March 2018 compared to March 2017.
 To: Chicago Transit Authority Board From: Jeremy Fine, Chief Financial Officer Re: Financial Results for March 2018 Date: May 9, 2018 I. Summary CTA s financial results are $0.9 million favorable to budget
Cincinnati Streetcar: Options & Recommendations for Funding Operations
 Cincinnati Streetcar: Options & Recommendations for Funding Operations Table of Contents Background & Context... 3 Cincinnati Streetcar at a Glance... 4 Operating Model... 5 Operating Expenses: Estimates
METRO. Fiscal Year 2012 Monthly Board Report. December 2011 (First Quarter Fiscal Year-to-Date)
") METRO Fiscal Year 2012 Monthly Board Report Revenue Expense Ridership Performance (First Quarter Fiscal Year-to-Date) 1/27/2012 Table of Contents Section A Section B Section C Section D Section E Section
METRO Fiscal Year 2012 Monthly Board Report Revenue Expense Ridership Performance (First Quarter Fiscal Year-to-Date) 1/27/2012 Table of Contents Section A Section B Section C Section D Section E Section
FY 2011 and FY 2012 Operating Budget APRIL 6, 2010 SAN FRANCISCO, CALIFORNIA
 FY 2011 and FY 2012 Operating Budget APRIL 6, 2010 SAN FRANCISCO, CALIFORNIA Overview Original approved FY 2010 budget (April 2008) = $816.7M FY 2010 Approved Budget (April 2009) = $768.6M ($129M deficit
METRO. Fiscal Year 2015 Monthly Board Report. February 2015
 METRO Fiscal Year 2015 Monthly Board Report Revenue Expense Ridership Performance 4/2/2015 Table of Contents Section A Section B Section C Section D Section E Section F Section G Section H Section I Section
QUALITY TRANSPORTATION SUMMARY
 SUMMARY Transportation systems influence virtually every aspect of community life. They are the means for moving people, goods, and services throughout the community, and they play a significant role in
Cash & Liquidity The chart below highlights CTA s cash position at March 2017 compared to March 2016.
 To: Chicago Transit Authority Board From: Jeremy Fine, Chief Financial Officer Re: Financial Results for March 2017 Date: May 10, 2017 I. Summary CTA s financial results are $0.6 million favorable to budget
Operating Budget. Third Quarter Financial Report (July 2005 March 2006)
") Third Quarter Financial Report (July 2005 March 2006) INDEX A. Executive Summary...page 2 B. Revenue and Expense Analysis...page 3 C. Budget Variance Reports...page 14 D. Ridership and Performance Measures...page
Third Quarter Financial Report (July 2005 March 2006) INDEX A. Executive Summary...page 2 B. Revenue and Expense Analysis...page 3 C. Budget Variance Reports...page 14 D. Ridership and Performance Measures...page
METRO. Fiscal Year Monthly Performance Report. Revenue Expense Ridership Performance. November 2018 (Third Quarter Fiscal Year-to Date)
") METRO Fiscal Year 2019 Monthly Performance Report Revenue Expense Ridership Performance (Third Quarter Fiscal Year-to Date) 12/12/2018 Table of Contents Section A Section B Section C Section D Section
METRO Fiscal Year 2019 Monthly Performance Report Revenue Expense Ridership Performance (Third Quarter Fiscal Year-to Date) 12/12/2018 Table of Contents Section A Section B Section C Section D Section
1/31/2019. January 31, Item #1 CITIZENS PARTICIPATION
 January 31, 2019 Item #1 CITIZENS PARTICIPATION 1 Item #2 APPROVAL OF MINUTES Item #3 TRAC GOALS, FRAMEWORK & AGENDA REVIEW 2 COMMITTEE GOALS Learn about Southern Nevada s mobility challenges, new developments
The year to date is less than budget and prior year by 15.4 million and 11.6 million, respectively.
 To: Chicago Transit Authority Board From: Jeremy Fine, Chief Financial Officer Re: Financial Results for September 2016 Date: November 16, 2016 I. Summary CTA s financial results are $0.3 million unfavorable
Public Transportation Department Anchorage: Performance. Value. Results.
 Anchorage: Performance. Value. Results. Mission Serve Anchorage residents and visitors by providing public transportation that emphasizes quality, safety, cost effectiveness, and economic vitality. Core
Cash & Liquidity The chart below highlights CTA s cash position at January 2018 compared to January 2017.
 To: Chicago Transit Authority Board From: Jeremy Fine, Chief Financial Officer Re: Financial Results for January 2018 Date: March 14, 2018 I. Summary CTA s financial results are $1.7 million unfavorable
Total Operating Activities for FY17 are $56.9 million, an increase of $5.1M or 9.8% from FY16.
 FY17 ADOPTED ANNUAL OPERATING AND CAPITAL BUDGET Valley Metro Rail, Inc. (VMR) is a public non-profit corporation whose members are the cities of Chandler, Glendale, Mesa, Phoenix, and Tempe. VMR plans,
INVESTING STRATEGICALLY
 11 INVESTING STRATEGICALLY Federal transportation legislation (Fixing America s Surface Transportation Act FAST Act) requires that the 2040 RTP be based on a financial plan that demonstrates how the program
METRO. Fiscal Year Monthly Performance Report. Revenue Expense Ridership Performance. February 2018 (First Quarter Fiscal Year-to Date)
") METRO Fiscal Year 2018 Monthly Performance Report Revenue Expense Ridership Performance (First Quarter Fiscal Year-to Date) 3/12/2018 Table of Contents Section A Section B Section C Section D Section E
METRO Fiscal Year 2018 Monthly Performance Report Revenue Expense Ridership Performance (First Quarter Fiscal Year-to Date) 3/12/2018 Table of Contents Section A Section B Section C Section D Section E
Cash & Liquidity The chart below highlights CTA s cash position at December 2017 compared to December 2016.
 To: Chicago Transit Authority Board From: Jeremy Fine, Chief Financial Officer Re: Financial Results for December 2017 Date: February 14, 2018 I. Summary CTA s financial results are $4.7 million favorable
Operating Budget Stability
 Operating Budget Stability March Financial Update Report to Agenda Executive Summary March Performance Against FY16 Budget March Performance Against Same Period Last Year Appendix Financial Detail: March
Financial Report Fiscal Year 2018
 Financial Report Fiscal Year 2018 Year to Date July 31, 2018 Presented on September 17, 2018 1 Major Highlights Revenue FY2018 sales tax revenue budgeted at 2.5% growth over FY2017 Sales tax remittances
Capital Metropolitan Transportation Authority
 Capital Metropolitan Transportation Authority Monthly Performance Report (Covering Performance Data Through March and April 2010) Capital Metropolitan Transportation Authority 1 Performance Report Contents
Cash & Liquidity The chart below highlights CTA s cash position at September 2017 compared to September 2016.
 To: Chicago Transit Authority Board From: Jeremy Fine, Chief Financial Officer Re: Financial Results for September 2017 Date: November 15, 2017 I. Summary CTA s financial results are $7.7 million favorable
Public Transportation
 Municipal Manager Marketing & Customer Service Program Planning Transit Operations & Maintenance Transit Planning Transit Operations Para Transit Services Vehicle Maintenance Non-Vehicle Maintenance PT
METRO. Metro Funding. Associated Master Plan: Comprehensive Master Transportation Plan (MTP) for Arlington. Neighborhood(s):
 for Arlington. Neighborhood(s):") METRO METRO METRO 2017 2026 CIP Metro Funding Project Description The Washington Metropolitan Area Transit Authority (WMATA/Metro) is a unique federal-state-local partnership formed to provide mass transit
METRO METRO METRO 2017 2026 CIP Metro Funding Project Description The Washington Metropolitan Area Transit Authority (WMATA/Metro) is a unique federal-state-local partnership formed to provide mass transit
Jul Aug Sept Oct Nov Dec Jan Feb Mar Apr May Jun
 REVENUE AND RIDERSHIP 4th Quarter FY2014 REVENUE (in Millions) $90M $85M $80M $75M $70M $65M $60M $55M $50M 79 77 74 74 72 70 FY2013 Actual FY2014 Budget FY2014 Actual 79 85 78 78 77 67 66 70 59 67 65
Toronto Transit Commission
 CAPITAL BUDGET NOTES Toronto Transit Commission 2018 2027 CAPITAL BUDGET AND PLAN OVERVIEW The Toronto Transit Commission delivers transit services with an estimated 539.4 million riders in 2018, using
METRO. Fiscal Year 2015 Monthly Board Report. September 2015 (Fourth Quarter Fiscal Year-to-Date)
") METRO Fiscal Year 2015 Monthly Board Report Revenue Expense Ridership Performance (Fourth Quarter Fiscal Year-to-Date) This report is based on a preliminary closing of the year-end financials for FY2015
METRO Fiscal Year 2015 Monthly Board Report Revenue Expense Ridership Performance (Fourth Quarter Fiscal Year-to-Date) This report is based on a preliminary closing of the year-end financials for FY2015
Proposed FY2017 Budget Overview. HART Board of Directors June 6, 2016
 Proposed FY2017 Budget Overview HART Board of Directors June 6, 2016 Budget Overview The FY2017 Proposed Operating and Capital Budget is balanced at $91,581,278 $6,921,453 higher, or 8.18% more than the
Washington Metropolitan Area Transit Authority Metro Budget Overview
 Washington Metropolitan Area Transit Authority Metro Budget Overview February 2011 Metro 10,877 Employees (10,974 budgeted) 1,491 Buses 588 Escalators and 237 Elevators 106 Miles of Track 92 Traction Power
BUDGETWATCH October 2018 Flash Report
 October 2018 Flash Report Overall Latest Condition (reporting on operations through September and subsidies through October): Passenger Revenues were slightly below the Forecast in September, marginally
OSU INSTITUTE OF TECHNOLOGY POLICY & PROCEDURES. A. provide a framework for safe and efficient travel while on official university business, and
 Travel 3-023 FISCAL SERVICES June 2016 POLICY 1.01 The purpose of this policy is to: A. provide a framework for safe and efficient travel while on official university business, and B. ensure university
METRO. Fiscal Year 2017 Monthly Performance Report. Revenue Expense Ridership Performance. October 2016
 METRO Fiscal Year 2017 Monthly Performance Report Revenue Expense Ridership Performance 11/18/2016 Table of Contents Section A Section B Section C Section D Section E Section F Section G Section H Section
REVISED AGENDA Regular Meeting of the Board of Directors
 REVISED AGENDA Regular Meeting of the Board of Directors Thursday, March 14, 2013, 7:00 pm NOTE: Times listed for Agenda Items are estimates only. Actual times may vary substantially dependent on circumstances.
FY2017 Year-End Financial Update
 Finance Committee Information Item III-A September 14, 2017 FY2017 Year-End Financial Update Washington Metropolitan Area Transit Authority Board Action/Information Summary Action Information MEAD Number:
FY2018 Third Quarter Financial Update
 Finance and Committee Information Item IV-A May 10, 2018 Third Quarter Financial Update Page 30 of 53 Washington Metropolitan Area Transit Authority Board Action/Information Summary Action Information
Power Accountants Association Annual Meeting Potential Impacts from Oct 2015 Rate Change
 Power Accountants Association Annual Meeting Potential Impacts from Oct 2015 Rate Change Material Provided by: Chris Mitchell Chris Mitchell Management Consultants (CMMC) mail@chrismitchellmc.com 5/14/2015
Cash & Liquidity The chart below highlights CTA s cash position at February 2017 compared to February 2016.
 To: Chicago Transit Authority Board From: Jeremy Fine, Chief Financial Officer Re: Financial Results for February 2017 Date: April 5, 2017 I. Summary CTA s financial results are $0.3 million favorable
Operating Budget. Second Quarter Financial Report
 Second Quarter Financial Report INDEX A. Executive Summary... A-1 B. Revenue and Expense Analysis... B-1 C. Budget Variance Reports... C-1 D. Ridership and Performance Measures... D-1 Board Budget Committee
CITY OF LOS ANGELES INTER-DEPARTMENTAL CORRESPONDENCE
 CITY OF LOS ANGELES INTER-DEPARTMENTAL CORRESPONDENCE DATE: TO: Honorable City Council c/o City Clerk, Room 395, City Hall Attention: Honorable Nury Martinez, Chair, Energy and the Environment Committee
Capital Metropolitan Transportation Authority Monthly Performance & Financial Report For Period Ending October 31, 2012 Soft Close
 Capital Metropolitan Transportation Authority Monthly Performance & Financial Report For Period Ending October 31, 2012 Soft Close Table of Contents SUMMARY REPORT Financial Performance -Sales Tax 3 -Other
2018 Regional Transportation Improvement Program: Amendment No. 1
 2018 Regional Transportation Improvement Program: Amendment No. 1 Transportation Committee Item 4 January 18, 2019 Summary of Changes 2 Transportation Committee Item 4 January 18, 2019 1 RTIP Project Tables
Chapter 4: Available Funds and Financial Scenarios
 Funding the Plan Federal and State requirements say that a Long Range Transportation Plan (LRTP) must include a financial plan. The financial plan must indicate resources from public and private sources
FY19 Budget - Discussion. April 2018
 FY19 Budget - Discussion April 2018 FY19 Proposed Budget: $6.6 Billion General Planning & Programs 3% Identify regional mobility needs and solutions Debt Service 6% Obligations from current and past projects
Federal Assistance 13% Charges for Services 5% Appropriated Fund Balance.5% Other 3% Administration 6% Building Maintenance 3% Other 2%
 TRANSIT FUND The Transit Fund is used to account for the operations of the Town s public transit system. Federal Assistance 13% Transit Revenues State Assistance 12% Charges for Services 5% Appropriated
Budget Performance in Millions of Dollars Favorable/Unfavorable to Budget. Suburban Suburban
 v System Status Budget Performance in Millions of Dollars Favorable/Unfavorable to Budget 6 4 2 0-2 -4-6 -8 Suburban Suburban Suburban ADA Suburban ADA ADA ADA Revenue Expenses Funding Required Net Funding
Strategic Plan Progress Report Goal 2 Focus. July 2015 San Francisco, California
 Strategic Plan Progress Report Goal 2 Focus July 2015 San Francisco, California 1 Goal 2 focus Make transit, walking, bicycling, taxi, ridesharing and carsharing the preferred means of travel Objective
MEETING DATE: November 17, SUBJECT: 2005 Wheel-Trans Operating Budget
 MEETING DATE: November 17, 2004 SUBJECT: 2005 Wheel-Trans Operating Budget RECOMMENDATION It is recommended that the Commission approve: 1/ The 2005 Wheel-Trans Operating Budget of $53.1 million provided
Arlington County, Virginia
 Arlington County, Virginia METRO METRO 2015 2024 CIP Metro Funding Project Description The Washington Metropolitan Area Transit Authority (WMATA/Metro) is a unique federal-state-local partnership formed
Operations & Finance Committee Meeting Agenda
 Operations & Finance Committee Meeting Agenda Nashville MTA Committee Meetings Music City Central Meeting Room 400 Charlotte Ave., Nashville, TN 37219 Thursday, February 22, 2018 The Operations & Finance
POLICIES AND PROCEDURES FOR THE ISSUANCE OF PORT HUENEME FILMING AND STILL PHOTOGRAPHY PERMITS
 POLICIES AND PROCEDURES FOR THE ISSUANCE OF PORT HUENEME FILMING AND STILL PHOTOGRAPHY PERMITS The guidelines and information contained herein is taken from the Port Hueneme's Municipal Ordinance and City
Financial Report Fiscal Year 2018
 Financial Report Fiscal Year 2018 Year to Date December 31, 2017 Presented on February 14, 2018 1 Major Highlights Revenue FY2018 sales tax revenue budgeted at 2.5% growth over FY2017 Sales tax remittances
TSCC Budget Review TriMet
 TSCC Budget Review 2017-18 TriMet 1. Introduction to the District: The Tri-County Metropolitan Transportation District (TriMet) boundary covers about 575 square miles of the urban portions of Multnomah,
Public Transportation
 Municipal Manager Administration Marketing and Customer Service Program Planning Transit Operations and Maintenance Transit Planning Transit Operations Para Transit Services Vehicle Maintenance Non-Vehicle
PINELLAS SUNCOAST TRANSIT AUTHORITY KEY BUDGET ASSUMPTIONS FOR FISCAL YEAR 2016
 PINELLAS SUNCOAST TRANSIT AUTHORITY KEY BUDGET ASSUMPTIONS FOR FISCAL YEAR 2016 PSTA Budget Forecasting Summary Item Assumption Amount Source 3 Yr. Avg. FY2016 FY2017 FY2018 FY2019 FY2020 Revenues FY15
Public Transit Services Summary of Submitted 2015 Budget From Rates
 Public Transit Services Summary of Submitted 2015 From Rates Service Expense 2014 2015 Revised Draft Non Tax Revenue Net Tax Supported Expense Non Tax Revenue Net Tax Supported Increase / (Decrease) Over
Revised. April Travel Policy
 Revised April 2016 Travel Policy Research Foundation for Mental Hygiene, Inc. Travel Policy The Research Foundation for Mental Hygiene, Inc. (Foundation) reimburses most, but not necessarily all, the costs
Toronto Transit Commission
 OPERATING PROGRAM SUMMARY Contents Overview I: 2015 2017 Service Overview and Plan 7 II: 2015 Budget by Service 12 III: Issues for Discussion 36 Toronto Transit Commission 2015 OPERATING BUDGET OVERVIEW
Audit and Finance Subcommittee
 MEETING OF THE Audit and Finance Subcommittee MEETING DATE February 9, 2017 TIME LOCATION 11:00 a.m. Valley Metro 101 N. 1st Ave., 10th Floor Lake Mead Conference Room (10B) Phoenix, AZ 85003 VALLEY METRO
CHAPTER 6: COST ESTIMATES
 CHAPTER 6: COST ESTIMATES 115 116 UNION STATION GEORGETOWN: ALTERNATIVES ANALYSIS for PREMIUM TRANSIT SERVICE The Recommended Alternative could be designed and constructed under a number of financing options.
General Policy - Reimbursement of Expenses for Travel
 General Policy - Reimbursement of Expenses for Travel Policy: College employees are authorized to receive a reimbursement for travel expenses incurred while on official College business. Authorization
Transit Development Plan (FY ) Executive Summary
 Executive Summary") Transit Development Plan (FY 2019-2028) Executive Summary December 2018 TABLE OF CONTENTS Introduction... 1 System Profile... 2 Public Outreach... 4 Key Findings/Direction... 5 Implementation Plan... 6
Transit Development Plan (FY 2019-2028) Executive Summary December 2018 TABLE OF CONTENTS Introduction... 1 System Profile... 2 Public Outreach... 4 Key Findings/Direction... 5 Implementation Plan... 6
MEMORANDUM OF AGREEMENT
 MEMORANDUM OF AGREEMENT made as of the 9 th day of June 2006 BETWEEN: HER MAJESTY THE QUEEN, in right of Alberta ( Alberta ), as represented by the Minister of Infrastructure and Transportation ( Minister
FY 2013 and FY 2014 Proposed Operating Budget An Investment in Maintenance. April 3, 2012 SAN FRANCISCO, CALIFORNIA
 FY 2013 and FY 2014 Proposed Operating An Investment in Maintenance April 3, 2012 SAN FRANCISCO, CALIFORNIA Introduction FY 2013-2014 Proposed Operating Revenues Expenditures An investment in maintenance
Financial Report Fiscal Year 2018
 Financial Report Fiscal Year 2018 Year to Date March 31, 2018 Presented on May 21, 2018 1 Major Highlights Revenue FY2018 sales tax revenue budgeted at 2.5% growth over FY2017 Sales tax remittances received
Toronto Transit Commission
 OPERATING ANALYST NOTES Contents Overview & Recommendations I: 2015 2017 Service Overview and Plan 6 II: 2015 Recommended Budget by Service 11 III: Issues for Discussion 35 Toronto Transit Commission 2015
CN I&T Vendors Travel and Expense Policy and Guidelines for Consultants
 CN I&T Vendors Travel and Expense Policy and Guidelines for Consultants Version AUGUST 2018 Table of Contents Expenses (Travel and other)..... 2-5 Invoicing........6 AUGUST 2018 P a g e 1 The following
New York City Transit
 New York City Transit MTA New York City Transit 2008 Preliminary Budget July Financial Plan 2008 2011 MISSION STATEMENT The mission of MTA New York City Transit is to provide customers with safe, reliable
Final Report June 1, 2012 San Francisco Municipal Transportation Agency (SFMTA) 2012 Budget Balancing Panel
 2012 Budget Balancing Panel") Panel Deliverables Final Report June 1, 2012 1. Develop a priority list of recommendations to address the balancing of the FY 2013 and FY 2014 Operating Budget. 2. Developed a priority list of recommendations
Panel Deliverables Final Report June 1, 2012 1. Develop a priority list of recommendations to address the balancing of the FY 2013 and FY 2014 Operating Budget. 2. Developed a priority list of recommendations
For Action. TTC 15-Year Capital Investment Plan & Capital Budget & Plan. Summary
 For Action TTC 15-Year Capital Investment Plan & 2019 2028 Capital Budget & Plan Date: January 24, 2019 To: TTC Board From: Chief Financial Officer Summary The purpose of this report is to 1. Submit for
Financial Management Report... 3
 November 13, 2013 Table of Contents Financial Management Report... 3 OPERATING FUNDS STATEMENT OF REVENUES & EXPENSES... 3 METROPOLITAN COUNCIL INVESTMENT PERFORMANCE SHORT-TERM PORTFOLIO... 4 METROPOLITAN
VIIl. Agency Financial Plans and 12-Month Allocations
 VIIl. Agency Financial Plans and 12-Month Allocations New York City Transit MTA NEW YORK CITY TRANSIT FEBRUARY FINANCIAL PLAN FOR 2006-2009 2005 FINAL ESTIMATE AND ADOPTED BUDGET FOR 2006 In accordance
HORRY COUNTY TRAVEL POLICY AND PROCEDURES MANUAL
 HORRY COUNTY TRAVEL POLICY AND PROCEDURES MANUAL Effective October 1, 2008 Updated for revised per diem rates effective July 1, 2012 as per Budget Ordinance 25-12 Updated for exclusion of day trip meal
RMTA FY2016 Annual Traffic and Toll Revenue Report
 RMTA Richmond Metropolitan Transportation Authority RMTA RMTA FY216 Annual Traffic and Report Richmond Metropolitan Transportation Authority August 216 Final Report RMTA FY216 Annual Traffic and Report
METRO. Fiscal Year Monthly Performance Report. Revenue Expense Ridership Performance. May 2018 (Second Quarter Fiscal Year-to Date)
") METRO Fiscal Year 2018 Monthly Performance Report Revenue Expense Ridership Performance (Second Quarter Fiscal Year-to Date) 6/12/2018 Table of Contents Section A Section B Section C Section D Section
METRO Fiscal Year 2018 Monthly Performance Report Revenue Expense Ridership Performance (Second Quarter Fiscal Year-to Date) 6/12/2018 Table of Contents Section A Section B Section C Section D Section
V E H I C L E U S E POL I C I E S AND PROC E D U R E S LAWRENCE UNIVERSITY
 V E H I C L E U S E POL I C I E S AND PROC E D U R E S LAWRENCE UNIVERSITY Vehicle Policies and Procedures The goal of this document is to ensure the safety of Lawrence University employees and students
FIRST PUBLIC HEARING ON TENTATIVE FISCAL YEAR 2016 MILLAGE RATE AND ANNUAL BUDGET AND REGULAR BOARD OF DIRECTORS MEETING
 FIRST PUBLIC HEARING ON TENTATIVE FISCAL YEAR 2016 MILLAGE RATE AND ANNUAL BUDGET AND REGULAR BOARD OF DIRECTORS MEETING Monday, September 14, 2015, 5:30 PM Florida Conference Room HART Administrative
Strategic Plan Progress Report Goal 3 Focus. June 2014 San Francisco, California
 Strategic Plan Progress Report Goal 3 Focus June 2014 San Francisco, California 1 Goal 3 focus Improve the environment and quality of life in San Francisco Objective 3.1 Reduce the Agency s and the transportation
SOUND TRANSIT STAFF REPORT MOTION NO. M D Street-to-M Street Track & Signal Project Preferred Alternative
 SOUND TRANSIT STAFF REPORT MOTION NO. M2007-126 D Street-to-M Street Track & Signal Project Preferred Alternative Meeting: Date: Type of Action: Staff Contact: Phone: Board 12/13/07 Discussion/Possible