VERSION 1.0 SAR COST VARIANCE INSTRUCTIONS Defense Acquisition Management Information Retrieval (DAMIR)
|
|
|
- Amberly Norman
- 6 years ago
- Views:
Transcription


 802-8400 CACI International Inc, 1100 N. Glebe Rd.")
1 Department of Defense Office of the Under Secretary of Defense for Acquisition, Technology & Logistics Acquisition Resources and Analysis/Acquisition Management VERSION 1.0 SAR COST VARIANCE INSTRUCTIONS Defense Acquisition Management Information Retrieval (DAMIR) Prepared for: Mark Kryzco Acting Deputy Director, Enterprise Information & OSD Studies Elizabeth Flaharty DAMIR Program Manager Submitted by: CACI International, Inc Park Meadow Drive Chantilly, VA (703) CACI International Inc, 1100 N. Glebe Rd., Arlington, VA USA Copyright All rights reserved. CACI is a registered trademark.
2 Change History Date Revision Change Description 12/15/2009 Original Initial release of this document 01/08/ Changed Heading fonts to Verdana 12/14/ Removed special characters from headers & added reference to Purview 02/02/ Updated (recapture all screens) to reflect changes of DAMIR /14/ Updated to reflect changes for DAMIR 4.3 1
3 TABLE OF CONTENTS 1. INTRODUCTION TO COST VARIANCE PURPOSE OF COST VARIANCE DOCUMENT SECURITY ACRONYMS AND ABBREVIATIONS GENERAL GUIDANCE FOR COST VARIANCE OVERVIEW OF COST VARIANCE ANNUAL AND QUARTERLY SARS Annual SARs Quarterly SARs Joint Program SARs RDT&E Only SARs SAR BASELINE ADDITIONAL SAR GUIDANCE NAVIGATING TO COST VARIANCE OF A SAR DAMIR PORTAL (PRIMARY AREA) DATA COLLECTION AREA SELECT A PROGRAM INITIALIZATION SCREEN Initialize a New SAR Editing a SAR INITIAL SAR SCREEN SECTION ACCESS LINKS SECTION INSTRUCTIONS Hide Button Show Button Hide All Button Show All Button DISCUSSION SUMMARY NAVIGATING AWAY FROM DATA ENTRY SCREEN COST VARIANCE SECTION COST VARIANCE SUMMARY COST VARIANCE SUMMARY TIPS COST VARIANCE DETAIL REPORTS COMPUTATIONAL MODEL COMMAND CENTER - RDT&E TY COMPUTATIONAL MODEL COMMAND CENTER - RDT&E BY COMPUTATIONAL MODEL COMMAND CENTER - PROCUREMENT TY COMPUTATIONAL MODEL COMMAND CENTER - PROCUREMENT BY COMPUTATIONAL MODEL COMMAND CENTER - MILCON TY COMPUTATIONAL MODEL COMMAND CENTER - MILCON BY COMPUTATIONAL MODEL COMMAND CENTER - OPERATIONS & MAINTENANCE TY COMPUTATIONAL MODEL COMMAND CENTER - OPERATIONS & MAINTENANCE BY TOTAL VARIANCE FOR - RDT&E TY TOTAL VARIANCE FOR - RDT&E BY TOTAL VARIANCE FOR - PROCUREMENT TY TOTAL VARIANCE FOR - PROCUREMENT BY TOTAL VARIANCE FOR - MILCON TY
4 6.14 TOTAL VARIANCE FOR - MILCON BY TOTAL VARIANCE FOR - OPERATIONS & MAINTENANCE TY TOTAL VARIANCE FOR - OPERATIONS & MAINTENANCE BY ECONOMIC VARIANCE DETAIL FOR - RDT&E TY ECONOMIC VARIANCE DETAIL FOR - PROCUREMENT TY ECONOMIC VARIANCE DETAIL FOR - MILCON TY ECONOMIC VARIANCE DETAIL FOR - OPERATIONS & MAINTENANCE TY QUANTITY-SCHEDULE VARIANCE DETAIL Procurement Quantity Variance - Main Procurement Quantity Variance TY Procurement Quantity Variance BY COST-QUANTITY CURVES Cost-Quantity Curves Best Fit Information Cost-Quantity Curves Graph PCE & SAR Baseline Cost-Quantity Curve Data QUANTITY ALLOCATION REPORTS PROCUREMENT SCHEDULE VARIANCE SUPPORT VARIANCE DETAIL REPORTS Initial Spares for Appropriation 2032 TY $M Initial Spares for Appropriation 2032 BY $M Other Support for Appropriation 2032 TY $M Other Support for Appropriation 2032 BY $M ADDITIONAL USER PROVIDED COST VARIANCE DETAIL FOR SAR Procurement Quantity Variances and Explanations Schedule Quantity Variances and Explanations DISCUSSION DATA ENTRY CHANGE EXPLANATIONS SAR REVIEW Change Summary Current Change Explanations COMPUTATIONAL MODEL RDT&E COMMAND CENTER RDT&E Total Variance RDT&E Economic Variance RDT&E Quantity Variance RDT&E Schedule Variance RDT&E Engineering Variance RDT&E Other Variance RDT&E Support Variance RDT&E Estimating Variance PROCUREMENT COMMAND CENTER Procurement Total Variance Procurement Economic Variance Procurement Quantity Variance Procurement Cost-Quantity Data Link Procurement Cost-Quantity Curves Link Procurement Quantity Variance Link Procurement Quantity Allocations Link Procurement Manual Qty/Sched Overrides Link Procurement Additional Quantity Variance Link Procurement Schedule Variance Link
5 Procurement Additional Schedule Variance Link Procurement Schedule Variance Procurement Engineering Variance Procurement Other Variance Procurement Support Variance Edit Procurement Support Variance Procurement Estimating Variance MILCON COMMAND CENTER MILCON Total Variance MILCON Economic Variance MILCON Schedule Variance MILCON Engineering Variance MILCON Other Variance MILCON Estimating Variance ACQUISITION O&M COMMAND CENTER Acq O&M Total Variance Acq O&M Economic Variance Acq O&M Schedule Variance Acq O&M Engineering Variance Acq O&M Other Variance Acq O&M Estimating Variance APPENDIX A INSTRUCTION SCREENS A.1 COST VARIANCE SUMMARY INSTRUCTIONS A.2 CHANGE EXPLANATIONS INSTRUCTIONS A.3 COMMAND CENTER INSTRUCTIONS A.4 TOTAL VARIANCE INSTRUCTIONS A.5 ECONOMIC VARIANCE INSTRUCTIONS A.6 QUANTITY VARIANCE INSTRUCTIONS A.7 SCHEDULE VARIANCE INSTRUCTIONS A.8 ENGINEERING VARIANCE INSTRUCTIONS A.9 OTHER VARIANCE INSTRUCTIONS A.10 SUPPORT VARIANCE INSTRUCTIONS A.11 ESTIMATING VARIANCE INSTRUCTIONS A.12 PROCUREMENT QUANTITY & SCHEDULE VARIANCE INSTRUCTIONS A.13 PROCUREMENT COST QUANTITY DATA INSTRUCTIONS A.14 PROCUREMENT COST QUANTITY CURVE INSTRUCTIONS A.15 PROCUREMENT QUANTITY VARIANCE INSTRUCTIONS A.16 PROCUREMENT QUANTITY ALLOCATIONS INSTRUCTIONS A.17 PROCUREMENT MANUAL QUANTITY/SCHEDULE OVERRIDE INSTRUCTIONS A.18 PROCUREMENT ADDITIONAL QUANTITY VARIANCE INSTRUCTIONS A.19 PROCUREMENT SCHEDULE VARIANCE INSTRUCTIONS A.20 PROCUREMENT ADDITIONAL SCHEDULE VARIANCE INSTRUCTIONS APPENDIX B ERROR MESSAGES B.1 CRITICAL MESSAGES B.2 WARNING MESSAGES B.3 INFORMATIONAL MESSAGES INDEX
6 TABLES TABLE 1 - ACRONYMS AND ABBREVIATIONS... 1 TABLE 2 - INITIALIZE SAR OPTIONS TABLE 3 - EDIT SAR OPTIONS TABLE 4 - COST VARIANCE SUMMARY FIELDS TABLE 5 DISCUSSION FIELD TABLE 6 - CHANGE EXPLANATION FIELDS TABLE 7 RDT&E COMMAND CENTER FIELDS TABLE 8 RDT&E BASE-YEAR FIELDS TABLE 9 - RDT&E TOTAL VARIANCE FIELDS TABLE 10 - RDT&E ECONOMIC VARIANCE FIELDS TABLE 11 - RDT&E QUANTITY VARIANCE FIELDS TABLE 12 - RDT&E SCHEDULE VARIANCE FIELDS TABLE 13 - RDT&E ENGINEERING VARIANCE FIELDS TABLE 14 - RDT&E OTHER VARIANCE FIELDS TABLE 15 - RDT&E SUPPORT VARIANCE FIELDS TABLE 16 - RDT&E ESTIMATING VARIANCE FIELDS TABLE 17 - PROCUREMENT COMMAND CENTER FIELDS TABLE 18 - PROCUREMENT BASE-YEAR FIELDS TABLE 19 - PROCUREMENT TOTAL VARIANCE FIELDS TABLE 20 - PROCUREMENT ECONOMIC VARIANCE FIELDS TABLE 21 - PROCUREMENT QUANTITY & SCHEDULE VARIANCE FIELDS TABLE 22 - COST-QUANTITY DATA FIELDS TABLE 23 - COST-QUANTITY CURVES FIELDS TABLE 24 - QUANTITY VARIANCE FIELDS TABLE 25 - QUANTITY ALLOCATIONS FIELDS TABLE 26 - QUANTITY MANUAL QTY/SCHED OVERRIDES FIELDS TABLE 27 - ADDITIONAL QUANTITY VARIANCE FIELDS TABLE 28 - SCHEDULE VARIANCE FIELDS TABLE 29 - ADDITIONAL SCHEDULE VARIANCE FIELDS TABLE 30 - PROCUREMENT ENGINEERING VARIANCE FIELDS TABLE 31 - PROCUREMENT OTHER VARIANCE FIELDS TABLE 32 - PROCUREMENT SUPPORT VARIANCE FIELDS TABLE 33 - PROCUREMENT QUANTITY RELATED SUPPORT FIELDS TABLE 34 - PROCUREMENT ESTIMATING VARIANCE FIELDS
7 TABLE 35 - MILCON COMMAND CENTER FIELDS TABLE 36 - MILCON TOTAL VARIANCE FIELDS TABLE 37 - MILCON ECONOMIC VARIANCE FIELDS TABLE 38 - MILCON SCHEDULE VARIANCE FIELDS TABLE 39 - MILCON ENGINEERING VARIANCE FIELDS TABLE 40 - MILCON OTHER VARIANCE FIELDS TABLE 41 - MILCON ESTIMATING VARIANCE FIELDS TABLE 42 - ACQ O&M COMMAND CENTER FIELDS TABLE 43 - ACQ O&M TOTAL VARIANCE FIELDS TABLE 44 - ACQ O&M ECONOMIC VARIANCE FIELDS TABLE 45 - ACQ O&M SCHEDULE VARIANCE FIELDS TABLE 46 - ACQ O&M ENGINEERING VARIANCE FIELDS TABLE 47 - ACQ O&M OTHER VARIANCE FIELDS TABLE 48 - ACQ O&M ESTIMATING VARIANCE FIELDS TABLE 49 - CRITICAL ERROR MESSAGES TABLE 50 - WARNING ERROR MESSAGES TABLE 51 - INFORMATIONAL ERROR MESSAGES
8 FIGURES FIGURE 1 - DAMIR PORTAL WELCOME SCREEN... 6 FIGURE 2 - RECENT PROGRAMS AREA... 7 FIGURE 3 - DAMIR PORTAL SCREEN (PRIMARY AREA)... 8 FIGURE 4 - DATA COLLECTION OPTION... 9 FIGURE 5- SELECT A PROGRAM... 9 FIGURE 6 - INITIALIZE A NEW SAR FIGURE 7 - INITIAL SAR SCREEN FIGURE 8 COST VARIANCE SECTION ACCESS FIGURE 9 - SAVE/CANCEL BUTTONS FIGURE 10 - SAMPLE INSTRUCTIONS FIGURE 11 - SUMMARY SECTION FIGURE 12 - DISCUSSION SUMMARY SCREEN FIGURE 13 - NAVIGATION WARNING MESSAGE FIGURE 14 TOTAL VARIANCE FACTORS FIGURE 15 - COST VARIANCE SUMMARY SCREEN FIGURE 16 - COST VARIANCE LINKS FIGURE 17 - COMPUTATIONAL MODEL COMMAND CENTER RDT&E TY FIGURE 18 - COMPUTATIONAL MODEL COMMAND CENTER RDT&E BY FIGURE 19 - COMPUTATIONAL MODEL COMMAND CENTER PROCUREMENT TY FIGURE 20 - COMPUTATIONAL MODEL COMMAND CENTER PROCUREMENT BY FIGURE 21 - COMPUTATIONAL MODEL COMMAND CENTER MILCON TY FIGURE 22 - COMPUTATIONAL MODEL COMMAND CENTER MILCON BY FIGURE 23 - COMPUTATIONAL MODEL COMMAND CENTER OPERATIONS & MAINTENANCE TY FIGURE 24 - COMPUTATIONAL MODEL COMMAND CENTER OPERATIONS & MAINTENANCE BY FIGURE 25 - TOTAL VARIANCE FOR RDT&E TY FIGURE 26 - TOTAL VARIANCE FOR RDT&E BY FIGURE 27 - TOTAL VARIANCE FOR PROCUREMENT TY FIGURE 28 - TOTAL VARIANCE FOR PROCUREMENT BY FIGURE 29 - TOTAL VARIANCE FOR MILCON TY FIGURE 30 - TOTAL VARIANCE FOR MILCON BY FIGURE 31 - TOTAL VARIANCE FOR OPERATIONS & MAINTENANCE TY FIGURE 32 - TOTAL VARIANCE FOR OPERATIONS & MAINTENANCE BY FIGURE 33 - ECONOMIC VARIANCE DETAIL FOR RDT&E TY FIGURE 34 - ECONOMIC VARIANCE DETAIL FOR PROCUREMENT TY
9 FIGURE 35 - ECONOMIC VARIANCE DETAIL FOR MILCON TY FIGURE 36 - ECONOMIC VARIANCE DETAIL FOR OPERATIONS & MAINTENANCE TY FIGURE 37 - PROCUREMENT QUANTITY VARIANCE - MAIN FIGURE 38 - PROCUREMENT QUANTITY VARIANCE TY FIGURE 39 - PROCUREMENT QUANTITY VARIANCE BY FIGURE 40 - COST-QUANTITY CURVES BEST FIT INFORMATION FIGURE 41 - COST-QUANTITY CURVES FIGURE 42 - PCE COST-QUANTITY CURVE DATA & SAR BASELINE FIGURE 43 - QUANTITY ALLOCATION REPORTS FIGURE 44 - PROCUREMENT SCHEDULE VARIANCE REPORTS FIGURE 45 - INITIAL SPARES FOR APPROPRIATION 2032 TY $M FIGURE 46 - INITIAL SPARES FOR APPROPRIATION 2032 BY FIGURE 47 - OTHER SUPPORT FOR APPROPRIATION 2032 TY FIGURE 48 - OTHER SUPPORT FOR APPROPRIATION 2032 BY FIGURE 49 - PROCUREMENT QUANTITY VARIANCES AND EXPLANATIONS REPORT FIGURE 50 - SCHEDULE QUANTITY VARIANCES AND EXPLANATIONS REPORT FIGURE 51 DISCUSSION AREA FIGURE 52 - CHANGE EXPLANATIONS DROPDOWN FIGURE 53 - CHANGE EXPLANATIONS SCREEN FIGURE 54 - EXAMPLE WHEN BREAK HYPERLINK USED FIGURE 55 - RDT&E COMMAND CENTER DISPLAY FIGURE 56 - RDT&E COMMAND CENTER DISPLAY FOR BASE-YEARS FIGURE 57 - RDT&E TOTAL VARIANCE FIGURE 58 - RDT&E ECONOMIC VARIANCE SCREEN FIGURE 59 - RDT&E QUANTITY VARIANCE SCREEN FIGURE 60 - RDT&E SCHEDULE VARIANCE SCREEN FIGURE 61 - RDT&E ENGINEERING VARIANCE SCREEN FIGURE 62 - RDT&E OTHER VARIANCE SCREEN FIGURE 63 - RDT&E SUPPORT VARIANCE SCREEN FIGURE 64 - RDT&E ESTIMATING VARIANCE SCREEN FIGURE 65 - PROCUREMENT COMMAND CENTER DISPLAY FIGURE 66 - PROCUREMENT COMMAND CENTER DISPLAY FOR BASE-YEARS FIGURE 67 - PROCUREMENT TOTAL VARIANCE SCREEN FIGURE 68 - PROCUREMENT ECONOMIC VARIANCE SCREEN FIGURE 69 - COST & SCHEDULE VARIANCE LINKS FIGURE 70 - PROCUREMENT QUANTITY & SCHEDULE VARIANCE MAIN SCREEN
10 FIGURE 71 - COST-QUANTITY DATA SCREEN FIGURE 72 - COST-QUANTITY CURVES SCREEN FIGURE 73 - QUANTITY VARIANCE SCREEN FIGURE 74 - QUANTITY ALLOCATIONS SCREEN FIGURE 75 - MANUAL QTY/SCHED OVERRIDES SCREEN FIGURE 76 - ADDITIONAL QUANTITY VARIANCE SCREEN FIGURE 77 - SCHEDULE VARIANCE SCREEN FIGURE 78 - ADDITIONAL SCHEDULE VARIANCE SCREEN FIGURE 79 PROCUREMENT ENGINEERING VARIANCE SCREEN FIGURE 80 - PROCUREMENT OTHER VARIANCE SCREEN FIGURE 81 - PROCUREMENT SUPPORT VARIANCE SCREEN FIGURE 82 EDIT QUANTITY RELATED SUPPORT SCREEN FIGURE 83 - PROCUREMENT ESTIMATING VARIANCE SCREEN FIGURE 84 - MILCON COMMAND CENTER DISPLAY FIGURE 85 - MILCON COMMAND CENTER DISPLAY FOR BASE-YEARS SCREEN FIGURE 86 - MILCON TOTAL VARIANCE SCREEN FIGURE 87 - MILCON ECONOMIC VARIANCE SCREEN FIGURE 88 - MILCON SCHEDULE VARIANCE SCREEN FIGURE 89 - MILCON ENGINEERING VARIANCE SCREEN FIGURE 90 - MILCON OTHER VARIANCE SCREEN FIGURE 91 - MILCON ESTIMATING VARIANCE SCREEN FIGURE 92 - ACQ O&M COMMAND CENTER DISPLAY FIGURE 93 - ACQ O&M COMMAND CENTER DISPLAY FOR BASE-YEARS FIGURE 94 - ACQ O&M TOTAL VARIANCE SCREEN FIGURE 95 - ACQ O&M ECONOMIC VARIANCE SCREEN FIGURE 96 - ACQ O&M SCHEDULE VARIANCE SCREEN FIGURE 97 - ACQ O&M ENGINEERING VARIANCE SCREEN FIGURE 98 - ACQ O&M OTHER VARIANCE SCREEN FIGURE 99 - ACQ O&M ESTIMATING VARIANCE SCREEN FIGURE COST VARIANCE SUMMARY INSTRUCTIONS SCREEN FIGURE CHANGE EXPLANATIONS INSTRUCTIONS SCREEN FIGURE COMMAND CENTER INSTRUCTIONS SCREEN FIGURE TOTAL VARIANCE INSTRUCTIONS SCREEN FIGURE ECONOMIC VARIANCE INSTRUCTIONS SCREEN FIGURE QUANTITY VARIANCE INSTRUCTIONS SCREEN FIGURE SCHEDULE VARIANCE INSTRUCTIONS SCREEN
11 FIGURE ENGINEERING VARIANCE INSTRUCTIONS SCREEN FIGURE OTHER VARIANCE INSTRUCTIONS SCREEN FIGURE SUPPORT VARIANCE INSTRUCTIONS SCREEN FIGURE ESTIMATING VARIANCE INSTRUCTIONS SCREEN FIGURE PROCUREMENT QUANTITY & SCHEDULE VARIANCE INSTRUCTIONS SCREEN FIGURE PROCUREMENT COST QUANTITY DATA INSTRUCTIONS SCREEN FIGURE PROCUREMENT COST QUANTITY CURVE INSTRUCTIONS SCREEN FIGURE PROCUREMENT QUANTITY VARIANCE INSTRUCTIONS SCREEN FIGURE PROCUREMENT QUANTITY ALLOCATIONS INSTRUCTIONS SCREEN FIGURE PROCUREMENT MANUAL QUANTITY/SCHEDULE OVERRIDE INSTRUCTIONS SCREEN FIGURE PROCUREMENT ADDITIONAL QUANTITY VARIANCE INSTRUCTIONS SCREEN FIGURE PROCUREMENT SCHEDULE VARIANCE INSTRUCTIONS SCREEN FIGURE PROCUREMENT ADDITIONAL SCHEDULE VARIANCE INSTRUCTIONS SCREEN FIGURE DISPLAY ERROR MESSAGE NUMBER
12 1. INTRODUCTION TO COST VARIANCE This document provides instructions about the Cost Variance section of a SAR. It complements the document titled SAR Data Entry Instructions, which describes how to enter and modify data for a SAR (Selected Acquisition Report). The SAR provides key cost, schedule, and performance information on Major Defense Acquisition Programs (MDAPs). 1.1 PURPOSE OF COST VARIANCE DOCUMENT This document will provide DAMIR users with the instructions about how to utilize the Cost Variance section of a SAR. 1.2 SECURITY Access to the Cost Variance section of a SAR requires the use of: A CAC (issuance of the Common Access Card is controlled by DoD) or ECA (External Certificate Authority) and A valid Personal Identification Number (PIN). 1.3 ACRONYMS AND ABBREVIATIONS Table 1 - Acronyms and Abbreviations Acronym Meaning ACAT Acq O&M ADM APB APUC ARA ARA/AM AT&L BY BY$ CAC DAMIR DoD ECA ECPs Flyaway Costs FYDP Acquisition Category Acquisition Operations & Maintenance Acquisition Decision Memorandum Acquisition Program Baseline Average Procurement Unit Cost Acquisition Resource Analysis Acquisition Resource Analysis/Acquisition Management Acquisition, Technology and Logistics Baseline-Year Baseline-Year dollars Common Access Card Defense Acquisition Management Information Retrieval Department of Defense External Certificate Authority Engineering Change Proposals An Air Force term for costs related to the production of usable end item military hardware. Equates to Rollaway & Sailaway Future Years Defense Program 1
13 Acronym NSNQ NSOQ OSD OSNQ OSOQ OUSD PAUC PB PCE PdE PE PIN RDT&E Rollaway Costs Sailaway Costs SAR SAR BL TY TY$ UCR WBS New Schedule New Quantity New Schedule Old Quantity Office of Secretary of Defense Old Schedule New Quantity Old Schedule Old Quantity Meaning Office of the Under Secretary of Defense Program Acquisition Unit Cost President s Budget Previous Current Estimate Production Estimate Planning Estimate Personal Identification Number Research, Development, Testing, & Evaluation An Army term for costs related to the production of usable end item military hardware. Equates to Flyaway & Sailaway A Navy term for costs related to the production of usable end item military hardware. Equates to Flyaway & Rollaway Selected Acquisition Report SAR Baseline Then-Year Then-Year dollars Unit Cost Reporting Work Breakdown Structure 2
14 2. GENERAL GUIDANCE FOR COST VARIANCE This section provides an overview of the SAR Cost Variance section. 2.1 OVERVIEW OF COST VARIANCE The Secretary of Defense is required to submit to Congress a SAR on each Major Defense Acquisition Program (MDAP) (ACAT I program) as defined in 10 USC 2432 and as included on the USD (AT&L) MDAP list. A "program" is defined as one that has an approved program initiation (Milestone B for all but some ship programs) that meets the MDAP cost or schedule criteria specified in 10 USC The Cost and Variance section provides vital information to support this process. 2.2 ANNUAL AND QUARTERLY SARS A SAR is required to be updated and submitted quarterly and annually by statute and/or OSD regulation as indicated below. These are required in accordance with: Statute: o o To report a Nunn-McCurdy unit cost breach (15% or more increase in Program Acquisition Unit Cost (PAUC) or Average Procurement Unit Cost (APUC)), And when there has been a schedule delay of 6 months or more in the Current Estimate (CE) since the last SAR. OSD Regulation o o For an initial SAR or a SAR reporting for the last time, And for a SAR rebaselining after a major milestone decision. Note that the first two conditions are statutory and the second two are regulatory. All submissions have the same content except for the Nunn-McCurdy submission, which includes additional unit cost breach information. Note that the existence of a breach to the APB is not one of the conditions for the submission of a SAR Annual SARs The annual SAR, prepared for the period starting January 1 and ending December 31, is mandatory for all reporting programs in accordance with 10 USC The as of date of December 31 is a nominal date for cost, schedule, and performance data. The annual SAR reflects the President s Budget (PB) and supporting documentation and the remainder of the program budget, if the total program budget is not reported in the President s Budget and supporting documentation. For example, the annual SAR should reflect the R-1/P-1 Exhibits (see DoD R, Financial Management Regulation ) plus initial spares, unless the R-1/P-1 and the SAR reflect different aggregations of cost in which case the common portions should agree. For those years not covered by the R-1/P-1, the SAR would reflect another budget supporting documentation such as the Future Years Defense Program (FYDP) or other documentation of appropriate decision authority (e.g., the Secretary of Defense or the Congress). 3
15 2.2.2 Quarterly SARs The submission of Quarterly SARs for the second, third, and fourth quarters of the fiscal year (March 31, June 30, and September 30, respectively) are required to be submitted on an exception basis when there has been one of the following: 1. A 15% or more increase in the Program Acquisition Unit Cost (PAUC) or Average Procurement Unit Cost (APUC) (in Base-Year dollars) compared to the current APB, PAUC< or APUC, or a 30% or more increase in the PAUC or APUC compared to the original APB (i.e., the Unit Cost Reporting (UCR) baselines), or 2. A 6-month or greater delay in the Current Estimate of any schedule milestone since the Current Estimate of the previous SAR. In addition, interim quarterly SARs are required by Departmental guidance to be submitted when there has been a Milestone B or Milestone C APB approval during the reporting quarter 'as of date'. Quarterly exception SARs may also be submitted to reflect corrections to funding, variance calculations, or categorizations as directed by the Office of the Under Secretary of Defense (Acquisition Technology & Logistics) (OUSD (AT&L)); program rebaselining after major milestone decisions (e.g., Milestone B or Milestone C), or for initial SARs and termination SARs Joint Program SARs For programs involving the formal participation of more than one DoD Component, Selected Acquisition Reporting is required for the lead DoD Component as well as the other participating DoD Components. Selected Acquisition Reporting of such programs is accomplished by the lead DoD Component submitting a composite SAR that reflects the total program of all participating DoD Components, and includes separate program funding summaries for each participating DoD Component funding appropriations RDT&E Only SARs In accordance with Title 10, United States Code, Section 2432, "Selected Acquisition Reports," pre-milestone B programs may submit RDT&E-only SARs that exclude procurement, military construction, and acquisition-related operation and maintenance costs, if: The DoD Components submit to the USD (AT&L) the names of those programs for which they intend to submit RDT&E-only SARs, 45 days before the end of the reporting quarter. The USD (AT&L) notifies Congress 15 days before a report is due of the newly reportable programs for which RDT&E-only SARs will be submitted. 2.3 SAR BASELINE The SAR Baseline (i.e., Planning Estimate (PE), Development Estimate (DE), or Production Estimate (PdE)) normally reflects the cost, schedule, and performance estimates of the program at the most recent major milestone decision (i.e., Milestone A, B, or C), as documented by the major milestone decision APB. The SAR baseline values are expressed in terms of the objectives of the major milestone APB. Once established, the SAR baseline remains in effect until the program transitions to a new SAR baseline after the next major milestone decision point (i.e., to a Development Estimate at Milestone B or to a Production Estimate at Milestone C). (This means that the SAR baseline and the major milestone APB are usually the same in initial SARs or rebaseline SARs (Phase II) submitted after a major milestone decision, but may not be the same in subsequent SAR submissions since the APB 4
16 may change several times between major milestone decisions.) The following are exceptions to the rule that the SAR baseline is the same as the APB approved at the most recent major milestone decision: a. For a program submitting an initial SAR between major milestones, the SAR baseline will reflect the currently approved APB, which may not necessarily be the same as the APB approved at the major milestone decision. b. In an initial SAR for a program for which an APB has not yet been approved, the SAR baseline may reflect the proposed APBs values of cost, schedule, and performance. This is an exceptional situation, since the Department prefers not to submit SARs without an approved APB. Furthermore, in accordance with 10 USC 2435, note that no amount appropriated or otherwise made available to the Department of Defense for carrying out a Major Defense Acquisition Program may be obligated after the program enters system development and demonstration (i.e., Milestone B) without an approved APB unless such obligation is specifically approved by the USD (AT&L). The Acquisition Decision Memorandum (ADM), major milestone decision documentation, test, and evaluation master plan, Future Years Defense Program, or a similar document or combination of documents may also be used to define the proposed APB and associated SAR Baseline in the absence of an approved APB.) 2.4 ADDITIONAL SAR GUIDANCE For the December SARs, formal guidance will be issued by OUSD (AT&L)/ARA in January of each year. The guidance package will include specifics about reporting dates, the use of DAMIR, the reporting programs, and other important submission information. When required, specific SAR preparation guidance may be issued by the USD (AT&L) for the quarters ending March 31, June 30, and September 30. 5

17 3. NAVIGATING TO COST VARIANCE OF A SAR This portion describes how you can navigate to the Cost Variance section for a SAR. Upon entering the DAMIR the following screen will be presented: Figure 1 - DAMIR Portal Welcome Screen 6

18 The entire DAMIR Portal screen is presented above. In this manual we will be focusing on the functions within Data Collection, specifically Create or Edit a SAR. The left-hand panel, titled DAMIR Alerts, contains alert messages broadcast from DAMIR administrators to DAMIR users. Beneath that area is an area titled Notifications, which can be automatically generated for a program as the program is elevated in the acquisition process. Underneath the primary area of the DAMIR Portal, you are presented a means to quickly access recently used programs: Figure 2 - Recent Programs Area In this example, the last three programs accessed were: HIMARS Stryker JSOW Notice that you can view (via Purview) the SAR, the APB, or DAES/Web Services (DAES/WS) by clicking on SAR, APB, or. DAES/WS, respectively. Alternatively, you can edit (via Create or Edit) the SAR, the APB, or DAES by clicking on SAR, APB, or. DAES, respectively. If the desired program is not within the Recent Programs Area, the following paragraphs describe how you can access other programs to Create or Edit a SAR a program. 3.1 DAMIR PORTAL (PRIMARY AREA) Upon entering the DAMIR the following screen will be presented: 7

19 Figure 3 - DAMIR Portal Screen (Primary Area) For those of you that just wish to review your reports without making changes, you will use the Purview section. We have described how to use the options in Purview in another document entitled DAMIR Purview Instructions, which describes its use for all DAMIR reports. 3.2 DATA COLLECTION AREA In the Data Collection area in the upper right-hand portion, click on the Create or Edit a SAR link to begin the creation process. 8


20 Figure 4 - Data Collection Option 3.3 SELECT A PROGRAM As shown below, the various programs will be presented separated by the initiating Service or Agency. Use the scroll bar on the right to locate the desired Service or Agency. The order of these sections is: 1. Army 2. Navy 3. Air Force 4. DoD where the agencies are listed Click the desired program to create a new SAR or edit an existing one. Figure 5- Select a Program 9
21 3.4 INITIALIZATION SCREEN Once you have selected a program, you will be presented with a screen to specify some options for your SAR. The screen comes in two flavors: Initialize a New SAR Edit a SAR Initialize a New SAR When initially creating a SAR, there are fewer options from which to choose. Figure 6 - Initialize a New SAR Table 2 - Initialize SAR Options Field Title Format Content/Notes Submission Date Dropdown Select the date of the submission from the drop-down presented in MMM YYYY format. Previous SAR Display Date of the previous SAR Buttons After making your choices, press the Continue button to continue defining your SAR. Press the Cancel button to terminate the SAR initialization process Editing a SAR The screen below is the one usually presented when updating a SAR. There are two radio buttons presented. You may only choose one of the options. 10
22 SAR Edit Options Screen Table 3 - Edit SAR Options Field Title Format Content/Notes Continue working on this SAR Delete This SAR Radio Button Radio Button Buttons Select this radio button to continue with this SAR. Select this radio button to delete this SAR. After making your choices, press the Continue button to continue working on or deleting your SAR. Press the Cancel button to terminate the SAR editing process. 3.5 INITIAL SAR SCREEN The initial screen presented when entering or editing a SAR is the Submission Status screen as shown below (note the presence of a data check message): 11

23 Figure 7 - Initial SAR Screen 3.6 SECTION ACCESS LINKS The panels on the left of the screen contain commands the will present the screens of the various sections of the SAR. When creating a SAR, most users will begin with the Nomenclature/Component section and simply march down the list until all desired sections have been completed. When editing, you may address the sections in any order. For the purposes of this document, we will focus only on the Cost Variance section that is highlighted in the following: 12

24 Figure 8 Cost Variance Section Access As the individual screens are presented in the following paragraphs, the instructions will not be displayed. There will also be data present in many of the screens, which will serve as a sample of the type of data to be entered. At the bottom of each screen where data may be entered, you will be presented the following: Figure 9 - Save/Cancel Buttons Before you leave any screen, be sure to press the Save button to save the data entered. If you press the Cancel button, the screen content will revert back to the last time the section data was saved. Note: If a SAR is being initially created and the Save button has not been pressed, the screen presented will be empty. As shown above, the bottom, right-hand portion of the screen records the date and time the SAR was last updated, as well as the name of the person who last updated the SAR. The system automatically records this. Some of the screens have been captured in two or three portions because the screen image is too large for one image. 13
 that is found in the")
25 3.7 SECTION INSTRUCTIONS As a default, each section displays instructions at the top of each screen for a section. See Appendix A for the instructions for the Cost Variance section. A sample set of instructions for the Nomenclature/Component section follows: Figure 10 - Sample Instructions Note: If you do not wish to see these instruction, click on Hide ( ) that is found in the upper, right-hand corner. The Hide will be replaced by Show ( ), which will make the instructions reappear Hide Button The Hide ( ) button hides the Instructions for the current section being displayed Show Button The Show ( ) button redisplays the Instructions for the current section. 3.8 DISCUSSION SUMMARY DAMIR has another facility to review all comments made in the various sections pertaining to the program in the Discussion Summary screen. It also enables you to add additional comments. The Discussion Summary facility is started by clicking on the Discussion Summary link found in the left-hand panel of all screens within the Summary portion. Figure 11 - Summary Section 14

26 The following screen is presented with all discussion entries listed by section, entering person, and date. Figure 12 - Discussion Summary Screen 3.9 NAVIGATING AWAY FROM DATA ENTRY SCREEN If you choose to navigate to another screen with unsaved changes on the current screen you will be presented the following message: Figure 13 - Navigation Warning Message If you do not wish to save your changes, press the OK button. Press the Cancel button to return to the screen with your most recent changes intact. You will then be able to save your work by pressing the Save button. 15

27 4. COST VARIANCE SECTION The Cost Variance Summary section is automatically created by the software. The Cost Variance Summary shows information about cost changes to the program since the most recent SAR Baseline as well as current changes since the prior SAR. It provides a Then-Year (TY) and a Base-Year (BY) dollar table of categorized cost variances. These tables are for review only. The Cost Variance section is initiated by clicking on the Cost Variance link found in the Data Sections panel on the lefthand side of the SAR Report Options segment. The Cost Variance section: Presents the Cost Variance Summary Screen to the user as the default (see Chapter 5 for a discussion of its content). Is a key section of the SAR. Identifies the total variance between the previous SAR (PCE) and the current SAR (CE) versus Cost Variance (CE). Breaks down the total variance into well defined variance categories: o o Economic: These include changes in the Current Estimate resulting from a change in indices since the previous report. This category includes only those changes due to revisions in the assumptions of historical and future escalation, and it applies only to the Then-Year dollar variance analysis. The Office of the Secretary of Defense escalation rates published with the President's Budget will be reflected in the annual SAR. These same rates will be reflected in subsequent 2 nd, 3 rd, or 4 th quarterly SAR submissions. Prior approval of the USD (AT&L) is required for economic changes based on system-specific rates in prior years. Quantity: A change in the number of development or production units of an end item of equipment. Ordinarily, categorization as a quantity change will be limited to those end items for which unit costs are required and for which cost-quantity information has been submitted. All Production quantity changes will be calculated using the baseline cost-quantity relationship in effect (Planning Estimate (PE), Development Estimate (DE), or Production Estimate (PdE), 16
28 o o o o o whichever is applicable). (Note that the baseline cost-quantity relationship is expressed in Base-Year dollars.) The difference between the cost of the quantity change based on the SAR Baseline cost-quantity relationship and the cost based on the previous Current Estimate cost-quantity relationship will be allocated to schedule, engineering, estimating, and other categories, as appropriate (for example, "allocation to estimating due to quantity decrease"). Quantity changes in support items are categorized as "support" and are not included here. Also, quantity changes are not applicable to the military construction and operation and maintenance appropriations. Schedule: This is a rephasing of development effort or a change in a procurement buy profile. Changes in support items are not included. Schedule changes may be quantity-related changes. Engineering: These are an alteration in the physical or functional characteristics of a system or item delivered, to be delivered, or under development after establishment of such characteristics. Changes in support items are not included. Engineering changes may be quantity-related changes. Estimating: These may be a change in program cost due to refinement of a prior Current Estimate, or a change in program or cost estimating assumptions and techniques not provided for in the quantity, engineering, or schedule variance categories. For example, the adjustment for assumptions on current and prior escalation rates, or correction of an error in preparing the baseline cost estimate. Changes in support items are not included. Estimating changes may be quantityrelated changes. Other: Use of this category must be pre-approved by the OUSD (AT&L) and is appropriate only for the most unusual circumstances, such as a change in program cost due to natural disasters, work stoppage, and similarly unforeseeable events not covered in other variance categories. The only other use for this category is to record the RDT&E and military construction reductions to terminated programs that have not yet entered production. Other changes are not acquisition reform savings or quantity-related changes. Support: Any change in cost, regardless of reason, associated with any Work Breakdown Structure (WBS) element not included in the flyaway costs as defined in DoD M, "Cost Analysis Guidance and Procedures". This category generally includes all costs changes associated with training and training equipment, peculiar support equipment, data, operational site activation, and initial spares and repair parts. However, construction costs funded by the military construction appropriation and associated only with operational site activation will be categorized elsewhere (except quantity). Note that the total support change (previous plus current) will equal the difference between the support items in the SAR baseline and the support items in the Current Estimate. Support changes may be quantity-related changes. Provides explanations for each separate cost change The following depicts the various items involved in the Total Variance: 17

29 Figure 14 Total Variance Factors There are four steps to reporting SAR cost variances: 1. The calculation of the total variance for each appropriation. 2. The identification of the appropriate variance category for a particular change. 3. Determining the dollar amounts for each variance category by fiscal year. 4. Providing the explanation for the changes. It is important to use the right words to provide understandable, acceptable change explanation. This is probably the most important step. 18

30 5. COST VARIANCE SUMMARY The Cost Variance Summary is the default report displayed when the Cost Variance link or Cost Variance Summary link is selected. The only data entry fields are the Memo and Discussion entries, except when the Program is transitioning to the next Major Milestone. When this occurs, an Adjustments line is displayed and data entry text boxes are available to provide total new appropriation category amounts that did not exist before the transition. The report displays a summary of Then-Year dollars (in millions) of Previous Changes and Current Changes by category (e.g., Economic, Quantity, etc.) by appropriation category (e.g., RDT&E, Procurement, etc.). A View this-submission link is in the upper, right-hand corner to display the Purview view of the Cost Variance screen. A View Base-Year $ link is available in the upper, righthand corner to show the same display for Base-Year $. 19
31 Figure 15 - Cost Variance Summary Screen 5.1 COST VARIANCE SUMMARY TIPS What do I have to do here? Normally, no data entry is required. To begin working on Cost Variance for this SAR, select the appropriation category that you want to work on from the navigation tree on the left under Computational Model. This will take you to the Computational Model Command Center for that appropriation category. If your program is transitioning to the next Major Milestone (e.g., Milestone C or Production), edit boxes will open in Previous Changes for Engineering, Estimating, and Other variance as well as the Adjustments line to allow adjustments because new funding sources have been introduced that did not previously exist. The goal for the Cost Variance section of the SAR is to explain all cost changes in the Current Estimate (CE) since the Current Estimate of the Previous SAR (PCE). Use the Computational Model to provide explanations and dollar amounts for the Current Changes. Previous Changes are the aggregate totals for cost changes that have happened since the SAR Baseline. At the top, totals for SAR Baseline (e.g., Planning, Development, and Production) appropriation categories and program total are shown. The SAR Baseline is the cost starting point for the program. Previous and Current Changes and Totals for the program are shown below the SAR Baseline. 20

32 The SAR Baseline plus Previous Changes will always equal the Current Estimate of the previous SAR (PCE). The SAR Baseline plus Previous Changes plus Current Changes must always equal the CE as entered into Cost and Funding. A SAR cannot be released to Congress if these values do not match. The Cost and Funding CE totals are displayed below the Cost Variance CE totals so you can determine if all cost changes plus the SAR Baseline add to the Cost and Funding CE as entered into the Cost and Funding. All mismatches between the Cost Variance CE and the Cost and Funding CE will be displayed in magenta. Once all cost changes have been accounted for since the PCE, the Cost Variance CE will match the Cost and Funding CE. If the two do not match, then an unexplained Cost Variance remains. On the left edge of the screen is a panel that provides links to various portions of Cost Variance including: Cost Variance Summary Cost Variance Detail Report Change Explanations Computational Model (the links within this area are dependent upon the appropriations for the selected program in this case, we have shown all of the possible sub-entries because all will be discussed in detail) Figure 16 - Cost Variance Links Table 4 - Cost Variance Summary Fields Field Title Format Content/Notes Memo Text Enter desired text to be associated with the Cost Variance of the program as a memo. This information will appear as part of the SAR report and will be viewable by all authorized individuals with SAR access. - Click on this button to check the spelling of your text. 21
33 Field Title Format Content/Notes - Click on this button to make highlighted text bold. - Click on this button to make highlighted text italic. - Click on this button to underline highlighted text. - Click on this button to number and list highlighted text. - Click on this button to list the highlighted text as bullet items. - This is the default (normal) view of the text. It may also be used to revert back to the normal view from the next two icon displays. - Display the Memo as HTML code. report. - Preview the Memo area as it will appear on the Discussion Buttons Text Save Save all changes to the screen. Cancel Cancel changes made since last saving this record. If you press the Cancel button, all data entered since the last Save will be discarded. Add My Comments Click on this link to add a Discussion item. Enter desired text to be associated with the program for this section. This information will NOT appear as part of the SAR report. However, it will be viewable by those with edit/review Draft SAR capabilities all the way up the Release Hierarchy. Enter the desired discussion comment then click on Add My Comments link to save your text. Edit Comments Click on this link to modify the last discussion comment added. If the current user reviewing the SAR is not the last person to have added a discussion item(s), the last comment will not be editable. 22
34 6. COST VARIANCE DETAIL REPORTS The Cost Variance Detail Reports display a number of detail reports regarding cost variance. You may also enter Discussion text if you so desire. Reports generated include: Command Center Detail o o o o o o o o Computational Model Command Center RDT&E TY Computational Model Command Center RDT&E BY Computational Model Command Center Procurement TY Computational Model Command Center Procurement BY Computational Model Command Center MILCON TY Computational Model Command Center MILCON BY Computational Model Command Center OM TY Computational Model Command Center OM BY Total Variance Detail o o o o o o o o Total Variance for RDT&E TY Total Variance for RDT&E BY Total Variance for Procurement TY Total Variance for Procurement BY Total Variance for MILCON TY Total Variance for MILCON BY Total Variance for OM TY Total Variance for OM BY Economic Variance Detail o o o o Economic Variance for RDTE Appropriation XXXX TY Economic Variance for Procurement Appropriation XXXX TY Economic Variance for MILCON Appropriation XXXX TY Economic Variance for OM Appropriation XXXX TY Quantity-Schedule Variance Detail o Procurement Quantity Variance Quantity Lot Buys Cost-Quantity Curve Detail o o o Cost-Quantity Curves Best Fit Information Cost/Quantity Curves (graph) PCE Cost-Quantity Curve Data & SAR Baseline Cost-Quantity Curve Data Support Variance Detail o Initial Spares for Appropriation XXXX TY $M o Initial Spares for Appropriation XXXX BY YYYY $M o Other Support for Appropriation XXXX TY $M o Other Support for Appropriation XXXX BY YYYY $M Because of the size and large number of reports, only a small portion of each report will be displayed along with the totals. Click on the Print icon ( corner of each report to print the currently displayed report. ) in the upper, right-hand 23
 for each fiscal year.")
35 6.1 COMPUTATIONAL MODEL COMMAND CENTER - RDT&E TY This report presents the various category variances for RDT&E in Then-Year dollars (TY$) for each fiscal year. Figure 17 - Computational Model Command Center RDT&E TY 24
 for each fiscal year.")
36 6.2 COMPUTATIONAL MODEL COMMAND CENTER - RDT&E BY This report presents the various category variances for RDT&E in Base-Year dollars (BY$) for each fiscal year. Figure 18 - Computational Model Command Center RDT&E BY 25


37 6.3 COMPUTATIONAL MODEL COMMAND CENTER - PROCUREMENT TY This report presents the various category variances for Procurement in Then-Year dollars (TY$) for each fiscal year. It also presents special totals for Quantity. Figure 19 - Computational Model Command Center Procurement TY 26


38 6.4 COMPUTATIONAL MODEL COMMAND CENTER - PROCUREMENT BY This report presents the various category variances for Procurement in Base-Year dollars (BY$) for each fiscal year. It also presents special totals for Quantity. Figure 20 - Computational Model Command Center Procurement BY 27
 for each fiscal year.")
39 6.5 COMPUTATIONAL MODEL COMMAND CENTER - MILCON TY This report presents the various category variances for MILCON in Then-Year dollars (TY$) for each fiscal year. Figure 21 - Computational Model Command Center MILCON TY 28
 for each fiscal year.")
40 6.6 COMPUTATIONAL MODEL COMMAND CENTER - MILCON BY This report presents the various category variances for MILCON in Base-Year dollars (BY$) for each fiscal year. Figure 22 - Computational Model Command Center MILCON BY 29
 for each fiscal year.")
41 6.7 COMPUTATIONAL MODEL COMMAND CENTER - OPERATIONS & MAINTENANCE TY This report presents the various category variances for Operations & Maintenance in Then- Year dollars (TY$) for each fiscal year. Figure 23 - Computational Model Command Center Operations & Maintenance TY 30
42 6.8 COMPUTATIONAL MODEL COMMAND CENTER - OPERATIONS & MAINTENANCE BY This report presents the various category variances for Operations & Maintenance in Base- Year dollars (BY$) for each fiscal year. Figure 24 - Computational Model Command Center Operations & Maintenance BY 31
 for each fiscal year.")
43 6.9 TOTAL VARIANCE FOR - RDT&E TY This report presents the Current Estimate Funding, Previous Current Estimate Funding, and Total Variances for RDT&E in Then-Year dollars (TY$) for each fiscal year. Figure 25 - Total Variance for RDT&E TY 32
44 6.10 TOTAL VARIANCE FOR - RDT&E BY This report presents the Current Estimate Funding, Previous Current Estimate Funding, and Total Variances for RDT&E in Base-Year dollars (BY$) for each fiscal year. Figure 26 - Total Variance for RDT&E BY 33
45 6.11 TOTAL VARIANCE FOR - PROCUREMENT TY This report presents the Current Estimate Funding, Previous Current Estimate Funding, and Total Variances for Procurement in Then-Year dollars (TY$) for each fiscal year. Figure 27 - Total Variance for Procurement TY 34
46 6.12 TOTAL VARIANCE FOR - PROCUREMENT BY This report presents the Current Estimate Funding, Previous Current Estimate Funding, and Total Variances for Procurement in Base-Year dollars (BY$) for each fiscal year. Figure 28 - Total Variance for Procurement BY 35
47 6.13 TOTAL VARIANCE FOR - MILCON TY This report presents the Current Estimate Funding, Previous Current Estimate Funding, and Total Variances for MILCON in Then-Year dollars (TY$) for each fiscal year. Figure 29 - Total Variance for MILCON TY 36
48 6.14 TOTAL VARIANCE FOR - MILCON BY This report presents the Current Estimate Funding, Previous Current Estimate Funding, and Total Variances for MILCON in Base-Year dollars (BY$) for each fiscal year. Figure 30 - Total Variance for MILCON BY 37
49 6.15 TOTAL VARIANCE FOR - OPERATIONS & MAINTENANCE TY This report presents the Current Estimate Funding, Previous Current Estimate Funding, and Total Variances for Operations & Maintenance in Then-Year dollars (TY$) for each fiscal year. Figure 31 - Total Variance for Operations & Maintenance TY 38
 for each fiscal year. Figure 32 - Total Variance for Operations & Maintenance BY 39")
50 6.16 TOTAL VARIANCE FOR - OPERATIONS & MAINTENANCE BY This report presents the Current Estimate Funding, Previous Current Estimate Funding, and Total Variances for Operations & Maintenance in Base-Year dollars (BY$) for each fiscal year. Figure 32 - Total Variance for Operations & Maintenance BY 39
 for each fiscal year. There will be one of these reports for each funding source.")
51 6.17 ECONOMIC VARIANCE DETAIL FOR - RDT&E TY This report presents the Economic Variance Detail with details supporting the variance calculation for RDT&E in Then-Year dollars (TY$) for each fiscal year. There will be one of these reports for each funding source. Figure 33 - Economic Variance Detail for RDT&E TY 40
 for each fiscal year.")
52 6.18 ECONOMIC VARIANCE DETAIL FOR - PROCUREMENT TY This report presents the Economic Variance Detail with details supporting the variance calculation for Procurement in Then-Year dollars (TY$) for each fiscal year. Figure 34 - Economic Variance Detail for Procurement TY 41
 for each fiscal year.")
53 6.19 ECONOMIC VARIANCE DETAIL FOR - MILCON TY This report presents the Economic Variance Detail with details supporting the variance calculation for MILCON in Then-Year dollars (TY$) for each fiscal year. Figure 35 - Economic Variance Detail for MILCON TY 42
 for each fiscal year.")
54 6.20 ECONOMIC VARIANCE DETAIL FOR - OPERATIONS & MAINTENANCE TY This report presents the Economic Variance Detail with details supporting the variance calculation for Operations & Maintenance in Then-Year dollars (TY$) for each fiscal year. Figure 36 - Economic Variance Detail for Operations & Maintenance TY 43
55 6.21 QUANTITY-SCHEDULE VARIANCE DETAIL This report presents the Quantity-Schedule Variance Detail report Procurement Quantity Variance Quantity Lot Buys This report presents the quantity streams for Procurement for each fiscal year. Figure 37 - Procurement Quantity Variance Quantity Lot Buys 44
56 Figure 38 - Procurement Quantity Variance TY 45
57 Figure 39 - Procurement Quantity Variance BY 46
 information for their program.")
58 6.22 COST-QUANTITY CURVES This portion discusses the Cost-Quantity-Curves reports Cost-Quantity Curves Best Fit Information This report displays the crucial information that describes the physical straight curve line and is provided for those that are interested in Best Fit Curve (Cost or Learning Curve) information for their program. Figure 40 - Cost-Quantity Curves Best Fit Information 47

59 Cost-Quantity Curves Graph This report graphically displays the cost versus quantity values. Figure 41 - Cost-Quantity Curves 48
 Quantity buy profile to the PCE Cost Curve and the SAR Baseline Quantity buy profile to the SAR Baseline")
60 PCE & SAR Baseline Cost-Quantity Curve Data This report shows detail data that supports the previous report (Cost-Quantity Curves). It displays the detail data that results from applying the PCE (Previous Current Estimate) Quantity buy profile to the PCE Cost Curve and the SAR Baseline Quantity buy profile to the SAR Baseline Cost Curve, each of which represent the respective Learning Curve. The PCE Quantity Buy and the PCE Recurring Cost data is used to create the PCE Cost Curve, and similarly the SAR Baseline Quantity Buy and SAR Baseline Recurring Cost data is used to create the SAR Baseline Cost Curve. Applying the CE (Current Estimate) Quantity buy profile to the PCE Cost Curve produces Total Quantity Variance, which includes all cost growth up through the PCE. Applying the CE Quantity buy profile to the SAR Baseline Cost Curve produces True Quantity Variance, which does not include any cost growth, and represents the cost of the CE Quantity, if it could have been produced according to the SAR Baseline Learning Curve. The PCE Best Fit Unit Cost points are plotted on the yellow PCE Cost Curve line and the SAR Baseline Best Fit Unit Cost points are plotted on the blue SAR Baseline Cost Curve line. The PCE and SAR Baseline Average Unit Cost columns are simply the recurring cost divided by the quantity in each year. The PCE and SAR Baseline Best Fit Total Cost represent the total cost of all quantity multiplied by the Best Fit Unit Cost. Figure 42 - PCE Cost-Quantity Curve Data & SAR Baseline Figure 43 - Quantity Allocation Reports 49
61
62 6.24 SUPPORT VARIANCE DETAIL REPORTS Four reports comprise the Support Variance Detail Reports: Initial Spares for Appropriation - TY Initial Spares for Appropriation - BY Other Support for Appropriation - TY Other Support for Appropriation - BY Initial Spares for Appropriation 2032 TY $M This Then Year report displays the initial spares (Current Estimate and Previous Current Estimate) for each fiscal year by appropriation. There will be one of these reports for each appropriation. Figure 44 - Initial Spares for Appropriation 2032 TY $M Initial Spares for Appropriation 2032 BY $M This Base Year report displays the initial spares (Current Estimate and Previous Current Estimate) for each fiscal year by appropriation. There will be one of these reports for each appropriation. 51
63 Figure 45 - Initial Spares for Appropriation 2032 BY 52
64 Other Support for Appropriation 2032 TY $M This Then Year report displays the other support (Current Estimate and Previous Current Estimate) for each fiscal year by appropriation. There will be one of these reports for each appropriation. Figure 46 - Other Support for Appropriation 2032 TY 53

65 Other Support for Appropriation 2032 BY $M This Base Year report displays the other support (Current Estimate and Previous Current Estimate) for each fiscal year by appropriation. There will be one of these reports for each appropriation. Figure 47 - Other Support for Appropriation 2032 BY 54
66 6.25 ADDITIONAL USER PROVIDED COST VARIANCE DETAIL FOR SAR This exception report only displays when there are change explanations in which case it also displays the associated category variance for each fiscal year. There will be one of these reports for each category with an explanation. We will show reports for Procurement and Schedule below Procurement Quantity Variances and Explanations This exception report only displays when there are change explanations in which case it also displays the associated category variance for each fiscal year. Figure 48 - Procurement Quantity Variances and Explanations Report 55
67 Schedule Quantity Variances and Explanations This exception report only displays when there are change explanations in which case it also displays the associated category variance for each fiscal year. Figure 49 - Schedule Quantity Variances and Explanations Report 56
68 6.26 DISCUSSION DATA ENTRY This provides the means for you to enter discussion comments to be associated with Cost Variances. Figure 50 Discussion Area Table 5 Discussion Field Field Title Format Content/Notes Discussion Text Add My Comments Click on this link to add a Discussion item. Enter desired text to be associated with the program for this section. This information will NOT appear as part of the SAR report. However, it will be viewable by those with edit/review Draft SAR capabilities all the way up the Release Hierarchy. Enter the desired discussion comment then click on Add My Comments to save your text. Edit Comments Click on this link to modify the last discussion comment added. If the current user reviewing the SAR is not the last person to have added a discussion item(s), the last comment will not be editable. 57

69 7. CHANGE EXPLANATIONS The Change Explanations screen is, as its name implies used to explain changes that have been applied. Note that you cannot add or delete a change, but you can modify a Change Explanation. The first time a user enters the Cost Variance section, the software automatically generates economic variances and Change Explanations for all appropriation categories. Change Explanations will also be displayed in other categories because of user actions. Notice the Change Explanations for Cost Category drop-down, which may contain the following categories (based on category explanations in your program): Figure 51 - Change Explanations Dropdown By selecting the various funding sources, DAMIR will display all of its change explanations. As is the example below, take note that quantity variances are handled in a special way: The explanations are automatically generated by DAMIR. A Subtotal (Type) summarizes the details (in the example below, the three line items beneath the Subtotal line. Only the Change Explanations of the Subtotal and Quantity lines are modifiable. Clicking on the Break hyperlink will cause the sub items to disappear from the display. Click on the Subtotal column of the summarized Quantity line item and pressing the Update button will result in a re-display of the sub items. 58

70 Figure 52 - Change Explanations Screen Table 6 - Change Explanation Fields 59
71 Field Title Format Content/Notes Change Explanations for Cost Category Select an entry from the drop-down to review the change explanation for the selected funding source. Break Subtotal Hyperlin k Checkbo x Click on this hyperlink to only display the summarized line item (Quantity as shown in the example below). By checking two or more checkboxes, those rows flagged will have a subtotal line created. Order Numeric You can change the numbers to resequence the explanations. Type Change Explanation Dropdown Dropdown Text Identifies the type of variance being addressed. You can change the explanation content (except auto-generated quantity variance line items), if necessary. BY$ (M) Display Base-Year dollars in millions. TY$ (M) Display Then-Year dollars in millions. Quantity Related Checkbo x Click on the checkbox if the explanation is quantity related. Button Press this button to update the information on the screen. Enter desired text to be associated with the Change Explanation as a memo. This information will appear as part of the SAR report and will be viewable by all authorized individuals with SAR access. - Click on this button to check the spelling of your text. Memo Text - Click on this button to make highlighted text bold. - Click on this button to make highlighted text italic. - Click on this button to underline highlighted text. - Click on this button to number and list highlighted text. - Click on this button to list the highlighted text as bullet items. - This is the default (normal) view of the text. It may also be used to revert back to the normal view from the next two icon displays. - Display the Memo as HTML code. 60

72 Field Title Format Content/Notes report. - Preview the Memo area as it will appear on the Discussion Buttons Text Save Save all changes to the screen. Cancel Cancel changes made since last saving this record. If you press the Cancel button, all data entered since the last Save will be discarded. Add My Comments Click on this link to add a Discussion item. Enter desired text to be associated with the program for this section. This information will NOT appear as part of the SAR report. However, it will be viewable by those with edit/review Draft SAR capabilities all the way up the Release Hierarchy. Enter the desired discussion comment then click on Add My Comments to save your text. Edit Comments Click on this link to modify the last discussion comment added. If the current user reviewing the SAR is not the last person to have added a discussion item(s), the last comment will not be editable. The following is an example of the same screen when the Break hyperlink is clicked: Figure 53 - Example When Break Hyperlink Used 7.1 SAR REVIEW If you are doing a SAR review, consider the following guidelines: 61
73 7.1.1 Change Summary This section provides a Then-Year and a Base-Year table of categorized cost variance changes for the current acquisition phase of the program. The previous changes in the current must reflect the sum of the previous and current changes in the prior SAR, except for phase one rebaselinings (when the Base-Year changes) and phase two rebaselinings (when the previous changes are literally incorporated into the new SAR baseline). Note that DAMIR generates the previous changes in the current report automatically and also handles the case of Base-Year changes in the phase one rebaselining and the phase two rebaselining when the previous changes are incorporated into the new SAR Baseline. The current changes are pulled directly from the costs entered in the current change explanations in the Cost Variance - Current Changes Explanations. They are not directly editable in the DAMIR Change Summary table. Make sure that the Current Estimate totals for each appropriation match the totals in Cost and Funding. Quantity changes should identify the type of quantity (i.e., vehicles), schedule changes should identify additional detail as possible, other weapon system support changes should identify specific other changes (e.g., data, training, manuals). DAMIR default explanations such as "New Estimating Change" are not appropriate Current Change Explanations This section provides the individual cost change explanations and the associated Base-Year and Then-Year dollars. The December SARs should almost always have an economic change ( Revised escalation indices ) related to inflation due to the fact that the inflation indices have been revised since the last SAR. Note that Economic change by definition has no Base-Year component. For the same reason, the December SARs should usually have an associated estimating adjustment for revised current and prior inflation rates ( Adjustment for current and prior inflation rates ). DAMIR computed schedule changes are based on the movement of quantities from year to year and have no base year component. Additional schedule changes added by the Program Office should not override the DAMIR Computational Model computed schedule change. Large estimating changes should be broken out where possible. Estimating change is not a sufficient explanation. Changes due to different categories should be reported separately, and not lumped under one category. Make sure that the explanation uses words that make it consistent with the variance category selected. References to POM and BES related documents and specific PBDs should not be used as the reason for a cost change. Check the Base-Year to Then-Year relationship (e.g., one would not expect an explanation to have a negative Base-Year component and a positive Then-Year component;although sometimes this happens when a Program Office aggregates several positive and negative changes, which is not recommended). 62
74 63
75 8. COMPUTATIONAL MODEL The Command Center is the heart of Computational Model and is the cost variance control center for all appropriation categories (e.g., RDT&E, Procurement, etc.). The goal in the Computational Model is to explain all cost changes since the PCE and have zero Unexplained Variances remaining, both at the Total level and on a yearly basis. Unexplained Variance expresses cost changes that remain unexplained for the Current Estimate (CE). Total Variance is the starting point, so Unexplained Variance is calculated by subtracting the amount of each Cost Variance category from Total Variance for each year. Select the appropriation category that you want to work on from the navigation tree on the far left under Computational Model. Cost Variance numbers shown in the Command Center are the aggregate of all appropriations in the selected appropriation category. The total amount explained for each Cost Variance category is displayed in the Totals column. The Computational Model automatically calculates Total and Economic Variances for all appropriation categories. For Procurement, the Computational Model also automatically calculates Quantity, Schedule, and Support Variance. There are links in the left column of the table below to each of the Cost Variance Categories. Click a link to work on that Cost Variance category. Alternatively you can navigate entirely through Computational Model by clicking the link on the bottom right to go to the next Cost Variance category indicated. The Computational Model section provides the means to display the following Command Centers (although any Command Center may be present or absent): Research, Development, Testing, & Evaluation (RDT&E) Command Center, Procurement Command Center, MILCON Command Center, and Acquisition Operations & Maintenance (Acq O&M) Command Center. The reports may display rows for Total Variance, Economic Variance, Quantity Variance, Schedule Variance, Engineering Variance, Other Variance, Support Variance, and Estimating Variance for the Fiscal Years displayed. The Unexplained Variance row should contain nothing but zeroes. If not, corrective action is required to have non-zero rows above the Unexplained row until it displays only zeroes. The Total Variance link ( ) at the bottom right of each screen enables the user to easily cycle through the various categories in order (i.e., when it is clicked, it will display the Total Variance field and this link will be replaced by. Once Economic Variance is displayed, this link will change to, and so forth. Clicking on the Command Center button ( ) will present the last selected command center (for example, if you are currently in Procurement, it will leave the current link and present the Procurement Command Center). 64
76 8.1 RDT&E COMMAND CENTER The RDT&E Command Center displays variances for the combined Fiscal Years of the Current Estimate and the Previous Current Estimate (CE & PCE). The report displays the year-by-year variances by category. Click on the links (Total Variance through Estimating) to review those variance categories. No data entry is required. The goal in Computational Model is to explain all cost changes since the PCE and have zero Unexplained Variance remaining, both at the Total level and on a yearly basis. Unexplained Variance expresses cost changes that remain unexplained for the Current Estimate (CE). Total Variance is the starting point, so Unexplained Variance is calculated by subtracting the amount of each Cost Variance category from Total Variance for each year. Select the appropriation category that you want to work on from the navigation tree on the far left under Computational Model. Cost Variance numbers shown in the Command Center are the aggregate of all appropriations in the selected appropriation category. The total amount explained for each Cost Variance category is displayed in the Totals column. The Computational Model automatically calculates Total and Economic Variances for all appropriation categories. For Procurement, the Computational Model also automatically calculates Quantity, Schedule, and Support Variances. There are links in the left column of the table below to each of the Cost Variance Categories. Click a link to work on that Cost Variance category. Alternatively, you can navigate entirely through the Computational Model by clicking the link on the bottom, right to go to the next Cost Variance category indicated. Notice the slide bar ( ), which you can drag to display more years. You can drag it left or right to see desired years. The report displays a summary of Then-Year dollars (in millions) of each Fiscal Year by category (e.g., Economic, Quantity, etc.) for RDT&E. A View Base-Year $ link is available in the upper, right-hand corner to show the same display for Base-Year $. You can drill down into the listed categories by clicking on the links beneath the Fiscal Years column. 65
, and Total Variance for the Fiscal Years.")
77 Figure 54 - RDT&E Command Center Display Table 7 RDT&E Command Center Fields Field Title Format Content/Notes View Base Year $ Total Variance Economic Link Link Link Click on this link and the Base-Years are displayed. The screen image is displayed below. It contains Current Estimate, Previous C.E. (Current Estimate), and Total Variance for the Fiscal Years. You may also add or edit Discussion entries. This row displays the total variance for each Fiscal Year. Click on the Total Variance link to display Current Estimate, Previous C.E. (Current Estimate), and Total Variance for the Fiscal Years. This row displays the economic variance for each Fiscal Year. Click on the Economic variance link to display PCE BY$ (New Indices) (Previous Current Estimate Base- Dollars), PCE BY$ (Old Indices), and Economic Variance for the Fiscal Years. Note that Economic Variance = New 66
78 Quantity Schedule Field Title Format Content/Notes Engineering Other Support Estimating Unexplained Discussion Link Link Link Link Link Link Display Text Indices Old Indices. This row displays the quantity variance for each Fiscal Year. Click on the Quantity variance link to add or delete Quantity changes for each Fiscal Year. This row displays the schedule variance for each Fiscal Year. Click on the Schedule variance link to add or delete schedule changes for each Fiscal Year. This row displays the engineering variance for each Fiscal Year. Click on the Engineering variance link to add or delete engineering changes for each Fiscal Year. This row displays the other variance for each Fiscal Year. Click on the Other variance link to add or delete other changes for each Fiscal Year. This row displays the variance for each Fiscal Year. Click on the Support variance link to display Current Estimate, Previous CE (Current Estimate), Current & Prior Offset, Support Economic, and Net Variance for the Fiscal Years. Note that Net Variance = Current Estimates other three variances. This row displays the variance for each Fiscal Year. Click on the Estimating variance link to display Subtotal, Adj. C&P Inflation, and Total Estimating for the Fiscal Years. Also displayed are Total Variance, Non Est. Change, Total Estimating, and Unexplained. This row displays the net variance for each Fiscal Year. The Unexplained Variance row should contain nothing but zeroes. If not, corrective action is required to nonzero rows above the Unexplained row until it displays only zeroes. There is no link. Add My Comments Click on this link to add a Discussion item. Enter desired text to be associated with the program for this section. This information will NOT appear as part of the SAR report. However, it will be viewable by those with edit/review Draft SAR capabilities all the way up the Release Hierarchy. Enter the desired discussion comment then click on Add My Comments link to save your text. Edit Comments Click on this link to modify the last discussion comment added. If the current user reviewing the SAR is not the last person to have added a discussion item(s), the last comment will not be editable. Click on the View Base-Year $ link ( ) and the following will be shown. Notice that the link changes to, which is the default view as shown above. The only field that permits data entry is the Discussion field. Notice the slide bar 67
79 ( ), which you can drag to display more years. You can drag it left or right to see desired years. The report displays a summary of Then-Year dollars (in millions) of each Fiscal Year by category (e.g., Economic, Quantity, etc.) for RDT&E. A View Base-Year $ link is available in the upper, right-hand corner to show the same display for Base-Year $. Figure 55 - RDT&E Command Center Display for Base-Years Table 8 RDT&E Base-Year Fields Field Title Format Content/Notes View Then Year $ Discussion Link Text Click on this link and the Then-Years are displayed. The screen image is the default. Add My Comments Click on this link to add a Discussion item. Enter desired text to be associated with the program for this section. This information will NOT appear as part of the SAR report. However, it will be viewable by those with edit/review Draft SAR capabilities all the way up the Release Hierarchy. Enter the desired discussion comment then click on Add My Comments 68
80 Field Title Format Content/Notes link to save your text. Edit Comments Click on this link to modify the last discussion comment added. If the current user reviewing the SAR is not the last person to have added a discussion item(s), the last comment will not be editable. 69
81 8.1.1 RDT&E Total Variance The Total Variance link in the Command Center will display the same information as the link at the bottom right of the screen. It displays the delta between the CE and PCE by fiscal year. The sum of the deltas is Total Variance. No data entry is required. Total Variance is the delta between the CE and the PCE in both TY$ and BY$ (CE minus PCE) by fiscal year. The fiscal years are then summed to total TY$ and total BY$. Total Variance is calculated automatically by the Computational Model and cannot be changed or edited. It is for review only. The aggregate of multiple appropriations is displayed below, along with the Total Variance for each appropriation. Click the Economic Variance link on the bottom, right to continue to Economic Variance. Alternatively, you can return to the Command Center to choose a different Cost Variance category by clicking the Command Center button on the bottom, left. Notice the slide bar ( ), which you can drag to display more years. You can drag it left or right to see desired years. Figure 56 - RDT&E Total Variance Table 9 - RDT&E Total Variance Fields Field Title Format Content/Notes 70
82 Field Title Format Content/Notes View Base Year $ Discussion Link Text Click on this link and the Base-Years are displayed. The screen image is displayed below. It contains Current Estimate, Previous C.E. (Current Estimate), and Total Variance for the Fiscal Years. You may also add or edit Discussion entries. Once displayed, the link will change to View Then Year $. Add My Comments Click on this link to add a Discussion item. Enter desired text to be associated with the program for this section. This information will NOT appear as part of the SAR report. However, it will be viewable by those with edit/review Draft SAR capabilities all the way up the Release Hierarchy. Enter the desired discussion comment then click on Add My Comments link to save your text. Edit Comments Click on this link to modify the last discussion comment added. If the current user reviewing the SAR is not the last person to have added a discussion item(s), the last comment will not be editable. 71
83 8.1.2 RDT&E Economic Variance This displays the economic variance for each Fiscal Year. Click on the Economic variance link from the RDT&E Command Center to display PCE BY$ (New Indices) (Previous Current Estimate Then-Year Dollars), PCE BY$ (Old Indices), and Economic Variance for the Fiscal Years. Economic Variance is a change in the Current Estimate (CE) resulting from using a different set of inflation indices than were used in the Previous Current Estimate. No data entry is required. Economic Variance is calculated using PCE BY$. The calculation formula is: (PCE BY$ * New Indices) (PCE BY$ * Old Indices). The calculation is done for each fiscal year. This produces a TY$ answer and the fiscal years are summed to a total TY$. There is no BY$ component to Economic Variance. Economic Variance is calculated automatically by the Computational Model and cannot be changed or edited. If there are multiple appropriations, there will be an aggregate answer that combines the Economic Variance for all appropriations. This aggregate answer is used for the single Economic Variance explanation that the Computation Model automatically creates. In addition, each appropriation will have its own Economic Variance in the page below, for review. For RDT&E, MILCON, or O&M, click the Quantity Variance link (below right) to continue to Quantity Variance. Alternatively, you can return to the Command Center to choose a different Cost Variance category by clicking the Command Center button on the bottom left. Notice the slide bar ( ), which you can drag to display more years. You can drag it left or right to see desired years. 72

84 Figure 57 - RDT&E Economic Variance Screen Table 10 - RDT&E Economic Variance Fields Field Title Format Content/Notes Discussion Text This field only applies to Base-Year display. Add My Comments Click on this link to add a Discussion item. Enter desired text to be associated with the program for this section. This information will NOT appear as part of the SAR report. However, it will be viewable by those with edit/review Draft SAR capabilities all the way up the Release Hierarchy. Enter the desired discussion comment then click on Add My Comments link to save your text. Edit Comments Click on this link to modify the last discussion comment added. If the current user reviewing the SAR is not the last person to have added a discussion item(s), the last comment will not be editable. 73
85 8.1.3 RDT&E Quantity Variance This displays the quantity variance for each Fiscal Year. Click on the Quantity variance link from the RDT&E Command Center to add or delete Quantity changes for each Fiscal Year. Quantity Variance is the change to your Program Cost Estimate that results from an increase or decrease in the total number of fully configured development quantity. The dollar amounts must be entered by fiscal year to produce the Total Quantity Variance. Data entry is required. RDT&E Quantity Variance occurs when there is a change in total Fully Configured Development Quantity. RDT&E Quantity Variance cannot be automatically calculated. If there are multiple appropriations, choose an appropriation by selecting one from the Appropriation dropdown. The dropdown is only visible when there are multiple appropriations. Provide the year by year TY$ costs associated with the change in RDT&E quantity. BY$ are automatically calculated by year. Be sure to save your work by clicking the Save button. The Cancel button will return to the last saved condition. Click the Schedule Variance link on the bottom right to continue to Schedule Variance. Alternatively, you can return to the Command Center to choose a different Cost Variance category by clicking the Command Center button on the bottom left. Notice the slide bar ( ), which you can drag to display more years. You can drag it left or right to see desired years. 74
, and Total Variance for the Fiscal Years. You may also add or edit Discussion entries.")
86 Figure 58 - RDT&E Quantity Variance Screen Table 11 - RDT&E Quantity Variance Fields Field Title Format Content/Notes View Base Year $ Link Click on this link and the Base-Years are displayed. The screen image is displayed below. It contains Current Estimate, Previous C.E. (Current Estimate), and Total Variance for the Fiscal Years. You may also add or edit Discussion entries. Del Checkbox Click on this checkbox to flag the row for deletion. Explanation Dropdown Select either New Quantity or Change from the drop-down to describe the contents of the row. Years Numeric Enter the Quantity number for the appropriate years. Button Button Buttons Click on the Add Change button to add the change. Click on the Delete Change(s) button to delete the marked changes in the Del checkbox. Save Save all changes to the screen. Cancel Cancel changes made since last saving this record. If you press the Cancel button, all data entered since the last Save will be discarded. 75
87 Field Title Format Content/Notes Discussion Button Text Press the Command Center button to return to the appropriate Command Center. Add My Comments Click on this link to add a Discussion item. Enter desired text to be associated with the program for this section. This information will NOT appear as part of the SAR report. However, it will be viewable by those with edit/review Draft SAR capabilities all the way up the Release Hierarchy. Enter the desired discussion comment then click on Add My Comments link to save your text. Edit Comments Click on this link to modify the last discussion comment added. If the current user reviewing the SAR is not the last person to have added a discussion item(s), the last comment will not be editable. 76

88 8.1.4 RDT&E Schedule Variance This displays the schedule variance for each Fiscal Year. Click on the Schedule variance link from the RDT&E Command Center to add or delete schedule changes for each Fiscal Year. Schedule Variance is a change due primarily to a shift in a Development (RDT&E), MILCON, or O&M effort not identifiable to buy year quantity changes. The dollar amounts must be entered by fiscal year to produce the Total Schedule Variance. Data entry is required. Schedule Variance is defined as a shift in the effort of RDT&E, MILCON, or O&M. The shift in effort could be a stretch-out or acceleration. Schedule Variance cannot be automatically calculated and must be entered in TY$ by fiscal year by appropriation. If there are multiple appropriations, choose an appropriation by selecting one from the Appropriation drop-down. The drop-down is only visible when there are multiple appropriations. Provide the year by year TY$ costs associated with Schedule Variance. BY$ are automatically calculated by year. Be sure to save your work by clicking the Save button. The Cancel button will return to the last saved condition. Click the Engineering Variance link on the bottom right to continue to Engineering Variance. Alternatively, you can return to the Command Center to choose a different Cost Variance category by clicking the Command Center button on the bottom left. Notice the slide bar ( ), which you can drag to display more years. You can drag it left or right to see desired years. 77
89 Figure 59 - RDT&E Schedule Variance Screen Table 12 - RDT&E Schedule Variance Fields Field Title Format Content/Notes View Base Year $ Link Click on this link and the Base-Years are displayed. The screen image is displayed below. It contains Current Estimate, Previous C.E. (Current Estimate), and Total Variance for the Fiscal Years. You may also add or edit Discussion entries. Del Checkbox Click on this checkbox to flag the row for deletion. Explanation Dropdown Select either New Schedule or Change from the drop-down to describe the contents of the row. Years Numeric Enter the Quantity number for the appropriate years. Button Button Buttons Click on the Add Change button to add the change. Click on the Delete Change(s) button to delete the marked changes in the Del checkbox. Save Save all changes to the screen. Cancel Cancel changes made since last saving this record. If you press the Cancel button, all data entered since the last Save will be discarded. 78
90 Field Title Format Content/Notes Discussion Button Text Press the Command Center button to return to the appropriate Command Center. Add My Comments Click on this link to add a Discussion item. Enter desired text to be associated with the program for this section. This information will NOT appear as part of the SAR report. However, it will be viewable by those with edit/review Draft SAR capabilities all the way up the Release Hierarchy. Enter the desired discussion comment then click on Add My Comments link to save your text. Edit Comments Click on this link to modify the last discussion comment added. If the current user reviewing the SAR is not the last person to have added a discussion item(s), the last comment will not be editable RDT&E Engineering Variance This displays the engineering variance for each Fiscal Year. Click on the Engineering variance link from the RDT&E Command Center to add or delete engineering changes for each Fiscal Year. The Engineering Variance is the cost change due to an alteration in the physical or functional characteristics of an end item or subsystem. The dollar amounts must be entered by fiscal year to produce the Total Engineering Variance for each explanation. Data entry is required. Engineering Variance is caused by changes in the design or functions of the system, and cannot be automatically calculated by the Computational Model. Costs are usually known in the Program Office by those that track Engineering Change Proposals (ECPs). If there are multiple appropriations, choose an appropriation by selecting one from the Appropriation drop-down. The drop-down is only visible when there are multiple appropriations. Click the Add Change button to begin and the Computational Model will insert a New Engineering Change explanation. Do not use the New Engineering Change text in the explanation. Use words that speak to kinds of Engineering changes, like Redesigned brake system due to... Provide any Engineering Variance in TY$ by appropriation below. BY$ are automatically calculated by year. To delete an explanation, check the checkbox in the Del column and click the Delete Change(s) button. Be sure to save your work by clicking the Save button. The Cancel button will return to the last saved condition. 79
91 Click the Other Variance link on the bottom right to continue to Other Variance. Alternatively, you can return to the Command Center to choose a different Cost Variance category by clicking the Command Center button on the bottom left. Notice the slide bar ( ), which you can drag to display more years. You can drag it left or right to see desired years. Figure 60 - RDT&E Engineering Variance Screen Table 13 - RDT&E Engineering Variance Fields Field Title Format Content/Notes View Base Year $ Link Click on this link and the Base-Years are displayed. The screen image is displayed below. It contains Current Estimate, Previous C.E. (Current Estimate), and Total Variance for the Fiscal Years. You may also add or edit Discussion entries. Del Explanation Checkbox Click on this checkbox to flag the row for deletion. Dropdown Select either New Quantity or Change from the dropdown to describe the contents of the row. Years Numeric Enter the Quantity number for the appropriate years. Button Click on the Add Change button to add the change. 80
92 Field Title Format Content/Notes Discussion Button Buttons Button Text Click on the Delete Change(s) button to delete the marked changes in the Del checkbox. Save Save all changes to the screen. Cancel Cancel changes made since last saving this record. If you press the Cancel button, all data entered since the last Save will be discarded. Press the Command Center button to return to the appropriate Command Center. This field only applies to Base-Year display. Add My Comments Click on this link to add a Discussion item. Enter desired text to be associated with the program for this section. This information will NOT appear as part of the SAR report. However, it will be viewable by those with edit/review Draft SAR capabilities all the way up the Release Hierarchy. Enter the desired discussion comment then click on Add My Comments link to save your text. Edit Comments Click on this link to modify the last discussion comment added. If the current user reviewing the SAR is not the last person to have added a discussion item(s), the last comment will not be editable. 81
93 8.1.6 RDT&E Other Variance This displays the other variance for each Fiscal Year. Click on the Other variance link from the RDT&E Command Center to add or delete other changes for each Fiscal Year. Other Variance is a change due to natural disasters, work stoppage (e.g., strikes), or similar unforeseeable events not covered in other variance categories. Use of Other Variance must be approved by OSD prior to entering any explanations and dollar amounts. The dollar amounts must be entered by fiscal year to produce the Total Other Variance for each explanation. Data entry is required. Other Variance cannot be automatically calculated. It must be entered in TY$ by fiscal year by appropriation. Use of Other Variance is rare. For example, it is used in cases of Natural Disasters or Labor Strikes. Its use must be approved by OSD. Costs are known in the Program Office by those that track the cost of Other changes, usually the cost analyst. If there are multiple appropriations, choose an appropriation by selecting one from the Appropriation drop-down. The drop-down is only visible when there are multiple appropriations. Click the Add Change button to begin and the Computational Model will insert a New Other Change explanation. Do not use the New Other Change text in the explanation. Use words that speak to Other kinds of changes. Provide any Other Variance in TY$ by fiscal year by appropriation below. BY$ are automatically calculated by year. To delete an explanation, check the checkbox in the Del column and click the Delete Change(s) button. Be sure to save your work by clicking the Save button. The Cancel button will return to the last saved condition. Click the Support Variance link on the bottom right to continue to Support Variance. Alternatively, you can return to the Command Center to choose a different Cost Variance category by clicking the Command Center button on the bottom left. Notice the slide bar ( ), which you can drag to display more years. You can drag it left or right to see desired years. 82
, and Total Variance for the Fiscal Years.")
94 Figure 61 - RDT&E Other Variance Screen Table 14 - RDT&E Other Variance Fields Field Title Format Content/Notes View Base Year $ Del Explanation Link Checkbox Dropdown Click on this link and the Base-Years are displayed. The screen image is displayed below. It contains Current Estimate, Previous C.E. (Current Estimate), and Total Variance for the Fiscal Years. You may also add or edit Discussion entries. This field is disabled in this example. Click on this checkbox to flag the row for deletion. This field is disabled in this example. Select either New Quantity or Change from the drop-down to describe the contents of the row. Years Numeric Enter the Quantity number for the appropriate years. Button Button Buttons Click on the Add Change button to add the change. Click on the Delete Change(s) button to delete the marked changes in the Del checkbox. Save Save all changes to the screen. Cancel Cancel changes made since last saving this 83
95 Field Title Format Content/Notes Button record. If you press the Cancel button, all data entered since the last Save will be discarded. Press the Command Center button to return to the appropriate Command Center. 84
96 8.1.7 RDT&E Support Variance This displays the variance for each Fiscal Year. Click on the Support variance link from the RDT&E Command Center to display the Current Estimate, Previous CE (Current Estimate), Current & Prior Offset, Support Economic, and Net Variance for the Fiscal Years. Note that Net Variance = Current Estimate the other three variances. Normally, there is no support variance reported for Development (RDT&E) unless the program has been broken out into Flyaway and Support in Cost and Funding. However, sometimes funding designated for support types of activities has been increased (or decreased) and helps to explain the current change in Development. Support variance is any change in cost (regardless of reason) that cannot be associated with flyaway costs. No data entry is required, but additional changes can be added if needed. To add one or more additional Support Variance explanations, click the Add/Edit RDT&E Support Changes link below. Once you have added a Support Change, the link will no longer be visible, but the additional change(s) will be visible. RDT&E Support Variance is defined as the change in Support since the PCE. Normally, RDT&E can only have Support Variance if Flyaway and Support have been broken out in Cost and Funding for both the PCE and the CE. However, this breakout rarely occurs in RDT&E. If Flyaway and Support are broken out, Support Variance is automatically calculated for each appropriation. These answers cannot be changed or edited. If total RDT&E Support Variance equals zero, either there has been no change in Support, or Flyaway and Support has not been broken out in Cost and Funding. Be sure to save your work by clicking the Save button. The Cancel button will return to the last saved condition. Click the Estimating Variance link on the bottom right to continue to Estimating Variance. Alternatively, you can return to the Command Center to choose a different Cost Variance category by clicking the Command Center button on the bottom left. Notice the slide bar ( ), which you can drag to display more years. You can drag it left or right to see desired years. 85
, and Total Variance for the Fiscal Years. You may also add or edit Discussion entries.")
97 Figure 62 - RDT&E Support Variance Screen Table 15 - RDT&E Support Variance Fields Field Title Format Content/Notes View Base Year $ Link Click on this link and the Base-Years are displayed. The screen image is displayed below. It contains Current Estimate, Previous C.E. (Current Estimate), and Total Variance for the Fiscal Years. You may also add or edit Discussion entries. Del Explanation Checkbox Click on this checkbox to flag the row for deletion. Dropdown Select either New Quantity or Change from the dropdown to describe the contents of the row. Years Numeric Enter the Quantity number for the appropriate years. Button Button Buttons Click on the Add Change button to add the change. Click on the Delete Change(s) button to delete the marked changes in the Del checkbox. Save Save all changes to the screen. 86
98 Field Title Format Content/Notes Cancel Cancel changes made since last saving this record. If you press the Cancel button, all data entered since the last Save will be discarded. Discussion Button Text Press the Command Center button to return to the appropriate Command Center This field only applies to Base-Year display. Add My Comments Click on this link to add a Discussion item. Enter desired text to be associated with the program for this section. This information will NOT appear as part of the SAR report. However, it will be viewable by those with edit/review Draft SAR capabilities all the way up the Release Hierarchy. Enter the desired discussion comment then click on Add My Comments link to save your text. Edit Comments Click on this link to modify the last discussion comment added. If the current user reviewing the SAR is not the last person to have added a discussion item(s), the last comment will not be editable. 87
99 8.1.8 RDT&E Estimating Variance This displays the variance for each Fiscal Year. Click on the Estimating variance link from the RDT&E Command Center to display the Subtotal, Adj. C&P Inflation, and Total Estimating for the Fiscal Years. Also displayed are the Total Variance, Non Est. Change, Total Estimating, and Unexplained. Estimating Variance is a change in a program cost due to: Refinement of a Prior Current Estimate. Change in program or cost estimating assumptions and techniques not covered by previous variance categories. Current and Prior inflation adjustment flyaway portion only. Related to Economic Change due to changes in inflation rates. Only occurs in December SAR. The dollar amounts must be entered by fiscal year to produce the Total Estimating Variance for each explanation. Data entry is required. Estimating Variance reflects a change in estimating assumptions and cannot be automatically calculated by Computational Model. Costs are known in the Program Office by those that track changes to Estimating, usually the cost analyst. If there are multiple appropriations, choose an appropriation by selecting one from the Appropriation drop-down. The drop-down is only visible when there are multiple appropriations. Click the Add Change button to begin and the Computational Model will insert a New Estimating Change explanation. Do not use the New Estimating Change text in the explanation. Use words that speak to Estimating kinds of changes, like Revised estimate due to... Provide any Estimating Variance in TY$ by appropriation below. BY$ are automatically calculated by year. To delete an explanation, check the checkbox in the Del column and click the Delete Change(s) button. Be sure to save your work by clicking the Save button. The Cancel button will return to the last saved condition. Click the Command Center link on the bottom right to return to the Command Center to review the results of your work in Computational Model. Notice the slide bar ( ), which you can drag to display more years. You can drag it left or right to see desired years. 88
, and Total Variance for the Fiscal Years. You may also add or edit Discussion entries.")
100 Figure 63 - RDT&E Estimating Variance Screen Table 16 - RDT&E Estimating Variance Fields Field Title Format Content/Notes View Base Year $ Link Click on this link and the Base-Years are displayed. The screen image is displayed below. It contains Current Estimate, Previous C.E. (Current Estimate), and Total Variance for the Fiscal Years. You may also add or edit Discussion entries. Del Explanation Checkbox Click on this checkbox to flag the row for deletion. Dropdown Describe the contents of the row, and keep in mind the President s budget. 89
101 Field Title Format Content/Notes Years Numeric Enter the Quantity number for the appropriate years. Discussion Button Button Buttons Button Text Click on the Add Change button to add the change. Click on the Delete Change(s) button to delete the marked changes in the Del checkbox. Save Save all changes to the screen. Cancel Cancel changes made since last saving this record. If you press the Cancel button, all data entered since the last Save will be discarded. Press the Command Center button to return to the appropriate Command Center. This field only applies to Base-Year display. Add My Comments Click on this link to add a Discussion item. Enter desired text to be associated with the program for this section. This information will NOT appear as part of the SAR report. However, it will be viewable by those with edit/review Draft SAR capabilities all the way up the Release Hierarchy. Enter the desired discussion comment then click on Add My Comments link to save your text. Edit Comments Click on this link to modify the last discussion comment added. If the current user reviewing the SAR is not the last person to have added a discussion item(s), the last comment will not be editable. 90
 of each Fiscal Year by category (e.g., Economic, Quantity, etc.) for Procurement.")
102 8.2 PROCUREMENT COMMAND CENTER The Procurement Command Center displays variances for the Fiscal Years shown. Notice the slide bar ( ), which you can drag to display more years. You can drag it left or right to see desired years. The report displays a summary of Then-Year dollars (in millions) of each Fiscal Year by category (e.g., Economic, Quantity, etc.) for Procurement. Click on the links (Total Variance through Estimating) to review those variance categories. A View Base Year $ link is available in the upper, right-hand corner to show the same display for Base-Year $. You can drill down into the listed categories by clipping on the links. No data entry is required. The goal in the Computational Model is to explain all cost changes since the PCE and have zero Unexplained Variance remaining, both at the Total level and on a yearly basis. Unexplained Variance expresses cost changes that remain unexplained for the Current Estimate (CE). The Total Variance is the starting point, so the Unexplained Variance is calculated by subtracting the amount of each Cost Variance category from the Total Variance for each year. Select the appropriation category that you want to work on from the navigation tree on the far left under Computational Model. Cost Variance numbers shown in the Command Center are the aggregate of all appropriations in the selected appropriation category. The total amount explained for each Cost Variance category is displayed in the Totals column. The Computational Model automatically calculates Total and Economic Variance for all appropriation categories. For Procurement, the Computational Model also automatically calculates the Quantity, Schedule, and Support Variance. There are links in the left column of the table below to each of the Cost Variance Categories. Click a link to work on that Cost Variance category. Alternatively, you can navigate entirely through the Computational Model by clicking the link on the bottom right to go to the next Cost Variance category indicated. 91
, and Total Variance for the Fiscal Years.")
103 Figure 64 - Procurement Command Center Display Table 17 - Procurement Command Center Fields Field Title Format Content/Notes View Base Year $ Total Variance Economic Link Link Link Click on this link and the Base-Years are displayed. The screen image is displayed below. It contains the Current Estimate, Previous C.E. (Current Estimate), and Total Variance for the Fiscal Years. You may also add or edit Discussion entries. Once displayed, the link will change to View Then-Years $. This row displays the total variance for each Fiscal Year. Click on the Total Variance link to display the Current Estimate, Previous C.E. (Current Estimate), and Total Variance for the Fiscal Years. This row displays the economic variance for each Fiscal Year. Click on the Economic variance link to display PCE BY$ (New Indices) (Previous Current Estimate Base-Year Dollars), PCE BY$ (Old Indices), and Economic Variance for the Fiscal Years. Note that Economic Variance = New 92
104 Quantity Schedule Field Title Format Content/Notes Engineering Other Support Estimating Unexplained Discussion Link Link Link Link Link Link Display Text Indices Old Indices. This row displays the quantity and schedule variance for each Fiscal Year. Click on the Quantity variance link to add or delete Quantity changes for each Fiscal Year. This row displays the same quantity and schedule as the Quantity link for each Fiscal Year. This row displays the engineering variance for each Fiscal Year. Click on the Engineering variance link to add or delete engineering changes for each Fiscal Year. This row displays the other variance for each Fiscal Year. Click on the Other variance link to add or delete other changes for each Fiscal Year. This row displays the variance for each Fiscal Year. Click on the Support variance link to display Current Estimate, Previous CE (Current Estimate), Current & Prior Offset, Support Economic, and Net Variance for the Fiscal Years. Note that Net Variance = Current Estimates other three variances. This row displays the variance for each Fiscal Year. Click on the Estimating variance link to display Subtotal, Adj. C&P Inflation, and Total Estimating for the Fiscal Years. Also displayed are Total Variance, Non Est. Change, Total Estimating, and Unexplained. This row displays the net variance for each Fiscal Year. The Unexplained Variance row should contain nothing but zeroes. If not, corrective action is required to non-zero rows above the Unexplained row until it displays only zeroes. There is no link. Add My Comments Click on this link to add a Discussion item. Enter desired text to be associated with the program for this section. This information will NOT appear as part of the SAR report. However, it will be viewable by those with edit/review Draft SAR capabilities all the way up the Release Hierarchy. Enter the desired discussion comment then click on Add My Comments link to save your text. Edit Comments Click on this link to modify the last discussion comment added. If the current user reviewing the SAR is not the last person to have added a discussion item(s), the last comment will not be editable. Click on the View Base Year $ link ( ) and the following will be shown. Notice that the link changes to, which is the default view as shown above. The only field that permits data entry is the Discussion field. Notice the slide bar 93
105 ( ), which you can drag to display more years. You can drag it left or right to see desired years. Figure 65 - Procurement Command Center Display for Base-Years Table 18 - Procurement Base-Year Fields Field Title Format Content/Notes View Then Year $ Discussion Link Text Click on this link and the Then-Years are displayed. The screen image is the default. Add My Comments Click on this link to add a Discussion item. Enter desired text to be associated with the program for this section. This information will NOT appear as part of the SAR report. However, it will be viewable by those with edit/review Draft SAR capabilities all the way up the Release Hierarchy. Enter the desired discussion comment then click on Add My Comments link to save your text. Edit Comments Click on this link to modify the last 94
106 Field Title Format Content/Notes discussion comment added. If the current user reviewing the SAR is not the last person to have added a discussion item(s), the last comment will not be editable. 95
107 8.2.1 Procurement Total Variance The Total Variance link from the Procurement Command Center will display the same information as the link at the bottom right of the screen. In this example, there is a portion for the full totals (Total Variance for Funding Source(s) Procurement), which is comprised of the specific funding sources listed below. The report displays a summary of Then-Year dollars (in millions) of each Fiscal Year by Current Estimate, Previous Current Estimate, and Total Variance for Procurement. A View Base Year $ link is available in the upper, right-hand corner to show the same display for Base-Year $. No data entry is required. Total Variance is the delta between the CE and the PCE in both TY$ and BY$ (CE minus PCE) by fiscal year. The fiscal years are then summed to total TY$ and total BY$. Total Variance is calculated automatically by the Computational Model and cannot be changed or edited. It is for review only. The aggregate of multiple appropriations is displayed below along with the Total Variance for each appropriation. Click the Economic Variance link on the bottom right to continue to Economic Variance. Alternatively, you can return to the Command Center to choose a different Cost Variance category by clicking the Command Center button on the bottom left. Notice the slide bar ( ), which you can drag to display more years. You can drag it left or right to see desired years. Figure 66 - Procurement Total Variance Screen 96
108 Table 19 - Procurement Total Variance Fields Field Title Format Content/Notes Discussion Button Text Press the Command Center button to return to the appropriate Command Center. Add My Comments Click on this link to add a Discussion item. Enter desired text to be associated with the program for this section. This information will NOT appear as part of the SAR report. However, it will be viewable by those with edit/review Draft SAR capabilities all the way up the Release Hierarchy. Enter the desired discussion comment then click on Add My Comments link to save your text. Edit Comments Click on this link to modify the last discussion comment added. If the current user reviewing the SAR is not the last person to have added a discussion item(s), the last comment will not be editable. 97
109 8.2.2 Procurement Economic Variance This displays the economic variance for each Fiscal Year. Click on the Economic variance link from the Procurement Command Center to display PCE BY$ (New Indices) (Previous Current Estimate Base-Year Dollars), PCE BY$ (Old Indices), and Economic Variance for the Fiscal Years. Economic Variance is a change in the Current Estimate (CE) resulting from using a different set of inflation indices than were used in the Previous Current Estimate. No data entry is required. Please review the Economic Variance answers below. Economic Variance is calculated using PCE BY$. The calculation formula is: (PCE BY$ * New Indices) (PCE BY$ * Old Indices). The calculation is done for each fiscal year. This produces a TY$ answer only and the fiscal years are summed to a total TY$. There is no BY$ component to Economic Variance. Economic Variance is calculated automatically by the Computational Model and cannot be changed or edited. If there are multiple appropriations, there will be an aggregate answer that combines the Economic Variance for all appropriations. This aggregate answer is used for the single Economic Variance explanation that the Computation Model automatically creates. In addition, each appropriation will have its own Economic Variance in the page below for review. For RDT&E, MILCON, or O&M, click the Quantity Variance link (below right) to continue to Quantity Variance. If you are viewing Economic Variance for Procurement, click the Quantity & Schedule Variance link on the bottom right to continue to Quantity & Schedule Variance. Alternatively, you can return to the Command Center to choose a different Cost Variance category by clicking the Command Center button on the bottom left. Note that Economic Variance = New Indices Old Indices. Notice the slide bar ( ), which you can drag to display more years. You can drag it left or right to see desired years. 98

110 Figure 67 - Procurement Economic Variance Screen Table 20 - Procurement Economic Variance Fields Field Title Format Content/Notes Discussion Button Text Press the Command Center button to return to the appropriate Command Center. Add My Comments Click on this link to add a Discussion item. Enter desired text to be associated with the program for this section. This information will NOT appear as part of the SAR report. However, it will be viewable by those with edit/review Draft SAR capabilities all the way up the Release Hierarchy. Enter the desired discussion comment then click on Add My Comments link to save your text. Edit Comments Click on this link to modify the last discussion comment added. If the current user reviewing the SAR is not the last person to have added a discussion item(s), the last comment will not be editable. 99
111 8.2.3 Procurement Quantity Variance This displays the quantity and Schedule variance for each Fiscal Year. Click on the Quantity variance link from the Procurement Command Center to view Quantity and Schedule changes for each Fiscal Year. Quantity Variance is the change to your Program Cost Estimate that results from an increase or decrease in the total number of fully configured quantity. Notice the slide bar ( ), which you can drag to display more years. You can drag it left or right to see desired years. Notice the following links at the top of the screen, which combines Cost & Schedule Variance data: Figure 68 - Cost & Schedule Variance Links The Quantity & Schedule Variance link ( ) displays the following (defaults to the Main link). The Quantitiy Lot Buys tab tables display the quantity streams from the CE and the PCE to indicate any quantity or schedule changes. The Quantity Lot Buys tab will also indicate in blue font whether or not there has been a Quantity and/or Schedule change since the PCE. No data entry is required. Please notice the navigation near the top of this screen. The links found above allow navigation through various Quantity & Schedule Variance calculation and data entry options. Click a link to navigate to that page. Only three areas of Quantity & Schedule Variance allow data entry. All others are automatic calculations and cannot be changed or edited. o o o Manual Quantity/Schedule Overrides Use this when the Computational Model answer is not accurate or because the Cost-Quantity Curves contain a mix of variant costs that cannot represent a true Learning Curve. When overriding, it is assumed that both Quantity and Schedule will be overridden. Additional Quantity Variance Use this to enter Quantity Variance that is in addition to what the Computational Model has calculated. Additional Schedule Variance Use this to enter Schedule Variance that is in addition to what the Computational Model has calculated. The Computational Model automatically calculates whether or not there is a Quantity and/or Schedule Variance, and presents a statement just above the table below, that indicates which of the variances have occurred. The table below displays the Quantity streams for the CE and the PCE along with the totals. This information is for review only and cannot be changed. If the Total Quantity changes, then you have a Quantity Variance. If the quantity went up, Quantity Variance is positive. If it went down, Quantity Variance is negative. If the buy profile changed between the CE and PCE, and it occurs in any year common to both the CE and PCE but it does not occur only in the last year, there is a Schedule Variance. Click the Engineering Variance link on the bottom right to continue to Engineering Variance. Alternatively, you can return to the Command Center to 100

112 choose a different Cost Variance category by clicking the Command Center button on the bottom left. Figure 69 - Procurement Quantity & Schedule Variance Main Screen Table 21 - Procurement Quantity & Schedule Variance Fields Field Title Format Content/Notes Discussion Button Text Press the Command Center button to return to the appropriate Command Center. Add My Comments Click on this link to add a Discussion item. Enter desired text to be associated with the program for this section. This information will NOT appear as part of the SAR report. However, it will be viewable by those with edit/review Draft SAR capabilities all the way up the Release Hierarchy. Enter the desired discussion comment then click on Add My Comments link to save your text. Edit Comments Click on this link to modify the last discussion comment added. If the current user reviewing the SAR is not the last person to have added a discussion item(s), the last comment will not be editable. 101
113 102

114 Procurement Cost-Quantity Data Link This displays the Cost-Quantity Data report when you click on the Cost-Quantity Data link at the top of the screen. No data entry is required. Please review the information below for accuracy. The information presented here shows the data from the SAR Baseline and the PCE that is used to create the two Cost-Quantity Curves, the SAR Baseline Cost-Quantity Curve, and the PCE Cost-Quantity Curve. These are also called Learning Curves. The data comes from the Quantity buy profile and End Item Related Flyaway (BY$) aligned with Quantity for the SAR Baseline and the PCE. If Procurement is made up of multiple appropriations in either or both the SAR Baseline and PCE, the curves represent the aggregate of all appropriations. The first table displays the aggregate data. Each appropriation s Cost-Quantity Curve is also displayed below for informational purposes, but these are NOT used to do the Quantity Variance calculations. Notice the slide bar ( ), which you can drag to display more years. You can drag it left or right to see desired years. Figure 70 - Cost-Quantity Data Screen 103
115 Table 22 - Cost-Quantity Data Fields Field Title Format Content/Notes Button Press the Command Center button to return to the appropriate Command Center Procurement Cost-Quantity Curves Link This displays the Cost-Quantity Curves Best Fit Information, Cost-Quantity Curves graphic, and PCE/SAR Cost-Quantity Curve Data reports when you click on the Cost-Quantity Curves link at the top of the screen. The Best Fit Information is used directly in calculating Quantity and Schedule Variance. No data entry is required. Please review the Cost Curve information below. In the Chart below the two Cost-Quantity Curves have been plotted. These are also called Learning Curves. If Procurement is made up of multiple appropriations in either or both the SAR Baseline and PCE, the curves represent the aggregate of all appropriations. Quantity Variance is automatically calculated separately for each appropriation, but the aggregate curve is used to do the calculation. The SAR Baseline Learning Curve produces True Quantity Variance. By definition, True Quantity Variance does not include other changes in cost (e.g., Schedule, Engineering, Estimating, etc.). The PCE Learning Curve produces Total Quantity Variance, and it contains all flyaway cost changes since the SAR Baseline including Schedule, Engineering, Estimating, and Other changes. The area between the two curves visually represents the delta between True and Total Quantity Variance. This delta must be allocated to those flyaway Cost Variance categories that caused cost change in the past. Please refer to Quantity Allocations for more information on allocations. Click the Quantity Allocations link above to view how the delta is allocated. Notice the slide bar ( ), which you can drag to display more years. You can drag it left or right to see desired years. 104

116 105
117 Figure 71 - Cost-Quantity Curves Screen Table 23 - Cost-Quantity Curves Fields Field Title Format Content/Notes Discussion Button Text Press the Command Center button to return to the appropriate Command Center. Add My Comments Click on this link to add a Discussion item. Enter desired text to be associated with the program for this section. This information will NOT appear as part of the SAR report. However, it will be viewable by those with edit/review Draft SAR capabilities all the way up the Release Hierarchy. Enter the desired discussion comment then click on Add My Comments link to save your text. Edit Comments Click on this link to modify the last discussion comment added. If the current user reviewing the SAR is not the last person to have added a discussion item(s), the last comment will not be editable. 106

118 Procurement Quantity Variance Link This displays the Quantity Variance report for all Procurement Accounts when you click on the Quantity Variance link at the top of the screen. No data entry is required. Please review the Quantity Variance answers below. The Computational Model automatically calculates the Quantity Variance, using the SAR Baseline (SAR BL), Cost Curve, and the PCE Cost Curve. It provides both the True Quantity Variance (SAR BL) and the Total Quantity Variance (PCE) answers. The delta between the two answers is allocated back to the flyaway Cost Variance categories that contributed to cost change in the past. This information is review only and cannot be changed or edited. If the answers provided by the Computational Model do not represent your actual Quantity Variance, you may override Computational Model s answers with your own by filling out Quantity and Schedule Overrides. If you have additional Quantity Variance that must be declared, you may provide that additional Quantity Variance by filling out Additional Quantity Variance. Notice the slide bar ( ), which you can drag to display more years. You can drag it left or right to see desired years. Figure 72 - Quantity Variance Screen 107
119 Table 24 - Quantity Variance Fields Field Title Format Content/Notes Discussion Button Text Press the Command Center button to return to the appropriate Command Center. This field only applies to Base-Year display. Add My Comments Click on this link to add a Discussion item. Enter desired text to be associated with the program for this section. This information will NOT appear as part of the SAR report. However, it will be viewable by those with edit/review Draft SAR capabilities all the way up the Release Hierarchy. Enter the desired discussion comment then click on Add My Comments link to save your text. Edit Comments Click on this link to modify the last discussion comment added. If the current user reviewing the SAR is not the last person to have added a discussion item(s), the last comment will not be editable. 108
120 Procurement Quantity Allocations Link This displays the Quantity Allocations report when you click on the Quantity Allocations link at the top of the screen. If there is Quantity Variance in the CE, the Computational Model automatically calculates Quantity Allocations and provides a Change Explanation for each allocation. The Allocation information on this page cannot be changed or edited in accordance with OSD guidance. Quantity Allocation explanations can be reviewed by clicking the Change Explanations link in the Cost Variance navigation tree on the left. Allocations are done by allocating a portion of the Amount to Allocate back to the flyaway Cost Variance categories that contributed to cost change in the past. Each flyaway category s portion is calculated using the percentage that each category contributed to Total Previous Changes. This is done for each appropriation that experiences a total quantity change. The flyaway Cost Variance Categories are: o o o o Schedule Engineering Estimating Other There are rules or exceptions to performing Quantity Allocations. If one of the rules is broken, the explanation for that rule is displayed on this screen, and no allocations will be performed. Notice the slide bar ( ), which you can drag to display more years. You can drag it left or right to see desired years. 109

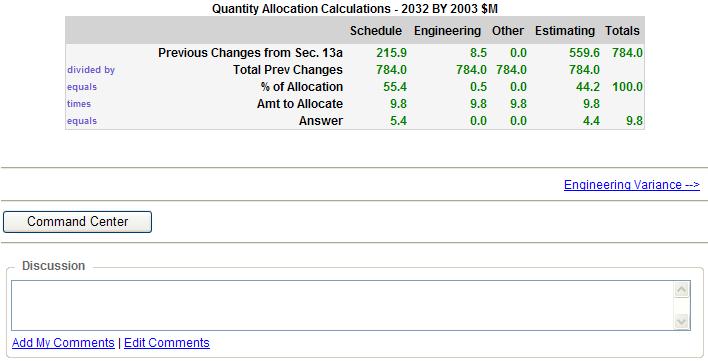
121 Figure 73 - Quantity Allocations Screen 110
122 Table 25 - Quantity Allocations Fields Field Title Format Content/Notes Discussion Button Text Press the Command Center button to return to the appropriate Command Center. This field only applies to Base-Year display. Add My Comments Click on this link to add a Discussion item. Enter desired text to be associated with the program for this section. This information will NOT appear as part of the SAR report. However, it will be viewable by those with edit/review Draft SAR capabilities all the way up the Release Hierarchy. Enter the desired discussion comment then click on Add My Comments link to save your text. Edit Comments Click on this link to modify the last discussion comment added. If the current user reviewing the SAR is not the last person to have added a discussion item(s), the last comment will not be editable. 111
123 Procurement Manual Qty/Sched Overrides Link This displays the Quantity Manual Qty/Sched Overrides report when you click on the Manual Qty/Sched Overrides link at the top of the screen. If the program office elects to override either quantity or schedule variance, both must be overridden. Overriding either indicates that the answer that the Computational Model provided for Quantity Variance is not acceptable. There are several possible reasons why an acceptable answer cannot be provided, and they are all Learning Curve related. o o o Each lot buy has a mix of variants that have significantly different unit costs. In this case, the Learning Curve cannot differentiate between variants and cannot accurately produce Quantity Variance because the BY$ Recurring Flyaway is an amalgam of the variants costs. The Learning Curve is inaccurate because the lot buy costs that produce the plot points for the curve vary widely from lot buy to lot buy, and thus, do not conform to Learning Curve theory. This means that the Learning Curve calculations provide a less than accurate answer because the curve and actual costs are too unrelated. Unique aberrations in unit cost cannot be taken into consideration by the Learning Curve calculations. If either Quantity Variance or Schedule Variance is considered inaccurate, then both answers are inaccurate, thus the need to override both. Data must be entered by fiscal year, and the sum of the changes will be Total Quantity Variance and Total Schedule Variance. Notice the slide bar ( ), which you can drag to display more years. You can drag it left or right to see desired years. 112

124 Figure 74 - Manual Qty/Sched Overrides Screen Table 26 - Quantity Manual Qty/Sched Overrides Fields Field Title Format Content/Notes Button Press the Command Center button to return to the appropriate Command Center. 113
125 Field Title Format Content/Notes Select Account Override Calculated Total (PCE) and True (SARBL) Quantity Variance Dropdown Checkbox Choose a specific account to display or Roll-Up All to summarize all accounts. Check on this checkbox to override calculated values. PCE Variance (Total) Numeric Enter the override PCE variance. SAR BL Variance (True) Override Calculated Schedule Variance Numeric Checkbox Enter the override SAR Baseline variance. Check on this checkbox to override calculated Schedule variance. Schedule Variance Numeric Enter the override schedule variance. Discussion Buttons Text Save Save all changes to the screen. Cancel Cancel changes made since last saving this record. If you press the Cancel button, all data entered since the last Save will be discarded. Add My Comments Click on this link to add a Discussion item. Enter desired text to be associated with the program for this section. This information will NOT appear as part of the SAR report. However, it will be viewable by those with edit/review Draft SAR capabilities all the way up the Release Hierarchy. Enter the desired discussion comment then click on Add My Comments link to save your text. Edit Comments Click on this link to modify the last discussion comment added. If the current user reviewing the SAR is not the last person to have added a discussion item(s), the last comment will not be editable. 114
126 Procurement Additional Quantity Variance Link This displays the Additional Quantity Variance report when you click on the Additional Quantity Variance link at the top of the screen. Data entry is required. Additional Quantity Variance is sometimes required when fact of life changes to the program dictate it. It will always be in addition to (and separate from) the calculated Quantity Variance. Some examples why Additional Quantity Variance might be necessary are: o o When there is quantity change in an undefined subsystem that is not part of the unit of measure for the Program, thus not associated with calculated Quantity Variance. Other unique conditions not represented in the Learning Curve. If there are multiple Procurement appropriations, choose an appropriation by selecting one from the Appropriation drop-down. The drop-down is only visible when there are multiple appropriations. Provide any additional Quantity Variance in TY$ by fiscal year below by appropriation. BY$ are automatically calculated by year. Be sure to save your work by clicking the Save button. The Cancel button will return to the last saved condition. Click the Engineering Variance link on the bottom right to continue to Engineering Variance. Alternatively, you can return to the Command Center to choose a different Cost Variance category by clicking the Command Center button on the bottom left. Notice the slide bar ( ), which you can drag to display more years. You can drag it left or right to see desired years. 115

127 Figure 75 - Additional Quantity Variance Screen Table 27 - Additional Quantity Variance Fields Field Title Format Content/Notes Select Account Button Dropdown Press the Command Center button to return to the appropriate Command Center. Choose a specific account to display or Roll-Up All to summarize all accounts. Del Checkbox Click on this checkbox to flag the row for deletion. Explanation Text Select either New Quantity or Change from the text box, or enter an explanation to describe the contents of the row. Years Numeric Enter the Quantity number for the appropriate years. Button Button Click on the Add Change button to add the change. Click on the Delete Change(s) button to delete the marked changes in the Del checkbox. 116
128 Field Title Format Content/Notes Discussion Buttons Text Save Save all changes to the screen. Cancel Cancel changes made since last saving this record. If you press the Cancel button, all data entered since the last Save will be discarded. Add My Comments Click on this link to add a Discussion item. Enter desired text to be associated with the program for this section. This information will NOT appear as part of the SAR report. However, it will be viewable by those with edit/review Draft SAR capabilities all the way up the Release Hierarchy. Enter the desired discussion comment then click on Add My Comments link to save your text. Edit Comments Click on this link to modify the last discussion comment added. If the current user reviewing the SAR is not the last person to have added a discussion item(s), the last comment will not be editable. 117
129 Procurement Schedule Variance Link This displays the Schedule Variance report when you click on the Schedule Variance link at the top of the screen. No data entry is required. Schedule Variance for Procurement is defined as a shift in the buy profile in the CE that is in a year (or years) common to both the PCE and CE, except when it occurs only in the last year. It is automatically calculated using End Item Related BY$ Flyaway aligned with quantity from the CE and the PCE. If the only change in the buy profile occurs in the last year, the change by definition is a Quantity change and not a Schedule change. Terms that will help you understand the calculation are listed below. In all cases the terms refer to End Item Related Flyaway BY$ aligned with quantity. o o o o NSNQ New Schedule New Quantity refers specifically to the CE. OSOQ - Old Schedule Old Quantity refers specifically to the PCE. NSOQ New Schedule Old Quantity refers to spreading the old flyaway dollars according to the New Schedule until it runs out. OSNQ Old Schedule New Quantity refers to spreading the new flyaway according to the Old Schedule until it runs out. Schedule change must be isolated from Quantity change to produce the correct answer. The steps below describe the process. 1) NSNQ OSOQ equals Quantity and Schedule Variance combined. Quantity must be held constant while Schedule Variance is isolated. 2) NSNQ OSNQ holds Quantity constant while isolating Schedule Variance. 3) NSNQ is the CE, so the Computational Model fills a set of years with OSNQ until it runs out, and Then-Year by year subtracts OSNQ from NSNQ. Any deltas that occur are in BY$. 4) The year by year positive and negative deltas that result will always add to zero for the BY$ Total Schedule Variance. So, by definition, Procurement Schedule Variance has no BY$ component. 5) These BY$ deltas are multiplied by the CE indices to produce the variance in TY$. This will always be a non zero number. Primarily, Schedule Variance reflects the inflationary results caused by the shift in the year by year quantity buy profile. The Computational Model inserts an explanation that states that there has been an Acceleration or Stretch-out of Procurement buy profile. You are encouraged to clarify the explanation by providing more detailed information on the shift in buy profile. Notice the slide bar ( ), which you can drag to display more years. You can drag it left or right to see desired years. 118

130 Figure 76 - Schedule Variance Screen Table 28 - Schedule Variance Fields Field Title Format Content/Notes Discussion Button Text Press the Command Center button to return to the appropriate Command Center. Add My Comments Click on this link to add a Discussion item. Enter desired text to be associated with the program for this section. This information will NOT appear as part of the SAR report. However, it will be viewable by those with edit/review Draft SAR capabilities all the way up the Release Hierarchy. Enter the desired discussion comment then click on Add My Comments link to save your text. Edit Comments Click on this link to modify the last discussion comment added. If the current user reviewing the SAR is not the last person to have added a discussion item(s), the last comment will not be editable. 119
131 Procurement Additional Schedule Variance Link This displays the Additional Schedule Variance report when you click on the Additional Schedule Variance link at the top of the screen. Data entry is required. Additional Schedule Variance is sometimes required when fact of life changes to the program dictate it. It will always be in addition to (and separate from) the calculated Schedule Variance. Some examples of why Additional Schedule Variance might be necessary are: o o o Contractor fees for altering the buy profile after lot buy cost has been negotiated. Keeping a plant open during the year that a quantity buy has been cancelled. Other additional Schedule costs not covered by standard Schedule Variance calculations. If there are multiple Procurement appropriations, choose an appropriation by selecting one from the Appropriation dropdown. The dropdown is only visible when there are multiple appropriations. Provide any additional Schedule Variance in TY$ by fiscal year below by appropriation. BY$ are automatically calculated by year. Additional Schedule Variance has both TY$ and BY$ components. Be sure to save your work by clicking the Save button. The Cancel button will return to the last saved condition. Notice the slide bar ( ), which you can drag to display more years. You can drag it left or right to see desired years. 120

132 Figure 77 - Additional Schedule Variance Screen Table 29 - Additional Schedule Variance Fields Field Title Format Content/Notes Select Account Button Dropdown Press the Command Center button to return to the appropriate Command Center. Choose a specific account to display or Roll-Up All to summarize all accounts. Del Checkbox Click on this checkbox to flag the row for deletion. Explanation Text Select either New Additional or Schedule Change in the text box, to describe the contents of the row, or enter an explanation. Years Numeric Enter the Quantity number for the appropriate years. Button Button Click on the Add Change button to add the change. Click on the Delete Change(s) button to delete the marked changes in the Del checkbox. 121
133 Field Title Format Content/Notes Discussion Buttons Text Save Save all changes to the screen. Cancel Cancel changes made since last saving this record. If you press the Cancel button, all data entered since the last Save will be discarded. Add My Comments Click on this link to add a Discussion item. Enter desired text to be associated with the program for this section. This information will NOT appear as part of the SAR report. However, it will be viewable by those with edit/review Draft SAR capabilities all the way up the Release Hierarchy. Enter the desired discussion comment then click on Add My Comments link to save your text. Edit Comments Click on this link to modify the last discussion comment added. If the current user reviewing the SAR is not the last person to have added a discussion item(s), the last comment will not be editable. 122
134 8.2.4 Procurement Schedule Variance This displays the Quantity and Schedule Variance for each Fiscal Year. Schedule Variance is a change due primarily to a shift in the procurement quantity buy profile (any year), a change in any year compared to PCE (except last year(s)), or a shift in a development, MILCON, or O&M effort not identifiable to buy year quantity changes. See the previous Procurement Quantity paragraph ( ) for its functions when you click on the Schedule variance link from the Procurement Command Center. 123
135 8.2.5 Procurement Engineering Variance This displays the engineering variance for each Fiscal Year. Click on the Engineering variance link from the Procurement Command Center to add or delete engineering changes for each Fiscal Year. Engineering Variance is the cost change due to an alteration in the physical or functional characteristics of an end item or subsystem. Data entry is required. Engineering Variance is caused by changes in the design or functions of the system, and cannot be automatically calculated by the Computational Model. Costs are usually known in the Program Office by those that track ECPs. If there are multiple appropriations, choose an appropriation by selecting one from the Appropriation dropdown. The dropdown is only visible when there are multiple appropriations. Click the Add Change button to begin and the Computational Model will insert a New Engineering Change explanation. Do not use the New Engineering Change text in the explanation. Use words that speak to Engineering kinds of changes, like Redesigned brake system due to... Provide any Engineering Variance in TY$ by fiscal year by appropriation below. BY$ are automatically calculated by year. To delete an explanation, check the checkbox in the Del column and click the Delete Change(s) button. Be sure to save your work by clicking the Save button. The Cancel button will return to the last saved condition. Click the Other Variance link on the bottom right to continue to Other Variance. Alternatively, you can return to the Command Center to choose a different Cost Variance category by clicking the Command Center button on the bottom left. Notice the slide bar ( ), which you can drag to display more years. You can drag it left or right to see desired years. 124
, and Total Variance for the Fiscal Years. You may also add or edit Discussion entries.")
136 Figure 78 Procurement Engineering Variance Screen Table 30 - Procurement Engineering Variance Fields Field Title Format Content/Notes View Base Year $ Link Click on this link and the Base-Years are displayed. The screen image is displayed below. It contains Current Estimate, Previous C.E. (Current Estimate), and Total Variance for the Fiscal Years. You may also add or edit Discussion entries. Select Account Dropdown Choose a specific account to display or Roll-Up All to summarize all accounts. Del Checkbox Click on this checkbox to flag the row for deletion. Explanation Text Select either New Engineering or Change from the dropdown, or describe the contents of the row. Years Numeric Enter the Quantity number for the appropriate years. Button Button Buttons Click on the Add Change button to add the change. Click on the Delete Change(s) button to delete the marked changes in the Del checkbox. Save Save all changes to the screen. 125
137 Field Title Format Content/Notes Cancel Cancel changes made since last saving this record. If you press the Cancel button, all data entered since the last Save will be discarded. Discussion Button Text Press the Command Center button to return to the appropriate Command Center. Add My Comments Click on this link to add a Discussion item. Enter desired text to be associated with the program for this section. This information will NOT appear as part of the SAR report. However, it will be viewable by those with edit/review Draft SAR capabilities all the way up the Release Hierarchy. Enter the desired discussion comment then click on Add My Comments link to save your text. Edit Comments Click on this link to modify the last discussion comment added. If the current user reviewing the SAR is not the last person to have added a discussion item(s), the last comment will not be editable Procurement Other Variance This displays the other variance for each Fiscal Year. Click on the Other variance link to add or delete other changes for each Fiscal Year. Other Variance is a change due to natural disasters, work stoppage e.g., strikes), or similar unforeseeable events not covered in other variance categories. It must be manually entered by the user and must be approved by OSD. Data entry is required. Other Variance cannot be automatically calculated. It must be entered in TY$ by fiscal year by appropriation. Use of Other Variance is rare. For example, it is used in cases of Natural Disasters or Labor Strikes. Its use must be approved by OSD. Costs are known in the Program Office by those that track the cost of Other changes, usually the cost analyst. If there are multiple appropriations, choose an appropriation by selecting one from the Appropriation drop-down. The drop-down is only visible when there are multiple appropriations. Click the Add Change button to begin and the Computational Model will insert a New Other Change explanation. Do not use the New Other Change text in the explanation. Use words that speak to Other kinds of changes. Provide any Other Variance in TY$ by appropriation below. BY$ are automatically calculated by year. To delete an explanation, check the checkbox in the Del column and click the Delete Change(s) button. 126

138 Be sure to save your work by clicking the Save button. The Cancel button will return to the last saved condition. Click the Support Variance link on the bottom right to continue to Support Variance. Alternatively, you can return to the Command Center to choose a different Cost Variance category by clicking the Command Center button on the bottom left. Notice the slide bar ( ), which you can drag to display more years. You can drag it left or right to see desired years. Figure 79 - Procurement Other Variance Screen Table 31 - Procurement Other Variance Fields Field Title Format Content/Notes View Base Year $ Link Click on this link and the Base-Years are displayed. The screen image is displayed below. It contains the Current Estimate, Previous C.E. (Current Estimate), and Total Variance for the Fiscal Years. You may also add or edit Discussion entries. Select Account Dropdown Choose a specific account to display or Roll-Up All to summarize all accounts. Del Checkbox Click on this checkbox to flag the row for deletion. 127
139 Field Title Format Content/Notes Explanation Text Edit New Other Change from the text box to describe the contents of the row. Years Numeric Enter the Quantity number for the appropriate years. Discussion Button Button Buttons Button Text Click on the Add Change button to add the change. Click on the Delete Change(s) button to delete the marked changes in the Del checkbox. Save Save all changes to the screen. Cancel Cancel changes made since last saving this record. If you press the Cancel button, all data entered since the last Save will be discarded. Press the Command Center button to return to the appropriate Command Center. Add My Comments Click on this link to add a Discussion item. Enter desired text to be associated with the program for this section. This information will NOT appear as part of the SAR report. However, it will be viewable by those with edit/review Draft SAR capabilities all the way up the Release Hierarchy. Enter the desired discussion comment then click on Add My Comments link to save your text. Edit Comments Click on this link to modify the last discussion comment added. If the current user reviewing the SAR is not the last person to have added a discussion item(s), the last comment will not be editable. 128
140 8.2.7 Procurement Support Variance This displays the variance for each Fiscal Year. Click on the Support variance link from the Procurement Command Center to display the Current Estimate, Previous CE (Current Estimate), Current & Prior Offset, Support Economic, and Net Variance for the Fiscal Years. Note that Net Variance = Current Estimates other three variances. Support variance is any change in cost (regardless of reason) that cannot be associated with flyaway costs. Some examples include estimating and schedule changes in initial spares requirements and other support such as training, data, peculiar support, etc. No data entry is required. However, you can identify the Quantity Related piece of Initial Spares and Other Support. To identify the Quantity Related amounts, click the Edit Quantity Related Support link below. This is meant to identify the part of Initial Spares or Other Support change that is Quantity Related. Keep in mind that Quantity Related amounts must be in the same year or years that show Support Variance. However, if the entire amount of Initial Spares or Other Support change is Quantity Related, do not use the Quantity Related data entry screen here. Just mark each explanation Quantity Related, as appropriate, in the Change Explanations screen. Support Variance is calculated using BY$ from both the CE and the PCE. It is simply the BY$ delta between the CE and PCE (CE PCE) on a year by year basis and those amounts summed to a BY$ total. The TY$ Support Variance is calculated by taking (CE BY$ * New Indices) (PCE BY$ * New Indices) on a year by year basis. These are summed to a TY$ total. Support Variance is automatically calculated by Computational Model for all appropriations, and cannot be changed or edited. Click the Estimating Variance link on the bottom right to continue to Estimating Variance. Alternatively, you can return to the Command Center to choose a different Cost Variance category by clicking the Command Center button on the bottom left. Notice the slide bar ( ), which you can drag to display more years. You can drag it left or right to see desired years. 129

141 Figure 80 - Procurement Support Variance Screen Table 32 - Procurement Support Variance Fields Field Title Format Content/Notes Edit Quantity Related Support View Base Year $ Link Link Click on this link and you can edit quantity related support values. Click on this link and the Base-Years are displayed. The screen image is displayed below. It contains Current 130
142 Field Title Format Content/Notes Estimate, Previous C.E. (Current Estimate), and Total Variance for the Fiscal Years. You may also add or edit Discussion entries. Discussion Button Text Press the Command Center button to return to the appropriate Command Center. Add My Comments Click on this link to add a Discussion item. Enter desired text to be associated with the program for this section. This information will NOT appear as part of the SAR report. However, it will be viewable by those with edit/review Draft SAR capabilities all the way up the Release Hierarchy. Enter the desired discussion comment then click on Add My Comments link to save your text. Edit Comments Click on this link to modify the last discussion comment added. If the current user reviewing the SAR is not the last person to have added a discussion item(s), the last comment will not be editable Edit Procurement Support Variance The following screen will be presented if you click on the Edit Quantity Related Support link at the top, left-hand portion of the above screen. The bottom of the screen provides the means for making changes. 131

143 132
144 Figure 81 Edit Quantity Related Support Screen Table 33 - Procurement Quantity Related Support Fields Field Title Format Content/Notes View Base Year $ Link Click on this link and the Base-Years are displayed. The screen image is displayed below. It contains the Current Estimate, Previous C.E. (Current Estimate), and Total Variance for the Fiscal Years. You may also add or edit Discussion entries. Initial Spares (Net) Numeric Enter the number of spares for the appropriate years. Other Support (Net) Numeric Enter the Quantity number for the appropriate years. Discussion Buttons Button Text Save Save all changes to the screen. Cancel Cancel changes made since last saving this record. If you press the Cancel button, all data entered since the last Save will be discarded. Press the Command Center button to return to the appropriate Command Center. Add My Comments Click on this link to add a Discussion item. Enter desired text to be associated with the program for this section. This information will NOT appear as part of the SAR report. However, it will be viewable by those with edit/review Draft SAR capabilities all the way up the Release Hierarchy. Enter the desired discussion comment then click on Add My Comments 133
145 Field Title Format Content/Notes link to save your text. Edit Comments Click on this link to modify the last discussion comment added. If the current user reviewing the SAR is not the last person to have added a discussion item(s), the last comment will not be editable. 134
146 8.2.8 Procurement Estimating Variance This displays the variance for each Fiscal Year. Click on the Estimating Variance link from the Procurement Command Center to display Subtotal, Adj. C&P Inflation, and Total Estimating for the Fiscal Years. Also displayed are Total Variance, Non Est. Change, Total Estimating, and Unexplained. Estimating Variance is a change in a program cost due to: Refinement of a Prior Current Estimate. Change in program or cost estimating assumptions and techniques not covered by previous variance categories. Current and Prior inflation adjustment flyaway portion only. Related to Economic Change due to changes in inflation rates. Only occurs in December SAR. Data entry is required. Estimating Variance reflects a change in estimating assumptions and cannot be automatically calculated by Computational Model. Costs are known in the Program Office by those that track changes to Estimating, usually the cost analyst. If there are multiple appropriations, choose an appropriation by selecting one from the Appropriation drop-down. The drop-down is only visible when there are multiple appropriations. Click the Add Change button to begin and the Computational Model will insert a New Estimating Change explanation. Do not use the New Estimating Change text in the explanation. Use words that speak to Estimating kinds of changes, like Revised estimate due to... Provide any Estimating Variance in TY$ by fiscal year by appropriation below. BY$ are automatically calculated by year. To delete an explanation, check the checkbox in the Del column and click the Delete Change(s) button. Be sure to save your work by clicking the Save button. The Cancel button will return to the last saved condition. Click the Command Center link on the bottom right to return to the Command Center to review the results of your work in Computational Model. Notice the slide bar ( ), which you can drag to display more years. You can drag it left or right to see desired years. 135
147 Figure 82 - Procurement Estimating Variance Screen Table 34 - Procurement Estimating Variance Fields Field Title Format Content/Notes View Base Year $ Select Account Del Link Dropdown Checkbox Click on this link and the Base-Years are displayed. The screen image is displayed below. It contains the Current Estimate, Previous C.E. (Current Estimate), and Total Variance for the Fiscal Years. You may also add or edit Discussion entries. Choose a specific account to display or Roll-Up All to summarize all accounts. This field is disabled. Click on this checkbox to flag the row for deletion. Explanation Text This field is disabled. Edit Revised Estimate due to 136
148 Field Title Format Content/Notes updated President's budget from the text box to describe the contents of the row. Years Numeric Enter the Quantity number for the appropriate years. Discussion Button Button Buttons Button Text Click on the Add Change button to add the change. Click on the Delete Change(s) button to delete the marked changes in the Del checkbox. Save Save all changes to the screen. Cancel Cancel changes made since last saving this record. If you press the Cancel button, all data entered since the last Save will be discarded. Press the Command Center button to return to the appropriate Command Center. This field only applies to Base-Year display. Add My Comments Click on this link to add a Discussion item. Enter desired text to be associated with the program for this section. This information will NOT appear as part of the SAR report. However, it will be viewable by those with edit/review Draft SAR capabilities all the way up the Release Hierarchy. Enter the desired discussion comment then click on Add My Comments to save your text. Edit Comments Click on this link to modify the last discussion comment added. If the current user reviewing the SAR is not the last person to have added a discussion item(s), the last comment will not be editable. 137
149 8.3 MILCON COMMAND CENTER The MILCON Command Center displays variances for the Fiscal Years shown. MILCON appropriations do not report Quantity Variance because, by definition, MILCON funding does not purchase either Development or Procurement quantities. Even though MILCON is thought of as a support type of appropriation (because support is directly related to quantity), no MILCON Support Variance is reported. No data entry is required on this screen. The goal in the Computational Model is to explain all cost changes to the PCE that have zero Unexplained Variance remaining both at the Total level and on a yearly basis. Unexplained Variance expresses cost changes that remain unexplained for the Current Estimate (CE). Total Variance is the starting point, so Unexplained Variance is calculated by subtracting the amount of each Cost Variance category from Total Variance for each year. Select the appropriation category that you want to work on from the navigation tree on the far left under the Computational Model. Cost Variance numbers shown in the Command Center are the aggregate of all appropriations in the selected appropriation category. The total amount explained for each Cost Variance category is displayed in the Totals column. The Computational Model automatically calculates Total and Economic Variance for all appropriation categories. For Procurement, Computational Model also automatically calculates Quantity, Schedule, and Support Variance. There are links in the left column of the table below to each of the Cost Variance Categories. Click a link to work on that Cost Variance category. Alternatively, you can navigate entirely through Computational Model by clicking the link on the bottom right to go to the next Cost Variance category indicated. The report displays a summary of Then-Year dollars (in millions) of each Fiscal Year by category (e.g., Economic, Quantity, etc.) for MILCON. Click on the links (Total Variance through Estimating) to review those variance categories. A View Base Year $ link is available in the upper, right-hand corner to show the same display for Base-Year $. You can drill down into the listed categories by clipping on the links. 138
, and Total Variance for the Fiscal Years.")
150 Figure 83 - MILCON Command Center Display Table 35 - MILCON Command Center Fields Field Title Format Content/Notes View Base Year $ Total Variance Economic Link Link Link Click on this link and the Base-Years are displayed. The screen image is displayed below. It contains the Current Estimate, Previous C.E. (Current Estimate), and Total Variance for the Fiscal Years. You may also add or edit Discussion entries. The row displays the total variance for each Fiscal Year. Click on the Total Variance link to display the Current Estimate, Previous C.E. (Current Estimate), and Total Variance for the Fiscal Years. The row displays the economic variance for each Fiscal Year. Click on the Economic variance link to display PCE BY$ (New Indices) (Previous Current Estimate Base-Year Dollars), PCE BY$ (Old Indices), and Economic Variance for the Fiscal Years. Note that Economic Variance = New Indices Old Indices. Schedule Link The row displays the schedule variance for each Fiscal 139
151 Field Title Format Content/Notes Engineering Other Estimating Unexplained Discussion Link Link Link Display Text Year. Click on the Schedule variance link to add or delete schedule changes for each Fiscal Year. The row displays the engineering variance for each Fiscal Year. Click on the Engineering variance link to add or delete engineering changes for each Fiscal Year. The row displays the other variance for each Fiscal Year. Click on the Other variance link to add or delete other changes for each Fiscal Year. The row displays the variance for each Fiscal Year. Click on the Estimating variance link to display Subtotal, Adj. C&P Inflation, and Total Estimating for the Fiscal Years. Also displayed are Total Variance, Non Est. Change, Total Estimating, and Unexplained. The row displays the net variance for each Fiscal Year. The Unexplained Variance row should contain nothing but zeroes. If not, corrective action is required to non-zero rows above the Unexplained row until it displays only zeroes. There is no link. Add My Comments Click on this link to add a Discussion item. Enter desired text to be associated with the program for this section. This information will NOT appear as part of the SAR report. However, it will be viewable by those with edit/review Draft SAR capabilities all the way up the Release Hierarchy. Enter the desired discussion comment then click on Add My Comments to save your text. Edit Comments Click on this link to modify the last discussion comment added. If the current user reviewing the SAR is not the last person to have added a discussion item(s), the last comment will not be editable. Click on the View Base Year $ link ( ) and the following will be shown. Notice that the link changes to, which is the default view as shown above. The only field that permits data entry is the Discussion field. Notice the slide bar ( ), which you can drag to display more years. You can drag it left or right to see desired years. 140

152 Figure 84 - MILCON Command Center Display for Base-Years Screen MILCON Total Variance The Total Variance link on the Command Center will display the same information as the link at the bottom right of the Command Center screen. It summarizes all of the variances listed below (Economic through Estimating). No data entry is required. Total Variance is the delta between the CE and the PCE in both TY$ and BY$ (CE minus PCE) by fiscal year. The fiscal years are then summed to total TY$ and total BY$. Total Variance is calculated automatically by the Computational Model and cannot be changed or edited. It is for review only. The aggregate of multiple appropriations is displayed below along with the Total Variance for each appropriation. Click the Economic Variance link on the bottom right to continue to Economic Variance. Alternatively, you can return to the Command Center to choose a different Cost Variance category by clicking the Command Center button on the bottom left. Notice the slide bar ( ), which you can drag to display more years. You can drag it left or right to see desired years. The report displays a summary of Then-Year dollars (in millions) of each Fiscal Year by Current Estimate, Previous Current Estimate, and Total Variance for MILCON. A View Base 141

153 Year $ link is available in the upper, right-hand corner to show the same display for Base- Year $. Figure 85 - MILCON Total Variance Screen Table 36 - MILCON Total Variance Fields Field Title Format Content/Notes View Base Year $ Link Click on this link and the Base-Years are displayed. The screen image is displayed below. It contains the Current Estimate, Previous C.E. (Current Estimate), and Total Variance for the Fiscal Years. You may also add or edit Discussion entries. Current Estimate Display Displays the Current Estimate for each year. Previous C.E. Display Displays the Previous Current Estimate for each year. Total Variance Discussion Display Button Text Displays the Variance between Current Estimate and Previous Current Estimate for each year. Press the Command Center button to return to the appropriate Command Center. Add My Comments Click on this link to add a Discussion item. Enter desired text to be associated with the program for this section. This information will NOT appear as part of the SAR report. However, it will be 142
154 Field Title Format Content/Notes viewable by those with edit/review Draft SAR capabilities all the way up the Release Hierarchy. Enter the desired discussion comment then click on Add My Comments to save your text. Edit Comments Click on this link to modify the last discussion comment added. If the current user reviewing the SAR is not the last person to have added a discussion item(s), the last comment will not be editable. 143
155 8.3.2 MILCON Economic Variance This displays the economic variance for each Fiscal Year. Click on the Economic variance link from the MILCON Command Center to display PCE BY$ (New Indices) (Previous Current Estimate Base-Year Dollars), PCE BY$ (Old Indices), and Economic Variance for the Fiscal Years. Economic Variance is a change in the Current Estimate (CE) resulting from using a different set of inflation indices than were used in the Previous Current Estimate. No data entry is required. Please review the Economic Variance answers below. Economic Variance is calculated using PCE BY$. The calculation formula is: (PCE BY$ * New Indices) (PCE BY$ * Old Indices). The calculation is done for each fiscal year. This produces a TY$ answer only and the fiscal years are summed to a total TY$. There is no BY$ component to Economic Variance. Economic Variance is calculated automatically by the Computational Model and cannot be changed or edited. If there are multiple appropriations, there will be an aggregate answer that combines the Economic Variance for all appropriations. This aggregate answer is used for the single Economic Variance explanation that the Computation Model automatically creates. In addition, each appropriation will have its own Economic Variance in the page below for review. You can return to the Command Center to choose a different Cost Variance category by clicking the Command Center button on the bottom left. Note that Economic Variance = New Indices Old Indices. Notice the slide bar ( ), which you can drag to display more years. You can drag it left or right to see desired years. 144
156 Figure 86 - MILCON Economic Variance Screen Table 37 - MILCON Economic Variance Fields Field Title Format Content/Notes View Base Year $ PCE BY$ (New Indices) PCE BY$ (Old Indices) Economic Variance Discussion Link Numeric Numeric Numeric Button Text Click on this link and the Base-Years are displayed. The screen image is displayed below. It contains the Current Estimate, Previous C.E. (Current Estimate), and Total Variance for the Fiscal Years. You may also add or edit Discussion entries. Displays the Previous Current Estimate in Base-Year dollars for each year with the new indices. Displays the Previous Current Estimate in Base-Year dollars for each year with the old indices. Displays the Variance between Current Estimate and Previous Current Estimate for each year. Press the Command Center button to return to the appropriate Command Center. Add My Comments Click on this link to add a Discussion item. Enter desired text to be associated with the program for this section. This information will NOT appear as part of the SAR report. However, it will be viewable by those with edit/review Draft SAR capabilities all the way up the Release Hierarchy. Enter the desired 145
157 Field Title Format Content/Notes discussion comment then click on Add My Comments to save your text. Edit Comments Click on this link to modify the last discussion comment added. If the current user reviewing the SAR is not the last person to have added a discussion item(s), the last comment will not be editable. 146
158 8.3.3 MILCON Schedule Variance This displays the schedule variance for each Fiscal Year. Schedule Variance is a change due primarily to a shift in a development, MILCON, or O&M effort not identifiable to buy year quantity changes. Click on the Schedule Variance link from the MILCON Command Center to add or delete schedule changes for each Fiscal Year. Data entry is required. Schedule Variance is defined as a shift in the effort of RDT&E, MILCON, or O&M. The shift in effort could be a stretch-out or acceleration. Schedule Variance cannot be automatically calculated. It must be entered in TY$ by appropriation. If there are multiple appropriations, choose an appropriation by selecting one from the Appropriation dropdown. The dropdown is only visible when there are multiple appropriations. Provide the year by year TY$ costs associated with Schedule Variance. BY$ are automatically calculated by year. Be sure to save your work by clicking the Save button. The Cancel button will return to the last saved condition. Click the Engineering Variance link on the bottom right to continue to Engineering Variance. Alternatively, you can return to the Command Center to choose a different Cost Variance category by clicking the Command Center button on the bottom left. Notice the slide bar ( ), which you can drag to display more years. You can drag it left or right to see desired years. 147
159 Figure 87 - MILCON Schedule Variance Screen Table 38 - MILCON Schedule Variance Fields Field Title Format Content/Notes View Base Year $ Link Click on this link and the Base-Years are displayed. The screen image is displayed below. It contains the Current Estimate, Previous C.E. (Current Estimate), and Total Variance for the Fiscal Years. You may also add or edit Discussion entries. Del Checkbox Click on this checkbox to flag the row for deletion. Explanation Text Edit "New Schedule" or "Change" in the text box, to describe the contents of the row. Years Numeric Enter the Quantity number for the appropriate years. Button Click on the Add Change button to add the change. Button Button Discussion Text. Click on the Delete Change(s) button to delete the marked changes in the Del checkbox. Press the Command Center button to return to the appropriate Command Center. 148
160 Field Title Format Content/Notes Add My Comments Click on this link to add a Discussion item. Enter desired text to be associated with the program for this section. This information will NOT appear as part of the SAR report. However, it will be viewable by those with edit/review Draft SAR capabilities all the way up the Release Hierarchy. Enter the desired discussion comment then click on Add My Comments to save your text. Edit Comments Click on this link to modify the last discussion comment added. If the current user reviewing the SAR is not the last person to have added a discussion item(s), the last comment will not be editable. 149
161 8.3.4 MILCON Engineering Variance This displays the engineering variance for each Fiscal Year. Click on the Engineering variance link from the MILCON Command Center to add or delete engineering changes for each Fiscal Year. The Engineering Variance is the cost change due to an alteration in the physical or functional characteristics of an end item or subsystem. Data entry is required. Engineering Variance is caused by changes in the design or functions of the MILCON effort and cannot be automatically calculated by the Computational Model. Costs are usually known in the Program Office by those that track ECPs. If there are multiple appropriations, choose an appropriation by selecting one from the Appropriation drop-down. The drop-down is only visible when there are multiple appropriations. Click the Add Change button to begin and the Computational Model will insert a New Engineering Change explanation. Do not use the New Engineering Change text in the explanation. Use words that speak to Engineering kinds of changes, like Redesigned brake system due to... Provide any Engineering Variance in TY$ by fiscal year by appropriation below. BY$ are automatically calculated by year. To delete an explanation, check the checkbox in the Del column and click the Delete Change(s) button. Be sure to save your work by clicking the Save button. The Cancel button will return to the last saved condition. Click the Other Variance link on the bottom right to continue to Other Variance. Alternatively, you can return to the Command Center to choose a different Cost Variance category by clicking the Command Center button on the bottom left. Notice the slide bar ( ), which you can drag to display more years. You can drag it left or right to see desired years. 150
, and Total Variance for the Fiscal Years. You may also add or edit Discussion entries.")
162 Figure 88 - MILCON Engineering Variance Screen Table 39 - MILCON Engineering Variance Fields Field Title Format Content/Notes View Base Year $ Link Click on this link and the Base-Years are displayed. The screen image is displayed below. It contains the Current Estimate, Previous C.E. (Current Estimate), and Total Variance for the Fiscal Years. You may also add or edit Discussion entries. Del Checkbox Click on this checkbox to flag the row for deletion. Explanation Text Edit "New Engineering" or "Change" in the text box, to describe the contents of the row. Years Numeric Enter the Quantity number for the appropriate years. Discussion Button Button Button Text Click on the Add Change button to add the change. Click on the Delete Change(s) button to delete the marked changes in the Del checkbox. Press the Command Center button to return to the appropriate Command Center. Add My Comments Click on this link to add a Discussion item. Enter desired text to be associated 151
163 Field Title Format Content/Notes with the program for this section. This information will NOT appear as part of the SAR report. However, it will be viewable by those with edit/review Draft SAR capabilities all the way up the Release Hierarchy. Enter the desired discussion comment then click on Add My Comments to save your text. Edit Comments Click on this link to modify the last discussion comment added. If the current user reviewing the SAR is not the last person to have added a discussion item(s), the last comment will not be editable. 152
164 8.3.5 MILCON Other Variance This displays the other variance for each Fiscal Year. Click on the Other variance link from the MILCON Command Center to add or delete other changes for each Fiscal Year. Other Variance is a change due to natural disasters, work stoppage (e.g., strikes), or similar unforeseeable events not covered in other variance categories. It must be manually entered by the user and must be approved by OSD. Data entry is required. The Other Variance cannot be automatically calculated. It must be entered in TY$ by fiscal year by appropriation. Use of Other Variance is rare. For example, it is used in cases of Natural Disasters or Labor Strikes. Its use must be approved by OSD. Costs are known in the Program Office by those that track the cost of Other changes, usually the cost analyst. If there are multiple appropriations, choose an appropriation by selecting one from the Appropriation drop-down. The drop-down is only visible when there are multiple appropriations. Click the Add Change button to begin and the Computational Model will insert a New Other Change explanation. Do not use the New Other Change text in the explanation. Use words that speak to Other kinds of changes. Provide any Other Variance in TY$ by fiscal year by appropriation below. BY$ are automatically calculated by year. To delete an explanation, check the checkbox in the Del column and click the Delete Change(s) button. Be sure to save your work by clicking the Save button. The Cancel button will return to the last saved condition. Click the Support Variance link on the bottom right to continue to Support Variance. Alternatively, you can return to the Command Center to choose a different Cost Variance category by clicking the Command Center button on the bottom left. Notice the slide bar ( ), which you can drag to display more years. You can drag it left or right to see desired years. 153
165 Figure 89 - MILCON Other Variance Screen Table 40 - MILCON Other Variance Fields Field Title Format Content/Notes View Base Year $ Link Click on this link and the Base-Years are displayed. The screen image is displayed below. It contains the Current Estimate, Previous C.E. (Current Estimate), and Total Variance for the Fiscal Years. You may also add or edit Discussion entries. Del Checkbox Click on this checkbox to flag the row for deletion. Explanation Text Edit "New Other Change" in the text box, to describe the contents of the row. Years Numeric Enter the Quantity number for the appropriate years. Discussion Button Button Button Text Click on the Add Change button to add the change. Click on the Delete Change(s) button to delete the marked changes in the Del checkbox. Press the Command Center button to return to the appropriate Command Center. Add My Comments Click on this link to add a Discussion item. Enter desired text to be associated 154
166 Field Title Format Content/Notes with the program for this section. This information will NOT appear as part of the SAR report. However, it will be viewable by those with edit/review Draft SAR capabilities all the way up the Release Hierarchy. Enter the desired discussion comment then click on Add My Comments to save your text. Edit Comments Click on this link to modify the last discussion comment added. If the current user reviewing the SAR is not the last person to have added a discussion item(s), the last comment will not be editable. 155
167 8.3.6 MILCON Estimating Variance This displays the variance for each Fiscal Year. Click on the Estimating Variance link from the MILCON Command Center to display the Subtotal, Adj. C&P Inflation, and Total Estimating for the Fiscal Years. Also displayed are Total Variance, Non Est. Change, Total Estimating, and Unexplained. Estimating Variance is a change in a program cost due to: Refinement of a Prior Current Estimate. Change in program or cost estimating assumptions and techniques not covered by previous variance categories. Current and Prior inflation adjustment flyaway portion only. Related to Economic Change due to changes in inflation rates. This only occurs in a December SAR. Data entry is required. Estimating Variance reflects a change in estimating assumptions and cannot be automatically calculated by the Computational Model. Costs are known in the Program Office by those that track changes to Estimating, usually the cost analyst. If there are multiple appropriations, choose an appropriation by selecting one from the Appropriation drop-down. The drop-down is only visible when there are multiple appropriations. Click the Add Change button to begin and the Computational Model will insert a New Estimating Change explanation. Do not use the New Estimating Change text in the explanation. Use words that speak to Estimating kinds of changes, like Revised estimate due to... Provide any Estimating Variance in TY$ by fiscal year by appropriation below. BY$ are automatically calculated by year. To delete an explanation, check the checkbox in the Del column and click the Delete Change(s) button. Be sure to save your work by clicking the Save button. The Cancel button will return to the last saved condition. Click the Command Center link on the bottom right to return to the Command Center to review the results of your work in Computational Model. Notice the slide bar ( ), which you can drag to display more years. You can drag it left or right to see desired years. 156
168 Figure 90 - MILCON Estimating Variance Screen Table 41 - MILCON Estimating Variance Fields Field Title Format Content/Notes View Base Year $ Link Click on this link and the Base-Years are displayed. The screen image is displayed below. It contains the Current Estimate, Previous C.E. (Current Estimate), and Total Variance for the Fiscal Years. You may also add or edit Discussion entries. Del Checkbox Click on this checkbox to flag the row for deletion. Explanation Text Edit "New estimating change" in the text box, to describe the contents of the row. 157
169 Field Title Format Content/Notes Years Numeric Enter the Quantity number for the appropriate years. Discussion Button Button Button Text Click on the Add Change button to add the change. Click on the Delete Change(s) button to delete the marked changes in the Del checkbox. Press the Command Center button to return to the appropriate Command Center. Add My Comments Click on this link to add a Discussion item. Enter desired text to be associated with the program for this section. This information will NOT appear as part of the SAR report. However, it will be viewable by those with edit/review Draft SAR capabilities all the way up the Release Hierarchy. Enter the desired discussion comment then click on Add My Comments to save your text. Edit Comments Click on this link to modify the last discussion comment added. If the current user reviewing the SAR is not the last person to have added a discussion item(s), the last comment will not be editable. 158
170 8.4 ACQUISITION O&M COMMAND CENTER The Acq O&M Command Center displays variances for the Fiscal Years shown. O&M appropriations do not report Quantity Variance because, by definition, O&M funding does not purchase either Development or Procurement quantities. Because O&M does not purchase quantities, O&M Support Variance is not reported. No data entry is required on this screen. The goal in the Computational Model is to explain all cost changes since the PCE and have zero Unexplained Variance remaining, both at the Total level and on a yearly basis. Unexplained Variance expresses cost changes that remain unexplained for the Current Estimate (CE). Total Variance is the starting point, so Unexplained Variance is calculated by subtracting the amount of each Cost Variance category from Total Variance for each year. Select the appropriation category that you want to work on from the navigation tree on the far left under the Computational Model. Cost Variance numbers shown in the Command Center are the aggregate of all appropriations in the selected appropriation category. The total amount explained for each Cost Variance category is displayed in the Totals column. The Computational Model automatically calculates Total and Economic Variance for all appropriation categories. For Procurement, the Computational Model also automatically calculates Quantity, Schedule, and Support Variance. There are links in the left column of the table below to each of the Cost Variance Categories. Click a link to work on that Cost Variance category. Alternatively, you can navigate entirely through the Computational Model by clicking the link on the bottom right to go to the next Cost Variance category indicated. Notice the slide bar ( ), which you can drag to display more years. You can drag it left or right to see desired years. The report displays a summary of Then-Year dollars (in millions) of each Fiscal Year by category (e.g., Economic, Schedule, etc.) for Acq O&M. Click on the links (Total Variance through Estimating) to review those variance categories. A View Base Year $ link is available in the upper, right-hand corner to show the same display for Base-Year $. You can drill down into the listed categories by clipping on the links. 159
, and Total Variance for the Fiscal Years.")
171 Figure 91 - Acq O&M Command Center Display Table 42 - Acq O&M Command Center Fields Field Title Format Content/Notes View Base Year $ Total Variance Economic Schedule Link Link Link Link Click on this link and the Base-Years are displayed. The screen image is displayed below. It contains the Current Estimate, Previous C.E. (Current Estimate), and Total Variance for the Fiscal Years. You may also add or edit Discussion entries. This row displays the total variance for each Fiscal Year. Click on the Total Variance link to display Current Estimate, Previous C.E. (Current Estimate), and Total Variance for the Fiscal Years. This row displays the economic variance for each Fiscal Year. Click on the Economic variance link to display PCE BY$ (New Indices) (Previous Current Estimate Base-Year Dollars), PCE BY$ (Old Indices), and Economic Variance for the Fiscal Years. Note that Economic Variance = New Indices Old Indices. This row displays the schedule variance for each Fiscal Year. Click on the Schedule variance link to add or delete 160
172 Field Title Format Content/Notes Engineering Other Estimating Unexplained Discussion Link Link Link Display Text schedule changes for each Fiscal Year. This row displays the engineering variance for each Fiscal Year. Click on the Engineering variance link to add or delete engineering changes for each Fiscal Year. This row displays the other variance for each Fiscal Year. Click on the Other variance link to add or delete other changes for each Fiscal Year. This row displays the variance for each Fiscal Year. Click on the Estimating variance link to display the Subtotal, Adj. C&P Inflation, and Total Estimating for the Fiscal Years. Also displayed are Total Variance, Non Est. Change, Total Estimating, and Unexplained. This row displays the net variance for each Fiscal Year. The Unexplained Variance row should contain nothing but zeroes. If not, corrective action is required to non-zero rows above the Unexplained row until it displays only zeroes. There is no link. Add My Comments Click on this link to add a Discussion item. Enter desired text to be associated with the program for this section. This information will NOT appear as part of the SAR report. However, it will be viewable by those with edit/review Draft SAR capabilities all the way up the Release Hierarchy. Enter the desired discussion comment then click on Add My Comments to save your text. Edit Comments Click on this link to modify the last discussion comment added. If the current user reviewing the SAR is not the last person to have added a discussion item(s), the last comment will not be editable. Click on the View Base Year $ link ( ) and the following will be shown. Notice that the link changes to, which is the default view as shown above. The only field that permits data entry is the Discussion field. Notice the slide bar ( ), which you can drag to display more years. You can drag it left or right to see desired years. 161
173 Figure 92 - Acq O&M Command Center Display for Base-Years 162
. No data entry is required.")
174 8.4.1 Acq O&M Total Variance The Total Variance link from the Acq O&M Command Center will display the same information as the link at the bottom right of the screen. It summarizes all of the variances listed below (Economic through Estimating). No data entry is required. Total Variance is the delta between the CE and the PCE in both TY$ and BY$ (CE minus PCE) by fiscal year. The fiscal years are then summed to total TY$ and total BY$. Total Variance is calculated automatically by the Computational Model and cannot be changed or edited. It is for review only. The aggregate of multiple appropriations is displayed below along with the Total Variance for each appropriation. Click the Economic Variance link on the bottom right to continue to Economic Variance. Alternatively, you can return to the Command Center to choose a different Cost Variance category by clicking the Command Center button on the bottom left. Notice the slide bar ( ), which you can drag to display more years. You can drag it left or right to see desired years. The report displays a summary of Then-Year dollars (in millions) of each Fiscal Year by Current Estimate, Previous Current Estimate, and Total Variance for Acq O&M. A View Base Year $ link is available in the upper, right-hand corner to show the same display for Base- Year $. Figure 93 - Acq O&M Total Variance Screen 163
175 Table 43 - Acq O&M Total Variance Fields Field Title Format Content/Notes View Base Year $ Link Click on this link and the Base-Years are displayed. The screen image is displayed below. It contains the Current Estimate, Previous C.E. (Current Estimate), and Total Variance for the Fiscal Years. You may also add or edit Discussion entries. Current Estimate Display Displays the Current Estimate for each year. Previous C.E. Display Displays the Previous Current Estimate for each year. Total Variance Discussion Display Button Text Displays the Variance between Current Estimate and Previous Current Estimate for each year. Press the Command Center button to return to the appropriate Command Center. Add My Comments Click on this link to add a Discussion item. Enter desired text to be associated with the program for this section. This information will NOT appear as part of the SAR report. However, it will be viewable by those with edit/review Draft SAR capabilities all the way up the Release Hierarchy. Enter the desired discussion comment then click on Add My Comments to save your text. Edit Comments Click on this link to modify the last discussion comment added. If the current user reviewing the SAR is not the last person to have added a discussion item(s), the last comment will not be editable. 164
 (Previous Current Estimate Base-Year Dollars), PCE BY$ (Old Indices), and Economic Variance for")
176 8.4.2 Acq O&M Economic Variance This displays the economic variance for each Fiscal Year. Click on the Economic variance link from the Acq O&M Command Center to display PCE BY$ (New Indices) (Previous Current Estimate Base-Year Dollars), PCE BY$ (Old Indices), and Economic Variance for the Fiscal Years. Economic Variance is a change in the Current Estimate (CE) resulting from using a different set of inflation indices than were used in the Previous Current Estimate. No data entry is required. Please review the Economic Variance answers below. Economic Variance is calculated using PCE BY$. The calculation formula is: (PCE BY$ * New Indices) (PCE BY$ * Old Indices). The calculation is done for each fiscal year. This produces a TY$ answer only and the fiscal years are summed to a total TY$. There is no BY$ component to Economic Variance. Economic Variance is calculated automatically by the Computational Model and cannot be changed or edited. If there are multiple appropriations, there will be an aggregate answer that combines the Economic Variance for all appropriations. This aggregate answer is used for the single Economic Variance explanation that the Computation Model automatically creates. In addition, each appropriation will have its own Economic Variance in the page below for review. You can return to the Command Center to choose a different Cost Variance category by clicking the Command Center button on the bottom left. Notice the slide bar ( ), which you can drag to display more years. You can drag it left or right to see desired years. 165
177 Figure 94 - Acq O&M Economic Variance Screen Table 44 - Acq O&M Economic Variance Fields Field Title Format Content/Notes View Base Year $ PCE BY$ (New Indices) PCE BY$ (Old Indices) Economic Variance Discussion Link Display Display Display Button Text Click on this link and the Base-Years are displayed. The screen image is displayed below. It contains the Current Estimate, Previous C.E. (Current Estimate), and Total Variance for the Fiscal Years. You may also add or edit Discussion entries. Displays the Previous Current Estimate in Base-Year dollars for each year with the new indices. Displays the Previous Current Estimate in Base-Year dollars for each year with the old indices. Displays the Variance between Current Estimate and Previous Current Estimate for each year. Press the Command Center button to return to the appropriate Command Center. Add My Comments Click on this link to add a Discussion item. Enter desired text to be associated with the program for this section. This information will NOT appear as part of the SAR report. However, it will be viewable by those with edit/review Draft SAR capabilities all the way up the Release Hierarchy. Enter the desired discussion comment then click on Add My Comments to save your text. Edit Comments Click on this link to modify the last discussion comment added. If the current user reviewing the SAR is not the last person to have added a discussion item(s), the last comment will not be editable. 166
178 8.4.3 Acq O&M Schedule Variance This displays the schedule variance for each Fiscal Year. Click on the Schedule Variance link from the Acq O&M Command Center to add or delete schedule changes for each Fiscal Year. Schedule Variance is a change due primarily to a shift in a development, MILCON, or O&M effort not identifiable to buy year quantity changes. Data entry is required. Schedule Variance is defined as a shift in the effort of RDT&E&E, MILCON or O&M. The shift in effort could be a stretch-out or acceleration. Schedule Variance cannot be automatically calculated and must be entered in TY$ by appropriation. If there are multiple appropriations, choose an appropriation by selecting one from the Appropriation dropdown. The dropdown is only visible when there are multiple appropriations. Provide the year by year TY$ costs associated with Schedule Variance. BY$ are automatically calculated by year. Be sure to save your work by clicking the Save button. The Cancel button will return to the last saved condition. Click the Engineering Variance link on the bottom right to continue to Engineering Variance. Alternatively, you can return to the Command Center to choose a different Cost Variance category by clicking the Command Center button on the bottom left. Notice the slide bar ( ), which you can drag to display more years. You can drag it left or right to see desired years. 167
, and Total Variance for the Fiscal Years. You may also add or edit Discussion entries.")
179 Figure 95 - Acq O&M Schedule Variance Screen Table 45 - Acq O&M Schedule Variance Fields Field Title Format Content/Notes View Base Year $ Link Click on this link and the Base-Years are displayed. The screen image is displayed below. It contains the Current Estimate, Previous C.E. (Current Estimate), and Total Variance for the Fiscal Years. You may also add or edit Discussion entries. Del Checkbox Click on this checkbox to flag the row for deletion. Explanation Text Edit "New Schedule" or "Change" in the text box, to describe the contents of the row. Years Numeric Enter the Quantity number for the appropriate years. Discussion Button Button Button Text Click on the Add Change button to add the change. Click on the Delete Change(s) button to delete the marked changes in the Del checkbox. Press the Command Center button to return to the appropriate Command Center. Add My Comments Click on this link to add a Discussion item. Enter desired text to be associated 168
180 Field Title Format Content/Notes with the program for this section. This information will NOT appear as part of the SAR report. However, it will be viewable by those with edit/review Draft SAR capabilities all the way up the Release Hierarchy. Enter the desired discussion comment then click on Add My Comments to save your text. Edit Comments Click on this link to modify the last discussion comment added. If the current user reviewing the SAR is not the last person to have added a discussion item(s), the last comment will not be editable. 169
181 8.4.4 Acq O&M Engineering Variance This displays the engineering variance for each Fiscal Year. Click on the Engineering variance link from the Acq O&M Command Center to add or delete engineering changes for each Fiscal Year. Engineering Variance is the cost change due to an alteration in the physical or functional characteristics of an end item or subsystem. Data entry is required. Engineering Variance is caused by changes in the design or functions of the system and cannot be automatically calculated by the Computational Model. Costs are usually known in the Program Office by those that track ECPs. If there are multiple appropriations, choose an appropriation by selecting one from the Appropriation dropdown. The dropdown is only visible when there are multiple appropriations. Click the Add Change button to begin and the Computational Model will insert a New Engineering Change explanation. Do not use the New Engineering Change text in the explanation. Use words that speak to Engineering kinds of changes, like Redesigned brake system due to... Provide any Engineering Variance in TY$ by fiscal year by appropriation below. BY$ are automatically calculated by year. To delete an explanation, check the checkbox in the Del column and click the Delete Change(s) button. Be sure to save your work by clicking the Save button. The Cancel button will return to the last saved condition. Click the Other Variance link on the bottom right to continue to Other Variance. Alternatively, you can return to the Command Center to choose a different Cost Variance category by clicking the Command Center button on the bottom left. Notice the slide bar ( ), which you can drag to display more years. You can drag it left or right to see desired years. 170
, and Total Variance for the Fiscal Years.")
182 Figure 96 - Acq O&M Engineering Variance Screen Table 46 - Acq O&M Engineering Variance Fields Field Title Format Content/Notes View Base Year $ Link Click on this link and the Base-Years are displayed. The screen image is displayed below. It contains the Current Estimate, Previous C.E. (Current Estimate), and Total Variance for the Fiscal Years. You may also add or edit Discussion entries. Del Checkbox Click on this checkbox to flag the row for deletion. Explanation Text Edit "New Engineering" or "Change" in the text box, to describe the contents of the row. Years Numeric Enter the Quantity number for the appropriate years. Discussion Button Button Button Text Click on the Add Change button to add the change. Click on the Delete Change(s) button to delete the marked changes in the Del checkbox. Press the Command Center button to return to the appropriate Command Center. Add My Comments Click on this link to add a Discussion item. Enter desired text to be associated 171
183 Field Title Format Content/Notes with the program for this section. This information will NOT appear as part of the SAR report. However, it will be viewable by those with edit/review Draft SAR capabilities all the way up the Release Hierarchy. Enter the desired discussion comment then click on Add My Comments to save your text. Edit Comments Click on this link to modify the last discussion comment added. If the current user reviewing the SAR is not the last person to have added a discussion item(s), the last comment will not be editable. 172
184 8.4.5 Acq O&M Other Variance This displays the Other variance for each Fiscal Year. Click on the Other variance link from the Acq O&M Command Center to add or delete other changes for each Fiscal Year. Other Variance is a change due to natural disasters, work stoppage e.g., strikes), or similar unforeseeable events not covered in other variance categories. It must be manually entered by the user and must be approved by OSD. Data entry is required. Other Variance cannot be automatically calculated and must be entered in TY$ by fiscal year by appropriation. Use of Other Variance is rare. For example, it is used in cases of Natural Disasters or Labor Strikes. Its use must be approved by OSD. Costs are known in the Program Office by those that track the cost of Other changes, usually the cost analyst. If there are multiple appropriations, choose an appropriation by selecting one from the Appropriation dropdown. The dropdown is only visible when there are multiple appropriations. Click the Add Change button to begin and the Computational Model will insert a New Other Change explanation. Do not use the New Other Change text in the explanation. Use words that speak to Other kinds of changes. Provide any Other Variance in TY$ by fiscal year by appropriation below. BY$ are automatically calculated by year. To delete an explanation, check the checkbox in the Del column and click the Delete Change(s) button. Be sure to save your work by clicking the Save button. The Cancel button will return to the last saved condition. Click the Support Variance link on the bottom right to continue to Support Variance. Alternatively, you can return to the Command Center to choose a different Cost Variance category by clicking the Command Center button on the bottom left. Notice the slide bar ( ), which you can drag to display more years. You can drag it left or right to see desired years. 173
, and Total Variance for the Fiscal Years. You may also add or edit Discussion entries.")
185 Figure 97 - Acq O&M Other Variance Screen Table 47 - Acq O&M Other Variance Fields Field Title Format Content/Notes View Base Year $ Link Click on this link and the Base-Years are displayed. The screen image is displayed below. It contains the Current Estimate, Previous C.E. (Current Estimate), and Total Variance for the Fiscal Years. You may also add or edit Discussion entries. Del Checkbox Click on this checkbox to flag the row for deletion. Explanation Text Edit "New Other Change" in the text box, to describe the contents of the row. Years Numeric Enter the Quantity number for the appropriate years. Discussion Button Button Button Text Click on the Add Change button to add the change. Click on the Delete Change(s) button to delete the marked changes in the Del checkbox. Press the Command Center button to return to the appropriate Command Center. Add My Comments Click on this link to add a Discussion item. Enter desired text to be associated 174
186 Field Title Format Content/Notes with the program for this section. This information will NOT appear as part of the SAR report. However, it will be viewable by those with edit/review Draft SAR capabilities all the way up the Release Hierarchy. Enter the desired discussion comment then click on Add My Comments to save your text. Edit Comments Click on this link to modify the last discussion comment added. If the current user reviewing the SAR is not the last person to have added a discussion item(s), the last comment will not be editable. 175
187 8.4.6 Acq O&M Estimating Variance This displays the Estimating variance for each Fiscal Year. Click on the Estimating Variance link from the Acq O&M Command Center to display Subtotal, Adj. C&P Inflation, and Total Estimating for the Fiscal Years. Also displayed are Total Variance, Non Est. Change, Total Estimating, and Unexplained. Estimating Variance is a change in a program cost due to: Refinement of a Prior Current Estimate. Change in program or cost estimating assumptions and techniques not covered by previous variance categories. Current and Prior inflation adjustment flyaway portion only. Related to Economic Change due to changes in inflation rates. This only occurs in a December SAR. Data entry is required. Estimating Variance reflects a change in estimating assumptions and cannot be automatically calculated by the Computational Model. Costs are known in the Program Office by those that track changes to Estimating, usually the cost analyst. If there are multiple appropriations, choose an appropriation by selecting one from the Appropriation drop-down. The drop-down is only visible when there are multiple appropriations. Click the Add Change button to begin and the Computational Model will insert a New Estimating Change explanation. Do not use the New Estimating Change text in the explanation. Use words that speak to Estimating kinds of changes, like Revised estimate due to... Provide any Estimating Variance in TY$ by fiscal year by appropriation below. BY$ are automatically calculated by year. To delete an explanation, check the checkbox in the Del column and click the Delete Change(s) button. Be sure to save your work by clicking the Save button. The Cancel button will return to the last saved condition. Click the Command Center link on the bottom right to return to the Command Center to review the results of your work in Computational Model. 176
188 Figure 98 - Acq O&M Estimating Variance Screen Table 48 - Acq O&M Estimating Variance Fields Field Title Format Content/Notes View Base Year $ Link Click on this link and the Base-Years are displayed. The screen image is displayed below. It contains the Current Estimate, Previous C.E. (Current Estimate), and Total Variance for the Fiscal Years. You may also add or edit Discussion entries. Del Checkbox Click on this checkbox to flag the row for deletion. Explanation Text Edit "New estimating change" in the text box, to describe the contents of the row. Years Numeric Enter the Quantity number for the appropriate years. Button Click on the Add Change button to add the change. 177
189 Field Title Format Content/Notes Discussion Button Button Text Click on the Delete Change(s) button to delete the marked changes in the Del checkbox. Press the Command Center button to return to the appropriate Command Center. Add My Comments Click on this link to add a Discussion item. Enter desired text to be associated with the program for this section. This information will NOT appear as part of the SAR report. However, it will be viewable by those with edit/review Draft SAR capabilities all the way up the Release Hierarchy. Enter the desired discussion comment then click on Add My Comments to save your text. Edit Comments Click on this link to modify the last discussion comment added. If the current user reviewing the SAR is not the last person to have added a discussion item(s), the last comment will not be editable. 178
190 APPENDIX A INSTRUCTION SCREENS This section displays the Instruction Screens for the various sections. These may be helpful to review prior to entering data for a given section. Use Hide to keep the Instructions from displaying. Use Show to display the Instructions. The specific functions of these buttons are shown below: The Hide ( displayed. The Show ( ) button hides the Instructions for the current section being ) button redisplays the Instructions for the current section. 179

191 A.1 Cost Variance Summary Instructions Figure 99 - Cost Variance Summary Instructions Screen 180

192 A.2 Change Explanations Instructions Figure Change Explanations Instructions Screen 181

193 A.3 Command Center Instructions Figure Command Center Instructions Screen 182

194 A.4 Total Variance Instructions Figure Total Variance Instructions Screen 183

195 A.5 Economic Variance Instructions Figure Economic Variance Instructions Screen 184

196 A.6 Quantity Variance Instructions Figure Quantity Variance Instructions Screen 185

197 A.7 Schedule Variance Instructions Figure Schedule Variance Instructions Screen 186

198 A.8 Engineering Variance Instructions Figure Engineering Variance Instructions Screen 187

199 A.9 Other Variance Instructions Figure Other Variance Instructions Screen 188

200 A.10 Support Variance Instructions Figure Support Variance Instructions Screen 189

201 A.11 Estimating Variance Instructions Figure Estimating Variance Instructions Screen 190

202 A.12 Procurement Quantity & Schedule Variance Instructions Figure Procurement Quantity & Schedule Variance Instructions Screen 191
203 A.13 Procurement Cost Quantity Data Instructions Figure Procurement Cost Quantity Data Instructions Screen 192

204 A.14 Procurement Cost Quantity Curve Instructions Figure Procurement Cost Quantity Curve Instructions Screen 193

205 A.15 Procurement Quantity Variance Instructions Figure Procurement Quantity Variance Instructions Screen 194

206 A.16 Procurement Quantity Allocations Instructions Figure Procurement Quantity Allocations Instructions Screen 195

207 A.17 Procurement Manual Quantity/Schedule Override Instructions Figure Procurement Manual Quantity/Schedule Override Instructions Screen 196

208 A.18 Procurement Additional Quantity Variance Instructions Figure Procurement Additional Quantity Variance Instructions Screen 197

209 A.19 Procurement Schedule Variance Instructions Figure Procurement Schedule Variance Instructions Screen 198

210 A.20 Procurement Additional Schedule Variance Instructions Figure Procurement Additional Schedule Variance Instructions Screen 199
Selected Acquisition Report (SAR)
") Selected Acquisition Report (SAR) RCS: DD-A&T(Q&A)823-224 B-2 Extremely High Frequency SATCOM and Computer Increment 1 (B-2 EHF Inc 1) As of FY 2017 President's Budget Defense Acquisition Management Information
Selected Acquisition Report (SAR) RCS: DD-A&T(Q&A)823-224 B-2 Extremely High Frequency SATCOM and Computer Increment 1 (B-2 EHF Inc 1) As of FY 2017 President's Budget Defense Acquisition Management Information
Selected Acquisition Report (SAR)
") Selected Acquisition Report (SAR) RCS: DD-A&T(Q&A)823-468 B61 Mod 12 Life Extension Program Tailkit Assembly (B61 Mod 12 LEP TKA) As of FY 2016 President's Budget Defense Acquisition Management Information
Selected Acquisition Report (SAR) RCS: DD-A&T(Q&A)823-468 B61 Mod 12 Life Extension Program Tailkit Assembly (B61 Mod 12 LEP TKA) As of FY 2016 President's Budget Defense Acquisition Management Information
Selected Acquisition Report (SAR)
") Selected Acquisition Report (SAR) RCS: DD-A&T(Q&A)823-384 Air and Missile Defense Radar (AMDR) As of FY 2017 President's Budget Defense Acquisition Management Information Retrieval (DAMIR) March 8, 2016
Selected Acquisition Report (SAR) RCS: DD-A&T(Q&A)823-384 Air and Missile Defense Radar (AMDR) As of FY 2017 President's Budget Defense Acquisition Management Information Retrieval (DAMIR) March 8, 2016
Innovation in Defense Acquisition Oversight: An Exploration of the AT&L Acquisition Visibility SOA
 Innovation in Defense Acquisition Oversight: An Exploration of the AT&L Acquisition Visibility SOA Presented: May 13, 2010 Russell Vogel Acquisition Resource and Analysis Office of the Under Secretary
Finally, the Department determined that modernizing 47 C-5B aircraft and 2 C-5C aircraft best meets the essentiality criteria set forth by the JROC.
 "Such acquisition program is essential to the national security" The Joint Requirements Oversight Council (JROC) 1 conducted an assessment of the C-5 Reliability Enhancement and Re-engining Program (RERP)
Selected Acquisition Report (SAR)
") Selected Acquisition Report (SAR) RCS: DD-A&T(Q&A)823-437 AB3B NEW BUILD As of December 31, 2011 Defense Acquisition Management Information Retrieval (DAMIR) UNCLASSIFIED Table of Contents Program Information
Selected Acquisition Report (SAR) RCS: DD-A&T(Q&A)823-437 AB3B NEW BUILD As of December 31, 2011 Defense Acquisition Management Information Retrieval (DAMIR) UNCLASSIFIED Table of Contents Program Information
Department of Defense INSTRUCTION
 Department of Defense INSTRUCTION NUMBER 5000.73 June 9, 2015 Incorporating Change 1, October 2, 2017 CAPE SUBJECT: Cost Analysis Guidance and Procedures References: See Enclosure 1 1. PURPOSE. In accordance
05_Create Expense Report - New
 05_Create Expense Report - New Purpose: How to Access: Audience: The purpose of this task is to create a new Expense Report. Open the Expenses worklet and click Create Expense Report from the Actions section.
Policy. Chapter 6. Accessing the Policy. Nexsure Training Manual - CRM. In This Chapter
 Nexsure Training Manual - CRM Policy In This Chapter Accessing the Policy Adding a Thank You Letter Editing the Policy Adding, Editing and Removing Assignments Admitted Carrier Identification Summary of
Maintaining Budget Change Requests
 Maintaining Budget Change Requests This document describes the functions used in TEAMS to enter and approve requests to move funds from one General Ledger account to another. In this document: Request
GUIDE FOR COMPLETING CO-PLAN DD 2794: COST AND SOFTWARE DATA REPORTING (CSDR) & EARNED VALUE MANAGEMENT (EVM) CO-PLAN
 & EARNED VALUE MANAGEMENT (EVM) CO-PLAN") GUIDE FOR COMPLETING CO-PLAN DD 2794: COST AND SOFTWARE DATA REPORTING (CSDR) & EARNED VALUE MANAGEMENT (EVM) CO-PLAN JANUARY 2017 The CSDR/EVM Co-Plan is a joint effort between the Office of the Secretary
GUIDE FOR COMPLETING CO-PLAN DD 2794: COST AND SOFTWARE DATA REPORTING (CSDR) & EARNED VALUE MANAGEMENT (EVM) CO-PLAN JANUARY 2017 The CSDR/EVM Co-Plan is a joint effort between the Office of the Secretary
How to Use Fundamental Data in TradingExpert Pro
 Chapter VII How to Use Fundamental Data in TradingExpert Pro In this chapter 1. Viewing fundamental data on the Fundamental Report 752 2. Viewing fundamental data for individual stocks 755 3. Building
Funding Policies, Part 2
 Funding Policies, Part 2 Intro to Funding Policies (Part 2) Intro to Funding Policies (Part 2) Introduction to Funding Policies (Part 2) Page 1 of 2 Approximate Length: 1 hour Welcome to the Funding Policies
DAMIR / SOA Conference Keynote
 0 DAMIR / SOA Conference Keynote 21 October 2009 Dr. Nancy Spruill Acquisition Resources and Analysis Office of the Under Secretary of Defense for Acquisition, Technology and Logistics 1 View from the
Module 2 Lesson 204, Fiscal Topics
 Module 2 Lesson 204, Fiscal Topics RDT&E Team, TCJ5-GC Oct 2017 1 Overview/Objectives The intent of lesson 204 is to provide instruction on: Basic appropriation rules Anti-Deficiency Act Major fund categories
Module: Budget Processing Topic: Next Year Budget Entry Next Year Budget Entry Munis Version 11
 Module: Budget Processing Topic: Next Year Budget Entry Next Year Budget Entry Munis Version 11 Objective This document provides instructions on how to enter next year budget requests. Overview Departments
P&C Rate Data Collection and Management System. PCRDCMS Rate Collection User Manual
 State of Florida Department of Financial Services Office of Insurance Regulation P&C Rate Data Collection and Management System (PCRDCMS) PCRDCMS Rate Collection User Manual Author: Vendor: Version: Jon
Submitting Expense Reports via SIRVA Connect Portal. Quick Reference Guide for the Global Employee
 Learn how to submit expense reports from the SIRVA Connect Portal. Submitting Expense Reports via SIRVA Connect Portal Quick Reference Guide for the Global Employee Table of Contents Set up Direct Deposit
UNITED STATES TRANSPORTATION COMMAND (USTRANSCOM)
") UNITED STATES TRANSPORTATION COMMAND (USTRANSCOM) PROGRAM EXECUTIVE OFFICE -TRANSCOM (PEO-T) DEFENSE PERSONAL PROPERTY SYSTEM (DPS) CLAIMS MANAGEMENT USER GUIDE FOR DOD CUSTOMERS Version 10 Program Manager:
UNITED STATES TRANSPORTATION COMMAND (USTRANSCOM) PROGRAM EXECUTIVE OFFICE -TRANSCOM (PEO-T) DEFENSE PERSONAL PROPERTY SYSTEM (DPS) CLAIMS MANAGEMENT USER GUIDE FOR DOD CUSTOMERS Version 10 Program Manager:
DUS DocWay TM Loan Documents User Guide. January 2019
 DUS DocWay TM Loan Documents User Guide January 2019 Table of Contents Getting Started with DUS DocWay... 1 Welcome Page Navigation... 3 Loan Documents Navigation... 6 Update Document Category and Type...
07_Create Expense Report From Spend Authorization (SA)
") 07_Create Expense Report From Spend Authorization (SA) Purpose: How to Access: Audience: Helpful Hints: Procedure: The purpose of this task is to create an Expense Report from a Spend Authorization. Open
07_Create Expense Report From Spend Authorization (SA) Purpose: How to Access: Audience: Helpful Hints: Procedure: The purpose of this task is to create an Expense Report from a Spend Authorization. Open
Margin Direct User Guide
 Version 2.0 xx August 2016 Legal Notices No part of this document may be copied, reproduced or translated without the prior written consent of ION Trading UK Limited. ION Trading UK Limited 2016. All Rights
DEFENSE ACQUISITION UNIVERSITY BCF Fundamentals of Business Financial Management
 1 Recognize the statutory and regulatory requirements that impact program budget planning and formulation. Identify how OMB Circulars (No. A-11 and A-123) provide instruction on the preparation and submission
FATCA Administration and Configuration Guide. Release 2.0 May 2014
 FATCA Administration and Configuration Guide Release 2.0 May 2014 FATCA Administration and Configuration Guide Release 2.0 May 2014 Document Control Number: 9MN12-62310026 Document Number: 14-FCCM-0002-2.0-01
USER GUIDE. October 2015
 TM USER GUIDE October 2015 CONTENTS ACCESS SMARTCLOSE TO INITIATE COLLABORATION... 1 INVITE COLLABORATORS... 3 PIPELINE VIEW... 4 INSIDE SMARTCLOSE... 5 OWNER DROPDOWN... 5 THE AUDIT SYSTEM... 6 THE MESSAGING
Advanced Financial Statements
 Sage 100 Fund Accounting Advanced Financial Statements STUDENT WORKBOOK SAGE LEARNING SERVICES Important Notice: Authentic Sage 100 Fund Accounting training guides display a holographic image on the front
Complete Closing Enterprise Closing Disclosure Form
 Complete Closing Enterprise Closing Disclosure Form VERSION 8.3 RamQuest.com 2015 RamQuest, Inc. Table of Contents Introduction... 5 Loan Estimate... 5 Closing Disclosure Form... 5 Accessing the CDF...
Money Management (MX) Frequently Asked Question s
 Frequently Asked Question s") Money Management (MX) Frequently Asked Question s Account Maintenance How do I get rid of duplicate accounts? How do I permanently delete an account? How do I hide/exclude an account? How do I rename my
Money Management (MX) Frequently Asked Question s Account Maintenance How do I get rid of duplicate accounts? How do I permanently delete an account? How do I hide/exclude an account? How do I rename my
User Guide July 2016
 User Guide July 2016 D E S I G N & D RAF T E D F O R I M P L E M E N T I N G A G E N C I E S User Guide World Bank Group Fraud & Corruption Hotline: 1-202-458-7677 Table of Contents Abbreviations Legends
Claims. Chapter 11. Adding a Claim. HOW to Add a Claim. Nexsure Training Manual - CRM. In This Chapter
 Nexsure Training Manual - CRM Claims In This Chapter Adding a Claim Populating the Claim form Tracking the Claim Delivering the Claim form Closing and Reopening the Claim Adding a Claim When a claim is
Setting up TaxSlayer Pro Online
 Setting up TaxSlayer Pro Online To set up TaxSlayer ProOnline as a Favorite in your web browser, use the following steps: 1. Open Internet Explorer, Mozilla Firefox, or Google Chrome. 2. Type https://vita.taxslayerpro.com
Integrating Business and Financial Management Functions
 PROGRAM OFFICE MANAGEMENT Integrating Business and Financial Management Functions A program executive officer once said, You can t be effective in the world of acquisition management unless you have an
Project Budgets! Stay in Control of Your Projects' Finances with. Project Budget Quick Reference WHAT CAN THE PROJECT BUDGETS FEATURE DO FOR ME?
 Stay in Control of Your Projects' Finances with Project Budgets! HOW DOES THE PROJECT BUDGETS FEATURE WORK? The Project Budget feature displays planned billings or costs. Actuals versus Planned View compares
4.9 PRINTING LENDING FORMS
 4.9 PRINTING LENDING FORMS In the Home library material window, you can print out a lending form, i.e. the list of material recorded for the member. 1. Highlight the Member class and select the Class /
In this user guide, we will demonstrate how to provide an overview of Advisor Investment Assumptions.
 In this user guide, we will demonstrate how to provide an overview of Advisor Investment Assumptions. Advisor Investment Assumptions are a single set of investment assumptions used globally across clients.
Reference Document. Customer Refunds
 Document Overview This document is being provided to explain how to generate a refund check to a customer. This document explains the process, setup involved and how the transaction affects the general
Contents. Introduction
 Getting Started Introduction O&M Profiler User Guide (v6) Contents Contents... 1 Introduction... 2 Logging In... 2 Messages... 3 Options... 4 Help... 4 Home Screen... 5 System Navigation... 5 Dashboard...
Construction Budget Application Using Procorem
 Construction Budget Application Using Procorem User Guide Updated: August 2, 2018 Trademarked names may appear throughout this document. Rather than list the names and entities that own the trademark or
TAA Scheduling. User s Guide
 TAA Scheduling User s Guide While every attempt is made to ensure both accuracy and completeness of information included in this document, errors can occur, and updates or improvements may be implemented
Quality Control Advisor SM. User Guide. January 2018
 Quality Control Advisor SM User Guide January 2018 Notice The information in this document is intended to provide general guidance to Freddie Mac Seller/Servicers. The information is offered as an aid
Genium INET PRM User's Guide
 TM Genium INET NASDAQ Nordic Version: 4.0.0250 Document Version: 11 Publication Date: Wednesday, 6th May, 2015 Confidentiality: Non-confidential Whilst all reasonable care has been taken to ensure that
Banner Finance Self Service Budget Development Training Guide
 Banner Finance Self Service Budget Development Training Guide Table of Contents Introduction and Assistance...3 FOAPAL....4 Accessing Finance Self Service...5 Create a Budget Development Query... 6 Query
Customer Refunds. Reference Guide For Versions Last Revised: December 29, SedonaOffice
 Reference Guide For Versions 5.7.24+ Last Revised: December 29, 2015 SedonaOffice 8401 Chagrin Blvd. Suite 15B 45185 Joy Road Chagrin Falls, OH 44023 Canton, MI 48187 440.247.5602 Table of Contents About
Introduction to Client Online
 Introduction to Client Online Trade Finance Guide TradeFinanceNewClientsV2Sept15 Contents Introduction 3 Welcome to your introduction to Client Online 3 If you have any questions 3 Logging In 4 Welcome
FATCA Administration and Configuration Guide. Release April 2015
 FATCA Administration and Configuration Guide Release 6.2.5 April 2015 FATCA Administration and Configuration Guide Release 6.2.5 April 2015 Part Number: E62969_14 Oracle Financial Services Software, Inc.
Central Budget Entry Munis - Financials: Central Budget Entry
 MU-FN-8-F, MU-FN-14-C Central Budget Entry Munis - Financials: Central Budget Entry CLASS DESCRIPTION This class will provide an overview of the Central Budget Entry program that is new to Munis version
 Page 1 of 7 Budget Exhibits Introduction to Budget Exhibits Introduction to Budget Exhibits index page 1 of 7 Approximate Length: 20 minutes Welcome to the Introduction of Budget Exhibits lesson of Budget
Project Budgets! Stay in Control of Your Projects' Finances with. Project Budget Quick Reference WHAT CAN THE PROJECT BUDGETS FEATURE DO FOR ME?
 Stay in Control of Your Projects' Finances with Project Budgets! HOW DOES THE PROJECT BUDGETS FEATURE WORK? The Project Budget feature displays planned billings or costs. Actuals versus Planned View compares
Budget - By Salesperson
 Budget - By Salesperson Entering a budget is easy. Follow these five steps to get started. Version 2013.12.21.01 1 Create a template. Before you can enter a budget, you first need to create a template.
Monthly Acquisition Report (MAR) Guidebook
 Guidebook") Monthly Acquisition Report (MAR) Guidebook March 2016 Version 3.0 Table of Contents Purpose and Control... 3 MAR Reporting Overview... 4 Page 1: Program Assessment / Top Issues... 5 Assessments Area...
Monthly Acquisition Report (MAR) Guidebook March 2016 Version 3.0 Table of Contents Purpose and Control... 3 MAR Reporting Overview... 4 Page 1: Program Assessment / Top Issues... 5 Assessments Area...
SLAS CLEARINGHOUSE REPORTING ENTITY MANUAL SEPTEMBER 2017
 SLAS CLEARINGHOUSE REPORTING ENTITY MANUAL SEPTEMBER 2017 T A B LE OF CONTENTS 1. INTRODUCTION... 4 1.1. Purpose of this Document... 4 1.2. Intended Audience... 4 1.3. SLAS Clearinghouse Staff Contact
MSI General Ledger Version 7.5
 MSI General Ledger Version 7.5 User s Guide Harris Local Government 1860 W. Winchester Road, Ste 204 Libertyville, IL 60048 Phone: (847) 362-2803 Fax: (847) 362-3347 Contents are the exclusive property
Chapter 10 Administration
 Chapter 10 Administration ibais User Manual BA Insurance Systems Chapter 10 Table of Contents CHAPTER 10 - ADMINISTRATION... 10-1 OVERVIEW... 10-1 HOW TO ACCESS THE ADMINISTRATION FUNCTIONS... 10-1 END
=- ~ = _. ..._ I Pil ge 1 of 19 Ill- Back Next. LOG 200 I ntermediate Acquisition Logistics
 l esson 6.6 - Budgeting Phase RESOURCES I PRINT I HELP Welcome to Budgeting Phase This lesson introduces the Budgeting phase, to include its: Products Major activities Timeline Principal players --...
UNIVERSITY OF GHANA OFFICE OF RESEARCH, INNOVATION AND DEVELOPMENT (ORID) Grant Application Guide
 Grant Application Guide") UNIVERSITY OF GHANA OFFICE OF RESEARCH, INNOVATION AND DEVELOPMENT (ORID) Grant Application Guide Step 1: Login Process 1. Visit the UG-Research Management Application Portal (UG-ReMAP) to initiate your
UNIVERSITY OF GHANA OFFICE OF RESEARCH, INNOVATION AND DEVELOPMENT (ORID) Grant Application Guide Step 1: Login Process 1. Visit the UG-Research Management Application Portal (UG-ReMAP) to initiate your
emerchantview Service July 23, 2010
 emerchantview Service July 23, 2010 2010 FIRST DATA CORPORATION All Rights Reserved. Printed in U.S.A. This document contains confidential and proprietary information of First Data Corporation. You may
Release Please distribute to all Spectra users in your company.
 Release 8.2.0 DECEMBER 2018 Please distribute to all Spectra users in your company. Support Email: support@spectra.ca Visit us online at: www.spectra.ca Support Telephone: (866) 718-2345 Support Fax: (866)
Correspondent XChange SM Functionality Manual. April 2019
 SM Functionality Manual April 2019 Table of Contents Overview of SM... 2 Third Party Process Flow for the... 2 Originator Pipeline, Navigation and Functions... 2 Create and Access Loans in Loan Selling
Selected Acquisition Report (SAR)
") Selected Acquisition Report (SAR) RCS: DD-A&T(Q&A)823-303 Ship to Shore Connector Amphibious Craft (SSC) As of FY 2016 President's Budget Defense Acquisition Management Information Retrieval (DAMIR) UNCLASSIFIED
Selected Acquisition Report (SAR) RCS: DD-A&T(Q&A)823-303 Ship to Shore Connector Amphibious Craft (SSC) As of FY 2016 President's Budget Defense Acquisition Management Information Retrieval (DAMIR) UNCLASSIFIED
Multifamily Securities Investor Access Desk Reference Manual
 Multifamily Securities Investor Access Manual February 2013 Contents 1 Application Overview... 3 2 Minimum Browser Requirements... 3 3 Contacting Investor Access Tool Administrator... 3 4 Accessing and
Introduction to Cost Analysis. Introduction to Cost Analysis
 Cost Analysis Introduction to Cost Analysis Introduction to Cost Analysis Introduction to Cost Analysis Terms and Concepts Page 1 of 2 Approximate Length: 2 hour, 20 minutes Welcome to the Cost Analysis
Lender Connect Collaboration
 Lender Connect Collaboration When working in files that were originated via RealEC/Closing Insight, the Lender will send over a Closing product with Event Code 431 - Closing Instructions. Below provides
Fiscal Closing Methods Summary
 Fiscal Closing Methods Summary Update 1/27/2017 FALSC 1 What is Fiscal Close? In general terms, Fiscal Closing is the process of closing one set of financial books at the end of the current fiscal year
Reference Guide. Sales and Use Tax e-services Webinar January 2018
 Reference Guide Sales and Use Tax e-services Webinar January 2018 This course is a live demonstration of e-services related to Minnesota sales and use tax. The webinar is designed for e- Services users
CCH Fixed Asset Register Quick Start Guide
 CCH Fixed Asset Register 2017.1 Quick Start Guide Legal Notice Disclaimer Wolters Kluwer (UK) Limited has made every effort to ensure the accuracy and completeness of these Release Notes. However, Wolters
This document contains a list of amendments for the Siebel system screens. Contents
 This document contains a list of amendments for the Siebel system screens. Contents 1. Currency Field... 1 2. Modifications in Agreement Creation... 1 3. Competition Field... 2 4. Expand All (+) and Collapse
Bank Reconciliation Processing SYSTEM ADMINISTRATION AND PROCESSING GUIDE. Last revised: 8/19/10 12:22 PM
 Bank Reconciliation Processing SYSTEM ADMINISTRATION AND PROCESSING GUIDE Last revised: 8/19/10 12:22 PM New World Systems 1 CONTENTS Contents... 1 Introduction... 3 System Administrator Guide... 4 Company
Selected Acquisition Report (SAR)
") Selected Acquisition Report (SAR) RCS: DD-A&T(Q&A)823-303 Ship to Shore Connector Amphibious Craft (SSC) As of FY 2017 President's Budget Defense Acquisition Management Information Retrieval (DAMIR) March
Selected Acquisition Report (SAR) RCS: DD-A&T(Q&A)823-303 Ship to Shore Connector Amphibious Craft (SSC) As of FY 2017 President's Budget Defense Acquisition Management Information Retrieval (DAMIR) March
Credit Card Processing Guide
 Credit Card Processing Guide A Guide For Processing Transactions With The Integrity Edge Software I Integrity Credit Card Processing Table of Contents Part I Credit Card Processing Setup 1 Part II Credit
Fund Details: Multi Fund Panel & COP Header
 Fund Details: Multi Fund Panel & COP Header Summary of Multi Fund Panel The purpose of the multi fund panel is to allow the user to quickly reference recently used and viewed closeout packets. The multi
Epicor Tax Connect for Eclipse. Release 9.0.3
 Epicor Tax Connect for Eclipse Release 9.0.3 Disclaimer This document is for informational purposes only and is subject to change without notice. This document and its contents, including the viewpoints,
Synaptic Analyser USER GUIDE
 Synaptic Analyser USER GUIDE Version 1.0 October 2017 2 Contents 1 Introduction... 3 2 Logging in to Synaptic Analyser... 3 3 Client Screen... 5 3.1 Client Details... 6 3.2 Holdings... 6 3.3 Income Sources...
Citi Trade Portal Letter of credit. InfoTrade tel
 Citi Trade Portal Letter of credit InfoTrade tel. 0 801 258 369 infotrade@citi.com CitiDirect Technical Assistance tel. 0 801 343 978, +48 (22) 690 15 21 Monday Friday 8.00 17.00 helpdesk.ebs@citi.com
Getting Ready to Trade
 Section VI. Getting Ready to Trade In This Section 1. Adding new securities 78 2. Updating your data 79 3. It's important to keep your data clean 80 4. Using Real-Time Alerts 81 5. Monitoring your tickers
ShelbyNext Financials: General Ledger Budgeting
 ShelbyNext Financials: General Ledger Budgeting (Course #F136) Presented by: Erin Ogletree Shelby Contract Trainer 2018 Shelby Systems, Inc. Other brand and product names are trademarks or registered trademarks
CASH ADVANCES TABLE OF CONTENTS
 CASH ADVANCES TABLE OF CONTENTS Overview... 2 Responsibilities... 2 Delegate Entry Authority to Other Users... 2 Cash Advance Tips and Reminders... 4 Create and Manage... 5 Create a Cash Advance for Yourself...
Opening a pensionsync account for the first time
 Set-up user guide Table of contents Opening a pensionsync account for the first time... 2 How to open an Account... 2 Understanding your Account... 4 Viewing your account... 4 Account Details... 5 Payroll
PROFITstar November PROFITstar Budget Manager Reference Guide. Hosted Version
 Table of Contents Welcome to Budget Manager... 1 Budget Administrators... 2 Prerequisites for Completing a Budget... 2 Exporting Data... 2 User Setup and Permissions... 4 Fixed Asset Setup...10 Open Budget
BudgetPak User Guide FY1718
 BudgetPak User Guide FY1718 Contents Overview... 2 About Your FY1718 Budget... 2 Logging In to BudgetPak... 3 Reviewing Current and Historical Budget and Actual Information... 4 Creating Your FY1718 Budget...
Oracle Banking Digital Experience
 Oracle Banking Digital Experience US Originations Auto Loans User Manual Release 18.2.0.0.0 Part No. E97823-01 June 2018 US Originations Auto Loans User Manual June 2018 Oracle Financial Services Software
NFX TradeGuard User's Guide
 NFX TradeGuard User's Guide NASDAQ Futures, Inc. (NFX) Version: 4.1.1229 Document Version: 4 5 Publication Date: Monday, 12 th Dec, 2016 Confidentiality: Non-confidential Genium, INET, ITCH, CONDICO, EXIGO,
The claims will appear on the list in order of Date Created. The search criteria at the top of the list will assist you in locating past claims.
 P r a c t i c e M a t e M a n u a l 63 CLAIMS/BILLING TAB Your claim submissions are managed in the Claims/Billing Tab. Claims can be printed, deleted, submitted or unsubmitted here, and rejected or failed
Dividend Oracle FLEXCUBE Investor Servicing Release 12.0 [April] [2012] Oracle Part Number E
![Dividend Oracle FLEXCUBE Investor Servicing Release 12.0 [April] [2012] Oracle Part Number E](/thumbs/78/78475113.jpg "Dividend Oracle FLEXCUBE Investor Servicing Release 12.0 [April] [2012] Oracle Part Number E") Dividend Oracle FLEXCUBE Investor Servicing Release 12.0 [April] [2012] Oracle Part Number E51528-01 Table of Contents Dividend 1. ABOUT THIS MANUAL... 1-1 1.1 INTRODUCTION... 1-1 1.2 RELATED DOCUMENTS...
Dividend Oracle FLEXCUBE Investor Servicing Release 12.0 [April] [2012] Oracle Part Number E51528-01 Table of Contents Dividend 1. ABOUT THIS MANUAL... 1-1 1.1 INTRODUCTION... 1-1 1.2 RELATED DOCUMENTS...
Sage Tax Services User's Guide
 Sage 300 2017 Tax Services User's Guide This is a publication of Sage Software, Inc. Copyright 2016. Sage Software, Inc. All rights reserved. Sage, the Sage logos, and the Sage product and service names
Oracle Banking Digital Experience
 Oracle Banking Digital Experience US Originations Auto Loans User Manual Release 18.1.0.0.0 Part No. E92727-01 January 2018 US Originations Auto Loans User Manual January 2018 Oracle Financial Services
VIPS IMPREST ACCOUNT,
 VIPS IMPREST ACCOUNT, your budget related accounting System Table of content 1. INSTALLATION OF THE PROGRAMME 2 1.1 USERS OF THE PROGRAMME 2 1.2 HOW TO INSTALL THE PROGRAMME 2 2. THE MAIN SCREEN 2 3. PRELIMINARY
CCH Corporation Tax. User Guide
 CCH Corporation Tax User Guide Disclaimer Wolters Kluwer has made every effort to ensure the accuracy and completeness of this Training Manual. However, Wolters Kluwer, its staff and agents will not be
Data Input. User Guide
 Data Input User Guide US / Canada UK / Europe Australia Hong Kong +1 866 408 3273 +44 (0) 207 651 0800 +61 (0) 2 8211 2717 +852 2293 2390 support@evestment.com europe@evestment.com australia@evestment.com
UCAA Expansion Application Insurer User Guide December 2017
 UCAA Expansion Application Insurer User Guide December 2017 2017 National Association of Insurance Commissioners All rights reserved. Revised Edition National Association of Insurance Commissioners NAIC
Know Your Customer v7.1 For PRPC 7.1. Demonstration Script
 Know Your Customer v7.1 For PRPC 7.1 Demonstration Script Copyright 2013 Pegasystems Inc., Cambridge, MA All rights reserved. This document describes products and services of Pegasystems Inc. It may contain
Commodity Contract & Market Valuation
 Commodity Contract & Market Valuation Presented by: Allen Smith and Kyle Klenke John Deere Agri Services 2009 Customer Conference February 18-20, 2009 Orlando, FL Copyright 2009 John Deere Agri Services,
Quick Reference Guide: General Budget Change
 Quick Reference Guide: General Budget Change In the USC Kuali system, every type of transaction is created and submitted in the form of an electronic document referred to as an edoc. The Kuali Financial
Microsoft Dynamics GP. COA Ecuador
 Microsoft Dynamics GP COA Ecuador Copyright Copyright 2010 Microsoft. All rights reserved. Limitation of liability This document is provided as-is. Information and views expressed in this document, including
Bond Amortization. amortization schedule. the PV, FV, and PMT functions. elements. macros
 8 Bond Amortization N LY O LEARNING OBJECTIVES a bond amortization schedule Use the PV, FV, and PMT functions Protect worksheet elements Automate processes with macros A T IO N Create E V A LU Financial
WinTen² Budget Management
 Budget Management Preliminary User Manual User Manual Edition: 4/13/2005 Your inside track for making your job easier! Tenmast Software 132 Venture Court, Suite 1 Lexington, KY 40511 www.tenmast.com Support:
#2 Password Protecting QuickBooks
 #2 Password Protecting QuickBooks We ve compiled these useful Tips to help our clients and friends get more out of their Quickbooks software. Please contact us if we can help you in any way with your accounting
2018 IRS ACA Reporting Completing Your Confirmation Page
 Revised Oct. 23, 2018 2018 IRS ACA Reporting Completing Your Confirmation Page SB-25770-XXXX Need Help? You are welcome to call your consultant with any questions at 800-654-8489 and their extension: Kim
Compensation & Benefits: Stock Options
 Compensation & Benefits: Stock Options Version 18.04 FS-BOE-SO-AG-201703--R018.04 Fairsail 2017. All rights reserved. This document contains information proprietary to Fairsail and may not be reproduced,
SINGLE-YEAR LINE-ITEM BUDGETING
 SINGLE-YEAR LINE-ITEM BUDGETING TABLE OF CONTENTS OPENING A PLAN FILE... 2 GENERAL NAVIGATION... 4 ENTERING NEW YEAR LINE-ITEM BUDGETS... 5 VIEWING HISTORICAL DATA... 6 ADDING, DELETING & MODIFYING CHARTSTRINGS...