westdrift Manhattan Beach, Autograph Collection 1400 Park View Avenue Manhattan Beach, California Conference Room: Loftlight Lobby
|
|
|
- Sybil Fleming
- 5 years ago
- Views:
Transcription
 westdrift Manhattan Beach, Autograph Collection 1400 Park View Avenue Manhattan Beach, California 90266 Conference Room: Loftlight Lobby Introduction and Chair s Remarks NERC Antitrust Compliance")
1 Agenda Finance and Audit Committee February 6, :45-11:15 a.m. Pacific (Please note the Schedule may be adjusted real-time should meetings conclude early and/or extend past their scheduled end time.) westdrift Manhattan Beach, Autograph Collection 1400 Park View Avenue Manhattan Beach, California Conference Room: Loftlight Lobby Introduction and Chair s Remarks NERC Antitrust Compliance Guidelines and Public Announcement* Agenda Items 1. Minutes* Approve a. November 6, 2018 Meeting Year-End Unaudited Results of Operations* Review and Recommend Board Acceptance a. NERC 2018 Unaudited Results b. Combined ERO Enterprise 2018 Unaudited Results c. Regional Entity Reports 3. Annual Review of Committee Mandate* Review 4. Other Business 5. Adjournment *Background materials included.
2 Antitrust Compliance Guidelines I. General It is NERC s policy and practice to obey the antitrust laws and to avoid all conduct that unreasonably restrains competition. This policy requires the avoidance of any conduct that violates, or that might appear to violate, the antitrust laws. Among other things, the antitrust laws forbid any agreement between or among competitors regarding prices, availability of service, product design, terms of sale, division of markets, allocation of customers or any other activity that unreasonably restrains competition. It is the responsibility of every NERC participant and employee who may in any way affect NERC s compliance with the antitrust laws to carry out this commitment. Antitrust laws are complex and subject to court interpretation that can vary over time and from one court to another. The purpose of these guidelines is to alert NERC participants and employees to potential antitrust problems and to set forth policies to be followed with respect to activities that may involve antitrust considerations. In some instances, the NERC policy contained in these guidelines is stricter than the applicable antitrust laws. Any NERC participant or employee who is uncertain about the legal ramifications of a particular course of conduct or who has doubts or concerns about whether NERC s antitrust compliance policy is implicated in any situation should consult NERC s General Counsel immediately. II. Prohibited Activities Participants in NERC activities (including those of its committees and subgroups) should refrain from the following when acting in their capacity as participants in NERC activities (e.g., at NERC meetings, conference calls and in informal discussions): Discussions involving pricing information, especially margin (profit) and internal cost information and participants expectations as to their future prices or internal costs. Discussions of a participant s marketing strategies. Discussions regarding how customers and geographical areas are to be divided among competitors. Discussions concerning the exclusion of competitors from markets. Discussions concerning boycotting or group refusals to deal with competitors, vendors or suppliers.
3 Any other matters that do not clearly fall within these guidelines should be reviewed with NERC s General Counsel before being discussed. III. Activities That Are Permitted From time to time decisions or actions of NERC (including those of its committees and subgroups) may have a negative impact on particular entities and thus in that sense adversely impact competition. Decisions and actions by NERC (including its committees and subgroups) should only be undertaken for the purpose of promoting and maintaining the reliability and adequacy of the bulk power system. If you do not have a legitimate purpose consistent with this objective for discussing a matter, please refrain from discussing the matter during NERC meetings and in other NERC-related communications. You should also ensure that NERC procedures, including those set forth in NERC s Certificate of Incorporation, Bylaws, and Rules of Procedure are followed in conducting NERC business. In addition, all discussions in NERC meetings and other NERC-related communications should be within the scope of the mandate for or assignment to the particular NERC committee or subgroup, as well as within the scope of the published agenda for the meeting. No decisions should be made nor any actions taken in NERC activities for the purpose of giving an industry participant or group of participants a competitive advantage over other participants. In particular, decisions with respect to setting, revising, or assessing compliance with NERC reliability standards should not be influenced by anti-competitive motivations. Subject to the foregoing restrictions, participants in NERC activities may discuss: Reliability matters relating to the bulk power system, including operation and planning matters such as establishing or revising reliability standards, special operating procedures, operating transfer capabilities, and plans for new facilities. Matters relating to the impact of reliability standards for the bulk power system on electricity markets, and the impact of electricity market operations on the reliability of the bulk power system. Proposed filings or other communications with state or federal regulatory authorities or other governmental entities. Matters relating to the internal governance, management and operation of NERC, such as nominations for vacant committee positions, budgeting and assessments, and employment matters; and procedural matters such as planning and scheduling meetings. NERC Antitrust Compliance Guidelines 2
4 DRAFT Minutes Finance and Audit Committee Meeting November 6, :00-9:45 a.m. Eastern Grand Hyatt Atlanta in Buckhead 3300 Peachtree Road NE Atlanta, GA Call to Order and Chair s Remarks Ms. Jan Schori, Chair, called to order a duly noticed open meeting of the Finance and Audit Committee (the Committee ) of the Board of Trustees ( Board ) of the North American Electric Reliability Corporation ( NERC or the Company ) on November 6, 2018, at 9:00 a.m. Eastern, and a quorum was declared present. The agenda is attached as Exhibit A. Present at the meeting were: Agenda Item 1a Finance and Audit Committee Meeting February 6, 2019 Committee Members Jan Schori, Chair Robert G. Clarke David Goulding Suzanne Keenan Roy Thilly Board of Trustee Members Janice B. Case Kenneth W. DeFontes, Jr. Frederick W. Gorbet George S. Hawkins Robin E. Manning James B. Robb, President and Chief Executive Officer NERC Staff Charles A. Berardesco, Senior Vice President, General Counsel, and Corporate Secretary Tina Buzzard, Associate Director Scott Jones, Senior Vice President, Chief Financial and Administrative Officer, and Corporate Treasurer Mark G. Lauby, Senior Vice President and Chief Reliability Officer Janet Sena, Senior Vice President and Director of Policy and External Affairs Andy Sharp, Controller Michael Walker, Senior Vice President and E-ISAC Chief of Staff Chair s Remarks Ms. Schori welcomed the participants to the meeting. NERC Antitrust Compliance Guidelines Ms. Schori directed the participants attention to the NERC Antitrust Compliance Guidelines included in the agenda, and indicated that all questions regarding antitrust compliance or related matters should be directed to Mr. Berardesco.
5 Minutes Upon motion duly made and seconded, the minutes from the August 15, 2018 meeting were approved as presented to the Committee. Fourth Quarter Calendar of FAC Responsibilities Mr. Sharp reviewed the Third Quarter Unaudited Financial Statements for NERC and for the ERO Enterprise, referencing the materials included in the advance agenda package. He noted that in the third quarter, NERC funding was on budget and expenditures were under budget, largely due to the timing of expenditures versus budget. NERC projects to be on budget for funding and slightly over budget for expenditures by the end of 2018, largely due to costs associated with the SPP dissolution. Mr. Sharp also noted that projected operating reserve usage was higher than expected for 2018, but that borrowing costs were lower than expected. Mr. Sharp also reviewed the projected year-end reserves for Mr. Sharp noted that seven Regional Entities were under budget in the third quarter; one region, MRO, was over budget due to costs associated with the SPP RE transition. The combined ERO Enterprise was under budget for the third quarter and is projected to be approximately 1.8 percent under budget at year end. Mr. Sharp reviewed the combined 2018 ERO Enterprise operating reserves. After discussion, and upon motion duly made and seconded, the Committee recommended the Third Quarter Unaudited Financial Statements for acceptance by the Board Business Plan and Budget Status Mr. Sharp noted that the Federal Energy Regulatory Commission had approved the 2019 Business Plans and Budgets. Ms. Schori thanked the Committee and the MRC Business Plan and Budget Input Group for their work during the annual budget process. Schedule for 2020 Business Plan and Budget Mr. Sharp reviewed the tentative 2020 ERO Enterprise Business Plan and Budget Schedule, which had been included in the advance agenda package. Overview of Internal Controls Ms. Schori noted that the Committee requested a presentation on NERC s accounting and financial internal controls to better understand the practices NERC has in place and to aid the Committee in executing its financial oversight duties. Mr. Sharp then provided a presentation on NERC s accounting and financial controls. He noted that NERC relies on several sources of guidance for implementing its internal control framework, including guidance from the Committee of Sponsoring Organizations of the Treadway Commission, internal and external auditors, Regional Entities and other companies, and through continuing education. He described the following elements of NERC s internal control environment: Tone at the top, including Committee oversight and management support of controls; Compliance oversight, including external auditors and internal audit and risk management; Finance and Audit Committee Meeting 2 Draft Minutes November 6, 2018
6 Corporate policies, including the code of conduct and internal financial policies; Accounting process documentation; Segregation of duties among accounting department staff; Accounting systems, including systems currently used by NERC and systems that will be used by NERC beginning in 2019; and Reporting and management oversight, including current monthly management reports. Mr. Sharp reviewed key corporate policies, accounting process documents, the approach to segregation of duties, key business systems and reporting and management oversight. He provided an overview of upcoming activities, including an update of accounting process documents in connection with a new accounting system and a review of system and process environments by Internal Audit. Following discussion, Ms. Schori requested that NERC staff provide an annual review of internal controls for the Committee, to include updates on policies that have changed in the prior year, issues that have been identified, and other matters of interest. Mr. Jones expressed his thanks to Mr. Walker, as the former CFO, and former Controller Susan Turpen, for their work in creating and implementing the original internal controls structure and process documentation. Adjournment There being no further business, and upon motion duly made and seconded, the meeting was adjourned. Submitted by, Charles A. Berardesco Corporate Secretary Finance and Audit Committee Meeting 3 Draft Minutes November 6, 2018
7 Agenda Item 2a Finance and Audit Committee Meeting February 6, 2019 Summary of Unaudited Results For the Year Ending December 31, 2018 Table of Contents Page I. Executive Summary Year-to-Date Actual Results 2 II. Detailed Operating Results Variances by Revenue and Expense Category 3 Variances by Department / Program 5 III. Supplemental Schedules Schedule 1 Reserves 6 Schedule 2 IT Projects 7 Schedule 3 E-ISAC & CRISP 10
8 Executive Summary Year-to-Date Actual Results ($ millions) Over FUNDING Actual Budget (Under) Revenues $ 72.1 $ 72.4 $ (0.3) Funding from Reserves Assessment Stabilization Reserve TOTAL FUNDING $ 72.7 $ 73.0 $ (0.3) EXPENDITURES Expenses (excluding Depreciation) $ 68.5 $ 69.2 $ (0.7) Fixed Asset Additions (1.3) TOTAL EXPENDITURES $ 71.1 $ 73.1 $ (2.0) RESERVE INCREASE (DECREASE) $ 1.6 $ (0.1) $ 1.7 FUNDING Revenues o Third-party funding was under budget due to lower CRISP revenues. CRISP billings were higher in 2018, but contractor expenses were under budget, resulting in a year-end true-up of CRISP revenue (adjustment to match revenue with expenses). o Testing and continuing education revenues were below budget due to lower activity. EXPENDITURES Expenses (excluding depreciation) o Contracts and Consultants was under budget primarily due to lower contractor costs in the CRISP program. Fixed Asset Additions o Under budget due primarily to the IT department reducing fixed asset spending to accommodate higher spending in software and other costs. NERC was under budget in total by 2.8%. Excluding the impacts of CRISP, NERC was 1.2% under budget for the year. OPERATING RESERVE INCREASE (INCREASE) Actual reserve increase from operations was higher than budget by $1.7 million. Summary of Results as of December 31,
9 Detailed Operating Results Total NERC (including CRISP) Variances by Revenue and Expense Category YTD Actual YTD Budget YTD Over (Under) % Over (Under) TOTAL FUNDING $ 72,674,868 $ 72,981,221 $ (306,353) (0.4%) EXPENDITURES Personnel $ 41,326,984 $ 40,969,105 $ 357, % Meetings, Travel, and Conference Calls 3,659,871 3,395, , % Contracts and Consultants 12,483,751 13,724,185 (1,240,434) (9.0%) Rent and Facilities 2,955,432 3,091,804 (136,372) (4.4%) Office Costs, Professional, and Misc.* 7,894,725 7,942,084 (47,359) (0.6%) Other Non-Operating Expenses 151, ,878 12, % Fixed Asset Additions* 2,625,596 3,874,000 (1,248,404) (32.2%) TOTAL EXPENDITURES $ 71,097,699 $ 73,135,156 $ (2,037,457) (2.8%) RESERVE INCREASE (DECREASE) $ 1,577,169 $ (153,935) $ 1,731,104 (1124.6%) FTEs (8.2) (4.1%) * Excludes depreciation expense Following is a brief summary of variances by major categories: Meeting, Travel, and Conference Call Expense o Meeting expenses were over budget due to higher attendance at workshops and conferences, which were substantially offset by increased revenues for these events. Contracts and Consultants Expense o Under budget due to lower costs from the CRISP program contractor and lower than expected spending in several departments. This was partially offset by unbudgeted costs for SPP RE transition work and a cyber-security supply chain risk study. Fixed Asset Additions (excluding depreciation) o Under budget due primarily to the IT department reducing fixed asset spending to accommodate higher spending in software and other costs. Summary of Results as of December 31,
10 CONTRACTS and CONSULTANTS YTD Actual YTD Budget YTD Over (Under) Reliability Standards $ 100,000 $ - $ 100,000 Compliance Assurance 43,750 50,000 (6,250) Compliance Analysis, Registration and Certification Compliance Enforcement 42,131-42,131 Reliability Assessment and System Analysis 192, ,000 (332,500) Reliability Risk Management 1,821,797 1,867,525 (45,728) E-ISAC 1,026,960 1,100,200 (73,240) Training, Education, and Personnel Certification 448, ,900 (150,160) General and Administrative and Executive 94,946 80,000 14,946 Legal and Regulatory Policy and External Affairs 24,225 20,000 4,225 Information Technology 2,046,484 2,123,966 (77,482) Human Resources 611, ,000 (28,324) Finance and Accounting 370, ,000 (56,498) TOTAL (excluding CRISP) $ 6,823,712 $ 7,432,591 $ (608,880) CRISP 5,660,040 6,291,594 (631,554) TOTAL (including CRISP) $ 12,483,751 $ 13,724,185 $ (1,240,434) Summary of Results as of December 31,
11 Variances by Department / Program DIRECT EXPENSES and NET FIXED ASSETS YTD Actual YTD Budget YTD Over (Under) Reliability Standards $ 2,966,471 $ 3,293,666 $ (327,195) Compliance Assurance 4,866,918 4,520, ,369 Compliance Analysis, Registration and Certification 2,561,118 2,748,762 (187,644) Compliance Enforcement 4,311,995 3,894, ,872 Reliability Assessment and System Analysis 3,781,922 4,105,476 (323,554) Reliability Risk Management 7,766,572 7,654, ,307 E-ISAC 7,180,329 7,357,222 (176,893) Training, Education, and Personnel Certification 1,423,730 1,706,574 (282,844) General and Administrative and Executive 7,750,004 7,874,321 (124,317) Legal and Regulatory 2,969,870 2,914,377 55,494 Policy and External Affairs 2,483,605 2,221, ,779 Information Technology 10,652,295 11,266,626 (614,331) Human Resources 1,487,049 1,704,459 (217,410) Finance and Accounting 4,286,782 4,008, ,456 TOTAL (excluding CRISP) $ 64,488,660 $ 65,270,572 $ (781,912) CRISP 6,609,039 7,864,584 (1,255,545) TOTAL EXPENSES and NET FIXED ASSETS $ 71,097,699 $ 73,135,156 $ (2,037,457) Reliability Standards: Under budget primarily due to reduced personnel costs resulting from the reallocation of resources to other departments. Compliance Assurance: Over budget mainly because of additional personnel costs resulting from the reallocation of resources from other departments. Compliance Enforcement: Over budget largely due to higher personnel costs due to lower than budgeted attrition, CMEP licensing and hosting costs (funded from the IT department budget), and unbudgeted SPP RE transition costs. Reliability Assessment and System Analysis: Under budget primarily because of lower than budgeted spending in contracts and consultants. Information Technology: Under budget, mainly due to lower fixed asset spending, which was partially offset by higher personnel costs due to a lower attrition rate, as well as CMEP and other costs that were funded by IT and charged to program areas. CRISP: Under budget primarily due lower than budgeted costs from the program contractor, as well as lower than expected software and personnel expenses. Summary of Results as of December 31,
12 SUPPLEMENTAL SCHEDULE 1 Year-End Actual Reserves Beginning Budgeted Budgeted Other Net Financing Ending Reserve Account Balance (1) Funding Uses Funding (Uses) (2) Activity (3) Balance Operating Contingency $ 3,680,094 $ 600,000 $ (231,393) $ 1,922,784 $ (717,274) $ 5,254,212 Future Obligations 3,015,787 - (480,457) - - $ 2,535,330 Assessment Stabilization 2,671,000 - (600,000) - - $ 2,071,000 System Operator 477,484 77,458-26, ,142 CRISP 500, ,000 Total Reserves $ 10,344,365 $ 677,458 $ (1,311,850) $ 1,948,984 $ (717,274) $ 10,941,683 NOTES: (1) Some 2018 beginning balances have been adjusted from the 12/31/2017 variance report balances as the result of a reconciliation to the final audited balance sheet. (2) The column Other Funding (Uses) primarily reflects the net impact of normal operations. For example, under normal circumstances, if NERC was tracking well under budget in actual expenditures, this would reflect additional funds into the reserve account. It also reflects the increase or decrease in working capital during the period. (3) Net financing activity in 2018 reflects principal debt repayments for borrowings originated in 2015 and NERC did not make the budgeted borrowings for 2017 and 2018 in light of a favorable working capital position. Not making the 2017 borrowing saved $483K in working capital in 2018 and contributed to the higher operating contingency reserve. The savings from the 2018 borrowing decision will be realized in Summary of Results as of December 31,
13 SUPPLEMENTAL SCHEDULE 2 IT Projects Expected Project Actual Expected Over (Under) Projects in Progress Budget (1) Spend Spend Budget CMEP Technology Project ( ) $ 5,103,000 $ 1,678,935 $ 5,103,000 $ - Entity Registration - CORES ( ) 1,200, ,897 1,200,000 - Actual Project Actual Over (Under) Projects Completed in 2018 Budget (1) Spend Budget NERC.com Phase 2 $ 300,000 $ 281,530 $ (18,471) E-ISAC Document Management 215, ,000 - SPP RE Transition - 460, ,983 CFR Enhancements 122, ,700 - E-ISAC Portal Enhancements 743, ,524 (75,951) NOTES: (1) The Project Budget noted above usually corresponds to the approved business case for each project and funds for each project are drawn from the available budget. In some projects, business cases may not be prepared, particularly when a project is smaller and/or may be in response to a FERC order. * Some of these projects span multiple years, so the amounts above do not represent a single budget year expenditure. * The amounts noted above do not include internal labor and reflect only external (consultant) costs of the projects. Summary of Results as of December 31,
14 SUPPLEMENTAL SCHEDULE 2 (continued) CMEP Technology Project (Started May 2017 / Planned Completion Dec 2020) This project will provide registered entities, Regional Entities, and NERC the ability manage the compliance and enforcement processes and data in a single ERO Enterprise system. Today, those processes and related data are managed across three separate systems that have to be synchronized (webcdms, CITS, and CRATS). Entity Registration - CORES (Started Dec 2017 / Planned Completion Dec 2019) NERC is undertaking an effort to both standardize and modernize the Entity Registration process. The discovery phase of the Centralized Organization Registration Entity System (CORES) project includes the capture of Region-specific needs, variations, and exceptions in the registration process. CORES will be a centralized entity registration process, which will require the retirement of registration in CDMS, CITS, and CRATS. The Joint Registration Organization (JRO) portion of the project will be combined with the CORES production release in NERC.com Phase 2 (Started May 2017 / Completed Feb 2018) In response to feedback from stakeholders, this project was a first step to improve the usability and search capability of the public NERC.com website. The project also enhanced the stability of the NERC.com platform with a technology upgrade from SharePoint 2010 to SharePoint 2016 in Azure. E-ISAC Document Management (Started Apr 2018 / Completed Oct 2018) NERC launched the Document Management Program to provide a secure and efficient method of creating, collaborating, storing, and disseminating the vast amount of information produced at NERC. The E-ISAC was the final business unit to be implemented. SPP RE Transition (Started Mar 2018 / Completed Nov 2018) Due to the SPP RE dissolution, NERC assessed the changes required to applications that contained SPP RE data and the reassignment/classification of such information. The inventory required the mapping utility, functionality, migration, and support efforts by both Region and entity. Activities included facilitated discussions with IT and business owners of impacted applications to capture and document high-level, as well as more detailed, requirements necessary to support the transition of registered entities from SPP RE to MRO and SERC. CFR Enhancements (Started Sep 2018 / Completed Dec 2018) This project is an enhancement to the Coordinated Functional Requirement (CFR) functionality, which is going to update the standard requirements that appear in the system, as well as performance improvement. Summary of Results as of December 31,
15 E-ISAC Portal Enhancements (Started Jan 2018 / Completed Dec 2018) As requested by and prioritized by the Member Executive Committee (MEC), certain enhancements were made to the E-ISAC portal during 2018 related to areas such as notifications, user communities, and STIX-TAXII. Summary of Results as of December 31,
16 SUPPLEMENTAL SCHEDULE 3 E-ISAC and CRISP Summary of Activity TOTAL E-ISAC (including CRISP) YTD Annual FUNDING Actual Budget Over (Under) Assessments $ 14,297,524 $ 14,297,524 $ - Other Funding 7,131,561 7,553,073 (421,512) TOTAL FUNDING $ 21,429,086 $ 21,850,597 $ (421,512) EXPENDITURES Personnel Expense $ 5,603,291 $ 6,004,182 $ (400,891) Meeting Expense 825, , ,893 Operating Expenses (excluding Depreciation) 7,339,251 8,549,624 (1,210,373) Fixed Assets (excluding Depreciation and Fixed Asset Allocation) 20, ,000 (229,068) Total Direct Costs (excluding Depreciation and Allocations) $ 13,789,368 $ 15,221,806 $ (1,432,438) Indirect Expense Allocation 6,308,060 6,519,415 (211,355) Fixed Asset Allocation (360,308) 109,377 (469,684) TOTAL EXPENDITURES (excluding Depreciation, including Allocations) $ 19,737,120 $ 21,850,597 $ (2,113,477) RESERVE INCREASE (DECREASE) $ 1,691,966 $ - $ 1,691,966 Summary of Results as of December 31,
17 SUPPLEMENTAL SCHEDULE 3 (continued) CRISP YTD Annual FUNDING Actual Budget Over (Under) Assessments $ 1,371,768 $ 1,371,768 $ - Other Funding 6,601,419 7,348,144 (746,725) TOTAL FUNDING $ 7,973,187 $ 8,719,912 $ (746,725) EXPENDITURES Personnel Expense $ 734,800 $ 944,070 $ (209,270) Meeting Expense 82,114 48,000 34,114 Operating Expenses (excluding Depreciation) 5,792,126 6,772,514 (980,389) Fixed Assets (excluding Depreciation and Fixed Asset Allocation) - 100,000 (100,000) Total Direct Costs (excluding Depreciation and Allocations) $ 6,609,039 $ 7,864,584 $ (1,255,545) Indirect Expense Allocation 913, ,215 72,065 Fixed Asset Allocation (52,165) 14,113 (66,278) TOTAL EXPENDITURES (excluding Depreciation, including Allocations) $ 7,470,153 $ 8,719,912 $ (1,249,759) RESERVE INCREASE (DECREASE) $ 503,034 $ - $ 503,034 E-ISAC (excluding CRISP) YTD Annual FUNDING Actual Budget Over (Under) Assessments $ 12,925,757 $ 12,925,757 $ - Other Funding 530, , ,213 TOTAL FUNDING $ 13,455,899 $ 13,130,686 $ 325,213 EXPENDITURES Personnel Expense $ 4,868,492 $ 5,060,112 $ (191,621) Meeting Expense 743, , ,779 Operating Expenses (excluding Depreciation) 1,547,126 1,777,110 (229,984) Fixed Assets (excluding Depreciation and Fixed Asset Allocation) 20, ,000 (129,068) Total Direct Costs (excluding Depreciation and Allocations) $ 7,180,329 $ 7,357,222 $ (176,893) Indirect Expense Allocation 5,394,781 5,678,200 (283,419) Fixed Asset Allocation (308,143) 95,263 (403,406) TOTAL EXPENDITURES (excluding Depreciation, including Allocations) $ 12,266,967 $ 13,130,686 $ (863,719) RESERVE INCREASE (DECREASE) $ 1,188,932 $ - $ 1,188,932 Summary of Results as of December 31,
18 NERC Summary of Unaudited Results for 2018 Scott Jones, Senior Vice President, Chief Financial and Administrative Officer Finance and Audit Committee Meeting February 6, 2019
19 Summary of 2018 Unaudited Results Total funding is slightly under budget CRISP revenue, after true-ups, is lower than budget. CRISP program contractor costs were under budget, contributing to an adjustment to CRISP revenue. Total expenditures were $2.0M (2.8%) under budget Lower-than-expected spending for contracts and consultants Less-than-budgeted costs from PNNL for CRISP Excluding CRISP, NERC s total expenses were under budget 1.2% Net impact was $1.6M increase in operating reserves Loan principal payments were $483k less than budgeted, contributing to larger reserve increase 2 RELIABILITY ACCOUNTABILITY
20 2018 Year-End Reserves Total reserves balance is $11.0M Operating Contingency Reserve (OCR) $5.3M Assessment Stabilization Reserve (ASR) $2.1M Future Obligation Reserve $2.5M System Operator Reserve $581k CRISP Reserve $500k 3 RELIABILITY ACCOUNTABILITY
21 OCR and ASR Details in 2018 Operating Contingency Reserve ($5.3M) Began year with $3.7M Budgeted $600k transfer from ASR Budgeted use of $231k Generated $1.9M from under budget spending in operations Used $717k for loan principal payments Assessment Stabilization Reserve ($2.1M) Began year with $2.7M Used $600k for budgeted offset to assessments 4 RELIABILITY ACCOUNTABILITY
22 Next Steps Financial audit by Grant Thornton will begin in March Auditor s report and findings will be presented to FAC in May Adjustments between budget presentation and accounting guidance for audit, primarily for leases and capitalized labor on IT projects (no effect on operating reserves) 5 RELIABILITY ACCOUNTABILITY
23 6 RELIABILITY ACCOUNTABILITY
24 Agenda Item 2b Finance and Audit Committee Meeting February 6, 2019 Combined ERO Enterprise (NERC and Regional Entities) Summary of Unaudited Results December 31, 2018 The ERO Enterprise was under budget $7.8M (4.0%) for combined expense and fixed asset (capital) spending. The budget variances ranged from 50.7% under budget to 15.9% over budget. Total Budget (Total Expenses plus the Increase (Decrease) in Fixed Assets) 2018 YTD 2018 YTD Over (Under) Entity Actual Budget $ % NERC $ 71,097,699 $ 73,135,157 $ (2,037,458) (2.8%) FRCC 7,866,174 7,514, , % MRO 13,592,158 11,726,736 1,865, % NPCC 14,419,307 15,106,968 (687,661) (4.6%) RF 20,886,485 21,383,900 (497,415) (2.3%) SERC 17,302,829 17,182, , % SPP RE 5,323,660 10,793,195 (5,469,535) (50.7%) Texas RE 11,343,290 12,656,959 (1,313,669) (10.4%) WECC 26,984,989 27,097,344 (112,355) (0.4%) $ 188,816,591 $ 196,597,237 $ (7,780,646) (4.0%) FRCC was over budget $352k (4.7%) largely as a result of unbudgeted retention bonuses. MRO was over budget $1.9M (15.9%), which is attributable primarily to higher personnel and operating expenses associated with the SPP RE transition. MRO s total transition cost is $2.2 million, an increase from the originally projected $1.5 million. This will not impact the 2018 or 2019 assessments since transition costs have been funded through the transfer of SPP RE assessments to MRO; however, the transferred SPP RE assessments exceeded $2.2 million and thus impacts the year-end working capital balance. A reassessment of funding will take place when the 2020 business plan and budget is created to determine the management of excess funding. NPCC was under budget $688k (4.6%) mainly as a result of staff retirements, cost controls in travel and meetings expenses, and contract negotiations for office costs. SPP RE was under budget $5.5M (50.7%), which is attributable to changing operations associated with the dissolution of SPP RE (CMEP activities ended on June 30, 2018 and the Regional Delegation Agreement terminated on August 31, 2018). Excess funding and working capital of $5.4M, as well as approximately $465k in penalty monies, were transferred to MRO and SERC by December 31, 2018.
25 Texas RE was under budget $1.3M (10.4%) due to staff vacancies and lower-than-expected benefits, travel, contracts and consultants, utility, IT, and professional services costs. Variances by Expense and Fixed Asset Categories Personnel Expenses For the ERO Enterprise, personnel expenses, consisting of salaries, payroll taxes, benefits, and retirement costs, were collectively under budget $1.9M (1.5%), ranging from 42.8% under budget to 17.3% over budget. All entities in the ERO Enterprise were under budget in FTEs. Personnel Expenses FTEs* Projected Over (Under) Year-End Over % of Entity Actual Budget $ % Variance Actual Budget (Under) Budget NERC $ 41,326,984 $ 40,969,106 $ 357, % 0.0% (8.2) (4.1%) FRCC 6,404,647 5,878, , % 0.0% (8.9) (29.1%) MRO 10,042,832 8,564,796 1,478, % 0.0% (0.6) (1.3%) NPCC 9,478,519 9,820,771 (342,252) (3.5%) 0.0% (0.3) (0.9%) RF 17,378,075 17,928,990 (550,915) (3.1%) 0.0% (2.2) (2.9%) SERC 12,497,785 12,937,387 (439,602) (3.4%) 0.0% (6.8) (9.0%) SPP RE 3,011,934 5,268,929 (2,256,995) (42.8%) 0.0% (14.5) (44.8%) Texas RE 9,118,104 9,958,819 (840,715) (8.4%) 0.0% (4.0) (6.7%) WECC 20,032,902 19,871, , % 0.0% (10.6) (7.4%) $ 129,291,782 $ 131,198,859 $ (1,907,077) (1.5%) 0.0% (56.2) (8.0%) * Represents equivalent full time positions from a budget and actual financial perspective and does not necessarily represent headcount. FRCC was over budget $526k (8.9%) primarily due to unbudgeted retention bonuses. This is partially offset by a higher than budgeted attrition rate, a 2018 new budgeted position that has not been filled, and lower-than-budgeted education expenses, medical expenses, and retirement costs. MRO was over budget $1.5M (17.3%) predominately due to increased personnel costs related to the SPP RE transition. SPP RE was under budget $2.3M (42.8%), which is attributable to the loss of SPP RE staff throughout 2018 (open positions were not filled), the conclusion of CMEP activities on June 30, 2018, and the retention of only four SPP RE employees to complete wind-down activities for the period of July 1 to August 31, 2018, the date of the Regional Delegation Agreement termination. Texas RE was under budget $841k (8.4%) as a result of staff vacancies that were not filled until later in December, broker negotiations that allowed actual costs for health benefits to remain flat, lower-than-budgeted education reimbursement and training costs, and lower participation in savings and retirement plans. Summary of Unaudited December 31, 2018 Results ERO Enterprise (NERC and Regional Entities Combined) 2
26 Travel, Meeting, and Conferencing Expenses For the ERO Enterprise, travel, meeting, and conferencing expenses were collectively under budget $1.4M (13.4%). Meeting, Travel, and Conferencing Expenses Over (Under) Entity Budget Meeting Travel Conferencing Actual $ % NERC $ 3,395,100 $ 312,876 $ (69,143) $ 21,038 $ 3,659,871 $ 264, % FRCC 252,241 (14,209) (39,742) (458) 197,832 (54,409) (21.6%) MRO 749,380 (4,412) (281,739) - 463,229 (286,151) (38.2%) NPCC 1,224,550 (91,706) (197,441) (6,083) 929,320 (295,230) (24.1%) RF 1,064,025 11,970 (63,808) (11,548) 1,000,639 (63,386) (6.0%) SERC 917,569 (50,083) (128,534) (17,414) 721,538 (196,031) (21.4%) SPP RE 558,500 (69,651) (367,588) - 121,261 (437,239) (78.3%) Texas RE 423,651 (9,928) (99,341) (3,539) 310,843 (112,808) (26.6%) WECC 2,231,994 (225,127) (13,580) (30,238) 1,963,049 (268,945) (12.0%) $ 10,817,010 $ (140,270) $ (1,260,916) $ (48,242) $ 9,367,582 $ (1,449,428) (13.4%) NERC was over budget $265k (7.8%) due to higher attendance at workshops and conferences, which is substantially offset by increased revenues for these events. FRCC was under budget $54k (21.6%) largely because of reduced staff travel in the reliability assessments department and meeting expenses in the training and compliance departments. MRO was under budget $286k (38.2%) due to (1) fewer face-to-face working group meetings; (2) reduced staff travel due to an increase in the use of MRO s facilities to host meetings; and (3) staff resources being shifted temporarily to SPP-related travel. NPCC was under budget $295k (24.1%) mainly from streamlining the NPCC Spring and Fall Compliance and Standards Workshops from a three-day format to a two-day format, and continuing efforts to (1) hold meetings onsite or at member facilities and (2) limit the number of attendees at offsite meetings and encourage participation via teleconference when available. RF was under budget $64k (6.0%) largely due to travel activity being less than budgeted. SERC was under budget $196k (21.4%) primarily because various meetings were cancelled due to weather or deferred to next year, and lower compliance-related travel due to the use of contractors in lieu of FTEs. SPP RE was under budget $437k (78.3%) as a result of the loss of SPP RE personnel throughout the year and the completion of SPP RE CMEP activities at the end of the second quarter. Texas RE was under budget $113k (26.6%) because of cost savings efforts for workshops and lower-than-expected travel expenses due to local audits and cancelled or rescheduled meetings. WECC was under budget $269k (12.0%) primarily due to reduced meetings and less-thananticipated meeting attendance and conference call usage. Summary of Unaudited December 31, 2018 Results ERO Enterprise (NERC and Regional Entities Combined) 3
27 Operating Expenses For the ERO Enterprise, operating expenses, consisting of consultants and contracts expenses, office rent, office costs, professional services, miscellaneous costs, and depreciation expense, were collectively under budget $166k (0.3%). Operating Expenses 2018 Contracts & Professional 2018 Over (Under) Entity Budget Consultants Office Rent Office Costs Services Miscellaneous Depreciation Actual $ % NERC $ 26,352,372 $ (1,240,434) $ (136,372) $ 162,837 $ (236,947) $ 26,751 $ 1,506,749 $ 26,434,956 $ 82, % FRCC 1,368,922 72,214 (92,928) (17,429) 13,496 - (13,174) 1,331,101 (37,821) (2.8%) MRO 2,704, ,971 7,344 (112,988) 258,687 - (23,955) 3,075, , % NPCC 4,632, ,776 (26,771) (98,646) (50,150) (3,800) (14,883) 4,568,626 (63,474) (1.4%) RF 2,566,710 56,047 20,997 1,008 (15,157) 1,230 66,814 2,697, , % SERC 3,435, , , , ,240 (5,550) (145,554) 4,095, , % SPP RE 1,320,088 (820,405) - (3,589) (57,129) ,965 (881,123) (66.7%) Texas RE 2,412,989 (91,438) (107,517) (18,464) (158,318) - 10,085 2,047,337 (365,652) (15.2%) WECC 5,687,896 (93,162) 41,440 (28,588) (28,819) - 46,538 5,625,305 (62,591) (1.1%) $ 50,481,445 $ (1,397,663) $ (135,185) $ 62,578 $ (147,097) $ 18,631 $ 1,432,620 $ 50,315,329 $ (166,116) (0.3%) MRO was over budget $371k (13.7%) due to the impact of the SPP RE transition. RF was over budget $131k (5.1%) primarily due to (1) higher depreciation as a result of last year s expenditures for the corporate internal and public websites, and office improvements being more than budgeted, and (2) unbudgeted contracts and consultant costs associated with a data warehouse project. SERC was over budget $660k (19.2%) mainly because of (1) contractors being used in lieu of FTEs; (2) lease of additional office space; (3) increased IT-related purchases and office supply and maintenance costs; and (4) legal fees associated with employment matters and a review of SERC bylaws. SPP RE was under budget $881k (66.7%), which is mainly attributable to the completion of audit activities and termination of all contracts on June 30, Texas RE was under budget $366k (15.2%) due to (1) lower-than-anticipated utility and maintenance expenses; (2) savings from contractor consolidation for studies and surveys; and (3) lower-than-anticipated IT and legal professional services. Indirect Expense Allocation NPCC and WECC allocate overhead to their non-statutory functions, and SPP RE receives an allocation of overhead from SPP, Inc. Year-to-date, NPCC allocated $38k (9.0%) less than expected due to lower administrative services expenses. SPP RE s allocation from SPP, Inc. was $2.1M (56.4%) less than expected, primarily because actual SPP, Inc. corporate overhead costs were below the budget amount due to the dissolution of SPP RE. WECC allocated $30k (5.5%) less than budgeted primarily due to higher labor float in the non-statutory area. Summary of Unaudited December 31, 2018 Results ERO Enterprise (NERC and Regional Entities Combined) 4
28 Fixed Asset (Capital) Additions For the ERO Enterprise, fixed asset (capital) additions (excluding the reversal of depreciation expense) were under budget $1.1M (20.9%). Fixed Asset Additions (Excludes Depreciation) Computer & Furniture 2018 Equipment Leasehold Allocation of 2018 Over (Under) Software and Fixtures Entity Budget CapEx CapEx CapEx Improvements Fixed Assets Actual $ % NERC $ 3,874,000 $ (151,708) $ - $ (946,697) $ (150,000) $ - $ 2,625,595 $ (1,248,405) (32.2%) FRCC 127,337 (60,000) - (34,735) ,602 (94,735) (74.4%) MRO 286,170 (23,032) 85,319 4, , , , % NPCC 115,000 (39,223) ,777 (39,223) (34.1%) RF 197,500 18,802 6,644-27, ,261 52, % SERC 345,002 (210,842) 22,789 65,499 72, ,079 (49,923) (14.5%) SPP RE % Texas RE 30,000 15, ,591 15, % WECC 69,301 3,135-27, ,795 30, % $ 5,044,310 $ (447,277) $ 114,752 $ (884,031) $ 161,282 $ 357 $ 3,989,393 $ (1,054,917) (20.9%) NERC was under budget $1.3M (32.2%), due primarily to the IT department reducing fixed asset spending to accommodate higher spending in software and other costs. FRCC was under budget $95k (74.4%) largely because of (1) fewer enhancements being made to compliance software and (2) indirect computer and software expenses being less than anticipated along with reduced allocations to statutory functions because of reduced FTEs. MRO was over budget $279k (97.3%) due to the impacts of the SPP RE transition. NPCC was under budget $39k (34.1%) mainly because no new functionality was added for the CDAA and CITS tools and the timing of scheduled software development projects, which included the continued roll out of NPCC s document management system. RF was over budget $53k (26.7%) primarily as a result of costs associated with the redesign and development of the corporate extranet site and leasehold improvements for some minor office modifications. SERC was under budget $50k (14.5%) due to limited CUG development costs and expensing of computer purchases previously budgeted as fixed assets, which is partially offset by expenses for CRISP and leasehold improvements for new office space. Texas RE was over budget $16k (52.0%), which is attributable to software renewals being higher than expected. WECC was over budget $30k (44.0%) primarily due to the unbudgeted purchase of video conferencing equipment to increase effectiveness of web and telephone-based meetings. Summary of Unaudited December 31, 2018 Results ERO Enterprise (NERC and Regional Entities Combined) 5
29 Working Capital and Operating Reserves (excluding CRISP) The ERO Enterprise began the 2018 year with approximately $5.5M more in reserves than anticipated in the 2018 budget. This was primarily because of favorable budget variances from the 2017 year Beginning Reserve Balances Over Entity Actual Budget (Under) NERC $ 9,844,365 $ 7,478,733 $ 2,365,632 FRCC 1,321,468 1,134, ,843 MRO 2,384,548 1,818, ,075 NPCC 5,017,751 4,499, ,858 RF 4,457,805 3,759, ,178 SERC 1,359, , ,993 SPP RE 725, ,930 (50,694) Texas RE 2,422,616 2,352,967 69,649 WECC 5,418,773 4,894, ,218 $ 32,952,284 $ 27,401,532 $ 5,550,752 For the end of 2018, the ERO Enterprise budgeted the reduction of $1.3M in reserves while actually generating $4.5M. This resulted in the unanticipated addition of $5.8M in total reserves Change in Reserve Balances Entity Actual Budget Over (Under) NERC $ 597,318 $ (1,454,543) $ 2,051,861 FRCC (860,168) (508,447) (351,721) MRO 1,975, ,184 1,331,451 NPCC 88,127 (626,181) 714,308 RF 412, ,611 (156,023) SERC 1,587,929 1,013, ,658 SPP RE (725,237) (775,930) 50,693 Texas RE 263,917 (1,107,973) 1,371,890 WECC 1,128, , ,950 $ 4,468,765 $ (1,347,302) $ 5,816,067 The combined effect of higher balances at the beginning of the year and adding additional reserves during 2018 resulted in a combined year-to-date reserve balance of $37.4M, which is $11.4M more than was anticipated in the 2018 budget. Summary of Unaudited December 31, 2018 Results ERO Enterprise (NERC and Regional Entities Combined) 6
30 2018 Year-End Reserve Balances Entity Actual Budget Over (Under) NERC $ 10,441,683 $ 6,024,190 $ 4,417,493 FRCC 461, ,178 (164,878) MRO 4,360,183 2,462,657 1,897,526 NPCC 5,105,878 3,873,712 1,232,166 RF 4,870,393 4,328, ,155 SERC 2,947,651 1,700,000 1,247,651 SPP RE (1) - (1) Texas RE 2,686,533 1,244,994 1,441,539 WECC 6,547,429 5,794, ,168 $ 37,421,049 $ 26,054,230 $ 11,366,819 The ERO Enterprise began the 2019 budget year with $7.3M in additional reserves above what was planned in the combined budgets Ending Reserves vs 2019 Beginning Reserves Entity 2018 Year-End Actual Balance 2019 Beginning Budgeted Balance Over (Under) NERC $ 10,441,683 $ 8,453,020 $ 1,988,663 FRCC 461,300 1,629,719 (1,168,419) MRO 4,360,183 1,762,886 2,597,297 NPCC 5,105,878 4,453, ,307 RF 4,870,393 4,318, ,155 SERC 2,947,651 2,328, ,467 Texas RE 2,686,533 1,314,649 1,371,884 WECC 6,547,429 5,838, ,028 $ 37,421,050 $ 30,098,668 $ 7,322,382 Summary of Unaudited December 31, 2018 Results ERO Enterprise (NERC and Regional Entities Combined) 7

31 Combined ERO Enterprise Summary of Unaudited Results 2018 Scott Jones, Senior Vice President, Chief Financial and Administrative Officer Finance and Audit Committee Meeting February 6, 2019
32 Summary of 2018 Unaudited Results (by expense) Combined ERO Enterprise was under budget $7.8M (4.0%) Personnel expenses were slightly under budget (-1.5%) predominately due to staff vacancies Meeting and travel expenses were under budget (-13.4%) mainly due to meeting cost savings efforts, reduced or rescheduled meetings, and lowerthan-expected travel activity Operating expenses were slightly under budget (-0.3%) Fixed assets were under budget (-20.9%) primarily due to lower spending 2 RELIABILITY ACCOUNTABILITY
33 Summary of 2018 Unaudited Results (by Region) NERC and five Regional Entities were under budget NERC (-2.8%) lower operating and fixed asset expenses NPCC (-4.6%) lower personnel, meetings, travel, and operating expenses RF (-2.3%) lower personnel and travel expenses SPP RE (-50.7%) lower expenses overall due to dissolution of operations Texas RE (-10.4%) lower personnel, travel, and operating expenses WECC (-0.4%) lower meeting expenses Three Regional Entities were over budget FRCC (+4.7%) higher personnel expenses MRO (+15.9%) higher personnel and operating expenses SERC (+0.7%) higher operating expenses 3 RELIABILITY ACCOUNTABILITY
34 2018 Year-End Reserves $33.0M Total reserves as of January 1, 2018 Started $5.5M over combined budgets $37.4M Total reserves as of December 31, 2018 Starting 2019 with $7.3M more than expected 4 RELIABILITY ACCOUNTABILITY


35 5 RELIABILITY ACCOUNTABILITY

36 Agenda Item 2c Finance and Audit Committee Meeting February 6, 2019 FRCC Regional Entity Division Unaudited Budget to Actual Variance Comparison as of December 31, 2018 Summary For the twelve months ending December 31, 2018, FRCC is $352K under budget. Total Funding On Budget Workshop funding is $5K unfavorable to budget due to less participation in the SOS training event than originally anticipated. Interest income is $5K favorable due to a reclassification from expense to income in Total Expenses Unfavorable Variance $434K Personnel Expenses (Actual - $526K over budget) o The unfavorable variance is primarily due to unbudgeted retention bonuses partially offset by a higher than budgeted attrition rate, a 2018 new budgeted position that has not been filled and lower than budgeted education expenses, medical expenses, and retirement costs. Meeting Expenses (Actual - $54K under budget) o The favorable variance is primarily due to a reduction in staff travel in the reliability assessments department and meeting expenses in the training and compliance departments. Operating Expenses (Actual - $38K under budget) o The favorable variance is primarily due to the following: $93K lower rent expense due to a decrease in allocated rent costs and lower than the budgeted lease obligations $32K due to decreased software costs $13K due to decreased depreciation in line with the variance in capital expenditures The favorable variance is partially offset by consulting costs which are $104K over budget due to increased use of consultants resulting from a higher than budgeted attrition and additional legal and accounting expenses which are $14K over budget. Total Fixed Asset Expense Favorable Variance $82K Software CapEx (Actual - $60K under budget)
37 o The favorable variance is primarily due to fewer enhancements to the Compliance software Computers CapEx (Actual - $35K under budget) o The favorable variance is primarily due to indirect computer and equipment expenses being less than anticipated along with reduced allocations to statutory for reduced FTEs
38
39 January 22, 2019 Sue Clarke, Vice President Finance and Administration P: F: E: Mr. Scott Jones Mr. Andy Sharp North American Electric Reliability Corporation (NERC) RE: Unaudited Midwest Reliability Organization (MRO) 2018 Fourth Quarter Statement of Activity and Cash Flow through December 31, 2018 Dear Mr. Jones and Mr. Sharp: MRO prepared the 2018 fourth quarter variance report using NERC s guidelines for reporting. 1. MRO has not had any formal changes to its 2018 budget as approved by FERC. The assessment funding projection for 2018 is reported as the assessment funding amount in MRO s FERCapproved 2018 budget (refer to Table 2). 2. The budget amounts of expenses and fixed assets for this reporting period match the budget amounts approved by FERC. 3. MRO s year-end projected expenses are expected to be higher than budgeted. Over-budget variances are quantified and explained for each cost category primarily related to the SPP RE transition (refer to Table 1). The following tables address the above reporting guidelines: Table 1: Preliminary Year-End Expenses (Combined) Table 2: Preliminary Unaudited FERC-Approved 2018 Budget Table 3: Preliminary SPP RE Transition Costs The budget-to-actual variances greater than $10,000 and 10 percent are explained below. Personnel Expenses (Variance of $1,478,036 (17.3%) over budget) MRO s FERC-approved budget for Personnel Expenses is over budget by 2.9 percent due to organization changes that have occurred 83.3 percent or $1,231,552 of the variance is directly related to the SPP RE transition and will be funded by an assessment from SPP RE 1
40 Meeting Expenses (Variance of $286,151 (38.2%) under budget) MRO s FERC-approved budget for Meeting Expenses is under budget due to: (1) fewer face-to-face working group meetings; (2) reduced staff travel due to an increase in the use of MRO s facilities to host meetings; and (3) staff resources being shifted temporarily to SPP-related travel. Operating Expenses (Variance of $371,058 (13.7%) over budget) MRO s FERC-approved budget for Operating Expenses is under budget by 4.6 percent SPP RE transition-related Operating Expenses were $495,634, funded by an assessment from SPP RE Budget Outlook The preliminary unaudited FERC-approved 2018 budget is under budget by 2.7 percent The 2018 combined budget exceeds MRO s FERC-approved budget by $1,865,421 or 15.9 percent The 2018 FERC-approved budget does not include transition costs of $2.2 million, an increase from the originally projected $1.5 million, related to the SPP RE dissolution. This will not impact the 2018 assessments since transition costs have been funded through a transfer of SPP RE assessments to MRO; however, the transferred assessment exceeded $2.2 million and thus impacts the year-end working capital balance. A reassessment of funding will take place when the 2020 business plan and budget is created to determine the management of excess funding. If you have any questions regarding this report, please contact me. Thank you, Sue Clarke Sue Clarke Vice President Finance and Administration Cc: Sara Patrick, MRO President and CEO 2
41 Midwest Reliability Organization Statement of Activity From 1/1/2018 to 12/31/2018 TABLE 1: PRELIMINARY YEAR-END EXPENSES (COMBINED) (In Whole Dollars) Unaudited 2018 End Of Year 2018 Budget 2018 Variance % Funding ERO Funding ERO Assessments $ 10,730,104 $ 10,730,104 - Penalty Sanctions 142, ,000 - Total ERO Funding $ 10,872,105 $ 10,872,104 $ - Federal Grants Membership Dues Testing Fees Services & Software Workshops Interest Miscellaneous/Transitional Funding 4,695,689 1,498,816 3,196,873 Total Funding $ 15,567,794 $ 12,370,920 $ 3,196,873 Expenses Personnel Expenses Salaries $ 7,613,052 $ 6,250,448 1,362,604 Payroll Taxes 500, , ,455 Benefits 686, ,221 23,104 Retirement Costs 1,242,676 1,259,803 (17,127) Total Personnel Expenses $ 10,042,832 $ 8,564,796 $ 1,478, % Meeting Expenses Meetings $ 89,538 $ 93,950 (4,412) Travel 373, ,430 (281,739) Conference Calls Total Meeting Expenses $ 463,229 $ 749,380 $ (286,151) -38.2% Operating Expenses Consultants & Contracts $ 777,098 $ 535, ,971 Office Rent 741, ,700 7,344 Office Costs 515, ,013 (112,988) Professional Services 488, , ,687 Miscellaneous Depreciation 554, ,000 (23,955) Total Operating Expenses $ 3,075,448 $ 2,704,390 $ 371, % Indirect Expenses Total Direct Expenses $ 13,581,509 $ 12,018,566 $ 1,562, % Other Non-Operating Expenses $ - $ - - Total Expenses $ 13,581,509 $ 12,018,566 $ 1,562,943 Change in Assets $ 1,986,285 $ 352,354 $ 1,633,930 Fixed Assets Depreciation (554,045) (578,000) 23,955 Computer & Software CapEx 263, ,170 (23,032) Furniture & Fixtures CapEx 85,319-85,319 Equipment CapEx 4,900-4,900 Leasehold Improvements 211, ,336 Inc(Dec) in Fixed Assets $ 10,648 $ (291,830) $ 302, % Total Budget (B + C) $ 13,592,157 $ 11,726,736 $ 1,865, % Change in Working Capital (A-B-C) $ 1,975,637 $ 644,184 $ 1,331,452 Head Count (3.50) FTEs (0.64) Beginning WC-1/1/18 $ 2,384,548 $ 1,818, ,075 Change to WC ,975, ,184 1,331,453 Working Capital at December 31,2018 $ 4,360,185 $ 2,462,657 $ 1,897,528 3
42 Midwest Reliability Organization Statement of Activity From 1/1/2018 to 12/31/2018 TABLE 2: PRELIMINARY (Unaudited) FERC-APPROVED BUDGET (In Whole Dollars) Unaudited 2018 End Of Year 2018 Budget 2018 Variance % Funding ERO Funding ERO Assessments $ 10,730,104 $ 10,730,104 - Penalty Sanctions 142, ,000 - Total ERO Funding $ 10,872,104 $ 10,872,104 $ - Federal Grants Membership Dues Testing Fees Services & Software Workshops Interest Miscellaneous/Transitional Funding Total Funding $ 10,872,104 $ 10,872,104 $ - Expenses Personnel Expenses Salaries $ 6,614,072 $ 6,250, ,624 Payroll Taxes 430, ,324 39,275 Benefits 622, ,221 (40,671) Retirement Costs 1,144,059 1,259,803 (115,744) Total Personnel Expenses $ 8,811,280 $ 8,564,796 $ 246, % Meeting Expenses Meetings $ 71,531 $ 93,950 (22,419) Travel 314, ,430 (341,073) Conference Calls Total Meeting Expenses $ 385,887 $ 749,380 $ (363,493) -48.5% Operating Expenses Consultants & Contracts $ 572,468 $ 535,127 37,341 Office Rent 732, ,700 (1,610) Office Costs 459, ,013 (168,685) Professional Services 261, ,550 32,334 Miscellaneous Depreciation 554, ,000 (23,955) Total Operating Expenses $ 2,579,815 $ 2,704,390 $ (124,575) -4.6% Indirect Expenses Total Direct Expenses $ 11,776,982 $ 12,018,566 $ (241,584) -2.0% Other Non-Operating Expenses $ - $ - $ - Total Expenses $ 11,776,982 $ 12,018,566 $ (241,584) Change in Assets $ (904,878) $ (1,146,462) $ 241, Fixed Assets Depreciation (554,045) (578,000) 23,955 Computer & Software CapEx 176, ,170 (110,168) Furniture & Fixtures CapEx Equipment CapEx 4,900-4,900 Leasehold Improvements 9,340-9,340 Inc(Dec) in Fixed Assets $ (363,803) $ (291,830) $ (71,973) 24.7% Total Budget (B + C) $ 11,413,180 $ 11,726,736 $ (313,556) -2.7% Change in Working Capital (A-B-C) $ (541,076) $ (854,632) $ 313,556 Head Count (2.50) FTEs (1.81) Beginning WC-1/1/18 $ 2,384,548 $ 1,818, ,075 Change to WC-2018 (541,076) (854,632) 313,556 Working Capital at December 31,2018 $ 1,843,472 $ 963,841 $ 879,631 4
43 Midwest Reliability Organization Statement of Activity From 1/1/2018 to 12/31/2018 TABLE 3: PRELIMINARY SPP RE TRANSITION COSTS (TRANSITIONAL) (In Whole Dollars) Unaudited 2018 End Of Year 2018 Transitional Transitional 2018 Variance % Funding ERO Funding ERO Assessments $ - $ - - Penalty Sanctions Total ERO Funding $ - $ - $ - Federal Grants Membership Dues Testing Fees Services & Software Workshops Interest Miscellaneous/Transitional Funding 4,695,689 1,498,816 3,196,873 Total Funding $ 4,695,689 $ 1,498,816 $ 3,196,873 Expenses Personnel Expenses Salaries $ 998,980 $ 555, ,384 Payroll Taxes 70,180 34,784 35,396 Benefits 63,775 58,952 4,823 Retirement Costs 98, ,984 (13,368) Total Personnel Expenses $ 1,231,552 $ 761,316 $ 470, % Meeting Expenses Meetings $ 18,007 $ - 18,007 Travel 59,334 45,000 14,334 Conference Calls Total Meeting Expenses $ 77,342 $ 45,000 $ 32, % Operating Expenses Consultants & Contracts $ 204,630 $ 100, ,630 Office Rent 8,953-8,953 Office Costs 55, ,000 (284,303) Professional Services 226,354 87, ,854 Miscellaneous Depreciation Total Operating Expenses $ 495,634 $ 527,500 $ (31,866) -6.0% Indirect Expenses Total Direct Expenses $ 1,804,527 $ 1,333,816 $ 470, % Other Non-Operating Expenses $ - $ - $ - Total Expenses $ 1,804,527 $ 1,333,816 $ 470,711 Change in Assets $ 2,891,162 $ 165,000 $ 2,726,162 Fixed Assets Depreciation Computer & Software CapEx 87,135 45,000 42,135 Furniture & Fixtures CapEx 85,319 60,000 25,319 Equipment CapEx Leasehold Improvements 201,996 60, ,996 Inc(Dec) in Fixed Assets $ 374,451 $ 165,000 $ 209, % Total Budget (B + C) $ 2,178,978 $ 1,498,816 $ 680, % Change in Working Capital (A-B-C) $ 2,516,712 $ - $ 2,516,712 Head Count (1.00) FTEs Beginning WC-1/1/18 $ - $ - - Change to WC ,516,712-2,516,712 Working Capital at December 31,2018 $ 2,516,712 $ - $ 2,516,712 5
44 January 18, 2019 North American Electric Reliability Corporation 3353 Peachtree Road NE Suite 600, North Tower Atlanta, GA Attention: Mr. Scott Jones Subject: NPCC Regional Entity Division Variance Comparison and Fourth Quarter 2018 Statement of Activities Dear Scott: The variance comparison for the period ended December 31, 2018 is included along with Northeast Power Coordinating Council, Inc. s unaudited Fourth Quarter 2018 Statement of Activities. Please do not hesitate to contact me via at jhala@npcc.org or via telephone at (212) should you have any comments or questions with regard to the materials provided. Enclosures Sincerely, cc: Mr. Christopher Weir, CPA NPCC Treasurer Mr. Edward A. Schwerdt NPCC President & CEO Ms. Jennifer Budd Mattiello NPCC Senior Vice President & COO ERO Finance Group Jessica Hala Jessica Hala Senior Manager, Finance and Accounting
45 NPCC Regional Entity Division Budget to Actual Variance Comparison as of December 31, 2018 TOTAL EXPENSES INCOME For the year ended December 31, 2018, the NPCC Regional Entity Division is $688k or -4.55% under budget based on invoices received to date. Areas that were under budget include Personnel Expenses, Meeting Expenses and Office Costs. The continuing and much appreciated volunteerism within the NPCC membership contributed to NPCC achieving its reliability objectives while staying under budget. Based on emerging areas of focus within 2018, NPCC successfully reprioritized resources to fulfill all of its responsibilities under its Regional Delegation Agreement. Under budget total expenses at year end were driven primarily by cost controls in Travel and Meetings expenses and contract negotiations in Office Costs. Penalty Sanctions (Actual income of $75k remitted to NPCC from July 1, 2016 through June 30, 2017 was applied to reduce 2018 assessments to NPCC U.S. load serving entity designees.) No penalty sanctions were received from July 1, 2017 through June 30, All penalties remitted from July 1, 2018 through June 30, 2019 will be applied to reduce 2020 assessments to NPCC U.S. load serving entity designees. Interest Income (Actual income of 27$k at year end, not included in budget) NPCC accounts for but has not budgeted for interest income for operating fund investments as returns on U.S. treasury securities fund have been negligible and corporate money market fund returns have been minimal. With the current trend toward rising interest rates, NPCC could experience greater returns on operating cash in the future. o NPCC allocated $27k as a portion of total interest income (93%) to the Regional Entity Division consistent with the ratio of Regional Entity (RE) to Criteria Services (CS) Division 2018 funding. A common system of accounts, with divisional separation, is used for both RE and CS revenue tracking and financial reporting. EXPENSES Personnel Expenses (Variance of $342k under budget at year end) o NPCC is currently fully staffed. Vacancies resulting from the departure of seasoned professionals were filled through a combination of in-house promotions, resource re-allocations and the retention of less seasoned successors, with the net result of lower than budgeted salaries and related personnel expenses. 1
46 Meeting Expenses (Variance of $295k under budget at year end) o Cost savings resulted from streamlining NPCC Spring and Fall Compliance and Standards Workshops from a three day format to a two day format. Efforts to hold more meetings onsite, at member facilities or conduct numerous NPCC webinars where effective and pragmatic for NPCC registered entities, will continue. Additionally, NPCC continues to limit the number of attendees sent to off-site meetings and encourages participation via webinar and teleconference when available. Consultants and Contracts (Variance of $131k over budget at year end) o Over budget variance of $131k is related to unbudgeted risk assessment initiatives including increased probabilistic assessments, a gas supply disturbance study and a tie benefits study. These important riskassessing initiatives and associated resource needs had not been identified prior to the June 2017 approval of the 2018 NPCC Business Plan and Budget. Office Costs (Variance of $99k under budget at year end) o Lower negotiated office internet rates and cell phone contracts resulted in significant cost savings. Fixed Assets (Variance of $39k under budget at year end) o Under budget variance is based on no new functionality added for the CDAA and CITS tools through the end of the year and the timing of scheduled software development projects, which included the continued roll out of NPCC s document management system. Net Change in Assets (Variance of $690k under budget at year end) o Under budget net change in assets is a result of variance in total expenses. Change in Working Capital (Variance of $714k under budget at year end) o Under budget change in working capital is a result of variance in total budget. (Unaudited) Submitted January 18,
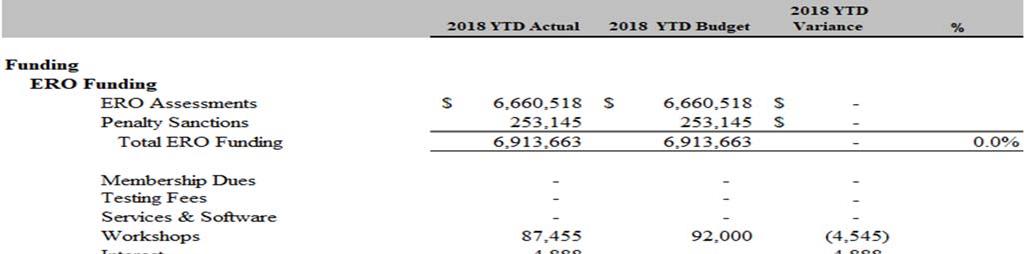
 For the Period Ended December 31, 2018 2018 YTD Actual 2018 YTD Budget 2018 YTD Actual")
47 Northeast Power Coordinating Council, Inc. - Regional Entity Division Statement of Activities, Fixed Assets and Change in Working Capital (Unaudited) For the Period Ended December 31, YTD Actual 2018 YTD Budget 2018 YTD Actual Variance from Budget % Funding Assessments 14,341,787 14,341,787 - Penalties 75,000 75,000 - Testing Services & Software Workshop Fees 63,449 64,000 (551) Interest 27,198-27,198 Miscellaneous Total Funding 14,507,434 14,480,787 26, % Expenses Personnel Expenses Salaries 6,845,678 7,107,599 (261,921) Payroll Taxes 411, ,441 (72) Employee Benefits 1,474,950 1,476,378 (1,427) Savings & Retirement 746, ,353 (78,831) Total Personnel Expenses 9,478,519 9,820,770 (342,251) -3.48% Meeting Expenses Meetings 261, ,050 (91,706) Travel 637, ,500 (197,441) Conference Calls 30,917 37,000 (6,083) Total Meeting Expenses 929,320 1,224,550 (295,230) % Operating Expenses Consultants & Contracts 2,008,416 1,877, ,776 Rent & Improvements 783, ,700 (26,771) Office Costs 566, ,760 (98,646) Professional Services 909, ,000 (50,150) Miscellaneous 46,200 50,000 (3,800) Depreciation 254, ,000 (14,883) Total Operating Expenses 4,568,626 4,632,100 (63,474) -1.37% Indirect Expense Allocation (378,818) (416,453) 37, % Other Non-Operating Expenses n/a Total Expenses 14,597,648 15,260,967 (663,319) -4.35% Net Change in Assets (90,214) (780,180) 689, % Fixed Assets Depreciation (254,117) (269,000) 14,883 Computer & Software CapEx 75, ,000 (39,223) Furniture & Fixtures CapEx Equipment CapEx Leasehold Improvements Incr(Dec) in Fixed Assets (178,340) (154,000) (24,340) 15.81% Total Budget (Expenses plus Incr(Dec) in Fixed Assets) 14,419,307 15,106,967 (687,660) -4.55% Change in Working Capital (Total Funding less Total Budget) 88,127 (626,180) 714, % Equivalent Full Time Employees (0.33) Headcount Beginning Total Reserves - 1/1/18 5,017,751 4,499, ,858 Change to Reserves - YTD ,127 (626,180) 714,307 Projected Total Reserves at 12/31/18 5,105,878 3,873,713 1,232,165
48 Jill S. Lewton Controller 3 Summit Park Drive, Suite 600 Cleveland, OH Office: Jill.lewton@rfirst.org January 22, 2019 Mr. Scott Jones North American Electric Reliability Corporation 3353 Peachtree Road, N.E. Suite 600, North Tower Atlanta, Georgia ReliabilityFirst s th Quarter Statement of Activities Variance Report - Unaudited Dear Mr. Scott Jones: As requested, the attached th Quarter Statement of Activities (unaudited) provides a comparison of budgeted and actual expenses relative to the 2018 ReliabilityFirst Corporation s Budget. For more information, please contact me at or jill.lewton@rfirst.org. Very truly yours, RELIABILITYFIRST CORPORATION Jill S. Lewton Jill S. Lewton Controller Forward Together ReliabilityFirst
49 ReliabilityFirst s th Quarter Statement of Activities Variance Report - Unaudited Significant Variances For the year ending December 31, 2018 ReliabilityFirst Corporation is $497k (2.33%) under budget. The major contributors to this variance are: Budget Funding Investment Income: 38K (76%) over budget for YTD o Investment Income is over budget due to the growth in value of the company s investment portfolio. Budget Expenses Personnel Expenses o Personnel Expenses: $551K (3%) under budget for YTD Personnel Expenses are primarily under budget due to personnel being below the approved staffing levels. ReliabilityFirst had four open positions at year end and is actively pursuing qualified candidates. Meeting Expenses o Travel: $64K (9%) under budget for YTD Travel is under budget due to the travel activity being less than budgeted. Operating Expenses o Contracts & Consultants: $56K (14%) over budget for YTD Contracts and Consultants is primarily over budget due to the costs associated with the data warehouse project, which were not budgeted. Depreciation o Depreciation: $67K (18%) over budget for YTD Depreciation expense directly correlates to current and prior years fixed asset activities. Therefore, as a result of last year s expenditures for the corporate internal and public websites, and office improvements being more than budgeted, more depreciation is being recorded than budgeted. Forward Together ReliabilityFirst
50 Fixed Assets o Computer Hardware & Software: $19K (10%) over budget for YTD Computer Hardware & Software is primarily over budget due to the costs associated with the redesign and development of the corporate extranet site. o Furniture & Fixtures: $7K (100%) over budget for YTD Furniture and Fixtures is over budget due to the purchase of a workstation for additional office space. o Leasehold Improvements: $27K (100%) over budget for YTD Leasehold Improvements is over budget due to the completion of some minor office modifications. Reserves Working Capital Reserve The Working Capital Reserve of $3,318,239 will be utilized to satisfy projected cash flow for daily operations and to stabilize and minimize volatility in future years assessments. This amount is slightly less than what was projected in the 2018 Business Plan and Budget as a result of utilizing a small amount of working capital to fund daily operations in Operating Reserve The Operating Reserve of $1,000,000 has been designated with the intention of providing for any unbudgeted and unexpected expenditures for the organization. Forward Together ReliabilityFirst
 % Variance Funding Assessments 20,147,707 20,147,707 0 0.00% Penalty Sanctions 1,912,877 1,912,877 0 0.00% Investment Income 88,147 50,000 38,147 76.")
51 ReliabilityFirst Corporation Statement of Activities, Fixed Assets and Change in Working Capital (unaudited) From 01/01/2018 Through 12/31/2018 (in Whole Numbers) 2018 Actual 2018 Budget YTD Variance Over/(Under) % Variance Funding Assessments 20,147,707 20,147, % Penalty Sanctions 1,912,877 1,912, % Investment Income 88,147 50,000 38, % Miscellaneous Income 6, , % Total Funding 22,155,325 22,110,584 44, % Expenses Personnel Expenses Salaries 12,725,182 12,975,641 (250,459) -1.93% Payroll Taxes 757, ,357 (8,295) -1.08% Employee Benefits 1,914,058 2,049,655 (135,597) -6.62% Savings & Retirement Costs 1,981,773 2,138,337 (156,564) -7.32% Total Personnel Expenses 17,378,075 17,928,990 (550,915) -3.07% Meeting Expenses Meetings 312, ,375 11, % Travel 649, ,250 (63,808) -8.95% Conference Calls 38,852 50,400 (11,548) % Total Meeting Expenses 1,000,639 1,064,025 (63,386) -5.96% Operating Expenses Contracts & Consultants 446, ,132 56, % Rent & Utilities 540, ,595 20, % Office Costs 832, ,717 1, % Professional Services 396, ,245 (15,157) -3.69% Miscellaneous 41,926 40,696 1, % Depreciation 440, ,325 66, % Total Operating Expenses 2,697,651 2,566, , % Non-Operating Expenses % Total Expenses 21,076,364 21,559,725 (483,361) -2.24% Net Change in Assets 1,078, , , % Fixed Assets Depreciation (440,139) (373,325) (66,814) 17.90% Computer Hardware & Software 216, ,500 18, % Furniture & Fixtures 6, , % Leasehold Improvements 27, , % Increase/(Decrease) in Fixed Assets (189,879) (175,825) (14,054) 7.99% Total Budget (Expenses + Incr/(Decr) in Fixed Assets) 20,886,485 21,383,900 (497,415) -2.33% Change in Working Capital (Total Funding less Total Budget) 1,268, , , % FTE (2.21) -2.90% WC - 12/31/ ,566 (558,612) 698,178 Less: Adjustment for future liabilities (698,178) 0 (698,178) Available Working Capital (558,612) (558,612) 0 Change to WC ,268, , ,156 Other Adjustments to Reserves (158,073) (158,073) 0 Total Working Capital 552,154 9, ,156 Working Capital Reserve 3,318,239 3,318,239 0 Operating Reserve 1,000,000 1,000,000 0 Total Working Capital and Operating Reserve 4,870,393 4,328, ,156


52 January 18, 2019 Mr. Scott Jones North American Electric Corporation 3353 Peachtree Road, NE Atlanta, GA RE: SERC 2018 Unaudited Financial Statement Budget vs. Actual Scott: Following please find SERC s unaudited 2018 financial statement, reflecting actual to budgeted amounts with variance explanations. If you have any questions, please let me know. Thank you, George Krogstie Director, Finance cc: Jason Blake 3701 Arco Corporate Drive, Suite 300, Charlotte, NC Office: Fax:
53 (In Whole Dollars) SERC Reliability Corporation YTD Report to Treasurer From 1/1/2018 Through 12/31/ Actual 2018 YTD Budget 2018 YTD Actual Variance Over/(Under) % Funding ERO Funding 17,205,136 17,205,136 - Penalties 727, ,978 - Workshops 149, ,025 (26,690) Interest 4,693 1,000 3,693 Miscellaneous 803,616 86, ,616 Total Funding 18,890,758 18,196, , % Expenses Personnel Expenses Salaries 9,781,046 9,833,357 (52,311) Payroll Taxes 586, ,668 (140,949) Benefits 1,091,011 1,094,551 (3,540) Retirement Costs 1,039,009 1,281,811 (242,802) Total Personnel Expenses 12,497,785 12,937,388 (439,603) -3.40% Meeting Expenses Meetings 216, ,160 (50,083) Travel 478, ,865 (128,534) Communications 27,130 44,544 (17,414) Total Meeting Expenses 721, ,569 (196,031) % Operating Expenses Contracts & Consultants 2,202,649 1,855, ,768 Office Rent 787, , ,622 Office Costs 613, , ,437 Professional Services 184,240 57, ,240 Miscellaneous/Contingency - 5,550 (5,550) Capital Depreciation Expenditures 307, ,068 (145,554) Total Operating Expenses 4,095,941 3,435, , % Other Non-Operating Expenses Total Expenses 17,315,264 17,290,935 24, % Net Change in Assets 1,575, , , % Fixed Assets Depreciation (307,514) (453,068) 145,554 Computer & Software CapEx 134, ,002 (210,841) Furniture & Fixtures CapEx 22,789-22,789 Equipment CapEx 65,499-65,499 Leasehold Improvements 72,631-72,631 Increase(Decrease) in Fixed Assets (12,435) (108,067) 95, % - Total Budget(Exp plus Incr/(Decr) in Fixed Assets 17,302,829 17,182, , % Change in Working Capital (Total Funding less Total Budget) 1,587,929 1,013, , % FTE's (6.75) Head Count (6.00) Beginning WC Reserve at ,359, , ,993 Change to WC ,587,929 1,013, ,658 Working Capital Reserve at 12/31/2018 2,947,651 1,700,000 1,247,651
54 Budget to Actual Comparison as of December 31, 2018 (Unaudited) Overall Summary Spending $68K over budget associated with SPP transition expenses Funding $695k over budget attributable to distribution of funds from SPP Net favorable working capital variance of $575K versus budget Income Revenue (Actual - $695K over budget) o Includes $725K distribution of funds from SPP Expense Personnel Expenses (Actual - $440K under budget) o Actual vacancy rates higher than budgeted, driving lower salary, taxes, benefits and retirement costs, partially offset by one-time CEO transition costs Meeting/Travel Expenses (Actual - $196K under budget) o Various meetings cancelled due to weather or deferred to next year o Compliance travel down due to use of contractors in lieu of FTE s Contracts/Consultants (Actual - $347K over budget) o YTD variance due to contractors used in lieu of FTEs, primarily for CMEP activities, together with unbudgeted SPP data migration Office Rent (Actual - $159K over budget) o Budget variance due to lease of additional office space Office Costs (Actual - $178K over budget) o Higher than expected expenses due primarily to IT related purchases (computers, software, etc.), together with increased office supplies and office maintenance costs Professional Services (Actual - $127K over budget) o Legal fees associated with employment matters and review of SERC bylaws driving budget variance Capital Depreciation (Actual - $146K under budget) o Fixed asset purchases were less than projected in 2017 and 2018, resulting in lower depreciation Miscellaneous (Actual - $6K under budget) Fixed Asset Purchases (Actual - $50K under budget) o Variance due to limited CUG development costs and expensing of computer purchases previously budgeted as fixed assets, partially offset by CRISP, and leasehold improvements for new office space
55 Deborah K. Currie Manager, Interregional Affairs Southwest Power Pool 201 Worthen Dr. Little Rock, AR P December 14, 2018 Via Electronic Mail Scott Jones, Senior Vice President, Chief Financial and Administrative Officer Andy Sharp, Controller North American Electric Reliability Corporation 3353 Peachtree Road, NE Suite 600, North Tower Atlanta, GA Subject: Southwest Power Pool Regional Entity 2018 Actual Cost-to-Budget Comparison Dear Mr. Jones and Mr. Sharp: Attached is Southwest Power Pool, Inc. s (SPP, Inc.) submission of SPP Regional Entity s (SPP RE) 2018 Actual Cost-to-Budget Comparison (2018 True Up Filing). SPP RE received approximately $9.7 million in statutory funds and due to the dissolution of SPP RE and the termination of the Regional Delegation Agreement on August 31, 2018, incurred approximately $5.3 million in statutory expense (compared to $10.8 million budget). The $465k funding variance results from the transfer of penalty funds traditionally held for the 2019 budget (approximately $435k) and the 2020 budget (approximately $30k) to MRO and SERC. 1 SPP RE performs only statutory activities, and therefore no statutory funding was used for non-statutory activities. The net impact on SPP RE s cash position for the year was a $5.9 million negative variance (compared to the budgeted $776 million negative variance). 2 The significant expense variances at the aggregate statutory level are explained below, while the explanation for the expense variances by statutory program area are provided in the Attachment 1. 1 SPP RE made the following funds transfers to MRO and SERC in accordance with the Termination Agreement paragraphs 5(c) and 5(g): penalty monies held in reserve for the 2019 and 2020 budgets (~$465k) on October 29, 2018; Q3 and Q4 assessments totaling ~$4.863 million on November 16, 2018 and there will be a final transfer of ~$557k made on December 20, SPP RE reported a beginning working capital balance as of 1/1/2018 of $1,015,236 on the 1 st Quarter Unaudited Actual to Budget Comparison and Statement of Activities (Quarter Report) and the 2 nd Quarter Report. During the preparation of the 3 rd Quarter Report, it was discovered that the $290,000 of penalty funds released for use on 1/1/2018 had been inadvertently included in the beginning working capital balance. The 3 rd Quarter Report and the 2018 True-up Filing reflect the corrected beginning working capital balance of $725,235. 1
56 SPP Regional Entity 2018 True-up Filing December 14, 2018 Page 2 Aggregate Expense Variances Personnel Expenses (Actual - $3.0 million or 43% under budget) Personnel expenses trailed budget primarily due to the dissolution of SPP RE and the termination of SPP RE s Regional Delegation Agreement on August 31, Compliance, Monitoring and Enforcement Program (CMEP) activities concluded on June 30, 2018 and all SPP RE personnel were terminated on that date with the exception of four management employees that remained through August 31, 2018 to complete wind-down activities. Positions that become open during the year were not filled. Travel and Meeting Expenses (Actual - $121K or 78% under budget) Travel expenses trailed budget primarily due to the cessation of CMEP activities on June 30, 2018 and unfilled budgeted staff positions. Operating Expenses (Actual - $439K or 67% under budget) Operating expenses trailed budget primarily due to the dissolution of SPP RE. All contracts were terminated with an effective date of June 30, 2018 and the SPP RE Trustees conducted a final meeting on August 31, 2018 which concluded their service. SPP, Inc. Indirect Expense (Actual - $1.6 million or 56% under budget) SPP Inc. Indirect Expenses trailed budget primarily due to actual SPP, Inc. corporate overhead costs being below the budget amount (3% escalation factor applied to the 2016 actual expenses) due to the dissolution of SPP RE. For the period, March 1, 2018 to June 30, 2018 SPP RE capped the SPP, Inc. shared staff time to 500 hours per month. With the cessation of CMEP activities on June 30, 2018, SPP RE provided no compensation for shared staff time effective July 1, Total Expenses (Actual $5.3 million or 51% under budget) SPP RE trailed budget primarily due the cessation of CMEP activities on June 30, 2018 and the termination of the Regional Delegation Agreement on August 31, SPP, Inc. Shared Staff and Indirect Support Staff The SPP governing documents, approved by NERC and FERC, allow for the use of SPP, Inc. staff not directly assigned to the SPP RE in the performance or support of some of the responsibilities that are performed by the SPP RE. There are two groups of SPP, Inc. staff that support the SPP RE. First, there is a group that performs some of the primary duties delegated to the SPP RE referred to as shared staff. Shared staff consists of a portion of the SPP RTO engineering staff that performs the technical studies that form the basis for the SPP Regional Assessments published by NERC. Second, there is another group that supplies administrative services to the SPP RE such as accounting, computer support, human resources support, building services support, etc. referred to as indirect support staff. In general, indirect support staff does not directly charge time and expenses to the SPP RE; these costs are billed through a primarily fixed administrative charge referred to as SPP, Inc. Indirect Overhead Expense Charge. Neither group participates in compliance or enforcement decisions of the SPP RE. Shared staff members charge time and expenses directly to the SPP RE accounts and their hours are included in the official total full time equivalent headcount of the SPP RE for the purposes of reporting to NERC and FERC. Shared staff members record specific hours worked in the performance or
57 SPP Regional Entity 2018 True-up Filing December 14, 2018 Page 3 support of the SPP RE s statutory functions in SPP, Inc. s time tracking system. These hours are posted by the shared staff members and reviewed and approved by their specific manager or supervisor. SPP RE staff review the hours posted by the shared staff members. This procedure results in actual hours spent by shared staff on SPP RE statutory functions being charged directly to the particular SPP RE direct function at the shared staff member s compensation rate. In addition, an allocation of overhead costs is added to the directly assignable staff s hourly rate for these employees. These direct charges are included in the SPP RE s Business Plan and Budget. For 2018, shared staff charged SPP RE 3,825 hours, or 3.0 FTEs based on SPP s standard assumption that total number of hours in a year is 1,880. However, due to the SPP RE dissolution, FTE shared staff worked until June 30, The total hours include SPP, Inc. staff time needed to complete wind-down activities effective to August 31, SPP RE budgeted 4.3 shared staff FTEs for The costs of indirect support staff and other overhead charges (office space, computers, portable electronic devices, etc.) (SPP, Inc. Indirect Expenses), were assessed to the SPP RE based on an annual allocation of SPP s shared services support costs via an appropriate measure (headcount, square footage, number of devices, etc.) The SPP, Inc. Indirect Expenses assessed to the SPP RE are included in the SPP RE s Business Plan and Budget. The SPP, Inc. support costs included in the calculations are reviewed in detail to help ensure that SPP RTO specific costs are excluded from the calculation. Due to the timing of the budget schedule, the estimated indirect expense charge for 2018 was based on actual 2016 costs, escalated by 3%. The calculation for the rate that was used in the development of the 2018 budget and the calculation for the actual 2018 costs are shown in Attachments 2 and 3, respectively. If you have any questions related to the submitted materials please feel free to contact me at or dcurrie@spp.org. Sincerely, Deborah K Currie Deborah K. Currie Manager, Interregional Affairs
58 Southwest Power Pool Regional Entity Statement of Activities From 1/1/2018 through 12/20/2018 Attachment I Total Statutory 2018 Actual 2018 Budget 2018 Variance from Budget Variance % Funding ERO Funding Assessments 9,727,265 9,727,265 - Penalty Sanctions 754, , , % Total ERO Funding $ 10,482,230 $ 10,017,265 $ 464,965 Federal Grants Membership Fees Testing Services & Software Workshop Fees Interest 2,024-2,024 Miscellaneous (5,885,831) - (5,885,831) Total Funding (A) $ 4,598,424 $ 10,017,265 $ (5,418,841) -54% Expenses Personnel Expenses Salaries 2,654,327 4,412,561 (1,758,234) -40% Payroll Taxes 142, ,561 (195,351) -58% Employee Benefits 120, ,305 (221,446) -28% Savings & Retirement 94, ,502 (81,964) -46% Total Personnel Expenses $ 3,011,933 $ 5,268,929 $ (2,256,996) -43% Meeting Expenses Meetings 37, ,000 (69,651) -65% Travel 83, ,500 (367,588) -81% Conference Calls Total Meeting Expenses $ 121,260 $ 558,500 $ (437,240) -78% Operating Expenses Consultants & Contracts 252,695 1,073,100 (820,405) -76% Rent & Improvements Office Costs 6,411 10,000 (3,589) -36% Professional Services 179, ,988 (57,129) -24% Miscellaneous Depreciation Total Operating Expenses $ 438,965 $ 1,320,088 $ (881,123) -67% Total Direct Expenses $ 3,572,159 $ 7,147,517 $ (3,575,358) -50% SPP Inc. Indirect Expenses $ 1,590,161 $ 3,645,678 $ (2,055,517) -56% SPP RE Indirect Expenses (1) $ (0) $ - $ (0) Total Indirect Expenses $ 1,590,161 $ 3,645,678 $ (2,055,517) -56% Other Non-Operating Expenses $ 161,339 $ - $ 161,339 Total Expenses (B) $ 5,323,659 $ 10,793,195 $ (5,469,536) -51% Change in Assets (A - B) (725,235) (775,930) 50,695-7% Fixed Assets Depreciation Computer & Software CapEx Furniture & Fixtures CapEx Equipment CapEx Leasehold Improvements Incr(Dec) in Fixed Assets Allocation of Fixed Assets Total Inc(Dec) in Fixed Assets (C) TOTAL BUDGET (B + C) $ 5,323,659 $ 10,793,195 $ (5,469,536) -51% Change in Working Capital (A-B-C) $ (725,235) $ (775,930) $ 50,695-7% FTEs (2) (14.4) -45% (1) SPP RE Indirect Expenses which represent direct expenses for SPP RE Administrative Services, are included in direct expenses. (2) Actual FTE equal RE Direct Staff FTEs (number of days employed at RE during 2018 divided by 365) plus Shared Staff FTEs (2018 billed hours divided by 1880) 1
59 Southwest Power Pool Regional Entity Statement of Activities From 1/1/2018 through 12/20/2018 Attachment I RELIABILITY STANDARDS Funding 2018 Actual 2018 Budget 2018 Variance from Budget Variance Over(Under) % ERO Funding Assessments 78,219 $ 78,219-0% Penalty Sanctions 3,395 1,304 2, % Total ERO Funding $ 81,614 $ 76,377 $ 2,091 3% Federal Grants Membership Fees Testing Services & Software Workshop Fees Interest Miscellaneous Total Funding (A) $ 81,614 $ 76,377 $ 4,182 5% Expenses Personnel Expenses Salaries 8,541 20,902 (12,361) -59% Payroll Taxes 653 1,599 (946) -59% Employee Benefits 608 1,107 (500) -45% Savings & Retirement (435) -52% Total Personnel Expenses $ 10,203 $ 24,444 $ (14,241) -58% Meeting Expenses Meetings Travel - 25,000 (25,000) -100% Conference Calls Total Meeting Expenses $ - $ 25,000 $ (25,000) -100% Operating Expenses Consultants & Contracts Rent & Improvements Office Costs Professional Services Miscellaneous Depreciation Total Operating Expenses $ - $ - $ - Total Direct Expenses $ 10,203 $ 49,444 $ (39,241) -79% SPP Inc. Indirect Expenses 5,580 14,109 (8,529) -60% SPP RE Indirect Expenses 4,712 15,970 (11,258) -70% Total Indirect Expenses $ 10,291 $ 30,079 $ (19,787) -66% Other Non-Operating Expenses $ - $ - $ - Total Expenses (B) $ 20,495 $ 79,523 $ (59,028) -74% Change in Assets (A - B) $ 61,119 $ (3,146) $ 63, % Fixed Assets Depreciation Computer & Software CapEx Furniture & Fixtures CapEx Equipment CapEx Leasehold Improvements Incr(Dec) in Fixed Assets $ - $ - $ - Allocation of Fixed Assets Total Inc(Dec) in Fixed Assets (C) $ - $ - $ - TOTAL BUDGET (B + C) $ 20,495 $ 79,523 $ (59,028) -74% Change in Working Capital (A-B-C) $ 61,119 $ (3,146) $ 63, % FTE's (0.06) -50% 2
60 Southwest Power Pool Regional Entity Statement of Activities From 1/1/2018 through 12/20/2018 Attachment I Explanation of 2018 Variance Reliability Standards Personnel Expenses Personnel expenses trailed budget primarily due to the dissolution of SPP RE and the termination of the Regional Delegation Agreement on August 31, Standards related activities ceased on or before June 30, 2018 with the conclusion of CMEP activities and the transfer of SPP RE data to MRO, SERC, and NERC. Travel Expenses Travel expenses trailed budget primarily due to the dissolution of SPP RE. Travel activities were curtailed prior to the conclusion of CMEP activities on June 30, SPP RE Indirect Expenses SPP RE indirect expenses trailed budget primarily due to the dissolution of SPP RE and the termination of the Regional Delegation Agreement. 3
61 Southwest Power Pool Regional Entity Statement of Activities From 1/1/2018 through 12/20/2018 Attachment I COMPLIANCE OPERATIONS, ENFORCEMENT and ORGANIZATION REGISTRATION (Includes Critical Infrastructure Protection) 2018 Actual 2018 Budget 2018 Variance from Budget Variance Over(Under) % Funding ERO Funding Assessments 8,239,822 8,239,822-0% Penalty Sanctions 590, , , % Total ERO Funding $ 8,830,486 $ 8,466,710 $ 363,776 4% Federal Grants Membership Fees Testing Services & Software Workshop Fees Interest Miscellaneous Total Funding (A) $ 8,830,486 $ 8,466,710 $ 727,551 9% Expenses Personnel Expenses Salaries 1,794,712 2,736,426 (941,714) -34% Payroll Taxes 101, ,337 (108,150) -52% Employee Benefits 80, ,018 (144,157) -64% Savings & Retirement 64, ,457 (45,307) -41% Total Personnel Expenses $ 2,040,909 $ 3,280,238 $ (1,239,329) -38% Meeting Expenses Meetings 17,903 17, % Travel 47, ,000 (176,130) -79% Conference Calls Total Meeting Expenses $ 65,773 $ 241,000 $ (175,227) -73% Operating Expenses Consultants & Contracts 246,192 1,012,000 (765,808) -76% Rent & Improvements Office Costs 4,889-4,889-76% Professional Services - 10,888 (10,888) -100% Miscellaneous Depreciation Total Operating Expenses $ 251,081 $ 1,022,888 $ (771,807) -75% - Total Direct Expenses $ 2,357,763 $ 4,544,126 $ (2,186,363) -48% SPP Inc. Indirect Expenses 929,324 2,454,906 (1,525,582) -62% SPP RE Indirect Expenses 1,088,777 1,467,679 (378,902) -26% Total Indirect Expenses $ 2,018,100 $ 3,922,585 $ (1,904,484) -49% Other Non-Operating Expenses $ - $ - $ - Total Expenses (B) $ 4,375,863 $ 8,466,710 $ (4,090,847) -48% Change in Assets (A - B) $ 4,454,623 $ - $ 4,818,398 Fixed Assets Depreciation Computer & Software CapEx Furniture & Fixtures CapEx Equipment CapEx Leasehold Improvements Incr(Dec) in Fixed Assets $ - $ - $ - Allocation of Fixed Assets Total Inc(Dec) in Fixed Assets (C) $ - $ - $ - TOTAL BUDGET (B + C) $ 4,375,863 $ 8,466,710 $ (4,090,847) -48% Change in Working Capital (A-B-C) $ 4,454,623 $ - $ 4,818,398 FTE's (11.34) -52% 4
62 Southwest Power Pool Regional Entity Statement of Activities From 1/1/2018 through 12/20/2018 Attachment I Explanation of 2018 Variance Compliance Operations, Enforcement and Organization Registration Personnel Expenses Personnel expenses trailed budget primarily due to the dissolution of SPP RE and the termination of the Regional Delegation Agreement on August 31, Compliance, enforcement and organization registration related activities ceased on or before June 30, 2018 with the conclusion of CMEP activities and the transfer of SPP RE data to MRO, SERC, and NERC. Travel Expenses Travel expenses trailed budget primarily due to the dissolution of SPP RE. Travel activities were curtailed prior to the conclusion of CMEP activities on June 30, Consultants &Contracts Consultants & Contracts expenses trailed budget primarily due to the cessation of CMEP activities on June 30, All contracts were terminated with an effective date no later than June 30, 2018 with the conclusion of CMEP activities. Professional Services Professional Services expenses trailed budget primarily due to the cessation of CMEP activities on June 30, SPP, Inc. Indirect Expenses SPP, Inc. indirect expenses trailed budget primarily due to the dissolution of SPP RE and the termination of the Regional Delegation Agreement. SPP RE Indirect Expenses SPP RE indirect expenses trailed budget primarily due to the dissolution of SPP RE and the termination of the Regional Delegation Agreement. 5
63 Southwest Power Pool Regional Entity Statement of Activities From 1/1/2018 through 12/20/2018 Attachment I RELIABILITY ASSESSMENTS and PERFORMANCE ANALYSIS 2018 Actual 2018 Budget Variance from Budget Over(Under) Variance % Funding ERO Funding Assessments 2,060,631 2,060,631-0% Penalty Sanctions 157,510 60,504 97, % Total ERO Funding $ 2,218,141 $ 2,121,135 $ 97,006 5% Federal Grants Membership Fees Testing Services & Software Workshop Fees Interest Miscellaneous Total Funding (A) $ 2,218,141 $ 2,121,135 $ 194,013 9% Expenses Personnel Expenses Salaries 205, ,249 (608,502) -75% Payroll Taxes 15,740 62,290 (46,550) -75% Employee Benefits 18,884 54,365 (35,481) -65% Savings & Retirement 9,670 32,570 (22,900) -70% Total Personnel Expenses $ 250,041 $ 963,474 $ (713,433) -74% Meeting Expenses Meetings - - Travel 1, ,000 (108,464) -99% Conference Calls Total Meeting Expenses $ 1,536 $ 110,000 $ (108,464) -99% Operating Expenses Consultants & Contracts 6,503 35,000 (28,497) -81% Rent & Improvements - - Office Costs - - Professional Services - - Miscellaneous - - Depreciation - - Total Operating Expenses $ 6,503 $ 35,000 $ (28,497) -81% Total Direct Expenses $ 258,081 $ 1,108,474 $ (850,393) -77% SPP Inc. Indirect Expenses 360, ,642 (294,206) -45% SPP RE Indirect Expenses 119, ,019 (238,842) -67% Total Indirect Expenses $ 479,614 $ 1,012,661 $ (533,047) -53% Other Non-Operating Expenses $ - $ - $ - Total Expenses (B) $ 737,694 $ 2,121,135 $ (1,383,440) -65% Change in Assets (A - B) $ 1,480,447 $ - $ 1,577,453 Fixed Assets Depreciation Computer & Software CapEx Furniture & Fixtures CapEx Equipment CapEx Leasehold Improvements Incr(Dec) in Fixed Assets $ - $ - $ - Allocation of Fixed Assets Total Inc(Dec) in Fixed Assets (C) $ - $ - $ - TOTAL BUDGET (B + C) $ 737,694 $ 2,121,135 $ (1,383,440) -65% Change in Working Capital (A-B-C) $ 1,480,447 $ - $ 1,577,453 FTE's (2.71) -40% 6
64 Southwest Power Pool Regional Entity Statement of Activities From 1/1/2018 through 12/20/2018 Attachment I Explanation of 2018 Variance Reliability Assessments and Performance Analysis (RAPA) Personnel Expenses Personnel expenses trailed budget primarily due to the dissolution of SPP RE and the termination of the Regional Delegation Agreement on August 31, RAPA related activities ceased on or before June 30, 2018 with the conclusion of CMEP activities and the transfer of SPP RE data to MRO, SERC, and NERC. Travel Expenses Travel expenses trailed budget primarily due to the dissolution of SPP RE. Travel activities were curtailed prior to the conclusion of CMEP activities on June 30, Consultants & Contracts Consultants & Contracts expenses trailed budget primarily due to the cessation of CMEP activities on June 30, All contracts were terminated with an effective date no later than June 30, 2018 with the conclusion of CMEP activities. SPP, Inc. Indirect Expenses SPP, Inc. indirect expenses trailed budget primarily due to the dissolution of SPP RE and the termination of the Regional Delegation Agreement. SPP RE s use of Engineering Shared Staff trailed budget (3.0 FTEs actual compared to 4.3 FTEs budgeted). SPP RE Indirect Expenses SPP RE indirect expenses trailed budget primarily due to the dissolution of SPP RE and the termination of the Regional Delegation Agreement. 7
65 Southwest Power Pool Regional Entity Statement of Activities From 1/1/2018 through 12/20/2018 Attachment I TRAINING, EDUCATION and OPERATOR CERTIFICATION Funding 2018 Actual 2018 Budget Variance from Budget Over(Under) Variance % ERO Funding Assessments 79,379 79,379-0% Penalty Sanctions - - Total ERO Funding $ 79,379 $ 79,379 $ - 0% Federal Grants Membership Fees Testing Services & Software Workshop Fees Interest Miscellaneous Total Funding (A) $ 79,379 $ 79,379 $ - 0% Expenses Personnel Expenses Salaries Payroll Taxes Employee Benefits Savings & Retirement Total Personnel Expenses $ - $ - $ - Meeting Expenses Meetings 4,240 60,000 (55,760) -93% Travel - - Conference Calls Total Meeting Expenses $ 4,240 $ 60,000 $ (55,760) -93% Operating Expenses Consultants & Contracts Rent & Improvements Office Costs Professional Services - - Miscellaneous Depreciation Total Operating Expenses $ - $ - $ - Total Direct Expenses $ 4,240 $ 60,000 $ (55,760) -93% SPP Inc. Indirect Expenses SPP RE Indirect Expenses 1,958 19,379 (17,421) -90% Total Indirect Expenses $ 1,958 $ 19,379 $ (17,421) -90% Other Non-Operating Expenses $ - $ - $ - Total Expenses (B) $ 6,198 $ 79,379 $ (73,181) -92% Change in Assets (A - B) $ 73,181 $ - $ 73,181 Fixed Assets Depreciation Computer & Software CapEx Furniture & Fixtures CapEx Equipment CapEx Leasehold Improvements Incr(Dec) in Fixed Assets $ - $ - $ - Allocation of Fixed Assets Total Inc(Dec) in Fixed Assets (C) $ - $ - $ - TOTAL BUDGET (B + C) $ 6,198 $ 79,379 $ (73,181) -92% Change in Working Capital (A-B-C) $ 73,181 $ - $ 73,181 FTE's
66 Southwest Power Pool Regional Entity Statement of Activities From 1/1/2018 through 12/20/2018 Attachment I Explanation of 2018 Variance Training, Education and Operator Certification Meeting Expenses Meeting expenses trailed budget primarily due to the termination of SPP RE s Regional Delegation Agreement on August 31, SPP RE held only one workshop at the corporate campus compared to the three budgeted workshops. SPP RE Indirect Expenses SPP RE indirect expenses trailed budget primarily due to the dissolution of SPP RE and the termination of the Regional Delegation Agreement. 9
67 Southwest Power Pool Regional Entity Statement of Activities From 1/1/2018 through 12/20/2018 Attachment I SITUATION AWARENESS and INFRASTRUCTURE SECURITY 2018 Actual 2018 Budget 2018 Variance from Budget Over(Under) Variance % Funding ERO Funding Assessments 45,144 45,144-0% Penalty Sanctions 3,395 1,304 2, % Total ERO Funding $ 48,539 $ 46,448 $ 2,091 5% Federal Grants Membership Fees Testing Services & Software Workshop Fees Interest Miscellaneous Total Funding (A) $ 48,539 $ 46,448 $ 4,182 9% Expenses Personnel Expenses Salaries 9,500 20,902 (11,402) -55% Payroll Taxes 727 1,599 (872) -55% Employee Benefits 608 1,107 (500) -45% Savings & Retirement (390) -47% Total Personnel Expenses $ 11,280 $ 24,444 $ (13,164) -54% Meeting Expenses Meetings Travel Conference Calls Total Meeting Expenses $ - $ - $ - Operating Expenses Consultants & Contracts - - Rent & Improvements Office Costs Professional Services Miscellaneous Depreciation Total Operating Expenses $ - $ - $ - Total Direct Expenses $ 11,280 $ 24,444 $ (13,164) -54% SPP Inc. Indirect Expenses 5,580 14,109 (8,529) -60% SPP RE Indirect Expenses 5,209 7,895 (2,686) -34% Total Indirect Expenses $ 10,789 $ 22,004 $ (11,215) -51% Other Non-Operating Expenses $ - $ - $ - Total Expenses (B) $ 22,069 $ 46,448 $ (24,379) -52% Change in Assets (A - B) $ 26,470 $ 1 $ 28,561 Fixed Assets Depreciation Computer & Software CapEx Furniture & Fixtures CapEx Equipment CapEx Leasehold Improvements Incr(Dec) in Fixed Assets $ - $ - $ - Allocation of Fixed Assets Total Inc(Dec) in Fixed Assets (C) $ - $ - $ - TOTAL BUDGET (B + C) $ 22,069 $ 46,448 $ (24,379) -52% Change in Working Capital (A-B-C) $ 26,470 $ 1 $ 28,561 FTE's (0.06) -50% 10
68 Southwest Power Pool Regional Entity Statement of Activities From 1/1/2018 through 12/20/2018 Attachment I Explanation of 2018 Variance Situational Awareness and Infrastructure Security (SAIS) Personnel Expenses Personnel expenses trailed budget primarily due to the dissolution of SPP RE and the termination of the Regional Delegation Agreement on August 31, SAIS related activities ceased on or before June 30, 2018 with the conclusion of CMEP activities and the transfer of SPP RE data to MRO, SERC, and NERC. 11
69 Southwest Power Pool Regional Entity Statement of Activities From 1/1/2018 through 12/20/2018 Attachment I GENERAL and ADMINISTRATIVE 2018 Actual 2018 Budget 2018 Variance from Variance Budget % Funding ERO Funding Assessments (775,930) (775,930) - 0% Penalty Sanctions Total ERO Funding $ (775,930) $ (775,930) $ - 0% Federal Grants Membership Fees Testing Services & Software Workshop Fees Interest Miscellaneous Total Funding (A) $ (775,930) $ (775,930) $ - 0% Expenses Salaries 635, ,082 (184,255) -22% Payroll Taxes 23,903 62,736 (38,833) -62% Employee Benefits 19,900 60,708 (40,808) -67% Savings & Retirement 19,869 32,803 (12,934) -39% Total Personnel Expenses $ 699,500 $ 976,330 $ (276,830) -28% Meeting Expenses Meetings 15,205 30,000 (14,795) -49% Travel 34,505 92,500 (57,995) -63% Conference Calls Total Meeting Expenses $ 49,710 $ 122,500 $ (72,790) -59% Operating Expenses Consultants & Contracts 26,100 (26,100) -100% Rent & Improvements - - Office Costs 1,522 10,000 (8,478) -85% Professional Services 179, ,100 (46,241) -20% Miscellaneous - - Depreciation - - Total Operating Expenses $ 181,381 $ 262,200 $ (80,819) -31% Total Direct Expenses $ 930,591 $ 1,361,030 $ (430,438) -32% SPP Inc. Indirect Expenses 289, ,912 (218,670) -43% SPP RE Indirect Expenses (1,219,833) (1,868,942) 649,108-35% Total Indirect Expenses $ (930,591) $ (1,361,030) $ 430,438-32% Other Non-Operating Expenses $ 161,339 $ - $ 161,339 Total Expenses (B) $ - $ - $ - Change in Assets (A - B) $ (775,930) $ (775,930) $ - 0% Fixed Assets Depreciation Computer & Software CapEx Furniture & Fixtures CapEx Equipment CapEx Leasehold Improvements Incr(Dec) in Fixed Assets $ - $ - $ - Allocation of Fixed Assets Total Inc(Dec) in Fixed Assets (C) $ - $ - $ - TOTAL BUDGET (B + C) $ - $ - $ - Change in Working Capital (A-B-C) $ (775,930) $ (775,930) $ - 0% FTE's (1.26) 0% 12
70 Southwest Power Pool Regional Entity Statement of Activities From 1/1/2018 through 12/20/2018 Attachment I Explanation of 2018 Variance General and Administrative Personnel Expenses Personnel expenses trailed budget primarily due to the dissolution of SPP RE. SPP RE retained four management staff during the period June 30, 2018 when CMEP activities concluded and August31, 2018 when the Regional Delegation Agreement terminated to complete wind-down activities. Meeting Expenses Meeting expenses trailed budget primarily due to the dissolution of SPP RE and the termination of the Regional Delegation Agreement. Travel Expenses Travel expenses trailed budget primarily due to the dissolution of SPP RE. Travel activities were curtailed prior to June 30, 2018 with the conclusion of CMEP activities. Consultants & Contracts Consultants & Contracts expenses trailed budget primarily due to the cessation of CMEP activities on June 30, All contracts were terminated with an effective date no later than June 30, 2018 with the conclusion of CMEP activities. Professional Services Professional Services expenses trailed budget primarily due to the cessation of CMEP activities on June 30, The SPP RE Trustees conducted a final meeting on August 31, 2018 which concluded their service. SPP, Inc. Indirect Expenses SPP, Inc. indirect expenses trailed budget primarily due to the dissolution of SPP RE and the termination of the Regional Delegation Agreement. SPP RE Indirect Expenses SPP RE indirect expenses trailed budget primarily due to the dissolution of SPP RE and the termination of the Regional Delegation Agreement. 13
71 Southwest Power Pool Regional Entity Statement of Activities From 1/1/2018 through 12/20/2018 Attachment I Other 2018 Explanations Member Forums Expenses incurred by SPP RE for forums are included in the direct expenses of the applicable program area. Legal and Regulatory, Information Technology, Human Resources, and Accounting and Finance Expenses incurred by SPP RE for legal, IT, HR, Accounting and Finance are accounted for within the SPP, Inc. Indirect Expenses. 14
72 Southwest Power Pool Regional Entity Statement of Activities From 1/1/2018 through 12/20/2018 Attachment 2 CALCULATION OF THE BUDGETED SPP INC. INDIRECT EXPENSE CHARGE Budget Expense Category 2 Overhead Costs Allocation ($000) Facilities $ 506 Information Technology 533 Human Resources/Benefits/Payroll 381 Corporate Services 1, Total Costs 2,626 Escalated by 3% $ 2,705 E Shared Staff Overhead Allocation 2016 Overhead Allocation Escalated by 3% 897 A Ending 2016 FTEs 4.1 B 2018 Budgeted FTEs 4.3 C 2018 Total Cost 941 D D = (A / B) x C Budgeted SPP Inc. Indirect Costs $ 3,645,677 D+E 1 Due to the timing of the budget process/schedule, the estimated indirect expense charge for 2018 is based on actual 2016 costs, escalated by 3%. Any variance between the estimated overhead expenses and the actual 2018 overhead expenses are included in the 2018 Business Plan and Budget true-up filing. 2 SPP RE cost allocation is based on an appropriate measure per expense category (square footage, number of devices, headcount, etc.) 15
73 January 17, 2019 Mr. Andy Sharp Controller, Accounting and Finance North American Electric Reliability Corporation 3353 Peachtree Road NE, Suite 600, North Tower Atlanta, GA RE: Texas Reliability Entity, Inc. Fourth Quarter 2018 Statement of Activities and Variance Report Dear Andy, Attached is the 2018 Fourth Quarter Statutory Statement of Activities (unaudited) and Variance Report for Texas RE. Year-to-date Texas RE is 10.4% under budget. Please contact me if you have questions or comments. Thank you. Judy Foppiano Judy A. Foppiano, CPA CFO & Director, Corporate Services Texas Reliability Entity, Inc. 805 Los Cimas Parkway, Suite 200 Austin, Texas TEXAS RELIABILITY ENTITY, INC. PAGE 1 OF LAS CIMAS PARKWAY, SUITE 200 AUSTIN, TEXAS
74 Budget to Actual Comparison as of December 31, 2018 Year-to-date variances greater than $10,000 and 10% explained below. FUNDING Penalty Sanctions: (Actual penalty income of $275,000 remitted to Texas RE as of June 30, 2017 has reduced 2018 assessments.) All penalty sanctions remitted from July 1, 2017 through June 30, 2018 have been included in the Texas RE 2019 Business Plan and Budget and applied to reduce 2019 assessments. Interest: $58,221 is greater than budget due to Texas RE s banking account being converted to the Business Banking U.S. End of Day Money Market Mutual Fund Sweep account. The change in account type allowed for higher interest and dividend collections than budgeted. Interest rates are higher than anticipated. EXPENSES Total Budget as of December 31, 2018 is $1,313,668 less than budget (-10.4%). Personnel Expenses: $840,715 less than budget (-8.4%). o Salaries are 5.7% less than budget due to four vacancies that were not filled until later in December. o Employee Benefits are 19.8% less than budget. The budget allowed for 12.0% increase in health benefits for Due to broker negotiations, the actual costs for 2018 benefits remained flat causing the budget variance. The education reimbursement and training budget was not fully used. o Savings and Retirement plans are under budget 14.9% because not all employees participate fully in the plans. o The vacancies have an impact on all personnel expenses causing a total 8.4% budget under-run. Meetings and Travel Expenses: $112,808 less than 2018 budget (-26.6%). o The actual costs for the workshops were under budget due to cost savings efforts. o Travel is less than budget due to employees taking advantage of remote access to the Spring NERC workshop and the fall NERC workshop being cancelled. CMEP Tool meeting has been moved to February Only 2 employees attended the fall NERC specialized training which did not fit the needs of others TEXAS RELIABILITY ENTITY, INC. PAGE 2 OF LAS CIMAS PARKWAY, SUITE 200 AUSTIN, TEXAS
75 budgeted to attend. The CCC meeting was not attended due to conflict. Several TOP audits have been local requiring limited travel related expenses. Enforcement certification review scheduled for Q4 has been moved to March All these factors cause the budget under-run of 26.6%. Total Operating Expenses: $365,652 less than 2018 budget (-15.2%). o Consultants and Contracts are less than budget for the year. Benefits survey, director compensation study, and CEO/Executive study were completed. The costs were much less because all surveys were conducted by one company allowing a better price. o Utilities, included in Rent and Improvements, are not as high as anticipated for Common Area Maintenance charges that are typically adjusted in the last quarter of each did not happen in o An IT external audit was planned for fourth quarter, but was deemed unnecessary for Penetration testing was done remotely and the cost was much less than budgeted. This is causing Professional Services to be under budget. Legal fees and consultants budgeted but not used add to the 28.5% variance. Fixed Assets: $5,506 greater than 2018 budget (4.0%) o Computer and Software Capital Costs are 52.0% greater than budget due to Nintex Forms and Veeam BU Software renewals being higher than expected. TEXAS RELIABILITY ENTITY, INC. PAGE 3 OF LAS CIMAS PARKWAY, SUITE 200 AUSTIN, TEXAS
 Revenue 2018 Actual 2018 Budget 2018 YTD Actual Variance from Budget % ERO Funding Assessments $ 11,271,986 $")
76 Texas Reliability Entity, Inc. Statement of Activities and Fixed Assets For period ended December 31, 2018 (Unaudited) Revenue 2018 Actual 2018 Budget 2018 YTD Actual Variance from Budget % ERO Funding Assessments $ 11,271,986 $ 11,271,986 $ - Penalty Sanctions 275, ,000 - Interest & Membership Dues 60,221 2,000 58,221 Total Revenue $ 11,607,207 $ 11,548,986 $ 58, % Expenses Personnel Expenses Salaries $ 6,742,189 $ 7,151,133 $ (408,944) -5.7% Payroll Taxes 452, ,794 (18,444) -3.9% Employee Benefits 1,059,590 1,321,119 (261,529) -19.8% Savings & Retirement 863,975 1,015,773 (151,798) -14.9% Total Personnel Expenses $ 9,118,104 $ 9,958,819 $ (840,715) -8.4% Meeting & Travel Expenses Meetings $ 13,872 $ 23,800 $ (9,928) -41.7% Tra vel 273, ,901 (99,341) -26.6% Conference Expenses 23,411 26,950 (3,539) -13.1% Total Meeting & Travel Expenses $ 310,843 $ 423,651 $ (112,808) -26.6% Operating Expenses Consultants & Contracts $ 259,762 $ 351,200 $ (91,438) -26.0% Rent & Improvements 570, ,648 (107,517) -15.9% Office Costs 640, ,441 (18,464) -2.8% Professional Services 397, ,200 (158,318) -28.5% Depreciation 178, ,500 10, % Total Operating Expenses 2,047,337 2,412,989 (365,652) -15.2% Total Expenses $ 11,476,284 $ 12,795,459 $ (1,319,174) -10.3% Change in Assets $ 130,923 $ (1,246,473) $ 1,377, % Fixed Assets Depreciation $ (178,585) $ (168,500) $ (10,085) 6.0% Computer & Software CapEx 45,591 30,000 15, % Incr(Dec) in Fixed Assets $ (132,994) $ (138,500) $ 5, % TOTAL BUDGET $ 11,343,290 $ 12,656,959 $ (1,313,668) -10.4% Change in Working Captial (Total Rev $ 263,917 $ (1,107,973) $ 1,371, % FTE's Beginning WC - 1/1/18 $ 2,422,616 $ 2,352,967 $ 69,649 Change to WC ,917 (1,107,973) 1,371,889 Working Capital 12/31/2018 $ 2,686,533 $ 1,244,995 $ 1,441,538 TEXAS RELIABILITY ENTITY, INC. PAGE 4 OF LAS CIMAS PARKWAY, SUITE 200 AUSTIN, TEXAS

77 January 22, 2019 Mr. Scott Jones Senior Vice President, Chief Financial and Administrative Officer, and Treasurer North American Electric Reliability Corporation 3353 Peachtree Road, N.E. Suite 600, North Tower Atlanta, GA RE: WECC Q Statutory Statement of Activities and Variance Report Dear Scott: Attached is WECC s fourth-quarter Statutory Statement of Activities (Unaudited) and Variance Report. WECC s 2018 year-to-date unaudited results are $229,000 under budget. If you have any questions or need more information, please contact me. Regards, Jillian Lessner Vice President and Chief Financial Officer jlessner@wecc.biz Enclosures cc: Melanie Frye, President and Chief Executive Officer WECC Finance and Audit Committee WESTERN ELECTRICITY COORDINATING COUNCIL 155 North 400 West, Suite 200 Salt Lake City, Utah
78 Statutory Statement of Activities (Unaudited) As of December 31, 2018 Variance Report Year-to-date variances greater than $10,000 and 10 percent are explained below. The explanations pertain to all statutory activities. REVENUE Workshop Fees: $137,000 under budget Workshop Fees are under budget due to lower-than-expected attendance at workshops and the cancellation of two Train-the-Trainer events. Interest: $251,000 over budget EXPENSES Interest is over budget due to higher-than-expected yields on WECC s short-term investments. Meetings: $225,000 under budget Meetings are under budget due to lower-than-expected attendance at stakeholder outreach meetings and the cancellation of two Train-the-Trainer events. Conference Calls: $30,000 under budget Conference Calls are under budget due to lower-than-expected usage. Depreciation: $47,000 over budget Depreciation is over budget due to higher-than-expected cost of an AgilePoint upgrade and unbudgeted security system improvements made in Other Non-Operating Expenses: $44,000 over budget Other Non-Operating Expenses are over budget due to the unbudgeted relocation of the Vancouver, WA office. FIXED ASSETS Equipment CapEx: $27,000 over budget Equipment CapEx is over budget due to the unbudgeted purchase of video conferencing equipment to increase effectiveness of web- and telephone-based meetings. WESTERN ELECTRICITY COORDINATING COUNCIL 155 North 400 West, Suite 200 Salt Lake City, Utah
 2018 YTD Budget 2018 YTD Variance Over(Under) Funding Assessments 25,282,000 25,282,000-0.0% Penalties 2,100,000 2,100,000-0.")
79 January 22, 2019 Statutory Statement of Activities and Variance Explanations 2 (In Whole Dollars) 2018 YTD Actual Western Electricity Coordinating Council Statutory Statement of Activities From 1/1/2018 to 12/31/2018 (Unaudited) 2018 YTD Budget 2018 YTD Variance Over(Under) Funding Assessments 25,282,000 25,282, % Penalties 2,100,000 2,100, % Federal Grants Testing Services & Software Workshop Fees 402, ,050 (137,094) -25.4% Interest 326,369 75, , % Miscellaneous 2,320-2, % Total Funding 28,113,646 27,997, , % Expenses Personnel Expenses Salaries 15,392,277 15,199, , % Payroll Taxes 1,065,914 1,089,355 (23,441) -2.2% Employee Benefits 2,258,073 2,293,855 (35,782) -1.6% Savings & Retirement 1,316,638 1,288,724 27, % Total Personnel Expenses 20,032,902 19,871, , % Meeting Expenses Meetings 530, ,785 (225,127) -29.8% Travel 1,387,629 1,401,209 (13,580) -1.0% Conference Calls 44,762 75,000 (30,238) -40.3% Total Meeting Expenses 1,963,049 2,231,994 (268,945) -12.0% Operating Expenses Consultants and Contracts 1,930,119 2,023,281 (93,162) -4.6% Rent & Improvements 985, ,461 41, % Office Costs 1,570,040 1,598,628 (28,588) -1.8% Professional Services 874, ,710 (28,819) -3.2% Miscellaneous Depreciation 264, ,816 46, % Total Operating Expenses 5,625,305 5,687,896 (62,591) -1.1% Direct Expenses 27,621,256 27,791,159 (169,903) -0.6% Indirect Expenses (515,247) (545,300) 30, % % Other Non-Operating Expenses 43,539-43, % Total Expenses 27,149,549 27,245,859 (96,311) -0.4% Net Change in Assets 964, , , % Fixed Assets Depreciation (264,354) (217,816) (46,538) 21.4% Computer & Software CapEx 53,135 50,000 3, % Furniture & Fixtures CapEx Equipment CapEx 39,002 12,000 27, % Leasehold Improvements Allocation of Fixed Assets 7,658 7, % Incr(Dec) in Fixed Assets (164,559) (148,515) (16,044) 10.8% Total Expenditures 26,984,989 27,097,344 (112,355) -0.4% Change in Working Capital (Total Funding less Total Budget) 1,128, , , % FTEs (10.63) Headcount (7.00) Beginning WC - 1/1/18 5,418,773 4,894, ,218 Change to WC ,128, , ,951 Working Capital at 12/31/18 6,547,429 5,794, ,168 W E S T E R N E L E C T R I C I T Y C O O R D I N A T I N G C O U N C I L
Agenda Finance and Audit Committee November 6, :00-9:45 a.m. Eastern
 Agenda Finance and Audit Committee November 6, 2018 9:00-9:45 a.m. Eastern Grand Hyatt Atlanta in Buckhead 3300 Peachtree Rd NE Atlanta, GA 30305 Conference Room: Grand Ballroom Lower Lobby Level Call
Agenda Finance and Audit Committee May 9, :30-9:30 a.m. Eastern
 Agenda Finance and Audit Committee May 9, 2018 8:30-9:30 a.m. Eastern The Ritz-Carlton, Pentagon City 1250 S. Hayes Street Arlington, VA 22202 Conference Room: Ritz Carlton Grand Ballroom (2 nd Floor)
Agenda Finance and Audit Committee February 7, :15-11:00 a.m. Eastern
 Agenda Finance and Audit Committee February 7, 2018 10:15-11:00 a.m. Eastern Hilton Fort Lauderdale Marina 1881 SE 17 th Street Fort Lauderdale, FL 33316 Conference Room: Grand Ballroom (1 st Floor) Call
Agenda Conference Call Finance and Audit Committee
 Agenda Conference Call Finance and Audit Committee July 19, 2010 2:00-3:00 p.m. EDT Dial-In: 800-672-4749 (No Code Needed) Introductions and Chairman s Remarks NERC Antitrust Compliance Guidelines *1.
Total ERO Enterprise 2019 Budgets and Assessments Analysis
 Total ERO Enterprise 2019 Budgets and Assessments Analysis The following includes an overview of the development of the proposed NERC, Regional Entity, and WIRAB 2019 Business Plan and Budgets (BP&Bs)
Agenda Finance and Audit Committee Open Conference Call and Webinar May 20, :00-3:30 p.m. Eastern
 Agenda Finance and Audit Committee Open Conference Call and Webinar May 20, 2013 2:00-3:30 p.m. Eastern DIAL-IN: 800-272-6255 Webex Registration Link: https://cc.readytalk.com/r/45l4p1np7adz Broadcast
SCHIFF HARDIN LLP A Limited Liability Partnership
 SCHIFF HARDIN LLP A Limited Liability Partnership Owen E. MacBride (312) 258-5680 Email: omacbride@schiffhardin.com 233 SOUTH WACKER DRIVE SUITE 6600 CHICAGO, ILLINOIS 60606 Tel.: 312.258.5500 Fax: 312.258.5700
Agenda Finance and Audit Committee Conference Call
 Agenda Finance and Audit Committee Conference Call November 2, 2009 10 a.m. EST Dial-In: 800-940-0570 Introductions and Chairman s Remarks Antitrust Compliance Guidelines *1. Minutes Review and Approve
September 8, 2017 VIA ELECTRONIC FILING
 !! September 8, 2017 VIA ELECTRONIC FILING Kirsten Walli, Board Secretary Ontario Energy Board P.O Box 2319 2300 Yonge Street Toronto, Ontario, Canada M4P 1E4 Re: North American Electric Reliability Corporation
Analysis of 2018 Total ERO Enterprise Budget
 Agenda Item 3.b.iii Finance and Audit Committee Meeting August 9, 2017 Analysis of Total ERO Enterprise Total ERO Enterprise and Assessments The proposed budget for the Total ERO Enterprise 1, inclusive
SCHIFF HARDIN LLP. May 30, 2014 VIA ELECTRONIC FILING
 SCHIFF HARDIN LLP A Limited Liability Partnership Owen E. MacBride (312) 258-5680 Email: omacbride@schiffhardin.com 233 SOUTH WACKER DRIVE SUITE 6600 CHICAGO, ILLINOIS 60606 Tel.: 312.258.5500 Fax: 312.258.5700
NERC Summary of Unaudited Results Third Quarter Andy Sharp, Controller Finance and Audit Committee Meeting November 6, 2018
 NERC Summary of Unaudited Results Third Quarter 2018 Andy Sharp, Controller Finance and Audit Committee Meeting November 6, 2018 2018 Third Quarter Results Total funding is on budget Interest income is
SCHIFF HARDIN LLP A Limited Liability Partnership
 SCHIFF HARDIN LLP A Limited Liability Partnership Owen E. MacBride (312) 258-5680 Email: omacbride@schiffhardin.com 233 SOUTH WACKER DRIVE SUITE 6600 CHICAGO, ILLINOIS 60606 Tel.: 312.258.5500 Fax: 312.258.5700
November 4, 2013 VIA ELECTRONIC FILING
 November 4, 2013 VIA ELECTRONIC FILING Doreen Friis Regulatory Affairs Officer/Clerk Nova Scotia Utility and Review Board 3 rd Floor 1601 Lower Water Street P.O. Box 1692, Unit âmâ Halifax, Nova Scotia
BEFORE THE CROWN INVESTMENT CORPORATION OF THE PROVINCE OF SASKATCHEWAN
 BEFORE THE CROWN INVESTMENT CORPORATION OF THE PROVINCE OF SASKATCHEWAN NORTH AMERICAN ELECTRIC ) RELIABILITY CORPORATION ) NOTICE OF FILING OF THE NORTH AMERICAN ELECTRIC RELIABILITY CORPORATION OF ITS
Agenda Conference Call Finance and Audit Committee
 Agenda Conference Call Finance and Audit Committee January 24, 2011 8:309:00 a.m. ET DialIn: 8007058289 (No Code Needed) Introductions and Chair s Remarks NERC Antitrust Compliance Guidelines 1. Texas
NERC Unaudited Summary of Results March 31, Finance and Audit Committee Meeting May 4, 2016
 NERC Unaudited Summary of Results March 31, 2016 Finance and Audit Committee Meeting May 4, 2016 First Quarter 2016 Significant Variances NERC was $186k (1.1%) under budget, including CRISP NERC was $407k
September 15, 2016 VIA ELECTRONIC FILING
 !! September 15, 2016 VIA ELECTRONIC FILING Rachelle Verret Morphy Saskatchewan Electric Reliability Authority 2025 Victoria Avenue Regina, Saskatchewan, Canada S4P 0S1 Re: North American Electric Reliability
UNITED STATES OF AMERICA BEFORE THE FEDERAL ENERGY REGULATORY COMMISSION. North American Electric Reliability ) Corporation ) Docket No.
 Corporation ) Docket No.") UNITED STATES OF AMERICA BEFORE THE FEDERAL ENERGY REGULATORY COMMISSION North American Electric Reliability ) Corporation ) Docket No. FA11-21-000 COMPLIANCE FILING OF THE NORTH AMERICAN ELECTRIC RELIABILITY
UNITED STATES OF AMERICA BEFORE THE FEDERAL ENERGY REGULATORY COMMISSION North American Electric Reliability ) Corporation ) Docket No. FA11-21-000 COMPLIANCE FILING OF THE NORTH AMERICAN ELECTRIC RELIABILITY
2017 Budget Presentation to MRO Board of Directors
 MIDWEST RELIABILITY ORGANIZATION 2017 Presentation to MRO Board of Directors June 30, 2016 Silvia Parada Mitchell, Finance and Audit Committee Chair Dan Skaar, President and CEO Sue Clarke, VP-Finance
Agenda Corporate Governance and Human Resources Committee November 2, :00-3:00 p.m. Eastern Conference Call
 Agenda Corporate Governance and Human Resources Committee November 2, 2017 2:00-3:00 p.m. Eastern Conference Call Dial-in: 1-800-289-0438 Conference ID: 5180226 Call to Order and Chair s Remarks NERC Antitrust
BEFORE THE ONTARIO ENERGY BOARD OF THE PROVINCE OF ONTARIO
 BEFORE THE ONTARIO ENERGY BOARD OF THE PROVINCE OF ONTARIO NORTH AMERICAN ELECTRIC ) RELIABILITY CORPORATION ) NOTICE OF FILING OF THE NORTH AMERICAN ELECTRIC RELIABILITY CORPORATION OF ITS 2012 BUSINESS
Via . May 1, 2017
 Via Email May 1, 2017 North American Electric Reliability Corporation 3353 Peachtree Road NE Suite 600, North Tower Atlanta, GA 30326 Attention: Mr. Scott Jones Subject: NPCC True Up Actual vs. Variance
Via . April 28, 2015
 Via Email April 28, 2015 North American Electric Reliability Corporation 3343 Peachtree Road, NE Fourth Floor East Tower Suite 400 Atlanta, Georgia 30326 Attention: Mr. Michael Walker Subject: NPCC True
SCHIFF HARDIN LLP A Limited Liability Partnership
 SCHIFF HARDIN LLP A Limited Liability Partnership Owen E. MacBride (312) 2585680 Email: omacbride@schiffhardin.com 233 SOUTH WACKER DRIVE SUITE 6600 CHICAGO, ILLINOIS 60606 Tel.: 312.258.5500 Fax: 312.258.5700
2017 Business Plan and Budget. Texas Reliability Entity, Inc. Approved by Texas RE Board of Directors. Date:, 2016
 2017 Business Plan and Texas Reliability Entity, Inc. Approved by Texas RE Board of Directors Date:, 2016 Approved by the Texas RE Board of Directors, 2016 1 Table of Contents Table of Contents... 2 Introduction...
Agenda Standards Oversight and Technology Committee August 13, :15 a.m. 12:15 p.m. Pacific
 Agenda Standards Oversight and Technology Committee August 13, 2014 11:15 a.m. 12:15 p.m. Pacific The Westin Bayshore 1601 Bayshore Drive Vancouver, BC V6G 2V4 Canada +1 604-682-3377 Call to Order and
NERC FAC M eeting July 20, 2017
 M ID W EST RELIABILITY ORGAN IZ ATION NERC FAC M eeting July 20, 2017 2018 Business Plan and Budget Approved by the M RO Board of Directors June 2 2, 2017 Sue Clarke, VP of Finance and Administration Improving
2015 Business Plan and Budget Draft 1.0. Approved by: MRO Board of Directors. Date: May 16, 2014
 Midwest Reliability Organization 2015 Business Plan and Budget Draft 1.0 Approved by: MRO Board of Directors Date: May 16, 2014 380 St. Peter Street, Suite 800 Saint Paul, MN 55102 Phone (651) 8551760
M RO NERC FAC 2016 Budget Review
 M ID W EST RELIABILITY ORGAN IZ ATION M RO NERC FAC 2016 Review July 22, 2015 Sue Clarke, VP-Finance and Administration Improving RELIABILITY and mitigating RISKS to the Bulk Power System 2016 Overview
Amended Agenda Finance and Audit Committee Conference Call
 Amended Agenda Finance and Audit Committee Conference Call June 5, 2009 2 p.m. EDT Dial-In: 866-833-6395 Code: 12556849 Open Session Introductions and Chairman s Remarks Antitrust Compliance Guidelines
2019 Business Plan and Budget. Texas Reliability Entity, Inc. Approved by Texas RE Board of Directors
 2019 Business Plan and Budget Texas Reliability Entity, Inc. Approved by Texas RE Board of Directors Date: May 23, 2018 1 Table of Contents Table of Contents... 2 Introduction... 3 Section A Statutory
Cyber Security Risk Information Sharing Program (CRISP) Overview, Budget Projection and Proposed Funding Allocation
 Overview, Budget Projection and Proposed Funding Allocation") Cyber Security Risk Information Sharing Program (CRISP) Overview, Budget Projection and Proposed Funding Allocation Introduction and Executive Summary This document provides additional background on CRISP,
Cyber Security Risk Information Sharing Program (CRISP) Overview, Budget Projection and Proposed Funding Allocation Introduction and Executive Summary This document provides additional background on CRISP,
123 FERC 61,282 UNITED STATES OF AMERICA FEDERAL ENERGY REGULATORY COMMISSION. North American Electric Reliability Corporation
 123 FERC 61,282 UNITED STATES OF AMERICA FEDERAL ENERGY REGULATORY COMMISSION Before Commissioners: Joseph T. Kelliher, Chairman; Suedeen G. Kelly, Marc Spitzer, Philip D. Moeller, and Jon Wellinghoff.
2016 Business Plan and Budget
 2016 Business Plan and Budget Draft 1 May 19, 2015 I Table of Contents About NERC... iv Overview... iv Membership and Governance... iv Scope of Oversight... v Statutory and Regulatory Background... vi
2016 Business Plan and Budget. Southwest Power Pool Regional Entity. Preliminary Budget
 2016 Business Plan and Budget Southwest Power Pool Regional Entity Preliminary Budget April 27, 2015 Table of Contents Introduction... 3 Section A 2015 Business Plan... 10 Reliability Standards Program...11
ieso Re: NERC 2016 Business Plan and Budget, Draft #1 June 30, 2015
 June 30, 2015 Mr. Michael Walker Senior Vice President and Chief Financial and Administrative Officer North American Electric Reliability Corporation 3353 Peachtree Road NE Suite 600, North Tower Atlanta,
2017 Business Plan and Budget
 2017 Business Plan and Budget Draft 1 May 19, 2016 I Table of Contents About NERC... 1 Overview... 1 Membership and Governance... 1 Scope of Oversight... 2 Statutory and Regulatory Background... 3 Funding...
2018 Business Plan and Budget Southwest Power Pool Regional Entity. Approved by SPP Regional Entity Trustees
 2018 Business Plan and Budget Southwest Power Pool Regional Entity Approved by SPP Regional Entity Trustees June 30, 2017 Table of Contents Introduction...3 Section A 2018 Business Plan... 10 Reliability
DRAFT Business Plan and Budget. Approved by: MRO Board of Directors. Date May 4June 28, 2012
 MIDWEST RELIABILITY ORGANIZATION DRAFT 2013 Business Plan and Budget Approved by: MRO Board of Directors Date May 4June 28, 2012 380 St. Peter Street, Suite 800 Saint Paul, MN 55102 Phone (651) 8551760
NERC 2013 Business Plan and Budget Overview. May 3, 2012
 NERC 2013 Business Plan and Budget Overview May 3, 2012 NERC 2013 Business Plan and Budget Budget Planning Background Goals and Priorities Challenges Business Planning Framework Key Deliverables and Resource
2014 Business Plan and Budget. Texas Reliability Entity, Inc. Approved by Texas RE Board of Directors
 2014 Business Plan and Budget Texas Reliability Entity, Inc. Approved by Texas RE Board of Directors Date: June 14, 2013 Table of Contents Introduction... 3 Section A 2014 Business Plan...12 Reliability
Key Compliance Trends Item 2.A
 Key Compliance Trends Item 2.A Key Compliance Trends The number of violations received each month exceeds the total monthly violations approved by the BOTCC or dismissed, but the BOTCC approved violations
April 6, 2018 VIA OVERNIGHT MAIL. Sheri Young, Secretary of the Board National Energy Board th Avenue SW Calgary, Alberta T2R 0A8
 !! April 6, 2018 VIA OVERNIGHT MAIL Sheri Young, Secretary of the Board National Energy Board 517 10 th Avenue SW Calgary, Alberta T2R 0A8 Re: North American Electric Reliability Corporation Dear Ms. Young:
Key Compliance Trends
 Key Compliance Trends Key Compliance Trends Trend # 1: The number of violations received each month exceeds the total monthly violations processed Monthly BOTCC approvals are increasing The use of the
Compliance Monitoring and Enforcement Program Report
 Compliance Monitoring and Enforcement Program Report Q3 2016 November 1, 2016 NERC Report Title Report Date I Table of Contents Preface... iii Introduction...1 Highlights from Q3 2016...1 Enforcement...1
June 27, Ms. Kimberly D. Bose Secretary Federal Energy Regulatory Commission 888 First Street, N.E. Washington, D.C
 June 27, 2013 Ms. Kimberly D. Bose Secretary Federal Energy Regulatory Commission 888 First Street, N.E. Washington, D.C. 20426 Re: NERC Spreadsheet Notice of Penalty FERC Docket No. NP13- -000 Dear Ms.
2016 Business Plan and Budget. Texas Reliability Entity, Inc. Approved by Texas RE Board of Directors. Date: May 21, 2015
 2016 Business Plan and Texas Reliability Entity, Inc. Approved by Texas RE Board of Directors Date: May 21, 2015 1 Table of Contents Table of Contents... 2 Introduction... 3 Section A 2016 Business Plan
December 31, Ms. Kimberly D. Bose Secretary Federal Energy Regulatory Commission 888 First Street, N.E. Washington, D.C.
 December 31, 2012 Ms. Kimberly D. Bose Secretary Federal Energy Regulatory Commission 888 First Street, N.E. Washington, D.C. 20426 Re: NERC Spreadsheet Notice of Penalty FERC Docket No. NP13- -000 Dear
SERC Reliability Corporation Business Plan and Budget
 SERC Reliability Corporation 3701 Arco Corporate Drive, Suite 300 Charlotte, NC 28273 704.357.7372 Fax 704.357.7914 www.serc1.org SERC Reliability Corporation 2018 Business Plan and Budget FINAL June 28,
2018 ERO Enterprise Metrics
 2018 ERO Enterprise Metrics Metrics In support of the ERO Enterprise s goals, there are six reliability metrics to measure achievement of a highly reliable and secure bulk power system (BPS). There is
August 31, Ms. Kimberly D. Bose Secretary Federal Energy Regulatory Commission 888 First Street, N.E. Washington, D.C
 August 31, 2011 Ms. Kimberly D. Bose Secretary Federal Energy Regulatory Commission 888 First Street, N.E. Washington, D.C. 20426 Re: NERC Administrative Citation Notice of Penalty FERC Docket No. NP11-
Approved Business Plan and Budget. Florida Reliability Coordinating Council, Inc.
 Approved 2016 Business Plan and Budget Florida Reliability Coordinating Council, Inc. Approved: 6/25/2015 Table of Contents Introduction... 3 Organizational Overview... 3 Membership and Governance... 4
Minutes Board of Trustees
 Minutes Board of Trustees Action Without a Meeting September 8, 2008 On September 8, 2008, a majority of the members of the Board of Trustees of the North American Electric Reliability Corporation consented
2013 Business Plan and Budget
 MIDWEST RELIABILITY ORGANIZATION 2013 Business Plan and Budget Approved by: MRO Board of Directors Date June 28, 2012 380 St. Peter Street, Suite 800 Saint Paul, MN 55102 Phone (651) 8551760 Fax (651)
133 FERC 61,062 UNITED STATES OF AMERICA FEDERAL ENERGY REGULATORY COMMISSION. North American Electric Reliability Corporation
 133 FERC 61,062 UNITED STATES OF AMERICA FEDERAL ENERGY REGULATORY COMMISSION Before Commissioners: Jon Wellinghoff, Chairman; Marc Spitzer, Philip D. Moeller, John R. Norris, and Cheryl A. LaFleur. North
165 FERC 61,023 UNITED STATES OF AMERICA FEDERAL ENERGY REGULATORY COMMISSION. North American Electric Reliability Corporation
 165 FERC 61,023 UNITED STATES OF AMERICA FEDERAL ENERGY REGULATORY COMMISSION Before Commissioners: Cheryl A. LaFleur, Neil Chatterjee, and Richard Glick. North American Electric Reliability Corporation
SCHIFF HARDIN LLP A Limited Liability Partnership
 SCHIFF HARDIN LLP A Limited Liability Partnership Owen E. MacBride (312) 258-5680 Email: omacbride@schiffhardin.com 233 SOUTH WACKER DRIVE SUITE 6600 CHICAGO, ILLINOIS 60606 Tel.: 312.258.5500 Fax: 312.258.5700
FRCC 2016 Business Plan & Budget (As Submitted to NERC and Posted for Comments on 5/1/2015) (Not Approved by the FRCC Board of Directors)
 (Not Approved by the FRCC Board of Directors)") FRCC 2016 Business Plan & (As Submitted to NERC and Posted for Comments on 5/1/2015) (Not Approved by the FRCC Board of Directors) Presentation to NERC FAC May 27, 2015 Reva R. Maskewitz - Controller 2016
FRCC 2016 Business Plan & (As Submitted to NERC and Posted for Comments on 5/1/2015) (Not Approved by the FRCC Board of Directors) Presentation to NERC FAC May 27, 2015 Reva R. Maskewitz - Controller 2016
Approved Business Plan and Budget. Florida Reliability Coordinating Council, Inc.
 Approved 2015 Business Plan and Budget Florida Reliability Coordinating Council, Inc. Approved: 6/25/2014 Table of Contents Introduction... 3 Organizational Overview... 3 Membership and Governance... 4
SERC Reliability Corporation Business Plan and Budget
 SERC Reliability Corporation 3701 Arco Corporate Drive, Suite 300 Charlotte, NC 28273 704.357.7372 Fax 704.357.7914 www.serc1.org SERC Reliability Corporation 2018 Business Plan and Budget DRAFT April
First Draft 2015 Business Plan and Budget May 16, 2014
 First Draft 2015 Business Plan and Budget May 16, 2014 1 Table of Contents Table of Contents Table of Contents... 2 About NERC... 4 Overview... 4 Membership and Governance... 5 Scope of Oversight... 5
Draft 1. Jen Kelly Director of Finance & HR
 2014 Business Plan and Budget Draft 1 Jen Kelly Director of Finance & HR 1 2014 Budget Overview 2 Increase in penalty sanctions ($915,500 vs. $51,000) Staffing Addition of.88 FTEs compared to 2013 budget
BES Definition Implementation Guidance
 BES Definition Implementation Guidance August 25, 2014 3353 Peachtree Road NE Suite 600, North Tower Atlanta, GA 30326 NERC BES Definition Implementation Guidance June 23, 2014 404-446-2560 www.nerc.com
BRIGER COMMUNITY DEVELOPMENT DISTRICT JANUARY 28, 2019 AGENDA PACKAGE
 BRIGER COMMUNITY DEVELOPMENT DISTRICT JANUARY 28, 2019 AGENDA PACKAGE Briger Inframark, Infrastructure Management Services 210 N. University Drive, #702, Coral Springs, FL 33071 Phone: 954-603-0033; Fax:
161 FERC 61,131 UNITED STATES OF AMERICA FEDERAL ENERGY REGULATORY COMMISSION
 161 FERC 61,131 UNITED STATES OF AMERICA FEDERAL ENERGY REGULATORY COMMISSION Before Commissioners: Neil Chatterjee, Chairman; Cheryl A. LaFleur, and Robert F. Powelson. North American Electric Reliability
Compliance Trending. Page 1 of 14
 Compliance Trending Page 1 of 14 Overall Trends The number of new CIP violations received each month continues to rise dramatically over the number of new non-cip violations In September 21, 182 CIP were
SERC Reliability Corporation Business Plan and Budget
 SERC Reliability Corporation 3701 Arco Corporate Drive, Suite 300 Charlotte, NC 28273 704.357.7372 Fax 704.357.7914 www.serc1.org SERC Reliability Corporation 2016 Business Plan and Budget DRAFT 1.0 April,
Compliance Trending May 2010
 Compliance Trending May 21 Overall Trends New Violations in May were received at a rate lower than the rolling 6 month average 6 Month Violation Receipt Average (Nov 29 through May 21) = 136 violations/month
2018 Business Plan and Budget. Texas Reliability Entity, Inc. Approved by Texas RE Board of Directors. Date: May 24, 2017
 2018 Business Plan and Budget Texas Reliability Entity, Inc. Approved by Texas RE Board of Directors Date: May 24, 2017 1 Table of Contents Table of Contents... 2 Introduction... 3 Section A Statutory
UNITED STATES OF AMERICA BEFORE THE FEDERAL ENERGY REGULATORY COMMISSION
 UNITED STATES OF AMERICA BEFORE THE FEDERAL ENERGY REGULATORY COMMISSION NORTH AMERICAN ELECTRIC ) Docket No. RR10-1- RELIABILITY CORPORATION ) Docket No. RR13-3- ANNUAL REPORT OF THE NORTH AMERICAN ELECTRIC
SCENARIO Proposed Business Plan and Budget 2020 Transitional Reliability Coordinator. Peak Reliability
 SCENARIO 1 2019 Proposed Business Plan and Budget 2020 Transitional Reliability Coordinator Peak Reliability Draft: Date: Version 1 June 1, 2018 Table of Contents Introduction... 3 Scenario 1 Status Quo
Shared Business Plan and Budget Assumptions NERC and the Regional Entities Planning Period
 NERC and the Regional Entities 2013-2015 Planning Period Commencing in December 2011, NERC and the eight Regional Entities have been collaborating in the development of a common set of business planning
2019 & 2020 Proposed Business Plan and Budget Wind Down. Peak Reliability
 2019 & 2020 Proposed Business Plan and Budget Wind Down Peak Reliability Draft: Date: Board Approval Draft September 4, 2018 Table of Contents Introduction... 3 2019 & 2020 Business Plan and Budget Wind
Lexington Community Development District Severn Trent Services, Management Services Division 210 North University Drive, Suite 702 Coral Springs, Flor
 Agenda Page #1 Lexington Community Development District March 14, 2017 Agenda Package Lexington Community Development District Severn Trent Services, Management Services Division 210 North University Drive,
Analysis of NERC Compliance Registry & Registration Appeals
 Electric Reliability Organization (ERO) Compliance Analysis Report NERC Compliance Registry and Registration Appeals May 2011 Table of Contents ERO Compliance Analysis Report... 2 Background Information...
2019 Business Plan and Budget. Western Electricity Coordinating Council. Approved by: WECC Board of Directors Date: June XX, 2018
 2019 Business Plan and Budget Western Electricity Coordinating Council Approved by: WECC Board of Directors Date: June XX, 2018 155 North 400 West, Suite 200 Salt Lake City, Utah 84103-1114 Table of Contents
SCENARIO & 2020 Proposed Business Plan and Budget Wind Down. Peak Reliability
 SCENARIO 2 2019 & 2020 Proposed Business Plan and Budget Wind Down Peak Reliability Draft: Date: Version 1 June 1, 2018 Table of Contents Introduction... 3 Scenario 2 Wind Down... 4 2019 & 2020 Business
Lexington Community Development District Inframark, Infrastructure Management Services 210 North University Drive, Suite 702 Coral Springs, Florida 33
 Page Number 1 Lexington Community Development District November 13, 2018 Agenda Package Lexington Community Development District Inframark, Infrastructure Management Services 210 North University Drive,
Long-Term Reliability Assessment
 Long-Term Reliability Assessment Key Findings and Long-Term Issues John Moura, Director of Reliability Assessment Topics Covered Today Background on NERC s Long-Term Reliability Assessment Emerging and
APPENDIX 4D TO THE RULES OF PROCEDURE
 APPENDIX 4D TO THE RULES OF PROCEDURE PROCEDURE FOR REQUESTING AND RECEIVING TECHNICAL FEASIBILITY EXCEPTIONS TO NERC CRITICAL INFRASTRUCTURE PROTECTION STANDARDS Effective: April 1, 2016 TABLE OF CONTENTS
2018 Business Plan and Budget
 2018 Business Plan and Western Electricity Coordinating Council Approved by: WECC Board of Directors Date: June XX, 2017 155 North 400 West, Suite 200 Salt Lake City, Utah 84103-1114 Table of Contents
FINAL Business Plan and Budget. Florida Reliability Coordinating Council, Inc. Approved by: FRCC Board of Directors
 FINAL 2013 Business Plan and Budget Florida Reliability Coordinating Council, Inc. Approved by: FRCC Board of Directors DATE: June 28, 2012 Table of Contents Introduction... 3 Organizational Overview...
APPENDIX 4D TO THE RULES OF PROCEDURE
 APPENDIX 4D TO THE RULES OF PROCEDURE PROCEDURE FOR REQUESTING AND RECEIVING TECHNICAL FEASIBILITY EXCEPTIONS TO NERC CRITICAL INFRASTRUCTURE PROTECTION STANDARDS Effective: July 1, 2016 TABLE OF CONTENTS
Northeast Power Coordinating Council, Inc. (NPCC) 2017 Business Plan and Budget
 2017 Business Plan and Budget") Northeast Power Coordinating Council, Inc. (NPCC) 2017 Business Plan and Budget Draft 1 Submitted to NERC April 28, 2016 Table of Contents Introduction... 3 Personnel Analysis... 12 Section A 2017 Regional
Northeast Power Coordinating Council, Inc. (NPCC) 2017 Business Plan and Budget Draft 1 Submitted to NERC April 28, 2016 Table of Contents Introduction... 3 Personnel Analysis... 12 Section A 2017 Regional
Relationship-Based Member-Driven Independence Through Diversity Evolutionary vs. Revolutionary Reliability & Economics Inseparable
 Southwest Power Pool, Inc. CORPORATE GOVERNANCE COMMITTEE MEETING December 7, 2011 Teleconference AGENDA 1:00 p.m. 3:00 p.m. CST 1. Call to Order and Administrative Items... Nick Brown 2. Vacancies...
SCHIFF HARDIN LLP. December 17, 2010 VIA ELECTRONIC FILING
 SCHIFF HARDIN LLP Owen E. MacBride (312) 2585680 Email: omacbride@schiffhardin.com 233 SOUTH WACKER DRIVE SUITE 6600 CHICAGO, ILLINOIS 60606 Tel.: 312.258.5500 Fax: 312.258.5700 www.schiffhardin.com December
2017 Business Plan and Budget
 2017 Business Plan and Western Electricity Coordinating Council Approved by: WECC Board of Directors Date: June XX, 2016 155 North 400 West, Suite 200 Salt Lake City, Utah 84103 1114 Table of Contents
2015 BUSINESS PLAN AND BUDGET FINAL VERSION
 2015 BUSINESS PLAN AND BUDGET FINAL VERSION Approved by ReliabilityFirst Board of Directors JUNE 25, 2014 Table of Contents About ReliabilityFirst... 4 Organizational Overview... 4 Membership and Governance...
2017 Metrics with Historical Data
 2017 Metrics with Historical Data Metrics In support of the ERO Enterprise s goals, there are six reliability metrics to measure progress on reliability improvement. There is also one metric to measure
Spot Check Procedure
 August 16, 2017 Version 4.0 MON-104 3000 Bayport Drive, Suite 600 Tampa, Florida 33607-8407 (813) 289-5644 - Phone (813) 289-5646 Fax www.frcc.com Page 2 of 10 TITLE NAME DATE Procedure Writer Manager
Compliance Monitoring and Enforcement Program Quarterly Report
 Compliance Monitoring and Enforcement Program Quarterly Report Q2 2018 August 15, 2018 NERC Report Title Report Date I Table of Contents Preface... iii Executive Summary... iv Chapter 1 : CMEP Activities...
June 29, 2016 VIA OVERNIGHT MAIL
 !! June 29, 2016 VIA OVERNIGHT MAIL Doreen Friis Regulatory Affairs Officer/Clerk Nova Scotia Utility and Review Board 3 rd Floor 1601 Lower Water Street P.O. Box 1692, Unit M Halifax, Nova Scotia B3J
Proposed Criteria for Determining Scope of Section 215 Activities Request for Comments on Revised Draft
 Proposed Criteria for Determining Scope of Section 215 Activities Request for Comments on Revised Draft January 10, 2013 Comments Due: January 23, 2013 The North American Electric Reliability Corporation
AGENDA AUDIT COMMITTEE MEETING April 11, :10-4:00pm
 AGENDA AUDIT COMMITTEE MEETING April 11, 2019 2:30-4:00pm Helms & Company, Inc. 1 Pillsbury Street, 3 rd Floor, Concord, NH Call In #: 1 646 876 9923 Meeting ID: 770 631 278 Committee Members: David Sky,
Finance Committee Meeting
 Children s Services Council Finance Committee Meeting Thursday, January 25, 2018, 3:30 p.m. AGENDA / MINUTES Welcome and introductions Finance Committee Members: Tom Lynch, CSC Finance Committee Chair
2012 BUDGET REVIEW Sue Clarke, VP of Finance and Administration
 2012 BUDGET REVIEW Sue Clarke, VP of Finance and Administration June 2, 2011 Promoting RELIABILITY and Mitigating RISKS to the Bulk Power System Overview MRO staff imposed a budget target with a flat headcount
Northeast Power Coordinating Council, Inc. (NPCC) 2014 Business Plan and Budget
 2014 Business Plan and Budget") Northeast Power Coordinating Council, Inc. (NPCC) 2014 Business Plan and Budget Approved by NPCC Board of Directors June 25, 2013 Table of Contents Introduction... 3 Personnel Analysis... 11 Section A
Northeast Power Coordinating Council, Inc. (NPCC) 2014 Business Plan and Budget Approved by NPCC Board of Directors June 25, 2013 Table of Contents Introduction... 3 Personnel Analysis... 11 Section A
UNITED STATES OF AMERICA Before the FEDERAL ENERGY REGULATORY COMMISSION. NORTH AMERICAN ELECTRIC ) RELIABILITY CORPORATION ) Docket No.
 RELIABILITY CORPORATION ) Docket No.") UNITED STATES OF AMERICA Before the FEDERAL ENERGY REGULATORY COMMISSION NORTH AMERICAN ELECTRIC ) RELIABILITY CORPORATION ) Docket No. RR07-16- ) REQUEST OF THE NORTH AMERICAN ELECTRIC RELIABILITY CORPORATION
UNITED STATES OF AMERICA Before the FEDERAL ENERGY REGULATORY COMMISSION NORTH AMERICAN ELECTRIC ) RELIABILITY CORPORATION ) Docket No. RR07-16- ) REQUEST OF THE NORTH AMERICAN ELECTRIC RELIABILITY CORPORATION
MOD Demand and Energy Data. Darrel Richardson, NERC Senior Standards Developer Jeff Rooker, SPP RE Lead Compliance Engineer May 12, 2016
 MOD-031-2 Demand and Energy Data Darrel Richardson, NERC Senior Standards Developer Jeff Rooker, SPP RE Lead Compliance Engineer May 12, 2016 Administrative Items NERC Antitrust Guidelines It is NERC s