SCHIFF HARDIN LLP. May 30, 2014 VIA ELECTRONIC FILING
|
|
|
- Bruce Harmon
- 6 years ago
- Views:
Transcription
1 SCHIFF HARDIN LLP A Limited Liability Partnership Owen E. MacBride (312) omacbride@schiffhardin.com 233 SOUTH WACKER DRIVE SUITE 6600 CHICAGO, ILLINOIS Tel.: Fax: May 30, 2014 VIA ELECTRONIC FILING Ms. Kimberly D. Bose Secretary Federal Energy Regulatory Commission 888 First Street, N.E. Washington, D.C Re: North American Electric Reliability Corporation Docket No. RR14-_-000 Report of Comparisons of Budgeted to Actual Costs for 2013 for NERC and the Regional Entities Dear Ms. Bose: The North American Electric Reliability Corporation (NERC) hereby submits the North American Electric Reliability Corporation s Report of Comparisons of Budgeted to Actual Costs for 2013 for NERC and the Regional Entities. This filing consists of: (1) this transmittal letter, (2) the narrative text of the filing, which follows this transmittal letter, and (3) Attachments 1 through 10. The Table of Contents to the narrative text list the 10 attachments. Please contact the undersigned if you have any questions concerning this filing. Respectfully submitted, /s/ Owen E. MacBride Owen E. MacBride Attorney for North American Electric Reliability Corporation
2 UNITED STATES OF AMERICA Before the FEDERAL ENERGY REGULATORY COMMISSION NORTH AMERICAN ELECTRIC ) RELIABILITY CORPORATION ) Docket No. RR ) NORTH AMERICAN ELECTRIC RELIABILITY CORPORATION S REPORT OF COMPARISONS OF BUDGETED TO ACTUAL COSTS FOR 2013 FOR NERC AND THE REGIONAL ENTITIES Gerald W. Cauley President and Chief Executive Officer Michael Walker Senior Vice President and Chief Financial and Administrative Officer North American Electric Reliability Corporation 3353 Peachtree Road Suite 600, North Tower Atlanta, GA (404) (404) facsimile Owen E. MacBride Schiff Hardin LLP 233 South Wacker Drive, Suite 6600 Chicago, IL (312) (312) facsimile omacbride@schiffhardin.com Charles A. Berardesco Senior Vice President and General Counsel Rebecca J. Michael Associate General Counsel for Regulatory and Corporate Matters North American Electric Reliability Corporation 1325 G Street, N.W., Suite 600 Washington, D.C (202) (202) facsimile charles.berardesco@nerc.net rebecca.michael@nerc.net May 30, 2014
3 TABLE OF CONTENTS I. INTRODUCTION 1 II. NOTICES AND COMMUNICATIONS 2 III. COMPARISONS OF ACTUAL COSTS TO BUDGETS FOR THE YEAR ENDED DECEMBER 31, IV. METRICS CONCERNING ADMINISTRATIVE COSTS IN 2013 NERC AND REGIONAL ENTITY BUDGETS AND ACTUAL COSTS 10 V. CONCLUSION 19 ATTACHMENTS: Attachment 1: North American Electric Reliability Corporation 2013 Actual Cost-to- Budget Comparison and Audited Financial Statements Attachment 2: Florida Reliability Coordinating Council, Inc Actual Cost-to- Budget Comparison and Audited Financial Statements Attachment 3: Midwest Reliability Organization 2013 Actual Cost-to-Budget Comparison and Audited Financial Statements Attachment 4: Northeast Power Coordinating Council, Inc Actual Cost-to- Budget Comparison and Audited Financial Statements Attachment 5: ReliabilityFirst Corporation 2013 Actual Cost-to-Budget Comparison and Audited Financial Statements Attachment 6: SERC Reliability Corporation 2013 Actual Cost-to-Budget Comparison and Audited Financial Statements Attachment 7: Southwest Power Pool Regional Entity 2013 Actual Cost-to-Budget Comparison; Audited Financial Statements of Southwest Power Pool, Inc. Attachment 8: Texas Reliability Entity, Inc Actual Cost-to-Budget Comparison and Audited Financial Statements Attachment 9: Western Electricity Coordinating Council 2013 Actual Cost-to-Budget Comparison and Audited Financial Statements Attachment 10: Metrics Concerning Administrative Costs in 2013 NERC and Regional Entity Budgets and Actual Costs -i-
4 I. INTRODUCTION The North American Electric Reliability Corporation ( NERC ) respectfully submits this filing to provide comparisons of actual to budgeted costs for the year 2013 for NERC and the eight Regional Entities. 1 The Commission originally directed NERC to file, each year, comparisons of actual to budgeted costs for the preceding year, in an order issued October 18, 2007 concerning the 2008 business plans and budgets of NERC and the Regional Entities. 2 As described in III below, in several subsequent orders, the Commission has clarified and expanded upon the information to be included in the annual actual-to-budget cost comparisons. The following information is provided in this filing: A comparison of the actual funding received and costs incurred by NERC and each Regional Entity for statutory and (where applicable) non-statutory activities for the year ended December 31, 2013, to the budgets of NERC and each Regional Entity for that year, with explanations of significant actual cost-to-budget variances. Audited financial statements of NERC and each Regional Entity for the year ended December 31, Metrics concerning NERC and Regional Entity administrative costs in their 2013 budgets and actual results. 3 This filing includes the following attachments: Attachment 1: 2013 Actual Cost-to-Budget Comparison and Audited Financial Statements for NERC. 1 The eight Regional Entities are the Florida Reliability Coordinating Council, Inc. ( FRCC ), Midwest Reliability Organization ( MRO ), Northeast Power Coordinating Council, Inc. ( NPCC ), ReliabilityFirst Corporation ( ReliabilityFirst ), SERC Reliability Corporation ( SERC ), Southwest Power Pool, Inc. Regional Entity ( SPP RE ), Texas Reliability Entity, Inc. ( Texas RE ), and Western Electricity Coordinating Council ( WECC ). 2 North American Electric Reliability Corporation, Order Conditionally Accepting 2008 Business Plan and Budget of the North American Electric Reliability Corporation and Ordering Compliance Filings, 121 FERC 61,057 (2007) ( 2008 ERO Budget Order ). 3 The metrics information is provided in response to P 39 of the Commission s Order issued June 19, North American Electric Reliability Corporation, Order Conditionally Accepting Compliance Filing, 123 FERC 61,282 (2008) ( June 19, 2008 Budget Compliance Order ).
5 Attachment 2: 2013 Actual Cost-to-Budget Comparison and Audited Financial Statements for FRCC. Attachment 3: 2013 Actual Cost-to-Budget Comparison and Audited Financial Statements for MRO. Attachment 4: 2013 Actual Cost-to-Budget Comparison and Audited Financial Statements for NPCC. Attachment 5: 2013 Actual Cost-to-Budget Comparison and Audited Financial Statements for ReliabilityFirst. Attachment 6: 2013 Actual Cost-to-Budget Comparison and Audited Financial Statements for SERC. Attachment 7: 2013 Actual Cost-to-Budget Comparison for SPP RE and 2012 Audited Financial Statements for Southwest Power Pool, Inc. Attachment 8: 2013 Actual Cost-to-Budget Comparison and Audited Financial Statements for Texas RE. Attachment 9: 2013 Actual Cost-to-Budget Comparison and Audited Financial Statements for WECC. Attachment 10: Metrics Concerning Administrative Costs in 2013 NERC and Regional Entity Budgets and Actual Costs II. NOTICES AND COMMUNICATIONS Notices and communications with respect to this filing may be addressed to: Gerald W. Cauley President and Chief Executive Officer Michael Walker Senior Vice President and Chief Financial and Administrative Officer North American Electric Reliability Corporation 3353 Peachtree Road North Tower, Suite 600 Atlanta, GA (404) (404) facsimile *Owen E. MacBride Schiff Hardin LLP 233 South Wacker Drive, Suite 6600 Chicago, IL (312) (312) facsimile *Charles A. Berardesco Senior Vice President and General Counsel *Rebecca J. Michael, Associate General Counsel for Regulatory and Corporate Matters North American Electric Reliability Corporation 1325 G Street, N.W., Suite 600 Washington, D.C (202) (202) facsimile charles.berardesco@nerc.net rebecca.michael@nerc.net *Persons to be included on the Commission s official service list. NERC requests waiver of the limitation to two persons on the service list in order to include a third person. -2-
6 III. COMPARISONS OF ACTUAL COSTS TO BUDGETS FOR THE YEAR ENDED DECEMBER 31, 2013 As noted above, in the 2008 ERO Budget Order, the Commission directed NERC to make annual filings comparing the NERC and Regional Entity budgets to actual costs incurred in the preceding year, in sufficient detail and with sufficient explanations for the Commission to determine, by program area, the reasons for deviations from the budget and the impacts of those deviations. 4 In the June 19, 2008 Budget Compliance Order, which addressed NERC s April 1, 2008 compliance filing to the 2008 ERO Budget Order, the Commission provided additional direction concerning the presentation of the annual filings comparing NERC s and the Regional Entities actual to budgeted expenditures: 37. To promote consistency and transparency, the Commission directs the use of certain practices and formats in future true-up filings. In particular, Regional Entities must provide a cover letter discussing major areas of actual cost-to-budget variances for all of the Regional Entity s statutory programs in the aggregate. Regional Entities should also follow NERC s template for the presentation of actual costs and budgeted costs on a program-by-program and line-item basis. Significant variances must be explained on a line-item basis with enough particularized information to clearly support each such variance. Regional Entities should refrain from using generic, program area summaries to support significant variances. The cause for each such variance should therefore be clear on its face. Further, each Regional Entity must provide an explanation of the allocation methods it used to allocate indirect costs to the direct statutory program or functional areas, as well as any allocation between any statutory and non-statutory activities. 38. Cash reserves are meant to handle expenses which exceed the amount budgeted, as well as unforeseen events that could occur at any time. However, in the future, the Commission expects NERC and the Regional Entities to justify the use of cash reserves as variances in the April true-up. Cash reserves should not become a means to fund expected projects outside of the budget approval process. The Commission expects that as NERC and the Regional Entities develop experience in planning and functioning under their budgets the amounts and number of variance will decrease. In addition, the Commission expects that with experience, the explanations for the variances will improve. In addition, although the following directive in the 2008 ERO Budget Order was ERO Budget Order at P
7 expressly applicable to NERC s compliance filing comparing actual expenses to budgets for the year ended December 31, 2007 for NERC and the Regional Entities, NERC has treated the directive as intended to apply to the annual filings comparing actual expenses to budgets for future years as well: [T]he Commission reminds NERC and the Regional Entities that, to the extent funding identified as statutory is used to fund non-statutory activities, those funds must be reimbursed (e.g., to load serving entities or to statutory expenditures). NERC is directed to inform the Commission in the... compliance filing the extent to which this has occurred and document that the funds have been or will be reimbursed. The comparisons of 2012 actual-to-budget funding and expenditures for NERC and the Regional Entities are provided in Attachments 1 through 9, as follows: Attachment 1: NERC Attachment 2: FRCC Attachment 3: MRO Attachment 4: NPCC Attachment 5: ReliabilityFirst Attachment 6: SERC Attachment 7: SPP RE Attachment 8: Texas RE Attachment 9: WECC Each Attachment also includes the respective entity s audited financial report for the year ended December 31, 2013, as prepared by its independent public accounting firm. The comparisons provided in Attachments 1 through 9 conform to the Commission s directives as quoted above: Each comparison contains a cover letter identifying overall actual-to-budget variances in Funding and total Expenses and in major Expense categories, and discussing reasons for major areas of actual cost-to-budget variances. Each comparison contains a summary table, prepared using a NERC-supplied template, showing the entity s 2013 budget, 2013 actual amounts, and the variance, -4-
8 for major line-item categories of Funding and Expenses. For those entities that engaged in both statutory and non-statutory activities in 2013, the comparisons include separate summary tables for statutory programs and nonstatutory activities, prepared using the NERC-supplied template, showing the entity s 2013 budget, 2013 actual amounts, and the variance, for major line-item categories of Funding and Expenses. 5 The comparisons include individual tables, also prepared using a NERC-supplied template, showing 2013 budget, 2013 actual amounts, and the variance, for major line-item categories of Funding and Expenses, for each of the statutory programs 6 (direct costs) and the overhead functions 7 (indirect costs). These tables also provide explanations for significant line-item actual-to-budget variances. 8 The Attachments also address (generally in the cover letter) (i) where applicable, whether any statutory funds were used in 2013 for non-statutory activities (neither NERC nor any Regional Entity reports using statutory funds for non-statutory activities during 2013); (ii) the impact of the entity s 2013 results on its working cash reserve for statutory programs (e.g., whether working cash reserves were used to fund expenditures during 2013) 9 ; (iii) how indirect 5 FRCC, NPCC, Texas RE and WECC had non-statutory activities in 2013 and each has provided summary tables for statutory and non-statutory activities. NERC, MRO, ReliabilityFirst, SERC and SPP RE did not have non-statutory activities in 2013 (although SPP RE s parent organization, Southwest Power Pool, Inc. had non-statutory activities). 6 Reliability Standards, Compliance Operations, Enforcement and Organization Registration, Reliability Assessment and Performance Analysis, Training, Education and Operator Certification, and Situation Awareness and Infrastructure Security (including Critical Infrastructure Protection). NERC and SERC have each provided separate tables for (i) Compliance Operations and Organization Registration and (ii) Compliance Enforcement. In addition, NERC has also provided separate tables for Event Analysis and Investigations and for Critical Infrastructure Protection and ES-ISAC (Electricity Sector Information Sharing and Analysis Center). 7 Committees and Member Forums, General and Administrative, Legal and Regulatory, Information Technology, Human Resources, and Accounting and Finance. Some of the Regional Entities report budget and actual expenditure information for some or all of the overhead functions on a combined basis, in order to protect the confidentiality of compensation information for departments that have a limited number of staff members. 8 Generally, explanations have been provided for line-item variances that are greater than +/- 10% of the budgeted amount and greater than $10,000 over or under the budgeted amount. 9 The summary comparison tables for total entity and (where applicable) statutory and non-statutory activities show the Change in Working Capital (or in Operating Reserves ) for the 2013 Actual Funding and Expenditures. A positive Change in Working Capital means the entity s total Actual Funding exceeded its total Actual Expenditures for the year 2013; therefore, it was not necessary for the entity to use a portion of its cash reserves balance at December 31, 2012 to fund 2013 expenditures. -5-
9 costs were allocated to the direct statutory programs or functions; and (iv) where applicable, whether, and if so how, costs were allocated between statutory programs and non-statutory activities in As it did in its actual cost-to-budget comparisons filed with the Commission for 2011 and 2012, 10 NERC has provided additional information in its 2013 report in Attachment 1 on (1) actual cost to budget variances for Consultants and Contracts expense, and (2) a detailed analysis and comparison of the major sources of changes in its working capital and operating reserves for 2013, as budgeted and per actual results. The analysis of working capital and operating reserves includes a breakdown of the changes in working capital and operating reserves due to 2013 budgeted operations and to differences in actual funding or expenditures from amounts budgeted, including unbudgeted or above-budget expenditures funded from the Known Contingency Reserve or the Unknown Contingency Reserve. This additional information is also responsive to recommendations adopted in the approved Settlement Agreement for the Commission s financial performance audit of NERC. 11 The table on page 4 of Attachment 1 shows the actual cost to budget variances for Consultants and Contracts expense for 2013 by NERC program area, and is followed by a detailed narrative discussion of the reasons for actual cost-to-budget variances for Consultants and Contracts expense in each program area (pages 4-5). The analysis of changes in working capital and operating reserves is provided on pages 8-9 of Attachment 1, including the 10 See Attachment 1 to North American Electric Reliability Corporation s Report of Comparisons of Budgeted to Actual Costs for 2011 for NERC and the Regional Entities, filed May 30, 2012 in Docket No. RR ( 2011 True-Up Filing ); and Attachment 1 to North American Electric Reliability Corporation s Report of Comparisons of Budgeted to Actual Costs for 2012 for NERC and the Regional Entities, filed May 30, 2013 in Docket No. RR ( 2012 True-Up Filing ) 11 See North American Electric Reliability Corporation, Order Approving Settlement Agreement, 142 FERC 61,054 (2013), Attachment (Settlement Agreement) at II(8)(a), specifying that NERC will [i]ncrease the granularity of the NERC budget filings by identifying proposed budgeted expenditures, at a minimum, by the major activities to be undertaken by each program area (Audit Staff Recommendation 4). NERC also agreed with Audit Staff Recommendation 5 to [i]ncrease the granularity of the NERC true-up filings in line with the budget filings. -6-
10 table on page 9 which shows the major sources of generation and additions to operating reserves in 2013 and the major expenditures of operating reserves in In addition, in its 2013 report, NERC has also provided (1) details relating to Miscellaneous Expense, reporting actual expenses for employee rewards and recognition, community responsibility activities and charitable contributions (see page 6 of Attachment 1); and (2) an actual cost-to budget comparison of 2013 Board of Trustees expenses, detailed by Meetings and Travel Expense (Quarterly Board Meetings and Trustee Travel expense) and Professional Services (Independent Trustee Fees and Trustee Search Fees). The information relating to Board of Trustees expenses is provided on page 7 of Attachment 1. Because the NERC and Regional Entity reports in each Attachment identify and discuss major areas of actual-to-budget variances, and the individual tables for each direct statutory program and each indirect cost function contain specific explanations of significant variances on a line-item basis, a detailed, entity-by-entity discussion of the actual-to-budget variances experienced in 2013 by NERC and individual Regional Entities is not provided here. However, the list below describes several recurring drivers of actual-to-budget variances experienced by NERC and the Regional Entities in 2013, as identified by NERC s review of the comparisons. A number of entities 12 experienced under-budget variances in Salary Expense and related Personnel Expenses (Payroll Taxes, Employee Benefits and Savings & Retirement), in one or more program areas, due to being unable to fill budgeted positions, due to filling budgeted positions later in the year than was assumed in the budget, or due to employees in existing positions leaving the entity, resulting in a vacant position for a portion of the year. Additionally, having fewer personnel on staff than budgeted tended to reduce Meetings and/or Travel Expense below the budgeted amounts The term entities is used in this discussion to include NERC as well as Regional Entities. 13 In the development of their annual budgets, NERC and some of the Regional Entities have begun to address this vacant position variance issue by including an attrition factor or labor float factor into their budget calculations. The attrition factor recognizes that, as in any organization, a portion of the -7-
11 In some instances, due to the difficulty in filling budgeted positions, the entity may have found it necessary (i) to pay higher compensation than budgeted to fill a new or vacant position, and/or (ii) to incur costs for temporary staffing services while budgeted positions were vacant. In order to address unfilled positions or emergent needs in particular program areas, some entities transferred one or more employees from one program area to another during 2013, or had shared FTEs who spent a greater portion of their time working in one program area and a lesser portion of time in another program area than was reflected in the budget. This resulted in actual cost-to-budget variances in Personnel Expenses and related Meeting and Travel expenses for the program areas involved in such transfers, although not necessarily for the entity as a whole. The inability to fill budgeted positions as planned, or the departure of existing employees, also resulted in some instances in higher-than budgeted Consultants & Contracts expense, due to either or both the need to use consultants or contractors to perform work that would have been done by employees, or the need to make greater use than budgeted of personnel recruiting services and search firms. Generally, NERC and the Regional Entities allocate Indirect Expenses to the direct statutory programs on the basis of numbers of FTEs in each statutory program. Therefore, due to differences in actual versus budgeted FTEs during the year in individual statutory programs, some entities experienced variances from budget in the amounts of Indirect Expenses allocated to the individual direct statutory programs. Some entities experienced higher or lower Employee Benefits expenses than budgeted due to actual renewal rates from services providers for their health and medical benefits programs being different than projected at the time of budget preparation. Some entities experienced lower than budgeted Employee Benefits expenses due to decisions by employees not to participate in the entity s medical benefits program. In some cases employees elected to stay on the health and medical programs of previous employers or of their spouse s employer. Some entities experienced either higher or lower costs than budgeted for Retirement costs due to greater or lesser participation by employees in the entity s retirement plan than was assumed in the budget. A number of entities realized lower than budgeted actual costs for Meetings and Travel due to (i) continuing efforts to make greater use of teleconferencing, Webinars and other virtual meeting capabilities rather than in-person meetings; (ii) holding several meetings in the same hotel or other outside facility, thereby obtaining lower charges; and/or (ii) scheduling meetings at NERC or Regional Entity facilities or the facilities of stakeholders (e.g. at the offices of Regional Entity members) rather than in rented, third-party meeting spaces. budgeted positions will be vacant during a part of the year due to delays in filling new or vacant positions and unexpected/unbudgeted departures of existing employees. -8-
12 In particular with respect to Meetings and Travel expense, several entities which moved to new offices with larger meeting spaces, or expanded existing offices, in 2013 or in recent prior years have been able to reduce Meetings and Travel expense by holding more meetings in the entity s office rather than in outside facilities. Some entities incurred lower than budgeted costs for Conference Calls due to entering into a new contract for teleconferencing services with the existing provider, or entering into a contract with a new provider of these services, at lower costs, during the course of the year. Several entities were able to spend less on Consultants and Contracts and/or Professional Services than budgeted, as a result of having work budgeted to be performed by contractors and consultants handled by internal staff of the entity. As some entities have increased their staffing over time, they have seen less need to use outside services, due to increased in-house staff capabilities. Some entities experienced lower than budgeted Consultants and Contracts expense due to timing delays or deferrals in planned projects. Some entities experienced variances in Office Rent or Office Costs due to new or changed office lease terms (including as a result of moving to a new office or taking additional space in the existing office facility), or due to implementing changes in the manner in which the entity accounted for Office Rent or Office Costs, as compared to the terms or accounting reflected in the budget. In addition, some entities which moved to new offices or expanded existing offices to accommodate increased staffing, incurred additional costs for capital expenditures (Furniture & Fixtures CapEx, Equipment CapEx, Computer & Software CapEx, and/or Leasehold Improvements) associated with the move to the new office or expansion of the existing office. Some actual cost-to-budget variances within program areas are due to the entity budgeting certain costs entirely in one program area but then recording the actual costs in the program area responsible for incurring the cost (e.g., budgeting all outside legal services in Legal and Regulatory but recording actual outside legal expenses in the program area(s) whose activities necessitate the services). Some entities budget Professional Services expense for one or two contested compliance hearing per year (e.g., for outside counsel to handle the hearing or for hearing officer services); if no contested hearings occur during the year, an underbudget variance in Professional Services expenses results. For some entities, Information Technology projects or Fixed Asset purchases (e.g., office furniture purchases) that were included in the 2013 budget were either (i) completed, or at least initiated, in late 2012, (ii) not carried out in 2013 (i.e., delayed/deferred to 2014), or (iii) initiated later in 2013 than assumed in the budget and therefore not completed in This resulted in reduced actual IT costs, Capital Expenditures, and/or Consultants and Contracts expense (where the project was to require the use of consulting services or outside contracts). In other cases, projects that were planned and budgeted for execution and completion in 2012 were not fully -9-
13 completed in 2012 or were delayed or deferred into 2013, resulting in unbudgeted expenditures in Some entities budgeted certain expenditures as expenses (e.g., as Office Costs), but then determined that the expenditure(s) needed to be capitalized (i.e., recorded as Fixed Asset additions, such as Computer & Software Capital Expenditures or Equipment Capital Expenditures) based on the entity s capitalization policy. The determination to capitalize rather than expense these expenditures also resulted in additional Depreciation expense. Some entities experienced higher or lower Funding from Workshop attendance fees, or other programs conducted for industry participants, due to higher or lower attendance at workshops or other programs than projected in the budget, holding more or fewer Workshops than assumed in the budget, making a determination not to charge fees (or charging lower fees) for some programs for which fees had been budgeted, or a combination of these factors. In addition to the above-described causes of actual-to-budget variances that were experienced by more than one entity, NERC and the Regional Entities experienced other above- or below-budget variances in actual Funding, Expenses and Fixed Asset Additions in individual line items due to particular events and circumstances impacting the particular entity. These variances are identified in the individual actual cost-to-budget comparisons presented in Attachments 1 through 9. NERC and the Regional Entities are taking the actual cost-to-budget comparisons for 2013, as well as year-to-date actual cost-to-budget comparisons for 2014, into account in developing their business plans and budgets for 2015, which are to be submitted to the NERC Board for approval, and then filed with the Commission for approval, in August In addition, the Regional Entities working capital and operating reserve policies are being reviewed as part of the 2015 business plan and budget review process. IV. METRICS CONCERNING ADMINISTRATIVE COSTS IN 2014 NERC AND REGIONAL ENTITY BUDGETS AND ACTUAL COSTS In the June 19, 2008 Budget Compliance Order, the Commission directed NERC to develop additional metrics analyzing its administrative expenses and those of the Regional -10-
14 Entities, and to present these metrics in future annual actual cost-to-budget filings and Business Plan and Budget filings: 39. Our analysis of the Regional Entities true-up statements indicates that many Regional Entities spent a significant percentage of their 2007 budgets on various administrative functions to support their statutory functions. 13 The amounts spent on administrative functions vary widely among the Regional Entities... We recognize that 2007 is the first year that these Regional Entities have prepared a budget for statutory functions and that there are some startup costs that will be unique to The Commission anticipates, however, that such effects will diminish as NERC and the Regional Entities gain experience preparing their budgets. To promote better transparency, the Commission directs NERC to develop additional metrics to identify, in a uniform manner, information detailing its total expenses for administrative functions as well as the expenses for administrative functions for each Regional Entity. For example, one of the matrices should be the percentage spent by the Regional Entity on administrative functions as a portion of its total approved budgeted funding similar to the information provided in the table attached to this order. These new metrics should be designed to enhance the Commission s ability to compare information provided by the Regional Entities on administrative costs and to understand the reasons for any significant differences in amounts budgeted by different Regional Entities for the same function. The Commission therefore directs NERC to develop these additional metrics for use in the true-up filings for NERC s 2008 and 2009 budgets and for use in NERC s subsequent business plans and budgets beginning with NERC s 2010 Business Plan and Budget. 13 The Commission considered the amount each Regional Entity spent on administrative functions as a percentage of its total budgeted funding. The administrative functions included in staff s analysis are: Committees and Member Forums, General and Administration, Legal and Regulatory, Information Technology, Human Resources, and Accounting and Finance. A table of administrative expenses spent by each Regional Entity as a percentage of its budgeted funding is included as Attachment A to this order. The administrative functions cited in footnote 13 of the June 19, 2008 Budget Compliance Order (Committees and Member Forums, General and Administration, Legal and Regulatory, Information Technology, Human Resources and Accounting and Finance) are the functions that NERC and the Regional Entities refer to as indirect costs in their business plans and budgets and reports of actual expenses. It is appropriate to analyze these indirect costs in the aggregate (as the Commission did in P 39 and footnote 13 of the June 19, 2008 Budget Compliance Order), -11-
15 rather than by individual function, due to certain necessary inconsistencies among the Regional Entities in budgeting and recording these costs. For example, as noted earlier, some of the Regional Entities budget and record all Salary expense for Legal and Regulatory, Human Resources and/or Accounting and Finance under General and Administrative, because they have only one or two employees in each of these functions, and therefore reporting the budgeted and actual Salary expense for these individual functional categories could reveal salary information of individual employees. 14 As stated earlier, the actual cost-to-budget comparisons for 2013, as well as year-to-date actual cost-to-budget comparisons for 2014, are being taken into account in developing the NERC and Regional Entity business plans and budgets for Attachment 10 provides the following three sets of metrics comparisons for NERC and the Regional Entities for their 2013 budgets and 2013 actual costs. In addition, Attachment 10 provides a comparison of these metrics values for 2011, 2012 and 2013 actual results. Statutory indirect expenditures as a percent of total statutory expenditures, 15 and statutory direct expenditures per dollar of statutory indirect expenditures (top row of tables on Attachment 10). 16 Statutory indirect full-time equivalent employees ( FTE ) as a percent of total statutory FTE, and ratio of statutory direct FTE to statutory indirect FTE (middle row of tables on Attachment 10). Total statutory expenditures per total FTE, statutory direct expenditures per direct FTE, statutory indirect expenditures per indirect FTE, and statutory indirect expenditures per total FTE (bottom row of tables on Attachment 10). These are the same metrics that NERC provided in its previous annual filings comparing 14 In addition, in some instances NERC or a Regional Entity has budgeted all of its projected costs for indirect functions such as General and Administrative, Legal and Regulatory or Information Technology in the indirect program, but has recorded some or all of the actual costs incurred for the function in the statutory program in which work was performed (e.g., recording Professional Services expenses budgeted in Legal and Regulatory in the direct program for which outside legal services were performed). 15 This is the metric shown in Attachment A to the June 19, 2008 Budget Compliance Order. 16 The term expenditures is used in this discussion to mean expenses plus capital expenditures (fixed asset additions net of depreciation). -12-
16 actual-to-budget costs for NERC and the Regional Entities for 2008, 2009, 2010, 2011 and In the June 29, 2009 Budget Compliance Order, the Commission indicated that these metrics were acceptable. 18 In reviewing indirect expenditures, it is important to take into consideration that NERC s indirect expenses support more than NERC s internal operations. NERC s indirect expenditures also include support of software applications that interface with Regional Entities. Costs for outside audit resources in connection with Regional Entity oversight, as well as Compliance and Certification Committee oversight of NERC s compliance with its Rules of Procedure, are also included in indirect expenses. In addition, expenses incurred in NERC s legal and executive (General and Administrative) operations, as well as those of the Regional Entities, directly support the activities of the standards, compliance and enforcement, and other statutory program areas. NERC s legal department, as well as those of the Regional Entities, devotes considerable resources to supporting standards development, compliance enforcement and registration matters. The following subsections provide discussion and analysis of the metrics provided in Attachment 10. Statutory indirect expenditures as a percent of total statutory expenditures, and statutory direct expenditures per dollar of statutory indirect expenditures The data and metrics in the top row of tables on Attachment 10 measure the portions of 17 Additional Compliance Filing of the North American Electric Reliability Corporation in Response to October 18, 2007 Order Comparisons of Budgeted to Actual Costs for 2008 for NERC and the Regional Entities, filed April 1, 2009 in Docket No. RR ; North American Electric Reliability Corporation s Report of Comparisons of Budgeted to Actual Costs for 2009 for NERC and the Regional Entities, filed June 1, 2010 in Docket No. RR ; North American Electric Reliability Corporation s Report of Comparisons of Budgeted to Actual Costs for 2010 for NERC and the Regional Entities, filed May 31, 2011 in Docket No. RR ; 2011 True-Up Filing; 2012 True-Up Filing. 18 North American Electric Reliability Corporation, Order Conditionally Accepting Compliance Filing, 127 FERC 61,307 (2009) ( June 29, 2009 Budget Compliance Order ), at PP
17 the total statutory expenditures of NERC and each Regional Entity, and the Electric Reliability Organization ( ERO ) in the aggregate, that are being expended on statutory direct functions and on statutory indirect functions. Based on 2013 actual data, statutory indirect expenditures averaged 33.61% of total statutory expenditures for NERC and the Regional Entities, and the average statutory direct expenditure per dollar of statutory indirect expenditure was $ The actual average statutory indirect expenditure percentage was almost equal, and the actual average statutory direct expenditure per dollar of indirect expenditure was equal, to the averages based on the NERC and Regional Entity budgets (33.51% and 1.98, respectively). Further, the 2011 and 2012 actual results are not significantly different from the 2013 actual results for these metrics. The 2013 actual average statutory indirect expenditure percentage was 33.61% while the 2011 and 2012 actual average statutory indirect expenditure percentages were 31.06% and 30.35%, respectively. The three-year average for this metric for 2011, 2012 and 2013 combined was 31.72%. The 2013 actual average statutory direct expenditure per dollar of indirect expenditure was $1.98 while the 2011 and 2012 statutory direct expenditure per dollar of statutory indirect expenditure was $2.22 and $2.29, respectively. The three-year average for 2011, 2012 and 2013 combined for this metric was $2.15. Looking at the 2013 values of these metrics for the individual entities compared to the 2013 averages, the percentages of actual statutory indirect expenditures to total statutory expenditures for NERC and SPP RE were noticeably higher than the overall weighted and 19 These figures are essentially weighted averages, i.e., they are calculated using the sums of the total statutory expenditures, total statutory direct expenditures, and total statutory indirect expenditures, for NERC and the eight Regional Entities. Since NERC s and WECC s expenditures are substantially larger than those of the other Regional Entities, the NERC and WECC results significantly influence the weighted averages. (The significance of the WECC data to the averages is further magnified due to the amount of U.S. Department of Energy grant funds and related expenditures included in WECC s 2013 budget and actual results.) The arithmetic averages for these two metrics are 34.53% for statutory indirect expenditures as a percent of total statutory expenditures, and $2.57 for statutory direct expenditures per dollar of statutory indirect expenditures. -14-
18 arithmetic averages, and their 2013 ratios of actual statutory direct expenditures to statutory indirect expenditures were noticeably lower than the overall weighted and arithmetic averages. For NERC, its total actual direct statutory expenditures were approximately $337,600 less than budgeted while its total statutory indirect expenditures exceeded budget by approximately $766,300, resulting in its percentage of statutory indirect expenditures to total statutory expenditures rising from 43.06% in its budget to 44.13% actual. NERC s lower-than budgeted direct statutory expenditures was primarily due to: (1) lower than budgeted Personnel Expenses, which were collectively under budget $581,200, due to unfilled positions in the Compliance Enforcement, Situation Awareness and Training, Education, and Operator Certification departments; (2) lower than budgeted Meetings, Travel and Conferencing expenses, which were collectively $620,600 under budget, due primarily to management initiatives to lower these expenses; and (3) higher than budgeted Fixed Asset expenditures due to the capitalization (rather than expensing) of the Enterprise Bulk Electric System Exceptions application and the standards balloting software application. SPP RE s actual 2013 indirect expense amount was in fact lower than budgeted (by approximately $337,500, or about 6%), but SPP RE s 2012 statutory direct expenditures were also lower than budgeted (by approximately $1,500,000, or about 25%), with the result that SPP RE s percentage of statutory indirect expenditures to total statutory expenditures increased from 47.33% as budgeted to 52.81% actual, and its ratio of statutory direct expenditures to statutory indirect expenditures fell from $1.11 as budgeted to $0.89 actual. In other words, the principal reason for SPP RE s actual percentage of statutory indirect expenditures to total statutory expenditures being higher than budgeted for 2013 was that SPP RE s actual direct statutory -15-
19 expenditures were much lower than budgeted, not that its actual indirect expenses were higher than budgeted. As shown by the data provided on the second page of Attachment 10, comparisons of the actual 2013 results for this first set of metrics to the actual results for 2012 and 2011 for these metrics show that, over this three-year period, NERC and the Regional Entities, in the aggregate, spent about the same portion of their total statutory expenditures on statutory indirect costs. Further, with only limited exceptions, each entity s annual values for these metrics were fairly consistent over the three-year period. This three-year view indicates that as their organizations and programs mature, with seven years of ERO and delegated function activities, each entity is reaching a steady state in terms of the portions of its total resources that are expended on statutory direct program costs and statutory indirect costs. Statutory indirect FTE as a percent of total statutory FTE, and ratio of statutory direct FTE to statutory indirect FTE On average for NERC and the Regional Entities, 2013 actual statutory indirect FTEs were 24.28% of total statutory FTEs, and on average NERC and the Regional Entities had 3.12 statutory direct FTEs per statutory indirect FTE in The 2013 actual value for statutory indirect FTEs as a percent of total statutory FTEs was slightly lower than the 2012 value for this metric of 24.65% and slightly higher than the 2011 value for this metric of 23.42%; while the 2013 actual value for the number of statutory direct FTEs per statutory indirect FTE was slightly higher than the 2012 value for this metric of 3.06, and lower than the 2011 value for this metric of Overall, however, the annual averages for this metric were fairly consistent across the three-year period In 2013, the actual percentage of statutory indirect FTEs to statutory total FTEs was less than 25% for each entity in the ERO except NERC (for which the percentage was 30.84%) and -16-
20 SERC (26.94%); and NERC and each Regional Entity had at least 2.24 statutory direct FTE per statutory indirect FTE. Among the Regional Entities, FRCC, MRO, Texas RE and WECC each had a lower actual percentage of statutory indirect FTEs to statutory total FTEs in 2013 than in 2012 and NPCC and SERC each experienced higher actual percentages of statutory indirect FTEs to statutory total FTEs in 2013 than in 2012 and NERC s actual percentage of statutory indirect FTEs to statutory total FTEs in 2013 was approximately equal to its value for this metric in 2012 and was somewhat higher than its value for this metric in ReliabilityFirst s actual percentage of statutory indirect FTEs to statutory total FTEs in 2013 was lower than its value for this metric in 2012 and higher than its value for this metric in Similarly, FRCC, MRO, Texas RE and WECC each had a higher actual ratio of statutory direct FTEs per statutory indirect FTE in 2013 than in 2012 and 2011, while NPCC and SERC each had lower actual ratios of statutory direct FTEs per statutory indirect FTE in 2013 than in 2012 and NERC s actual ratio of statutory direct FTEs per statutory indirect FTE in 2013 was equal to its 2012 value, and lower than its 2011 value, for this metric. ReliabilityFirst s actual ratio of statutory direct FTEs per statutory indirect FTE in 2013 was higher than its value for this metric in 2012 and lower than its value for this metric in The three-year average percentage of actual statutory indirect FTEs to total statutory FTEs was 24.14%. The three-year average actual ratio of statutory direct FTEs per statutory indirect FTE was As noted above in the discussion of the first set of metrics, comparisons of the actual 2013 results for this second set of metrics to the actual results for 2012 and 2011 for these metrics show that, over this three-year period, NERC and the Regional Entities, in the aggregate, had about the same percentage of indirect FTEs to total statutory FTEs and about the same ratio of statutory direct FTEs per statutory indirect FTEs for each of the three years (i.e., -17-
21 the highest annual average value for each metric was within 7% or less of the lowest annual average value for the metric). Total statutory expenditures per total FTE, statutory direct expenditures per direct FTE, statutory indirect expenditures per indirect FTE, and statutory indirect expenditures per total FTE The bottom row of metrics in the tables in Attachment 10 shows the (i) total statutory expenditures per total FTE (total statutory expenditures divided by total number of statutory FTE), (ii) statutory direct expenditures per direct FTE, (iii) statutory indirect expenditures per indirect FTE, and (iv) statutory indirect expenditures per total FTE (statutory indirect expenditures divided by total number of FTE), for NERC and each Regional Entity. For NERC and the eight Regional Entities, in the aggregate: The actual average total statutory expenditures per statutory FTE were approximately 7.6% higher than budgeted ($273,210 actual versus $253,971 budgeted). The actual average statutory direct expenditures per statutory direct FTE were also approximately 7.6% higher than budgeted ($239,565 actual versus $222,630 budgeted). The actual average statutory indirect expenditures per statutory indirect FTE were 7.3% higher than budgeted ($378,131 actual verses $352,402 budgeted). The actual average statutory indirect expenditures per total statutory FTE were higher than budgeted by 7.9% ($91,815 actual versus $85,109). Overall, for NERC and the Regional Entities in the aggregate, the actual 2013 value for each of the first three metrics was lower than the actual values for 2012 and 2011, with only one exception: The actual average total statutory expenditures per statutory FTE were $273,210 in 2013, as compared to $278,306 in 2012 and as compared to $291,503 in The three-year average value for this metric was $281,007. The actual average statutory direct expenditures per statutory direct FTE were $239,565 in 2013 as compared to $257,242 in 2012 and as compared to $262,409 in The three-year average value for this metric was $253,
22 The actual average statutory indirect expenditures per statutory indirect FTE were $378,131 in 2013 as compared to $342,707 in 2012 and as compared to $386,650 in The three-year average value for this metric was $369,163. This latter comparison shows that from 2011 to 2013, the ERO s FTE staffing (both direct function and indirect function personnel) grew faster than statutory expenditures grew, indicating an increase in the efficiency of use of the ERO s personnel. A final, overall observation on the entire set of metrics data presented in Attachment 10 (similar to the observation stated earlier based on the first set of metrics), is that, after seven years of ERO operations, as their organizations and programs mature, with only limited exceptions, each of the nine entities appears to be reaching a steady state in terms of the portions of its total statutory expenditures and personnel resources that are being devoted to statutory direct program activities and to statutory indirect activities. While some differences remain in the individual metrics values among the entities, these differences (i.e. each entity s metrics values) can be seen as becoming ingrained in their organizational and program structures. V. CONCLUSION The North American Electric Reliability Corporation respectfully requests that the Commission accept this filing and Attachments as compliant with the Commission s requirements for annual presentation of comparisons of actual-to-budgeted funding and costs for NERC and the Regional Entities for the year ended December 31,
23 Respectfully submitted, Gerry W. Cauley President and Chief Executive Officer Michael Walker Senior Vice President and Chief Financial and Administrative Officer North American Electric Reliability Corporation 3353 Peachtree Road Suite 600, North Tower Atlanta, GA (404) (404) facsimile /s/ Owen E. MacBride Owen E. MacBride Schiff Hardin LLP 233 South Wacker Drive, Suite 6600 Chicago, IL (312) (312) facsimile Charles A. Berardesco Senior Vice President and General Counsel Rebecca J. Michael Associate General Counsel for Corporate and Regulatory Matters North American Electric Reliability Corporation 1325 G Street, N.W., Suite 600 Washington, D.C (202) (202) facsimile charles.berardesco@nerc.net rebecca.michael@nerc.net -20-
24 ATTACHMENT ACTUAL COST-TO-BUDGET COMPARISON AND 2013 AUDITED FINANCIAL REPORT FOR NORTH AMERICAN ELECTRIC RELIABILITY CORPORATION
25 North American Electric Reliability Corporation 2013 Audited Results Actual to Budget Variance Analysis For the year ending December 31, 2013, NERC was approximately on budget with a minor over budget variance of $428.6k (0.8%) for total expenses and fixed asset (capital) purchases, inclusive of expenditures of reserves. While there were some significant variances within the expense categories, as further explained below, this minor overall budget variance was primarily due to: (1) higher personnel expenses resulting from the addition of senior personnel, higher than budgeted expenses for temporary office services needed to support NERC s ongoing operations during times of staff vacancies, higher incentive compensation based upon year end performance results, higher payroll tax expense due to a higher maximum salary limit subject to taxes, and the accrued expense for unused paid time off, which were partially offset by lower than budgeted benefits and retirement costs; and (2) higher than budgeted expenditures of fixed assets due to capitalization of the development costs of the Enterprise Bulk Electric System Exception (BES) software application and furniture and leasehold improvement costs required for the approved increase in lease space for the Atlanta offices. These over budget expenses were offset to a degree by lower travel expenses due to having fewer FTEs on staff, fewer telecommuters, various management initiatives to reduce overall travel expenses, and lower than budgeted consultant and contract expense. Consultant and contract expenses were under budget primarily due to the reclassification of expenses related to development of the BES software application which were partially budgeted under consulting and contract expenses, but were recorded in fixed assets as capitalized software, resulting in the over budget variance in fixed asset additions. All uses of operating reserves received necessary corporate authorizations and are further explained beginning on page 8 under the heading Operating Reserve Analysis.
26 2013 ACTUAL VERSUS BUDGET BY CATEGORY 2013 Actual 2013 Budget 2013 Variance Over(Under) % TOTAL FUNDING 52,349,031 52,252,656 96, % BUDGET EXPENSES and FIXED ASSETS PERSONNEL EXPENSES 32,113,505 31,298, , % MEETINGS, TRAVEL and CONFERENCE CALLS 3,414,306 4,098,310 (684,005) 16.7% CONSULTANTS and CONTRACTS 8,293,693 8,816,254 (522,561) 5.9% RENT 2,722,106 2,756,840 (34,734) 1.3% OFFICE COSTS, PROFESSIONAL SERVICES and MISCELLANEOUS 5,461,481 5,494,346 (32,865) 0.6% Other Non Operating Expenses 203,164 50, , % FIXED ASSET PURCHASES (excludes the credit for depreciation) 2,506,631 1,772, , % TOTAL BUDGET 54,714,886 54,286, , % Change in Working Capital and Operating Reserves (2,365,855) (2,033,597) (332,256) FTEs (11.50) 6.2% The following is an explanation the major factors influencing actual to budget performance for 2013: Funding Over budget variance is the net effect of over budget variances in services and software and testing fees and under budget variances in workshop fees and Interest. Testing fees were over budget primary due to more system operator certification tests taken and more certificate renewals than expected. Services and software were over budget primarily due to licensing of GADS data which was not planned for Workshop fees were under budget primarily due to elimination of a NASPI workshop and the elimination of fees for a compliance auditor workshop that was held at a Regional Office instead of a hotel. Interest was under budget primarily due to extremely low rates of return on invested funds. Staff Vacancies and Attrition The company ended the year 11.5 FTEs under budget. Staff attrition for 2013 was 19%, down from 26% in Personnel Expenses were $815.1k (2.6%) over budget Salaries expense, which is comprised of base salaries, at risk performance compensation, employment agency fees, temporary office services, and accrued vacation, or paid time off expense, was over budget $1.4M (5.9%). o Base salaries were over budget $245.5k, primarily due to the addition of senior personnel. o At risk performance compensation was $847.7k over budget primarily due to the fact that the budget was not established taking into account historic results. Similar North American Electric Reliability Corporation 2013 Audited Results Actual to Budget Variance Analysis 2
27 to previous budgets, the 2013 budget for at risk performance compensation was based on a hypothetical threshold payout level of 70 percent, with the final payout level dependent upon actual performance results, as well as the availability of funding for any payout amounts in excess of budget. 1 At risk performance compensation is subject to finalization and approval of corporate and departmental performance measures and year end performance reviews of personnel, as well as the receipt of management, Corporate Governance and Human Resources Committee and Board of Trustee approvals in accordance with the company s compensation governance policies. Commencing with the 2015 budget, management is proposing to budget at risk performance compensation based on historic results. This should avoid large variances in actual to budgeted expense for this item and more closely track projected actual year end results throughout the year. o Temporary office services expenses were approximately $226.9k over budget due to the increased use of temporary staffing to support NERC s ongoing operations during times of staff vacancies. o The accrual for earned but unused vacation, or paid time off expense, was increased at year end and resulted in $89.2k in expense that was not budgeted. Payroll taxes were $68.0k (4.7%) over budget due to a higher maximum taxable earnings cap than the assumption in the budget. Benefits expense, which is comprised of education and training, health and life, workers compensation, and relocation was $212.6k (6.9%) under budget, primarily due to having fewer FTEs on staff than budgeted and due to lower than budgeted renewal costs associated with NERC s health plans. In the 2013 budget, NERC assumed the cost of health plans would increase 10% over 2012, but actual renewal rates, effective April 1, 2013, increased 9%. Retirement expenses were $449.6k (16.6%) under budget primarily due to having fewer FTEs on staff, later eligibility dates due to timing of hiring and due to forfeiture of unvested funds related to personnel attrition. Meetings, Travel, Conferencing and Webinar expenses were under budget $684.0k (16.7%), primarily due to lower travel costs, as explained above. Travel costs, which were $736.5k lower than budget, were slightly offset by higher than budgeted meetings expense. Meetings expense, which includes the cost of rented space and catering for meetings and workshops held in hotels and the cost of catering for meetings held in NERC or Regional Entity offices, was over budget $63.7k 1 Over the past several years the incentive compensation budget has been based upon a threshold percentage achievement of corporate goals and per employee maximum incentive compensation eligibility. Projected incentive compensation expense was then accrued during the year based upon historic results. Beginning in 2015, the budget will be based on the three year historic average of the actual total company wide incentive compensation payment amount to actual salary expense. This methodology should more closely track actual results and avoid large variances between budgeted and actual incentive compensation expenses. North American Electric Reliability Corporation 2013 Audited Results Actual to Budget Variance Analysis 3
28 primarily due to meetings related to the standards reform initiative, Geo Magnetic Disturbance initiatives and the Reliability Issues Steering Committee, which were not specifically budgeted. Consultants and Contracts expenses were $522.6k (5.9%) under budget due primarily, as noted above, to the reclassification of expenses related to development of the Enterprise BES software application, which was partially budgeted under consulting and contract expenses in Information Technology, but recorded in fixed assets as capitalized software in the Reliability Assessments and Performance Analysis program. The following table summarizes the over and under budget variances for consultants and contracts by Program area. CONSULTANTS and CONTRACTS Actual Budget Over(Under) STANDARDS 310, , ,600 COMPLIANCE OPERATIONS 17,282 17,282 RELIABILITY ASSESSMENTS and PERFORMANCE ANALYSIS 757, ,000 72,899 RELIABILITY RISK MANAGEMENT* 2,764,411 2,863,180 (98,769) CRITICAL INFRASTRUCTURE DEPARTMENT** 683, ,000 (101,333) TRAINING, EDUCATION and OPERATOR CERTIFICATION 604, ,574 (244,360) POLICY and EXTERNAL AFFAIRS 39, ,000 (110,777) LEGAL and REGULATORY 3,000 3,000 INFORMATION TECHNOLOGY 2,039,258 2,721,000 (681,742) HUMAN RESOURCES 501, , ,867 FINANCE and ACCOUNTING 572, , ,770 TOTAL CONTRACTS and CONSULTANTS 8,293,693 8,816,254 (522,561) *Includes Event Analysis and Situation Awareness Departments **Includes Critical Infrastructure and ES ISAC The over budget variance in the Reliability Standards Program was related to the NERC standards reform initiative which utilized outside expert consulting resources to review existing standards. These costs were funded from Unknown Contingency operating reserves. Compliance Operations Over budget $17.3k for outside consulting assistance in connection with the reliability assurance initiative. These costs were funded from the Unknown Contingency operating reserves. Reliability Assessments and Performance Analysis Over budget $72.9k primarily related to change orders in connection with improvements to the GADS and TADS databases and to evaluate the development of a web based replacement for pcgar. These costs were funded from the Unknown Contingency operating reserves. Critical Infrastructure Department Under budget $101.3k due to lower than budget expenses related to cyber risk preparedness assessments and outside contract and consulting support for deployment of the secure communications portal within the ES ISAC. North American Electric Reliability Corporation 2013 Audited Results Actual to Budget Variance Analysis 4
29 Reliability Risk Management Collectively under budget $98.8k for events analysis and situation awareness. The use of subject matter experts to support event analysis was not required, resulting in an under budget variance of $98.0k. Situation Awareness was $0.8k under budget due to lower than budgeted costs for additional industry user licensing fees for SAFNR, which were incurred in 2012 but budgeted in 2013, and due to lower than budgeted costs for the current secure alerts system, the replacement of which is included in NERC s 2014 budget. The under budget expenses related to SAFNR and the alerts system were offset by higher than budgeted network communication expenses for NERCnet. Training, Education and Operator Certification $244.4k under budget due to lower than budgeted expenses for consulting and contract support for (1) system operator exam development, (2) web based course development and, (3) course review in the continuing education program. Policy and External Affairs Under budget $110.8k due to reductions in external contract support and assumption of greater responsibilities by NERC staff. Information Technology Under expense budget $681.7k primarily due to: (1) the reclassification of expenses related to development of the BES Enterprise software application which was partially budgeted ($500k) as consulting and contract expense, but recorded in fixed assets as capitalized software and required expenditure of operating reserves as reflected in the operating reserve analysis; (2) the decision to delay expenditure of $250k for data warehouse design as the company continues to evaluate its requirements in connection with long term IT infrastructure and application planning; and (3) the decision to delay expenditure of $150k for disaster recovery to permit funding of other higher priority projects which required additional funding. The reduction in expense associated with these projects was offset by costs for development of the Event Information Data System (EIDS), which had been recorded in fixed assets during the course of 2013, but were reclassed as consulting and contract expense prior to finalizing the 2013 audited financial report and as described in the company s March 31, 2014 unaudited variance report which has been filed with the Commission. The total EIDS development cost incurred in 2013 was $638.8k and was funded through a combination of budgeted funds and Known Contingency Operating Reserves. Human Resources $212.9k over budget at year end, due primarily to higher than budgeted costs associated with staff and board compensation studies. Finance and Accounting $247.8k over budget to fund additional outside auditor support in connection with various risk management and internal control initiatives and for costs associated with the evaluation and implementation of upgrades to the company s accounting system. Rent $34.7k, 1.3%, under budget due to lower than budgeted straight line rent expense as a result of the refund of an excess tenant improvement associated with the expansion of the Atlanta office. North American Electric Reliability Corporation 2013 Audited Results Actual to Budget Variance Analysis 5
30 Office Costs, Professional Services and Miscellaneous Office Costs were $48.2k, 1.5%, over budget primarily due to higher than budgeted, (1) communication expenses (i.e. internet and cellular services), (2) equipment costs to support employee communications, and (3) equipment repair and service contracts related to NERC s leased offices in Atlanta and Washington, DC. These higher than budgeted expenses were offset by lower than budgeted costs related to copying, use taxes and merchant card fees. Professional Services were $74.0k, 3.2%, under budget due lower than budgeted use of outside counsel. The under budget variance for outside counsel expenses was offset by an increase in outside services expenses related to the implementation of a new travel and expense management system which will improve efficiency and internal controls. Miscellaneous expenses, which were $7.0k, 32.6%, under budget, consist of employee rewards and recognition expenses, costs associated with community responsibility activities, and charitable contributions. The total combined cost of year end employee recognition events in both Atlanta and DC was $13.4k. Depreciation was $366.1k, 23.2%, over budget due primarily to: (1) development costs of the Enterprise BES software application, which were partially budgeted as contract and consultant expense but recorded in fixed Assets as capitalized software; and (2) higher than budgeted amortization of leasehold improvements in NERC s Atlanta and Washington, DC offices. Other Non Operating Expenses, were over budget $153.2k, 306.3%, due primarily to recording as an expense the loss on retirement or disposal of certain fixed assets, principally assets in the situation room in Princeton which was closed in 2013, and the expense of moving certain of the assets to other NERC locations. Fixed Asset Purchases, excluding a credit for depreciation, were $734.5k, 41.5%, over budget primarily due to, (1) capitalization of the development costs of the Enterprise BES software application, as previously noted, and (2) furniture and leasehold improvement costs required for the approved increase in lease space for the Atlanta offices. As described in 2013 quarterly variance reports, the costs associated with the increase in lease space required for the Atlanta office was not fully known and was estimated at the time the budget was developed, but were within the range of projected expenditures at the time the lease amendment and associated improvements were authorized by the board and committee. Total costs also include the use of operating reserve funding for the standards balloting software (SBS) application and the Enterprise BES software application which are further detailed in the Operating Reserve Analysis and received necessary corporate authorizations in accordance with NERC s Working Capital and Operating Reserve Policy. Allocation of Indirect Expenses and Fixed Assets by Program Total direct expenses of the administrative programs were $24.4M, which was 1.3M, 5.8% over budget. Direct expenses were over budget primarily due to higher personnel expenses as a result of having more FTEs on staff than budgeted, the addition of senior staff, higher incentive compensation than budgeted, and an North American Electric Reliability Corporation 2013 Audited Results Actual to Budget Variance Analysis 6
31 increase in accrued, unused paid time off. The actual and budgeted allocations of indirect expenses by FTE were $202.0k and $172.9k, respectively, for an increase per FTE of $29.1k. Total fixed assets, net of depreciation for the administrative programs were ($272.1k), which was $569.9k, 191.4%, under budget. Total fixed assets was under budget primarily due to lower than budgeted purchases of capitalized computers and software in the Information Technology department as explained in more detail in the variance report for Informaton Technology that follows on page 21. Collectively, the total budget for administrative programs was $766.3k, 3.3% over budget. The actual and budgeted allocations of fixed assets net of depreciation by FTE were ($2.3k) and $2.2k, respectively for a decrease of $4.4k per FTE. The variances in indirect expenses and the allocation of fixed assets reflected in the variance reports by department are the result of the change in costs per FTE and the difference in actual versus budgeted FTE by department. Use of Statutory Funds for Non-Statutory Activities NERC does not have non statutory activities and therefore did not use statutory funds for non statutory activities. Board of Trustees Expenses The following table provides actual and budgeted expenses of the Board of Trustees. The amounts reflected in this table are included in the totals by expense category in the tables presented above. Trustee expenses were under budget $20.8k, 1.5%, primarily due to lower than budgeted trustee compensation, which was due to a reduction in the total number of independent trustees from eleven to ten, offset by an increase in trustee compensation as approved by the Board on August 15, Trustee travel expenses were over budget primarily due to 2012 travel expense that was recorded and reimbursed in Board of Trustee Expenses 2013 Actual 2013 Budget Variance Over (Under) % Meetings and Travel Expenses Quarterly Board Meetings 243, ,000 9, % Trustee Travel 166, ,000 11, % Total Board of Trustees Meetings and Travel Expenses 410, ,000 21, % Professional Services Independent Trustee Fees 931, ,000 (48,750) 5.0% Trustee Search Fees 6,495 6,495 Total Board of Trustee Professional Services Expenses 937, ,000 (42,255) 4.3% Total Board of Trustee Expenses 1,348,210 1,369,000 (20,790) 1.5% North American Electric Reliability Corporation 2013 Audited Results Actual to Budget Variance Analysis 7
32 Operating Reserve Analysis As detailed by the table on page 9, the use of Known Contingency Reserves included: (1) $209.0k for the development of the BES Enterprise software application, of which $50.1k in non capitalized costs was recorded in contracts and consultants and $772.2k was recorded as capitalized software 2 ; (2) $206.3k for EIDS 3 ; (3) consulting support for the Reliability Assurance Initiative and risk management audits, collectively $158.2k; and (4) implementation of additional back office accounting and expense management systems, together with consulting support, related to implementation of the FERC Audit recommendations, $92.7k. The use of Unknown Contingency Reserves included: (1) the Standards Overview Project, $160.6k; (2) GADS and TADS upgrades and maintenance and development of a webbased replacement application for pcgar, collectively $253.7k; (3) a total of $164.2k in costs in excess of the tenant improvement allowance associated with an increase in lease space for the Atlanta office, of which $49.6k was recorded as operating expenses and $114.6k of which was recorded in fixed assets 4 ; and (4) $5.1k development of the SBS application, which was not specifically budgeted but was available from reserves due to under runs in the IT capital budget which were transferred to reserves 5. The working capital and operating reserve analysis reflects that NERC s 2013 approved budget included a reduction in assessments associated with the return of $2,033,600 in excess working capital and operating reserves, which would be funded from $1,686,310 from Unknown Contingency Reserves and $347,290 from the System Operator Reserves. The actual reduction in excess working capital and operating reserves was $2,193,106, of which $2,106,494 came from Known and Unknown Contingency Reserves 6 and $86,613 came from the System Operator Reserves. The lower than budgeted reduction in System Operator reserves, ($86,613 compared to the budgeted reduction of $347,290) was due primarily to (1) higher than budgeted funding from testing fees and certificate renewals, and (2) lower than budgeted Contract and Consultant expenses related to exam development. 2 The total amount budgeted in contracts and consultants was $613.3k. 3 The total cost of EIDS in 2013 was $638.8k. The total amount budgeted in contracts and consultants and fixed assets was $432.5k 4 As previously reported, the total cost of construction, furniture, equipment, leasehold improvements, and operating expenses was $915,162. The tenant improvement allowance was $751,007. The difference between these two figures of $164,155 represents the total cash outlay by NERC for the build out of the additional leased space. 5 Total 2013 development costs of SBS was $250.1, $245k of which was funded from the IT capital budget. 6 The $2,365,855 reduction in excess working capital and operating reserves from budgeted operations and the use of known and unknown contingencies was offset by the $172,749 adjustment to reserves related to the excess tenant improvement allowance associated with expansion of NERC s Atlanta office. North American Electric Reliability Corporation 2013 Audited Results Actual to Budget Variance Analysis 8
33 OPERATING RESERVE ANALYSIS 2013 Actual 2013 Budget Generation (Use) of Reserves 2013 Generation (Use) of Reserves in Excess of Budget Known Contingency Reserves Unknown Contingency Reserves 1 System Operator Reserves Beginning Working Capital and Operating Reserves Balance as of 12/31/12 per audit 8,305,675 5,440,748 2,864,927 Less: Adjustment for future liabilities (3,665,375) (3,665,375) Available Working Capital and Operating Reserves 4,640,300 5,440,748 (800,448) 1,000,000 2,036,821 1,603,479 (1) Generation (Use) of Operating Reserves from Budgeted Operations Funding 52,262,956 52,252,656 10,300 10,300 Personnel (32,113,505) (31,298,405) (815,101) (815,101) Meetings, Travel and Conference Calls (3,414,306) (4,098,310) 684, ,005 Contracts and Consultants (6,504,577) (7,417,968) 913, ,391 Operating Expenses (excl. contracts, consultants & depreciation) (8,057,549) (8,214,186) 156, ,250 (86,613) Non Operating Expenses (103,456) (50,000) (53,456) (53,456) Fixed Assets (excluding depreciation) (1,336,565) (1,444,600) 108, ,035 Total Operating Reserves Generated(Used) from Budgeted Operations 732,999 (270,814) 1,003,812 1,090,425 (86,613) (2) Additions to Operating Reserves Services and Software Fees not budgeted 86,075 86,075 86,075 Total Additions to Operating Reserves 86,075 86,075 86,075 (3) Expenditures of Operating Reserves Contracts and Consultants NERC Standards Overview Project (310,600) (150,000) (160,600) (160,600) GADS and TADS Change Management and Consulting (269,479) (80,000) (189,479) (189,479) pcgar web based application development (64,225) (64,225) (64,225) BES non capitalized costs (50,150) (613,286) 563, ,136 EIDS (638,755) (350,000) (288,755) (288,755) Reliability Assurance Initiative and Other Auditing (363,232) (205,000) (158,232) (158,232) Systems review and implementation (FERC Audit) (92,675) (92,675) (92,675) Subtotal (1,789,116) (1,398,286) (390,830) 23,474 (414,304) Operating Expenses Travel and invoice system implementation (76,452) (37,000) (39,452) (39,452) Atlanta Office Expansion (49,587) (49,587) (49,587) Subtotal (126,039) (37,000) (89,039) (39,452) (49,587) Other Non Operating Expenses Disposal of assets (99,708) (99,708) (99,708) Subtotal (99,708) (99,708) (99,708) Fixed Assets SAS Software Upgrade (33,190) (33,190) (33,190) Atlanta Office Expansion net in excess of TIA (114,568) (114,568) (114,568) ERO Applications BES Exceptions Capitalized Costs (772,177) (772,177) (772,177) ERO Applications EIDS (82,500) 82,500 82,500 Standards Balloting Software (250,131) (245,000) (5,131) (5,131) Subtotal (1,170,066) (327,500) (842,566) (689,677) (152,889) Total Expenditure of Operating Reserves (3,184,929) (1,762,786) (1,422,143) (705,655) (716,488) (4) Net Expenditure of Operating Reserves (3,098,855) (1,762,786) (1,336,069) (705,655) (630,414) Total Generation (Use) of Operating Reserves (2,365,855) (2,033,600) (332,256) (705,655) 460,011 (86,613) TOTAL Operating Reserves 2013 Reserve Balance Beginning Balance 1/1/2013 4,640,300 5,440,748 (800,448) 1,000,000 2,036,821 1,603,479 Generation (Use) from Budgeted Operations 732,999 (270,814) 1,003, ,612 (86,613) Generation (Use) Known and Unknown Contingency Reserve (3,098,855) (1,762,786) (1,336,069) (705,655) (2,393,200) Other adjustments to reserves 2 172, , ,749 Balance 12/31/13 2,447,194 3,407,148 (959,955) 294, ,982 1,516,866 1 The use of Unknown Contingency Reserves includes the $1,686,310 budgeted reduction in reserves. The 2013 budget also included a $347,290 planned reduction in the System Operator Reserves, for a total budgeted reduction in reserves of $2,033, Represents transactions recorded only on the Statement of Financial Position (balance sheet) and do not impact the Statement of Activities (income statement), including true up of current versus non current deferred rent obligation. The increase to reserves in 2013 was due to excess tenant improvement allowance received as part of NERC's expansion in the Atlanta office. North American Electric Reliability Corporation 2013 Audited Results Actual to Budget Variance Analysis 9
34 NORTH AMERICAN ELECTRIC RELIABILITY CORPORATION Statement of Activities and Fixed Assets (Audited) For the period ended 12/31/ Actual 2013 Budget 2013 Variance Over(Under) % Funding Assessments 47,604,156 47,604,156 0 Penalties 2,512,500 2,512,500 (0) Testing 1,822,154 1,680, ,154 Services & Software 86,075 86,075 Workshop Fees 320, ,000 (115,275) Interest 3,197 20,000 (16,803) Miscellaneous A Total Funding 52,349,031 52,252,656 96, % Expenses Personnel Expenses Salaries 25,465,466 24,056,166 1,409,301 Payroll Taxes 1,527,728 1,459,710 68,018 Employee Benefits 2,867,337 3,079,941 (212,604) Savings & Retirement 2,252,973 2,702,588 (449,615) Total Personnel Expenses 32,113,505 31,298, , % Meeting Expenses Meetings 1,105,734 1,042,000 63,734 Travel 2,001,968 2,738,500 (736,532) Conference Calls 306, ,810 (11,207) Total Meeting Expenses 3,414,306 4,098,310 (684,005) 16.7% Operating Expenses Consultants and Contracts 8,293,693 8,816,254 (522,561) Rent & Improvements 2,722,106 2,756,840 (34,734) Office Costs 3,229,693 3,181,515 48,178 Professional Services 2,217,307 2,291,331 (74,024) Miscellaneous 14,482 21,500 (7,018) Depreciation 1,945,946 1,579, ,145 Total Operating Expenses 18,423,226 18,647,242 (224,015) 1.2% Other Non Operating Expenses 203,164 50, , % Indirect Expenses B Total Expenses 54,154,201 54,093,957 60, % =A B Net Change in Assets (1,805,170) (1,841,301) 36, % Fixed Assets Depreciation (1,945,946) (1,579,801) (366,145) Computer & Software CapEx 1,536,218 1,556,100 (19,882) Furniture & Fixtures CapEx 354, ,745 Equipment CapEx 540, , ,478 Leasehold Improvements 75,189 75,189 Allocation of Fixed Assets C Incr(Dec) in Fixed Assets 560, , , % =B+C Total Budget (Expenses plus Incr(Dec) in Fixed Assets) 54,714,886 54,286, , % =A B C Change in Operating Reserves (Total Funding less Total Budget) (2,365,855) (2,033,600) (332,256) 16.3% FTE's (11.50) 6.2% North American Electric Reliability Corporation 2013 Audited Results Actual to Budget Variance Analysis 10
35 North American Electric Reliability Corp 2013 Statement of Activities and Fixed Asset Budget STANDARDS Variance Actual Budget Over(Under) % Comments (Explain variances < +/ 10% and $10,000) Funding Assessments 9,156,330 9,156, % Penalties 510, , % Testing Services & Software Workshop Fees 99, ,000 (4,750) 4.6% Interest 688 3,970 (3,282) 82.7% Miscellaneous Total Funding 9,767,104 9,775,088 (7,984) 0.1% Expenses Personnel Expenses Salaries 3,428,381 3,335,519 92, % Payroll Taxes 215, ,052 2, % Employee Benefits 371, ,484 21, % Savings & Retirement 328, ,334 (34,098) 9.4% Total Personnel Expenses 4,343,281 4,261,389 81, % Meeting Expenses Meetings 224, ,000 60, % Lower than budgeted salaries due to fewer FTEs was offset by higher than budgeted incentive compensation as explained in the cover letter, and costs related to temporary office services which was budgeted in HR. Relocation and education benefits budgeted in HR, offset by lower than budgeted health benefits. Under budget due to timing of hiring and later eligibility in the plan Standards/Compliance workshop expense $30k higher than budgeted, but largely offset by workshop fees; and meetings of standards drafting teams $30k higher than budgeted Travel 352, ,500 (20,418) Due to having fewer telecommuters and management initiatives 5.5% to lower overall corporate travel Conference Calls 117, ,500 9, % Total Meeting Expenses 694, ,000 49, % Operating Expenses Consultants and Contracts 310, , , % Higher than budget due to costs of standards overview project. Rent & Improvements Office Costs 78,654 77, % Professional Services Miscellaneous (0) 0.0% Depreciation 2,324 2,324 Total Operating Expenses 392, , , % Other Non Operating Expenses 0.0% Indirect Expenses 5,252,332 4,581, , % Total Expenses 10,682,199 9,715, , % Net Change in Assets (915,094) 59,108 (974,203) Fixed Assets Depreciation (2,324) (2,324) Computer & Software CapEx 252, ,330 $245k Funded SBS from IT capital budget that was released to reserves and laptop purchase, also budgeted in IT Furniture & Fixtures CapEx Equipment CapEx Leasehold Improvements Allocation of Fixed Assets (58,544) 59,108 (117,652) Incr(Dec) in Fixed Assets 191,462 59, , % Total Budget 10,873,661 9,775,088 1,098, % Change in Working Capital (1,106,556) 0 (1,106,556) FTE's (0.50) 1.9% Due to staff vacancies December,
36 North American Electric Reliability Corp 2013 Statement of Activities and Fixed Asset Budget COMPLIANCE OPERATIONS, ORGANIZATION REGISTRATION, and INVESTIGATIONS 2013 Actual 2013 Budget Funding Assessments 8,422,798 8,422, % Penalties 462, , % Testing Services & Software 2013 Variance Over(Under) % Comments (Explain variances < +/ 10% and $10,000) Workshop Fees 40,000 Compliance auditor workshop held at Regional Office so no fees (40,000) 100.0% were charged Interest 599 3,595 (2,996) 83.3% Miscellaneous Total Funding 8,886,040 8,928,994 (42,954) 0.5% Expenses Personnel Expenses Salaries 3,263,844 3,202,041 61, % Payroll Taxes 200, ,103 (1,266) 0.6% Primarily due to education, training, relocation and other employee benefits which were budgeted in HR but recorded in the employee's Employee Benefits 382, ,580 56, % home department. Savings & Retirement 299, ,031 (68,655) 18.7% Due to fewer FTEs and timing of hiring which impacts eligibility Total Personnel Expenses 4,146,204 4,097,755 48, % Meeting Expenses Meetings 79,986 80,000 (14) 0.0% Travel 294, ,500 (146,197) Due to having fewer FTEs on staff, fewer telecommuters, and 33.2% various management initiatives to reduce overall travel expenses Conference Calls 12,077 34,235 (22,158) The budget for conference calls was based upon historical usage, which was lower in 2013 than prior years. Also, $12.1k for conference calls related to the Operating Committee were recorded in the Events Analysis department because the employee liason to 64.7% the committee transferred to that department in Total Meeting Expenses 386, ,735 (168,369) 30.4% Operating Expenses Consultants and Contracts 17,282 17,282 Rent & Improvements Office Costs 57,358 73,424 (16,066) Telephone, office supplies, and dues were under budget $18k; offset 21.9% by $2k office costs that were over budget. Professional Services 7,529 7,529 Meeting and interview transcripts that was not budgeted Miscellaneous 500 (500) 100.0% Depreciation 64,869 60,630 4, % Total Operating Expenses 147, ,554 12, % Other Non Operating Expenses 4,017 4,017 Loss from disposal of assets Indirect Expenses 4,571,549 4,149, , % Total Expenses 9,255,174 8,936, , % Net Change in Assets (369,134) (7,098) (362,036) Fixed Assets Depreciation (64,869) (60,630) (4,239) 7.0% Computer & Software CapEx Furniture & Fixtures CapEx Equipment CapEx Leasehold Improvements Allocation of Fixed Assets (50,956) 53,532 (104,488) Incr(Dec) in Fixed Assets (115,825) (7,098) (108,727) % Total Budget 9,139,348 8,928, , % Change in Working Capital (253,309) 0 (253,309) Due to staff vacancies and transfer of 1 position to another FTE's (1.37) 5.7% department December,
37 North American Electric Reliability Corp 2013 Statement of Activities and Fixed Asset Budget COMPLIANCE ENFORCEMENT Variance Actual Budget Over(Under) % Comments (Explain variances < +/ 10% and $10,000) Funding Assessments 6,317,083 6,317, % Penalties 404, , % Testing Services & Software Workshop Fees Interest 413 3,146 (2,733) 86.9% Miscellaneous Total Funding 6,722,300 6,725,004 (2,704) 0.0% Expenses Personnel Expenses Salaries 1,854,459 2,152,370 (297,910) 13.8% Payroll Taxes 115, ,794 (25,505) 18.1% Employee Benefits 199, ,882 (75,748) 27.6% Savings & Retirement 188, ,200 (58,676) 23.7% Total Personnel Expenses 2,357,406 2,815,246 (457,839) 16.3% Meeting Expenses Meetings 4,704 5,000 (296) 5.9% Travel 42, ,000 (143,523) 77.2% Conference Calls 3,950 3,950 Total Meeting Expenses 51, ,000 (139,869) 73.2% Operating Expenses Consultants and Contracts Rent & Improvements Due to open positions and transfers to other departments and management initiatives to reduce costs Office Costs 26,116 41,000 (14,884) Primarily due to lower telecommunications costs due to 36.3% having fewer FTEs on staff Professional Services Miscellaneous 500 (500) 100.0% Depreciation 2,724 2,724 Total Operating Expenses 28,840 41,500 (12,660) 30.5% Other Non Operating Expenses Indirect Expenses 3,155,439 3,630,417 (474,978) 13.08% Total Expenses 5,592,816 6,678,163 (1,085,347) 16.3% Net Change in Assets 1,129,484 46,841 1,082,643 Fixed Assets Depreciation (2,724) (2,724) Computer & Software CapEx 2,199 2,199 Laptop purchase budgeted in IT Furniture & Fixtures CapEx Equipment CapEx Leasehold Improvements Allocation of Fixed Assets (35,172) 46,841 (82,013) Incr(Dec) in Fixed Assets (35,697) 46,841 (82,538) 176.2% Total Budget 5,557,119 6,725,004 (1,167,885) 17.4% Change in Working Capital 1,165, ,165,181 Due to open positions and transfers to other departments, all personnel costs are under budget. FTE's (5.38) 25.6% Due to staff vacancies and transfers to other departments December,
38 North American Electric Reliability Corp 2013 Statement of Activities and Fixed Asset Budget RELIABILITY ASSESSMENTS and PERFORMANCE ANALYSIS 2013 Actual 2013 Budget Funding Assessments 7,358,220 7,358, % Penalties 361, , % Testing Services & Software 82,500 82, Variance Over(Under) % Comments (Explain variances < +/ 10% and $10,000) The 2013 budget did not include anticipated funding from licensing GADS software to third parties because there were no plans to actively pursue this source of funding. The funding received is reflected in the Operating Reserve Analysis as an addition to the Unknown Contingence Reserve. Workshop Fees 16,900 40,000 (23,100) The budget was for a GADS workshop that was not offered in The funding received was for a modeling workshop that was not 57.8% planned. Interest 445 2,809 (2,364) 84.2% Miscellaneous Total Funding 7,819,503 7,762,436 57, % Expenses Personnel Expenses Salaries 2,395,766 2,429,590 (33,823) 1.4% Payroll Taxes 149, ,215 (1,036) 0.7% Employee Benefits 263, , % Savings & Retirement 210, ,736 (59,064) Due to fewer FTEs and timing of hiring which impacts eligibility in the 21.9% plan Total Personnel Expenses 3,019,253 3,112,303 (93,050) 3.0% Meeting Expenses Meetings 114,636 78,000 36, % Additional GMD and RISC meetings that were not budgeted Travel 309, ,000 (100,535) Due to having fewer telecommuters and management initiatives to 24.5% lower overall corporate travel Conference Calls 28,384 31,950 (3,566) 11.2% Total Meeting Expenses 452, ,950 (67,465) 13.0% Operating Expenses Consultants and Contracts 757, ,000 72,899 Primarily related to change orders in connection with improvements to the GADS and TADS databases and to evaluate the development of 10.6% a web based replacement for pcgar. Rent & Improvements Office Costs 122, ,416 (39,334) Telecommunications under budget $11.1k primarily due to fewer FTEs on staff; Maintenance & service agreements $20.65k under budget 24.4% due to lower cost of software used in modeling and asset tracking Professional Services Miscellaneous (242) 48.5% Depreciation 154,643 37, ,193 The BES database was partially budgeted as Contract and Consultinig expense in IT, but was recorded as capitalized software. Depreciation 312.9% began in July when the asset was put into production. Total Operating Expenses 1,034, , , % Other Non Operating Expenses Indirect Expenses 3,397,854 3,241, , % Total Expenses 7,904,473 7,758, , % Net Change in Assets (84,970) 4,372 (89,344) % Fixed Assets Depreciation (154,643) (37,450) (117,193) 312.9% Depreciation of the BES database which was not budgeted See above Computer & Software CapEx 810, ,517 Furniture & Fixtures CapEx Equipment CapEx Leasehold Improvements Allocation of Fixed Assets (37,874) 41,822 (79,696) Incr(Dec) in Fixed Assets 618,000 4, ,628 Total Budget 8,522,473 7,762, , % Change in Working Capital (702,970) (0) (702,970) FTE's (1.93) 10.3% Due to staff vacancies $772.2k for development of BES exception database which was partially budgeted as an expense; $31k for SAS Software; and laptop purchase budgeted in IT December,
39 North American Electric Reliability Corp 2013 Statement of Activities and Fixed Asset Budget TRAINING, EDUCATION and OPERATOR CERTIFICATION 2013 Actual 2013 Budget Funding Assessments 1,449,793 1,449, % Penalties 93,484 93, % Testing 1,822,154 1,680, , % Services & Software Workshop Fees Interest 182 1,199 (1,017) 84.8% Miscellaneous Total Funding 3,365,625 3,224, , % Expenses Personnel Expenses 2013 Variance Over(Under) % Comments (Explain variances < +/ 10% and $10,000) Salaries 648, ,645 (188,674) Due to staff vacancies and lower than budget average salaries due to 22.5% evaluation of future requirments for open positions Payroll Taxes 55,655 54,087 1, % Employee Benefits 111, ,396 (762) 0.7% Savings & Retirement 57,056 94,203 (37,147) 39.4% Due to fewer FTEs and timing of hiring that impacts eligibility in the plan Total Personnel Expenses 873,315 1,098,331 (225,015) 20.5% Meeting Expenses Meetings 53,277 30,000 23, % Travel 45,692 70,000 (24,308) 34.7% Conference Calls 33,257 27,000 6, % Total Meeting Expenses 132, ,000 5, % Operating Expenses The Personnel Certification Governance Committee (PCGC) held quarterly meetings at hotels which in prior years had been held via conference call Less travel than budgeted due to management initiative to lower total corporate travel expense. The Training department increased training opportunities for NERC employees through the use of webinars. Consultants and Contracts 604, ,574 (244,360) Under budget primarily due to lower than budgeted expenses for consulting and contract support for (1) system operator exam development, (2) webbased course development and, (3) course review in the continuing 28.8% education program Rent & Improvements Office Costs 85,908 96,500 (10,592) $3.4k due to lower telecommunications costs; $3k due to lower merchant 11.0% credit card fees; $2.7k lower dues and subscription expenses Professional Services Miscellaneous (420) 84.0% Depreciation Total Operating Expenses 690, ,574 (254,892) 27.0% Other Non Operating Expenses Indirect Expenses 1,387,828 1,383,016 4, % Total Expenses 3,084,051 3,553,921 (469,870) 13.2% Net Change in Assets 281,574 (329,445) 611, % Fixed Assets Depreciation (480) (480) Computer & Software CapEx Furniture & Fixtures CapEx Equipment CapEx 9,595 9,595 Equipment purchased for producing training materials that can be saved and posted on NERC's website and internal intranet for future use Leasehold Improvements Allocation of Fixed Assets (15,469) 17,844 (33,313) Incr(Dec) in Fixed Assets (6,354) 17,844 (24,198) 135.6% Total Budget 3,077,697 3,571,765 (494,068) 13.8% Change in Working Capital 287,928 (347,289) 635, % FTE's (1.13) 14.1% Due to staff vacancies December,
40 North American Electric Reliability Corp 2013 Statement of Activities and Fixed Asset Budget EVENT ANALYSIS Variance Actual Budget Over(Under) % Comments (Explain variances < +/ 10% and $10,000) Funding Assessments 3,501,894 3,501,894 Penalties 183, ,113 Testing Services & Software Workshop Fees 43,650 52,000 (8,350) Fees collected for Human Performance Workshop less than budgeted. The cost of the workshop, recorded as Meetings 16.1% Expense, was under budget $5k. Interest 269 1,423 (1,154) 81.1% Miscellaneous Total Funding 3,728,945 3,738,430 (9,485) 0.3% Expenses Personnel Expenses FTEs were over budget 7% due to transfer of staff from another department. Personnel expenses are 18% higher Salaries 1,612,923 1,340, , % because the 2013 budget for personnel expenses included a 3% reduction in salaries, payroll taxes and retirement costs Payroll Taxes 94,740 82,107 12, % to budget for attrition and timing of new hires, but the 3% reduction was not applied to budgeted FTEs. Salaries Employee Benefits 129, ,336 4, % expense was also higher due to higher than budgeted Savings & Retirement 168, ,189 15, % incentive compensation. Higher salaries expense also Total Personnel Expenses 2,005,644 1,701, , % contributed to higher retirement expenses. Meeting Expenses Meetings 76,184 62,000 14, % Travel 132, ,000 (22,042) 14.2% Conference Calls 12,519 12,519 Total Meeting Expenses 221, ,000 4, % Operating Expenses Consultants and Contracts 22, ,000 (97,950) 81.6% Rent & Improvements Office Costs 32,606 36,100 (3,494) 9.7% Professional Services Miscellaneous % Depreciation Total Operating Expenses 56, ,600 (100,193) 64.0% Other Non Operating Expenses Indirect Expenses 2,054,470 1,642, , % Total Expenses 4,338,183 3,717, , % Net Change in Assets (609,238) 21,190 (630,426) Fixed Assets Depreciation (842) (842) Computer & Software CapEx Furniture & Fixtures CapEx Equipment CapEx Leasehold Improvements Allocation of Fixed Assets (22,900) 21,190 (44,090) Incr(Dec) in Fixed Assets (23,742) 21,190 (44,932) 212.0% Meetings of the Operating Committee were budgeted in another department resulting in an over budget variance of $19.2k; offset by $5k under budget cost of the Human Performance workshop as noted above. Primarily due to management initiatives to reduce overal travel expense. Conference calls were collectively budgeted in Compliance Operations due to the lack of historical data to support an allocation to Event Analysis The use of subject matter experts to support event analysis was not required Total Budget 4,314,441 3,738, , % Change in Working Capital (585,495) (0) (585,495) FTE's % Staff transfer from another department December,
41 North American Electric Reliability Corp 2013 Statement of Activities and Fixed Asset Budget SITUATION AWARENESS Variance Actual Budget Over(Under) % Comments (Explain variances < +/ 10% and $10,000) Funding Assessments 5,093,049 5,093, % Penalties 125, , % Testing Services & Software 3,575 3,575 FIST Royalties and TSIN fees not budgeted due to unpredictability NASPI workshop fees lower than budgeted due to elimination of 1 Workshop Fees 88, ,000 (16,595) 15.8% of 3 planned workshops Interest (843) 86.6% Miscellaneous 9 9 Total Funding 5,310,457 5,324,311 (13,854) 0.3% Expenses Personnel Expenses Salaries 662, ,927 (194,802) 22.7% Lower salaries and payroll tax expense due to having fewer FTE's Payroll Taxes 43,913 56,925 (13,011) 22.9% on staff than budgeted Employee Benefits 106,891 87,659 19,232 Medical and Dental $8.7k under budget due to fewer FTEs; offset by $24k in costs for education and relocation benefits that were 21.9% budgeted in HR Savings & Retirement 50,303 98,496 (48,194) Due to fewer FTEs and timing of hiring that impacts eligibility in 48.9% the plan Total Personnel Expenses 863,231 1,100,007 (236,775) 21.5% Meeting Expenses Meetings 107, ,000 (90,509) 45.7% Budget included three NASPI workshops but only two were held and the department held all other meetings in NERC's offices rather than hotels Travel 29,235 72,500 (43,265) 59.7% Conference Calls 2,544 24,175 (21,631) 89.5% Total Meeting Expenses 139, ,675 (155,405) 52.7% Operating Expenses Due to open positions and management initiatives to lower overall travel costs The budget for conference calls was based upon historical usage. In prior years, the Situation Awareness and Critical Infrastructure (CID) departments were combined. This under budget variance is offset by the over budget variance in CID. Consultants and Contracts 2,742,361 2,743,180 (819) 0.0% Rent & Improvements Office Costs 40,145 47,750 (7,605) 15.9% Professional Services Miscellaneous 500 (500) 100.0% Depreciation 4,645 7,395 (2,750) 37.2% Total Operating Expenses 2,787,151 2,798,825 (11,674) 0.4% Primarily due to lower telecommunications costs due to having fewer FTEs on staff. Other Non Operating Expenses 56,346 56,346 Primarily due to loss on disposal of assets in the situation room in the Princeton office which was closed in 2013 Indirect Expenses 997,943 1,123,701 (125,758) 11.2% Total Expenses 4,843,942 5,317,208 (473,266) 8.9% Net Change in Assets 466,515 7, , % Fixed Assets Depreciation (4,645) (7,395) 2, % Computer & Software CapEx 2,155 2,155 Laptop purchase budgeted in IT Furniture & Fixtures CapEx Equipment CapEx Leasehold Improvements Allocation of Fixed Assets (11,123) 14,498 (25,621) Incr(Dec) in Fixed Assets (13,613) 7,103 (20,716) 291.7% Total Budget 4,830,328 5,324,311 (493,982) 9.3% Change in Working Capital 480, ,128 FTE's (1.56) 24.0% Due to staff vacancies December,
42 North American Electric Reliability Corp 2013 Statement of Activities and Fixed Asset Budget CRITICAL INFASTRUCTURE and ES ISAC 2013 Actual 2013 Budget Funding Assessments 7,991,299 7,991, % Penalties 371, , % Testing Services & Software 2013 Variance Over(Under) % Comments (Explain variances < +/ 10% and $10,000) Workshop Fees 72,520 95,000 (22,480) Lower than budgeted fees collected for the Grid Security Conference. As noted below under Meetings, the expense of 23.7% the conference was under budget $34k. Interest 471 2,884 (2,413) 83.7% Miscellaneous Total Funding 8,435,367 8,460,227 (24,860) 0.3% Expenses Personnel Expenses Salaries 2,838,325 2,853,871 (15,546) 0.5% Payroll Taxes 165, ,586 (7,447) 4.3% Education, training, relocation and parking/mass transit benefits budgeted in HR and collectively $54.59k over budget; offset by Employee Benefits 294, ,885 43, % medical, life, and other benefits $11.40k under budget Savings & Retirement 288, ,315 (23,496) Due to fewer FTEs and timing of hiring which affects eligibility in 7.5% the plan Total Personnel Expenses 3,586,418 3,589,657 (3,239) 0.1% Meeting Expenses The cost of CIPC meetings was $10k over budgeted, offset by Meetings 120, ,000 (24,352) 16.8% $34k Grid Security Conference that was under budget Fewer FTEs on staff than budgeted and lower costs due to Travel 278, ,000 (141,372) 33.7% management initiatives to lower total corporate travel expense Conference Calls 40,831 24,000 16,831 The budget for conference calls was based upon historical usage. In prior years, the Situation Awareness and Critical Infrastructure (CID) departments were combined. This over budget variance is offset by the over budget variance in 70.1% Situation Awareness. Total Meeting Expenses 440, ,000 (148,893) 25.3% Operating Expenses Consultants and Contracts 683, ,000 (101,333) Lower than budgeted expenses related to cyber risk preparedness assessments and outside contract and consulting support for deployment of the secure communications portal 12.9% within the ES ISAC Rent & Improvements Office Costs 128, ,250 3, % Professional Services Miscellaneous 500 (500) Depreciation 16,602 16,602 Depreciation of capitalized software supporting the ES ISAC that was purchased after the 2013 budget was developed. Total Operating Expenses 828, ,750 (81,757) 9.0% Other Non Operating Expenses Indirect Expenses 3,597,847 3,327, , % Total Expenses 8,453,365 8,417,290 36, % Net Change in Assets (17,998) 42,937 (60,936) 141.9% Fixed Assets Depreciation (16,602) (16,602) Depreciation of capitalized software supporting the ES ISAC that was purchased after the 2013 budget was developed. Computer & Software CapEx Furniture & Fixtures CapEx Equipment CapEx Leasehold Improvements 3,159 3,159 Improvements specifically related to ES ISAC Allocation of Fixed Assets (40,103) 42,937 (83,040) Incr(Dec) in Fixed Assets (53,546) 42,937 (96,483) 224.7% Total Budget 8,399,819 8,460,227 (60,407) 0.7% Change in Working Capital 35,547 (0) 35,547 0 FTE's (1.44) 7.5% Due to staff vacancies December,
43 GENERAL and ADMINISTRATIVE, including Executive and Policy & External Affairs 2013 Actual North American Electric Reliability Corp 2013 Statement of Activities and Fixed Asset Budget 2013 Budget Funding Assessments (1,686,309) (1,686,309) 0.0% Penalties Testing Services & Software Workshop Fees Interest Miscellaneous Total Funding (1,686,309) (1,686,309) 0.0% Expenses Personnel Expenses 2013 Variance Over(Under) % Comments (Explain variances < +/ 10% and $10,000) Salaries 2,477,017 1,342,080 1,134, % Payroll Taxes 113,386 60,640 52, % Due to additional FTEs on staff Employee Benefits 286, , , % Due to additional FTEs on staff Savings & Retirement 92, ,179 (82,585) 47.1% Total Personnel Expenses 2,969,592 1,734,136 1,235, % Meeting Expenses Due to transfers from other departments, addition of senior management, higher than budgeted incentive compensation, increase in accrued but unpaid vacation expense and the 3% reduction in the 2013 budgeted expenses to adjust for attrition Higher retirement expenses due to having additional FTEs on staff was offset by forfeited unvested benefits Meetings 305, ,000 45, % Travel 332, ,000 10, % Conference Calls 28,633 57,500 (28,868) 50.2% Total Meeting Expenses 665, ,500 26, % Operating Expenses The cost of BOT meetings was approximately $10k over budget; $15k sponsorship of Electric Infrastructure Security Council not budgeted; and $21.1k participation in Canadian Electricity Assoc cross border forum, also not budgeted Conference call expense was budgeted based upon historical average. Decreased usage in 2013 from prior years. Consultants and Contracts 39, ,000 (110,777) 73.9% Rent & Improvements 2,722,106 2,756,840 (34,734) 1.3% Due to reductions in external contract support for Policy & External Affairs department and assumption of greater responsibilities by NERC staff Office Costs 392, ,000 (114,563) Office supplies, computer supplies, and equipment maintenance and repair were collectively $75k over budget, offset by under 22.6% budget variances in all other expenses in this category Professional Services 1,116,638 1,132,053 (15,415) 1.4% Miscellaneous 1,279 5,500 (4,221) 76.7% Primarily due to higher than budgeted amortization of leasehold Depreciation 489, , , % improvements Total Operating Expenses 4,761,172 4,901,919 (140,747) 2.9% Other Non Operating Expenses 66,385 50,000 16,385 Loss from disposal of assets and cost to move remaining useable equipment from Princeton to other NERC offices Indirect Expenses (8,463,012) (7,325,556) (1,137,456) 15.5% Total Expenses (0) (0) % Net Change in Assets (1,686,309) (1,686,309) (0) 0.0% Fixed Assets Depreciation (489,488) (350,526) (138,962) 39.6% See above Computer & Software CapEx 2,199 2,199 Laptop purchase budgeted in IT Furniture & Fixtures CapEx 354, ,745 Furniture for the expansion of the Atlanta office Equipment CapEx Leasehold Improvements 72,030 72,030 Expansion of Atlanta office Allocation of Fixed Assets 60, ,526 (290,013) Incr(Dec) in Fixed Assets (0) (0) Total Budget (0) (0) 0 Change in Working Capital (1,686,309) (1,686,309) (0) 0.0% FTE's % Transfers from other department December,
44 North American Electric Reliability Corp 2013 Statement of Activities and Fixed Asset Budget LEGAL and REGULATORY Variance Actual Budget Over(Under) % Comments (Explain variances < +/ 10% and $10,000) Funding Assessments Penalties Testing Services & Software Workshop Fees Interest Miscellaneous Total Funding Expenses Personnel Expenses Salaries 2,536,703 2,325, ,410 9% Payroll Taxes 149, ,177 30,125 25% Employee Benefits 227, ,835 41,825 23% Savings & Retirement 217, ,724 (44,221) 17% Total Personnel Expenses 3,131,168 2,892, ,138 8% Meeting Expenses Meetings 10,572 5,000 5,572 Meetings of the ERO Legal Group were not included in the 111% budget due to being newly formed and lack of historical data Travel 83, ,500 (61,051) Less travel due to management initiative to lower overall 42% corporate travel expenses Conference Calls 10,724 3,200 7,524 Conference call expense was budgeted based upon historical 235% average. Increased usage in 2013 from prior years. Total Meeting Expenses 104, ,700 (47,955) 31% Operating Expenses Consultants and Contracts 3,000 3,000 Industry survey related to the 5 Yr performance assessment Rent & Improvements Office Costs 68,053 50,500 17,553 35% Telephone expense and subscription/publication expense higher than budgeted Professional Services 735, ,000 (214,193) All outside counsel fees are budgeted in Legal, but actual fees charged to department managing the engagement. In total, 23% NERC was under budget for outside counsel fees $104.4k. Miscellaneous (136) 27% Depreciation 3,380 3,380 Total Operating Expenses 810,604 1,001,000 (190,396) 19% Other Non Operating Expenses Indirect Expenses (4,046,516) (4,045,729) (787) 0.02% Total Expenses 0 0 (0) 59% Net Change in Assets (0) (0) 0 59% Fixed Assets Depreciation (3,380) (3,380) Computer & Software CapEx 4,310 4,310 Laptop purchases budgeted in IT Furniture & Fixtures CapEx Equipment CapEx Leasehold Improvements Allocation of Fixed Assets (929) (929) Incr(Dec) in Fixed Assets 0 0 Total Budget 0 0 (0) Change in Working Capital (0) (0) 0 0 FTE's (0.20) The budget for salaries, payroll taxes and retirment expenses were reduced by 3% based upon estimated attrition and timing of hiring, but the reduction was not applied to budgeted FTEs. This department was fully staffed in 2013, resulting in the over budget variance for salaries and payroll taxes. Payroll taxes are also higher due to higher maximum salary subject to FICA tax. Retirement expense was under budget due to timing of hiring which affects elibility. Employee benefits was over budget primarily due to education, training and other benefits that were budgeted in HR. December,
45 North American Electric Reliability Corp 2013 Statement of Activities and Fixed Asset Budget INFORMATION TECHNOLOGY 2013 Actual Expenses Personnel Expenses 2013 Budget 2013 Variance Over(Under) % Comments (Explain variances < +/ 10% and $10,000) Salaries 1,787,073 1,651, ,997 Base salaries were under budget due to staff vacancies, but were offset by higher incentive compensation and higher temporary office services 8.2% that were required as a result of the vacancies Payroll Taxes 118, ,954 3, % Employee Benefits 226, ,184 2, % Savings & Retirement 166, ,464 (12,345) 6.9% Due to fewer FTEs and timing of hiring which impacts eligibility Total Personnel Expenses 2,299,062 2,168, , % Meeting Expenses Meetings 3,371 5,000 (1,629) 32.6% Travel 32,872 62,000 (29,128) Less travel due to management initiative to lower overall corporate 47.0% travel expenses Conference Calls 5,338 4, % Total Meeting Expenses 41,582 71,800 (30,218) 42.1% Operating Expenses Consultants and Contracts 2,039,258 2,721,000 (681,742) Refer to the cover letter, which provides a detailed explanation of this 25.1% variance. Rent & Improvements Office Costs 2,155,419 1,893, , % Communications expense $202.9k over budget primarily related to delays in closure of the Princeton data center and cancellation of data connection contracts; maintenance and service agreements and noncapitalized software $38.8k over budget due to initiation of enterprise software agreements that will lower annual costs on a long term basis. Professional Services 4,706 4,706 On site technical support for employee meetings Miscellaneous (483) 96.5% Depreciation 1,198,919 1,123,002 75, % Total Operating Expenses 5,398,320 5,738,227 (339,907) 5.9% Other Non Operating Expenses 76,655 76,655 Loss on disposal of assets not fully depreciated Indirect Expenses (7,815,620) (7,978,706) 163, % Total Expenses (0) (0) (0) 120.0% Net Change in Assets % Fixed Assets Depreciation (1,198,919) (1,123,002) (75,917) 6.8% Computer & Software CapEx 448,414 1,556,100 (1,107,686) 71.2% Furniture & Fixtures CapEx Equipment CapEx 530, , , % Leasehold Improvements Allocation of Fixed Assets 219,622 (649,098) 868,720 Incr(Dec) in Fixed Assets 0 0 Total Budget (0) (0) (0) Change in Working Capital FTE's (1.87) 11.2% Due to staff vacancies $245.0k for SBS recorded in Standards; $350.0 less than budgeted for data warehouse hardware; $202.4k for hardware recorded in Equipment CapEx; $132.3k less for laptops (offset by $15k recorded in other departments); $82.5k allocated to EIDS; $95.5k less for replacement servers that were not needed $112.4k related to expansion of Atlanta office; $202.4k for hardware budgeted as computer CapEx December,
46 North American Electric Reliability Corp 2013 Statement of Activities and Fixed Asset Budget HUMAN RESOURCES 2013 Actual 2013 Budget Funding Assessments Penalties Testing Services & Software Workshop Fees Interest Miscellaneous Total Funding Expenses Personnel Expenses 2013 Variance Over(Under) % Comments (Explain variances < +/ 10% and $10,000) Over budget due to no attrition, which was budgeted at 3% across all Salaries 531, ,723 32, % departments and higher incentive compensation than budgeted Payroll Taxes 26,028 22,610 3, % Employee Benefits 111, ,737 (462,506) Benefits budgeted in HR but charged to employee's home cost center when utilized include education and training, relocation and parking/mass transit benefits. Collectively, these expenses are $490.49k under budget in HR, but equal to budget for total NERC. Medical benefits are $27.96k over budget due 80.6% to a higher actual cost than the budgeted average cost per employee. Savings & Retirement 43,971 41,348 2, % Total Personnel Expenses 712,595 1,136,418 (423,823) 37.3% Meeting Expenses Meetings 1,943 5,000 (3,057) 61.1% Travel 13,829 21,000 (7,171) 34.1% Primarily due to management initiatives to reduce overal travel expense. Conference Calls 1, % Total Meeting Expenses 16,952 26,600 (9,648) 36.3% Operating Expenses Consultants and Contracts 501, , ,867 Due primarily to higher than budgeted costs associated with staff and board 73.8% compensation studies Rent & Improvements Office Costs 10,142 42,500 (32,358) 76.1% Professional Services 61,562 23,278 38, % See comment under office costs Miscellaneous 10,936 10, % Depreciation 4,833 4,833 Total Operating Expenses 588, , , % Other Non Operating Expenses Indirect Expenses (1,318,387) (1,527,796) 209, % Total Expenses 0 (0) (0) 36.8% Net Change in Assets (0) % Monthly fees for performance management and benefits enrollment services were budgeted in office costs, but actuals are charged to professional fees to more accurately describe the expense. A corresponding over budget variance is reflected for professional services. Fixed Assets Depreciation (4,833) (4,833) Computer & Software CapEx 11,600 11,600 Active Strategy software budgeted in IT Furniture & Fixtures CapEx Equipment CapEx Leasehold Improvements Allocation of Fixed Assets (6,767) (6,767) Incr(Dec) in Fixed Assets (0) (0) Total Budget 0 (0) (0) Change in Working Capital (0) 0 0 FTE's December,
47 North American Electric Reliability Corp 2013 Statement of Activities and Fixed Asset Budget FINANCE and ACCOUNTING Variance Actual Budget Over(Under) % Comments (Explain variances < +/ 10% and $10,000) Funding Assessments Penalties Testing Services & Software Workshop Fees Interest Miscellaneous Total Funding Expenses Personnel Expenses Salaries 1,428,514 1,230, , % Payroll Taxes 80,258 70,460 9, % Employee Benefits 155, ,964 6, % Savings & Retirement 141, ,368 1, % Total Personnel Expenses 1,806,336 1,591, , % Meeting Expenses Meetings 3,113 5,000 (1,887) 37.7% Travel 54,803 62,500 (7,697) 12.3% Conference Calls 9,494 1,850 7, % Total Meeting Expenses 67,410 69,350 (1,940) 2.8% Operating Expenses Consultants and Contracts 572, , , % Rent & Improvements Office Costs 32,050 28,500 3, % Professional Services 291, , , % Miscellaneous (361) 72.2% Depreciation 2, , % Total Operating Expenses 898, , , % Other Non Operating Expenses (240) (240) Indirect Expenses (2,771,726) (2,201,294) (570,432) 25.9% Total Expenses (0) % Net Change in Assets 0 (0) (0) 43.2% Additional outside auditor support in connection with various risk management and internal control initiatives and costs associated with the evaluation and implementation of upgrades to the company's accounting system Primarily due to outside counsel fees which is budgeted in the Legal department. NERC was under budget $104.4k for all outside counsel fees. Fixed Assets Depreciation (2,196) (798) (1,398) 175.2% Computer & Software CapEx 2,495 2,495 Additional module to accounting software Furniture & Fixtures CapEx Equipment CapEx Leasehold Improvements Allocation of Fixed Assets (299) 798 (1,097) Incr(Dec) in Fixed Assets 0 0 Total Budget (0) % Change in Working Capital 0 (0) (0) 61.4% FTE's Salaries and payroll taxes over budget due to the 3% reduction in budgeted expenses to adjust for attrition in all departments and temporary office services, budgeted in HR, utilized during staff leave of absence. December,
48 Financial Statements and Report of Independent Certified Public Accountants North American Electric Reliability Corporation December 31, 2013 and 2012
49 North American Electric Reliability Corporation Table of contents Report of Independent Certified Public Accountants 1 Financial statements: Statements of financial position 3 Statements of activities 4 Statements of cash flows 5 Notes to financial statements 6 Supplemental schedules of expenses 15

50 Report of Independent Certified Public Accountants Audit Tax Advisory Grant Thornton LLP 1100 Peachtree Street, NE, Suite 1200 Atlanta, GA T F To the Board of Trustees of North American Electric Reliability Corporation: We have audited the accompanying financial statements of North American Electric Reliability Corporation (a New Jersey non-profit corporation), which comprise the statements of financial position as of December 31, 2013 and 2012, and the related statements of activities, and cash flows for the years then ended, and the related notes to the financial statements. Management s responsibility for the financial statements Management is responsible for the preparation and fair presentation of these financial statements in accordance with accounting principles generally accepted in the United States of America; this includes the design, implementation, and maintenance of internal control relevant to the preparation and fair presentation of financial statements that are free from material misstatement, whether due to fraud or error. Auditor s responsibility Our responsibility is to express an opinion on these financial statements based on our audits. We conducted our audits in accordance with auditing standards generally accepted in the United States of America. Those standards require that we plan and perform the audits to obtain reasonable assurance about whether the financial statements are free from material misstatement. An audit involves performing procedures to obtain audit evidence about the amounts and disclosures in the financial statements. The procedures selected depend on the auditor s judgment, including the assessment of the risks of material misstatement of the financial statements, whether due to fraud or error. In making those risk assessments, the auditor considers internal control relevant to the entity s preparation and fair presentation of the financial statements in order to design audit procedures that are appropriate in the circumstances, but not for the purpose of expressing an opinion on the effectiveness of the entity s internal control. Accordingly, we express no such opinion. An audit also includes evaluating the appropriateness of accounting policies used and the reasonableness of significant accounting estimates made by management, as well as evaluating the overall presentation of the financial statements. Grant Thornton LLP U.S. member firm of Grant Thornton International Ltd
51 2 We believe that the audit evidence we have obtained is sufficient and appropriate to provide a basis for our audit opinion. Opinion In our opinion, the financial statements referred to above present fairly, in all material respects, the financial position of North American Electric Reliability Corporation as of December 31, 2013 and 2012, and the results of its operations and its cash flows for the years then ended in accordance with accounting principles generally accepted in the United States of America. Supplementary information Our audit was conducted for the purpose of forming an opinion on the financial statements as a whole. The supplemental schedules of expenses shown on pages are presented for purposes of additional analysis and are not a required part of the financial statements. Such supplementary information is the responsibility of management and was derived from and relates directly to the underlying accounting and other records used to prepare the financial statements. The information has been subjected to the auditing procedures applied in the audit of the financial statements and certain additional procedures. These additional procedures included comparing and reconciling the information directly to the underlying accounting and other records used to prepare the financial statements or to the financial statements themselves, and other additional procedures in accordance with auditing standards generally accepted in the United States of America. In our opinion, the supplementary information is fairly stated, in all material respects, in relation to the financial statements as a whole. Atlanta, Georgia May 7, 2014 Grant Thornton LLP U.S. member firm of Grant Thornton International Ltd
52 North American Electric Reliability Corporation 3 Statements of Financial Position December 31, Assets Current Assets Cash and cash equivalents $ 26,182,060 $ 27,936,696 Accounts receivable, net of allowance for doubtful accounts of $0 and $62,572 3,353,895 4,281,602 Prepaid expenses 869, ,087 Total Current Assets 30,405,831 33,106,385 Long-Term Assets Property and equipment, net 5,645,116 5,220,210 Security deposits 99, ,903 Cash surrender value of insurance policies - 337, b Plan Assets 320, ,243 Total Long-Term Assets 6,064,912 5,790,770 Total assets $ 36,470,743 $ 38,897,155 Liabilities and net assets Current Liabilities Accounts payable and accrued expenses $ 6,943,283 $ 5,868,604 Accrued retirement liabilities 1,788,624 1,409,548 Deferred revenue 5,287,044 5,177,751 Deferred rent - current 182, ,270 Deferred compensation -current 20,386 28,280 Capital lease obligations - current 47,108 65,928 Regional assessments collected in advance 9,427,293 9,614,829 Total Current Liabilities 23,696,159 22,288,210 Long-Term Liabilities Deferred rent - non-current 3,817,478 3,618,267 Deferred compensation - non-current 597, ,308 Capital lease obligations- non-current - 47,108 Total Long-Term Liabilities 4,414,992 4,376,683 Total liabilities 28,111,151 26,664,893 Net assets Unrestricted 7,914,592 9,719,762 Temporarily restricted 445,000 2,512,500 Total net assets 8,359,592 12,232,262 Total liabilities and net assets $ 36,470,743 $ 38,897,155 The accompanying notes are an integral part of these financial statements.
53 North American Electric Reliability Corporation 4 Statements of Activities For the Year Ended December 31, 2013 For the Year Ended December 31, 2012 Unrestricted Temporarily Restricted Total Unrestricted Temporarily Restricted Revenues: NERC assessments $ 47,604,156 $ - $ 47,604,156 $ 50,661,271 $ - $ 50,661,271 Penalty income - 445, , , ,000 Testing / fees 1,822,154-1,822,154 2,057,383-2,057,383 Services and software 86,075-86, , ,618 Workshops 320, , , ,800 Rental Income 293, , , ,080 Interest 3,197-3,197 13,335-13,335 (Loss) gain on disposal of fixed assets (99,708) - (99,708) Miscellaneous revenues ,081-2,081 Net assets (penalties) released from restrictions 2,512,500 (2,512,500) Total revenues 52,542,323 (2,067,500) 50,474,823 53,648, ,000 53,748,602 Expenses: Salaries 25,465,466-25,465,466 23,391,982-23,391,982 Employee costs 4,395,066-4,395,066 4,096,501-4,096,501 Retirement and savings plans 2,252,973-2,252,973 1,793,528-1,793,528 Travel and meetings 3,414,306-3,414,306 3,616,022-3,616,022 Services 10,511,000-10,511,000 11,819,937-11,819,937 Rent 3,015,106-3,015,106 2,908,290-2,908,290 Office costs 1,622,635-1,622,635 1,829,606-1,829,606 Computer 1,607,057-1,607,057 1,284,025-1,284,025 Depreciation and amortization 1,945,946-1,945,946 2,144,184-2,144,184 Property tax expense 48,606-48,606 51,008-51,008 Provision for bad debts 45,610-45,610 (113,173) - (113,173) Miscellaneous expenses 20,608-20,608 25,197-25,197 Interest 3,114-3,114 6,993-6,993 Total expenses 54,347,493-54,347,493 52,854,100-52,854,100 Change in net assets (1,805,170) (2,067,500) (3,872,670) 794, , ,502 Net assets, beginning of year 9,719,762 2,512,500 12,232,262 8,925,260 2,412,500 11,337,760 Net assets, end of year $ 7,914,592 $ 445,000 $ 8,359,592 $ 9,719,762 $ 2,512,500 $ 12,232,262 Total The accompanying notes are an integral part of these financial statements.
54 North American Electric Reliability Corporation 5 Statements of Cash Flow For the Years Ended December 31, Cash flows from operating activities: Change in net assets $ (3,872,670) $ 894,502 Adjustments to reconcile change in net assets to net cash provided by operating activities: Depreciation and amortization 1,945,946 2,144,184 Straight-line rent accrual 258,362 1,583,373 Loss (gain) on disposal of fixed assets 99,708 (34) Provision for bad debts 45,610 (113,173) Change in value of insurance policies 337,414 (55,316) Increase (decrease) in cash attributable to changes in operating assets and liabilities: Accounts receivable 882,097 (625,538) Prepaid expenses 18,211 (336,246) Security deposits 15,767 - Receipt of funds for regional entities 152,966, ,437,437 Disbursements of funds to regional entities (152,966,084) (115,437,437) Accounts payable and accrued expenses 803,926 (913,150) Deferred revenue 109,293 2,533,575 Regional assessments collected in advance (187,536) 4,939,801 Deferred compensation (324,105) 26,716 Accrued retirement liabilities 379,076 (272,933) Net cash provided by operating activities 511,099 9,805,761 Cash flows from investing activities Purchases of property and equipment (2,200,782) (804,411) Proceeds from sales of property and equipment 975 2,381 Net cash used in investing activities (2,199,807) (802,030) Cash flows from financing activities Capital lease payments (65,928) (83,185) Net cash used in financing activities (65,928) (83,185) Net (decrease) increase in cash and cash equivalents (1,754,636) 8,920,546 Cash and cash equivalents, beginning of year 27,936,696 19,016,150 Cash and cash equivalents, end of year $ 26,182,060 $ 27,936,696 Supplemental disclosure of non-cash information: Fixed asset purchases within accounts payable $ 270,753 $ - Capital lease obligation for equipment $ - $ 93,242 Supplemental disclosure of cash paid: Interest $ 3,113 $ 6,993 The accompanying notes are an integral part of these financial statements.
55 North American Electric Reliability Corporation 6 Notes to the Financial Statements 1 Organization and Nature of Business North American Electric Reliability Corporation (the "Corporation" or "NERC") is an international, independent, not-for-profit organization, whose mission is to ensure the reliability of the bulk power system in North America. NERC relies on the diverse and collective expertise of electricity industry participants, subject to government oversight and audit. The Corporation is certified by the U.S. Federal Energy Regulatory Commission ("FERC") as the Electric Reliability Organization ("ERO") within the United States. In the United States, the Corporation has the authority to levy fines and penalties against any of the individual users, owners and operators of the bulk power system for non-compliance with the reliability standards that govern the bulk power system. The Corporation has also been recognized as the ERO by governmental authorities in Canada. The Corporation's mission is to enhance the reliability and security of the bulk power system in North America. To achieve that, the Corporation develops and enforces reliability standards; monitors the bulk power system; assesses future adequacy and educates, trains and certifies industry personnel. Entities subject to the Corporation's reliability standards account for virtually all the electricity supplied in the United States of America, Canada and a portion of Baja California, Norte, Mexico. The Corporation is the successor to North American Electric Reliability Council (the "Council") which was formed in 1968 in the aftermath of the November 1965 blackout that affected the northeastern United States and Ontario, Canada. On October 31, 2006, the Council entered into an agreement and plan of merger with the Corporation, a New Jersey non-profit corporation. At the effective date of the merger, January 1, 2007, the separate corporate existence of the Council ceased, and Corporation became the surviving entity. All of the property, assets, rights, privileges, powers, franchises and immunities of the Council became the property of the Corporation. All debts, liabilities and obligations of the Council were also assumed by the Corporation. The Corporation is organized and operates as a business league under Internal Revenue Code Section 501(c) (6). The activities of the Corporation are directed by an independent board of trustees. The membership of the Corporation is unique. It is a not-for-profit corporation whose members include users, owners and operators of the bulk power system, eight regional entities, large and small end-use customers, state and provincial governmental authorities and any other interested parties. Annually, the board of trustees approves an operating budget for the Corporation that includes a provision for working capital and operating reserves, which are recovered through assessments to Load-Serving Entities ("LSE"). The determination of the annual working capital and operating reserve requirements and the authorization of management to access these funds is governed by the Corporation s Working Capital and Operating Reserve Policy. The Corporation assesses each LSE its proportional share of its annual operating budget based on "net energy for load". During 2013, the assessments to LSEs made up approximately 94% of the total funding for the Corporation. Assessments to U.S. entities were offset in 2013 by $2.5M in penalties received in prior years but were restricted from use until 2013 per the Corporation s policy on the Accounting, Financial Statement and Budgetary Treatment of Penalties Imposed and Received for Violations of Reliability Standards. The Corporation also generates funding from the collection of fees charged for various services. These services include the maintenance of a certification program for system operators, the development of reports and software programs, and the hosting of workshops to educate the industry on various reliability matters.
56 North American Electric Reliability Corporation 7 The Corporation has entered into separate Delegation Agreements, which have been approved by FERC, with eight Regional Entities: Florida Reliability Coordinating Council ("FRCC"), Midwest Reliability Organization ("MRO"), Northeast Power Coordinating Council ("NPCC"), Reliability First Corporation ("RFC"), SERC Reliability Corporation ("SERC"), Southwest Power Pool Regional Entity ("SPP"), Texas Reliability Entity ("TRE") and Western Electricity Coordinating Council ("WECC"). Through these Delegation Agreements, the Corporation has delegated certain of its ERO responsibilities and functions to the Regional Entities. The Corporation must annually approve the eight Regional Entities' budgets and submit them along with its budget and schedule of assessments to load serving entities to FERC for final approval of the budgets and the U.S. portion of the assessments. The Corporation has the sole responsibility to invoice, collect and disburse the monies approved in the Regional Entities' budgets. These pass-through amounts are not included as revenue and expense in the statement of activities, see related Note 6. 2 Summary of Significant Accounting Policies Basis of Accounting and Presentation The financial statements of the Corporation have been prepared on the accrual basis of accounting in conformity with accounting principles generally accepted in the United States of America. Net assets, revenues, expenses, gains and losses are classified based on the existence or absence of restrictions. The Corporation reports information regarding its financial position and activities according to three classes of net assets: unrestricted net assets, temporarily restricted net assets and permanently restricted net assets. There were no permanently restricted net assets as of December 31, 2013 or Net assets totaling $445,000 and $2,512,500 were temporarily restricted by FERC as of December 31, 2013 and 2012, respectively, to offset future assessments. Cash and Cash Equivalents The Corporation considers all highly liquid investments purchased with original maturities of three months or less to be cash and cash equivalents. The Corporation maintains its cash balances with one bank. The accounts at the bank are insured up to certain limits by the Federal Deposit Insurance Corporation. Balances in these accounts may exceed Federally-insured limits from time to time. Use of Estimates The preparation of financial statements in conformity with accounting principles generally accepted in the United States of America requires management to make estimates and assumptions that affect the amounts of assets and liabilities and disclosure of contingent assets and liabilities at the date of the financial statements and the reported amounts of revenues and expenses during the reporting period. Actual results could differ from those estimates. Revenue Recognition The Corporation recognizes assessment revenue billed to the LSEs on a pro-rata basis over the calendar year. Fees generated for testing, certifications, services and software, workshops and other services are recognized when the test is taken, service rendered and/or workshops are completed. Penalty income is derived from FERC's approval of assessment of penalties to registered entities regarding enforcement of NERC's Reliability Standards. The penalty income from a registered entity is recorded following closure of the enforcement matter including exhaustion of appeals and the outcome determined. The funds are temporarily restricted due to FERC's requirement that the funds be used to reduce future NERC assessments.
57 North American Electric Reliability Corporation 8 Deferred Revenue Deferred revenue represents assessments billed and received in advance of the period in which it is earned. Deferred revenue is recognized as revenue in the period in which it is earned. Accounts Receivable Accounts receivable are recorded at the original invoice amount, less an estimated allowance for uncollectible accounts. Credit is generally extended on a short-term basis; thus accounts receivable do not bear interest. Accounts receivable are periodically evaluated for collectability based on past experience and an analysis of current accounts receivable collectability. Changes in the estimated collectability of accounts receivable are recorded in the results of operations for the period in which the estimate is revised. Accounts deemed uncollectible are charged to the allowance in the years they are deemed uncollectible. Property and Equipment Purchased property and equipment are capitalized at cost. Donated assets are capitalized at the fair market value of the assets on the date of contribution. The Corporation s minimum capitalization policy is for additions greater than $2,000. Depreciation and amortization is provided by the straight-line method over the estimated useful lives of the related assets as follows: Years Software development Furniture and equipment Leasehold improvements 3 years 3-7 years Term of lease or estimated useful life of the asset, whichever is shorter Expenditures for maintenance and repairs are charged to operations as incurred while renewals and betterments are capitalized. Compensated Absences Employees of the Corporation are entitled to paid time off depending on length of service. At December 31, 2013 and 2012, the Corporation has recorded accrued compensated absences of $543,126 and $453,950 related to days earned, included with accounts payable and accrued expenses on the statements of financial position. Income Taxes The Corporation has received a determination letter from the Internal Revenue Service concluding that it is exempt from Federal income taxes under Section 501(c)(6) of the Internal Revenue Code. The Corporation is subject to income taxes on revenues related to unrelated business activities. The Corporation is subject to a proxy tax related to nondeductible lobbying and political expenses incurred. There was no proxy tax incurred in 2013 or The Corporation recognizes the tax benefit from an uncertain tax position only if it is more likely than not that the tax position will be sustained on examination by the taxing authority, based on the technical merits of the position. The Corporation is no longer subject to federal and state tax examinations by the respective taxing authorities for the years prior to Tax years 2010 through 2013 remain subject to examination by major tax jurisdictions.
58 North American Electric Reliability Corporation 9 Subsequent Events The Corporation discloses material events that occur after the statement of financial position date but before financial statements are issued. In general, these events are recognized in the financial statements if the condition existed at the date of the statement of financial position, but are not recognized if the condition did not exist at the statement of financial position date. The Corporation discloses non-recognized events if required to keep the financial statements from being misleading. Management evaluated events occurring subsequent to December 31, 2013 through May 7, 2014, the date the financial statements were available for issuance. On January 13, 2014, the company secured a non-revolving credit facility under the Capital Financing Program that was approved by the Board of Trustees and the Federal Energy Regulatory Commission (FERC) as part of the Corporation s 2014 Business Plan and Budget. The interest rate is floating and equal to LIBOR plus 275 basis points, which yielded a rate of 2.91% at closing. The total size of the non-revolving credit facility is $7.5M, with the total authorized borrowings each year limited to the amount approved by the Board of Trustees and FERC in that year s business plan and budget. The Corporation s line of credit was also amended. See Note 4 below. In April, 2014, management became aware that the sub-tenant under the Washington, D.C. lease, referenced in Note 8, filed for Chapter 11 bankruptcy, but the full impact of the event is not known at this time. 3 Property and Equipment Property and equipment consist of the following at December 31: December 31, Software development $ 2,986,517 $ 1,599,433 Furniture and equipment 6,860,119 7,269,259 Leasehold improvements 1,100,281 1,241,799 10,946,917 10,110,491 Accumulated depreciation and amortization (5,301,801) (4,890,281) $ 5,645,116 $ 5,220,210 Depreciation and amortization expense for the years ended December 31, 2013 and 2012 was $1,945,946 and $2,144,184, respectively. 4 Line of Credit The Corporation has a line of credit with a bank that expires in June The line of credit provides for up to $4,000,000 of availability to be used for working capital needs. The line of credit accrues interest at prime plus 0.5% (3.25% at December 31, 2013 and 2012). Total borrowings under the line of credit may not exceed 70% of the qualified accounts receivable. The line of credit is collateralized by all existing and future assets and subject to a filing under the Uniform Commercial Code. As part of the line of credit agreement, the Corporation was required to maintain $400,000 in a non-interest bearing account with the lender. The $400,000 is classified within cash and cash equivalents on the statements of financial position. There were no borrowings outstanding at December 31, 2013 or At December 31, 2013 and 2012, the available amount under the line of credit was reduced by open letters of credit totaling $140,736 and $101,236 respectively, which represents security deposits for the Corporation's office lease agreements. Pursuant to the line of credit agreement, the Corporation is required to comply with financial covenants primarily related to minimum net asset requirements. In connection with the non-revolving credit facility secured on January 13, 2014, the line of credit was amended and restated. As part of the amended and restated line of credit not, the Corporation is no longer required to maintain the $400,000 non-interest bearing account with the lender.
59 North American Electric Reliability Corporation 10 5 Penalty Income The Corporation received $445,000 and $100,000 of penalty income in 2013 and 2012, respectively, which is temporarily restricted. The penalty income will be utilized in accordance with the timing of the receipt of the income and FERC's requirement for the use of penalty income to reduce assessments. NERC transferred $2,512,500 of penalty income from temporarily restricted net assets to unrestricted net assets during During 2012, NERC did not transfer any penalty income from temporarily restricted net assets to unrestricted net assets. 6 Regional Assessments Collected in Advance In addition to Corporation assessments billed to LSEs or designees, a regional assessment is also billed by the Corporation on behalf of the regional entities. The regional assessment is based on approved budgets of the eight regional entities and remitted to the regional entities by the Corporation. There is a credit risk if the Corporation does not collect the assessments from LSEs or designees before the regional assessments are due to the regional entities. However, the risk is minimal since the Corporation has the ability to reassess and rebill in a subsequent period for any uncollected assessments. Regional assessments billed and remitted for 2013 and 2012 were as follows: For the Year Ended December 31, Total regional assessments billed to WECC, ERCOT, individual LSE's and designees $ 113,584,703 $ 110,280,847 Total regional assessments remitted to regional entities (113,480,310) (110,147,242) Billings over remittances $ 104,393 $ 133,605 As of December 31, 2013 and 2012, regional assessments collected in advance and not yet remitted to the regional entities based upon the remittance schedule set forth in the delegation agreements totaled $9,427,293 and $9,614,829, respectively. 7 Deferred Compensation Agreements and Life Insurance Policies During 2005, the Council entered into a deferred compensation agreement (the "Deferred Compensation Agreement") with a retiring executive that provided benefits to the individual upon reaching normal retirement age and was payable over a period selected by the retiring employee. Under certain circumstances, benefits were payable to his surviving spouse. The Corporation assumed the liabilities upon merger with the Council effective January 1, The present value of the estimated liability under the agreement at December 31, 2007 was accrued using a discount rate of 4.91%. The Corporation provided for some of the benefit funding through a variable universal life policy. Effective October 15, 2008, the Deferred Compensation Agreement was superseded by a new agreement. The variable universal life policy used to fund the liability, including the cash surrender value of the policy, was assigned and transferred to the retired executive in January In accordance with the new agreement, the Corporation will continue to pay the policy premiums through At December 31, 2013 and 2012, the present value of the unfunded liability, using a discount rate of 0.75% was $14,257 and $38,968, respectively. The present value of the unfunded liability as of December 31, 2013 is included in current deferred compensation on the statements of financial position. As of December 31, 2012, $24,712 and $14,257 of the present value of the unfunded liability is included in current and non-current deferred compensation, respectively.
60 North American Electric Reliability Corporation 11 On October 15, 2008, the Corporation entered into various Executive Benefit Agreements (the "Agreements") with certain executives and the aforementioned retired executive. The Agreements supersede and replace all previous written or oral agreements between the Corporation and these executives. In accordance with the Agreements, while employed by the Corporation, the executives shall be provided with life insurance coverage, through individual and/or group policies, providing a death benefit equal to the lesser of three times base salary or $500,000, or three times base salary depending upon the executives' employment date. The executives agreed to issue split dollar endorsement agreements with respect to such policies. The executives retired from the Corporation in 2013, and in accordance with the Agreements, ownership of the policies, including the cash surrender value, transferred to the executives within 60 days following termination of employment. The Corporation paid and expensed all the premiums that were due on these policies in 2013, prior to transfer of ownership. When ownership of the policies transferred, the asset and deferred compensation balances on the statements of financial position were written off. At December 31, 2013 and 2012, the cash surrender value of all remaining policies was $0 and $337,414, respectively. Deferred Compensation Plan The Corporation established a deferred compensation plan in 2012 in accordance with Internal Revenue Code Section 457 for certain employees, as defined. The plan provides that eligible employees may make elective salary reduction contributions in accordance with limitations established by the Internal Revenue Code. The asset and liability for this deferred compensation plan of $320,660 and $118,243 at December 31, 2013 and 2012, respectively, are included in 457b Plan Assets and non-current deferred compensation on the statements of financial position. Retiree Medical Benefits Effective September 1, 2007, the board of trustees approved and adopted a policy to provide medical coverage for a very limited number of current retirees and any and all dependents and transition retirees and any and all dependents, as defined by the board resolution, up to a maximum monthly benefit of $550 paid directly to the applicable insurer. Assumptions used in recording the retiree medical benefits included the 2009 Social Security Administration Actuarial Period Life Table, annual inflation rate of 1.5% and discount rate of 3.8%. At December 31, 2013 and 2012 the accrued retiree medical benefits liability was $276,855 and $241,394, respectively, and is included in non-current deferred compensation on the statements of financial position. The retiree medical expense related to this policy was $26,616 and $22,170, respectively for the years ended December 31, 2013 and Commitments Operating Leases The Corporation leases office space in Washington, D.C. and Atlanta, Georgia under non-cancellable lease agreements, with expiration dates through The lease for office space in Princeton, NJ expired in In 2012, the Corporation entered into an agreement to expand the amount of leased space in Atlanta, Georgia with an expiration date in 2022, which is coterminous with the term of the lease for the original premises. In 2011, the Corporation entered into separate sub-lease agreements for a portion of the office space in Princeton, New Jersey, which expired in 2013, and for one of the two locations in Washington D.C., with an expiration date of February As indicated in Note 2, in April 2014, management became aware that the subleasee filed for Chapter 11 bankruptcy, but the full impact of the event is not known at this time.
61 North American Electric Reliability Corporation 12 Approximate future minimum payments on office lease space, net of rental income for sub-leased space, at December 31, 2013, for the next five years are as follows: Years Ending December 31, Leased Space Sub-leased Space Net 2014 $ 2,966,000 $ (276,000) $ 2,690, ,044,000 (286,000) 2,758, ,123,000 (248,000) 2,875, ,923,000 (50,000) 2,873, ,939,000-2,939,000 Thereafter 11,490,000-11,490,000 $ 26,485,000 $ (860,000) $ 25,625,000 The office leases are subject to escalation clauses covering increases in real estate taxes and operating costs over the base year. The Corporation has received tenant improvement allowances as of December 31, 2013 and 2012 totaling $381,632 and $2,256,634, respectively. The difference between rent expense calculated ratably over the lease term and rent paid according to the lease is recorded as a deferred rent obligation on the statement of financial position in the amount of $3,999,899 and $3,741,537 at December 31, 2013 and 2012, respectively. Office rent expense, net of sub-lease income of $293,000 and $314,080, was $2,574,909 and $2,508,580 for the years ended December 31, 2013 and 2012, respectively. In April, 2014, management became aware that the sub-tenant under the Washington, D.C. lease filed for Chapter 11 bankruptcy, but the full impact of the event is not known at this time. Capital Leases The Corporation has entered into a capital lease agreements for office equipment. Depreciation expense related to these capital leases was $65,407 for each of the years ended December 31, 2013 and Assets leased by the Corporation under capital leases are included in fixed assets and capital lease obligation on the statements of financial position and consisted of the following: December 31, 2013 Copier leases $ 196,221 Accumulated depreciation (150,837) Net Book Value $ 45,384 The following is a schedule of future minimum lease payments under these capital leases, together with the future obligation net of interest and maintenance as of December 31, 2013: Future Minimum Years ending December 31, Payments 2014 $ 56,697 Less: Amounts representing interest and maintenance (9,589) Future Obligation net of Interest and Maintenance $ 47,108
62 North American Electric Reliability Corporation 13 Contractual Commitments The Corporation has software license, maintenance support and data management service agreements with varying expiration dates through The following table is a schedule of future commitments under the terms of the agreements: Future Minimum Years ending December 31, Payments 2014 $ 196, , , ,000 Total Service Agreements $ 636,000 9 Savings and Investment Plan The Corporation sponsors an employee savings 401(k) plan (the "Plan") whereby eligible participating employees may elect to contribute up to the Internal Revenue Service Code 402(g) (1) limit. The Corporation contributes a 75% match of the participant's elective contribution, provided that the elective contribution does not exceed 6% of eligible compensation. The Corporation also makes a discretionary contribution equal to a percentage of the eligible compensation of all qualifying participants. The additional discretionary contributions are determined annually by the Board of Trustees and are subject to the limitation imposed by the Internal Revenue Service Code 401(a) (17). The Corporation's expenses related to the Plan for the years ended December 31, 2013 and 2012 were $2,252,973 and $1,793,528, respectively. The contributions accrued as of December 31, 2013 and 2012 amounted to $1,788,624 and $1,409,548, respectively, and are included in accrued retirement liabilities in the statements of financial position. 10 Concentration of Credit Risk The Corporation receives a significant portion of its income from assessments, based upon "net energy for load", to LSEs within the eight regions which are located throughout the United States of America, Canada and a portion of Baja California, Norte, Mexico. LSEs are assessed a proportional share of the Corporation's operating budget as well as a proportional share of the operating budget of the regional entity in whose territory the LSE is located. The Corporation issues quarterly invoices directly to LSEs or, in some circumstances, designees. With respect to LSEs located within Texas Reliability Entity ("TRE"), the Corporation issues a quarterly invoice to Electric Reliability Council of Texas ("ERCOT") which then issues invoices to the LSEs in its region, collects the assessments and remits the funds to the Corporation. The Corporation then remits the regional assessments to TRE. A similar arrangement exists with respect to LSEs located within the Western Electricity Coordinating Council ("WECC"). For LSEs located within the PJM Interconnection ("PJM"), the Corporation issues invoices to PJM which issues invoices to the LSEs, collects the assessments and remits the funds to the Corporation. The Corporation then forwards the regional assessment to Reliability First Corporation ("RFC"), the regional entity. The Corporation is extending credit to the LSEs and designees and is exposed to credit risk to the extent regional assessments are paid by the Corporation to the regional entities prior to collecting assessments from the LSEs or designees. Based on past history, the Corporation believes that the risk of its trade accounts receivable credit exposure is limited. 11 Functional Classification The Corporation is required to provide information about expenses reported by their functional classification, which is a method of grouping expenses according to the purpose for which costs are incurred. The Corporation groups expenses by operational programs and by administrative programs as defined by FERC.
63 North American Electric Reliability Corporation 14 The following table shows the functional classification of expenses for the years ended December 31, 2013 and 2012: For the Years Ended December 31, Operational Programs: Reliability Standards $ 5,429,867 $ 4,392,836 Compliance and Organization Registration Certification 9,404,714 9,352,528 Reliability Assessment and Performance Analysis 4,506,619 4,648,251 Training and Education 1,696,223 2,055,853 Situation Awareness and Infrastructure Security 8,701,517 9,815,542 29,738,940 30,265,010 Administrative Programs: General & Administrative 8,656,304 7,736,048 Legal and Regulatory 4,046,516 4,093,557 Information Technology 7,815,620 7,211,151 Human Resources 1,318,387 1,456,847 Finance and Accounting 2,771,726 2,091,487 24,608,553 22,589,090 Total Expenses $ 54,347,493 $ 52,854,100
64 North American Electric Reliability Corporation 15 Supplemental Schedules of Expenses For the Years Ended December 31, Employee costs: Payroll taxes (FICA, SUI, FUI, Medicare) $ 1,527,728 $ 1,417,838 Employee benefits - medical 2,053,703 1,961,176 Employee benefits - life / disability 173, ,987 Employee benefits - officers' life 33,328 53,188 Insurance - workers' compensation 54,219 64,697 Relocation expenses 149, ,182 Educational 402, ,433 $ 4,395,066 $ 4,096,501 Travel and meetings: Meetings $ 741,766 $ 569,258 Workshops 363, ,591 Travel 2,001,968 2,268,587 On-line meetings 306, ,586 $ 3,414,306 $ 3,616,022
65 North American Electric Reliability Corporation 16 Supplemental Schedules of Expenses (continued) For the Years Ended December 31, Services: Insurance - commercial $ 109,765 $ 125,932 Contract and consultants 8,293,693 9,429,191 Independent trustee fees 931, ,000 Search fees 6, ,314 Temporary office services and agency fees 180,924 62,749 Accounting and auditing fees 143,271 39,926 Legal fees 845,602 1,031,825 $ 10,511,000 $ 11,819,937 Office costs: Publications and subscriptions $ 76,993 $ 43,075 Dues 40,862 46,079 Postage 8,022 14,007 UPS, express mail, etc. 29,509 42,202 Telephone 517, ,469 Office and equipment repair/services 86,810 83,775 Copying 44,720 21,754 Stationery and office forms 176 1,380 Office supplies 187, ,589 Bank charges 22,967 23,392 Sales and use tax 3,782 17,935 Card fees 81,782 84,058 Internet expenses 522, ,891 $ 1,622,635 $ 1,829,606
66 ATTACHMENT ACTUAL COST-TO-BUDGET COMPARISON AND 2013 AUDITED FINANCIAL REPORT FOR FLORIDA RELIABILITY COORDINATING COUNCIL, INC.


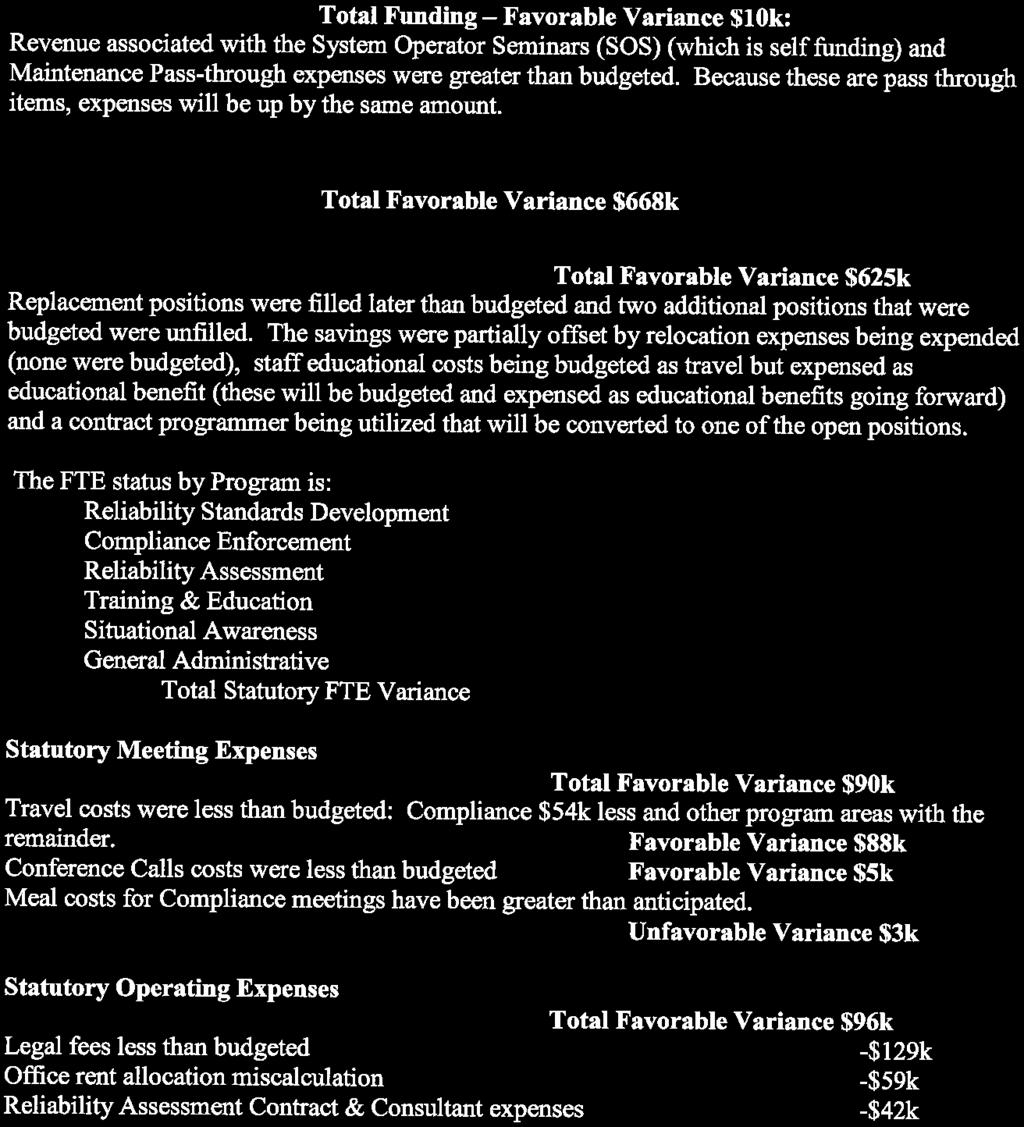
67

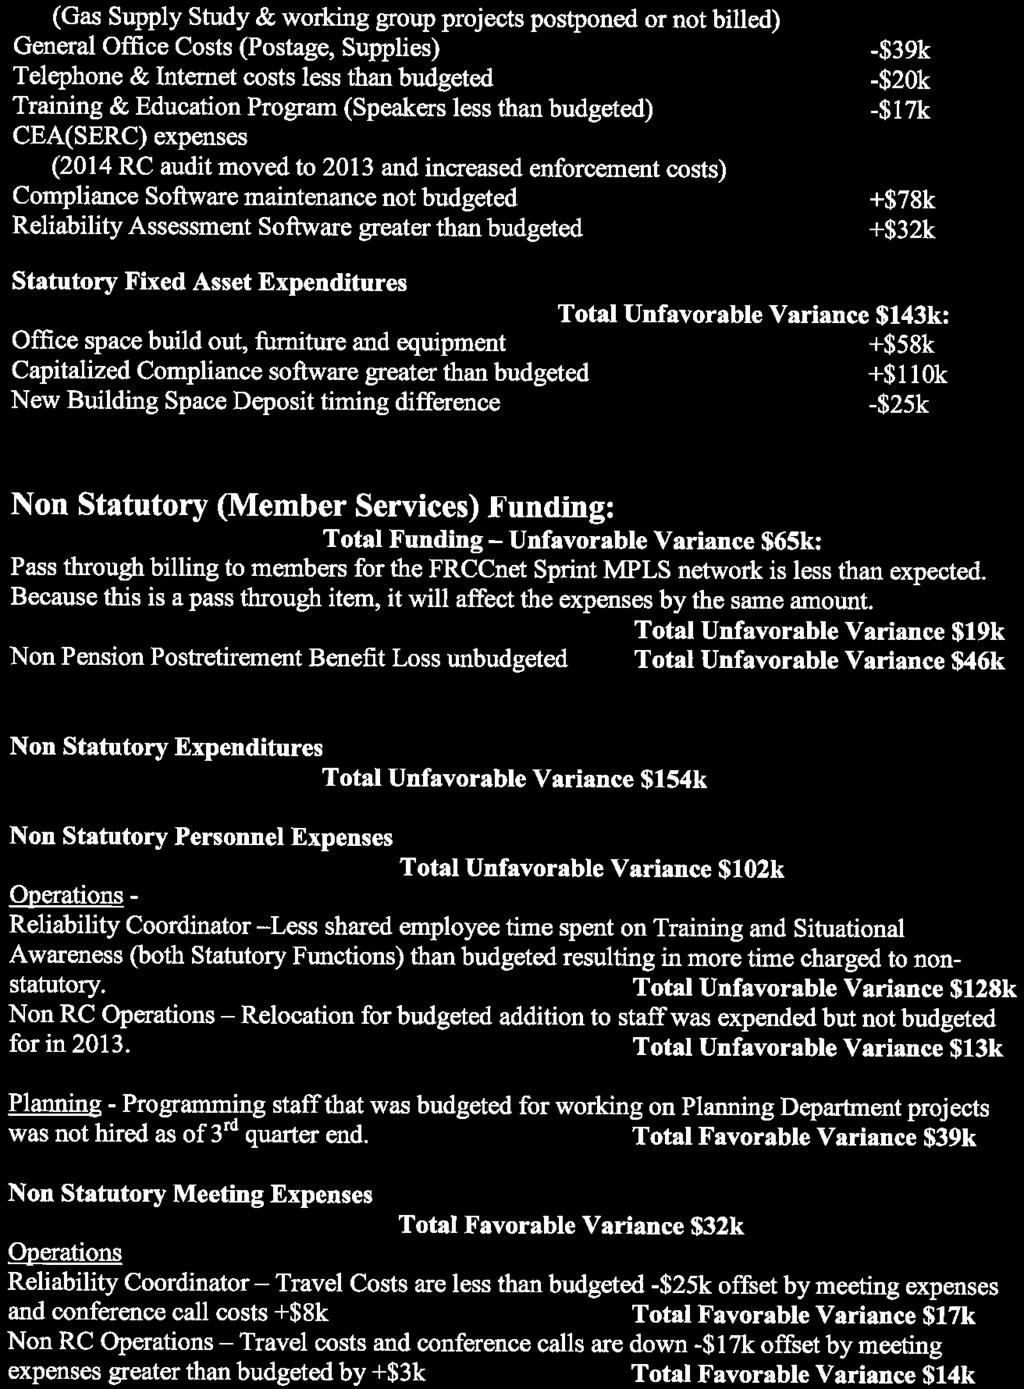
68

69

70

71
72
73 Florida Reliability Coordinating Council, Inc Statement of Activities and Capital Expenditures Based on Audited TOTAL COMPANY For the Year Ended 12/31/2013 (In Whole Dollars) 2013 Actual 2013 Budget 2013 Variance % Funding ERO Funding ERO Assessments $ 5,957,970 $ 5,957,971 $ (1) Penalty Sanctions 304, ,500 - Total ERO Funding $ 6,262,470 $ 6,262,471 $ (1) $ - Membership Dues $ 6,250,976 $ 6,250,975 1 Testing Fees Services & Software 314, ,000 (18,359) Workshops 99,385 90,000 9,385 Interest Special Assessment (45,824) - (45,824) Total Funding $ 12,881,648 $ 12,936,446 $ (54,798) -0.4% Expenses Personnel Expenses Salaries $ 5,174,009 $ 5,569,794 (395,785) Payroll Taxes 314, ,291 (43,497) Benefits 783, ,937 12,798 Retirement Costs 688, ,397 (96,349) Total Personnel Expenses $ 6,960,586 $ 7,483,419 $ (522,833) -7.0% Meeting Expenses Meetings $ 115,998 $ 98,669 17,329 Travel 182, ,787 (128,143) Conference Calls 31,301 42,543 (11,242) Total Meeting Expenses $ 329,943 $ 451,999 $ (122,056) -27.0% Operating Expenses Consultants & Contracts $ 3,039,370 $ 3,192,699 (153,329) Office Rent 720, ,044 (18,800) Office Costs 573, ,392 (122,754) Professional Services 83, ,504 (338,836) Miscellaneous 75,000-75,000 Depreciation 138, ,390 20,660 Total Operating Expenses $ 4,629,970 $ 5,168,029 $ (538,059) -10.4% Total Indirect Expenses $ - $ - $ - Other Non-Operating Expenses $ 519,831 $ - $ 519,831 Total Expenses $ 12,440,330 $ 13,103,447 $ (663,117) -5.1% Change in Assets $ 441,318 $ (167,001) $ 608, % Fixed Asset Expenditures Depreciation $ (138,050) $ (117,390) $ (20,660) Non Pension Post Retir Obligat $ (565,655) $ - (565,655) Software CapEx 109,556 25,000 84,556 Furniture & Fixtures CapEx 27,000-27,000 Equipment & Computers CapE 86,327 4,239 82,088 Leasehold Improvements 55,137 78,461 (23,324) Increase/(Decrease) in Fixed Assets $ (425,685) $ (9,690) $ (415,995) 100.0% Total Budget $ 12,014,645 $ 13,093,757 $ (1,079,112) -8.2% CHANGE IN WORKING CAPITAL $ 867,003 $ (157,311) $ 1,024, % FTEs (3.75)
74 Florida Reliability Coordinating Council, Inc Statement of Activities and Capital Expenditures Based on Audited TOTAL STATUTORY ONLY For the Year Ended 12/31/2013 (In Whole Dollars) 2013 Actual 2013 Budget Funding ERO Funding ERO Assessments $ 5,957,970 5,957, Variance % $ $ (1) Penalty Sanctions 304, ,500 - Total ERO Funding $ 6,262,470 $ 6,262,471 $ (1) Membership Dues Testing Fees Services & Software 22,650 22, Workshops 99,385 90,000 9,385 Interest Miscellaneous Total Funding $ 6,384,505 $ 6,374,471 $ 10, % Expenses Personnel Expenses Salaries $ 3,286,539 $ 3,741,113 $ (454,574) Payroll Taxes 201, ,656 (39,543) Benefits 489, ,629 (44,295) Retirement Costs 440, ,863 (86,191) Total Personnel Expenses $ 4,417,658 $ 5,042,261 $ (624,603) -12.4% Meeting Expenses Meetings $ 86,452 $ 83,259 $ 3,193 Travel 144, ,363 (88,013) Conference Calls 14,301 19,347 (5,046) Total Meeting Expenses $ 245,103 $ 334,969 $ (89,866) -26.8% Operating Expenses Consultants & Contracts $ 336,548 $ 176,977 $ 159,571 Office Rent 513, ,285 (59,191) Office Costs 113, ,513 (86,450) Professional Services 47, ,538 (128,707) Miscellaneous Depreciation 112,023 93,493 18,530 Total Operating Expenses $ 1,122,559 $ 1,218,806 $ (96,247) -7.9% Total Indirect Expenses $ - $ - $ - Other Non-Operating Expenses $ - $ - $ - Total Expenses $ 5,785,320 $ 6,596,036 $ (810,716) -12.3% Change in Assets $ 599,185 $ (221,565) $ 820, % Fixed Asset Expenditures Depreciation $ (112,023) $ (93,493) $ (18,530) Software CapEx 109,556 25,000 84,556 Furniture & Fixtures CapEx Equipment & Computers CapEx 81,445 4,239 77,206 Leasehold Improvements Increase/(Decrease) in Fixed Assets $ 78,978 $ (64,254) $ 143, % Total Budget $ 5,864,298 $ 6,531,782 $ (667,484) -10.2% CHANGE IN WORKING CAPITAL $ 520,207 $ (157,311) $ 677, % FTEs (4.20) Beginning Working Capital 1/1/2013 1,367, , ,803 Change in Working Capital 520,207 (157,311) 677,518 Working Capital at 12/31/2013 1,887, ,589 1,561,321


75


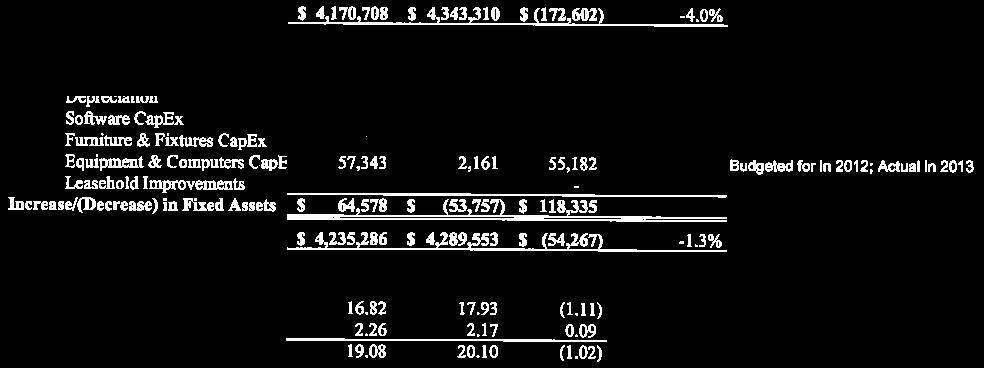
76


77


78


79


80


81

82 FLORIDA RELIABILITY COORDINATING COUNCIL, INC. FINANCIAL STATEMENTS AND SUPPLEMENTAL SCHEDULES December 31, 2013 Certified Public Accountants Business Consultants Limited Liability Company
83 FLORIDA RELIABILITY COORDINATING COUNCIL, INC. TABLE OF CONTENTS PAGE INDEPENDENT AUDITORS REPORT 1-2 FINANCIAL STATEMENTS Statement of Financial Position 3 Statement of Activities 4 Statement of Cash Flows 5 Notes to Financial Statements 6-17 SUPPLEMENTAL INFORMATION Total Summary 18 Statutory Summary 19 Statutory By Program Non-statutory Summary 26 i
84 INDEPENDENT AUDITORS REPORT
85 INDEPENDENT AUDITORS REPORT To the Board of Directors Florida Reliability Coordinating Council, Inc. We have audited the accompanying financial statements of Florida Reliability Coordinating Council, Inc., (a nonprofit organization) which comprise the statement of financial position as of December 31, 2013, and the related statements of activities and cash flows for the year then ended, and the related notes to the financial statements. Management s Responsibility for the Financial Statements Management is responsible for the preparation and fair presentation of these financial statements in accordance with accounting principles generally accepted in the United States of America; this includes the design, implementation, and maintenance of internal control relevant to the preparation and fair presentation of financial statements that are free from material misstatement, whether due to fraud or error. Auditor s Responsibility Our responsibility is to express an opinion on these financial statements based on our audit. We conducted our audit in accordance with auditing standards generally accepted in the United States of America. Those standards require that we plan and perform the audit to obtain reasonable assurance about whether the financial statements are free of material misstatement. An audit involves performing procedures to obtain audit evidence about the amounts and disclosures in the financial statements. The procedures selected depend on the auditor s judgment, including the assessment of the risks of material misstatement of the financial statements, whether due to fraud or error. In making those risk assessments, the auditor considers internal control relevant to the entity s preparation and fair presentation of the financial statements in order to design audit procedures that are appropriate in the circumstances, but not for the purpose of expressing an opinion on the effectiveness of the entity s internal control. Accordingly, we express no such opinion. An audit also includes evaluating the appropriateness of accounting policies used and the reasonableness of significant accounting estimates made by management, as well as evaluating the overall presentation of the financial statements. We believe that the audit evidence we have obtained is sufficient and appropriate to provide a basis for our audit opinion. Opinion In our opinion, the financial statements referred to above present fairly, in all material respects, the statement of financial position of Florida Reliability Coordinating Council as of December 31, 2013 and the changes in its net assets and its cash flows for the year then ended in accordance with accounting principles generally accepted in the United States of America.
86 Other Matter Our audit was conducted for the purpose of forming an opinion on the financial statements as a whole. The statutory and non-statutory schedules on Pages 18 to 26 inclusive are presented for purposes of additional analysis and are not a required part of the financial statements. Such information is the responsibility of management and was derived from and relates directly to the underlying accounting and other records used to prepare the financial statements. The information has been subjected to the auditing procedures applied in the audit of the financial statements and certain additional procedures, including comparing and reconciling such information directly to the underlying accounting and other records used to prepare the financial statements or to the financial statements themselves, and other additional procedures in accordance with auditing standards generally accepted in the United States of America. In our opinion, the information is fairly stated in all material respects in relation to the financial statements as a whole. CARR, RIGGS & INGRAM, LLC Certified Public Accountants January 31,
87 FINANCIAL STATEMENTS
88 FLORIDA RELIABILITY COORDINATING COUNCIL, INC. STATEMENT OF FINANCIAL POSITION December 31, 2013 ASSETS Current assets: Cash $ 6,558,632 Member receivables 2,835,667 Related party receivable 19,403 Prepaid expenses 18,526 Total current assets 9,432,228 Property and equipment - at cost Equipment and computers 560,153 Software 910,964 Furniture and fixtures 317,732 Leasehold improvements 126,636 Total 1,915,485 Less accumulated depreciation and amortization (1,497,031) Total property and equipment, net 418,454 Other assets Deposits 150, (f) plan 109,175 Total other assets 259,175 Total assets $ 10,109,857 LIABILITIES AND NET ASSETS Current liabilities: Accounts payable $ 379,159 Current portion of accrued postretirement benefit obligation 32, (f) plan payable 109,175 Deferred revenue 3,111,955 Compliance penalty assessment 481,000 Accrued expenses 2,067,785 Total current liabilities 6,181,988 Long-term liabilities: Accrued postretirement benefit obligation 1,373,908 Net assets: Unrestricted statutory - FERC designated 1,966,888 Unrestricted member services - board designated 587,073 Total net assets 2,553,961 Total liabilities and net assets $ 10,109,857 See Notes to Financial Statements
89 FLORIDA RELIABILITY COORDINATING COUNCIL, INC. STATEMENT OF ACTIVITIES For the year ended December 31, 2013 Revenues: Nonstatutory member assessments $ 6,250,976 Statutory member assessments 5,957,970 Services and software 314,641 Training and education fees 99,385 Postretirement benefit loss (45,824) Gain on 457(f) Plan 22,127 Penalty and sanctions realized 304,500 Total revenue 12,903,775 Expenses: Salaries 5,174,009 Payroll taxes 314,794 Employee benefits 783,735 Retirement and deferred compensation plans 688,048 Meetings 115,998 Travel 182,644 Conference calls 31,301 Contracts & consultants 3,039,370 Facilities rental 720,244 Office costs 573,638 Legal and accounting 83,668 Penalty sanctions 75, (f) plan 22,127 Depreciation and amortization 138,050 Total expenses 11,942,626 Increase in net assets before change in accumulated post retirement obligation 961,149 Net periodic change in postretirement obligation (519,831) Increase in net assets 441,318 Net assets - beginning of year 2,112,643 Net assets - end of year $ 2,553,961 See Notes to Financial Statements
90 FLORIDA RELIABILITY COORDINATING COUNCIL, INC. STATEMENT OF CASH FLOWS For the year ended December 31, 2013 Cash flows from operating activities: Cash received from members $ 12,705,017 Cash paid to suppliers and employees (10,561,406) Net cash provided by operating activities 2,143,611 Cash flows from investing activities Purchases of software and equipment (278,020) Net cash used by investing activities (278,020) Net increase in cash 1,865,591 Cash at beginning of year $ 4,693,041 Cash at end of year $ 6,558,632 Reconciliation of increase in net assets to net cash used by operating activities Increase in net assets $ 441,318 Adjustments to reconcile increase in net assets to net cash used by operating activities: Depreciation and amortization 138,050 Increase in receivables, prepaid expenses, and other assets (217,496) Increase in accounts payable and accrued expenses 1,160,116 Change in postretirement benefit obligation 565,655 Increase in deferred income 55,968 Net cash provided by operating activities $ 2,143,611 See Notes to Financial Statements
91 FLORIDA RELIABILITY COORDINATING COUNCIL, INC. NOTES TO FINANCIAL STATEMENTS December 31, General and Summary of Significant Accounting Policies General Florida Reliability Coordinating Council, Inc. (the Company ) is a group of electric utilities and energy marketers primarily doing business in the State of Florida. The purpose of the Company is to ensure and enhance the reliability and adequacy of the bulk power supply in Florida (which is defined as the general area encompassed by Peninsula Florida) now and into the future. The Company serves as a Regional Entity with delegated authority from the North American Electric Reliability Corporation ( NERC ) for the purpose of proposing and enforcing reliability standards within the FRCC region. On May 2, 2007, the Company entered into a Delegation Agreement with North American Electric Reliability Corporation ( NERC ), an organization certified by the Federal Energy Regulatory Commission pursuant to Section 215(c) of the Federal Power Act. The Company is required by federal law to assess the reliability of the Bulk Power System. The Federal Energy Regulatory Commission ( FERC ) empowered the Company through a Delegation Agreement with NERC to monitor, enforce and implement electric reliability standards under Section 215 of the Federal Power Act. The Company is responsible for establishing the process for development, revision, withdrawals and approval of the Company s Regional Reliability Standards for the region. The Company monitors and enforces compliance with NERC and FERC reliability standards through on-site audits, self-certifications, periodic spot checks, self-reports, event investigation, periodic data submittal, exception reporting and through complaints. The initial term of the agreement is for three years and is renewable for five more years upon a successful compliance audit conducted by NERC. The Company s source of revenue is split into two parts. The statutory functions, defined as those functions being performed for Reliability Standards and Compliance, are funded by NERC. The member services functions are paid by its members who are assessed for costs and expenses of establishing, developing, operating and maintaining the Company. A summary of the Company s significant accounting policies consistently applied in preparation of the accompanying financial statements follows: The financial statements have been prepared on the accrual basis of accounting in accordance with accounting principles generally accepted in the United States of America; consequently, revenues and gains are recognized when earned, and expenses and losses are recognized when incurred. Concentration of Credit Risk The Company places its cash with high credit quality institutions. At times, these balances may be in excess of the FDIC insurance limit. Use of Estimates Management uses estimates and assumptions in preparing these financial statements in accordance with accounting principles generally accepted in the United States of America. Those estimates and assumptions affect the reported amounts of assets, liabilities, revenues and expenses. Actual results could vary from the estimates that are used. Income Taxes The Company has been approved for tax-exempt status under Section 501(c) (6) of the Internal Revenue Code and is exempt from federal and state income taxes. Accordingly, no provision for income taxes is included in the financial statements. Tax years after 2009 remain subject to examination by taxing authorities
92 FLORIDA RELIABILITY COORDINATING COUNCIL, INC. NOTES TO FINANCIAL STATEMENTS December 31, General and Summary of Significant Accounting Policies (Continued) The Company follows Accounting Standard Codification (ASC) 740, Accounting for Income Taxes with respect to accounting for uncertainty in income taxes. A tax position is recognized as a benefit only if it is more likely than not that the tax position would be sustained in a tax examination, with a tax examination being presumed to occur. The amount recognized is the largest amount of tax benefit that is greater than 50% likely of being realized on examination. For tax positions not meeting the more likely than not test, no tax benefit is recorded. Due to its tax-exempt status, the Company is not subject to U.S. federal income tax or state income tax. The Company s Form 990 has not been subject to examination by the Internal Revenue Service or the State of Florida for the last three years. The Company has not recognized liability for unrecognized tax benefits as it has no known tax positions that would subject the Company to any material income tax exposure. A reconciliation of the beginning and ending amount of unrecognized tax benefits and interest accrued related to unrecognized tax benefits are not included nor is there any interest accrued related to unrecognized tax benefits or interest expense and penalties in operating expenses as there are no unrecognized tax benefits. Member, Related Party, and Other Receivables The Company considers all receivables to be fully collectible, usually within 30 to 60 days; accordingly, no allowance for doubtful accounts is required and no late fees are assessed. If amounts become uncollectible, they will be charged to operations when that determination is made and will be paid by the remaining members. Property and Equipment Property and equipment with a cost over $500 are capitalized and are stated at cost, less accumulated depreciation and amortization. Depreciation and amortization are provided for in amounts sufficient to relate the cost of depreciable assets to operations over their estimated service lives, principally on a straight-line basis. The estimated lives used in determining depreciation are: Equipment Software Furniture and fixtures Leasehold improvements 5 years 3 years 7 years 5 years Leasehold improvements are amortized over the lives of the respective leases or the service lives of the improvements, whichever is shorter
93 FLORIDA RELIABILITY COORDINATING COUNCIL, INC. NOTES TO FINANCIAL STATEMENTS December 31, General and Summary of Significant Accounting Policies (Continued) Line of Credit The Company secured a line of credit from Bank of America, N.A. for two (2) years in the amount of $1,500,000. The line of credit is intended to be used for short term needs that arise between budget funding periods as a bridge between budget years. The covenants call for a funded debt to total unrestricted and temporarily restricted net assets not exceeding 2.0:1.0 and an out of debt period of 30 days each line year. The total charges and fees for 2 year term were paid in 2013 and amounted to $8,095. As of December 31, 2013, the company has not drawn on the line of credit and is in full compliance with all covenants. Postretirement Benefits Other Than Pensions The Company sponsors a postretirement health care plan covering employees hired before October 1, 2003 if the retiree completes 10 years of service prior to retirement, is over the age of 60 at retirement and participates in the Company s IRS qualified retirement or profit-sharing plan at the time of retirement. The plan is noncontributory for retirees (see Note 6). Date of Management s Review Management has evaluated events and transactions for potential recognition or disclosure through January 31, 2014, which is the date the financial statements were available to be issued. 2. Fair Value Measurements Financial Accounting Standards Board ASC 820 establishes a framework for measuring fair value. That framework provides a fair value hierarchy that prioritizes the inputs to valuation techniques used to measure fair value. The hierarchy gives the highest priority to unadjusted quoted prices in active markets for identical assets or liabilities (level 1 measurement) and the lowest priority to unobservable inputs (level 3 measurements). The three levels of the fair value hierarchy under FASB ASC 820 are described below: Level 1: Inputs to the valuation methodology are unadjusted quoted prices for identical assets or liabilities in active markets that the Organization has the ability to access. Level 2: Inputs to the valuation methodology include: Quoted prices for similar assets or liabilities in active markets Quoted prices for identical or similar assets or liabilities in inactive markets Inputs other than quoted prices that are observable for that asset or liability Inputs that are derived principally from or corroborated by observable market data by correlation or other means If the asset or liability has a specified (contractual) term, the Level 2 input must be observable for substantially the full term of the asset or liability. Level 3: Inputs to the valuation methodology are unobservable and significant to the fair value measurement
94 FLORIDA RELIABILITY COORDINATING COUNCIL, INC. NOTES TO FINANCIAL STATEMENTS December 31, Fair Value Measurements (Continued) The asset s or liability s fair value measurement level within the fair value hierarchy is based on the lowest level of any input that is significant to the fair value measurement. Valuation techniques used need to maximize the use of observable inputs and minimize the use of unobservable inputs. The following is a description of the valuation methodologies used for the Organization s securities invested in the 457(f) Retirement Plan measured at fair value as of December 31, 2013: Cash and cash equivalents: The carrying amounts reported in the Statements of Financial Position approximate the fair value because of the short maturities of those instruments. Mutual funds: Measured at net asset value within in the active market on which the individual securities are traded. The methods described above may produce a fair value calculation that may not be indicative of the net realizable value or reflective of future fair values. Furthermore, while the Organization believes its valuation methods are appropriate and consistent with other market participants, the use of different methodologies or assumptions to determine the fair value of certain financial instruments could result in a different fair value measurement at the reporting date. The fair values of the Organization s securities invested in the 457(f) Retirement Plan, classified by level, are as follows: December 31, 2013 Fair Value Level 1 Level 2 Level 3 Cash and equivalents $ 851 $ 851 $ - $ - Mutual funds - fixed income 17,181 17, Mutual funds - equities 91,143 91, Total $ 109,175 $ 109,175 $ - $ - The fair value and cost of the Organization s securities invested in the 457(f) Retirement Plan, as of December 31, 2013 are as follows: Cost Value Market Value Cash and equivalents $ 851 $ 851 Mutual funds - fixed income 17,594 17,181 Mutual funds - equities 70,654 91,143 Total $ 89,099 $ 109,
95 FLORIDA RELIABILITY COORDINATING COUNCIL, INC. NOTES TO FINANCIAL STATEMENTS December 31, Deferred Revenues The contracts with the members of FRCC have a provision in them that provides that they have 30 days from the date of invoice for a new budgetary year (January through December) to withdraw from membership. Therefore, the Company made a decision to invoice all members on December 1 for the first quarterly installment of the 2014 budget, thus at December 31, 2013 it would be known whether all members are continuing with their membership. 4. Commitments In December 2003, the Company entered into an agreement with Sprint Communications Company L.P. ( Sprint ) to provide certain telecommunication services that are passed through to certain members beginning in 2004 for the Company s network. The initial term of the agreement is 36 months and has been renewed for an additional 12-month period each year thereafter. The agreement calls for the Company to make a minimum service commitment of $96,000 for each contract year of the term. In December 2006, the Company entered into an agreement with Open Access Technology International, Inc. to provide the Florida Transaction Management System ( FTMS ) services for the Company s customers. The initial term of the agreement was 36 months at $3,750 per month and has been renewed for an additional 12-month period each year thereafter. In 2013, the Company renewed this contract for 36 months at an annual cost of $57,000. In addition, several enhancements to the FTMS service were agreed upon of which $27,000 was paid for in 2013 and $27,000 will be paid in 2014 at the completion of the enhancements. The Company also has the option to purchase the system for $100,000; however, at this time, the Company has no intention of doing so. In November 2007, the Company entered into an agreement to purchase Compliance Tracking System software from Guidance Solutions, Inc. In 2008, the Company entered into an agreement with several of the other regional entities to form a consortium and share the cost of future enhancements and program modules to add to the Compliance Tracking System originally purchased from Guidance Solutions, Inc. In June of 2011, the consortium broke up with certain member regions deciding to change software and vendors and go in a different direction for their Compliance Tracking System. The Company decided to remain with Guidance and has agreed to share costs of software enhancements with one other region that remains with Guidance. The cost of enhancements added or in progress for 2013 was $109,556. The Company is obligated for enhancements in progress as of December 31, 2013 from this regional agreement of approximately $28,800 for enhancements to be completed in The Company is also obligated for enhancements of their own system for $7,000 to be completed in In May of 2013, the Company entered into an agreement with other Eastern Interconnection Reliability Coordinators and created the Interchange Distribution Calculator (IDC) Tools Member Association to manage the IDC Application contract that in prior years was managed by NERC. This tool is used to manage transmission congestion across the Eastern Interconnection. The agreement calls for the Company to make a minimum service commitment of $118,600 for each contract year of the term. In May of 2013 the Company entered into agreements with Cisco Systems Capital Corporation to provide WebEx online presentation and audio conferencing services
96 FLORIDA RELIABILITY COORDINATING COUNCIL, INC. NOTES TO FINANCIAL STATEMENTS December 31, Commitments (Continued) The initial term of the agreement is for 36 months and call for the Company to make a total commitment of $130,500 over the 36-month term. In July 2013, the company entered into an agreement with TW Telecom Holdings, Inc. (TW Telecom) to provide required redundant telecommunications for the FRCCnet wide area network that provides data to the FRCC reliability Coordinator. The initial term of the agreement is 36 months and calls for the Company to make a minimum service commitment of $68,400 for each contract year of the term. 5. Operating Leases The Company leases its facilities and has operating leases that expire September 30, 2020 at its current location on Bayport Drive. The Bayport Plaza lease required a $150,000 deposit. For all leases, rental payments escalate based on the schedules set forth in the lease agreement. Minimum future rental payments are: Year ended December 31, 2014 $ 745, , , , , and thereafter 1,498,850 $ 5,437,857 Rent expense charged to operations during the year ended December 31, 2013 was $720,244, including the effects of lease payment escalations over the term of the leases. For all leases, the future expense to be recognized including the effects of rent abatements and rent escalations are as follows: Year Ended December 31, 2014 $ 750, , , , , and thereafter $ 1,313,557 5,066,
97 FLORIDA RELIABILITY COORDINATING COUNCIL, INC. NOTES TO FINANCIAL STATEMENTS December 31, Postretirement Benefits Other Than Pensions The Company adheres to ASC , Defined Benefit Plans - Other Post Retirement, which requires companies to report the funded status (defined as the difference between the fair value of plan assets and the plan s benefit obligation) of their postretirement plan. The current year effect is a $519,831 increase to unrestricted net assets. The following table sets forth the plan s funded status reconciled with the amount shown in the Company s statement of financial position at December 31, 2013: Accumulated postretirement benefit oligation: Plan assets at fair value -0- Funded status -0- Accrued postretirement benefit obligation: Current portion $ 32,914 Long-term portion $ 1,373,908 1,406,822 Since the plan is non-contributory, the entire balance of the accumulated benefit obligation is recorded as a liability in the statement of financial position as of December 31, Benefits expected to be paid in each of the next five years are as follows: Year Ended December 31, 2014 $ 32, , , , , and thereafter 391,970 $ 610,
98 FLORIDA RELIABILITY COORDINATING COUNCIL, INC. NOTES TO FINANCIAL STATEMENTS December 31, Postretirement Benefits Other Than Pensions (Continued) The following provides the components of net periodic postretirement benefit cost for the year ended December 31, Service Cost $ (25,156) Interest Cost (31,214) Amortization of unrecognized net obligation (10,664) Recognition of net actuarial gain 3,607 Net periodic postretirement benefit cost (63,427) Benefits paid during ,603 Net postretirement benefit loss $ (45,824) Items not yet recognized as a component of net periodic postretirement benefit costs Unrecognized net loss $ (404,717) Unrecognized net transition obligations (39,983) Transitional effect of ASC (444,700) Postretirement effect of ASC as of December $ 75,131 Net periodic change in postretirement obligation (519,831) Postretirement obligation recognized as a component of net periodic benefit cost as of December 31, 2013 $ (444,700)
99 FLORIDA RELIABILITY COORDINATING COUNCIL, INC. NOTES TO FINANCIAL STATEMENTS December 31, Postretirement Benefits Other Than Pensions (Continued) Amounts included in unrestricted net assets and expected to be recognized as components of net periodic benefit gain (cost) next year include amortization of unrecognized net obligation and net actuarial gain of approximately ($11,000) and $3,607, respectively. For measurement purposes, an 8% annual rate increase in the per capita cost of covered health care benefits was assumed for 2015; the rate was assumed to decrease to 7% for 2016; 6% for 2017 and remain at 5% thereafter. The health care cost trend rate assumption has a significant effect on the amounts reported. To illustrate, if assumed health care cost trend rates were increased by one percentage point in each year, the accumulated postretirement benefit obligation at December 31, 2013 would be increased $257,009 and the aggregate of the service and interest cost components of net periodic postretirement benefit cost for the year ended December 31, 2013 would be increased by $9,353. The weighted average discount rate used in estimating the accumulated postretirement benefit obligation was 3.75%. Mortality was based on the RP-2000 Combined Mortality Tables for Healthy Males and Females. The measurement date of the accumulated postretirement benefit obligation was December 31, Glossary: Accumulated postretirement benefit obligation The actuarial present value of benefits attributed to employee service rendered to a particular date. Net periodic postretirement benefit gain The amount recognized in the financial statements as the gain of the postretirement benefit plan for a period. In December of 2003, the Medicare Prescription Drug, Improvement and Modernization Act of 2003 (Act) was signed into law. The Act includes a special subsidy for employers that sponsor retiree health benefit plans with prescription drug benefits that are as favorable as the Medicare Part D benefit. The Company has not determined whether its plan is actuarially equivalent to the Medicare Part D benefit due to the cost of obtaining such an actuarial computation. 7. Retirement Plan Effective January 1, 2001, the Company adopted a 401(k) Plan ( Plan ) intended to benefit substantially all employees with 6 months of service and 21 years of age. On September 30, 2007, the plan was amended to enable employees with one hour of service to be eligible to enter the plan. Participants can contribute any amount of their compensation for the Plan year, not to exceed the limits determined by the Internal Revenue Code. The Company may make matching contributions with prescribed limits. The Company may also make additional non-elective discretionary contributions to the Plan. The Company made matching contributions to the Plan of $250,909 and a discretionary contribution to the Plan of $434,433 (net of forfeitures) for the year ending December 31, Deferred Compensation The Company implemented an executive deferred compensation plan subject to Section 457(f) of the Internal Revenue Code in For the year ended December 31, 2013, the Company contributed $8,492 to benefit the participant in this Plan. In 2013, the Company adopted a Nonqualified 457(b) Retirement Plan ( Retirement Plan ), to be effective January 1, 2014, intended to benefit key managerial employees of the Company. The amount expensed in 2013 and to be funded in 2014 is $16,
100 FLORIDA RELIABILITY COORDINATING COUNCIL, INC. NOTES TO FINANCIAL STATEMENTS December 31, Related Parties Various members of the Company are founding members of Florida Electric Power Coordinating Group, Inc. ( FCG ) and the organizations, excluding the board of directors, are under common management. FCG is a nonprofit organization operating under Section 501(c)(6) of the Internal Revenue Code and is exempt from federal and state income taxes. The Company is providing FCG with administrative and accounting services, including the use of office space. FCG reimbursed the Company approximately 3.46% of the Company s administrative expenses in The service agreement with FCG is a one-year agreement that will automatically renew unless canceled in advance by either party. The original agreement was renewed for an additional year in February At December 31, 2013, the Company had billed and collected a total of $276,901 from FCG relating to the service agreement and has a receivable from FCG in the amount of $19,403. The Company is purchasing the services from Florida Power and Light ( FPL ), a member of the Company, to fulfill the responsibilities of reliability coordinator, operations planning coordinator, state capacity emergency coordinator as well as various other services. The Company paid FPL $2,073,322 relating all of to these services and at December 31, 2013 had $683,463 of accrued expenses recorded on the books. 9. Concentrations Two members make up approximately 54.8% of the member services assessments and dues. The same two members comprise 67.1% of the statutory assessment that NERC bills directly in order to fund the Company for its statutory functions. 10. Contingencies As part of the Company s Delegation Agreement with NERC, the Company has the authority to fine entities within its region for violation of reliability standards. During 2013, six (6) notices of penalty were filed with FERC with settlement agreements addressing alleged violations of reliability standards for the entities within the FRCC region. The penalties totaling $248,000 as of December 31, 2013, were approved by FERC and paid by the entities. The Delegation Agreement Rules of Procedures from NERC stipulate that any penalty monies collected by June 30 of each year, which is between budget submissions, are to be held until they can be accounted for in a budget submission. At year-end December 31, 2013, a total of $481,000 penalty assessment is being held for future use of which $343,000 was accounted for in the 2014 budget submission and will be taken into operating income at the beginning of 2014 to offset funding from all entities in the region. The balance, plus any penalties billed and collected prior to June 30, 2014 will be held and accounted for in the 2015 budget submission. The Company is the registered entity for the FRCC Region Reliability Coordinator functions and as a Planning Authority within the FRCC region. As a NERC registered entity, the Company must comply with applicable NERC reliability standards. Violations of these standards can result in financial penalties. The Company is involved in various enforcement actions for possible violations of electric reliability standards related to the NERC registered entity functions
101 FLORIDA RELIABILITY COORDINATING COUNCIL, INC. NOTES TO FINANCIAL STATEMENTS December 31, Contingencies - (Continued) Several of the possible violations were self-reported by FRCC which may result in no penalty. At this time, the Company cannot fully determine the effect of the possible penalties that may arise. Based on the limited information available at this time the Company estimates that it is reasonably possible for a penalty to be assessed ranging from $75,000 to $125,000, however the Company cannot conclude that any amount within this range is a better estimate than any other, and accordingly the Company has included $75,000 as an accrued contingent liability. 11. Functional Expenses The detail of functional expenses for the year ended is as follows: Statutory expenses: Reliability Standards Development $ 229,145 Compliance & Enforcement 4,170,708 Reliability Assessment & Performance Analysis 1,109,679 Training & Education 259,144 Situational Awareness & Infrastructure 16,643 Total statutory expenses $ 5,785,319 Member Services expenses: Planning Committee 710,959 Operating Committee 5,424,221 General & Administrative 519,831 Total member services expenses 6,655,011 Total Expenses $ 12,440,
102 FLORIDA RELIABILITY COORDINATING COUNCIL, INC. NOTES TO FINANCIAL STATEMENTS December 31, Net Assets Unrestricted net assets that are designated are FERC-approved for statutory expense or boardapproved for member services expense segregations of unrestricted net assets for specific projects. Since designations are voluntary and may be reversed or redirected by the governing board at any time, designated portions of net assets are not considered restricted. The detail of unrestricted FERC or board-designated net assets is as follows at year end: Statutory $ 1,966,888 Member Services $ 587,073 Total unrestricted-board designated net assets $ 2,553,
103 SUPPLEMENTAL INFORMATION
104 Florida Reliability Coordinating Council, Inc. Statement of Activities - Total Actual To Total Budget TOTAL COMPANY December 31, 2013 (In Whole Dollars) 2013 Actual 2013 Budget 2013 Variance % Funding ERO Funding ERO Assessments $ 5,957,970 $ 5,957,971 $ (1) Penalty Sanctions 304, ,500 - Total ERO Funding $ 6,262,470 $ 6,262,471 $ (1) $ - Membership Dues $ 6,250,976 $ 6,250,975 1 Testing Fees Services & Software 314, ,000 (18,359) Workshops 99,385 90,000 9,385 Interest Special Assessment NonCash Post Ret Gain (Loss) (45,824) - (45,824) Total Funding $ 12,881,648 $ 12,936,446 $ (54,798) -0.4% Expenses Personnel Expenses Salaries $ 5,174,009 $ 5,569,794 (395,785) Payroll Taxes 314, ,291 (43,497) Benefits 783, ,937 12,798 Retirement Costs 688, ,397 (96,349) Total Personnel Expenses $ 6,960,586 $ 7,483,419 $ (522,833) -7.0% Meeting Expenses Meetings $ 115,998 $ 98,669 17,329 Travel 182, ,787 (128,143) Conference Calls 31,301 42,543 (11,242) Total Meeting Expenses $ 329,943 $ 451,999 $ (122,056) -27.0% Operating Expenses Consultants & Contracts $ 3,039,370 $ 3,192,699 (153,329) Office Rent 720, ,044 (18,800) Office Costs 573, ,392 (122,754) Professional Services 83, ,504 (338,836) Miscellaneous 75,000-75,000 Depreciation 138, ,390 20,660 Total Operating Expenses $ 4,629,970 $ 5,168,029 $ (538,059) -10.4% Total Indirect Expenses $ - $ - $ - Other Non-Operating Expenses $ 519,831 $ - $ 519,831 Total Expenses $ 12,440,330 $ 13,103,447 $ (663,117) -5.1% Change in Assets $ 441,318 $ (167,001) $ 608, % Fixed Asset Expenditures Depreciation $ (138,050) $ (117,390) $ (20,660) Non Pension Post Retir. Oblig (565,655) - (565,655) Software CapEx 136,556 25, ,556 Furniture & Fixtures CapEx 4,882-4,882 Equipment & Computers CapEx 136,582 82,700 53,882 Leasehold Improvements Increase/(Decrease) in Fixed Assets $ (425,685) $ (9,690) $ (415,995) 100.0% Total Budget $ 12,014,645 $ 13,093,757 $ (1,079,112) -8.2% CHANGE IN WORKING CAPITAL $ 867,003 $ (157,311) $ 1,024, % FTEs (3.75) See Independent Auditors Report
105 Florida Reliability Coordinating Council, Inc. Statement of Activities - Total Actual To Total Budget TOTAL Statutory Only December 31, 2013 (In Whole Dollars) 2013 Actual 2013 Budget 2013 Variance % Funding ERO Funding ERO Assessments $ 5,957,970 $ 5,957,971 $ (1) Penalty Sanctions 304, ,500 - Total ERO Funding $ 6,262,470 $ 6,262,471 $ (1) Membership Dues Testing Fees Services & Software 22,650 22, Workshops 99,385 90,000 9,385 Interest Miscellaneous Total Funding $ 6,384,505 $ 6,374,471 $ 10, % Expenses Personnel Expenses Salaries $ 3,286,539 $ 3,741,113 $ (454,574) Payroll Taxes 201, ,656 (39,543) Benefits 489, ,629 (44,295) Retirement Costs 440, ,863 (86,191) Total Personnel Expenses $ 4,417,658 $ 5,042,261 $ (624,603) -12.4% Meeting Expenses Meetings $ 86,452 $ 83,259 $ 3,193 Travel 144, ,363 (88,013) Conference Calls 14,301 19,347 (5,046) Total Meeting Expenses $ 245,103 $ 334,969 $ (89,866) -26.8% Operating Expenses Consultants & Contracts $ 336,548 $ 176,977 $ 159,571 Office Rent 513, ,285 (59,191) Office Costs 113, ,513 (86,450) Professional Services 47, ,538 (128,707) Miscellaneous Depreciation 112,023 93,493 18,530 Total Operating Expenses $ 1,122,559 $ 1,218,806 $ (96,247) -7.9% Total Indirect Expenses $ - $ - $ - Other Non-Operating Expenses $ - $ - $ - Total Expenses $ 5,785,320 $ 6,596,036 $ (810,716) -12.3% Change in Assets $ 599,185 $ (221,565) $ 820, % Fixed Asset Expenditures Depreciation $ (112,023) $ (93,493) $ (18,530) Software CapEx 109,556 25,000 84,556 Furniture & Fixtures CapEx Equipment & Computers CapEx 81,445 4,239 77,206 Leasehold Improvements Increase/(Decrease) in Fixed Assets $ 78,978 $ (64,254) $ 143, % Total Budget $ 5,864,298 $ 6,531,782 $ (667,484) -10.2% CHANGE IN WORKING CAPITAL $ 520,207 $ (157,311) $ 677, % FTEs (4.20) Beginning Working Capital 1/1/2012 1,367, , ,803 Change in Working Capital 520,207 (157,311) 677,518 Working Capital at 12/31/2012 1,887, ,589 1,561,321 See Independent Auditors Report
106 Florida Reliability Coordinating Council, Inc. Statement of Activities - Total Actual To Total Budget RELIABILITY STANDARDS December 31, 2013 (In Whole Dollars) 2013 Actual 2013 Budget 2013 Variance % Funding ERO Funding ERO Assessments $ 381,624 $ 381,622 $ 2 Penalty Sanctions 19,053 19,053 - Total ERO Funding $ 400,677 $ 400,675 $ 2 Membership Dues $ - - Testing Fees - - Services & Software - Workshops - Interest Miscellaneous Total Funding $ 400,677 $ 400,675 $ 2 0.0% Expenses Personnel Expenses Salaries 120,361 $ 204,940 (84,579) Payroll Taxes 7,613 13,183 (5,570) Benefits 17,108 34,059 (16,951) Retirement Costs 15,984 28,862 (12,878) Total Personnel Expenses $ 161,066 $ 281,044 $ (119,978) -42.7% Meeting Expenses Meetings $ 876 $ 1,002 (126) Travel 17,823 35,721 (17,898) Conference Calls (47) Total Meeting Expenses $ 19,419 $ 37,490 $ (18,071) -48.2% Operating Expenses Consultants & Contracts $ 1,226 $ - 1,226 Office Rent 12,837 18,690 (5,853) Office Costs 4,357 9,136 (4,779) Professional Services 1,785 12,134 (10,349) Miscellaneous - Depreciation 890 1,342 (452) Total Operating Expenses $ 21,095 $ 41,302 $ (20,207) -48.9% Total Indirect Expenses $ 27,565 $ 41,958 $ (14,393) -34.3% Other Non-Operating Expenses $ - $ - $ - Total Expenses $ 229,145 $ 401,794 $ (172,649) -43.0% Change in Assets $ 171,532 $ (1,119) $ 172, % Fixed Asset Expenditures Depreciation $ (890) $ (1,342) $ 452 Software CapEx - Furniture & Fixtures CapEx - Equipment & Computers CapEx 3, ,423 Leasehold Improvements - Increase/(Decrease) in Fixed Assets $ 2,756 $ (1,119) $ 3, % Total Budget $ 231,901 $ 400,675 $ (168,774) -42.1% CHANGE IN WORKING CAPITAL $ 168,776 $ - $ 168,776 Direct FTEs (0.64) -38.8% Indirect FTE's (0.27) -65.9% Total FTE's (0.91) -44.2% See Independent Auditors Report
107 Florida Reliability Coordinating Council, Inc. Statement of Activities - Total Actual To Total Budget COMPLIANCE December 31, 2013 (In Whole Dollars) 2013 Actual 2013 Budget 2013 Variance % Funding ERO Funding ERO Assessments $ 4,082,506 $ 4,082,511 $ (5) Penalty Sanctions 207, ,042 - Total ERO Funding $ 4,289,548 $ 4,289,553 $ (5) Membership Dues - $ - - Testing Fees - - Services & Software - Workshops - Interest Miscellaneous Total Funding $ 4,289,548 $ 4,289,553 $ (5) 0.0% Expenses Personnel Expenses Salaries $ 2,091,678 $ 2,227,031 (135,353) Payroll Taxes 126, ,260 (16,842) Benefits 332, ,490 11,220 Retirement Costs 282, ,634 (31,000) Total Personnel Expenses $ 2,833,440 $ 3,005,415 $ (171,975) -5.7% Meeting Expenses Meetings $ 12,154 $ 6,501 5,653 Travel 76, ,336 (54,345) Conference Calls 9,324 3,285 6,039 Total Meeting Expenses $ 98,469 $ 141,122 $ (42,653) -30.2% Operating Expenses Consultants & Contracts $ 195,037 $ 16, ,237 Office Rent 385, ,212 (49,029) Office Costs 72,858 91,091 (18,233) Professional Services 34, ,809 (83,205) Miscellaneous - Depreciation 102,321 80,918 21,403 Total Operating Expenses $ 790,003 $ 740,830 $ 49, % Total Indirect Expenses $ 448,796 $ 455,943 $ (7,147) -1.6% Other Non-Operating Expenses $ - $ - $ - Total Expenses $ 4,170,708 $ 4,343,310 $ (172,602) -4.0% Change in Assets $ 118,840 $ (53,757) $ 172,597 Fixed Asset Expenditures Depreciation $ (102,321) $ (80,918) $ (21,403) Software CapEx 109,556 25,000 84,556 Furniture & Fixtures CapEx - Equipment & Computers CapEx 57,343 2,161 55,182 Leasehold Improvements - Increase/(Decrease) in Fixed Assets $ 64,578 $ (53,757) $ 118,335 Total Budget $ 4,235,286 $ 4,289,553 $ (54,267) -1.3% CHANGE IN WORKING CAPITAL $ 54,262 $ - $ 54,262 Direct FTEs (1.11) -6.2% Indirect FTE's % Total FTE's (1.02) -5.1% See Independent Auditors Report
108 Florida Reliability Coordinating Council, Inc. Statement of Activities - Total Actual To Total Budget RELIABILITY ASSESSMENT December 31, 2013 (In Whole Dollars) 2013 Actual 2013 Budget 2013 Variance % Funding ERO Funding ERO Assessments $ 1,314,299 $ 1,314,299 $ - Penalty Sanctions 62,701 62,701 - Total ERO Funding $ 1,377,000 $ 1,377,000 $ - Membership Dues - $ - - Testing Fees - - Services & Software 22,650 22, Workshops - Interest Miscellaneous Total Funding $ 1,399,650 $ 1,399,000 $ % Expenses Personnel Expenses Salaries $ 555,631 $ 674,444 (118,813) Payroll Taxes 34,375 43,385 (9,010) Benefits 78,830 97,086 (18,256) Retirement Costs 73,102 94,982 (21,880) Total Personnel Expenses $ 741,938 $ 909,897 $ (167,959) -18.5% Meeting Expenses Meetings $ 3,021 $ 4,810 (1,789) Travel 45,477 49,865 (4,388) Conference Calls 3,309 10,387 (7,078) Total Meeting Expenses $ 51,807 $ 65,062 $ (13,255) -20.4% Operating Expenses Consultants & Contracts $ 105,426 $ 115,177 $ (9,751) Office Rent 59,663 61,504 (1,841) Office Costs 17,254 71,379 (54,125) Professional Services 10,055 37,218 (27,163) Miscellaneous - Depreciation 4,066 5,309 (1,243) Total Operating Expenses $ 196,464 $ 290,587 $ (94,123) -32.4% Total Indirect Expenses $ 119,470 $ 138,080 $ (18,610) -13.5% Other Non-Operating Expenses $ - $ - $ - Total Expenses $ 1,109,679 $ 1,403,626 $ (293,947) -20.9% Change in Assets $ 289,971 $ (4,626) $ 294,597 Fixed Asset Expenditures Depreciation $ (4,066) $ (5,309) $ 1,243 Software CapEx - Furniture & Fixtures CapEx - Equipment & Computers CapEx 15, ,883 Leasehold Improvements - Increase/(Decrease) in Fixed Assets $ 11,500 $ (4,626) $ 16, % Total Budget $ 1,121,179 $ 1,399,000 $ (277,821) -19.9% CHANGE IN WORKING CAPITAL $ 278,471 $ - $ 278,471 Direct FTEs (1.07) -19.7% Indirect FTE's (0.33) -35.9% Total FTE's (1.40) -22.0% See Independent Auditors Report
109 Florida Reliability Coordinating Council, Inc. Statement of Activities - Total Actual To Total Budget TRAINING AND EDUCATION December 31, 2013 (In Whole Dollars) 2013 Actual 2013 Budget 2013 Variance % Funding ERO Funding ERO Assessments $ 276,132 $ 276,136 $ (4) Penalty Sanctions 12,817 12,817 - Total ERO Funding $ 288,949 $ 288,953 $ (4) Membership Dues - $ - - Testing Fees - - Services & Software - Workshops 99,385 90,000 9,385 Interest Miscellaneous Total Funding $ 388,334 $ 378,953 $ 9, % Expenses Personnel Expenses Salaries $ 85,084 $ 137,870 (52,786) Payroll Taxes 5,417 8,869 (3,452) Benefits 9,594 18,009 (8,415) Retirement Costs 11,743 19,416 (7,673) Total Personnel Expenses $ 111,838 $ 184,164 $ (72,326) -39.3% Meeting Expenses Meetings $ 70,380 $ 70,908 (528) Travel 3,493 12,228 (8,735) Conference Calls 922 4,902 (3,980) Total Meeting Expenses $ 74,795 $ 88,038 $ (13,243) -15.0% Operating Expenses Consultants & Contracts $ 28,500 $ 45,000 (16,500) Office Rent 9,346 12,573 (3,227) Office Costs 13,091 12, Professional Services 1,266 7,502 (6,236) Miscellaneous - Depreciation (66) Total Operating Expenses $ 52,960 $ 78,210 $ (25,250) -32.3% Total Indirect Expenses $ 19,551 $ 28,226 $ (8,675) -30.7% Other Non-Operating Expenses $ - $ - $ - Total Expenses $ 259,144 $ 378,638 $ (119,494) -31.6% Change in Assets $ 129,190 $ 315 $ 128,875 Fixed Asset Expenditures Depreciation $ (757) $ (823) $ 66 Software CapEx - Furniture & Fixtures CapEx - Equipment & Computers CapEx 4,708 1,138 3,570 Leasehold Improvements - Increase/(Decrease) in Fixed Assets $ 3,951 $ 315 $ 3, % Total Budget $ 263,095 $ 378,953 $ (115,858) -30.6% CHANGE IN WORKING CAPITAL $ 125,239 $ - $ 125,239 Direct FTEs (0.51) -45.9% Indirect FTE's (0.09) -52.9% Total FTE's (0.60) -46.9% See Independent Auditors Report
110 Florida Reliability Coordinating Council, Inc. Statement of Activities - Total Actual To Total Budget SITUATIONAL AWARENESS December 31, 2013 (In Whole Dollars) 2013 Actual 2013 Budget 2013 Variance % Funding ERO Funding ERO Assessments $ 60,714 $ 60,714 $ - Penalty Sanctions 2,887 2,887 - Total ERO Funding $ 63,601 $ 63,601 $ - Membership Dues - $ - - Testing Fees - - Services & Software - Workshops - Interest Miscellaneous Total Funding $ 63,601 $ 63,601 $ - 0.0% Expenses Personnel Expenses Salaries $ 6,217 $ 31,052 (24,835) Payroll Taxes 379 1,997 (1,618) Benefits 805 4,070 (3,265) Retirement Costs 827 4,373 (3,546) Total Personnel Expenses $ 8,228 $ 41,492 $ (33,264) -80.2% Meeting Expenses Meetings $ 21 $ 38 (17) Travel 516 3,213 (2,697) Conference Calls Total Meeting Expenses $ 563 $ 3,257 $ (2,694) -82.7% Operating Expenses Consultants & Contracts $ 1,726 $ - 1,726 Office Rent 714 2,831 (2,117) Office Costs 1,550 7,755 (6,205) Professional Services 121 1,875 (1,754) Miscellaneous - Depreciation 2,428 2,561 (133) Total Operating Expenses $ 6,539 $ 15,022 $ (8,483) -56.5% Total Indirect Expenses $ 1,313 $ 6,357 $ (5,044) -79.3% Other Non-Operating Expenses $ - $ - $ - Total Expenses $ 16,643 $ 66,128 $ (49,485) -74.8% Change in Assets $ 46,958 $ (2,527) $ 49,485 Fixed Asset Expenditures Depreciation $ (2,428) $ (2,561) $ 133 Software CapEx - Furniture & Fixtures CapEx - Equipment & Computers CapEx Leasehold Improvements - Increase/(Decrease) in Fixed Assets $ (2,246) $ (2,527) $ % Total Budget $ 14,397 $ 63,601 $ (49,204) -77.4% CHANGE IN WORKING CAPITAL $ 49,204 $ - $ 49,204 Direct FTEs (0.20) -80.0% Indirect FTE's (0.06) -85.7% Total FTE's (0.26) -81.3% See Independent Auditors Report
111 Florida Reliability Coordinating Council, Inc. Statement of Activities - Total Actual To Total Budget GENERAL ADMINISTRATIVE December 31, 2013 (In Whole Dollars) 2013 Actual 2013 Budget 2013 Variance % Funding ERO Funding ERO Assessments $ (157,305) $ (157,311) $ 6 Penalty Sanctions - - Total ERO Funding $ (157,305) $ (157,311) $ 6 Membership Dues - $ - - Testing Fees - - Services & Software - Workshops - Interest Miscellaneous Total Funding $ (157,305) $ (157,311) $ 6 0.0% Expenses Personnel Expenses Salaries $ 427,568 $ 465,776 $ (38,208) Payroll Taxes 26,911 29,962 (3,051) Benefits 50,287 58,915 (8,628) Retirement Costs 56,382 65,596 (9,214) Total Personnel Expenses $ 561,148 $ 620,249 $ (59,101) -9.5% Meeting Expenses Meetings $ - $ - Travel Conference Calls - - Total Meeting Expenses $ 50 $ - $ 50 ###### Operating Expenses Consultants & Contracts $ 4,633 $ - $ 4,633 Office Rent 45,351 42,475 2,876 Office Costs 3,953 7,840 (3,887) Professional Services - - Miscellaneous - Depreciation 1,561 2,540 (979) Total Operating Expenses $ 55,498 $ 52,855 $ 2, % Total Indirect Expenses $ (616,695) $ (670,564) $ 53,869 Other Non-Operating Expenses $ - $ - $ - Total Expenses $ 1 $ 2,540 $ (2,539) % Change in Assets $ (157,306) $ (159,851) $ 2, % Fixed Asset Expenditures Depreciation $ (1,561) $ (2,540) $ 979 Software CapEx - Furniture & Fixtures CapEx - Equipment & Computers CapEx - Leasehold Improvements - Increase/(Decrease) in Fixed Assets $ (1,561) $ (2,540) $ % Total Budget $ (1,560) $ - $ (1,560) CHANGE IN WORKING CAPITAL $ (155,745) $ (157,311) $ 1, % FTEs (0.67) -17.9% See Independent Auditors Report
112 Florida Reliability Coordinating Council, Inc. Statement of Activities - Total Actual To Total Budget TOTAL MEMBER SERVICES - NON STATUTORY December 31, 2013 (In Whole Dollars) 2013 Actual 2013 Budget 2013 Variance % Funding ERO Funding ERO Assessments $ - $ - $ - Penalty Sanctions Total ERO Funding $ - $ - $ - Membership Dues 6,250,976 6,250,975 1 Testing Fees Services & Software 291, ,000 (19,009) Workshops Special Assessment Non Cash Postretirement (45,824) - (45,824) Total Funding $ 6,497,143 $ 6,561,975 $ (64,832) -1.0% Expenses Personnel Expenses Salaries $ 1,887,470 $ 1,828,681 58,789 Payroll Taxes 113, ,635 (3,954) Benefits 294, ,308 57,093 Retirement Costs 247, ,534 (10,158) Total Personnel Expenses $ 2,542,928 $ 2,441,158 $ 101, % Meeting Expenses Meetings $ 29,546 $ 15,410 14,136 Travel 38,294 78,424 (40,130) Conference Calls 17,000 23,196 (6,196) Total Meeting Expenses $ 84,840 $ 117,030 $ (32,190) -27.5% Operating Expenses Consultants & Contracts $ 2,702,822 $ 3,015,722 (312,900) Office Rent 207, ,759 40,391 Office Costs 460, ,879 (36,304) Professional Services 35, ,966 (210,129) Miscellaneous 75,000-75,000 Depreciation 26,027 23,897 2,130 Total Operating Expenses $ 3,507,411 $ 3,949,223 $ (441,812) -11.2% Total Indirect Expenses Other Non-Operating Expenses $ 519,831 $ - $ 519,831 Total Expenses $ 6,655,010 $ 6,507,411 $ 147, % Change in Assets $ (157,867) $ 54,564 $ (212,431) Fixed Asset Expenditures Depreciation $ (26,027) $ (23,897) $ (2,130) Non Pension Post Retir. Oblig (565,655) - (565,655) Software CapEx 27,000-27,000 Furniture & Fixtures CapEx 4,882-4,882 Equipment & Computers CapEx 55,137 78,461 (23,324) Leasehold Improvements Increase/(Decrease) in Fixed Assets $ (504,663) $ 54,564 $ (559,227) % Total Budget $ 6,150,347 $ 6,561,975 $ (411,628) -6.3% CHANGE IN WORKING CAPITAL $ 346,796 $ - $ 346,796 FTEs See Independent Auditors Report
113 ATTACHMENT ACTUAL COST-TO-BUDGET COMPARISON AND 2013 AUDITED FINANCIAL REPORT FOR MIDWEST RELIABILITY ORGANIZATION
114 April 29, 2014 Sue Clarke, VP of Finance and Administration P: (651) F: (651) E: Mr. Michael Walker Ms. Susan Turpen North American Electric Reliability Corporation (NERC) RE: 2013 Budget Variance Explanation Based on Audited Financials Dear Mr. Walker and Ms. Turpen: MRO staff reports the audited final numbers to be 7.63% under budget ($709k). Prior to the annual actuarial calculation of post-retirement medical benefit obligation (discount rate, expected rate of return on plan assets and health care cost trend rate) MRO staff reported to be 4.91% under budget ($457k). While MRO was under budget, MRO staff believes the principal responsibilities under the delegation agreement were met in During 2013, MRO conducted 19 audits and spot checks including 10 on-site and 6 off-site combined CIP and operations and planning audits and 2 offsite operations and planning audits. Additionally, MRO participated in one on-site operations and planning audit and one on-site CIP audit lead by SERC. No spot checks were conducted in MRO identified 147 new potential violations and closed 140 instances of noncompliance (violations or remediated issues) in MRO completed all budgeted reliability assessments for the year. In addition, MRO provided oversight on the event analysis of eight events in the Region during As requested, the year-to-date variances greater than $10,000 and 10 percent are explained below. Meeting Expenses (Actual - $223,169 under budget) Meeting expenses were under budget by $40,863. This was due to the new MRO facility having provided more opportunities to host meetings, which enabled staff to reduce cost significantly more than originally expected by eliminating the cost of meeting room and audio visual rentals as well as lower catering costs. These cost savings are trended in the 2014 Budget. Travel expenses were under budget by $155,747. Greater than budgeted use of the new MRO facility resulted in less travel by MRO staff. Resources were also shifted from auditing to risk assessment and mitigation, which in 2013 required minimum travel. Conference call expenses were under budget by $26,559. Upgrades in mid-year 2013 for audio and web conferencing media eliminated costs for the remaining portion of These cost savings are trended in the 2014 Budget.
115 Consultants and Contracts (Actual - $82,453 under budget) MRO had expected to come in on budget by the end of the year. Two expected projects were outsourced; one was approximately 50% completed. Both are expected to be completed in Professional Services (Actual - $99,161 under budget) External counsel is requested when necessary and this cost is difficult to trend. Other non-operating Expenses (Actual - $194,304 under budget) In addition to the review of financials, MRO s independent financial audit requests support for the annual actuarial calculation of post-retirement medical benefit obligation. The actuarial assumptions take into consideration the discount rate, expected rate of return on plan assets and health care cost trend rate. After review and discussion of provided assessments by the relevant third party advisors, a higher post-retirement discount rate of 5.04% (up from 4.12%) and a 6% expected rate of return applied. This rate remains unchanged from the previous year s assumptions and calculation. This resulted in a positive impact to net revenues of $252k in $58k was included in the net periodic cost and $194k as a non-operating cost. Fixed Assets (Actual - $52,355 over budget) MRO staff accelerated some planned projects from Change in Assets and Year End MRO was under budget by $709k as explained above. If you have any questions regarding this report, please contact me at Thank you, fâx VÄtÜ~x Sue Clarke Cc: Daniel Skaar, MRO
116 Midwest Reliability Organization 2012 Statement of Activities and Capital Expenditures 01/01/ /31/2013 Per Audit Consolidated 2013 Actual 2013 Budget 2013 Variance from Budget Over(Under) Funding ERO Funding Assessments 9,098,927 9,098,927 Penalty Sanctions 14,001 14,001 Total ERO Funding $ 9,112,928 $ 9,112,928 $ Federal Grants Membership Fees Testing Services & Software Workshop Fees Interest Miscellaneous Total Funding (A) $ 9,112,928 $ 9,112,928 $ Expenses Personnel Expenses Salaries 4,760,887 4,772,320 (11,433) Payroll Taxes 310, ,394 (1,604) Employee Benefits 380, ,086 (13,192) Savings & Retirement 724, ,228 (108,924) Total Personnel Expenses 6,176,875 6,312,027 (135,153) Meeting Expenses Meetings 91, ,464 (40,863) Travel 475, ,765 (155,747) Conference Calls 15,141 41,700 (26,559) Total Meeting Expenses 581, ,929 (223,169) Operating Expenses Consultants & Contracts 490, ,100 (82,453) Rent & Improvements 487, ,827 (41,718) Office Costs 443, ,304 14,884 Professional Services 147, ,500 (99,161) Miscellaneous Depreciation 410, , ,594 Total Operating Expenses 1,978,542 2,082,396 (103,854) Indirect Expenses 1 (1) Other Non Operating Expenses (194,304) (194,304) Total Expenses (B) 8,542,873 9,199,353 (656,481) Change in Assets (A B) 570,055 (86,425) 656,481 Fixed Assets Depreciation (410,259) (305,665) (104,594) Computer & Software CapEx 420, ,851 80,535 Furniture & Fixtures CapEx 37,162 37,162 Equipment CapEx Leasehold Improvements (15,342) 50,000 (65,342) (Inc)Dec in Fixed Assets $ 31,947 $ 84,186 $ (52,239) Allocation of Fixed Assets Total Inc(Dec) in Fixed Assets (C) 31,947 84,184 (52,239) TOTAL BUDGET (B + C) 8,574,820 9,283,537 (708,720) Change in Working Capital (A B C) 538,108 (170,609) 708,720 FTEs /2/2014, 2:29 PM
117 Midwest Reliability Organization 2012 Statement of Activities and Capital Expenditures 01/01/ /31/2013 Per Audit RELIABILITY STANDARDS 2013 Actual 2013 Budget Funding ERO Funding Assessments 542, , % Penalty Sanctions % Total ERO Funding $ 543,602 $ 543,602 $ 0.00% Federal Grants Membership Fees Testing Services & Software Workshop Fees Interest Miscellaneous Total Funding (A) 543, , % Expenses 2013 Variance from Budget Over(Under) Comments (Explain variances > +/ 10% and $10,000) Personnel Expenses Salaries 165, ,558 (44,654) 21.21% Payroll Taxes 9,913 12,362 (2,449) 19.81% Employee Benefits 11,425 15,154 (3,729) 24.61% Savings & Retirement 27,194 32,835 (5,641) 17.18% Total Personnel Expenses 214, ,909 (56,473) 20.85% Reduced staff involvment by increasing alignment with technical stakeholders to address reliability impacts. Meeting Expenses Fewer meetings at a much lower cost due to hosting at MRO's facility. Savings resulted from eliminating meeting room and audio visual rental costs Meetings 843 7,500 (6,657) 88.76% as well as lowering catering costs. Travel 19,540 28,900 (9,360) Working groups were encouraged to reduce face to face meetings so less travel than anticipated. Also, member reimbursements were reduced for 32.39% our SME application guide developers because there were fewer application guides than anticipated in Conference Calls 9,682 15,000 (5,318) 35.45% Upgrades in mid year 2013 for audio and web conferencing media eliminated costs for the remaining portion of Total Meeting Expenses 30,065 51,400 (21,335) 41.51% Operating Expenses Consultants & Contracts 12,000 12, % Rent & Improvements Office Costs 2,436 6,580 (4,144) A certain amount of training is required over a two or three year span rather than each year. In 2013 staff did not take as much training as they will in 62.98% 2014 and Professional Services Miscellaneous Depreciation Total Operating Expenses 14,436 18,580 (4,144) 22.30% Indirect Expenses 121, ,132 (76,853) 38.79% Total actual indirect costs were under budget, therefore there were less indirect costs than budgeted allocated to this program. Other Non Operating Expenses Total Expenses (B) 380, ,021 (158,805) 29.46% Change in Assets (A B) 163,386 4, , % Fixed Assets Depreciation Computer & Software CapEx Furniture & Fixtures CapEx Equipment CapEx Leasehold Improvements (Inc)Dec in Fixed Assets $ - $ - $ - Allocation of Fixed Assets 1,154 4,581 (3,427) 74.81% Total actual fixed costs were under budget, therefore there were less asset costs than budgeted allocated to this program. Total Inc(Dec) in Fixed Assets (C) 1,154 4,581 (3,427) 74.81% TOTAL BUDGET (B + C) 381, ,602 (162,232) 29.84% Change in Working Capital (A B C) (162,232) (162,232) FTEs (0.5) 31.79% 5/2/2014, 2:29 PM
118 COMPLIANCE OPERATIONS, ENFORCEMENT and ORGANIZATION REGISTRATION 2013 Actual 2013 Budget Funding ERO Funding Assessments 6,126,145 6,126, % Penalty Sanctions 9,581 9, % Total ERO Funding $ 6,135,726 $ 6,135,726 $ 0.00% Federal Grants Membership Fees Testing Services & Software Workshop Fees Interest Miscellaneous Total Funding (A) 6,135,726 6,135, % Expenses Midwest Reliability Organization 2012 Statement of Activities and Capital Expenditures 01/01/ /31/2013 Per Audit 2013 Variance from Budget Over(Under) Comments (Explain variances > +/ 10% and $10,000) Personnel Expenses Salaries 2,373,856 2,372,105 1, % Payroll Taxes 156, ,443 (2,570) 1.61% Employee Benefits 199, ,097 (3,244) 1.60% Savings & Retirement 318, ,579 (75,238) 19.12% Annual post retirement adjustment reduced the cost for 2013 based on higher discount rate provided by third party advisors Total Personnel Expenses 3,048,923 3,128,224 (79,301) 2.54% Meeting Expenses Meetings 2,794 5,600 (2,806) Fewer meetings at a much lower cost due to hosting at MRO's facility. Savings resulted from eliminating meeting room and audio visual rental costs as well 50.11% as lowering catering costs. Travel 130, ,300 (70,208) The overall travel expense was estimated high compared to actual travel costs. Travel for working group meetings was discouraged and MRO staff attended 35.05% far fewer meetings than anticipated. The travel was replaced with conference calls. Conference Calls 2,793 8,400 (5,607) 66.75% Upgrades in mid year 2013 for audio and web conferencing media eliminated costs for the remaining portion of Total Meeting Expenses 135, ,300 (78,621) 36.69% Operating Expenses Consultants & Contracts 105, ,000 (51,502) 32.80% Two expected projects were outsourced; one was approximately 50% completed. Both are expected to be completed in Rent & Improvements Office Costs 85,015 79,354 5, % Professional Services 7,500 (7,500) % These were contingency dollars for Canadian filings that were not necessary in Miscellaneous Depreciation Total Operating Expenses 190, ,854 (53,341) 21.87% Indirect Expenses 2,298,406 2,491,737 (193,331) 7.76% Total actual indirect costs were under budget, therefore there were less indirect costs than budgeted allocated to this program Other Non Operating Expenses Total Expenses (B) 5,673,521 6,078,115 (404,594) 6.66% Change in Assets (A B) 462,205 57, , % Fixed Assets Depreciation Computer & Software CapEx Furniture & Fixtures CapEx Equipment CapEx Leasehold Improvements (Inc)Dec in Fixed Assets $ - $ - $ - Allocation of Fixed Assets 21,873 57,611 (35,738) 62.03% Total actual fixed costs were under budget, therefore there were less asset costs than budgeted allocated to this program Total Inc(Dec) in Fixed Assets (C) 21,873 57,611 (35,738) 62.03% TOTAL BUDGET (B + C) 5,695,394 6,135,726 (440,332) 7.18% Change in Working Capital (A B C) (440,332) (440,332) FTEs % 5/2/2014, 2:29 PM
119 RELIABILITY ASSESSMENTS and PERFORMANCE ANALYSIS 2013 Actual 2013 Budget Funding ERO Funding Assessments 2,274,076 2,274, % Penalty Sanctions 3,370 3, % Total ERO Funding $ 2,277,446 $ 2,277,446 $ 0.00% Federal Grants Membership Fees Testing Services & Software Workshop Fees Interest Miscellaneous Total Funding (A) 2,277,446 2,277, % Expenses Midwest Reliability Organization 2012 Statement of Activities and Capital Expenditures 01/01/ /31/2013 Per Audit 2013 Variance from Budget Over(Under) Comments (Explain variances > +/ 10% and $10,000) Personnel Expenses Salaries 819, ,326 23, % Payroll Taxes 52,710 54,654 (1,944) 3.56% Employee Benefits 71,461 71,795 (334) 0.47% Savings & Retirement 149, ,752 (11,259) 7.00% Total Personnel Expenses 1,092,979 1,082,527 10, % Meeting Expenses Meetings 7,316 20,000 (12,684) Approximately the same number of meetings at a much lower cost due to hosting at MRO's facility. Savings resulted from eliminating meeting room 63.42% and audio visual rental costs as well as lowering catering costs. Due to the increased number of activities in this area there was more travel than anticipated. Activities included but not limited to BES, RAPA, and Event Analysis meetings at the NERC level. MRO staff also knew that travel (most specifically airfare) was low in our original budget. MRO staff was Travel 147, ,150 41, % confident that they would be able to manage to the RAPA budget as a whole. Conference Calls 2,207 2,500 (293) 11.72% Upgrades in mid year 2013 for audio and web conferencing media eliminated costs for the remaining portion of Total Meeting Expenses 157, ,650 28, % Operating Expenses Consultants & Contracts 60, ,100 (80,545) RAPA has three contracts that are budgeted based on an estimated number of required hours; actual hours can fluctuate greatly. In the case of 2013 the actual dollars in our Model Building came in 50% lower. MRO also had Event Analysis contingency dollars in our 2013 Budget that were 57.08% unnecessary and were removed in the 2014 budget. Rent & Improvements Office Costs 24,140 28,400 (4,260) 2013 training dollars were budgeted for two different staffers who are no longer in the department. Actual staff required different training 15.00% requirements; actual cost was lower than budgeted. Professional Services Miscellaneous Depreciation Total Operating Expenses 84, ,500 (84,805) 50.03% Indirect Expenses 878, ,504 1, % Other Non Operating Expenses Total Expenses (B) 2,213,239 2,257,181 (43,942) 1.95% Change in Assets (A B) 64,207 20,265 43, % Fixed Assets Depreciation Computer & Software CapEx Furniture & Fixtures CapEx Equipment CapEx Leasehold Improvements (Inc)Dec in Fixed Assets $ - $ - $ - Allocation of Fixed Assets 8,359 20,265 (11,906) 58.75% Total actual fixed costs were under budget, therefore there were less asset costs than budgeted allocated to this program. Total Inc(Dec) in Fixed Assets (C) 8,359 20,265 (11,906) 58.75% TOTAL BUDGET (B + C) 2,221,598 2,277,446 (55,848) 2.45% Change in Working Capital (A B C) (55,848) (55,848) FTEs % 5/2/2014, 2:29 PM
120 TRAINING, EDUCATION and OPERATOR CERTIFICATION 2013 Actual 2013 Budget Funding ERO Funding Assessments 229, , % Penalty Sanctions % Total ERO Funding $ 229,417 $ 229,417 $ 0.00% Federal Grants Membership Fees Testing Services & Software Workshop Fees Interest Miscellaneous Total Funding (A) 229, , % Expenses Midwest Reliability Organization 2012 Statement of Activities and Capital Expenditures 01/01/ /31/2013 Per Audit 2013 Variance from Budget Over(Under) Comments (Explain variances > +/ 10% and $10,000) Personnel Expenses Salaries 77,308 65,436 11, % Payroll Taxes 3,320 2,231 1, % Employee Benefits 3,744 1,935 1, % Savings & Retirement 12,525 11,469 1, % More Sr Management involvement than anticipated with the number of issues that were addressed in 2013 agendas. Some of those issues included but Total Personnel Expenses 96,897 81,071 15, % not limited to: BES, New Modeling, and Protection System Standards. Meetings 56,428 63,500 (7,072) 11.14% Travel 12,313 28,600 (16,287) 56.95% Dollars were budgeted for the SME to travel and give forum presentations in 2013 which were not required. Conference Calls 15,000 (15,000) % Upgrades in mid year 2013 for audio and web conferencing media eliminated costs for the remaining portion of Total Meeting Expenses 68, ,100 (38,359) 35.82% Operating Expenses Consultants & Contracts Rent & Improvements Office Costs 349 5,000 (4,651) 93.02% Professional Services Miscellaneous Depreciation Total Operating Expenses 349 5,000 (4,651) 93.02% Indirect Expenses 38,856 35,428 3, % Other Non Operating Expenses Total Expenses (B) 204, ,599 (23,756) 10.39% Change in Assets (A B) 24, , % Fixed Assets Depreciation Computer & Software CapEx Furniture & Fixtures CapEx Equipment CapEx Leasehold Improvements (Inc)Dec in Fixed Assets $ - $ - $ - Allocation of Fixed Assets (449) 54.85% Total actual fixed costs were under budget, therefore there were less asset costs than budgeted allocated to this program. Total Inc(Dec) in Fixed Assets (C) (449) 54.85% TOTAL BUDGET (B + C) 205, ,418 (24,205) 10.55% Change in Working Capital (A B C) (24,204) 1 (24,205) FTEs % 5/2/2014, 2:29 PM
121 SITUATION AWARENESS and INFRASTRUCTURE SECURITY (Includes Critical Infrastructure Protection) 2013 Actual 2013 Budget Funding ERO Funding Assessments 97,197 97, % Penalty Sanctions % Total ERO Funding $ 97,348 $ 97,348 $ 0.00% Federal Grants Membership Fees Testing Services & Software Workshop Fees Interest Miscellaneous Total Funding (A) 97,348 97, % Expenses Midwest Reliability Organization 2012 Statement of Activities and Capital Expenditures 01/01/ /31/2013 Per Audit 2013 Variance from Budget Over(Under) Comments (Explain variances > +/ 10% and $10,000) Personnel Expenses Salaries 27,834 37,373 (9,539) 25.52% Payroll Taxes 2,091 1, % Employee Benefits 2,118 1, % Savings & Retirement 4,134 7,642 (3,508) 45.90% Total Personnel Expenses 36,177 48,774 (12,597) 25.83% Meeting Expenses Meetings Travel 11,149 3,300 7, % Conference Calls Total Meeting Expenses 11,173 3,300 7, % Operating Expenses Consultants & Contracts Rent & Improvements Office Costs 3,688 5,000 (1,312) 26.24% Professional Services Miscellaneous Depreciation Total Operating Expenses 3,688 5,000 (1,312) 26.24% Less of MRO's time was spent monitoring the system because MRO is able to rely on the BES operators to provide information in the event of a potential risk to reliability. Indirect Expenses 20,017 39,364 (19,347) 49.15% Total actual indirect costs were under budget, therefore there were less indirect costs than budgeted allocated to this program. Other Non Operating Expenses Total Expenses (B) 71,055 96,438 (25,383) 26.32% Change in Assets (A B) 26, , % Fixed Assets Depreciation Computer & Software CapEx Furniture & Fixtures CapEx Equipment CapEx Leasehold Improvements (Inc)Dec in Fixed Assets $ - $ - $ - Allocation of Fixed Assets (720) 79.07% Total actual fixed costs were under budget, therefore there were less asset costs than budgeted allocated to this program. Total Inc(Dec) in Fixed Assets (C) (720) 79.07% TOTAL BUDGET (B + C) 71,245 97,348 (26,103) 26.81% Change in Working Capital (A B C) (26,103) (26,103) FTEs (0.14) 45.16% 5/2/2014, 2:29 PM
122 Midwest Reliability Organization 2012 Statement of Activities and Capital Expenditures 01/01/ /31/2013 Per Audit MEMBER FORUMS 2013 Actual 2013 Budget 2013 Variance from Budget Over(Under) Comments (Explain variances > +/ 10% and $10,000) Funding ERO Funding ELIMINATED 07/01/2013 TO CONFORM TO HOW THE Assessments OTHER REGIONS ARE RECORDING NERC Penalty Sanctions PARTICIPATION Total ERO Funding $ $ $ ALL OTHER REGIONS AND NERC RECORD COSTS IN THE PROGRAM OF THE PARTICIPANT Federal Grants WE WILL TRACK NERC TIME SEPARATELY Membership Fees Testing Services & Software Workshop Fees Interest Miscellaneous Total Funding (A) Expenses Personnel Expenses Salaries 153, ,396 (143,601) 48.29% Payroll Taxes 11,411 16,595 (5,184) 31.24% Employee Benefits 6,777 18,916 (12,139) 64.17% Savings & Retirement 29,487 57,407 (27,920) 48.64% Total Personnel Expenses 201, ,314 (188,844) 48.38% Actuals are substantially below budget because as of 7/1/2013 MRO stopped recording costs to Member Forums. Please see above comment for details. Meeting Expenses Meetings Travel 66, ,000 (120,481) 64.43% Conference Calls Total Meeting Expenses 66, ,000 (120,481) 64.43% Actuals are substantially below budget because as of 7/1/2013 MRO stopped recording costs to Member Forums. Please see above comment for details. Operating Expenses Consultants & Contracts Rent & Improvements Office Costs Professional Services Miscellaneous Depreciation Total Operating Expenses Indirect Expenses (267,989) (577,314) 309, % Actuals are substantially below budget because as of 7/1/2013 MRO stopped recording costs to Member Forums. Please see above comment for details. Other Non Operating Expenses Total Expenses (B) Change in Assets (A B) Fixed Assets Depreciation Computer & Software CapEx Furniture & Fixtures CapEx Equipment CapEx Leasehold Improvements (Inc)Dec in Fixed Assets $ - $ - $ - Allocation of Fixed Assets Total Inc(Dec) in Fixed Assets (C) TOTAL BUDGET (B + C) Change in Working Capital (A B C) FTEs 1.4 (1.4) % Actuals are substantially below budget because as of 7/1/2013 MRO stopped recording costs to Member Forums. Please see above comment for details. 5/2/2014, 2:29 PM
123 GENERAL and ADMINISTRATIVE 2013 Actual 2013 Budget Funding ERO Funding Assessments (170,612) (170,612) 0.00% Penalty Sanctions Total ERO Funding $ (170,612) $ (170,612) $ 0.00% Federal Grants Membership Fees Testing Services & Software Workshop Fees Interest Miscellaneous Total Funding (A) (170,612) (170,612) 0.00% Expenses Midwest Reliability Organization 2012 Statement of Activities and Capital Expenditures 01/01/ /31/2013 Per Audit 2013 Variance from Budget Over(Under) Comments (Explain variances > +/ 10% and $10,000) Personnel Expenses Salaries 290, ,366 98, % Payroll Taxes 14,177 10,760 3, % Employee Benefits 14,934 13,435 1, % Savings & Retirement 44,544 34,693 9, % Total Personnel Expenses 364, , ,043 In first quarter 2013 the executives charged their BOD preparation and actual time to G&A rather than to each of their own programs. In addition, costs 44.99% for third and fourth quarter NERC and BOT meetings were recorded here rather than in Member Forums. Meeting Expenses Approximately the same number of meetings at a much lower cost due to hosting at MRO's facility. Savings resulted from eliminating meeting room and Meetings 23,221 35,864 (12,643) 35.25% audio visual rental costs as well as lowering catering costs. Travel 73,098 60,000 13, % The BOT travel that was budgeted under program Forums(1100) was charged to G&A after 06/30/2013 based on the treatment by the other regions Conference Calls (637) 79.63% Upgrades in mid year 2013 for audio and web conferencing media eliminated costs for the remaining portion of Total Meeting Expenses 96,482 96,664 (182) 0.19% Operating Expenses Consultants & Contracts 1,912 40,000 (38,088) 95.22% Contingent dollars were included for MRO's share of an all regional project (similar to the Deloitte project in 2012) but were not needed in 2013 Rent & Improvements Office Costs 74,806 71,100 3, % Professional Services 72, ,000 (27,500) 27.50% Actual compensation required for independent Board members was less than budgeted. Miscellaneous Depreciation Total Operating Expenses 149, ,100 (61,882) 29.31% Indirect Expenses (609,997) (559,018) (50,979) 9.12% Other Non Operating Expenses Total Expenses (B) Change in Assets (A B) (170,612) (170,612) 0.00% Fixed Assets Depreciation Computer & Software CapEx Furniture & Fixtures CapEx Equipment CapEx Leasehold Improvements (Inc)Dec in Fixed Assets $ - $ - $ - Allocation of Fixed Assets Total Inc(Dec) in Fixed Assets (C) TOTAL BUDGET (B + C) Change in Working Capital (A B C) 170, , % FTEs % 5/2/2014, 2:29 PM
124 LEGAL and REGULATORY 2013 Actual 2013 Budget Funding ERO Funding Assessments Penalty Sanctions Total ERO Funding $ $ $ Federal Grants Membership Fees Testing Services & Software Workshop Fees Interest Miscellaneous Total Funding (A) Expenses Midwest Reliability Organization 2012 Statement of Activities and Capital Expenditures 01/01/ /31/2013 Per Audit 2013 Variance from Budget Over(Under) Comments (Explain variances > +/ 10% and $10,000) Personnel Expenses Salaries 195, ,355 (23,975) 10.93% Payroll Taxes 12,707 11,538 1, % Employee Benefits 2,110 2,150 (40) 1.86% Savings & Retirement 28,067 37,375 (9,308) 24.90% Total Personnel Expenses 238, ,418 (32,154) 11.89% Costs were below budget because in first quarter 2013 the executives charged their BOD preparation and actual time to G&A rather than to each of their own programs Meeting Expenses Meetings Travel 9,418 9,515 (97) 1.02% Conference Calls Total Meeting Expenses 9,418 9,515 (97) 1.02% Operating Expenses Consultants & Contracts Rent & Improvements Office Costs 5,118 5, % Professional Services 22,115 60,000 (37,885) Contingency dollars for outside legal counsel to supplement internal resources as necessary. This included funds for MRO's share of the all region year assessment. By sharing these costs 63.14% among the regions, each region benefited from the economy of scale. Miscellaneous Depreciation Total Operating Expenses 27,233 65,050 (37,817) 58.14% Indirect Expenses (274,915) (344,983) 70, % Other Non Operating Expenses Total Expenses (B) Change in Assets (A B) Fixed Assets Depreciation Computer & Software CapEx Furniture & Fixtures CapEx Equipment CapEx Leasehold Improvements (Inc)Dec in Fixed Assets $ - $ - $ - Allocation of Fixed Assets Total Inc(Dec) in Fixed Assets (C) TOTAL BUDGET (B + C) Change in Working Capital (A B C) FTEs (0.1) 8.20% 5/2/2014, 2:29 PM
125 INFORMATION TECHNOLOGY Funding 2013 Actual 2013 Budget ERO Funding Assessments Penalty Sanctions Total ERO Funding $ $ $ Federal Grants Membership Fees Testing Services & Software Workshop Fees Interest Miscellaneous Total Funding (A) Expenses Midwest Reliability Organization 2012 Statement of Activities and Capital Expenditures 01/01/ /31/2013 Per Audit 2013 Variance from Budget Over(Under) Comments (Explain variances > +/ 10% and $10,000) Personnel Expenses Salaries 343, ,579 52, % Sr management time in the IT area was significant since the IT Manager was new and MRO began several significant projects: SharePoint, Website and Lync Payroll Taxes 24,681 22,502 2, % Employee Benefits 35,665 33,318 2, % Savings & Retirement 57,973 40,739 17, % Total Personnel Expenses 462, ,138 74, % Meeting Expenses Meetings Travel 1,501 4,000 (2,499) 62.48% Conference Calls Total Meeting Expenses 2,419 4,000 (1,581) 39.53% Operating Expenses Consultants & Contracts 265, ,500 88, % Costs were higher than budget due to SharePoint expansion. Rent & Improvements Office Costs 167, ,900 23, % Professional Services Miscellaneous Depreciation 410, , , % Impact of depreciating building improvements, equipment, and other capital investments related to our facility move in 2012 Total Operating Expenses 844, , , % Indirect Expenses (1,308,651) (1,019,203) (289,448) 28.40% Other Non Operating Expenses Total Expenses (B) Change in Assets (A B) Fixed Assets Depreciation (410,259.00) (305,665.00) (104,594) 34.22% Computer & Software CapEx 420, ,851 80, % Furniture & Fixtures CapEx Equipment CapEx Leasehold Improvements (Inc)Dec in Fixed Assets $ 10,127 $ 34,186 $ (24,059) Allocation of Fixed Assets (10,127) (34,186) 24, % Total actual fixed costs were under budget, therefore there were less asset costs than budgeted allocated to this program Total Inc(Dec) in Fixed Assets TOTAL BUDGET (B + C) Change in Working Capital (A B C) FTEs % 5/2/2014, 2:29 PM
126 HUMAN RESOURCES 2013 Actual 2013 Budget Funding ERO Funding Assessments Penalty Sanctions Total ERO Funding $ $ $ Federal Grants Membership Fees Testing Services & Software Workshop Fees Interest Miscellaneous Total Funding (A) Expenses Personnel Expenses Salaries Payroll Taxes Employee Benefits Savings & Retirement Total Personnel Expenses Meeting Expenses Meetings Travel Conference Calls Total Meeting Expenses Operating Expenses Consultants & Contracts Rent & Improvements Office Costs Professional Services Miscellaneous Depreciation Total Operating Expenses Indirect Expenses Other Non Operating Expenses Total Expenses (B) Change in Assets (A B) Fixed Assets Depreciation Computer & Software CapEx Furniture & Fixtures CapEx Equipment CapEx Leasehold Improvements (Inc)Dec in Fixed Assets $ - $ - $ - Allocation of Fixed Assets Total Inc(Dec) in Fixed Assets (C) TOTAL BUDGET (B + C) Change in Working Capital (A B C) Midwest Reliability Organization 2012 Statement of Activities and Capital Expenditures 01/01/ /31/2013 Per Audit 2013 Variance from Budget Over(Under) Comments (Explain variances > +/ 10% and $10,000) Human Resources costs are included under the Finance and Accounting program. FTEs 5/2/2014, 2:29 PM
127 ACCOUNTING and FINANCE 2013 Actual 2013 Budget Funding ERO Funding Assessments Penalty Sanctions Total ERO Funding $ $ $ Federal Grants Membership Fees Testing Services & Software Workshop Fees Interest Miscellaneous Total Funding (A) Expenses Midwest Reliability Organization 2012 Statement of Activities and Capital Expenditures 01/01/ /31/2013 Per Audit 2013 Variance from Budget Over(Under) Comments (Explain variances > +/ 10% and $10,000) Personnel Expenses Salaries 313, ,826 22, % Payroll Taxes 22,907 20,485 2, % Employee Benefits 32,807 32, % Savings & Retirement 52,546 56,737 (4,191) 7.39% Total Personnel Expenses 421, ,399 20, % Meeting Expenses Meetings Travel 3,733 3, % Conference Calls Total Meeting Expenses 4,086 3,000 1, % Operating Expenses Consultants & Contracts 44,716 45,500 (784) 1.72% Rent & Improvements 487, ,827 (41,718) 7.89% Office Costs 79,799 83,920 (4,121) 4.91% Professional Services 52,724 79,000 (26,276) An IT intrusion test was scheduled in 2013; however the test was not done due to the significant network changes that were planned and implemented in 33.26% the course of the year. MRO currently has an intrusion test scheduled for the 2nd Qtr of 2014 Miscellaneous Depreciation Total Operating Expenses 664, ,247 (72,899) 9.89% Indirect Expenses (895,392) (1,140,646) 245, % Other Non Operating Expenses (194,304) (194,304) Total Expenses (B) Change in Assets (A B) Fixed Assets Depreciation Computer & Software CapEx Furniture & Fixtures CapEx 37,162 37,162 Equipment CapEx Leasehold Improvements (15,342) 50,000 (65,342) % The planned improvements for 2013 were completed in 2012 (Inc)Dec in Fixed Assets $ 21,820 $ 50,000 $ (28,180) Allocation of Fixed Assets (21,820) (50,000) 28, % Total actual fixed costs were under budget, therefore there were less asset costs than budgeted allocated to this program Total Inc(Dec) in Fixed Assets (C) TOTAL BUDGET (B + C) Change in Working Capital (A B C) FTEs % 5/2/2014, 2:29 PM
128 Statement of Activities and Capital Expenditures by Program Non Statutory Total Reliability Standards (Section 300) Compliance and Organization Registration and Certification (Section 400 & 500) Reliability Assessment and Performance Analysis (Section 800) Training and Education (Section 600 & 900) Functions in Delegation Agreement Situation Awareness and Infrastructure Security (Section 1000) 2013 Actual Total Statutory Total Statutory Total Human Resources Non Statutory Total Funding ERO Funding NERC Assessments 9,098,927 9,098,927 9,098, ,840 6,126,145 2,274, ,281 97,197 (170,612) Penalty Sanctions 14,000 14,000 14, ,581 3, Total NERC Funding 9,112,927 9,112,927 9,112, ,602 6,135,726 2,277, ,417 97,348 (170,612) Membership Dues Testing Fees Services & Software Workshops Interest Miscellaneous Total Funding (A) 9,112,927 9,112,927 9,112, ,602 6,135,726 2,277, ,417 97,348 (170,612) Expenses Personnel Expenses Salaries 4,760,887 4,760,887 4,760, ,904 2,373, ,315 77,308 27, , , , , ,002 Payroll Taxes 310, , ,790 9, ,873 52,710 3,320 2,091 11,411 14,177 12,707 24,681 22,907 Benefits 380, , ,894 11, ,853 71,461 3,744 2,118 6,777 14,934 2,110 35,665 32,807 Retirement Costs 724, , ,304 27, , ,493 12,525 4,134 29,487 44,544 28,067 57,973 52,546 Total Personnel Expenses 6,176,875 6,176,875 6,176, ,436 3,048,923 1,092,979 96,897 36, , , , , ,262 Meeting Expenses Meetings 91,601 91,601 91, ,794 7,316 56, , Travel 475, , ,018 19, , ,655 12,313 11,149 66,519 73,098 9,418 1,501 3,733 Conference Calls 15,141 15,141 15,141 9,682 2,793 2, Total Meeting Expenses 581, , ,760 30, , ,178 68,741 11,173 66,519 96,482 9,418 2,419 4,086 Operating Expenses Consultants & Contracts 490, , ,647 12, ,498 60,555 1, ,966 44,716 Office Rent 487, , , ,109 Office Costs 443, , ,188 2,436 85,015 24, ,688 74,806 5, ,837 79,799 Professional Services 147, , ,339 72,500 22,115 52,724 Miscellaneous Depreciation 410, , , ,259 Total Operating Expenses 1,978,542 1,978,542 1,978,542 14, ,513 84, , ,218 27, , ,348 Total Direct Expenses 8,737,177 8,737,177 8,737, ,937 3,375,115 1,334, ,987 51, , , ,915 1,308,651 1,089,696 Indirect Expenses 121,279 2,298, ,387 38,856 20,017 (267,989) (609,997) (274,915) (1,308,651) (895,392) Other Non Operating Expenses (194,304) (194,304) (194,304) (194,304) Total Expenses (B) 8,542,873 8,542,873 8,542, ,216 5,673,521 2,213, ,843 71,055 Change in Assets 570, , , , ,205 64,207 24,574 26,293 (170,612) Committee and Member Forums General and Administrative Legal and Regulatory Information Technology Accounting and Finance Non Statutory Functions Fixed Assets Depreciation (410,259) (410,259) (410,259) (410,259) Computer & Software CapEx 420, , , ,386 Furniture & Fixtures CapEx 37,162 37,162 37,162 37,162 Equipment CapEx Leasehold Improvements (15,342) (15,342) (15,342) (15,342) Allocation of Fixed Assets 1,154 21,873 8, (10,127) (21,820) Inc(Dec) in Fixed Assets ( C ) 31,947 31,947 31,947 1,154 21,873 8, TOTAL BUDGET (=B + C) 8,574,820 8,574,820 8,574, ,370 5,695,394 2,221, ,213 71,245 TOTAL CHANGE IN WORKING CAPITAL (=A B C) 538, , , , ,332 55,848 24,204 26,103 (170,612) FTEs
129 MIDWEST RELIABILITY ORGANIZATION Saint Paul, Minnesota FINANCIAL STATEMENTS Including Independent Auditors' Report As of and for the Years Ended December 31,2013 and 2012
130 MIDWEST RELIABILITY ORGANIZATION TABLE OF CONTENTS INDEPENDENT AUDITORS' REPORT FINANCIAL STATEMENTS Statements of Financial Position Statements of Operations and Members' Equity Statements of Cash Flows Notes to Financial Statements


131 VIRCHOW KRAUSE, LLP INDEPENDENT AUDITORS' REPORT Baker Tilly Virchow Krause, LLP 225 S Sixth St, Ste 2300 Minneapolis, MN tel fax bakertilly.com To the Board of Directors and Members Midwest Reliability Organization Saint Paul, Minnesota Report on the Financial Statements We have audited the accompanying financial statements of Midwest Reliability Organization (the "Organization"), which comprise the statements of financial position as of December 31,2013 and 2012, and the related statements of operations and members' equity and cash flows for the years then ended, and the related notes to the financial statements. Management's Responsibility for the Financial Statements Management is responsible for the preparation and fair presentation of these financial statements in accordance with accounting principles generally accepted in the United States of America; this includes the design, implementation, and maintenance of internal control relevant to the preparation and fair presentation of financial statements that are free from material misstatement, whether due to fraud or error. Auditors'Responsibility Our responsibility is to express an opinion on these financial statements based on our audits. We conducted our audits in accordance with auditing standards generally accepted in the United States of America. Those standards require that we plan and perform the audits to obtain reasonable assurance about whether the financial statements are free from material misstatement. An audit involves performing procedures to obtain audit evidence about the amounts and disclosures in the financial statements. The procedures selected depend on the auditors' judgment, including the assessment of the risks of material misstatement of the financial statements, whether due to fraud or error. In making those risk assessments, the auditor considers internal control relevant to the entity's preparation and fair presentation of the financial statements in order to design audit procedures that are appropriate in the circumstances, but not for the purpose of expressing an opinion on the effectiveness of the entity's internal control. Accordingly, we express no such opinion. An audit also includes evaluating the appropriateness of accounting policies used and the reasonableness of significant accounting estimates made by management, as well as evaluating the overall presentation of the financial statements. We believe that the audit evidence we have obtained is sufficient and appropriate to provide a basis for our audit opinion. Opinion In our opinion, the financial statements referred to above present fairly, in all material respects, the financial position of the Organization as of December 31,2013 and 2012, and the changes in its net assets and its cash flows for the years then ended in accordance with accounting principles generally accepted in the United States of America. Minneapolis, Minnesota April 3, 2014 an independent member of BAKER TILLY INTERNATIONAL Page 1 An Affirmative Action Equal Opportunity Employer
132 MIDWEST RELIABILITY ORGANIZATION STATEMENTS OF FINANCIAL POSITION As of December 31, 2013 and 2012 ASSETS CURRENT ASSETS Cash and cash equivalents $ 3,739,704 $ 3,190,832 Restricted cash 136,516 14,002 Accounts receivable 34, ,366 Prepaid expenses 263, ,276 Total Current Assets 4,174,579 3,596,476 PROPERTY, IMPROVEMENTS AND EQUIPMENT, NET 1,194,569 1,234,867 OTHER ASSETS Restricted cash - non-current 320, ,003 Security Deposit - non-current 39,858 39,858 Capitalized software costs, net of accumulated amortization of $439,510 and $384,099, respectively 186, ,975 TOTAL ASSETS $ 5,915,239 $ 5,089,179 LIABILITIES AND MEMBERS' EQUITY CURRENT LIABILITIES Accounts payable - trade $ 207,901 $ 391,426 Accrued liabilities 638, ,367 Retirement plan contribution 407, ,800 Deferred assessments 136,512 14,002 Total Current Liabilities 1,390,156 1,343,595 OTHER LIABILITIES Postretirement medical benefit obligation 153, ,334 Deferred assessments - non-current 320, ,003 Deferred rent - non-current 309, ,976 Total Liabilities 2,172,912 1,916,908 MEMBERS' EQUITY 3,742,327 3,172,271 TOTAL LIABILITIES AND MEMBERS' EQUITY $ 5,915,239 $ 5,089,179 See accompanying notes to financial statements. Page 2
133 MIDWEST RELIABILITY ORGANIZATION STATEMENTS OF OPERATIONS AND MEMBERS' EQUITY For the Years Ended December 31, 2013 and REVENUE Assessments $ 9,098,927 $ 8,349,029 Penalty sanctions 14, ,499 Total Revenue 9,112,927 8,767,528 EXPENSES Personnel expenses Salaries 4,760,887 4,358,348 Payroll taxes 310, ,397 Em ployee benefits 380, ,704 Retirement benefits 724, ,571 Total personnel expenses 6,176,876 5,677,020 Meeting expenses Conference calls 15,142 23,501 Meetings 91,601 55,278 Travel 475, ,881 Total meeting expenses 581, ,660 Operating expenses Building rent and facilities 487, ,209 Consulting 490, ,918 Office costs 853, ,798 Professional services 147,338 63,768 Total operating expenses 1,978,536 1,892,693 Total Expenses 8,737,175 8,073,373 CHANGE IN MEMBERS' EQUITY BEFORE POSTRETIREMENT RELATED CHANGES 375, ,155 POSTRETIREMENT-RELATED CHANGES Postretirement medical benefit obligation changes other than net periodic cost (194,304) 51,965 CHANGE IN MEMBERS' EQUITY 570, ,190 MEMBERS' EQUITY - Beginning of Year 3,172,271 2,530,081 MEMBERS' EQUITY - END OF YEAR $ 3,742,327 $ 3,172,271 See accompanying notes to financial statements. Page 3
134 MIDWEST RELIABILITY ORGANIZATION STATEMENTS OF CASH FLOWS For the Years Ended December 31, 2013 and CASH FLOWS FROM OPERATING ACTIVITIES Change in members' equity $ 570,056 $ 642,190 Adjustments to reconcile excess of revenues over expenses to net cash provided by operating activities Depreciation and software amortization 410, ,618 Change in assets and liabilities: Accounts receivable 156,640 (191,366) Prepaid expenses (63,357) (69,377) Security deposit Accounts payable - trade (128,156) (17,846) Accrued liabilities 57,940 86,846 Retirement plan contribution 49,636 48,436 Deferred assessments 338,520 (310,539) Deferred rent 187,596 74,232 Postretirement medical benefit obligation {194,163) 159,270 Change from Operating Activities 1,384, ,464 CASH FLOWS FROM INVESTING ACTIVITIES Change in restricted cash (338,524) 310,540 Purchases of property, improvements and equipment and software {497,575) {1,082,142) Change from Investing Activities {836,099) {771,602) Net Change in Cash and Cash Equivalents 548, ,862 CASH AND CASH EQUIVALENTS - BEGINNING OF YEAR 3,190,832 3,042,970 CASH AND CASH EQUIVALENTS - END OF YEAR $ 3,739,704 $ 3,190,832 Supplemental cash flow disclosure Equipment and software additions included in accounts payable $ 53,795 $ 109,164 See accompanying notes to financial statements. Page 4
 is a nonprofit organization dedicated to ensuring the reliability of the bulk power system in the north-central part of North America.")
135 MIDWEST RELIABILITY ORGANIZATION NOTES TO FINANCIAL STATEMENTS As of and for the Years Ended December 31, 2013 and 2012 NOTE 1 - SIGNIFICANT ACCOUNTING POLICIES Services Midwest Reliability Organization (or the "Organization") is a nonprofit organization dedicated to ensuring the reliability of the bulk power system in the north-central part of North America. The Organization is a Regional Entity under the Energy Policy Act of 2005 (United States) and operates under delegated authority from the Federal Energy Regulatory Commission (FERC) via a delegation agreement with the North American Reliability Corporation. Additionally, the Organization operates in the provinces of Saskatchewan and Manitoba through other agreements. The primary focus of the Organization is ensuring compliance with reliability standards utilizing open, fair processes in the public interest and providing assessments on bulk power system reliability. In addition to the Board of Directors, Midwest Reliability Organization has formed four standing committees: Compliance Committee, Planning Committee, Operating Committee and the Standards Committee. The Board of Directors has four committees: Finance and Audit Committee, Governance and Personnel Committee, Dispute Resolution Committee and Hearing Body Committee. Cash and Cash Equivalents The Organization considers all highly liquid investments with original maturities of three months or less to be cash equivalents. Cash and cash equivalents are held by one financial institution, Wells Fargo, in three accounts. Escrowed amounts resulting from penalties assessed and collected in the United States are segregated into a separate account. Receivables Receivables, if any, result primarily from assessments related to load serving entities (members and nonmembers). No allowance for doubtful accounts is recorded based on historical experience and management's evaluation of receivables. Bad debts are expensed when deemed uncollectible. Receivables are generally unsecured. Property, Improvements and Equipment Property, improvements and equipment are stated at cost less accumulated depreciation and amortization. Significant additions or improvements exceeding $3,000 and $2,000 are capitalized for the years ended December 31, 2013 and 2012, respectively, while expenditures for maintenance and repairs are charged to operations as incurred. Depreciation is recorded using the straight-line method over the estimated useful lives of the assets, ranging from three to seven years. Leasehold improvements are amortized using the straight-line method over the shorter of the estimated useful life or the remaining lease term. The cost and related accumulated depreciation of assets sold or disposed of are removed from the accounts, and the resulting gain or loss is included in operations. Capitalized Software Costs The Organization capitalizes software development costs incurred and purchased software in upgrading computer software used internally to serve its members. The Organization begins capitalization of these costs after technological feasibility has been determined. The capitalized software, once placed in service, is amortized on the straight-line method over its estimated useful life of three years. Accumulated amortization totaled $439,510 and $384,099 for the years ended December 31, 2013 and 2012, respectively. Amortization expense totaled $55,411 and $108,054 for the years ended December 31, 2013 and 2012, respectively. Page 5
136 MIDWEST RELIABILITY ORGANIZATION NOTES TO FINANCIAL STATEMENTS As of and for the Years Ended December 31, 2013 and 2012 NOTE 1 - SIGNIFICANT ACCOUNTING POLICIES (Continued) Deferred Assessments Deferred assessments represents penalty assessments paid by load-serving entities, which will be used to offset budget allocations received from NERC. Tax Status The Internal Revenue Service has determined that the Organization is exempt from federal income taxes under Section 501 (c)(6) of the Internal Revenue Code. They are also exempt from state income taxes. However, any unrelated business income may be subject to taxation. The Organization follows the accounting standards for contingencies in evaluating uncertain tax positions. This guidance prescribes recognition threshold principles for the financial statement recognition of tax positions taken or expected to be taken on a tax return that are not certain to be realized. No liability has been recognized by the Organization for uncertain tax positions as of December 31, 2013 and The Organization's tax returns are subject to review and examination by federal and state authorities. The tax returns for the current year as well as fiscal years 2010 and thereafter are open to examination by federal and state authorities. Revenue and Assessments The Organization receives its revenues from NERC through a net energy-to-ioad allocation for all load-serving entities within its geographical area. The revenue allocation is prescribed under the Energy Policy Act of 2005 in the United States and similar arrangements in Saskatchewan and Manitoba. Any other revenues are collected on a fee-for-service basis at no cost, if applicable. Use of Estimates The preparation of financial statements in conformity with accounting principles generally accepted in the United States of America requires management to make estimates and assumptions that affect the reported amounts of assets and liabilities and disclosure of contingent assets and liabilities at the date of the financial statements and the reported amounts of revenues and expenses during the reporting period. Actual results could differ from those estimates. Subsequent Events The Organization has evaluated subsequent events through April 3, 2014, which is the date that the financial statements were approved and available to be issued. Page 6
137 MIDWEST RELIABILITY ORGANIZATION NOTES TO FINANCIAL STATEMENTS As of and for the Years Ended December 31, 2013 and 2012 NOTE 2 - NERC TRANSACTIONS On October 30, 2007 the Organization entered into a delegation agreement with the North American Electric Reliability Corporation ("NERC") with an executed version dated April 5, 2008 to enforce the Reliability Standards as set by NERC within a designated region. The delegation agreement, which was set to expire in May 2010, was approved for extension by FERC through May 2, The Organization and NERC completed work on a five-year delegation agreement which was executed and approved by FERC effective January 1, In connection with the current delegation agreement, the Organization has the ability to propose Reliability Standards and Regional Variances. The Organization has the authority to enforce the Reliability Standards as set by NERC and approved by regulatory authorities within the geographic boundaries. The Organization is subject to oversight from NERC and applicable regulations in the United States, Manitoba, and Saskatchewan. To ensure the delegated functions have reasonable funding, NERC is to fund the Organization with the monies necessary to carry out its activities as per the agreement. A formula is devised that equitably allocates charges among the end users within the boundaries served by the Organization, based on net energy for load or through such other formula as provided. The Organization provides NERC with a board approved annual operating budget on or before June 30 of each year. Budgeted revenues from NERC were $9,098,927 and $8,349,029 for the years ended December 31, 2013 and 2012, respectively, which agree with the amounts received. NOTE 3 - LEASE COMMITMENTS The Organization executed an operating lease for office space in St Paul, Minnesota on January 20, Rent expense was $237,745 and $330,188 for the years ended December 31,2013 and 2012, respectively. Future expected minimum lease payments under the lease as of December 31, 2013 are as follows: Years Ending December Thereafter $ 94, , , , ,277 1,200,135 $ 2,409,651 Page 7
138 MIDWEST RELIABILITY ORGANIZATION NOTES TO FINANCIAL STATEMENTS As of and for the Years Ended December 31, 2013 and 2012 NOTE 4 - PROPERTY, IMPROVEMENTS AND EQUIPMENT The following is a schedule of property, improvements and equipment as of December 31: Equipment $ 1,731,631 $ 1,403,378 Furniture 422, ,164 Leasehold improvements 321, ,548 2,475,639 2,161,090 Less: Accumulated depreciation {1,281,070) {926,223) Net Property, Improvements and Equipment $ 1,194,569 $ 1,234,867 NOTE 5 - LINE OF CREDIT The Organization obtained a revolving line of credit from National Cooperative Service Corporation (NCSC) in February The line of credit has a credit limit of $2,000,000 and an interest rate equal to the NCSC Line of Credit Rate in effect from time to time, not to exceed the Prevailing Bank Prime Rate as published in the "Money Rates" column of the eastern edition of the Wall Street Journal on the publication day immediately preceding the day on which an adjustment in the interest rate becomes effective. The Organization is required to maintain a Debt Service Coverage Ratio of not less than The line of credit is secured by substantially all assets of the Organization, and expires on February 26,2017. There were no outstanding balances at December 31, 2013 or 2012, respectively. Page 8
139 MIDWEST RELIABILITY ORGANIZATION NOTES TO FINANCIAL STATEMENTS As of and for the Years Ended December 31, 2013 and 2012 NOTE 6 - RETIREMENT PLANS Postretirement Health Plan The Organization has a defined benefit postretirement health plan available to eligible current and future retirees. Information regarding the plan as of December 31 was as follows: Change in projected benefit obligation Benefit obligation at beginning of year Service cost I nterest cost Plan changes Actuarial (gain) loss Benefits paid Benefit obligation at end of year Change in plan assets Fair value of plan assets at beginning of year Actual return on plan assets Employer contribution Benefits paid Fair value of plan assets at end of year Unfunded status recognized as a noncurrent liability Weighted average assumptions used to calculate the benefit obligation-discount rate $ 880,141 $ 662, , ,199 36,195 29,632 (200,476) 44,362 (3,222) (2,997) 882, , , ,881 59,097 57, ,542 2,997 (3,222) (2,997) 729, ,807 $ (153,171) $ (347,334) 5.04% 4.12% Net periodic postretirement benefit expense for the years ending December 31 is comprised of the following: Components of net periodic benefit cost Service cost I nterest cost Expected return on plan assets Amortization of prior service credit Amortization of actuarial loss $ ,757 $ 146,199 36,195 29,632 (35,073) (35,173) (38,601) (38,601) 8,405 8,245 Net periodic benefit cost $ 140,683 $ 110,302 Weighted-average assumptions used to calculate the net periodic benefit cost Discount rate Expected return on plan assets Rate of compensation increases 4.12% 6.00% N/A 4.48% 7.00% N/A The expected rates of return on plan assets are based on the weighting of the Organization's asset allocations, the 30-year rolling historical average returns, and recent historical average return. Page 9
140 MIDWEST RELIABILITY ORGANIZATION NOTES TO FINANCIAL STATEMENTS As of and for the Years Ended December 31, 2013 and 2012 NOTE 6 - RETIREMENT PLANS (Continued) Assumed health care cost trend rates at December 31 consist of the following: Health care cost trend rate assumed for next year 10.1% 10.6% Rate to which the cost trend rate is assumed to decline (the ultimate trend rate) 5.0% 5.0% Year that the rate reaches the ultimate trend rate Assumed health care cost trend rates have a significant effect on the amounts reported for the health care plan. A one-percentage point change in assumed health care trend rates would have the following effects: One-Percentage Point I ncrease Decrease Effect on total of service cost and interest cost Effect on postretirement benefit obligation $ 52,259 $ 194,953 (39,675) (151,445) Plan related changes other than net periodic cost included in retirement benefit expense: Actuarial (gain) loss arising during the year Amortization of prior year service cost $ (232,905) $ 38,601 13,364 38,601 $ (194,304) $ 51,965 ========= The Organization employs a total return investment approach for plan assets with a mix of equity and debt investments used to maximize the long-term appreciation of plan assets for a prudent level of risk. The Organization's plan assets are invested in various funds, which consist of both stocks and bonds. The equity component includes investment in companies of various sizes, with an emphasis on large cap stocks, and represents several investment styles. The equity portion also includes an allocation to international stocks. Investments in bonds are diversified into three portfolios that invest mainly in U.S. treasuries, high quality corporate issues and mortgage securities. Page 10
141 MIDWEST RELIABILITY ORGANIZATION NOTES TO FINANCIAL STATEMENTS As of and for the Years Ended December 31, 2013 and 2012 NOTE 6 - RETIREMENT PLANS (Continued) The fair values of the Organization's postretirement health plan assets at December 31, by asset category, are as follows: Quoted Prices Quoted Prices in Active in Active Markets for Markets for Identical Identical Assets Assets {Level 1) {Level 1) Asset category Cash equivalents $ 7,490 $ 11,418 Mutual funds-bonds 383, ,492 Mutual funds-equities 265, ,657 Mutual funds-balanced 72,156 39,240 $ 729,224 $ 532,807 Cash equivalents - Investments in cash equivalents consist of money market funds and are classified as Level 1 as they are traded in an active market for which closing prices are readily available. Mutual Funds - Investments in mutual funds are classified as Level 1 as they are traded in an active market for which closing prices are readily available. While the plan believes its valuation methods are appropriate and consistent with other market participants, the use of different methodologies or assumptions to determine the fair value of certain financial instruments could result in a different estimate of fair value at the reporting date. Estimated future benefit payments (which reflect expected future service, as appropriate) as of December 31, 2013 are as follows: Years Ending December $ 5,259 6,772 7,947 12,769 22, ,585 It is reasonably possible that changes in these estimates could occur in the near term and that actual results could differ from these estimates and could have a material effect on the financial statements. The Organization expects to contribute $105,536 to the plan in Page 11
142 MIDWEST RELIABILITY ORGANIZATION NOTES TO FINANCIAL STATEMENTS As of and for the Years Ended December 31, 2013 and 2012 NOTE 6 - RETIREMENT PLANS (Continued) Defined Contribution Pension Plan In 2009, the Organization established a thrift savings plan to replace the terminated multiple-employer plan for the benefit of its employees. The Organization's previous 401 (k) plan was converted into the new plan as well as the establishment of a new, non-elective employer contribution plan. In order to participate in the plan, employees must have attained age 20 and have completed one month of service. Employees may contribute up to the IRS limitations for their elective deferral, with a 50% matching contribution from the Organization. For employees to receive the non-elective or employer contribution, they must have worked 1,000 hours during the plan year. The Organization matched $241,044 and $202,250 of employee deferrals as of December 31,2013 and 2012, respectively. In addition, the Organization elected to make an employer contribution in the amount of $370,263 and $352,412 for the years ended December 31, 2013 and 2012, respectively. The Organization also established a 457B plan in Eligible employees may contribute an elective deferral, with a discretionary matching contribution from the Organization. Employee contributions were $16,226 and $14,200, for the years ended December 31, 2013 and 2012, respectively. The Organization matched $6,675 and $7,400, of employee deferrals for the years ended December 31, 2013 and 2012, respectively. The Organization also established a 457F plan in Employer contribution amounts for employees in excess of IRS contribution limits are deposited to the 457F. The Organization contributed in the amounts of $20,950 and $11,579, for the years ended December 31, 2013 and 2012, respectively. Page 12
143 ATTACHMENT ACTUAL COST-TO-BUDGET COMPARISON AND 2013 AUDITED FINANCIAL REPORT FOR NORTHEAST POWER COORDINATING COUNCIL, INC.
144 Via April 28, 2014 North American Electric Reliability Corporation 3343 Peachtree Road, NE Fourth Floor East Tower Suite 400 Atlanta, Georgia Attention: Mr. Michael Walker Subject: NPCC 2013 True Up Actual vs. Budget Variance Analysis True Up Filing Based on Audited 2013 Financial Statements Dear Michael: Enclosed is the Northeast Power Coordinating Council, Inc. (NPCC) submittal regarding the 2013 NPCC actual vs. budget variances. NPCC s independent audit performed by Pricewaterhouse Coopers LLP was concluded on March 27, 2014 and forwarded to NERC for its information and provision to FERC. As you know, NPCC is a Cross-border Regional Entity which provides Regional Entity functions and services through its regional entity (RE) division. The establishment of Regionally-specific criteria, and monitoring and enforcement of compliance with such criteria are provided through the criteria services (CS) division of NPCC. The CS division is funded by assessments to the Independent System Operators/Balancing Authority Areas within the Region based on their respective Net Energy for Load. No Regional Entity division assessments were used to fund CS division activities. Allocation between the RE division and CS division represents a 94/6 split for 2013 based upon total corporate FTEs of in the RE division and 2.14 in the CS division for the full year. No indirect costs were allocated from the CS division to the RE division and no cross subsidies exist. In addition, NPCC does not budget for interest income and reports such income apportioned based upon its Regional Entity (RE) and Criteria Services (CS) division full time equivalent (FTE) ratio. Actual total expenses for NPCC s RE division for 2013 were $13,533,519 (excluding non-operating expenses which represent change in pension liability based upon actuarial review) which is $538,216 or 4% under the 2013 operating budget of $14,071,735. Actual total expenses for NPCC s CS division for 2013 were $863,318 (excluding non-operating expenses) which is $173,344 or 17% under the 2013 operating budget of $1,036,662. In the aggregate, actual total expenses for the NPCC RE and CS divisions were $14,396,839 which is $711,558 or nearly 5% under the 2013 total corporate budget of $15,108,397. Indirect expenses are allocated to the direct statutory programs based on FTE ratio. NPCC did not use operating cash reserves to fund any activities or services in page: Significant aggregate expense variations for the Regional Entity division are explained on the following 1
145 Personnel Expenses (Actual variance of $346k or 4% under budget at year end) In 2013 NPCC experienced several partial year vacancies but ended the year fully staffed. Despite not being at a full staff complement at times during the year, NPCC performed all of its 2013 delegated responsibilities as well as its goals and objectives, including: - Conducted 22 off-site Operations & Planning (O&P) audits, four on-site O&P audits, 39 off-site CIP audits, 11 on-site CIP audits and 483 individual spot checks involving 79 entities; - Processed 153 Technical Feasibility Exceptions (TFE) from 23 entities, completed TFE Part B review of 135; - Closed 180 violations; - Accepted mitigation plans for 152 violations; - Examined 87 events of which eight were category two or higher; - Processed 35 new entity registrations, 19 entity removals, 17 entity name changes and three certifications. WECC CEA Revenue and Expenses (Actual variance of $75k or 218% over budget at year end) WECC CEA related expenses and offsetting revenue were greater than budget in 2013 due to ongoing audit follow up and enforcement work resulting from the O&P and CIP audits conducted during The total actual expenses related to the WECC audits were trued up with WECC, as per the CEA Agreement. Meeting Expenses (Actual variance of $157k or 12% under budget at year end) Continued efforts to hold more meetings onsite and at member facilities or via webinars have kept meeting expenses under budget. Additionally, in 2013 NPCC contracted with a more cost effective teleconference/webinar provider. No funds were budgeted in association with NPCC conducting compliance hearings and no hearings have been initiated to date in NPCC. Significant variances by program area are provided on a line-item basis using the template provided by NERC which presents actual and budgeted costs on program-by-program format. A single consolidated budget versus actual cost comparison is presented for Administrative Services in order to be consistent with the presentation in NPCC s 2013 Business Plan and Budget. Should you have any questions please do not hesitate to contact me via at jhala@npcc.org or via telephone at (212) JH: jh Enclosures Sincerely, cc: Mr. Edward A. Schwerdt NPCC President & CEO Ms. Jennifer Budd Mattiello NPCC Vice President & COO Jessica Hala Jessica Hala Manager, Finance and Accounting 2
146 Northeast Power Coordinating Council, Inc Statement of Activities Summary Total NPCC (RE and CS Divisions) 2013 Actual 2013 Budget 2013 Variance from Budget Over(Under) Funding ERO Funding Assessments 12,352,264 12,352,265 - Penalty Sanctions 297, ,301 - Total ERO Funding 12,649,565 12,649,566 - Federal Grants Non-Statutory Assessments 1,139,690 1,139,690 - Testing Services & Software Workshop Fees 58,650 80,000 (21,350) Interest 17,281-17,281 Miscellaneous 109,867 34,500 75,367 Total Funding (A) 13,975,053 13,903,756 71,298 Expenses Personnel Expenses Salaries 5,738,140 5,946,022 (207,882) Payroll Taxes 378, ,303 (19,108) Employee Benefits 1,309,704 1,377,863 (68,159) Savings & Retirement 1,171,746 1,233,209 (61,463) Total Personnel Expenses 8,597,785 8,954,397 (356,612) Meeting Expenses Meetings 331, ,000 (65,396) Travel 799, ,000 (110,343) Conference Calls 71,988 87,000 (15,012) Total Meeting Expenses 1,203,249 1,394,000 (190,751) Operating Expenses Consultants & Contracts 2,060,648 2,178,000 (117,352) Rent & Improvements 740, ,500 34,199 Office Costs 540, ,500 72,384 Professional Services 910,220 1,120,000 (209,780) Miscellaneous 43,094 80,000 (36,906) Depreciation 300, ,000 93,260 Total Operating Expenses 4,595,805 4,760,000 (164,195) Indirect Expenses Other Non-Operating Expenses (2,541,035) - (2,541,034) Total Expenses (B) 11,855,804 15,108,397 (3,252,592) Change in Assets (A - B) 2,119,249 (1,204,641) 3,323,890 Fixed Assets Depreciation (300,260) (207,000) (93,260) Computer & Software CapEx 167, ,230 Furniture & Fixtures CapEx 1,388-1,388 Equipment CapEx Leasehold Improvements Incr(Dec) in Fixed Assets (131,642) (207,000) 75,358 Allocation of Fixed Assets (0) - (0) Total Inc(Dec) in Fixed Assets (C) (131,642) (206,997) 75,355 TOTAL BUDGET (B + C) 11,724,162 14,901,400 (3,177,237) Change in Working Capital (A-B-C) 2,250,891 (997,645) 3,248,535 FTE's (0.64)
147 Northeast Power Coordinating Council, Inc Statement of Activities Summary NON-STATUTORY 2013 Actual 2013 Budget 2013 Variance from Budget Over(Under) Funding ERO Funding Assessments Penalty Sanctions Total ERO Funding Federal Grants Non-Statutory Assessments 1,139,690 1,139, % Testing Services & Software Workshop Fees Interest Miscellaneous Total Funding (A) 1,140,237 1,139, % Expenses Personnel Expenses Salaries 247, ,881 (21,467) -7.98% Payroll Taxes 15,240 19,614 (4,374) % Employee Benefits 67,957 46,561 21, % Savings & Retirement 134, ,645 (6,462) -4.59% Total Personnel Expenses 464, ,701 (10,907) -2.29% Meeting Expenses Meetings 3,602 20,000 (16,398) % Travel 37,492 55,000 (17,508) % Conference Calls Total Meeting Expenses 41,094 75,000 (33,906) % Operating Expenses Consultants & Contracts 1,425 65,000 (63,575) % Rent & Improvements (933) - (933) Office Costs Professional Services Miscellaneous Depreciation 18,655 14,490 4, % Total Operating Expenses 21,615 79,490 (57,875) % Indirect Expenses 335, ,471 (70,656) % Other Non-Operating Expenses (395,997) - (395,997) Total Expenses (B) 467,321 1,036,662 (569,341) % Change in Assets (A - B) 672, , , % Fixed Assets Depreciation (18,655) (14,490) (4,165) 28.74% Computer & Software CapEx Furniture & Fixtures CapEx Equipment CapEx Leasehold Improvements Incr(Dec) in Fixed Assets (18,655) (14,490) (4,165) Allocation of Fixed Assets Total Inc(Dec) in Fixed Assets (C) (18,655) (14,490) (4,165) 28.74% TOTAL BUDGET (B + C) 448,666 1,022,172 (573,506) % Change in Working Capital (A-B-C) 691, , , % FTE's %
148 Northeast Power Coordinating Council, Inc Statement of Activities Summary TOTAL STATUTORY Variance from Budget Actual Budget Over(Under) Comments (Explain variances > +/- 10% and >$10,000) Funding ERO Funding Assessments 12,352,264 12,352, % Penalty Sanctions 297, , % Total ERO Funding 12,649,565 12,649, % Federal Grants Non-Statutory Assessments Testing Services & Software Workshop Fees 58,650 80,000 (21,350) % Actual fees charged per person for attending NPCC s standards and compliance workshops were less than originally budgeted. Interest 16,734-16,734 Interest income, while not budgeted, was allocated by FTE ratio between statutory and nonstatutory. Miscellaneous 109,867 34,500 75, % WECC CEA actual expenses and offsetting revenue were greater than budget due to ongoing audit follow up and enforcement work resulting from the O&P and CIP audits conducted during Total Funding (A) 12,834,816 12,764,066 70, % Expenses Personnel Expenses Salaries 5,490,726 5,677,141 (186,415) -3.28% Under budget due to staff vacancies throughout the year and due to at risk compensation component based on corporate goal attainment and individual performance. Payroll Taxes 362, ,689 (14,734) -3.90% Under budget due to staff vacancies throughout the year. Employee Benefits 1,241,747 1,331,302 (89,555) -6.73% Under budget due to several employees opting out of health insurance coverage for superior coverage through a prior employer, as well as staff vacancies throughout the year. Savings & Retirement 1,037,563 1,092,564 (55,001) -5.03% Under budget due to staff vacancies throughout the year. Total Personnel Expenses 8,132,991 8,478,696 (345,705) -4.08% Meeting Expenses Meetings 328, ,000 (48,998) % Continued efforts to hold more meetings onsite and at member facilities or via webinars have kept meeting expenses under budget. Travel 762, ,000 (92,835) % Travel expenses were controlled by holding more meetings onsite or via webinars. Conference Calls 71,988 87,000 (15,012) % Contracted with a more cost effective teleconference/webinar provider. Total Meeting Expenses 1,162,155 1,319,000 (156,845) % Operating Expenses Consultants & Contracts 2,059,223 2,113,000 (53,777) -2.55% Rent & Improvements 741, ,500 35, % Office Costs 539, ,500 71, % Over budget primarily related to computer supplies and maintenance due to additional software programs including Diligent Board Books, to support Directors' hardware. Professional Services 909,302 1,120,000 (210,698) % Legal fees were less than budget due to judicious use of outside counsel. Miscellaneous 42,511 80,000 (37,489) % Under budget due to ongoing cost cutting efforts in all areas. Depreciation 281, ,510 89, % Over budget due to additional assets placed in service in 2013 related to CMEP Data Administration Application (CDAA) software development to enhance the efficiencies of compliance activities for both registered entities and Regional Entity staffs. Total Operating Expenses 4,574,190 4,680,510 (106,320) -2.27% Indirect Expenses (335,817) (406,471) 70, % Other Non-Operating Expenses (2,145,038) - (2,145,037) Decrease in NPCC's pension liability based on actuarial review at year end. Total Expenses (B) 11,388,481 14,071,735 (2,683,253) % Change in Assets (A - B) 1,446,335 (1,307,669) 2,754, % Fixed Assets Depreciation (281,605) (192,510) (89,095) 46.28% Over budget due to additional assets placed in service in 2013 related to CMEP Data Administration Application (CDAA) software development to enhance the efficiencies of compliance activities for both registered entities and Regional Entity staffs. Computer & Software CapEx 167, ,230 Over budget due to capitalization of costs related to CMEP Data Administration Application (CDAA) software development not included in budget. Furniture & Fixtures CapEx 1,388-1,388 Over budget due to office furniture purchase not included in budget. Equipment CapEx Leasehold Improvements Incr(Dec) in Fixed Assets (112,987) (192,510) 79,523 Allocation of Fixed Assets (0) - (0) Total Inc(Dec) in Fixed Assets (C) (112,987) (192,507) 79, % TOTAL BUDGET (B + C) 11,275,494 13,879,228 (2,603,733) % Change in Working Capital (A-B-C) 1,559,322 (1,115,163) 2,674, % FTE's (0.64) -1.79% Fully staffed at year end; variance is due to temporary vacancies during the year.
149 Northeast Power Coordinating Council, Inc Statement of Activities Summary RELIABILITY STANDARDS 2013 Actual 2013 Budget Funding ERO Funding Assessments 1,358,549 1,358, % Penalty Sanctions 32,431 32, % Total ERO Funding 1,390,980 1,390, % Federal Grants Non-Statutory Assessments Testing Services & Software Workshop Fees Interest Miscellaneous Total Funding (A) 1,390,980 1,390, % 2013 Variance from Budget Over(Under) Comments (Explain variances > +/- 10% and >$10,000) Expenses Personnel Expenses Salaries 475, ,983 (3,488) -0.73% Payroll Taxes 29,163 31,972 (2,809) -8.79% Employee Benefits 96, ,361 (5,233) -5.16% Savings & Retirement 70,714 78,141 (7,427) -9.50% Total Personnel Expenses 671, ,457 (18,957) -2.75% Meeting Expenses Meetings 1,665 30,000 (28,335) % Meeting expenses were under budget due to more meetings held at NPCC offices, member facilities or via webinar. Additionally, meetings that were previously allocated across all programs are now recorded to Admin and allocated through indirect expenses. Travel 116, ,000 11, % Increased volume of meetings attended by staff but not hosted by NPCC. Conference Calls Total Meeting Expenses 117, ,000 (17,289) % Operating Expenses Consultants & Contracts 8,561 30,000 (21,439) % Under budget as a result of judicious use of contractor and consultant services to complement staff functions. Rent & Improvements Office Costs Professional Services Miscellaneous Depreciation Total Operating Expenses 8,959 30,000 (21,041) % Indirect Expenses 596, ,523 40, % Other Non-Operating Expenses (165,783) - (165,783) Decrease in NPCC's pension liability based on actuarial review at year end. Total Expenses (B) 1,229,069 1,411,980 (182,911) % Change in Assets (A - B) 161,911 (21,000) 182, % Fixed Assets Depreciation Computer & Software CapEx Furniture & Fixtures CapEx Equipment CapEx Leasehold Improvements Incr(Dec) in Fixed Assets Allocation of Fixed Assets (11,883) (21,000) 9, % Total Inc(Dec) in Fixed Assets (C) (11,883) (21,000) 9, % TOTAL BUDGET (B + C) 1,217,186 1,390,980 (173,794) % Change in Working Capital (A-B-C) 173, ,794 FTE's %
150 Northeast Power Coordinating Council, Inc Statement of Activities Summary WECC CEA Responsibilities 2013 Actual 2013 Budget Funding ERO Funding Assessments Penalty Sanctions - - Total ERO Funding Variance from Budget Over(Under) Comments (Explain variances > +/- 10% and >$10,000) Federal Grants Non-Statutory Assessments Testing Services & Software Workshop Fees Interest Miscellaneous 109, ,867 WECC CEA funds budgeted under Compliance are shown here. WECC CEA actual expenses and offsetting revenue were greater than budget due to ongoing audit follow up and enforcement work resulting from the O&P and CIP audits conducted during Total Funding (A) 109, ,867 Expenses Personnel Expenses Salaries 46,313-46,313 WECC CEA related expenses allocated from Compliance. Payroll Taxes Employee Benefits Savings & Retirement Total Personnel Expenses 46,313-46,313 Meeting Expenses Meetings Travel 1,971-1,971 WECC CEA related expenses allocated from Compliance. Conference Calls Total Meeting Expenses 1,971-1,971 Operating Expenses Consultants & Contracts 61,583-61,583 WECC CEA related expenses allocated from Compliance. Rent & Improvements Office Costs Professional Services Miscellaneous Depreciation Total Operating Expenses 61,583-61,583 Indirect Expenses Other Non-Operating Expenses Total Expenses (B) 109, ,867 Change in Assets (A - B) Fixed Assets Depreciation Computer & Software CapEx Furniture & Fixtures CapEx Equipment CapEx Leasehold Improvements Incr(Dec) in Fixed Assets Allocation of Fixed Assets Total Inc(Dec) in Fixed Assets (C) TOTAL BUDGET (B + C) 109, ,867 Change in Working Capital (A-B-C) FTE's - - -
151 Northeast Power Coordinating Council, Inc Statement of Activities Summary COMPLIANCE OPERATIONS, ENFORCEMENT and ORGANIZATION REGISTRATION 2013 Actual 2013 Budget Funding ERO Funding Assessments 7,576,805 7,576, % Penalty Sanctions 166, , % Total ERO Funding 7,742,833 7,742, % Federal Grants Non-Statutory Assessments Testing Services & Software Workshop Fees Interest Variance from Budget Over(Under) Comments (Explain variances > +/- 10% and >$10,000) Miscellaneous - 34,500 (34,500) % WECC CEA funds budgeted under Compliance are shown separately under "WECC CEA." WECC CEA actual expenses and offsetting revenue were greater than budget due to ongoing audit follow up and enforcement work resulting from the O&P and CIP audits conducted during Total Funding (A) 7,742,833 7,777,333 (34,500) -0.44% Expenses Personnel Expenses Salaries 1,996,523 2,117,561 (121,038) -5.72% Under budget due allocation to WECC, temporary vacancies during the year and at risk compensation component based on corporate goal attainment and individual performance. Payroll Taxes 137, ,612 (15,363) % Under budget due to temporary vacancies during the year and at risk compensation component based on corporate goal attainment and individual performance. Employee Benefits 471, ,444 6, % Savings & Retirement 240, ,129 (61,309) % Under budget due to temporary vacancies during the year. Total Personnel Expenses 2,846,508 3,037,746 (191,238) -6.30% Meeting Expenses Meetings 34,230 45,000 (10,770) % Meeting expenses were under budget due to more meetings held at NPCC offices, member facilities or via webinar. Additionally, meetings that were previously allocated across all programs are now recorded to Admin and allocated through indirect expenses. Travel 309, ,000 (65,148) % Continued efforts to hold more meetings onsite or via webinars have kept travel expenses under budget. Conference Calls Total Meeting Expenses 344, ,000 (75,918) % Operating Expenses Consultants & Contracts 1,424,600 1,578,000 (153,400) -9.72% Under budget due to allocation to WECC and two on-site audits previously included in the 2013 schedule and budget being moved to 2014 so that NPCC led Certification Reviews of organizational and/or EMS changes by NPCC registered entities could be performed. Rent & Improvements Office Costs Professional Services Miscellaneous 2,391-2,391 Depreciation Total Operating Expenses 1,426,991 1,578,000 (151,009) -9.57% Indirect Expenses 3,009,853 2,849, , % Other Non-Operating Expenses (193,685) - (193,685) Decrease in NPCC's pension liability based on actuarial review at year end. Total Expenses (B) 7,433,749 7,884,840 (451,091) -5.72% Change in Assets (A - B) 309,084 (107,507) 416, % Fixed Assets Depreciation Computer & Software CapEx Furniture & Fixtures CapEx Equipment CapEx Leasehold Improvements Incr(Dec) in Fixed Assets Allocation of Fixed Assets (64,888) (107,507) 42, % Total Inc(Dec) in Fixed Assets (C) (64,888) (107,507) 42, % TOTAL BUDGET (B + C) 7,368,861 7,777,333 (408,472) -5.25% Change in Working Capital (A-B-C) 373, ,972 FTE's (0.31) -2.09% Fully staffed at year end; variance is due to temporary vacancies during the year.
152 RELIABILITY ASSESSMENTS and PERFORMANCE ANALYSIS 2013 Actual Northeast Power Coordinating Council, Inc Statement of Activities Summary 2013 Budget Funding ERO Funding Assessments 2,892,110 2,892, % Penalty Sanctions 64,529 64, % Total ERO Funding 2,956,639 2,956, % Federal Grants Non-Statutory Assessments Testing Services & Software Workshop Fees Interest Miscellaneous Total Funding (A) 2,956,639 2,956, % 2013 Variance from Budget Over(Under) Comments (Explain variances > +/- 10% and >$10,000) Expenses Personnel Expenses Salaries 807, ,733 (131,514) % Under budget due to turnover and at risk compensation component based on corporate goal attainment and individual performance. Payroll Taxes 56,613 63,449 (6,836) % Under budget due to turnover resulting in temporary vacancies. Employee Benefits 209, ,362 (5,854) -2.72% Under budget due to several employees opting out of health insurance coverage for superior coverage through a prior employer, as well as staff vacancies throughout the year. Savings & Retirement 169, ,530 (14,307) -7.80% Total Personnel Expenses 1,242,563 1,401,074 (158,511) % Meeting Expenses Meetings 34,968 45,000 (10,032) % Meeting expenses were under budget due to more meetings held at NPCC offices or via webinar. Additionally, meetings that were previously allocated across all programs are now recorded to Admin and allocated through indirect expenses. Travel 183, ,000 23, % Travel expenses exceeded budget due to travel associated with Bulk Electric System definition related meetings. Conference Calls Total Meeting Expenses 217, ,000 12, % Operating Expenses Consultants & Contracts 335, ,000 50, % Over budget due primarily due to consulting associated with revision of the Bulk Electric System definition. Rent & Improvements Office Costs Professional Services Miscellaneous 1,409-1,409 Depreciation Total Operating Expenses 336, ,000 51, % Indirect Expenses 1,131,642 1,107,348 24, % Other Non-Operating Expenses (443,660) - (443,660) Decrease in NPCC's pension liability based on actuarial review at year end. Total Expenses (B) 2,484,960 2,998,422 (513,462) % Change in Assets (A - B) 471,679 (41,783) 513, % Fixed Assets Depreciation Computer & Software CapEx Furniture & Fixtures CapEx Equipment CapEx Leasehold Improvements Incr(Dec) in Fixed Assets Allocation of Fixed Assets (23,644) (41,783) 18, % Total Inc(Dec) in Fixed Assets (C) (23,644) (41,783) 18, % TOTAL BUDGET (B + C) 2,461,316 2,956,639 (495,323) % Change in Working Capital (A-B-C) 495, ,323 FTE's (0.33) -5.66% Fully staffed at year end; variance is due to temporary vacancies during the year.
153 Northeast Power Coordinating Council, Inc Statement of Activities Summary TRAINING, EDUCATION and OPERATOR CERTIFICATION 2013 Actual 2013 Budget 2013 Variance from Budget Over(Under) Funding ERO Funding Assessments 136, , % Penalty Sanctions 1,107 1, % Total ERO Funding 137, , % Comments (Explain variances > +/- 10% and >$10,000) Federal Grants Non-Statutory Assessments Testing Services & Software Workshop Fees 58,650 80,000 (21,350) % Actual fees charged per person for attending NPCC s standards and compliance workshops were less than originally budgeted. Interest Miscellaneous Total Funding (A) 196, ,617 (21,350) -9.81% Expenses Personnel Expenses Salaries 19,084 17,338 1, % Payroll Taxes 1,138 1, % Employee Benefits 4,539 4, % Savings & Retirement 4,712 4,785 (73) -1.53% Total Personnel Expenses 29,473 27,340 2, % Meeting Expenses Meetings 125, ,000 (26,459) % Workshop expenses were less than budgeted as a result of lower negotiated rates and more meetings held at NPCC offices, member facilities or via webinar. Travel 2,507 20,000 (17,493) % Under budget due to more meetings held at NPCC offices or via webinar. Conference Calls Total Meeting Expenses 128, ,000 (43,952) % Operating Expenses Consultants & Contracts 3,088-3,088 Rent & Improvements Office Costs Professional Services Miscellaneous 1,666-1,666 Depreciation Total Operating Expenses 4,754-4,754 Indirect Expenses 20,209 18,994 1, % Other Non-Operating Expenses (15,087) - (15,087) Decrease in NPCC's pension liability based on actuarial review at year end. Total Expenses (B) 167, ,334 (50,937) % Change in Assets (A - B) 28,870 (717) 29, % Fixed Assets Depreciation Computer & Software CapEx Furniture & Fixtures CapEx Equipment CapEx Leasehold Improvements Incr(Dec) in Fixed Assets Allocation of Fixed Assets (406) (717) % Total Inc(Dec) in Fixed Assets (C) (406) (717) % TOTAL BUDGET (B + C) 166, ,617 (50,626) % Change in Working Capital (A-B-C) 29,276-29,276 FTE's %
154 Northeast Power Coordinating Council, Inc Statement of Activities Summary SITUATION AWARENESS and INFRASTRUCTURE SECURITY 2013 Actual 2013 Budget Funding ERO Funding Assessments 1,503,453 1,503, % Penalty Sanctions 33,206 33, % Total ERO Funding 1,536,659 1,536, % Federal Grants Non-Statutory Assessments Testing Services & Software Workshop Fees Interest Miscellaneous Total Funding (A) 1,536,659 1,536, % 2013 Variance from Budget Over(Under) Comments (Explain variances > +/- 10% and >$10,000) Expenses Personnel Expenses Salaries 508, ,676 (10,960) -2.11% Salaries were under budget due to at risk compensation component based on corporate goal attainment and individual performance. Payroll Taxes 33,867 33, % Employee Benefits 60,012 82,596 (22,584) % Under budget due to several employees opting out of health insurance coverage for superior coverage through a prior employer. Savings & Retirement 110, ,730 (6,833) -5.80% Total Personnel Expenses 713, ,340 (39,848) -5.29% Meeting Expenses Meetings 8,014 45,000 (36,986) % Under budget due to continued efforts to hold more meetings onsite, at member facilities or via webinars. Additionally, meetings that were previously allocated across all programs are now recorded to Admin and allocated through indirect expenses. Travel 43,486 90,000 (46,514) % Continued efforts to hold more meetings onsite or via webinars have kept travel expenses under budget. Conference Calls Total Meeting Expenses 51, ,000 (83,500) % Operating Expenses Consultants & Contracts 113, ,000 13, % Over budget due to added programs and efforts related to system frequency response and generator governor response and the implementation of the NPCC program for the Simultaneous Activation of Reserve (SAR). Rent & Improvements Office Costs Professional Services Miscellaneous Depreciation Total Operating Expenses 113, ,000 13, % Indirect Expenses 610, ,819 40, % Other Non-Operating Expenses (304,468) - (304,468) Decrease in NPCC's pension liability based on actuarial review at year end. Total Expenses (B) 1,184,914 1,558,159 (373,245) % Change in Assets (A - B) 351,745 (21,500) 373, % Fixed Assets Depreciation Computer & Software CapEx Furniture & Fixtures CapEx Equipment CapEx Leasehold Improvements Incr(Dec) in Fixed Assets Allocation of Fixed Assets (12,167) (21,500) 9, % Total Inc(Dec) in Fixed Assets (C) (12,167) (21,500) 9, % TOTAL BUDGET (B + C) 1,172,747 1,536,659 (363,912) % Change in Working Capital (A-B-C) 363, ,912 FTE's %
155 ADMINISTRATIVE SERVICES 2013 Actual Northeast Power Coordinating Council, Inc Statement of Activities Summary 2013 Budget Funding ERO Funding Assessments (1,115,163) (1,115,163) % Penalty Sanctions - - Total ERO Funding (1,115,163) (1,115,163) % 2013 Variance from Budget Over(Under) Comments (Explain variances > +/- 10% and >$10,000) Federal Grants Non-Statutory Assessments Testing Services & Software Workshop Fees Interest 16,734-16,734 Interest income, while not budgeted, was allocated by FTE ratio between statutory and non-statutory. Miscellaneous Total Funding (A) (1,098,429) (1,115,163) 16, % Expenses Personnel Expenses Salaries 1,637,376 1,604,850 32, % Payroll Taxes 104,925 95,230 9, % Employee Benefits 399, ,410 (62,766) % Under budget due to several employees opting out of health insurance coverage for superior coverage through a prior employer. Savings & Retirement 441, ,249 34, % Total Personnel Expenses 2,583,142 2,568,739 14, % Meeting Expenses Meetings 123,584 60,000 63, % Company wide meetings that were previously allocated across all programs are now recorded to G&A and allocated across all programs through indirect expenses. Total Statutory meetings are under budget. Travel 105, , % Conference Calls 71,988 87,000 (15,012) % Contracted with a more cost effective teleconference/webinar provider. Total Meeting Expenses 300, ,000 48, % Operating Expenses Consultants & Contracts 113, ,000 (6,658) -5.55% Rent & Improvements 741, ,500 35, % Office Costs 539, ,500 71, % Over budget primarily related to computer supplies and maintenance due to additional software programs including Diligent Board Books, to support Directors' hardware. Professional Services 909,302 1,120,000 (210,698) % Legal fees were less than budget due to judicious use of outside counsel. Miscellaneous 36,044 80,000 (43,956) % Under budget due to ongoing cost cutting efforts in all areas. Depreciation 281, ,510 89, % Over budget due to additional assets placed in service in The assets are related to CDAA software development to enhance the efficiencies of compliance activities for both registered entities and Regional Entity staffs. Total Operating Expenses 2,621,842 2,687,510 (65,668) -2.44% Indirect Expenses (5,704,951) (5,508,249) (196,702) 3.57% Other Non-Operating Expenses (1,022,355) - (1,022,355) Decrease in NPCC's pension liability based on actuarial review at year end. Total Expenses (B) (1,221,474) - (1,221,474) Change in Assets (A - B) 123,045 (1,115,163) 1,238, % Fixed Assets Depreciation (281,605) (192,510) (89,095) 46.28% Over budget due to additional assets placed in service in The assets are related to CDAA software development to enhance the efficiencies of compliance activities for both registered entities and Regional Entity staffs. Computer & Software CapEx 167, ,230 Over budget due to capitalization of costs related to CMEP Data Administration Application (CDAA) software development not included in budget. Furniture & Fixtures CapEx 1,388-1,388 Equipment CapEx Leasehold Improvements Incr(Dec) in Fixed Assets (112,987) (192,510) 79,523 Allocation of Fixed Assets 112, ,510 (79,523) % Total Inc(Dec) in Fixed Assets (C) TOTAL BUDGET (B + C) (1,221,474) - (1,221,474) Change in Working Capital (A-B-C) 123,045 (1,115,163) 1,238, % FTE's %
156 Northeast Power Coordinating Council, Inc. Financial Statements December 31, 2013 and 2012
157 Northeast Power Coordinating Council, Inc. Index December 31, 2013 and 2012 Page(s) Report of Independent Auditors...1 Financial Statements Statements of Financial Position...2 Statements of Activities...3 Statements of Cash Flows...4 Notes to Financial Statements
158 To the Board of Directors and the Members of Northeast Power Coordinating Council, Inc. Independent Auditor's Report We have audited the accompanying financial statements of Northeast Power Coordinating Council, Inc., which comprise the balance sheets as of December 31, 2013 and December 31, 2012, and the related change in net assets and cash flows for the years then ended. Management's Responsibility for the Financial Statements Management is responsible for the preparation and fair presentation of the financial statements in accordance with accounting principles generally accepted in the United States of America; this includes the design, implementation, and maintenance of internal control relevant to the preparation and fair presentation of financial statements that are free from material misstatement, whether due to fraud or error. Auditor's Responsibility Our responsibility is to express an opinion on the financial statements based on our audits. We conducted our audits in accordance with auditing standards generally accepted in the United States of America. Those standards require that we plan and perform the audit to obtain reasonable assurance about whether the financial statements are free from material misstatement. An audit involves performing procedures to obtain audit evidence about the amounts and disclosures in the financial statements. The procedures selected depend on our judgment, including the assessment of the risks of material misstatement of the financial statements, whether due to fraud or error. In making those risk assessments, we consider internal control relevant to the Company's preparation and fair presentation of the financial statements in order to design audit procedures that are appropriate in the circumstances, but not for the purpose of expressing an opinion on the effectiveness of the Company's internal control. Accordingly, we express no such opinion. An audit also includes evaluating the appropriateness of accounting policies used and the reasonableness of significant accounting estimates made by management, as well as evaluating the overall presentation of the financial statements. We believe that the audit evidence we have obtained is sufficient and appropriate to provide a basis for our audit opinion. Opinion In our opinion, the financial statements referred to above present fairly, in all material respects, the financial position of Northeast Power Coordinating Council, Inc. at December 31, 2013 and December 31, 2012, and the results of its operations and its cash flows for the years then ended in accordance with accounting principles generally accepted in the United States of America. PricewaterhouseCoopers LLP New York, New York March 27, 2014
159 Northeast Power Coordinating Council, Inc. Statements of Financial Position December 31, 2013 and Assets Cash $ 7,412,184 $ 6,724,986 Restricted cash 611, ,950 Investments 2,210,944 2,210,894 Prepaid expenses 236, ,074 Other assets 137, ,714 Equipment and leasehold improvements, less accumulated depreciation and amortization of $1,100,649 and $800,389, respectively 1,142,418 1,274,059 Total assets $ 11,750,309 $ 11,466,677 Liabilities and Net Assets Accrued expenses and other liabilities $ 1,572,583 $ 1,287,040 Accrued liability for pension 1,135,117 3,676,153 Deferred revenue 734, ,313 Deferred rent 774, ,901 Total liabilities 4,216,085 5,966,407 Net assets Unrestricted net assets 7,534,224 5,500,270 Total net assets 7,534,224 5,500,270 Total liabilities and net assets $ 11,750,309 $ 11,466,677 The accompanying notes are an integral part of these financial statements. 2
160 Northeast Power Coordinating Council, Inc. Statements of Activities Years Ended December 31, 2013 and Revenue Assessments $ 1,139,688 $ 956,900 Regional entity ERO funding 12,352,264 12,551,567 Penalty sanctions 212, ,300 Workshops 58,650 56,616 Interest income 17,281 22,255 Miscellaneous Income 109, ,507 Total revenue 13,889,750 14,105,145 Operating expenses Salaries and employee benefits 8,365,952 7,722,983 Administrative and consultant fees 2,398,006 1,944,962 Professional fees 572, ,170 Meetings and travel 1,131, ,372 Telephone and telecommunications 262, ,042 Office supplies and expense 316, ,696 Equipment leases 131, ,307 Rent expense 643, ,281 Insurance expense 39,019 34,768 Miscellaneous 43, ,107 Depreciation and amortization 300, ,647 Total operating expenses 14,203,389 12,794,335 Change in net assets before nonoperating expenses (313,639) 1,310,810 Nonoperating expenses Pension change other than net periodic pension cost (2,347,593) 1,080,685 Increase in net assets 2,033, ,125 Net assets Beginning of year 5,500,270 5,270,145 End of year $ 7,534,224 $ 5,500,270 The accompanying notes are an integral part of these financial statements. 3
161 Northeast Power Coordinating Council, Inc. Statements of Cash Flows Years Ended December 31, 2013 and Cash flows from operating activities Change in net assets $ 2,033,954 $ 230,125 Depreciation and amortization 300, ,647 Decrease (increase) in prepaid expenses 34,523 (65,349) Decrease (increase) in other assets 198,523 (267,638) Increase in accrued expenses and other liabilities 285,543 90,135 (Decrease) increase in accrued liability for pension (2,541,036) 1,019,403 Increase (decrease) in deferred revenue 498,804 (230,210) Increase in deferred rent 6,367 6,424 Net cash provided by operating activities 816,938 1,019,537 Cash flows from investing activities Purchases of equipment and leasehold improvements (168,619) (246,623) Purchases of investments (50) (30) Restricted cash 38, ,845 Net cash (used for) provided by investing activities (129,740) 441,192 Net increase in cash 687,198 1,460,729 Cash Beginning of year 6,724,986 5,264,257 End of year $ 7,412,184 $ 6,724,986 The accompanying notes are an integral part of these financial statements. 4
162 Northeast Power Coordinating Council, Inc. Notes to Financial Statements December 31, 2013 and Background Northeast Power Coordinating Council, Inc. ( NPCC or the Company ) is a New York State not-for-profit corporation whose purpose is to promote and enhance the reliable and efficient operation of the international, interconnected bulk power system in Northeastern North America through its regional entity and criteria services divisions. The Company s regional entity division is responsible for the development of regional reliability standards and compliance assessment and enforcement of continent-wide and regional reliability standards, coordination of system planning, design and operations, and assessment of reliability. These responsibilities are pursuant to an agreement with the North American Electric Reliability Corporation ( NERC ), an Electric Reliability Organization ( ERO ), under authority of the U.S. Federal Energy Regulatory Commission ( FERC ), and by Memoranda of Understanding with applicable Canadian Provincial regulatory and/or governmental authorities. The Company s criteria services division establishes regionally-specific criteria, and monitors and enforces compliance with such criteria. In the development of regionally-specific reliability criteria, the Company, to the extent possible, facilitates attainment of fair, effective and efficient competitive electric markets. The Company is primarily funded through the NERC based on the regional entity division annual business plan and budget submitted to and approved by the FERC and Canadian provincial regulatory and/or governmental authorities. The Company s criteria services division is funded by regional independent system operators or balancing authorities acting as the Load Serving Entities designees with regard to funding and the criteria services division operates on assessments to and funded from these entities based upon a Net Energy for Load formula. 2. Summary of Significant Accounting Policies Basis of Accounting For the years ended December 31, 2013 and 2012, the Company used the accrual basis of accounting in conformity with accounting principles generally accepted in the United States of America. Cash The Company s cash balance consists of its operating checking account, as well as a savings account. At times, cash balances may be in excess of depository insurance limits. Restricted Cash Restricted cash represents amounts in deposit accounts funded with penalties levied and received for noncompliance within NPCC U.S., which are required to be used for statutory activities in years subsequent to which the penalty was received, and amounts in deposit accounts for collateralizing a letter of credit as security for NPCC s office lease. At times, cash balances may be in excess of depository insurance limits. Equipment and Leasehold Improvements Equipment and leasehold improvements are stated at cost. Depreciation of furniture and computer equipment is computed on the straight-line basis over the estimated useful lives of the applicable assets. Amortization of leasehold improvements is computed on the straight-line basis over the estimated useful lives of the applicable assets, or over the term of the related lease, whichever is less. 5
163 Northeast Power Coordinating Council, Inc. Notes to Financial Statements December 31, 2013 and 2012 Revenue Recognition For the criteria services division, membership in the Company is on a calendar year basis. There are no fees assessed to full members other than those members that are Independent System Operators or Balancing Authorities. Assessments received are recorded as income in the year to which the membership applies irrespective of when billed or collected. For the regional entity division, membership in the Company is on a calendar year basis. There are no fees assessed to general members. Funding mechanisms provided through U.S. regulatory and Canadian Provincial governmental and/or regulatory agreements provide for quarterly remittances through the North American Electric Reliability Corporation. Assessments received are recorded as income in the year to which the Business Plan and Budget applies irrespective of when billed or collected. Penalty sanctions are recorded as income when levied and the appeals process has been waived or is concluded. Rent Expense The Company s office lease which commenced in 2009 contains predetermined increases and decreases in the rentals payable during the lease term. Rent expense is recognized on a straight-line basis over the lease term. The difference between the rent expense charged to operations during the year and the amount payable under the lease during that year is recorded as Deferred rent on the Statements of Financial Position. Deferred rent also includes the landlord s contribution toward the cost of leasehold improvements, which is being amortized over the lease term. The unamortized balance of the landlord s contribution at December 31, 2013 is approximately $372,000. Income Taxes The Company has been classified as exempt from federal income taxes under Section 501(c) (6) of the Internal Revenue Code. Use of Estimates The Company uses estimates and assumptions in preparing these financial statements in accordance with accounting principles generally accepted in the United States of America. Those estimates and assumptions affect the reported amounts of assets, liabilities, revenues and expenses. Actual results could vary from the estimates that are used. 3. Investments The Company s primary banking relationship is with JP Morgan Chase. Prior to 2009, both regional entity (ERO funded) and criteria services (Regional Independent System Operators/Balancing Authorities ISO/BAs) revenues were invested in a JPMorgan 100% U.S. Treasury Security Money Market Fund (the Fund ). The Fund aims to provide the highest possible level of current income while still maintaining liquidity and providing maximum safety of principal. The Fund is a money market fund managed to meet the requirements of Rule 2a-7 under the Investment Company Act of The Fund is not insured or guaranteed by the FDIC or any other government agency. In late 2008, the Fund was closed to additional investments. Subsequent excess cash is being deposited into a savings account with JP Morgan Chase. 6
164 Northeast Power Coordinating Council, Inc. Notes to Financial Statements December 31, 2013 and 2012 The Fund invests solely in debt securities of the U.S. Treasury, including Treasury bills, bonds and notes. These investments carry different interest rates, maturities and issue dates. The National Association of Insurance Commissioner ( NAIC ), Moody s, Fitch IBCA and S&P ratings signify that the Fund has historically had a superior capacity to maintain a net asset value of $1.00 per share. The ratings do not eliminate the risks associated with investing in the Fund. The NAIC approved status indicates that the Fund meets certain pricing and quality guidelines. Management has determined that the likelihood of sustaining losses from money market funds to be remote based on the marketability of the underlying investment of the funds. At December 31, 2013 and 2012, the Company owned 2,210,944 and 2,210,894 units of $1 par value per unit, respectively. In 2013 and 2012, the funds earned average yields of less than 1%. Investment income earned on the Fund is reinvested into units of the Fund on a monthly basis. 4. Equipment and Leasehold Improvements Equipment and leasehold improvements at December 31, 2013 and 2012 consists of the following: Depreciable Life Furniture 10 years $ 202,906 $ 201,518 Computer equipment 3 years 435, ,769 Website 3 years 232, ,000 Software 3 years 397, ,470 Leasehold improvements 15 years (See note 2) 974, ,691 2,243,067 2,074,448 Less: Accumulated depreciation and amortization (1,100,649) (800,389) $ 1,142,418 $ 1,274,059 In 2013 and 2012, depreciation and amortization expense totaled $300,260 and $236,647, respectively. 5. Pension Plan The Company has a trusteed, noncontributory defined benefit pension plan (the Plan ) covering employees hired prior to February 6, The Company s plan contributions were $700,000 and $600,000 for the years 2013 and 2012, respectively. 7
165 Northeast Power Coordinating Council, Inc. Notes to Financial Statements December 31, 2013 and 2012 The following tables provide information with respect to the defined benefit plan as of and for the years ended December 31, 2013 and 2012: Components of net periodic benefit cost Service cost $ 298,867 $ 276,757 Interest cost 477, ,524 Expected return on plan assets (599,893) (492,785) Amortization of prior service cost 20,532 20,532 Recognized actuarial loss 310, ,690 Net periodic benefit cost $ 506,557 $ 538,718 Change in benefit obligation Benefit obligation at beginning of year $ 11,279,973 $ 8,957,466 Service cost 298, ,757 Interest cost 477, ,524 Actuarial (gain) loss (1,660,662) 1,686,218 Benefits paid (101,992) (101,992) Benefit obligation at end of year 10,293,237 11,279,973 Change in fair value of plan assets Fair value of plan assets at beginning of year 7,603,820 6,300,716 Actual return on plan assets 956, ,096 Company contribution 700, ,000 Benefits paid (101,992) (101,992) Fair value of plan assets at end of year 9,158,120 7,603,820 Funded status at end of year $ (1,135,117) $ (3,676,153) Amounts recognized in unrestricted net assets consist of Loss $ (1,745,933) $ (4,072,994) Prior service cost (160,151) (180,683) $ (1,906,084) $ (4,253,677) Changes in unrestricted assets recognized in nonoperating expenses Net (gain) loss $ (2,017,061) $ 1,373,907 Amortization of prior service cost (20,532) (20,532) Amortization of net gain (loss) (310,000) (272,690) Amounts of unrestricted net assets expected to be recognized in net periodic benefit cost in 2014 Amortization of loss $ 200,000 $ (2,347,593) $ 1,080,685 8
166 Northeast Power Coordinating Council, Inc. Notes to Financial Statements December 31, 2013 and 2012 Weighted-average assumptions as of December 31 used for obligation Discount rate 5.00 % 4.25 % Expected return on plan assets 7.50 % 7.50 % Rate of compensation increase 3.00 % 3.00 % Weighted-average assumptions as of December 31 used for net periodic benefit cost Discount rate 5.00 % 4.25 % Expected return on plan assets 7.50 % 7.50 % Rate of compensation increase 3.00 % 3.00 % The accumulated benefit obligation at December 31, 2013 and 2012 was $9,371,706 and $8,487,636, respectively. The Company determines its expected return on plan assets assumption by evaluating both historical returns of major asset classes and current market factors. Current market factors include inflation and interest rates, as well as asset diversification. The Company s defined benefit plan weighted average asset allocation at December 31, 2013 and 2012 by asset category is as follows: Allocation Percentage Equity securities 70.6% 71.1% Debt securities 28.0% 28.2% Cash 1.4% 0.7% 100.0% 100.0% The Company s defined benefit plan invests primarily in equity and debt securities that are based upon levels of risk and provide for necessary liquidity requirements. The long-term objective is to limit the variability of its pension funding. The Company s plan assets are measured against benchmarks established by the Pension Committee, which has the authority to recommend changes as deemed appropriate. Investments in actively traded equity and debt securities are valued using market prices in active markets. Their valuations are obtained from real-time quotes for transactions in active exchange markets involving identical assets. There were no securities for which the fair value was based on other observable or unobservable inputs. At December 31, 2013, the plan assets consisted of $127,177 of cash and cash equivalents, $3,310,439 of domestic equities, $1,346,311 of international equities, $2,563,932 of corporate bonds, $1,126,052 of specific strategy funds, $263,378 of commodity funds and $420,831 of public real estate investment trust investments. At December 31, 2013, the Company s target allocation percentages for plan assets were approximately 46% equity securities, 29% debt securities and 25% other securities. The targets may be adjusted periodically to reflect current market conditions and trends as well as inflation levels, interest rates and trends thereof. 9
167 Northeast Power Coordinating Council, Inc. Notes to Financial Statements December 31, 2013 and 2012 Expected employer contribution for the year ended December 31, 2014 is $650,000. Benefits expected to be paid in cash in subsequent years ending December 31 are as follows: 2014 $ 110, , , , , ,274, Savings and Supplemental Plans The Company maintains a 401(k) plan for which all employees are immediately eligible upon hire. Within this plan, an employee can contribute 2% or greater of his or her compensation up to the IRS limit set for this plan. The Company s policy is to contribute on the employee s behalf 100% of the employee s contribution of the first 3% of his or her compensation, and 50% of his or her contribution for the next 2% of compensation. Additionally, for those employees joining the Company after February 6, 2007, and upon completion of a full calendar year of service, such employees become eligible for a discretionary contribution to be considered annually by the Board of Directors. The discretionary contribution for 2013 and 2012 was 8% of base compensation and totaled $189,215 for 2013 and $189,956 for Company contributions to the 401(k) plan were $185,546 and $174,392 for 2013 and 2012, respectively. During 2010, the Company adopted a supplemental plan for employees who were not eligible to receive the same percentage level of retirement benefits as other employees under the 401(k) plan due to IRS compensation limits. The Company contributed $26,500 and $23,000 to this supplemental plan for 2013 and 2012, respectively. During 2013, the Company adopted a 457(f) plan for the President and CEO to provide benefits not provided under the Pension Plan as a result of the IRS code limitations. The Company contributed $30,000 to this plan in Leases The Company is obligated under long-term operating leases for the rental of office facilities and certain equipment. NPCC executed office and equipment leases with effective rental dates starting in 2009 coordinated with its relocation of offices within New York City. NPCC s office lease provides for additional rent based on increases in real estate taxes and operating expenses over base amounts. The office lease expires on April 30, 2024 and includes an option to renew for five years. The office lease provides for security in the form of a collateralized letter of credit in the amount of $500,000 at lease inception and reduced to $300,000 at December 31, 2012, and reduced amounts in future years. NPCC executed various computer and equipment leases with expiration dates through March, In addition, the Company rents certain other equipment on a month-to-month basis. Rental expense for office facilities and equipment totaled $775,320 and $761,588 for 2013 and 2012, respectively. 10
168 Northeast Power Coordinating Council, Inc. Notes to Financial Statements December 31, 2013 and 2012 Future minimum rental payments required under the Company s long-term operating leases as of December 31, 2013 are as follows: Office Other Space Leases Total Year Ending December $ 652,380 $ 129,064 $ 781, ,392 88, , ,392 20, , , , , ,392 Thereafter 3,826,091 3,826,091 $ 7,168,039 $ 237,843 $ 7,405, Functional Expenses During 2013 and 2012 salaries and employee benefits consist of the following: President, COO and technical staff $ 5,510,411 $ 5,128,701 Administrative support 175, ,254 Payroll taxes, insurance, pension and educational assistance 2,680,048 2,425,028 Total salaries and employee benefits $ 8,365,952 $ 7,722, Other Expenses The Company incurs various costs for administrative, consultant and professional services. Such costs amounted to $2,970,235 and $2,472,132 in 2013 and 2012, respectively, and consist of the following: Consultants $ 1,734,733 $ 1,485,916 Accounting, legal and other services 1,197, ,903 Pension administration 38,389 21,313 Total administrative, consultant and professional fees $ 2,970,235 $ 2,472,132 These costs are reflected in Administrative and consultant fees and Professional fees in the Statements of Activities. 11
169 Northeast Power Coordinating Council, Inc. Notes to Financial Statements December 31, 2013 and Related Party Transactions The NERC, through agreements with the FERC in the U.S. and Canadian Provincial regulatory and/or governmental agreements within Canada, delegates enforcement authority to eight Regional Entities. NPCC is the cross-border Regional Entity for Northeastern North America. NERC was certified as the Electric Reliability Organization by the FERC on July 20, As of June 18, 2007, the U.S. FERC granted NERC the legal authority to enforce reliability standards with all U.S. users, owners, and operators of the bulk power system, and made compliance with those standards mandatory and enforceable. NERC relies on the diverse and collective expertise of industry participants to improve the reliability of the bulk power system. These entities account for virtually all the electricity supplied in the United States, Canada, and a portion of Baja California Norte, Mexico. NERC is subject to audit by the U.S. FERC and governmental and/or regulatory authorities in Canada. NERC funded the Regional Entities based upon Business Plans and Budgets submitted to and approved by FERC in the U.S. and Canadian Provincial regulatory and/or governmental authorities. NPCC s criteria services division was fully funded by regional independent system operator or balancing authorities acting as the Load Serving Entities designees and operated on assessments to and funded from these six entities. Dues were based upon a Net Energy for Load funding formula. During 2013 and 2012, total assessments billed amounted to $1,139,688 and $956,900, respectively Total Total Description Percent Share Percent Share Hydro-Quebec TransEnergie % $ 325, % $ 270,543 Independent Electricity System Operator % 250, % 211,520 ISO-New England, Inc % 235, % 196,362 New Brunswick System Operator 2.12 % 24, % 20,242 New York Independent System Operator % 283, % 240,034 Nova Scotia Power Inc % 20, % 18,199 Total assessments % $ 1,139, % $ 956, Line of Credit On March 18, 2013, pursuant to an agreement with a lender, the Company obtained a line of credit in the amount of $1,000,000. There were no borrowings against the line of credit as of December 31, Subsequent Events Management has evaluated, for potential recognition and disclosure, events subsequent to the date of the Statement of Financial Position through March 27, 2014, the date the financial statements were available to be issued. 12
170 ATTACHMENT ACTUAL COST-TO-BUDGET COMPARISON AND 2013 AUDITED FINANCIAL REPORT FOR RELIABILITYFIRST CORPORATION
 is providing NERC the end of year audited 2013 True-up Filing.")
171 3 Summit Park Drive, Suite 600 Cleveland, OH May 5, 2014 Mr. Michael Walker North American Electric Reliability Corporation 3353 Peachtree Road, N.E. Suite 600, North Tower Atlanta, Georgia Subject: ReliabilityFirst s 2013 True-up Filing Mr. Michael Walker: As requested, ReliabilityFirst Corporation (ReliabilityFirst) is providing NERC the end of year audited 2013 True-up Filing. Significant variances are explained below, while more detailed variances are provided in the attached Statement of Activities, Fixed Assets and Change in Working Capital document presented by program area. The explanations of variances are provided based on the following criteria: 1. Variances equal to or greater than +/- 10% of budget, and 2. Variances greater than $10,000, or 3. Variances that are considered significant. Summary For the year ending December 31, 2013, ReliabilityFirst was $119K (.68%) over budget. This year end variance included $551K of Leasehold Improvement capital expenditures that related to the 2014 office and data center relocation, which were not included in the 2013 budget. If these capital expenditures were not recorded in 2013, the year-end variance would have been $432K (2.48%) under budget. In addition to completing all statutory objectives, ReliabilityFirst completed these major accomplishments: Developed the audit section of the MKInsight Audit Management Software to organize, manage, and improve efficiency of our monitoring processes. ReliabilityFirst Staff presented entity training on our Risk-Harm determination tool during the Spring Reliability Workshop. The series included detail on how risk and harm is quantified, the concepts of estimating the likelihood and magnitude of harm occurring, and how to mitigate the risk to reduce the likelihood of the harm occurring. Delivered one full day of training to more than 200 representatives from Registered Entities on Reliability Assurance Initiative (RAI) which included the identification of key critical process areas that contribute to reliability and how a systems thinking approach can lead to building a robust set of management practices that can reduce the risk to reliability. Supported RAI by conducting a pilot appraisal of key management practice areas with a registered entity. To improve ReliabilityFirst s resource assessments, reviewed demand forecast method(s) and data, the weather normalization calculations, and the NERC demand bandwidth analysis used in our footprint. After reviewing this information, researched a method of including load forecast uncertainty (i.e., bandwidth) in future resource assessments. Forward Together ReliabilityFirst
172 Reviewed the September 8, 2011 Arizona-Southern California Outage report findings and recommendations and performed a gap analysis to determine what could be missing in existing standards, guidelines, processes, or audit procedures and assessment studies. A report was produced that included suggestions for improvement. Examined existing methods to determine reliability of systems and proposed a definition and a method to measure grid reliability for the bulk power system. Existing methods and data considered included misoperations analysis, TADs, GADs, CIP Influence, outages/100 miles/year, etc. A sample report was produced on an entity basis to show the effect of that entity s performance on the overall ReliabilityFirst footprint. Quantitatively assessed the effectiveness of two Reliability Standards in achieving the desired reliability outcome including whether, if appropriate to the standard, less than zero-tolerance compliance would achieve essentially the same reliability result as full compliance. The two Standards assessed were PRC-005 and VAR-002. Reports were produced that discussed the benefits and any detriments of the standards and any recommendations for any changes to the standard or other proposals for improvement. Provided guidance and education to registered entities to meet compliance obligations through a better understanding of the NERC Reliability Standards by conducting 12 assist visits. Entity issues ranging from compliance concerns associated with their reading of the FERC approved standards, to preparing for new standards, and providing additional guidance and education. ReliabilityFirst conducted several successful outreach efforts, including two workshops that were attended by 200 plus registered entities and a Monthly Open Compliance Call that was attended by, on average, 75 registered entities. Funding Investment Income: $127K (211%) under budget The variance in Investment Income is due to the unrealized change in value of the company s investment portfolio offset by the dividends that were received. Expenses Personnel Expenses o Salaries, Payroll Taxes, Employee Benefits and Savings & Retirement Costs: $651K (5%) under budget These personnel expenses were under budget due to the difficulties in hiring qualified personnel. Operating Expenses o o Rent & Utilities: $98K (21%) over budget Rent was over budget due to the early termination penalty for the prior office lease, offset by the board decision not to pursue an offsite disaster recovery site in Office Costs: $213K (31%) over budget Office Costs were over budget as a result of variances in Telephone and Internet. Telephone expenses were over budget due to the large capacity phone line that was procured in preparation to support an in house conferencing system. Internet expenses were over budget due to the continued use of the contracted high bandwidth data line. Fixed Assets Computer Hardware & Software: $37K (47%) under budget Computer Hardware & Software was under budget due to planned hardware purchases being delayed or reassessed in consideration of the planned 2014 office move. Furniture & Fixtures: $8K over budget The variance in Furniture & Fixtures was a result of the purchases of office furniture to accommodate new hires and appliances for the new office.
173 Leasehold Improvements: $551K over budget The variance in Leasehold Improvements was a result of the planned 2014 office and data center relocation. All of these expenditures have been reimbursed from our Tenant Improvement Allowance in Cash Reserves ReliabilityFirst s Operating Reserve of $1,000,000 was never utilized. Statutory Programs ReliabilityFirst performed only statutory activities in Cost Allocation ReliabilityFirst records all direct costs to the appropriate program areas. Costs related to the Administrative Services programs are allocated proportionately based on FTE count to the direct programs. Direct Programs include: o Standards o Compliance o Reliability Assessment o Training & Education o Situation Awareness Administrative Services Programs include: o General & Administrative o Legal & Regulatory Affairs o Information Technology o Human Resources o Finance & Accounting For more information, please contact me at or jill.lewton@rfirst.org. Sincerely, Jill S. Lewton Jill S. Lewton Controller
174 Statement of Activities, Fixed Assets and Change in Working Capital Summary 01/01/ /31/ Actual 2013 Budget 2013 Variance Funding ERO Funding ERO Assessments $ 14,165,848 $ 14,165,848 $ % Penalty Sanctions 2,979,800 2,979, % Total ERO Funding $ 17,145,648 $ 17,145,648 $ % Other Funding Membership Fees $ - $ - $ - Investment Income (66,853) 60,000 (126,853) % Miscellaneous Total Other Funding $ (66,853) $ 60,000 $ (126,853) % Total Funding $ 17,078,795 $ 17,205,648 $ (126,853) -0.74% Expenses Direct Expenses Personnel Expenses Salaries $ 10,007,431 $ 10,610,389 $ (602,958) -5.68% Payroll Taxes 611, ,720 (12,890) -2.06% Employee Benefits 1,306,001 1,318,673 (12,672) -0.96% Savings & Retirement 1,491,994 1,514,025 (22,031) -1.46% Total Personnel Expenses $ 13,417,256 $ 14,067,807 $ (650,551) -4.62% Meeting Expenses Meetings $ 173,392 $ 157,810 $ 15, % Travel 765, ,300 (7,415) -0.96% Conference Calls 38,097 43,092 (4,995) % Total Meeting Expenses $ 977,374 $ 974,202 $ 3, % Operating Expenses Consultants & Contracts $ 609,487 $ 650,140 $ (40,653) -6.25% Office Rent 560, ,645 98, % Office Costs 899, , , % Professional Services 451, ,160 (31,495) -6.52% Miscellaneous 30,702 25,021 5, % (Gain)/Loss on Disposal of Assets (255) - (255) Depreciation 428, ,772 (4,837) -1.12% Total Operating Expenses $ 2,980,084 $ 2,740,602 $ 239, % Total Direct Expenses $ 17,374,714 $ 17,782,611 $ (407,897) -2.29% Indirect Expenses $ - $ - $ (0) Other Non-Operating Expenses $ - $ - $ - Total Expenses $ 17,374,714 $ 17,782,611 $ (407,897) -2.29% Net Change in Assets $ (295,919) $ (576,963) $ 281, % Fixed Assets Depreciation $ (428,935) $ (433,772) $ 4, % Computer & Software CapEx 40,989 78,000 (37,011) % Furniture & Fixtures CapEx 8,082-8,082 Equipment CapEx Leasehold Improvements 550, ,734 Increase/(Decrease) Fixed Assets $ 170,870 $ (355,772) $ 526, % Allocation of Fixed Assets $ - $ - $ - Increase/(Decrease) Total Fixed Assets $ 170,870 $ (355,772) $ 526, % Total Budget $ 17,545,584 $ 17,426,839 $ 118, % Change in Working Capital $ (466,789) $ (221,191) $ (245,598) % FTEs All amounts are based on audited financials - All amounts are in whole dollars - All functions are Statutory May 5, 2014 Version 2
175 Statement of Activities, Fixed Assets and Change in Working Capital Standards 01/01/ /31/ Actual 2013 Budget 2013 Variance % Explanation of Variances Funding ERO Funding ERO Assessments $ 148,183 $ 148,183 $ - 0% Penalty Sanctions 26,047 26,047-0% Total ERO Funding $ 174,230 $ 174,230 $ - 0% Other Funding Membership Fees $ - $ - $ - Investment Income (1,284) 524 (1,808) -345% Miscellaneous Total Other Funding $ (1,284) $ 524 $ (1,808) -345% The variance in Investment Income was due to the unrealized change in value of the company's investment portfolio offset by the dividends that were received. Total Funding $ 172,946 $ 174,754 $ (1,808) Expenses Direct Expenses Personnel Expenses Salaries $ 85,293 $ 87,336 $ (2,043) -2% Payroll Taxes 7,190 4,744 2,446 52% Employee Benefits 10,677 10,970 (293) -3% Savings & Retirement 16,969 13,974 2,995 21% Total Personnel Expenses $ 120,129 $ 117,024 $ 3,105 3% Meeting Expenses Meetings $ - $ - $ - Travel 11,216 11,500 (284) -2% Conference Calls Total Meeting Expenses $ 11,216 $ 11,500 $ (284) -2% Operating Expenses Consultants & Contracts $ - $ - $ - Office Rent Office Costs 2,037 2,668 (631) -24% Professional Services Miscellaneous (Gain)/Loss on Disposal of Assets Depreciation Total Operating Expenses $ 2,158 $ 2,668 $ (510) -19% Total Direct Expenses $ 133,503 $ 131,192 $ 2,311 2% Indirect Expenses $ 108,605 $ 44,949 $ 63, % Indirect Expenses are expenses related to the Administrative Services programs that have been allocated proportionately based on FTE count to the direct programs. As a result, the increase is due to higher administrative expenditures being allocated. Other Non-Operating Expenses $ - $ - $ - Total Expenses $ 242,108 $ 176,141 $ 65,967 37% Net Change in Assets $ (69,162) $ (1,387) $ (67,775) 4886% Fixed Assets Depreciation $ - $ - $ - Computer & Software CapEx Furniture & Fixtures CapEx Equipment CapEx Leasehold Improvements Increase/(Decrease) Fixed Assets $ - $ - $ - Allocation of Fixed Assets $ 7,620 $ (1,387) $ 9, % Allocation of Fixed Assets are fixed asset costs related to the Administrative Services programs that have been allocated proportionately based on FTE count to the direct programs. As a result, the increase is due to higher fixed asset expenditures being allocated. Increase/(Decrease) Total Fixed Assets $ 7,620 $ (1,387) $ 9, % Total Budget $ 249,728 $ 174,754 $ 74,974 43% Change in Working Capital $ (76,782) $ - $ (76,782) FTEs % May 5, 2014 Version 2
176 Statement of Activities, Fixed Assets and Change in Working Capital Compliance 01/01/ /31/ Actual 2013 Budget 2013 Variance % Explanation of Variances Funding ERO Funding ERO Assessments $ 10,736,863 $ 10,736,863 $ - 0% Penalty Sanctions 2,240,059 2,240,059-0% Total ERO Funding $ 12,976,922 $ 12,976,922 $ - 0% Other Funding Membership Fees $ - $ - $ - Investment Income (49,800) 45,105 (94,905) -210% Miscellaneous Total Other Funding $ (49,800) $ 45,105 $ (94,905) -210% The variance in Investment Income was due to the unrealized change in value of the company's investment portfolio offset by the dividends that were received. Total Funding $ 12,927,122 $ 13,022,027 $ (94,905) Expenses Direct Expenses Personnel Expenses Salaries $ 5,456,087 $ 5,870,101 $ (414,014) -7% Payroll Taxes 355, ,369 (15,171) -4% Employee Benefits 751, ,359 (87,344) -10% Savings & Retirement 801, ,559 (65,668) -8% Total Personnel Expenses $ 7,364,191 $ 7,946,388 $ (582,197) -7% Personnel expenses were under budget due to the difficulties in hiring qualified personne Meeting Expenses Meetings $ 12,964 $ 8,210 $ 4,754 58% Travel 490, ,000 (17,402) -3% Conference Calls Total Meeting Expenses $ 503,562 $ 516,210 $ (12,648) -2% Operating Expenses Consultants & Contracts $ 409,642 $ 475,000 $ (65,358) -14% Office Rent Office Costs 273, ,989 (38,422) -12% Professional Services 15,000 15,000-0% Miscellaneous 1,260 1,405 (145) -10% (Gain)/Loss on Disposal of Assets Depreciation 225, ,421 19,097 9% Total Operating Expenses $ 924,987 $ 1,009,815 $ (84,828) -8% Contracts & Consultants expense was under budget as a result of the process improvements and efficiency gains that were achieved during the year. Office costs were under budget primarily due to a variance in Telephone. Telephone expense was under budget due to the number of employees receiving wireless devices (i.e. cell phone and air cards) being less than budgeted. Depreciation expense directly correlates to current and prior year fixed asset activities. As a result of the prior year fixed asset purchases being over budget, there was more depreciation expense recorded this year. Total Direct Expenses $ 8,792,740 $ 9,472,413 $ (679,673) -7% Indirect Expenses $ 4,212,979 $ 3,865,608 $ 347,371 9% Indirect Expenses are expenses related to the Administrative Services programs that have been allocated proportionately based on FTE count to the direct programs. As a result, the increase is due to higher administrative expenditures being allocated. Other Non-Operating Expenses $ - $ - $ - Total Expenses $ 13,005,719 $ 13,338,021 $ (332,302) -2% Net Change in Assets $ (78,597) $ (315,994) $ 237,397-75% Fixed Assets Depreciation $ (225,518) $ (206,421) $ (19,097) 9% Computer & Software CapEx - 9,600 (9,600) -100% Furniture & Fixtures CapEx Equipment CapEx Leasehold Improvements Increase/(Decrease) Fixed Assets $ (225,518) $ (196,821) $ (28,697) 15% Allocation of Fixed Assets $ 295,594 $ 183,045 $ 112,549 61% Depreciation expense directly correlates to current and prior year fixed asset activities. As a result of the prior year fixed asset purchases being over budget, there was more depreciation expense recorded this year. Computer & Software CapEx was under budget due to the need for further evaluation regarding the analytical software needs for the Reliability Assurance Initiatives. Allocation of Fixed Assets are fixed asset costs related to the Administrative Services programs that have been allocated proportionately based on FTE count to the direct programs. As a result, the increase is due to higher fixed asset expenditures being allocated. Increase/(Decrease) Total Fixed Assets $ 70,076 $ (13,776) $ 83, % Total Budget $ 13,075,795 $ 13,324,245 $ (248,450) -2% Change in Working Capital $ (148,673) $ (302,218) $ 153,545-51% FTEs % The 2013 actual FTE count includes 1.63 FTEs for the graduate program May 5, 2014 Version 2
177 Statement of Activities, Fixed Assets and Change in Working Capital Reliability Assessment 01/01/ /31/ Actual 2013 Budget 2013 Variance % Explanation of Variances Funding ERO Funding ERO Assessments $ 2,538,757 $ 2,538,757 $ - 0% Penalty Sanctions 520, ,944-0% Total ERO Funding $ 3,059,701 $ 3,059,701 $ - 0% Other Funding Membership Fees $ - $ - $ - Investment Income (11,019) 10,490 (21,509) -205% Miscellaneous Total Other Funding $ (11,019) $ 10,490 $ (21,509) -205% The variance in Investment Income was due to the unrealized change in value of the company's investment portfolio offset by the dividends that were received. Total Funding $ 3,048,682 $ 3,070,191 $ (21,509) Expenses Direct Expenses Personnel Expenses Salaries $ 1,308,756 $ 1,479,629 $ (170,873) -12% Payroll Taxes 79,803 86,964 (7,161) -8% Employee Benefits 119, ,494 (35,145) -23% Savings & Retirement 201, ,462 (16,556) -8% Total Personnel Expenses $ 1,709,814 $ 1,939,549 $ (229,735) -12% Personnel expenses were under budget due to the difficulties in hiring qualified personnel. Meeting Expenses Meetings $ 19,252 $ 15,000 $ 4,252 28% Travel 94, ,500 (12,257) -12% Travel expenses were under budget due to attending less meetings than originally budgeted. Conference Calls Total Meeting Expenses $ 113,495 $ 121,500 $ (8,005) -7% Operating Expenses Consultants & Contracts $ 79,557 $ 77,140 $ 2,417 3% Office Rent Office Costs 51,227 60,687 (9,460) -16% Professional Services Miscellaneous % (Gain)/Loss on Disposal of Assets Depreciation Total Operating Expenses $ 130,843 $ 137,877 $ (7,034) -5% Total Direct Expenses $ 1,954,152 $ 2,198,926 $ (244,774) -11% Indirect Expenses $ 932,195 $ 898,979 $ 33,216 4% Indirect Expenses are expenses related to the Administrative Services programs that have been allocated proportionately based on FTE count to the direct programs. As a result, the increase is due to higher administrative expenditures being allocated. Other Non-Operating Expenses $ - $ - $ - Total Expenses $ 2,886,347 $ 3,097,905 $ (211,558) -7% Net Change in Assets $ 162,335 $ (27,714) $ 190, % Fixed Assets Depreciation $ - $ - $ - Computer & Software CapEx Furniture & Fixtures CapEx Equipment CapEx Leasehold Improvements Increase/(Decrease) Fixed Assets $ - $ - $ - Allocation of Fixed Assets $ 65,405 $ (27,714) $ 93, % Allocation of Fixed Assets are fixed asset costs related to the Administrative Services programs that have been allocated proportionately based on FTE count to the direct programs. As a result, the increase is due to higher fixed asset expenditures being allocated. Increase/(Decrease) Total Fixed Assets $ 65,405 $ (27,714) $ 93, % Total Budget $ 2,951,752 $ 3,070,191 $ (118,439) -4% Change in Working Capital $ 96,929 $ - $ 96,929 FTEs % May 5, 2014 Version 2
178 Statement of Activities, Fixed Assets and Change in Working Capital Training & Education 01/01/ /31/ Actual 2013 Budget 2013 Variance % Explanation of Variances Funding ERO Funding ERO Assessments $ 754,962 $ 754,962 $ - 0% Penalty Sanctions 161, ,493-0% Total ERO Funding $ 916,455 $ 916,455 $ - 0% Other Funding Membership Fees $ - $ - $ - Investment Income (3,980) 3,252 (7,232) -222% Miscellaneous Total Other Funding $ (3,980) $ 3,252 $ (7,232) -222% The variance in Investment Income was due to the unrealized change in value of the company's investment portfolio offset by the dividends that were received. Total Funding $ 912,475 $ 919,707 $ (7,232) Expenses Direct Expenses Personnel Expenses Salaries $ 419,851 $ 411,250 $ 8,601 2% Payroll Taxes 28,288 27, % Employee Benefits 54,888 51,900 2,988 6% Savings & Retirement 63,056 64,991 (1,935) -3% Total Personnel Expenses $ 566,083 $ 555,614 $ 10,469 2% Meeting Expenses Meetings $ 74,751 $ 90,000 $ (15,249) -17% Meetings were under budget due to the decision to host two less workshops than originally budgeted. Travel 5,367 4,000 1,367 34% Conference Calls Total Meeting Expenses $ 80,118 $ 94,000 $ (13,882) -15% Operating Expenses Consultants & Contracts $ - $ - $ - Office Rent Office Costs Professional Services Miscellaneous (Gain)/Loss on Disposal of Assets Depreciation Total Operating Expenses $ - $ - $ - Total Direct Expenses $ 646,201 $ 649,614 $ (3,413) -1% Indirect Expenses $ 336,676 $ 278,683 $ 57,993 21% Indirect Expenses are expenses related to the Administrative Services programs that have been allocated proportionately based on FTE count to the direct programs. As a result, the increase is due to higher administrative expenditures being allocated. Other Non-Operating Expenses $ - $ - $ - Total Expenses $ 982,877 $ 928,297 $ 54,580 6% Net Change in Assets $ (70,402) $ (8,590) $ (61,812) 720% Fixed Assets Depreciation $ - $ - $ - Computer & Software CapEx Furniture & Fixtures CapEx Equipment CapEx Leasehold Improvements Increase/(Decrease) Fixed Assets $ - $ - $ - Allocation of Fixed Assets $ 23,622 $ (8,590) $ 32, % Allocation of Fixed Assets are fixed asset costs related to the Administrative Services programs that have been allocated proportionately based on FTE count to the direct programs. As a result, the increase is due to higher fixed asset expenditures being allocated. Increase/(Decrease) Total Fixed Assets $ 23,622 $ (8,590) $ 32, % Total Budget $ 1,006,499 $ 919,707 $ 86,792 9% Change in Working Capital $ (94,024) $ - $ (94,024) FTEs % May 5, 2014 Version 2
179 Statement of Activities, Fixed Assets and Change in Working Capital Situation Awareness 01/01/ /31/ Actual 2013 Budget 2013 Variance % Explanation of Variances Funding ERO Funding ERO Assessments $ 208,273 $ 208,273 $ - 0% Penalty Sanctions 31,257 31,257-0% Total ERO Funding $ 239,530 $ 239,530 $ - 0% Other Funding Membership Fees $ - $ - $ - Investment Income (770) 629 (1,399) -222% Miscellaneous Total Other Funding $ (770) $ 629 $ (1,399) -222% The variance in Investment Income was due to the unrealized change in value of the company's investment portfolio offset by the dividends that were received. Total Funding $ 238,760 $ 240,159 $ (1,399) Expenses Direct Expenses Personnel Expenses Salaries $ 122,270 $ 120,045 $ 2,225 2% Payroll Taxes 6,222 5, % Employee Benefits 5,141 7,251 (2,110) -29% Savings & Retirement 18,418 19,207 (789) -4% Total Personnel Expenses $ 152,051 $ 152,487 $ (436) 0% Meeting Expenses Meetings $ 9,638 $ 2,000 $ 7, % Travel 25,013 30,000 (4,987) -17% Conference Calls Total Meeting Expenses $ 34,651 $ 32,000 $ 2,651 8% Operating Expenses Consultants & Contracts $ - $ - $ - Office Rent Office Costs 4,491 2,496 1,995 80% Professional Services Miscellaneous (19) -2% (Gain)/Loss on Disposal of Assets Depreciation % Total Operating Expenses $ 5,797 $ 3,821 $ 1,976 52% Total Direct Expenses $ 192,499 $ 188,308 $ 4,191 2% Indirect Expenses $ 65,163 $ 53,939 $ 11,224 21% Indirect Expenses are expenses related to the Administrative Services programs that have been allocated proportionately based on FTE count to the direct programs. As a result, the increase is due to higher administrative expenditures being allocated. Other Non-Operating Expenses $ - $ - $ - Total Expenses $ 257,662 $ 242,247 $ 15,415 6% Net Change in Assets $ (18,902) $ (2,088) $ (16,814) 805% Fixed Assets Depreciation $ (425) $ (425) $ - 0% Computer & Software CapEx Furniture & Fixtures CapEx Equipment CapEx Leasehold Improvements Increase/(Decrease) Fixed Assets $ (425) $ (425) $ - 0% Allocation of Fixed Assets $ 4,572 $ (1,663) $ 6, % Allocation of Fixed Assets are fixed asset costs related to the Administrative Services programs that have been allocated proportionately based on FTE count to the direct programs. As a result, the increase is due to higher fixed asset expenditures being allocated. Increase/(Decrease) Total Fixed Assets $ 4,147 $ (2,088) $ 6, % Total Budget $ 261,809 $ 240,159 $ 21,650 9% Change in Working Capital $ (23,049) $ - $ (23,049) FTEs % May 5, 2014 Version 2
180 Statement of Activities, Fixed Assets and Change in Working Capital General & Adminstrative 01/01/ /31/ Actual 2013 Budget 2013 Variance % Explanation of Variances Funding ERO Funding ERO Assessments $ (221,190) $ (221,190) $ - 0% Penalty Sanctions Total ERO Funding $ (221,190) $ (221,190) $ - 0% Other Funding Membership Fees $ - $ - $ - Investment Income Miscellaneous Total Other Funding $ - $ - $ - Total Funding $ (221,190) $ (221,190) $ - Expenses Direct Expenses Personnel Expenses Salaries $ 1,209,523 $ 1,245,216 $ (35,693) -3% Payroll Taxes 41,727 40,166 1,561 4% Employee Benefits 67,553 68,109 (556) -1% Savings & Retirement 157, ,326 47,026 43% Total Personnel Expenses $ 1,476,155 $ 1,463,817 $ 12,338 1% Savings & Retirement costs were over budget due to the reallocation of compensation resulting from the implementation of a deferred compensation plan. Meeting Expenses Meetings $ 35,702 $ 25,800 $ 9,902 38% Travel 71,650 59,800 11,850 20% Travel was over budget as a result of the travel required by the office move project coordinator. Conference Calls Total Meeting Expenses $ 107,352 $ 85,600 $ 21,752 25% Operating Expenses Consultants & Contracts $ 32,750 $ 21,000 $ 11,750 56% Contracts & Consultants were over budget as a result of the leadership training being higher than budgeted, along with the five year regional assessment project that was not budgeted. Office Rent 560, , ,367 39% Office Rent was over budget due to the early termination penalty for the prior office lease. Office Costs 72,851 39,623 33,228 84% Office costs were over budget as a result of variances in Computer Service & Maintenance. Computer Service & Maintenance was over budget as a result of the annual fees associated with the online solutions used to manage board materials and company surveys. Professional Services 306, ,650 (8,989) -3% Miscellaneous 10,236 11,976 (1,740) -15% (Gain)/Loss on Disposal of Assets Depreciation 45,631 45, % Total Operating Expenses $ 1,028,141 $ 835,220 $ 192,921 23% Total Direct Expenses $ 2,611,648 $ 2,384,637 $ 227,011 10% Indirect Expenses $ (2,611,648) $ (2,384,637) $ (227,011) 10% Indirect Expenses are expenses related to the Administrative Services Programs that have been allocated proportionately based on FTE count to the direct programs. As a result, the increase is due to higher General & Administrative expenditures being allocated. Other Non-Operating Expenses $ - $ - $ - Total Expenses $ - $ - $ - Net Change in Assets $ (221,190) $ (221,190) $ - 0% Fixed Assets Depreciation $ (45,631) $ (45,326) $ (305) 1% Computer & Software CapEx Furniture & Fixtures CapEx 8,082-8,082 Equipment CapEx Leasehold Improvements 550, ,734 Increase/(Decrease) Fixed Assets $ 513,185 $ (45,326) $ 558, % The variance in Furniture & Fixtures was a result of the purchases of office furniture to accommodate new hires and appliances for the new office. The variance in Leasehold Improvements was a result of the planned 2014 office and data center relocation. All of these expenditures were reimbursed from our Tenant Improvement allowance. Allocation of Fixed Assets $ (513,185) $ 45,326 $ (558,511) -1232% Increase/(Decrease) Total Fixed Assets $ - $ - $ - Total Budget $ - $ - $ - Change in Working Capital $ (221,190) $ (221,190) $ - 0% Allocation of Fixed Assets are fixed asset costs related to the Administrative Services programs that have been allocated proportionately based on FTE count to the direct programs. As a result, the increase is due to higher General & Administrative fixed asset expenditures being allocated. FTEs % May 5, 2014 Version 2
181 Statement of Activities, Fixed Assets and Change in Working Capital Legal & Regulatory Affairs 01/01/ /31/ Actual 2013 Budget 2013 Variance % Explanation of Variances Funding ERO Funding ERO Assessments $ - $ - $ - Penalty Sanctions Total ERO Funding $ - $ - $ - Other Funding Membership Fees $ - $ - $ - Investment Income Miscellaneous Total Other Funding $ - $ - $ - Total Funding $ - $ - $ - Expenses Direct Expenses Personnel Expenses Salaries $ 374,928 $ 373,908 $ 1,020 0% Payroll Taxes 20,144 19, % Employee Benefits 29,042 18,245 10,797 59% Savings & Retirement 60,471 58,576 1,895 3% Total Personnel Expenses $ 484,585 $ 470,252 $ 14,333 3% Employee Benefits were over budget as a result of a variance in Medical Benefits. Medical Benefits were over budget due to an existing employee electing medical coverage that was not budgeted, along with an employee selecting a medical plan that was different than what was originally budgeted. Meeting Expenses Meetings $ 718 $ - $ 718 Travel 43,800 28,000 15,800 56% Travel expense was over budget due to more travel required of our general counsel than anticipated. Conference Calls Total Meeting Expenses $ 44,518 $ 28,000 $ 16,518 59% Operating Expenses Consultants & Contracts $ - $ - $ - Office Rent Office Costs 13,643 8,308 5,335 64% Professional Services 50,095 65,000 (14,905) -23% Miscellaneous 8-8 (Gain)/Loss on Disposal of Assets Depreciation Total Operating Expenses $ 63,746 $ 73,308 $ (9,562) -13% Professional Services expense was under budget as a result of a variance in Legal Fees. Legal Fees were under budget due to negotiating flat fees for certain services and performing more legal work in house. Total Direct Expenses $ 592,849 $ 571,560 $ 21,289 4% Indirect Expenses $ (592,849) $ (571,560) $ (21,289) 4% Indirect Expenses are expenses related to the Administrative Services Programs that have been allocated proportionately based on FTE count to the direct programs. As a result, the increase is due to higher Legal & Regulatory expenditures being allocated. Other Non-Operating Expenses $ - $ - $ - Total Expenses $ - $ - $ - Net Change in Assets $ - $ - $ - Fixed Assets Depreciation $ - $ - $ - Computer & Software CapEx Furniture & Fixtures CapEx Equipment CapEx Leasehold Improvements Increase/(Decrease) Fixed Assets $ - $ - $ - Allocation of Fixed Assets $ - $ - $ - Increase/(Decrease) Total Fixed Assets $ - $ - $ - Total Budget $ - $ - $ - Change in Working Capital $ - $ - $ - FTEs % May 5, 2014 Version 2
182 Statement of Activities, Fixed Assets and Change in Working Capital Information Technology 01/01/ /31/ Actual 2013 Budget 2013 Variance % Explanation of Variances Funding ERO Funding ERO Assessments $ - $ - $ - Penalty Sanctions Total ERO Funding $ - $ - $ - Other Funding Membership Fees $ - $ - $ - Investment Income Miscellaneous Total Other Funding $ - $ - $ - Total Funding $ - $ - $ - Expenses Direct Expenses Personnel Expenses Salaries $ 592,533 $ 618,029 $ (25,496) -4% Payroll Taxes 41,223 41,356 (133) 0% Employee Benefits 101,658 85,791 15,867 18% Savings & Retirement 87,574 97,312 (9,738) -10% Total Personnel Expenses $ 822,988 $ 842,488 $ (19,500) -2% Employee Benefits were over budget as a result of a variance in Individual Training. Individual Training was over budget due to vulnerability remediation training that was not budgeted for. Meeting Expenses Meetings $ 1,223 $ 600 $ % Travel 11,866 11, % Conference Calls 38,097 43,092 (4,995) -12% Total Meeting Expenses $ 51,186 $ 54,692 $ (3,506) -6% Operating Expenses Consultants & Contracts $ 9,031 $ 36,000 $ (26,969) -75% Consultants & Contracts were under budget due to the postponement of several projects Office Rent - 60,000 (60,000) -100% Rent was under budget as a result of the delay in securing an offsite disaster recovery site. Office Costs 468, , ,154 85% Professional Services Miscellaneous 1,639-1,639 (Gain)/Loss on Disposal of Assets (255) - (255) Depreciation 153, ,658 (24,239) -14% Total Operating Expenses $ 632,073 $ 526,743 $ 105,330 20% Office Costs were over budget as a result of variances in Telephone and Internet. Telephone expenses were over budget due to the large capacity phone line that was procured in preparation to support an in house conferencing system. Internet expenses were over budget due to the continued use of the contracted high bandwidth data line. The variance in Proceeds/Loss on Disposal of Assets was due to the gain on disposal of computer equipment that was returned. Depreciation expense directly correlates to current and prior year fixed asset activities. As a result of the current year fixed asset purchases being under budget, there was less depreciation expense recorded this year. Total Direct Expenses $ 1,506,247 $ 1,423,923 $ 82,324 6% Indirect Expenses $ (1,506,247) $ (1,423,923) $ (82,324) 6% Other Non-Operating Expenses $ - $ - $ - Total Expenses $ - $ - $ - Net Change in Assets $ - $ - $ - Fixed Assets Depreciation $ (153,419) $ (177,658) $ 24,239-14% Computer & Software CapEx 40,989 68,400 (27,411) -40% Furniture & Fixtures CapEx Equipment CapEx Leasehold Improvements Increase/(Decrease) Fixed Assets $ (112,430) $ (109,258) $ (3,172) 3% Depreciation expense directly correlates to current and prior year fixed asset activities. As a result of the current year fixed asset purchases being under budget, there was less depreciation expense recorded this year. Computer & Software CapEx is under budget due to the planned hardware purchases being delayed or reassessed in consideration of the planned 2014 office move. Allocation of Fixed Assets $ 112,430 $ 109,258 $ 3,172 3% Increase/(Decrease) Total Fixed Assets $ - $ - $ - Total Budget $ - $ - $ - Change in Working Capital $ - $ - $ - FTEs % May 5, 2014 Version 2
183 Statement of Activities, Fixed Assets and Change in Working Capital Human Resources 01/01/ /31/ Actual 2013 Budget 2013 Variance % Explanation of Variances Funding ERO Funding ERO Assessments $ - $ - $ - Penalty Sanctions Total ERO Funding $ - $ - $ - Other Funding Membership Fees $ - $ - $ - Investment Income Miscellaneous Total Other Funding $ - $ - $ - Total Funding $ - $ - $ - Expenses Direct Expenses Personnel Expenses Salaries $ 250,700 $ 202,709 $ 47,991 24% Payroll Taxes 18,791 15,076 3,715 25% Employee Benefits 134,902 49,487 85, % Savings & Retirement 60,524 31,626 28,898 91% Total Personnel Expenses $ 464,917 $ 298,898 $ 166,019 56% Salaries were over budget due to the reallocation of the Event Planner/Receptionist position from the General & Administrative Program to the Human Resources Program. Employee Benefits were over budget as a result of a variance in Company Training. Company Training was over budget due to the additional expenses incurred for the week of company training. Savings & Retirements expenses were over budget due to the reallocation of the Event Planner/Receptionist position from the General & Administrative Program to the Human Resources Program, along with the administrative costs relating to the management of the company's retirement plan that were not budgeted. Meeting Expenses Meetings $ 19,144 $ 16,200 $ 2,944 18% Travel 7,778 8,500 (722) -8% Conference Calls Total Meeting Expenses $ 26,922 $ 24,700 $ 2,222 9% Operating Expenses Consultants & Contracts $ 78,507 $ 31,000 $ 47, % Office Rent Office Costs 8,316 4,404 3,912 89% Professional Services 37,250 44,410 (7,160) -16% Miscellaneous 16,498 10,690 5,808 54% (Gain)/Loss on Disposal of Assets Depreciation % Total Operating Expenses $ 141,370 $ 91,303 $ 50,067 55% Consultants & Contracts were over budget due to recruitment search fees paid to assist with filling the vacant technical positions. Total Direct Expenses $ 633,209 $ 414,901 $ 218,308 53% Indirect Expenses $ (633,209) $ (414,901) $ (218,308) 53% Indirect Expenses are expenses related to the Administrative Services Programs that have been allocated proportionately based on FTE count to the direct programs. As a result, the increase is due to higher Human Resource expenditures being allocated. Other Non-Operating Expenses $ - $ - $ - Total Expenses $ - $ - $ - Net Change in Assets $ - $ - $ - Fixed Assets Depreciation $ (799) $ (799) $ - 0% Computer & Software CapEx Furniture & Fixtures CapEx Equipment CapEx Leasehold Improvements Increase/(Decrease) Fixed Assets $ (799) $ (799) $ - 0% Allocation of Fixed Assets $ 799 $ 799 $ - 0% Increase/(Decrease) Total Fixed Assets $ - $ - $ - Total Budget $ - $ - $ - Change in Working Capital $ - $ - $ - FTEs % May 5, 2014 Version 2
184 Statement of Activities, Fixed Assets and Change in Working Capital Finance & Accounting 01/01/ /31/ Actual 2013 Budget 2013 Variance % Explanation of Variances Funding ERO Funding ERO Assessments $ - $ - $ - Penalty Sanctions Total ERO Funding $ - $ - $ - Other Funding Membership Fees $ - $ - $ - Investment Income Miscellaneous Total Other Funding $ - $ - $ - Total Funding $ - $ - $ - Expenses Direct Expenses Personnel Expenses Salaries $ 187,490 $ 202,166 $ (14,676) -7% Payroll Taxes 13,244 13, % Employee Benefits 31,776 34,067 (2,291) -7% Savings & Retirement 23,833 31,992 (8,159) -26% Total Personnel Expenses $ 256,343 $ 281,290 $ (24,947) -9% Meeting Expenses Meetings $ - $ - $ - Travel 4,354 6,000 (1,646) -27% Conference Calls Total Meeting Expenses $ 4,354 $ 6,000 $ (1,646) -27% Operating Expenses Consultants & Contracts $ - $ 10,000 $ (10,000) -100% Office Rent Office Costs 5,167 3,604 1,563 43% Professional Services 42,659 43,100 (441) -1% Miscellaneous (Gain)/Loss on Disposal of Assets Depreciation 3,143 3,143-0% Total Operating Expenses $ 50,969 $ 59,847 $ (8,878) -15% Contracts & Consultants were under budget as a result of the postponement of the implementation of an automated expense management system. Total Direct Expenses $ 311,666 $ 347,137 $ (35,471) -10% Indirect Expenses $ (311,666) $ (347,137) $ 35,471-10% Indirect Expenses are expenses related to the Administrative Services Programs that have been allocated proportionately based on FTE count to the direct programs. As a result, the decrease is due to lower Finance & Accounting expenditures being allocated. Other Non-Operating Expenses $ - $ - $ - Total Expenses $ - $ - $ - Net Change in Assets $ - $ - $ - Fixed Assets Depreciation $ (3,143) $ (3,143) $ - 0% Computer & Software CapEx Furniture & Fixtures CapEx Equipment CapEx Leasehold Improvements Increase/(Decrease) Fixed Assets $ (3,143) $ (3,143) $ - 0% Allocation of Fixed Assets $ 3,143 $ 3,143 $ - 0% Increase/(Decrease) Total Fixed Assets $ - $ - $ - Total Budget $ - $ - $ - Change in Working Capital $ - $ - $ - FTEs % May 5, 2014 Version 2
185
186
187
188
189
190
191
192
193
194
195
196
197
198 ATTACHMENT ACTUAL COST-TO-BUDGET COMPARISON AND 2013 AUDITED FINANCIAL REPORT FOR SERC RELIABILITY CORPORATION
199 May 1, 2014 Mike Walker Chief Financial Officer North American Electric Reliability Corporation SERC 2013 Budget vs. Actual Variance Analysis Enclosed is SERC s response to your request for information on variances between the 2013 SERC budget and year-end financials. Overall, SERC over ran 2013 budgeted revenues by $93,264 and under spent its 2013 budgeted expenses of $16,094,659 by $551,358. The net impact was a $644,622 positive variance on SERC s cash position for the year. During 2013, SERC conducted 55 audits and spot checks including 16 on-site and 9 off-site operations and planning audits, 4 operations and planning audits of multi-regional Registered Entities, and 9 on-site and 21 off-site CIP audits. SERC adjusted the planned audits and spot checks pursuant to supplemental guidance provided by NERC and FERC. SERC identified 363 new potential violations and closed 323 enforcement actions addressing possible violations identified during the period from 2008 through In addition, SERC completed all budgeted reliability assessments for the year. There are several mitigating circumstances, as explained below: During 2013, total personnel costs were lower than budget due to several factors. SERC was not fully staffed during 2013 by 7.56 FTEs. Additionally, when preparing the budget, SERC budgeted retirement costs based on historical data. The actual employee contribution for 2013 was lower than budgeted, causing the corresponding company match to be lower than budgeted. Due to the strains on the economy, SERC has emphasized the use of conference calls and Webex capabilities to reduce the number of face to face meetings, which reduced travel and meeting costs. Additionally, SERC continues to work with the same hotels, which provides cost savings on larger meetings, and SERC is now hosting more meetings in the Charlotte office at a significantly reduced cost. SERC used contractors to support audit and enforcement activities; engaged a management consulting firm to support SERC's corporate initiative for management training; and a project manager and architecture firm to assist with the design, construction, and coordination of the relocation of SERC s offices in 2014, causing an unplanned overrun in Consultants and Contractors.
200 2 In a coordinated effort with the other regional entities on the preparation of the Five Year Assessment, SERC managed the contract with the consultant, subject to reimbursement from the other regional entities. The offsetting revenue is recorded in Miscellaneous income. SERC purchased office furniture and equipment to furnish the new office space, causing the over run in Office Costs. SERC has no non-statutory activity, and therefore no statutory funding was used for nonstatutory activities. All personnel costs for the other administrative functions, including Information Technology, Legal, Finance, and Human Resources, are recorded within General and Administrative to protect the confidentiality of individual compensation information of employees in these programs. SERC allocates indirect or administrative expenses and capital expenditures to the statutory programs based upon the ratio of FTEs in those program areas to total statutory program FTEs. The variances associated with this allocation are the result of the differences in the actual versus budgeted ratio of FTEs and the actual versus budgeted spend in the administrative cost centers. SERC performs the Compliance Enforcement Activities for FRCC and SPP. The regional entity reimburses SERC for the actual costs incurred, including an overhead calculation. These costs have been recorded separately on the Compliance Enforcement Activity Statement of Activities. Detailed descriptions of budget to actual variances are provided in the attached file. If you have any questions, please feel free to call or me. Yours truly, Jennifer Kelly cc: R. Scott Henry
201 SERC Reliability Corporation Statement of Activities From 1/1/2013 through 12/31/2013 Total Statutory 2013 Actual 2013 Budget 2013 Variance from Budget Over(Under) Funding ERO Funding Assessments 13,829,878 13,829,878 - Penalty Sanctions 51,000 51,000 - Total ERO Funding $ 13,880,878 $ 13,880,878 $ - Federal Grants Membership Fees Testing Services & Software Workshop Fees 173, ,000 (72,003) Interest 1,271 10,000 (8,729) Miscellaneous 238,996 65, ,996 Total Funding (A) $ 14,295,142 $ 14,201,878 $ 93,264 Expenses Personnel Expenses Salaries 9,176,085 9,925,148 (749,063) Payroll Taxes 632, ,509 37,404 Employee Benefits 896, ,101 (19,311) Savings & Retirement 1,169,319 1,353,523 (184,204) Total Personnel Expenses 11,875,107 12,790,281 (915,174) Meeting Expenses Meetings 276, ,160 (32,321) Travel 646, ,023 51,375 Conference Calls 49,760 60,000 (10,240) Total Meeting Expenses 972, ,183 8,814 Operating Expenses Consultants & Contracts 1,410,698 1,166, ,751 Rent & Improvements 403, ,407 (1,676) Office Costs 633, , ,216 Professional Services 107, ,900 1,805 Miscellaneous 2,148-2,148 Depreciation 137, ,389 (163,242) Total Operating Expenses 2,695,197 2,340, ,002 Indirect Expenses Other Non-Operating Expenses Total Expenses (B) 15,543,301 16,094,659 (551,358) Change in Assets (A - B) (1,248,159) (1,892,781) 644,622 Fixed Assets Depreciation (137,147) (300,389) 163,242 Computer & Software CapEx 474, , ,480 Furniture & Fixtures CapEx Equipment CapEx Leasehold Improvements Incr(Dec) in Fixed Assets (337,666) 187,056 (524,722) Allocation of Fixed Assets Total Inc(Dec) in Fixed Assets (C) (337,666) 187,056 (524,722) TOTAL BUDGET (B - C) 15,880,967 15,907,603 (26,636) Change in Working Capital (A-B+C) (1,585,825) (1,705,725) 119,900 FTE's (7.56)
202 SERC Reliability Corporation Statement of Activities From 1/1/2013 through 12/31/2013 Per Audit RELIABILITY STANDARDS 2013 Actual 2013 Budget Funding ERO Funding Assessments 698, , % Penalty Sanctions 2,358 2, % Total ERO Funding $ 701,238 $ 701,238 $ % Federal Grants Membership Fees Testing Services & Software Workshop Fees Interest Miscellaneous Total Funding (A) 701, , % 2013 Variance from Budget Over(Under) Comments (Explain variances > +/- 10% and $10,000) Expenses Personnel Expenses Salaries 226, ,825 (111,591) % SERC budgeted 2.66 FTE's in the Standards program during SERC finished 2013 with 1.72 FTEs, a difference of 0.94 FTEs, causing SERC to be under budget. Payroll Taxes 17,470 20,270 (2,800) % Employee Benefits 26,540 34,294 (7,754) % Savings & Retirement 13,925 46,701 (32,776) % SERC budgeted based on historical employee contributions. The actual employee contribution for 2013 was lower than budgeted, causing the corresponding company match to be lower than budgeted. Additionally, as noted above in Salaries Expense, SERC was not fully staffed. Due to this, SERC incurred less expense. Total Personnel Expenses 284, ,090 (154,921) % Meeting Expenses Meetings Travel 5,804 9,101 (3,297) % SERC continues to emphasize the use of technology by hosting meetings using WebEx. By doing this, travel costs have decreased. Conference Calls Total Meeting Expenses 6,106 9,101 (2,995) % Operating Expenses Consultants & Contracts Rent & Improvements Office Costs % Professional Services Miscellaneous Depreciation Total Operating Expenses % Indirect Expenses 300, ,342 38, % Expenses related to indirect programs have been allocated proportionately to the direct programs for 2013 based on the number of FTEs in those programs Other Non-Operating Expenses Total Expenses (B) 591, ,888 (118,758) % Change in Assets (A - B) 110,195 (8,650) 118, % Fixed Assets Depreciation Computer & Software CapEx Furniture & Fixtures CapEx Equipment CapEx Leasehold Improvements Incr(Dec) in Fixed Assets Allocation of Fixed Assets (17,273) 8,650 (25,923) % Total Inc(Dec) in Fixed Assets (C) (17,273) 8,650 (25,923) % TOTAL BUDGET (B - C) 608, ,238 (92,835) % Change in Working Capital (A-B+C) 92,922-92,922 FTE's (0.94) %
203 SERC Reliability Corporation Statement of Activities From 1/1/2013 through 12/31/2013 Per Audit COMPLIANCE OPERATIONS, ENFORCEMENT and ORGANIZATION REGISTRATION 2013 Actual 2013 Budget Funding ERO Funding Assessments 11,150,647 11,150, % Penalty Sanctions 36,796 36, % Total ERO Funding $ 11,187,443 $ 11,187,443 $ % Federal Grants Membership Fees Testing Services & Software Workshop Fees Interest Miscellaneous 1,467-1,467 Total Funding (A) 11,188,910 11,187,443 1, % 2013 Variance from Budget Over(Under) Comments (Explain variances > +/- 10% and $10,000) Expenses Personnel Expenses Salaries 4,422,701 5,080,600 (657,899) % SERC budgeted 41.5 FTE's in the Compliance program during SERC finished 2013 with FTEs, a difference of 4.36 FTEs, causing SERC to be under budget. SERC used contractors to assist in completing the work. Payroll Taxes 331, ,536 23, % Employee Benefits 470, ,979 (13,323) -2.75% Savings & Retirement 636, ,345 (69,109) -9.80% SERC budgeted based on historical employee contributions. The actual employee contribution for 2013 was lower than budgeted, causing the corresponding company match to be lower than budgeted. Total Personnel Expenses 5,860,709 6,577,460 (716,751) % Meeting Expenses Meetings 26,743 17,910 8, % Travel 380, ,966 2, % Conference Calls Total Meeting Expenses 407, ,876 11, % Operating Expenses Consultants & Contracts 474, , , % SERC is over budget in Consultants & Contracts due to the use of contractors to support audit and enforcement activities. Additionally, SERC developed tools to allow for handling of protected entity information and an audit checklist tool, causing an unplanned overrun. Rent & Improvements Office Costs 16,050 12,578 3, % Professional Services 8,513 15,000 (6,487) % Miscellaneous Depreciation Total Operating Expenses 499, , , % Indirect Expenses 4,174,852 4,072, , % Expenses related to indirect programs have been allocated proportionately to the direct programs for 2013 based on the number of FTEs in those programs Other Non-Operating Expenses Total Expenses (B) 10,941,910 11,322,402 (380,492) -3.36% Change in Assets (A - B) 247,000 (134,959) 381, % Fixed Assets Depreciation Computer & Software CapEx Furniture & Fixtures CapEx Equipment CapEx Leasehold Improvements Incr(Dec) in Fixed Assets Allocation of Fixed Assets (241,171) 134,959 (376,130) % Total Inc(Dec) in Fixed Assets (C) (241,171) 134,959 (376,130) % TOTAL BUDGET (B - C) 11,183,081 11,187,443 (4,362) -0.04% Change in Working Capital (A-B+C) 5,829-5,829 FTE's (4.36) %
204 SERC Reliability Corporation Statement of Activities From 1/1/2013 through 12/31/2013 Per Audit COMPLIANCE ENFORCEMENT ACTIVITY Funding 2013 Actual 2013 Budget ERO Funding Assessments Penalty Sanctions Total ERO Funding $ - $ - $ Variance from Budget Over(Under) Comments (Explain variances > +/- 10% and $10,000) Federal Grants Membership Fees Testing Services & Software Workshop Fees Interest Miscellaneous 175,852 65, , % The income recorded in Miscellaneous relates to the cross regional monitoring activities for FRCC and SPP. The regional entity audited reimburses SERC for actual costs incurred. The 2013 Budget includes $15,000 related to enforcement activities for FRCC and $50,000 related to auditing and enforcement activities for SPP. During 2013, SERC continued to execute its contracted duties and participated on an unbudgeted audit, in accordance with a coordination agreement with FRCC RE. Total Funding (A) 175,852 65, , % Expenses Personnel Expenses Salaries 134,025 45,000 89, % Amount represents the total personnel expenses related to the cross regional monitoring activities for FRCC and SPP. During 2013, SERC continued to execute its contracted duties and participated on an unbudgeted audit, in accordance with a coordination agreement with FRCC RE. Payroll Taxes Employee Benefits Savings & Retirement Total Personnel Expenses 134,025 45,000 89, % Meeting Expenses Meetings Travel 27,173 15,000 12, % Amount represents the travel expenses related to the cross regional monitoring activities for FRCC. During 2013, SERC continued to execute its contracted duties and participated on an unbudgeted audit, in accordance with a coordination agreement with FRCC RE, causing an over run. Conference Calls Total Meeting Expenses 27,173 15,000 12, % Operating Expenses Consultants & Contracts Rent & Improvements Office Costs Professional Services Miscellaneous Depreciation Total Operating Expenses Indirect Expenses 14,654 5,000 9, % Other Non-Operating Expenses Total Expenses (B) 175,852 65, , % Change in Assets (A - B) Fixed Assets Depreciation Computer & Software CapEx Furniture & Fixtures CapEx Equipment CapEx Leasehold Improvements Incr(Dec) in Fixed Assets Allocation of Fixed Assets Total Inc(Dec) in Fixed Assets (C) TOTAL BUDGET (B - C) 175,852 65, , % Change in Working Capital (A-B+C) FTE's - - -
205 RELIABILITY ASSESSMENTS and PERFORMANCE ANALYSIS 2013 Actual 2013 Budget SERC Reliability Corporation Statement of Activities From 1/1/2013 through 12/31/2013 Per Audit Funding ERO Funding Assessments 1,937,756 1,937, % Penalty Sanctions 6,384 6, % Total ERO Funding $ 1,944,140 $ 1,944,140 $ % Federal Grants Membership Fees Testing Services & Software Workshop Fees Interest Miscellaneous Total Funding (A) 1,944,140 1,944, % 2013 Variance from Budget Over(Under) Comments (Explain variances > +/- 10% and $10,000) Expenses Personnel Expenses Salaries 723, ,697 (19,946) -2.68% SERC budgeted 7.20 FTE's in the RAPA program during SERC finished 2013 with 6.69 FTEs, a difference of 0.51 FTEs, causing SERC to be under budget. This was offset by the positions within RAPA were filled at a higher than budgeted salary. Payroll Taxes 56,925 44,622 12, % Payroll Tax expense was higher than budgeted due to filling positions in RAPA at higher than budgeted salaries. Employee Benefits 93,610 99,594 (5,984) -6.01% Savings & Retirement 93, ,868 (10,441) % SERC budgeted based on historical employee contributions. The actual employee contribution for 2013 was lower than budgeted, causing the corresponding company match to be lower than budgeted. Total Personnel Expenses 967, ,781 (24,068) -2.43% Meeting Expenses Meetings 28,428 32,285 (3,857) % A greater emphasis on the use of technology by hosting WebEx meetings, as well as utilizing member facilities, has lowered meeting costs. Travel 69,856 30,667 39, % In an effort to train and develop new staff, SERC sent additional employees to meetings, causing an overrun. Conference Calls Total Meeting Expenses 98,284 62,952 35, % Operating Expenses Consultants & Contracts 194, ,000 (8,135) -4.01% Rent & Improvements Office Costs 4,648 2,431 2, % Professional Services Miscellaneous Depreciation Total Operating Expenses 199, ,431 (5,918) -2.88% Indirect Expenses 754, ,391 47, % Expenses related to indirect programs have been allocated proportionately to the direct programs for 2013 based on the number of FTEs in those programs Other Non-Operating Expenses Total Expenses (B) 2,020,163 1,967,555 52, % Change in Assets (A - B) (76,023) (23,415) (52,608) % Fixed Assets Depreciation Computer & Software CapEx Furniture & Fixtures CapEx Equipment CapEx Leasehold Improvements Incr(Dec) in Fixed Assets Allocation of Fixed Assets (43,442) 23,415 (66,857) % Total Inc(Dec) in Fixed Assets (C) (43,442) 23,415 (66,857) % TOTAL BUDGET (B - C) 2,063,605 1,944, , % Change in Working Capital (A-B+C) (119,465) - (119,465) FTE's (0.51) -7.08%
206 SERC Reliability Corporation Statement of Activities From 1/1/2013 through 12/31/2013 Per Audit TRAINING, EDUCATION and OPERATOR CERTIFICATION 2013 Actual 2013 Budget Funding ERO Funding Assessments 701, , % Penalty Sanctions 2,137 2, % Total ERO Funding $ 703,537 $ 703,537 $ % 2013 Variance from Budget Over(Under) Comments (Explain variances > +/- 10% and $10,000) Federal Grants Membership Fees Testing Services & Software Workshop Fees 173, ,000 (72,003) % In 2013, SERC began holding most meetings in house, resulting in a savings in costs, and therefore an offsetting decrease in revenue allowing SERC to charge a reduced attendance fee, from when the budget was developed Interest Miscellaneous Total Funding (A) 877, ,537 (71,916) -7.57% Expenses Personnel Expenses Salaries 300, ,005 (33,276) -9.96% SERC budgeted 7.20 FTE's in the Standards program during SERC finished 2013 with 6.69 FTEs, a difference of 0.51 FTEs, causing SERC to be under budget. Payroll Taxes 20,837 20, % Employee Benefits 27,231 26, % Savings & Retirement 35,589 41,864 (6,275) % SERC budgeted based on historical employee contributions. The actual employee contribution for 2013 was lower than budgeted, causing the corresponding company match to be lower than budgeted. Total Personnel Expenses 384, ,521 (38,135) -9.03% Meeting Expenses Meetings 142, ,975 (50,932) % SERC continues to work with the same hotels, which provides cost savings on larger meetings. Additionally, as noted in the workshop fee revenue, SERC is now hosting more meetings in the Charlotte office at a significantly reduced cost. Finally, a greater emphasis on the use of technology by hosting WebEx meetings has lowered meeting costs. Travel 13,986 22,781 (8,795) % SERC continues to emphasize the use of technology by hosting meetings using WebEx. Additionally, SERC is now hosting more meetings in the Charlotte office, which does not require staff to travel. By doing this, travel costs have decreased. Conference Calls Total Meeting Expenses 156, ,756 (59,727) % Operating Expenses Consultants & Contracts 90,077 82,000 8, % Rent & Improvements Office Costs 4, , % Professional Services Miscellaneous Depreciation Total Operating Expenses 95,048 82,318 12, % Indirect Expenses 269, ,779 32, % Expenses related to indirect programs have been allocated proportionately to the direct programs for 2013 based on the number of FTEs in those programs Other Non-Operating Expenses Total Expenses (B) 905, ,374 (52,312) -5.46% Change in Assets (A - B) (27,441) (7,837) (19,604) % Fixed Assets Depreciation Computer & Software CapEx Furniture & Fixtures CapEx Equipment CapEx Leasehold Improvements Incr(Dec) in Fixed Assets Allocation of Fixed Assets (15,520) 7,837 (23,357) % Total Inc(Dec) in Fixed Assets (C) (15,520) 7,837 (23,357) % TOTAL BUDGET (B - C) 920, ,537 (28,955) -3.05% Change in Working Capital (A-B+C) (42,961) - (42,961) FTE's (0.02) -0.83%
207 SITUATION AWARENESS and INFRASTRUCTURE SECURITY (Includes Critical Infrastructure 2013 Actual 2013 Budget SERC Reliability Corporation Statement of Activities From 1/1/2013 through 12/31/2013 Per Audit Protection) Funding ERO Funding Assessments 1,046,920 1,046, % Penalty Sanctions 3,325 3, % Total ERO Funding $ 1,050,245 $ 1,050,245 $ % Federal Grants Membership Fees Testing Services & Software Workshop Fees Interest Miscellaneous Total Funding (A) 1,050,332 1,050, % 2013 Variance from Budget Over(Under) Comments (Explain variances > +/- 10% and $10,000) Expenses Personnel Expenses Salaries 380, ,945 (120,083) % SERC budgeted 3.75 FTE's in the Situation Awareness program during SERC finished 2013 with 3.12 FTEs, a difference of 0.63 FTEs, causing SERC to be under budget. Payroll Taxes 20,980 30,057 (9,077) % As noted above in Salaries Expense, decrease in payroll taxes is due to not being fully staffed. Employee Benefits 32,467 45,882 (13,415) % As noted above in Salaries Expense, there was less participation in benefits due to not being fully staffed. Savings & Retirement 61,989 57,116 4, % Total Personnel Expenses 496, ,000 (137,702) % Meeting Expenses Meetings 3,225 16,575 (13,350) % A greater emphasis on the use of technology by hosting WebEx meetings has lowered meeting costs. Additionally, SERC is now hosting more meetings in the Charlotte office at a significantly reduced cost, further reducing expenses, causing the under run. Travel 55,399 43,172 12, % In an effort to train and develop new staff, SERC sent additional employees to meetings, causing an overrun. Conference Calls Total Meeting Expenses - 58,624-59,747 - (1,123) -1.88% Operating Expenses Consultants & Contracts - - Rent & Improvements Office Costs 2, , % Professional Services Miscellaneous Depreciation Total Operating Expenses 2, , % Indirect Expenses 351, ,433 (16,487) -4.47% Expenses related to indirect programs have been allocated proportionately to the direct programs for 2013 based on the number of FTEs in those programs Other Non-Operating Expenses Total Expenses (B) 909,184 1,062,440 (153,256) % Change in Assets (A - B) 141,148 (12,195) 153, % Fixed Assets Depreciation Computer & Software CapEx Furniture & Fixtures CapEx Equipment CapEx Leasehold Improvements Incr(Dec) in Fixed Assets Allocation of Fixed Assets (20,260) 12,195 (32,455) % Total Inc(Dec) in Fixed Assets (C) (20,260) 12,195 (32,455) % TOTAL BUDGET (B - C) 929,444 1,050,245 (120,801) % Change in Working Capital (A-B+C) 120, ,888 FTE's (0.63) %
208 MEMBER FORUMS 2013 Actual 2013 Budget Funding ERO Funding Assessments Penalty Sanctions Total ERO Funding $ - $ - $ - Federal Grants Membership Fees Testing Services & Software Workshop Fees Interest Miscellaneous Total Funding (A) SERC Reliability Corporation Statement of Activities From 1/1/2013 through 12/31/2013 Per Audit 2013 Variance from Budget Over(Under) Comments (Explain variances > +/- 10% and $10,000) Expenses Personnel Expenses Salaries 639, ,690 (111,707) % SERC budgeted 7.20 FTE's in the Committees and Members Forum program during SERC finished 2013 with 6.69 FTEs, a difference of 0.51 FTEs, causing SERC to be under budget. Payroll Taxes 46,782 45,101 1, % Employee Benefits 57,156 61,616 (4,460) -7.24% Savings & Retirement 65,562 99,754 (34,192) % SERC budgeted based on historical employee contributions. The actual employee contribution for 2013 was lower than budgeted, causing the corresponding company match to be lower than budgeted. Total Personnel Expenses 809, ,161 (148,678) % Meeting Expenses Meetings 11,598 26,125 (14,527) % A greater emphasis on the use of technology by hosting WebEx meetings has lowered meeting costs. Travel 28,345 34,849 (6,504) % SERC continues to emphasize the use of technology by hosting meetings using WebEx. Additionally, SERC is now hosting more meetings in the Charlotte office, which does not require staff to travel. By doing this, travel costs have decreased. Conference Calls Total Meeting Expenses 39,943 60,974 (21,031) % Operating Expenses Consultants & Contracts 2,756-2,756 Rent & Improvements Office Costs 1,477 1,505 (28) -1.86% Professional Services Miscellaneous Depreciation Total Operating Expenses 4,343 1,505 2, % Indirect Expenses (853,769) (1,020,640) 166, % Expenses related to indirect programs have been allocated proportionately to the direct programs for 2013 based on the number of FTEs in those programs Other Non-Operating Expenses Total Expenses (B) Change in Assets (A - B) Fixed Assets Depreciation Computer & Software CapEx Furniture & Fixtures CapEx Equipment CapEx Leasehold Improvements Incr(Dec) in Fixed Assets Allocation of Fixed Assets Total Inc(Dec) in Fixed Assets (C) TOTAL BUDGET (B - C) Change in Working Capital (A-B+C) FTE's (0.54) %
209 SERC Reliability Corporation Statement of Activities From 1/1/2013 through 12/31/2013 Per Audit GENERAL and ADMINISTRATIVE 2013 Actual 2013 Budget Funding ERO Funding Assessments (1,705,725) (1,705,725) % Penalty Sanctions Total ERO Funding $ (1,705,725) $ (1,705,725) $ % 2013 Variance from Budget Over(Under) Comments (Explain variances > +/- 10% and $10,000) Federal Grants Membership Fees Testing Services & Software Workshop Fees Interest Miscellaneous 61,329-61,329 SERC is working in a coordinated effort with the other regional entities on the preparation of the Regional Five Year Assessment. SERC is managing the contract with the consultant, subject to reimbursement from the other regional entities. This reimbursement is included in Miscellaneous Income, as an offset to the expense recorded in Contracts and Consultants. Total Funding (A) (1,644,396) (1,705,725) 61, % Expenses Personnel Expenses Salaries 2,347,800 2,131, , % While SERC is under budget by.56 FTEs in General & Administrative, the positions within G&A were filled at a higher than budgeted salary, causing an over run. Payroll Taxes 138, ,883 10, % Employee Benefits 189, ,124 25, % There was higher usage of SERC's medical benefits in 2013, causing an over run. Savings & Retirement 262, ,875 (36,284) % SERC budgeted based on historical employee contributions. The actual employee contribution for 2013 was lower than budgeted, causing the corresponding company match to be lower than budgeted. Total Personnel Expenses 2,938,324 2,722, , % Meeting Expenses Meetings 64,500 23,290 41, % The over run in meetings expenses is due to actual meeting spaces charged more than anticipated in the budget, as well as additional in-house meetings. Travel 65,429 61,487 3, % Conference Calls 49,760 60,000 (10,240) % SERC renegotiated lower rates for the telecommunications component of SERC s web based conferencing platform, causing the under run. Total Meeting Expenses 179, ,777 34, % Operating Expenses Consultants & Contracts 211, ,984 SERC engaged a management consulting firm to support SERC's corporate initiative for management training; a project manager and architecture firm to assist with the design, construction, and coordination of the relocation of SERC s offices in Both were unbudgeted, but deemed necessary. Additionally, in a coordinated effort with the other regional entities on the preparation of the Five Year Assessment, SERC managed the contract with the consultant, subject to reimbursement from the other regional entities. This was an unbudgeted project, causing an overrun. The offsetting revenue is recorded in Miscellaneous income, as noted above. Rent & Improvements (1 676) -0 41% Office Costs 481, , , % The over run in office costs includes one time costs for the purchase of office furniture and equipment to furnish the new office space. Individually, all items were below SERC s capitalization policy and were therefore expensed. Professional Services 37,366 20,000 17, % The variance is comprised of various unbudgeted items, including a property tax bill, and an increase in our general liability insurances. Miscellaneous 1,038-1,038 Depreciation 137, ,389 (163,242) % Due to the actual cost of the assets and the timing of when the assets were placed into service, depreciation expense and capital expenditures were lower than the budget, causing the under run. Total Operating Expenses 1,272, , , % Indirect Expenses (4,391,004) (3,781,902) (609,102) 16.11% Expenses related to indirect programs have been allocated proportionately to the direct programs for 2013 based on the number of FTEs in those programs Other Non-Operating Expenses Total Expenses (B) Change in Assets (A - B) (1,644,396) (1,705,725) 61, % Fixed Assets Depreciation (137,147) (300,389) 163, % Due to the actual cost of the assets and the timing of when the assets were placed into service, depreciation expense was lower than the budget, causing the under run. Computer & Software CapEx 474, , , % Due to delays in 2012, several 2012 software projects were completed and capitalized throughout 2013, causing an over run. Furniture & Fixtures CapEx Equipment CapEx - - Leasehold Improvements Incr(Dec) in Fixed Assets (337,666) 187,056 (524,722) Allocation of Fixed Assets 337,666 (187,056) 524, % Total Inc(Dec) in Fixed Assets (C) TOTAL BUDGET (B - C) Change in Working Capital (A-B+C) (1,644,396) (1,705,725) 61, % FTE's (0.56) -3.73%
210 SERC Reliability Corporation Statement of Activities From 1/1/2013 through 12/31/2013 Per Audit LEGAL and REGULATORY 2013 Actual 2013 Budget Funding ERO Funding Assessments Penalty Sanctions Total ERO Funding $ - $ - $ - Federal Grants Membership Fees Testing Services & Software Workshop Fees Interest Miscellaneous Total Funding (A) Expenses Personnel Expenses Salaries Payroll Taxes Employee Benefits Savings & Retirement Total Personnel Expenses Meeting Expenses Meetings Travel Conference Calls Total Meeting Expenses Operating Expenses Consultants & Contracts Rent & Improvements Office Costs 1,215 1,768 (553) % Professional Services 26,147 30,000 (3,853) % Miscellaneous Depreciation Total Operating Expenses 27,362 31,768 (4,406) % 2013 Variance from Budget Over(Under) Comments (Explain variances > +/- 10% and $10,000) Indirect Expenses (27,362) (31,768) 4, % Expenses related to indirect programs have been allocated proportionately to the direct programs for 2013 based on the number of FTEs in those programs Other Non-Operating Expenses Total Expenses (B) Change in Assets (A - B) Fixed Assets Depreciation Computer & Software CapEx Furniture & Fixtures CapEx Equipment CapEx Leasehold Improvements Incr(Dec) in Fixed Assets Allocation of Fixed Assets Total Inc(Dec) in Fixed Assets (C) TOTAL BUDGET (B - C) Change in Working Capital (A-B+C) FTE's - - -
211 SERC Reliability Corporation Statement of Activities From 1/1/2013 through 12/31/2013 Per Audit INFORMATION TECHNOLOGY Funding 2013 Actual 2013 Budget ERO Funding Assessments Penalty Sanctions Total ERO Funding $ - $ - $ - Federal Grants Membership Fees Testing Services & Software Workshop Fees Interest Miscellaneous Total Funding (A) Variance from Budget Over(Under) Comments (Explain variances > +/- 10% and $10,000) Expenses Personnel Expenses Salaries Payroll Taxes Employee Benefits Savings & Retirement Total Personnel Expenses Meeting Expenses Meetings Travel Conference Calls Total Meeting Expenses Operating Expenses Consultants & Contracts 424, ,780 (208,001) % Participation in the OATI schedule checkout tool was lower than planned in 2013, resulting in an under run from the budgeted cost. However, a change was made to the tool to accommodate the users need for intra-hour scheduling. The net effect caused an overrun. Additionally, actual costs for hosting and maintaining SERC s servers are lower than budgeted. Finally, SERC did not incur significant costs related to various IT projects, causing an under run. Rent & Improvements Office Costs 107, ,916 (37,307) % The budget included funds the purchase of computers and equipment for existing staff replacements and for the budgeted new positions. The majority of these items were purchased in 2012, causing an under run in Additionally, SERC negotiated better rates on the telephone and internet service, causing an under run. Professional Services Miscellaneous Depreciation Total Operating Expenses - 532, ,696 - (245,308) % Indirect Expenses (532,388) (777,696) 245, % Expenses related to indirect programs have been allocated proportionately to the direct programs for 2013 based on the number of FTEs in those programs Other Non-Operating Expenses Total Expenses (B) Change in Assets (A - B) Fixed Assets Depreciation Computer & Software CapEx Furniture & Fixtures CapEx Equipment CapEx Leasehold Improvements Incr(Dec) in Fixed Assets Allocation of Fixed Assets Total Inc(Dec) in Fixed Assets (C) TOTAL BUDGET (B - C) Change in Working Capital (A-B+C) FTE's - - -
212 SERC Reliability Corporation Statement of Activities From 1/1/2013 through 12/31/2013 Per Audit HUMAN RESOURCES 2013 Actual 2013 Budget Funding ERO Funding Assessments Penalty Sanctions Total ERO Funding $ - $ - $ - Federal Grants Membership Fees Testing Services & Software Workshop Fees Interest Miscellaneous Total Funding (A) Variance from Budget Over(Under) Comments (Explain variances > +/- 10% and $10,000) Expenses Personnel Expenses Salaries Payroll Taxes Employee Benefits Savings & Retirement Total Personnel Expenses Meeting Expenses Meetings Travel Conference Calls Total Meeting Expenses Operating Expenses Consultants & Contracts 10,000-10,000 SERC engaged a consultant to offer a climate survey to employees. This was an unbudgeted expense, but deemed necessary. Rent & Improvements Office Costs % Professional Services 6,975 10,000 (3,025) % Miscellaneous Depreciation Total Operating Expenses 17,674 10,360 7, % Indirect Expenses (17,674) (10,360) (7,314) 70.60% Expenses related to indirect programs have been allocated proportionately to the direct programs for 2013 based on the number of FTEs in those programs Other Non-Operating Expenses Total Expenses (B) Change in Assets (A - B) Fixed Assets Depreciation Computer & Software CapEx Furniture & Fixtures CapEx Equipment CapEx Leasehold Improvements Incr(Dec) in Fixed Assets Allocation of Fixed Assets Total Inc(Dec) in Fixed Assets (C) TOTAL BUDGET (B - C) Change in Working Capital (A-B+C) FTE's - - -
213 ACCOUNTING and FINANCE 2013 Actual 2013 Budget Funding ERO Funding Assessments Penalty Sanctions Total ERO Funding $ - $ - $ - SERC Reliability Corporation Statement of Activities From 1/1/2013 through 12/31/2013 Per Audit Federal Grants Membership Fees Testing Services & Software Workshop Fees Interest 1,271 10,000 (8,729) % Miscellaneous Total Funding (A) 1,271 10,000 (8,729) % Expenses Personnel Expenses Salaries Payroll Taxes Employee Benefits Savings & Retirement Total Personnel Expenses Meeting Expenses Meetings Travel Conference Calls Total Meeting Expenses Operating Expenses Consultants & Contracts 1,600-1,600 Rent & Improvements Office Costs 12,259 8,000 4, % Professional Services 28,704 30,900 (2,196) -7.11% 2013 Variance from Budget Over(Under) Comments (Explain variances > +/- 10% and $10,000) Miscellaneous 1,000-1,000 Depreciation Total Operating Expenses 43,563 38,900 4, % Indirect Expenses (43,563) (28,900) (14,663) 50.74% Expenses related to indirect programs have been allocated proportionately to the direct programs for 2013 based on the number of FTEs in those programs Other Non-Operating Expenses Total Expenses (B) - 10,000 (10,000) % Change in Assets (A - B) 1,271-1,271 Fixed Assets Depreciation Computer & Software CapEx Furniture & Fixtures CapEx Equipment CapEx Leasehold Improvements Incr(Dec) in Fixed Assets Allocation of Fixed Assets Total Inc(Dec) in Fixed Assets (C) TOTAL BUDGET (B - C) - 10,000 (10,000) % Change in Working Capital (A-B+C) 1,271-1,271 FTE's - - -


214 SERC RELIABILITY CORPORATION FINANCIAL STATEMENTS AND SUPPLEMENTAL SCHEDULES As of and for the Year Ended December 31, 2013 and 2012 And Report of Independent Auditor
215 SERC RELIABILITY CORPORATION TABLE OF CONTENTS REPORT OF INDEPENDENT AUDITOR FINANCIAL STATEMENTS Statements of Financial Position... 3 Statements of Activities... 4 Statements of Cash Flows... 5 Notes to the Financial Statements SUPPLEMENTAL SCHEDULES Statutory Financial Statements Statutory Financial Statements by Function
, which comprise the statements of financial position as of December 31, 2013 and 2012, and the related statements of activities and cash flows for")
216 Report of Independent Auditor To the Board of Directors SERC Reliability Corporation Charlotte, North Carolina Report on the Financial Statements We have audited the accompanying financial statements of SERC Reliability Corporation (the Corporation ), which comprise the statements of financial position as of December 31, 2013 and 2012, and the related statements of activities and cash flows for the years then ended, and the related notes to the financial statements. Management s Responsibility for the Financial Statements Management is responsible for the preparation and fair presentation of these financial statements in accordance with accounting principles generally accepted in the United States of America; this includes the design, implementation, and maintenance of internal control relevant to the preparation and fair presentation of financial statements that are free from material misstatement, whether due to fraud or error. Auditor s Responsibility Our responsibility is to express an opinion on these financial statements based on our audits. We conducted our audits in accordance with auditing standards generally accepted in the United States of America. Those standards require that we plan and perform the audits to obtain reasonable assurance about whether the financial statements are free from material misstatement. An audit involves performing procedures to obtain audit evidence about the amounts and disclosures in the financial statements. The procedures selected depend on the auditor s judgment, including the assessment of the risks of material misstatement of the financial statements, whether due to fraud or error. In making those risk assessments, the auditor considers internal control relevant to the entity s preparation and fair presentation of the financial statements in order to design audit procedures that are appropriate in the circumstances, but not for the purpose of expressing an opinion on the effectiveness of the entity s internal control. Accordingly, we express no such opinion. An audit also includes evaluating the appropriateness of accounting policies used and the reasonableness of significant accounting estimates made by management, as well as evaluating the overall presentation of the financial statements. We believe the audit evidence we have obtained is sufficient and appropriate to provide a basis for our audit opinion. Opinion In our opinion, the financial statements referred to above present fairly, in all material respects, the financial position of SERC Reliability Corporation as of December 31, 2013 and 2012, and the changes in net assets and its cash flows for the years then ended in conformity with accounting principles generally accepted in the United States of America.
217 Supplemental Schedules Our audits were conducted for the purpose of forming an opinion on the financial statements as a whole. The supplemental schedules on pages 10 through 13 are presented for purposes of additional analysis and are not a required part of the financial statements. Such information is the responsibility of management and was derived from and relates directly to the underlying accounting and other records used to prepare the financial statements. The information has been subjected to the auditing procedures applied in the audits of the financial statements and certain additional procedures, including comparing and reconciling such information directly to the underlying accounting and other records used to prepare the financial statements or to the financial statements themselves, and other additional procedures in accordance with auditing standards generally accepted in the United States of America. In our opinion, the information is fairly stated in all material respects in relation to the financial statements as a whole. Charlotte, North Carolina April 11,
218 SERC RELIABILITY CORPORATION STATEMENTS OF FINANCIAL POSITION DECEMBER 31, 2013 AND ASSETS Current assets Cash and cash equivalents $ 7,685,935 $ 7,192,908 Accounts receivable 68,691 18,487 Prepaid expenses and other current assets 172, ,403 Total current assets 7,926,839 7,338,798 Property and equipment, net 662, ,812 Total Assets $ 8,589,317 $ 7,663,610 LIABILITIES AND NET ASSETS Current liabilities Accounts payable $ 452,530 $ 465,519 Accrued salaries and related benefits 2,407,098 1,981,820 Deferred revenue 2,318, ,606 Total current liabilities 5,177,811 3,003,945 Net assets Unrestricted and undesignated 2,215,987 3,473,073 Unrestricted and designated operating reserve 1,195,519 1,186,592 Total Net Assets 3,411,506 4,659,665 Total Liabilities and Net Assets $ 8,589,317 $ 7,663,610 The accompanying notes to the financial statements are an integral part of these statements. 3
219 SERC RELIABILITY CORPORATION STATEMENTS OF ACTIVITIES YEARS ENDED DECEMBER 31, 2013 AND Funding Member assessments $ 13,829,878 $ 14,845,275 Penalty sanctions 51, ,500 Workshops 173, ,574 Interest 1,271 7,665 Miscellaneous 238, ,822 Total funding 14,295,142 15,627,836 Expenses Personnel expenses: Salaries 9,176,085 8,003,504 Payroll taxes 632, ,010 Employee benefits 896, ,615 Savings and retirement 1,169,319 1,060,293 Total personnel expenses 11,875,107 10,290,422 Meeting expenses: Meetings 276, ,082 Travel 646, ,263 Conference calls 49,760 42,622 Total meeting expenses 972, ,967 Operating expenses: Contracts and consultants 1,410, ,931 Rent and improvements 403, ,835 Office costs 633, ,242 Professional services 107, ,214 Depreciation 137, ,449 Miscellaneous 2,148 8,170 Total operating expenses 2,695,197 1,987,841 Total expenses 15,543,301 13,243,230 Change in net assets (1,248,159) 2,384,606 Net assets Beginning of year 4,659,665 2,275,059 End of year $ 3,411,506 $ 4,659,665 The accompanying notes to the financial statements are an integral part of these statements. 4
220 SERC RELIABILITY CORPORATION STATEMENTS OF CASH FLOWS YEARS ENDED DECEMBER 31, 2013 AND 2012 Cash flows from operating activities Change in net assets $ (1,248,159) $ 2,384,606 Adjustments to reconcile change in net assets to net cash provided by operating activities: Depreciation 137, ,449 Changes in operating assets and liabilities: Accounts receivable (50,204) 29,475 Prepaid expenses and other current assets (44,810) (4,102) Accounts payable (12,989) 253,723 Accrued salaries and related benefits 425, ,500 Deferred revenue 1,761,577 80,279 Net cash provided by operating activities 967,840 3,491,930 Cash flows from investing activities Additions to property and equipment (474,813) (146,827) Net increase in cash and cash equivalents 493,027 3,345,103 Cash and cash equivalents Beginning of year 7,192,908 3,847,805 End of year $ 7,685,935 $ 7,192,908 The accompanying notes to the financial statements are an integral part of these statements. 5
221 SERC RELIABILITY CORPORATION NOTES TO THE FINANCIAL STATEMENTS DECEMBER 31, 2013 AND 2012 Note 1 Organization and nature of operations SERC Reliability Corporation (the Corporation ) is a non-profit corporation which qualifies as a Regional Reliability Organization under the Energy Policy Act of The Corporation's mission is to promote the reliability of the electricity supply for the southeastern United States. The activities of the Corporation are directed by its Board of Directors. The Corporation s members are electricity suppliers, brokers and consumers from various ownership segments of the electricity supply industry, investor-owned utilities rural electric cooperatives, municipal utilities, independent power producers, power marketers and customers. These entities account for virtually all the electricity supplied in the southeastern United States. Note 2 Summary of significant accounting policies Accounting Principles - The financial statements of the Corporation have been prepared on the accrual basis of accounting in accordance with accounting principles generally accepted in the United States of America ( GAAP ). The Corporation is required to report information regarding its financial position and activities according to three classes of net assets - unrestricted net assets, temporarily restricted net assets and permanently restricted net assets. The Corporation had only unrestricted net assets as of December 31, 2013 and 2012, including unrestricted net assets that have been designated by the Board of Directors as an operating reserve. Management Estimates - The preparation of financial statements in conformity with GAAP requires management to make estimates, including estimates relating to assumptions that affect the reported amounts of assets and liabilities and disclosure of contingent assets and liabilities at the date of financial statements and the reported amounts of revenues and expenses during the reporting period. Actual results could differ from these estimates. Cash and Cash Equivalents - The Corporation considers all cash investments with an original maturity of three months or less to be cash equivalents. Accounts Receivable - Accounts receivable arise primarily from amounts billed to members. Management s determination of the need for an allowance for doubtful accounts is based on evaluation of the accounts receivable, past experience, current economic conditions and other risks inherent in the accounts receivable portfolio. Any amounts considered to be uncollectible are written off at the time of such determination. At December 31, 2013 and 2012, management has determined that an allowance for doubtful accounts is not necessary. Property and Equipment - Property and equipment are stated at cost. Depreciation is computed using the straight-line method over the estimated economic useful lives of the assets ranging from 5-7 years for leasehold improvements and 3 years for computer equipment and software. The costs of major improvements are capitalized, while the costs of maintenance and repairs, which do not improve or extend the lives of the respective assets, are expensed currently. The cost and accumulated depreciation of property and equipment are eliminated from the accounts upon disposal, and any resulting gain or loss is included in the change in net assets of the Corporation. Long-lived assets held and used by the Corporation are reviewed for impairment whenever changes in circumstances indicate the carrying value of an asset may not be recoverable. Deferred Revenue - Deferred revenue represents amounts billed or collected from members in advance of the periods in which such amounts are earned. 6
222 SERC RELIABILITY CORPORATION NOTES TO THE FINANCIAL STATEMENTS DECEMBER 31, 2013 AND 2012 Note 2 Summary of significant accounting policies (continued) Revenue Recognition - All income is recognized in the period when earned. The Corporation receives a significant portion of its funding directly from the North American Electric Reliability Corporation ( NERC ) based on the budget submitted by the Corporation and approved by NERC and the Federal Energy Regulatory Commission ( FERC ). The revenue is received in four equal quarterly installments received at the beginning of each quarter. Based on past history with NERC, the Corporation believes that its revenue risk exposure is limited. Income Taxes - The Corporation is exempt from federal and state income taxes under Section 501(c)(6) of the Internal Revenue Code ( IRC ) and the applicable state statutes. Management believes that the Corporation continues to satisfy the requirements of a tax exempt organization and is not subject to tax. Accordingly, no provision for income taxes has been recorded in the accompanying financial statements. Management has evaluated the effect of the Financial Accounting Standards Board ( FASB ) guidance on accounting for uncertainty in income taxes. The guidance clarifies the accounting for uncertainty in income taxes recognized in an entity s financial statements by prescribing a recognition threshold and measurement attribute for the financial statement recognition and measurement of a tax position taken or expected to be taken in a tax return. The Corporation s policy is to record a liability for any tax position taken that is beneficial to the Corporation, including any related interest and penalties, when it is more likely than not the position taken by management with respect to a transaction or class of transactions will be overturned by a taxing authority upon examination. Management believes there are no such positions at December 31, 2013 or 2012 and, accordingly, no liability has been accrued. The Corporation is no longer subject to tax examinations for years prior to Note 3 Property and equipment Property and equipment includes the following at December 31: Leasehold improvements $ 53,099 $ 53,099 Computer equipment 202, ,411 Software 918, ,360 1,173, ,870 Less: Accumulated depreciation (511,204) (374,058) Property and equipment, net $ 662,478 $ 324,812 Depreciation expense was $137,147 and $129,449 for the years ended December 2013 and 2012, respectively. Note 4 Leases The Corporation leases office facilities under three operating leases which continue through January The leases call for monthly payments ranging from $32,000 to $35,000. Subsequent to year end, the Corporation entered into a new operating lease for office space which commences on April 1, 2014 and continues through March 31, The lease will provide free rent for the first 10 months of the lease period and annual rent payments ranging from $460,000 to $612,000 thereafter. In connection with the future office space, the Corporation entered into a construction agreement providing for an upfit allowance, whereby the Corporation will be reimbursed for upfit costs up to $814,710. 7
223 SERC RELIABILITY CORPORATION NOTES TO THE FINANCIAL STATEMENTS DECEMBER 31, 2013 AND 2012 Note 4 Leases (continued) Total rent expense for the years ended December 31, 2013 and 2012, was $403,731 and $404,835, respectively. Future minimum payments on all operating leases are as follows: Note 5 Line of credit Year ending December 31, 2014 $ 410, , , , ,101 Thereafter 3,530,777 Total $ 6,010,058 The Corporation has a $1,000,000 bank line of credit at an interest rate of prime plus 0.9%, limited to a 5.0% floor, (5.0% at December 31, 2013) for which all outstanding borrowings shall be payable in full at maturity on August 30, The line is secured by the assets of the Corporation. The line of credit had no outstanding balance at December 31, 2013 and Note 6 Benefit plans 401(k) plan - The Corporation sponsors a 401(k) retirement plan covering all eligible employees, as defined. The Corporation makes an annual contribution to the plan equal to 3% of each eligible employee s compensation. In addition, the plan provides that the Corporation may make additional discretionary matching and profit-sharing contributions. During the years ended December 31, 2013 and 2012, contribution expense related to the plan totaled $1,131,588 and $1,029,192, respectively. Deferred compensation plan - The Corporation established a deferred compensation plan in accordance with Internal Revenue Code Section 457 for certain employees, as defined. The plan provides that eligible employees may make elective salary reduction contributions in accordance with limitations established by the Internal Revenue Code. In addition, the Corporation may make discretionary contributions as provided in the plan. During the years ended December 31, 2013 and 2012, contribution expense related to the plan totaled $21,036 and $21,876, respectively. The asset and liability for deferred compensation of $82,204 and $61,063 at December 31, 2013 and 2012, respectively, is included in prepaid expenses and other current assets and accrued salaries and related benefits in the accompanying statements of financial position. Note 7 Concentrations of credit risk and uncertainties The Corporation places its cash and cash equivalents on deposit with a North Carolina financial institution. The Federal Deposit Insurance Company ( FDIC ) covers $250,000 for substantially all depository accounts. The Corporation from time to time may have balances in excess of the FDIC insured limits. The Corporation had funds in banks in excess of the federally insured limited of $7,343,667 and $6,960,203 at December 31, 2013 and 2012, respectively. 8
224 SERC RELIABILITY CORPORATION NOTES TO THE FINANCIAL STATEMENTS DECEMBER 31, 2013 AND 2012 Note 8 Functional expenses The following is an allocation of expenses by functional category for the years ended December 31: Program expenses: Reliability standards $ 291,074 $ 356,196 Compliance enforcement 6,928,256 5,643,977 Reliability assessment 1,265, ,662 Training and education 635, ,381 Situtation awareness 557, ,826 9,677,541 8,601,042 Committee and member forums 853, ,597 General and administrative expenses: General and administrative 4,391,004 3,480,171 Legal and regulatory 27,362 49,805 Information technology 532, ,603 Human resources 17, Accounting and finance 43,563 40,962 5,011,991 4,097,591 Total $ 15,543,301 $ 13,243,230 Note 9 Subsequent events Management has evaluated subsequent events through April 11, 2014, the date the financial statements were issued. 9
225 ACCOMPANYING INFORMATION
226 SERC RELIABILITY CORPORATION STATUTORY FINANCIAL STATEMENTS YEAR ENDED DECEMBER 31, YTD 2013 YTD 2013 YTD Actual Budget Variance Funding Member assessments $ 13,829,878 $ 13,829,878 $ - Penalty sanctions 51,000 51,000 - Workshops 173, ,000 (72,003) Interest 1,271 10,000 (8,729) Miscellaneous 238,996 65, ,996 Total funding 14,295,142 14,201,878 93,264 Expenses Personnel expenses: Salaries 9,176,085 9,925,148 (749,063) Payroll taxes 632, ,509 37,404 Employee benefits 896, ,100 (19,310) Savings and retirement 1,169,319 1,353,524 (184,205) Total personnel expenses 11,875,107 12,790,281 (915,174) Meeting expenses: Meetings 276, ,160 (32,321) Travel 646, ,023 51,375 Conference calls 49,760 60,000 (10,240) Total meeting expenses 972, ,183 8,814 Operating expenses: Contracts and consultants 1,410,698 1,166, ,751 Rent and improvements 403, ,407 (1,676) Office costs 633, , ,216 Professional services 107, ,900 1,805 Depreciation 137, ,389 (163,242) Miscellaneous 2,148-2,148 Total operating expenses 2,695,197 2,340, ,002 Total expenses 15,543,301 16,094,659 (551,358) Change in net assets $ (1,248,159) $ (1,892,781) $ 644,622 10
227 SERC RELIABILITY CORPORATION STATUTORY FINANCIAL STATEMENTS YEAR ENDED DECEMBER 31, YTD 2012 YTD 2012 YTD Actual Budget Variance Funding Member assessments $ 14,845,275 $ 14,845,275 $ - Penalty sanctions 434, ,500 - Workshops 226, ,670 (38,096) Interest 7,665 10,000 (2,335) Miscellaneous 113,822 40,000 73,822 Total funding 15,627,836 15,594,445 33,391 Expenses Personnel expenses: Salaries 8,003,504 8,908,407 (904,903) Payroll taxes 561, ,758 (240,748) Employee benefits 665, ,883 (230,268) Savings and retirement 1,060,293 1,207,456 (147,163) Total personnel expenses 10,290,422 11,813,504 (1,523,082) Meeting expenses: Meetings 341, ,078 (60,996) Travel 581, ,591 (35,328) Conference calls 42,622 96,000 (53,378) Total meeting expenses 964,967 1,114,669 (149,702) Operating expenses: Contracts and consultants 899,931 1,159,275 (259,344) Rent and improvements 404, ,722 (39,887) Office costs 402, ,875 (280,633) Professional services 143,214 89,400 53,814 Depreciation 129, ,952 (103,503) Miscellaneous 8,170-8,170 Total operating expenses 1,987,841 2,609,224 (621,383) Total expenses 13,243,230 15,537,397 (2,294,167) Change in net assets $ 2,384,606 $ 57,048 $ 2,327,558 11
228 SERC RELIABILITY CORPORATION STATUTORY FINANCIAL STATEMENTS BY FUNCTION YEAR ENDED DECEMBER 31, RELIAB COMP ENFORCE/ RELIAB TRAINING SIT COMMITTEE & GENERAL LEGAL & 2300 HUMAN ACCOUNTING 2013 YTD 2013 YTD 2013 YTD STD DEV ORG REG & CERT ASSES & EDUC AWARE MBR FORUMS ADMIN REGULATORY IT RESOURCES & FINANCE Actual Budget Variance Funding Member assessments $ 698,880 $ 11,150,647 $ 1,937,756 $ 701,400 $ 1,046,920 - $ (1,705,725) $ 13,829,878 $ 13,829,878 $ - Penalty sanctions 2,358 36,796 6,384 2,137 3, ,000 51,000 - Workshops , , ,000 (72,003) Interest ,271 1,271 10,000 (8,729) Miscellaneous , , ,996 65, ,996 Total funding 701,325 11,364,762 1,944, ,621 1,050, (1,644,396) ,271 14,295,142 14,201,878 93,264 Expenses Personnel expenses: Salaries 226,234 4,556, , , , ,983 2,347, ,176,085 9,925,148 (749,063) Payroll taxes 17, ,116 56,925 20,837 20,980 46, , , ,509 37,404 Employee benefits 26, ,656 93,610 27,231 32,467 57, , , ,100 (19,310) Savings and retirement 13, ,236 93,427 35,589 61,989 65, , ,169,319 1,353,524 (184,205) Total personnel expenses 284,169 5,994, , , , ,483 2,938, ,875,107 12,790,281 (915,174) Meeting expenses: Meetings ,743 28, ,043 3,225 11,598 64, , ,160 (32,321) Travel 5, ,579 69,856 13,986 55,399 28,345 65, , ,023 51,375 Conference calls , ,760 60,000 (10,240) Total meeting expenses 6, ,322 98, ,029 58,624 39, , , ,183 8,814 Operating expenses: Contracts and consultants - 474, ,865 90,077-2, , ,779 10,000 1,600 1,410,698 1,166, ,751 Rent and improvements , , ,407 (1,676) Office costs ,050 4,648 4,971 2,316 1, ,725 1, , , , , ,216 Professional services - 8, ,366 26,147-6,975 28, , ,900 1,805 Depreciation , , ,389 (163,242) Miscellaneous , ,000 2,148-2,148 Total operating expenses , ,513 95,048 2,316 4,343 1,272,991 27, ,388 17,674 43,563 2,695,197 2,340, ,002 Total expenses 291,074 6,928,256 1,265, , , ,769 4,391,004 27, ,388 17,674 43,563 15,543,301 16,094,659 (551,358) Change in net assets $ 410,251 $ 4,436,506 $ 678,630 $ 242,158 $ 493,094 $ (853,682) $ (6,035,400) $ (27,362) $ (532,388) $ (17,674) $ (42,292) $ (1,248,159) $ (1,892,781) $ 644,622 12
229 SERC RELIABILITY CORPORATION STATUTORY FINANCIAL STATEMENTS BY FUNCTION YEAR ENDED DECEMBER 31, RELIAB COMP ENFORCE/ RELIAB TRAINING SIT COMMITTEE & GENERAL LEGAL & 2300 HUMAN ACCOUNTING 2012 YTD 2012 YTD 2012 YTD STD DEV ORG REG & CERT ASSES & EDUC AWARE MBR FORUMS ADMIN REGULATORY IT RESOURCES & FINANCE Actual Budget Variance Funding Member assessments $ 510,346 $ 10,639,545 $ 1,581,890 $ 570,332 $ 1,543,162 $ - $ - $ - $ - $ - $ - $ 14,845,275 $ 14,845,275 $ - Penalty sanctions 14, ,124 45,906 14,094 42, , ,500 - Workshops , , ,670 (38,096) Interest ,665 7,665 10,000 (2,335) Miscellaneous - 110, , ,822 40,000 73,822 Total funding 524,440 11,068,273 1,627, ,000 1,585,444-3, ,665 15,627,836 15,594,445 33,391 Expenses Personnel expenses: Salaries 259,658 3,972, , , , ,535 1,916, ,003,504 8,908,407 (904,903) Payroll taxes 16, ,761 42,766 15,936 52,689 24, , , ,758 (240,748) Employee benefits 20, , ,875 22,991 77,453 23, , , ,883 (230,268) Savings and retirement 49, ,132 96,200 47,117 89,506 82,545 83, ,060,293 1,207,456 (147,163) Total personnel expenses 346,160 5,080, , , , ,399 2,325, ,290,422 11,813,504 (1,523,082) Meeting expenses: Meetings ,384 17, , ,390 68, , ,078 (60,996) Travel 8, ,418 23,111 9,341 48,673 29,150 62, , ,591 (35,328) Conference calls , ,622 96,000 (53,378) Total meeting expenses 9, ,802 40, ,897 48,909 36, , ,967 1,114,669 (149,702) Operating expenses: Contracts and consultants - 106, ,994 65,338 10,189 6, , ,722-1, ,931 1,159,275 (259,344) Rent and improvements , , ,722 (39,887) Office costs ,845 3,262 7, , , ,816-10, , ,875 (280,633) Professional services , ,532 49, , ,214 89,400 53,814 Depreciation , , ,952 (103,503) Miscellaneous , ,170-8,170 Total operating expenses , ,335 74,255 10,948 7, ,757 49, , ,962 1,987,841 2,609,224 (621,383) Total expenses 356,196 5,643, , , , ,597 3,480,171 49, , ,962 13,243,230 15,537,397 (2,294,167) Change in net assets $ 168,244 $ 5,424,296 $ 670,134 $ 167,619 $ 585,618 $ (544,597) $ (3,476,953) $ (49,805) $ (526,603) $ (50) $ (33,297) $ 2,384,606 $ 57,048 $ 2,327,558 13
230 ATTACHMENT ACTUAL COST-TO-BUDGET COMPARISON FOR SOUTHWEST POWER POOL REGIONAL ENTITY AND 2013 AUDITED FINANCIAL REPORT FOR SOUTHWEST POWER POOL, INC.


231
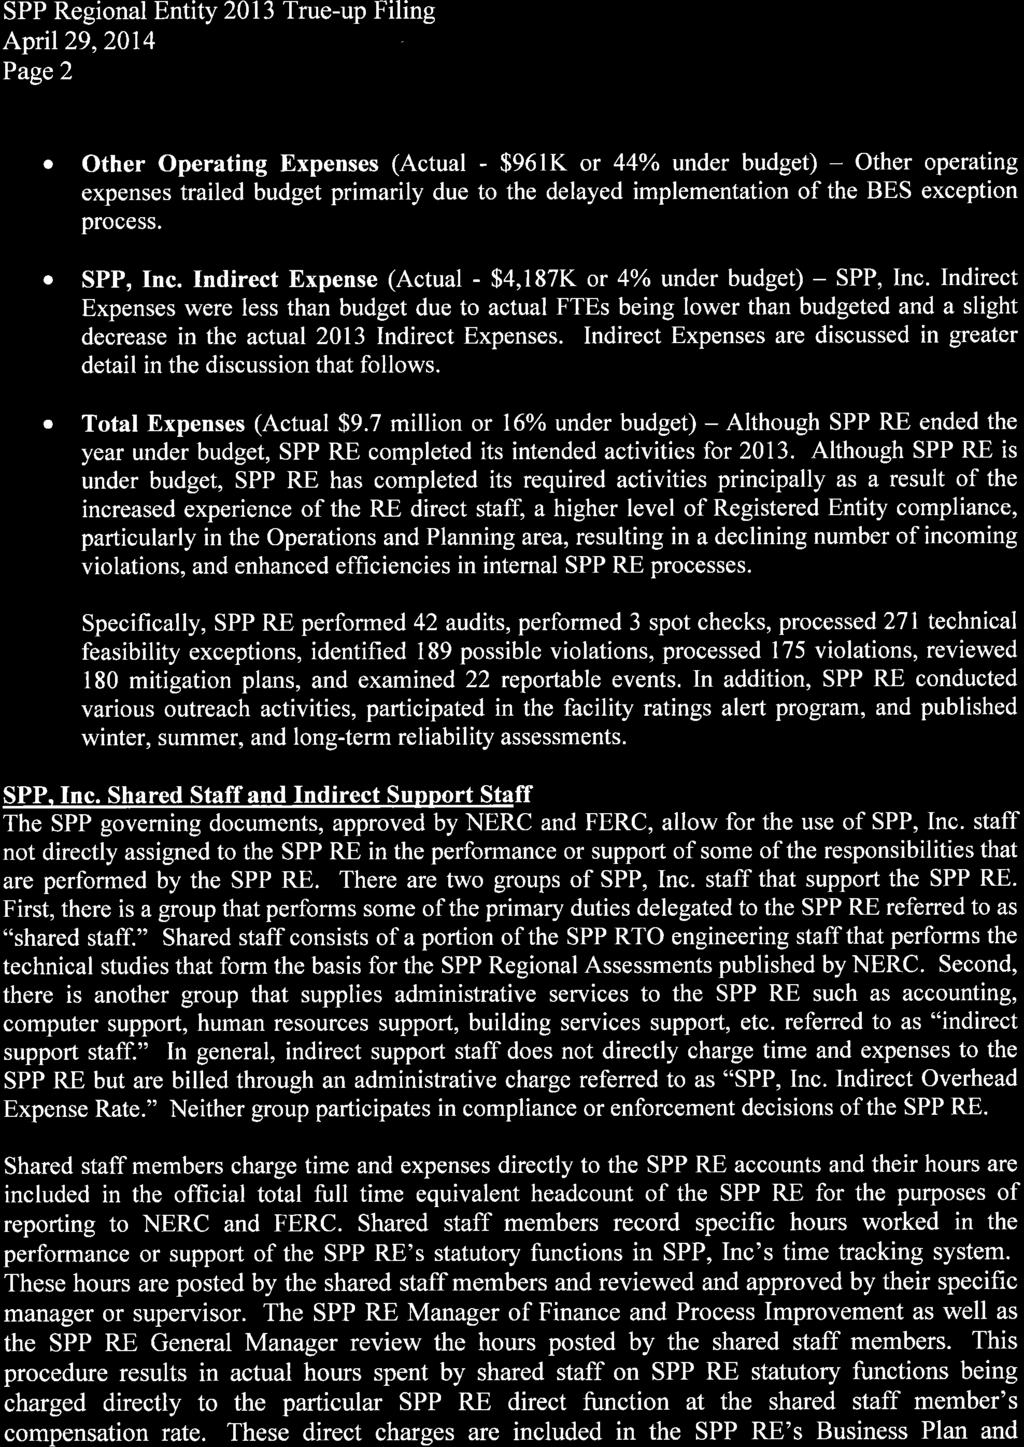
232


233
234
235
236
237
238
239
240
241
242
243
244
245
246
247
248
249
250
251
252
253
254
255
256
257
258
259
260
261
262
263
264
265
266
267
268
269
270
271
272
273
274
275
276 ATTACHMENT ACTUAL COST-TO-BUDGET COMPARISON AND 2013 AUDITED FINANCIAL REPORT FOR TEXAS RELIABILITY ENTITY, INC.
 2013 Actual Cost-to-Budget Comparison Dear Mr. Walker and Ms. Turpen, Texas Reliability Entity (Texas RE) has completed the 2013 True Up Analysis.")
277 April 29, 2014 Michael Walker, CFO Susan Turpen, Controller North American Electric Reliability Corporation 3343 Peachtree Road, NE Floor East Tower Suite 400 Atlanta, GA Subject: Texas Reliability Entity (Texas RE) 2013 Actual Cost-to-Budget Comparison Dear Mr. Walker and Ms. Turpen, Texas Reliability Entity (Texas RE) has completed the 2013 True Up Analysis. The budget comparisons are compared to the 2013 Texas RE budget, formally approved by FERC. Texas RE did not use Statutory funds for Non-statutory purposes. Texas RE s policy is to allocate indirect expenses to programs based on the pro-rata share of FTEs to total program FTEs. Texas RE maintains a $2,000,000 cash reserve balance according to the policy approved by the Texas RE Board of Directors. The significant expense variances at the aggregate statutory level are explained below. The explanations for the expense variances by statutory program area are provided in the attached spreadsheet. INCOME Total Statutory Income was under budget by $40k or 0.4%. Membership Fees decreased $2,000 or 9%. Fewer registered entities paid membership dues than budgeted. No Workshop Fees were collected in 2013 causing a 100% budget variance. Registered Entities hosted the workshops; therefore, no fees were charged to attend. EXPENSES Personnel Expenses ($553,797 or 7% below budget) Salary expense was $145k or 2% less than budget due to FTE vacancies. The vacancies were the result of employee turnover and the timing of hiring replacement employees. Employee benefits is 23% less than budget due to fewer employees participating in offered benefits than anticipated. Travel and Meeting Expenses ($46k or 11.4% less than budget) Meeting expenses were 16% less than budget due to the workshops being hosted by registered entities with no costs to Texas RE.
278 Travel expenses were $44k or 12.5% less than budget. Standards attended fewer meetings than budgeted that required travel while the RAPA program required more travel. Less travel was required in the Compliance audit area. Conference expenses increased $3,784 or 20% offsetting the reduction in the travel expense. Other Operating Expenses ($818k or 26.5% less than budget) Consultants and Contract costs were 16.8% less than budget because the IT staff performed some of the task originally planned for consultants in the Sharepoint project implementation. The Rent budget did not consider the deferred rent adjustment to make the rent expense straight line over the life of the lease causing the favorable 19.5% budget variance. Reconfiguring the cubicle space and adding front office signage caused the cost to be 18.4% greater than budget for office cost. Professional Services are $354,177 less than budget because professional insurance policies were less than anticipated since Texas RE has reached an excellent experience rating. The Enforcement department did not utilize the legal fees budgeted for a potential contested case. Laptops and computer equipment fully depreciated in 2013 and replacements were not purchased causing the 40% favorable variance in depreciation. Indirect Expenses ($59K or 26.5% less than budget) Indirect expense are allocated to functional departments based on FTE count. Texas RE indirect expenses were less than budget because Non-Statutory costs were charged directly to the Non-Statutory department rather than being charged indirectly. FIXED ASSETS Budgeted assets were not acquired in 2013 causing budget to be 19.5% less than anticipated. Total Budgeted Statutory expenses are under budget $1.4 million or 12.8%. Although Texas RE ended the year $1.4 million under budget, Texas RE completed its intended activities for Texas RE completed 33 Non-CIP audits, 10 CIP audits with CCA s, 21 CIP audits without CCA s, and 12 spot checks. Texas RE indentified 170 non-compliance matters and completely resolved 322 violations to reduce violation caseload from 255 to category zero events, 7 category one, 2 category 2 and 3 category 1 events were examined. 123 technical feasibility exceptions were processed in Texas RE verified mitigation plans or mitigation activities for 62 possible violations. In 2013, Texas RE processed 18 new entity registrations, 23 entity removals and 9 entity name changes. Also, 2 TOP certifications and 2 reviews associated with a control center relocation was conducted. PAGE 2 OF 17
279 If you have any questions on the report or the attached spreadsheet, please call me at the number below. Thank you. Judy Foppiano Judy A. Foppiano, CPA CFO & Director of Corporate Services Texas Reliability Entity, Inc. 805 Los Cimas Parkway, Suite 200 Austin, Texas PAGE 3 OF 17
280 Texas Reliability Entity, Inc Statutory & Non-Statutory Statement of Activities Audited Total Statutory & State (Non-Statutory) Combined Variance from Funding 2013 Actual 2013 Budget Budget Over(Under) ERO Funding Assessments $ 8,152,520 $ 8,152,520 $ - Penalty Sanctions 849, ,000 - Total ERO Funding $ 9,001,520 $ 9,001,520 $ - Membership Fees $ 19,250 $ 21,250 $ (2,000) Testing Fees 1,029,100 1,029,100 - Workshop Fees - 32,100 (32,100) Interest 9,076 13,910 (4,834) Total Funding $ 10,058,946 $ 10,097,880 $ (38,934) Expenses Personnel Expenses Salaries $ 6,244,320 $ 6,400,409 $ (156,089) Payroll Taxes 425, ,631 (143,834) Employee Benefits 732, ,487 (211,020) Savings & Retirement 813, ,812 (85,588) Total Personnel Expenses $ 8,215,808 $ 8,812,339 $ (596,531) Meeting & Travel Expenses Meetings $ 32,157 $ 38,316 $ (6,159) Travel 305, ,999 (54,600) Conference Expenses 22,324 18,540 3,784 Total Meeting & Travel Expenses $ 359,880 $ 416,855 $ (56,975) Operating Expenses Consultants & Contracts $ 349,113 $ 433,131 $ (84,018) Rent & Improvements 465, ,930 (68,152) Office Costs 450, ,638 75,790 Professional Services 544, ,000 (360,089) Depreciation 672, ,000 (215,715) Total Operating Expenses $ 2,482,514 $ 3,134,699 $ (652,185) Indirect Expenses Total Expenses $ 11,058,202 12,363, (1,305,691.00) Change in Assets (999,256) (2,266,013) 1,266,757 Fixed Assets Depreciation $ (672,285) $ (888,000) 215,715 Computer & Software CapEx 208, ,750 (202,574) Equipment CapEx 2,523 78,238 (75,715) Incr(Dec) in Fixed Assets $ (461,586) $ (399,012) $ (62,574) Allocation of Fixed Assets $ - $ - $ - Total Inc(Dec) in Fixed Assets $ (461,586) $ (399,012) $ (62,574) TOTAL BUDGET $ 10,596,616 $ 11,964,881 $ (1,368,265) Change in Working Captial $ (537,670) $ (1,867,001) $ 1,329,331 FTE's PAGE 4 OF 17
281 Texas Reliability Entity, Inc Statutory Statement of Activities Audited Funding 2013 Actual 2013 Budget Variance from Budget Over(Under) Comments (Explain variances > +/- 10% and $10,000) ERO Funding Assessments $ 8,152,520 $ 8,152,520 $ - 0% Penalty Sanctions 849, ,000-0% Total ERO Funding $ 9,001,520 $ 9,001,521 $ - 0% Membership Fees $ 19,250 $ 21,250 $ (2,000) -9.4% Workshop Fees - 32,100 (32,100) % Interest 7,929 13,910 (5,981) -43.0% Total Funding $ 9,028,699 $ 9,068,781 $ (40,081) -0.4% No fees were charged for the workshops held in Registered Entities hosted the workshops; therefore, no need to charge fees to attend Expenses Personnel Expenses Salaries $ 5,713,409 $ 5,858,856 $ (145,447) -2.5% Vacancies and timing of new hires Payroll Taxes 388, ,255 (134,328) -25.7% Directly related to staff vacancies Employee Benefits 669, ,322 (198,396) -22.8% Directly related to staff vacancies Savings & Retirement 742, ,519 (75,625) -9.2% Directly related to staff vacancies Total Personnel Expenses $ 7,515,155 $ 8,068,952 $ (553,797) -6.9% Meeting & Travel Expenses Meetings $ 32,157 $ 38,316 $ (6,159) -16.1% Workshops hosted by Registered Entities Travel 304, ,000 (43,616) -12.5% Standards and Compliance did not require as much travel as budgeted Conference Expenses 22,324 18,540 3, % Total Meeting & Travel Expenses $ 358,865 $ 404,856 $ (45,991) -11.4% Operating Expenses Consultants & Contracts $ 345,280 $ 415,000 $ (69,720) -16.8% Contract costs related to implementing the Sharepoint project were not used; the IT staff performed some of the tasks originally planned for the consultant Rent & Improvements 429, ,930 (104,179) -19.5% Adjustment for deferred rent not considered in the budget Office Costs 425, ,684 66, % Professional Services 534, ,225 (354,117) -39.9% Professional insurance policies were less than anticipated since Texas RE has shown an excellent experience rating over the past three years. The budgeted legal services budgeted in the Enforcement Department for a potential contested case were not utilized in Costs related to replacement laptops, software and server equipment have not been incurred, resulting in a 40.1% variance for depreciation. Depreciation 532, ,000 (355,934) -40.1% Total Operating Expenses $ 2,267,196 $ 3,084,839 $ (817,643) -26.5% Indirect Expenses 189,349 (223,856) 413, % Allocated to functional departments based on FTE count Total Expenses $ 10,330,564 11,334,791 (1,004,227) -8.9% Change in Assets (1,301,865) (2,266,010) 964, % Fixed Assets Depreciation $ (532,066) $ (888,000) $ 355, % Computer & Software CapEx 208, ,750 (202,574) -49.3% Equipment CapEx 2,523 78,238 (75,715) -96.8% Incr(Dec) in Fixed Assets $ (321,367) $ (399,012) $ 77, % Allocation of Fixed Assets $ - $ - $ - 0.0% Total Inc(Dec) in Fixed Assets $ (321,367) $ (399,012) $ 77, % TOTAL BUDGET $ 10,009,197 $ 10,935,779 $ (926,583) -8.5% Change in Working Captial $ (980,498) $ (1,866,998) $ 886, % FTE's PAGE 5 OF 17
282 Texas Reliability Entity, Inc Statement of Activities Audited RELIABILITY STANDARDS Funding 2013 Actual 2013 Budget Variance from Budget Over(Under) Comments (Explain variances > +/- 10% and $10,000) ERO Funding Assessments $ 406,288 $ 406,288 $ - 0% Penalty Sanctions 34,477 34,477-0% Total ERO Funding $ 440,765 $ 440,765 $ - 0% Membership Fees $ - $ 863 $ (863) -100% Did not allocate membership fees to programs Total Funding $ 440,765 $ 441,628 $ (863.00) 0% Expenses Personnel Expenses Salaries $ 125,229 $ 217,122 $ (91,893) -42% Vacancies, employee turnover & timing of New hires Payroll Taxes 7,340 19,923 (12,583) -63% Directly related to staff vacancies. Employee Benefits 12,246 26,197 (13,951) -53% Directly related to staff vacancies. Savings & Retirement 16,181 32,191 (16,010) -50% Directly related to staff vacancies. Total Personnel Expenses $ 160,996 $ 295,433 $ (134,437) -46% Meeting & Travel Expenses Meetings $ 583 $ - $ % Travel 4,555 10,835 (6,280) -58% Less Travel required to attend meetings than budgeted Total Meeting & Travel Expenses $ 5,138 $ 10,835 $ (5,697) -53% Operating Expenses Consultants & Contracts $ 7,957 $ 12,276 $ (4,319) -35% webvote Service Solution canceled Office Costs % Total Operating Expenses $ 8,817 $ 12,761 $ (3,944) -31% Indirect Expenses 135, ,461 4,056 3% Allocated to functional departments based on FTE count Total Expenses $ 310, ,490 (140,023) -31% Change in Assets 130,298 (8,862) 139, % Fixed Assets Incr(Dec) in Fixed Assets $ - $ - $ - Allocation of Fixed Assets $ - $ (8,862) $ 8, % Total Inc(Dec) in Fixed Assets $ - $ (8,862) $ 8, % TOTAL BUDGET $ 310,467 $ 441,628 $ (131,161) -30% Change in Working Captial $ 130,298 $ - $ 130,298 FTE's (0.50) PAGE 6 OF 17
283 COMPLIANCE OPERATIONS, ENFORCEMENT and ORGANIZATION REGISTRATION Texas Reliability Entity, Inc Statement of Activities Audited Funding 2013 Actual 2013 Budget Variance from Budget Over(Under) Comments (Explain variances > +/- 10% and $10,000) ERO Funding Assessments $ 8,079,155 $ 8,079,155 $ - 0% Penalty Sanctions 689, ,543-0% Total ERO Funding $ 8,768,698 $ 8,768,698 $ - 0% Membership Fees $ - $ 17,259 $ (17,259) -100% Did not allocate membership fees to programs Total Funding $ 8,768,698 $ 8,785,957 $ (17,259) 0% Expenses Personnel Expenses Salaries $ 3,494,378 $ 3,854,415 $ (360,037) -9% Vacancies, employee turnover & timing of New hires Payroll Taxes 246, ,884 (97,370) -28% Directly related to staff vacancies. Employee Benefits 404, ,125 (184,556) -31% Directly related to staff vacancies. Savings & Retirement 463, ,470 (108,243) -19% Directly related to staff vacancies. Total Personnel Expenses $ 4,608,688 $ 5,358,894 $ (750,206) -14% Meeting & Travel Expenses Meetings $ 383 $ - $ % Travel 166, ,964 (56,864) -26% Less Travel for audits and meetings Total Meeting & Travel Expenses $ 166,483 $ 222,964 $ (56,481) -25% Operating Expenses Consultants & Contracts $ 201,688 $ 274,815 $ (73,128) -27% CIP consultant not utilized Office Costs 10,867 15,562 (4,695) -30% Telephone charges lower than budgeted Professional Services 64, ,224 (247,050) -79% Outside legal for contested case not utilized Depreciation - 331,292 (331,292) -100% Depreciation actual charged to G&A Total Operating Expenses $ 276,728 $ 932,893 $ (656,165) -70% Indirect Expenses 3,162,052 2,629, ,826 20% Allocated to functional departments based on FTE count Total Expenses $ 8,213,951 $ 9,143,977 $ (930,026) -10% Change in Assets 554,747 (358,020) 912, % Fixed Assets Depreciation $ - $ (331,292) $ 331, % Depreciation actually charged to IT and G&A Computer & Software CapEx - 150,537 (150,537) -100% Assets budgeted not purchased Incr(Dec) in Fixed Assets $ - $ (180,755) $ 180, % Allocation of Fixed Assets $ - $ (177,265) $ 177, % Total Inc(Dec) in Fixed Assets $ - $ (358,020) $ 358, % TOTAL BUDGET $ 8,213,951 $ 8,785,957 $ (572,006) -7% Change in Working Captial $ 554,747 $ - $ 554,747 FTE's PAGE 7 OF 17
284 Texas Reliability Entity, Inc Statement of Activities Audited RELIABILITY ASSESSMENTS and PERFORMANCE ANALYSIS Funding 2013 Actual 2013 Budget Variance from Budget Over(Under) Comments (Explain variances > +/- 10% and $10,000) ERO Funding Assessments $ 1,047,067 $ 1,047,067 $ - 0% Penalty Sanctions 81,883 81,883-0% Total ERO Funding $ 1,128,950 $ 1,128,950 $ - 0% Membership Fees $ - $ 2,049 $ (2,049) -100% Did not allocate membership fees to programs Total Funding $ 1,128,950 $ 1,131,000 $ (2,049.00) 0% Expenses Personnel Expenses Salaries $ 628,266 $ 590,909 $ 37,357 6% Payroll Taxes 41,725 50,393 (8,668) -17% Error in budget allocation to payroll taxes Employee Benefits 77,687 77, % Savings & Retirement 84,941 87,610 (2,669) -3% Total Personnel Expenses $ 832,619 $ 806,171 $ 26,448 3% Meeting & Travel Expenses Meetings $ 1,913 $ - $ 1, % Travel 39,616 33,658 5,958 18% Total Meeting & Travel Expenses $ 41,529 $ 33,658 $ 7,871 23% Operating Expenses Consultants & Contracts $ 1,050 $ - $ 1, % Office Costs 36,367-36, % PI software maintenance was not budgeted in 2013 Professional Services % Total Operating Expenses $ 37,717 $ - $ 37,717 Indirect Expenses 406, ,221 94,329 30% Allocated to functional departments based on FTE count Total Expenses $ 1,318,415 $ 1,152,050 $ 166,365 14% Change in Assets (189,465) (21,050) (168,415) 800% Fixed Assets Incr(Dec) in Fixed Assets $ - $ - $ - Allocation of Fixed Assets $ - $ (21,050) $ 21, % Total Inc(Dec) in Fixed Assets $ - $ (21,050) $ 21, % TOTAL BUDGET $ 1,318,415 $ 1,131,000 $ 187,415 17% Change in Working Captial $ (189,465) $ - $ (189,465) FTE's (0.25) PAGE 8 OF 17
285 Texas Reliability Entity, Inc Statement of Activities Audited TRAINING, EDUCATION and OPERATOR CERTIFICATION Funding 2013 Actual 2013 Budget Variance from Budget Over(Under) Comments (Explain variances > +/- 10% and $10,000) ERO Funding Assessments $ 315,477 $ 315,477 $ - 0% Penalty Sanctions 30,168 30,168-0% Total ERO Funding $ 345,645 $ 345,645 $ - 0% Membership Fees $ - $ 755 $ (755) -100% Did not allocate membership fees to programs Workshop Fees - 32,100 (32,100) -100% No fees were charged for the workshops. Registered Entities hosted the workshops; therefore, no need to charge fees to attend. Total Funding $ 345,645 $ 378,500 $ (32,855) -9% Expenses Personnel Expenses Salaries $ 114,833 $ 172,183 $ (57,351) -33% Less than anticipated staff involvement in the workshops Payroll Taxes 10,128 15,167 (5,039) -33% Employee Benefits 17,728 27,147 (9,418) -35% Savings & Retirement 17,980 25,529 (7,550) -30% Total Personnel Expenses $ 160,668 $ 240,026 $ (79,357) -33% Meeting & Travel Expenses Meetings $ 14,697 $ 30,900 $ (16,203) -52% Registered Entities hosted meetings requiring less cost to Texas RE. Travel 2, , % Conference Expenses 11,008-11, % Utilizing online meetings that was not included in the budget Total Meeting & Travel Expenses $ 27,821 $ 31,200 $ (3,379) -11% Operating Expenses Consultants & Contracts $ 350 $ - $ % Office Costs 1,933-1, % Total Operating Expenses $ 2,283 $ - $ 2, % Indirect Expenses 158, ,029 43,074 37% Allocated to functional departments based on FTE count Total Expenses $ 348,875 $ 386,255 $ (37,379) -10% Change in Assets (3,230) (7,755) 4,524-58% Fixed Assets Incr(Dec) in Fixed Assets $ - $ - $ - Allocation of Fixed Assets $ - $ (7,755) $ 7, % Total Inc(Dec) in Fixed Assets $ - $ (7,755) $ 7, % TOTAL BUDGET $ 348,875 $ 378,500 $ (29,624) -8% Change in Working Captial $ (3,230) $ 0 $ (3,231) FTE's $ - PAGE 9 OF 17
286 Texas Reliability Entity, Inc Statement of Activities Audited SITUATION AWARENESS and INFRASTRUCTURE SECURITY Funding 2013 Actual 2013 Budget Variance from Budget Over(Under) Comments (Explain variances > +/- 10% and $10,000) ERO Funding Assessments $ 185,443 $ 185,443 $ - 0% Penalty Sanctions 12,929 12,929-0% Total ERO Funding $ 198,372 $ 198,372 $ - 0% Membership Fees $ - $ 324 $ (324) -100% Total Funding $ 198,372 $ 198,696 $ (324.00) 0% Expenses Personnel Expenses Salaries $ 51,624 $ 111,829 $ (60,205) -54% Less time charged to SAIS than anticipated in the budget Payroll Taxes 3,739 9,921 (6,182) -62% Directly related to salary variance Employee Benefits 5,878 13,128 (7,250) -55% Directly related to salary variance Savings & Retirement 7,594 16,580 (8,986) -54% Directly related to salary variance Total Personnel Expenses $ 68,834 $ 151,458 $ (82,624) -55% Meeting & Travel Expenses Travel 2,314 1,263 1,051 83% Total Meeting & Travel Expenses $ 2,314 $ 1,263 $ 1,051 83% Operating Expenses Office Costs Total Operating Expenses $ - $ - $ - Indirect Expenses 67,758 49,298 18,460 37% Total Expenses $ 138,907 $ 202,019 $ (63,112) -31% Change in Assets 59,465 (3,323) 62, % Fixed Assets Incr(Dec) in Fixed Assets $ - $ - $ - Allocation of Fixed Assets $ (3,324) $ 3, % Total Inc(Dec) in Fixed Assets $ - $ (3,324) $ 3, % TOTAL BUDGET $ 138,907 $ 198,695 $ (59,788) -30% Change in Working Captial $ 59,465 $ 1 $ 59,464 FTE's PAGE 10 OF 17
287 Texas Reliability Entity, Inc Statement of Activities Audited GENERAL and ADMINISTRATIVE Funding 2013 Actual 2013 Budget Variance from Budget Over(Under) Comments (Explain variances > +/- 10% and $10,000) ERO Funding Assessments $ (1,880,909) $ (1,880,909) $ - 0% Penalty Sanctions Total ERO Funding $ (1,880,909) $ (1,880,909) $ - 0% Membership Fees $ 19,250 $ - $ 19, % Budgeted to programs, actual charged to G&A Interest 7,929 13,910 (5,981) -43% Total Funding $ (1,853,730) $ (1,866,999) $ 13,269-1% Expenses Personnel Expenses Salaries $ 257,293 $ 189,676 $ 67,617 36% Salary expense was recorded to G & A by the Legal team for time spent filling an open position in G & A. Payroll Taxes 11,887 17,678 (5,791) -33% Error in budget allocation to payroll taxes Employee Benefits 25,273 26,158 (884) -3% Savings & Retirement 23,659 17,890 5,769 32% More employees participated in the retirment plan than in prior years Total Personnel Expenses $ 318,113 $ 251,402 $ 66,712 27% Meeting & Travel Expenses Meetings $ 2,798 $ 6,180 $ (3,382) -55% Travel 57,124 54,851 2,273 4% Conference Expenses (776) - (776) -100% Total Meeting & Travel Expenses $ 59,145 $ 61,031 $ (1,886) -3% Operating Expenses Consultants & Contracts $ 23,811 $ 2,981 $ 20, % Regional Assessments Project not budgeted Rent & Improvements 423, ,930 (110,665) -21% Deferred rent not considered in budget for straight line cost. Office Costs 54,681 31,369 23,312 74% Office space adjusted and new signage Professional Services 264, ,000 (60,984) -19% BOD fees less than anticipated Depreciation 532, , , % Depreciation expenses charged to G&A. The overage was offset by under-spending in Compliance Total Operating Expenses $ 1,297,839 $ 1,086,656 $ 211,183 19% Indirect Expenses (1,675,097) (1,399,089) (276,008) 20% Allocated to functional departments based on FTE count Total Expenses $ - $ 0 $ (0) -100% Change in Assets (1,853,730) (1,866,999) 13,269-1% Fixed Assets Depreciation $ (532,066) $ (193,376) (338,690) 175% Equipment CapEx 2,523 78,238 (75,715) -97% Incr(Dec) in Fixed Assets $ (529,543) $ (115,138) $ (414,405) 360% Allocation of Fixed Assets $ 115,138 $ (115,138) -100% Allocated to functional departments based on FTE count Total Inc(Dec) in Fixed Assets $ (529,543) $ - $ (529,543) 100% TOTAL BUDGET $ (529,543) 0 $ (529,543) 100% Change in Working Captial $ (1,324,187) $ (1,866,999) $ 542,812-29% FTE's PAGE 11 OF 17
288 Texas Reliability Entity, Inc Statement of Activities Audited LEGAL and REGULATORY Funding 2013 Actual 2013 Budget Variance from Budget Over(Under) Comments (Explain variances > +/- 10% and $10,000) ERO Funding Total ERO Funding $ - $ - $ - Total Funding $ - $ - $ - Expenses Personnel Expenses Salaries $ 463,471 $ 307,265 $ 156,206 51% Due to workload, FTE's charged more hours to Legal than budgeted Payroll Taxes 28,977 28, % Employee Benefits 55,623 47,924 7,700 16% Additional training for legal staff Savings & Retirement 53,108 25,093 28, % Total Personnel Expenses $ 601,179 $ 408,806 $ 192,373 47% Meeting & Travel Expenses Travel 10,791 11,172 (381) -3% Total Meeting & Travel Expenses $ 10,791 $ 11,172 $ (381) -3% Employees participation in retirement plan more than anticipated Operating Expenses Consultants & Contracts $ 3,475 $ 2,211 $ 1,264 57% Office Costs 3,635 2,415 1,220 51% Professional Services - 17,577 (17,577) -100% Outside legal services not utilized Total Operating Expenses $ 7,110 $ 22,203 $ (15,093) -68% Indirect Expenses (619,080) (442,181) (176,900) 40% Total Expenses $ - $ - $ - Change in Assets TOTAL BUDGET $ - $ - $ - 0% Change in Working Captial $ - $ - $ - 0% FTE's PAGE 12 OF 17
289 Texas Reliability Entity, Inc Statement of Activities Audited INFORMATION TECHNOLOGY Funding 2013 Actual 2013 Budget Variance from Budget Over(Under) Comments (Explain variances > +/- 10% and $10,000) ERO Funding Total ERO Funding $ - $ - $ - Total Funding $ - $ - $ - Expenses Personnel Expenses Salaries $ 316,631 $ 215,903 $ 100,728 47% Additional FTE due to workload Payroll Taxes 23,456 19,525 3,931 20% Directly related to Salary variance Employee Benefits 44,497 34,005 10,492 31% Directly related to additional FTE and salary expenses Savings & Retirement 45,178 21,779 23, % Total Personnel Expenses $ 429,761 $ 291,211 $ 138,550 48% Meeting & Travel Expenses Meetings $ 1,511 $ 1,236 $ % Travel 10,832 10, % Conference Expenses 12,092 18,540 (6,448) -35% Total Meeting & Travel Expenses $ 24,436 $ 29,776 $ (5,340) -18% Directly related to additional FTE and salary expenses, employees participation greater than anticipated for retirement plan Operating Expenses Consultants & Contracts $ 79,407 $ 84,562 $ (5,155) -6% Rent & Improvements 6,486-6, % Office Costs 287, ,721 19,673 7% Professional Services 54,777 54, % Depreciation - 363,332 (363,332) -100% Depreciation charged to G &A, allocated to functional departments Total Operating Expenses $ 428,064 $ 770,039 $ (341,975) -44% Indirect Expenses (882,261) (1,091,026) 208,765-19% Total Expenses $ - $ - $ - Change in Assets Fixed Assets Depreciation $ - $ (363,332) $ 363, % Depreciation charged to G &A, allocated to functional departments Computer & Software CapEx 208, ,213 (52,037) -20% Furniture & Fixture CapEx % Equipment CapEx % Leasehold Improvement CapEx % Incr(Dec) in Fixed Assets $ 208,176 $ (103,119) $ 311, % Allocation of Fixed Assets $ - $ 103,119 $ (103,119) -100% Total Inc(Dec) in Fixed Assets $ 208,176 $ - $ 208,176 0% TOTAL BUDGET $ 208,176 $ - $ 208,176 0% Change in Working Captial $ (208,176) $ - $ (208,176) 0% FTE's PAGE 13 OF 17
290 Texas Reliability Entity, Inc Statement of Activities Audited HUMAN RESOURCES Funding 2013 Actual 2013 Budget Variance from Budget Over(Under) Comments (Explain variances > +/- 10% and $10,000) ERO Funding Total ERO Funding $ - $ - $ - Total Funding $ - $ - $ - Expenses Personnel Expenses Salaries Payroll Taxes Employee Benefits Savings & Retirement Total Personnel Expenses $ - $ - $ - 0% Meeting & Travel Expenses Meetings $ 9,136 $ - $ 9, % Staff meetings and team building events not budgeted Travel 8,788 1,358 7, % Travel for job applicants & consultants Total Meeting & Travel Expenses $ 17,925 $ 1,358 $ 16, % Operating Expenses Consultants & Contracts $ 24,692 $ 28,617 $ (3,925) -14% Office Costs 3, , % Professional Services 55,843 20,000 35, % Unbudgeted VP recruiting service Total Operating Expenses $ 83,769 $ 48,897 $ 34,872 71% Indirect Expenses (101,693) (50,255) (51,438) 102% Total Expenses $ - $ - $ - Change in Assets TOTAL BUDGET $ - $ - $ - 0% Change in Working Captial $ - $ - $ - 100% FTE's PAGE 14 OF 17
291 Texas Reliability Entity, Inc Statement of Activities Audited ACCOUNTING and FINANCE Funding 2013 Actual 2013 Budget Variance from Budget Over(Under) Comments (Explain variances > +/- 10% and $10,000) ERO Funding Total ERO Funding $ - $ - $ - Total Funding $ - $ - $ - Expenses Personnel Expenses Salaries $ 254,958 $ 199,554 $ 55,404 28% Additional FTE Payroll Taxes 16,675 18,240 (1,565) -9% Employee Benefits 28,980 27,380 1,600 6% Savings & Retirement 33,684 20,378 13,306 65% Employee contributions increased resulting in the matching retirement being greater than budgeted. Total Personnel Expenses $ 334,296 $ 265,552 $ 68,744 26% Meeting & Travel Expenses Meetings $ 1,135 $ - $ 1,135 Travel 2,200 1, % Total Meeting & Travel Expenses $ 3,335 $ 1,598 $ 1, % Operating Expenses Consultants & Contracts $ 2,850 $ 9,539 $ (6,689) -70% Did not use consultant as budgeted, offset by additional FTE Office Costs 27,019 41,852 (14,833) -35% Property taxes less than budgeted Professional Services 94, ,000 (65,002) -41% Insurance policies were less than anticipated since TRE has shown an excellent experience rating over the past three years Total Operating Expenses $ 124,867 $ 211,391 $ (86,524) -41% Indirect Expenses (462,498) (478,541) 16,043-3% Total Expenses $ - $ (0) $ 0-100% Change in Assets - 0 (0) -100% TOTAL BUDGET $ - $ (0) $ 0-100% Change in Working Captial $ - $ 0 $ (0) -100% FTE's PAGE 15 OF 17
292 Texas Reliability Entity, Inc Statement of Activities Audited STATE (NON-STATUTORY) Funding 2013 Actual 2013 Budget Variance from Budget Over(Under) Comments (Explain variances > +/- 10% and $10,000) ERO Funding Assessments $ - $ - $ - Penalty Sanctions Total ERO Funding $ - $ - $ - PUCT $ 1,029,100 $ 1,029,100 $ - 0% Interest 1,147-1, % Total Funding $ 1,030,247 $ 1,029,100 $ 1,147 0% Expenses Personnel Expenses Salaries $ 530,912 $ 541,553 $ (10,641) -2% Payroll Taxes 36,870 46,376 (9,506) -20% Employee Benefits 62,541 75,164 (12,623) -17% Employee participation in benefits less than anticipated Savings & Retirement 70,331 80,292 (9,961) -12% Employee participation in retirement plan less than anticipated Total Personnel Expenses $ 700,653 $ 743,385 $ (42,732) -6% Meeting & Travel Expenses Meetings $ - $ - $ - Travel 1,015 12,000 (10,985) -92% Travel less than anticipated for Protocol group Conference Expenses Total Meeting & Travel Expenses $ 1,015 $ 12,000 $ (10,985) -92% Operating Expenses Consultants & Contracts $ 3,833 $ 18,130 $ (14,297) -79% Rent & Improvements 36,026-36,026 Rent charged directly, no indirect costs Office Costs 24,438 14,954 9,484 63% Costs charged directly, no indirect costs Professional Services 10,804 16,775 (9,054) -54% Costs charged directly, no indirect costs Depreciation 140, ,219 Costs charged directly, no indirect costs Total Operating Expenses $ 215,319 $ 49,859 $ 165, % Indirect Expenses - 223,856 (223,856) -100% Total Expenses $ 916,988 1,029,100 (112,112) -11% Change in Assets 113, ,260 Fixed Assets Depreciation $ (140,219) $ - $ (140,219) 0% Incr(Dec) in Fixed Assets $ (140,219) $ - $ (140,219) Allocation of Fixed Assets $ - $ - $ - 0% Total Inc(Dec) in Fixed Assets $ (140,219) $ - $ (140,219) 0% TOTAL BUDGET $ 776,769 $ 1,029,100 $ (252,331) -25% Change in Working Captial $ 253,479 $ - $ 253,479 0% FTE's PAGE 16 OF 17


293 Texas Reliability Entity, Inc. Penalty Sanctions For year ended December 31, 2013 Date Rec'd Amount 7/1/10-6/30/11 7/1/11-7/1/12-6/30/13 7/1/13-6/30/14 Year to Recognize 06/30/12 for BP&B Subtotal 2011 $ 1,225, $ 20, $ 20, , $ 198, , , , , , , , , , , , , , , , , , , , , , , , , , , , , , , , , , , , , , , , , , , , , , , , , , , , , , , , , , , , , , , , , , , , , , , , , , , , , , , , , , , , , , , , , /19/2012 1, , /31/2012 9, , /8/ , , /20/2012 8, , /20/ , , /20/ , , /20/ , , /17/ , , /16/2012 7, , /30/2012 7, , /30/ , , /21/ , , /21/ , , /21/ , , /21/2012 6, , Subtotal 2012 $ 447, /30/2013 6, , /28/ , , /28/ , , /8/ , , / , , /10/ , , /4/ , , /4/2013 7, , /10/ , , /10/ , , /3/2013 9, , /6/ , , /1/ , , /1/2013 4, , /1/ , , /1/ , , /1/ , , /19/ , , Subtotal 2013 $ 635, $ 2,308, $ 20, $ 572, $ 832, $ 419, $ 464, Texas RE 2013 Penalties Reconciliation 12/31/ /31/2012 Change in 2013 Total Cumulative Penalties - GAAP/BKD Audit $ 2,308, $ 1,673, $ 635, Total Cumulative Penalties - True Up Report 1,424, , , $ 883, $ 1,080, $ (197,000.00) Texas RE's auditited financial statements include penalties recorded as earned revenue at the time of invoicing, in accordance with GAAP. Texas RE's true up rerporet includes only those penalties included in the approved budgtet for the calendar year, as shown above. PAGE 17 OF 17

294 Texas Reliability Entity, Inc. Auditor s Report and Financial Statements December 31, 2013 and 2012
295 Texas Reliability Entity, Inc. December 31, 2013 and 2012 Contents Independent Auditor s Report... 1 Financial Statements Statements of Financial Position... 3 Statements of Activities... 4 Statements of Cash Flows... 5 Notes to Financial Statements... 6 Other Information Schedule of Statutory and Nonstatutory Operating Activities... 15
296 Independent Auditor s Report Board of Directors Texas Reliability Entity, Inc. Austin, Texas We have audited the accompanying financial statements of Texas Reliability Entity, Inc. (Texas RE), which comprise the statements of financial position as of December 31, 2013 and 2012, and the related statements of activities and cash flows for the years then ended, and the related notes to the financial statements. Management s Responsibility for the Financial Statements Management is responsible for the preparation and fair presentation of these financial statements in accordance with accounting principles generally accepted in the United States of America; this includes the design, implementation and maintenance of internal control relevant to the preparation and fair presentation of financial statements that are free from material misstatement, whether due to fraud or error. Auditor s Responsibility Our responsibility is to express an opinion on these financial statements based on our audits. We conducted our audits in accordance with auditing standards generally accepted in the United States of America. Those standards require that we plan and perform the audit to obtain reasonable assurance about whether the financial statements are free from material misstatement. An audit involves performing procedures to obtain audit evidence about the amounts and disclosures in the financial statements. The procedures selected depend on the auditor s judgment, including the assessment of the risks of material misstatement of the financial statements, whether due to fraud or error. In making those risk assessments, the auditor considers internal control relevant to the entity s preparation and fair presentation of the financial statements in order to design audit procedures that are appropriate in the circumstances, but not for the purpose of expressing an opinion on the effectiveness of the entity s internal control. Accordingly, we express no such opinion. An audit also includes evaluating the appropriateness of accounting policies used and the reasonableness of significant accounting estimates made by management, as well as evaluating the overall presentation of the financial statements. We believe that the audit evidence we have obtained is sufficient and appropriate to provide a basis for our audit opinion.
297 Board of Directors Texas Reliability Entity, Inc. Page 2 Opinion In our opinion, the financial statements referred to above present fairly, in all material respects, the financial position of Texas Reliability Entity, Inc. as of December 31, 2013 and 2012, and the changes in its net assets and its cash flows for the years then ended in accordance with accounting principles generally accepted in the United States of America. Emphasis of Matter As discussed in Note 8 to the financial statements in 2013, the entity has elected to change its method of accounting of fines and penalties in Our opinion is not modified with respect to this matter. Other Information Our audit was conducted for the purpose of forming an opinion on the financial statements as a whole. The Schedule of Statutory and Nonstatutory Operating Activities is presented for purposes of additional analysis and is not a required part of the financial statements. Such information has not been subjected to the auditing procedures applied in the audit of the financial statements, and accordingly, we do not express an opinion or provide any assurance on it. Dallas, Texas April 23, 2014
298 Texas Reliability Entity, Inc. Statements of Financial Position December 31, 2013 and 2012 Assets (Restated - Note 7) Current Assets Cash $ 4,697,098 $ 5,400,125 Assets limited to use cash 887,078 1,083,012 5,584,176 6,483,137 Accounts receivable - 3,766 Other current assets 239, ,910 Total current assets 5,823,316 6,785,813 Property and Equipment, Net 602,903 1,191,777 Total assets $ 6,426,219 $ 7,977,590 Liabilities and Net Assets Current Liabilities Accounts payable $ 154,575 $ 250,812 Accrued liabilities 349, ,789 Deferred rent 181, ,988 Total current liabilities 685,475 1,023,589 Unrestricted Net Assets Undesignated 4,853,666 5,870,989 Regulator designated 887,078 1,083,012 Total unrestricted net assets 5,740,744 6,954,001 Total liabilities and net assets $ 6,426,219 $ 7,977,590 See Notes to Financial Statements 3
299 Texas Reliability Entity, Inc. Statements of Activities Years Ended December 31, 2013 and (Restated - Note 7) Revenues, Gains and Other Support Statutory revenue $ 8,806,770 $ 9,972,718 Protocol revenue 1,029, ,100 Interest income 9,076 15,945 Total revenues, gains and other support 9,844,946 10,987,763 Expenses Salaries and related benefits 8,215,809 7,040,648 Facility and equipment costs 685, ,200 Outside services 854,729 1,421,830 Travel and meetings 359, ,211 Administrative and other 269, ,049 Depreciation 672, ,124 Total expenses 11,058,203 10,517,062 Change in Unrestricted Net Assets (1,213,257) 470,701 Unrestricted Net Assets, Beginning of Year 6,954,001 6,483,300 Unrestricted Net Assets, End of Year $ 5,740,744 $ 6,954,001 See Notes to Financial Statements 4
300 Texas Reliability Entity, Inc. Statements of Cash Flows Years Ended December 31, 2013 and (Restated - Note 7) Operating Activities Change in net assets $ (1,213,257) $ 470,701 Item not requiring cash Depreciation 672, ,124 Changes in Accounts receivable 3,766 (794) Other current assets 59,770 5,922 Accounts payable (96,237) 198,679 Deferred rent (22,548) (14,787) Accrued liabilities (219,329) 43,949 Net cash (used in) provided by operating activities (815,550) 1,472,794 Investing Activities Capital expenditures for property and equipment and systems under development (83,411) (226,682) Net cash used in investing activities (83,411) (226,682) Net (Decrease) Increase in Cash (898,961) 1,246,112 Cash, Beginning of Year 6,483,137 5,237,025 Cash, End of Year $ 5,584,176 $ 6,483,137 See Notes to Financial Statements 5
301 Texas Reliability Entity, Inc. Notes to Financial Statements December 31, 2013 and 2012 Note 1: Organization and Operations Texas Reliability Entity, Inc. (Texas RE) is a Texas nonprofit corporation that is tax exempt under Section 501(c)(3) of the Internal Revenue Code. Texas RE was formed January 1, 2010, to be the Regional Entity for the Electric Reliability Council of Texas, Inc. (ERCOT) region and to preserve and enhance reliability across the ERCOT region by encouraging a culture of compliance among all users, owners and operators of the bulk-power system (BPS). Texas RE, took assignment of all rights, contracts, obligations, assets and liabilities of Texas Regional Entity (which was an independent division of ERCOT, the predecessor Regional Entity), effective midnight on June 30, Texas RE became the Regional Entity for the ERCOT region on July 1, 2010, pursuant to its Amended and Restated Delegation Agreement with North American Electric Reliability Corporation (NERC), which was approved by the Federal Energy Regulatory Commission (FERC) on May 6, The Delegation Agreement with NERC was further amended effective January 1, 2011 and October 7, Texas Regional Entity was the authorized Regional Entity for the ERCOT region from May 2007 through June 30, As Regional Entity, Texas RE proposes and facilitates development of new and modified NERC Reliability Standards and Regional Standards (Standards); monitors, assesses, investigates and enforces compliance by registered entities with Standards in the ERCOT region, and oversees the mitigation of any violations. Texas RE is authorized to impose penalties and sanctions for violations, but NERC and FERC must approve determination of all violations and the imposition of all penalties and sanctions. These Regional Entity activities are referred to herein as statutory activities. The ERCOT region is the geographic area located within the state of Texas that operates under the jurisdiction of the Public Utility Commission of Texas (PUCT) and is not synchronously interconnected with any electric utilities operating outside of Texas. The ERCOT region includes approximately 200,000 square miles and 85% of Texas load. In addition to Texas RE s statutory activities as Regional Entity, Texas RE has a contract with the PUCT and ERCOT to be the Reliability Monitor for the ERCOT region. As Reliability Monitor, Texas RE monitors, investigates and reports to the PUCT regarding compliance with state reliability rules (the reliability-based ERCOT Protocols and Operating Guides), and coordinates and assists PUCT staff with related reliability-related matters. The PUCT is responsible for the enforcement of violations of the state reliability rules. Texas RE s activities under this contract are permitted by NERC and FERC, by Exhibit E to the Delegation Agreement, and these activities are referred to herein as nonstatutory activities. 6
302 Texas Reliability Entity, Inc. Notes to Financial Statements December 31, 2013 and 2012 Membership and Governance Texas RE has the following six membership sectors under its Bylaws: System Coordination and Planning: An entity that is registered with NERC as a Reliability Coordinator (RC), Balancing Authority (BA), Planning Authority (PA), Resource Planner (RP) or Interchange Authority (IA). Transmission and Distribution: An entity that is registered with NERC as a Transmission Owner (TO), Transmission Planner (TP), Transmission Service Provider (TSP), Distribution Provider (DP), and/or Transmission Operator (TOP) and is not a Cooperative or Municipal Utility. Cooperative Utility: An entity that is (a) a corporation organized under Chapter 161 of the Texas Utilities Code or a predecessor statute to Chapter 161 and operating under that chapter; (b) a corporation organized as an electric cooperative in a state other than Texas that has obtained a certificate of authority to conduct affairs in the state of Texas or (c) a cooperative association organized under Tex. Rev. Civ. Stat or a predecessor to that statute and operating under that statute that is registered with NERC for at least one reliability function. Municipal Utility: An entity that owns or controls transmission or distribution facilities, owns or controls dispatchable generating facilities or provides retail electric service and is a municipally owned utility as defined in PURA and is registered with NERC for at least one reliability function. Generation: An entity that is registered with NERC as a Generator Owner (GO) or Generator Operator (GOP). Load-Serving and Marketing: An entity that is registered with NERC as a Load-Serving Entity (LSE), a Purchasing-Selling Entity (PSE) or any newly defined NERC reliability function for demand response. Membership in Texas RE is voluntary and open to any entity that is a user, owner or operator of the ERCOT region BPS and registered with NERC for at least one reliability function. Eligible registered entities must complete and submit a membership application, pay a nominal annual fee, which may be waived for good cause shown and comply with the Texas RE Bylaws. Any person or entity that has a direct and material interest in the BPS has a right to participate in the Texas RE Standards development process, even if not a Texas RE member. Texas RE is governed by a hybrid board of directors (the Board), comprised of the following nine directors: Texas RE President and Chief Executive Officer Four Independent Directors 7
303 Texas Reliability Entity, Inc. Notes to Financial Statements December 31, 2013 and 2012 Two Member Directors (the Chair and Vice-Chair of the Member Representatives Committee) Chair of the PUCT, or another PUCT Commissioner designated by the Chairman, as an ex officio nonvoting member Texas Public Counsel, from the Texas Office of Public Utility Counsel, as an ex officio nonvoting member The Board s primary role is to oversee management of Texas RE, including assuring that Texas RE meets its requirements under the Bylaws and Delegation Agreement, and to elect a Chief Executive Officer to manage and be responsible for the day-to-day ongoing activities of Texas RE. The Board has one subcommittee, the Audit and Governance Committee, which is comprised of the Independent Directors. Texas RE has two stakeholder committees, the Member Representatives Committee (MRC) and the Reliability Standards Committee (RSC). The MRC includes representatives from members in each of the six membership sectors and provides advice and recommendations to the Board on administrative, financial, reliability-related or any other matters, except for standards development issues, through its elected Chair and Vice-Chair, who serve as directors. The RSC includes representatives from the six industry sectors described above, whether or not members of Texas RE and including any entity with a direct and material interest in the ERCOT region BPS. The RSC facilitates the Regional Standards development process, coordinates the development of Regional Standards and variances with the development of national NERC Standards, and monitors, reviews, and comments on Standards under development and Standards interpretation requests. Note 2: Summary of Significant Accounting Policies Use of Estimates The preparation of financial statements in conformity with accounting principles generally accepted in the United States of America requires management to make estimates and assumptions that affect the reported amounts of assets and liabilities and disclosure of contingent assets and liabilities at the date of the financial statements and the reported amounts of revenues, expenses gains, losses and other changes in net assets during the reporting period. Actual results could differ from those estimates. Cash At December 31, 2013, Texas RE s cash accounts exceeded federally insured limits by approximately $5,400,000. Texas RE places its cash with a high quality financial institution, and management believes no significant risks exist with respect to uninsured balances. 8
304 Texas Reliability Entity, Inc. Notes to Financial Statements December 31, 2013 and 2012 Assets Limited to Use As stipulated by NERC policies, Texas RE records fines and penalties that are required to be used in future operations as assets limited to use. Assets limited to use (maintained in a financial institution) was $887,078 and $1,083,012 at December 31, 2013 and 2012, respectively. Revenue Recognition Texas RE funds its statutory operations primarily from assessments NERC collects from load serving entities and pays to Texas RE in four quarterly payments, pursuant to the Delegation Agreement. Four quarterly payments were received by Texas RE, which totaled $8,152,520 and $9,503,866 from NERC during 2013 and 2012, respectively. NERC pays Texas RE at or near the beginning of each quarter. Additionally, Texas RE recognized $19,250 and $21,020 for membership dues and other miscellaneous revenue, and $635,000 and $447,832 from fines and penalties, during 2013 and 2012, respectively. Texas RE did not recognize any revenue from providing workshops in 2013; however, Texas RE recognized $3,330 from providing workshops in All statutory budgeted expenditures for Texas RE are approved by the Texas RE Board when it approves Texas RE s annual business plan and budget. Texas RE funds its nonstatutory operations from revenues paid by ERCOT from its PUCT approved system administration fee, pursuant to the Reliability Monitor Agreement. Texas RE received revenue of $1,029,100 and $999,100 from the Reliability Monitor Agreement in 2013 and 2012, respectively, to cover operating expenses incurred by Texas RE. All nonstatutory budgeted expenditures for Texas RE are approved by the Texas RE Board when it approves Texas RE s annual business plan and budget. Texas RE recognized revenue related to fines and penalties in the period in which they are earned (all appeals have been exhausted). Related Party Transactions Texas RE compensates its independent board directors, which is a common practice in the industry in which Texas RE operates. The authority to compensate its Independent Directors is specified in the Bylaws, which were approved by the Texas RE membership. Texas RE Independent Director compensation (totaling approximately $225,000 during 2013 and $190,000 during 2012) is paid monthly. In addition to their compensation, Texas RE independent board members are reimbursed for their actual expenses incurred related to their duties as a Texas RE board member. 9
305 Texas Reliability Entity, Inc. Notes to Financial Statements December 31, 2013 and 2012 Property and Equipment Property and equipment are stated at cost less accumulated depreciation. Depreciation is charged to expense using the straight-line method over the estimated useful life of each asset. Assets under capital lease obligations and leasehold improvements are depreciated over the shorter of the lease term or their respective estimated useful lives. Repairs and maintenance costs are expensed when incurred. The estimated useful lives for each major depreciable classification of property and equipment are as follows: Equipment Computer hardware Computer software Furniture and fixtures Leasehold improvements 5 years 3 years 5 years 7 years 7.5 years Long-lived Asset Impairment Texas RE evaluates the recoverability of the carrying value of long-lived assets whenever events or circumstances indicate the carrying amount may not be recoverable. If a long-lived asset is tested for recoverability and the undiscounted estimated future cash flows expected to result from the use and eventual disposition of the asset is less than the carrying amount of the asset, the asset cost is adjusted to fair value and an impairment loss is recognized as the amount by which the carrying amount of a long-lived asset exceeds it fair value. No asset impairment was recognized during the years ended December 31, 2013 and Deferred Rent In 2010, Texas RE entered into an operating lease agreement, which contains provisions for future increases in rent payments. In accordance with accounting principles generally accepted in the United States of America, Texas RE records monthly rent expense equal to the total of payments due over the lease term divided by the number of months of the lease term. The difference between rent expense recorded and the amount paid is credited or charged to deferred rent. Income Taxes Texas RE is exempt from income taxes under Section 501 of the Internal Revenue Code and a similar provision of state law. However, Texas RE is subject to federal income tax on any unrelated business taxable income. Texas RE files tax returns in the U.S. federal jurisdiction. With a few exceptions, Texas RE is no longer subject to U.S. federal examinations by tax authorities for years before
306 Texas Reliability Entity, Inc. Notes to Financial Statements December 31, 2013 and 2012 Note 3: Expenses by Functional Classification While the statements of activities presents expenses by natural classification, Texas RE s expenses by functional classification for the years ended December 31 were as follows: Program $ 6,942,188 $ 6,602,467 General and administrative 4,116,015 3,914,595 Total $ 11,058,203 $ 10,517,062 Certain costs have been allocated among the program and general and management categories based on actual use or estimates made by management. Note 4: Property and Equipment Property and equipment at December 31 consists of: Equipment $ 410,886 $ 408,364 Computer hardware 701, ,980 Computer software 1,376,992 1,168,815 Furniture 309, ,512 Leasehold improvement 206, ,521 Work in process 15, ,288 Total property and equipment 3,020,891 2,937,480 Less accumulated depreciation 2,417,988 1,745,703 Total property and equipment, net $ 602,903 $ 1,191,777 11
307 Texas Reliability Entity, Inc. Notes to Financial Statements December 31, 2013 and 2012 Note 5: Line of Credit On January 29, 2013, Texas RE obtained a $500,000 bank line of credit that expires in The line is not collateralized by any of Texas RE s assets and is unsecured. Interest rate varies with LIBOR plus 4.265%. At December 31, 2013, there was $0 borrowed against the line. Note 6: Operating Leases Texas RE leases office space, datacenter space and equipment under noncancellable agreements recorded as operating leases. Operating lease expenditures for the year ended December 31, 2013, were $395,698. The future rental payments due under operating leases are as follows through December 31, 2013: 2014 $ 547, , , , ,000 $ 2,091,583 Note 7: Employee Benefit Plans Texas RE employees are sponsored under the Texas Reliability Entity, Inc. 401(k) Savings Plan (Plan) which is subject to the provisions of the Employee Retirement Income Security Act of The Plan utilizes a third-party administrator to assist in the administration. Employees must be 21 years of age to be eligible to participate. Texas RE matches 75% of the employee s contribution up to 6% of eligible compensation as defined in the plan document. Employees are fully vested for the Texas RE match of 75% after five years. In addition, Texas RE contributes 10% of a participant s eligible compensation as defined in the plan document. Employees are fully vested for the Texas RE contributions of 10% after three years. Employer contributions to the 401(k) plans were $813,224 and $705,777, respectively, in 2013 and
308 Texas Reliability Entity, Inc. Notes to Financial Statements December 31, 2013 and 2012 Note 8: Change in Accounting Principle During 2013, Texas RE changed its method of recognizing fines and penalties revenue from the period they were available to be used in operations to the period in which they were earned (all appeals have been exhausted). This recognition methodology is the preferred method of NERC. As a result of this retrospective change, the 2012 financial statements have been restated as follows: Statement of Financial Position 2013 As Computed Effect of As Originally Effect of Previously As Adjusted Change Reported As Adjusted Change 2012 Cash $ 5,584,176 $ 4,697,098 $ (887,078) $ 6,483,137 $ 5,400,125 $ (1,083,012) Assets limited to use cash - 887, ,078-1,083,012 1,083,012 Deferred revenue 955,837 - (955,837) 1,080,833 - (1,080,833) Total current liabilities 1,641, ,475 (955,837) 2,104,422 1,023,589 (1,080,833) Unrestricted net assets 4,784,907 5,740, ,837 5,873,168 6,954,001 1,080,833 Statement of Activities 2013 As Computed Effect of As Originally Effect of Previously As Adjusted Change Reported As Adjusted Change 2012 Statutory revenue $ 8,931,766 $ 8,806,770 $ 124,996 $ 10,097,716 $ 9,972,718 $ (124,998) Change in unrestricted net assets (1,088,261) (1,213,257) (124,996) 595, ,701 (124,998) Unrestricted net assets, beginning of year 5,873,168 6,954,001 1,080,833 5,277,469 6,483,300 1,205,831 Unrestricted net assets, end of year 4,784,907 5,740, ,837 5,873,168 6,954,001 1,080,833 13
309 Texas Reliability Entity, Inc. Notes to Financial Statements December 31, 2013 and 2012 Statement of Cash Flows 2013 As Computed Effect of As Originally Effect of Previously As Adjusted Change Reported As Adjusted Change 2012 Change in net assets $ (1,088,261) $ (1,213,257) $ (124,996) $ 595,699 $ 470,701 $ (124,998) Decrease in deferred revenue (124,996) - 124,996 (124,998) - 124,998 Net cash (used in) provided by operating activities (815,550) (815,550) - 1,472,794 1,472,794 - Note 9: Subsequent Events Subsequent events have been evaluated through the date of the Independent Auditor s Report, which is the date the financial statements were available to be issued. 14
310 Other Information
311 Texas Reliability Entity, Inc. Schedule of Statutory and Nonstatutory Operating Activities Year Ended December 31, 2013 Statutory Nonstatutory Total Revenues, Gains and Other Support Statutory revenue $ 8,806,770 $ - $ 8,806,770 Protocol revenue - 1,029,100 1,029,100 Interest income 7,929 1,147 9,076 Total revenues, gains and other support 8,814,699 1,030,247 9,844,946 Expenses Salaries and related benefits 7,515, ,653 8,215,809 Facility and equipment costs 649,885 36, ,911 Outside services 840,092 14, ,729 Travel and meetings 358,865 1, ,880 Administrative and other 245,151 24, ,589 Depreciation 532, , ,285 Total expenses 10,141, ,988 11,058,203 Change in Unrestricted Net Assets (1,326,516) 113,259 (1,213,257) Unrestricted Net Assets, Beginning of Year, As Restated 6,284, ,172 6,954,001 Unrestricted Net Assets, End of Year $ 4,958,313 $ 782,431 $ 5,740,744 15
312 ATTACHMENT ACTUAL COST-TO-BUDGET COMPARISON AND 2013 AUDITED FINANCIAL REPORT FOR WESTERN ELECTRICITY COORDINATING COUNCIL

313 Jillian Lessner Director of Finance and Accounting May 9, 2014 Mr. Michael Walker Senior Vice President, Chief Financial and Administrative Officer North American Electric Reliability Corporation 3353 Peachtree Road, N.E. Suite 600, North Tower Atlanta, Georgia RE: 2013 Statement of Activities and Variance Explanations Based on Audited Financials Summary The Western Electricity Coordinating Council s (WECC) audited Statutory total change in working capital for the year ended December 31, 2013 is over budget by $8.46 million with grant activity and $4.50 million over budget without grant activity. The major drivers of WECC s 2013 overrun are related to the bifurcation of the organization, the recommendations of the Reliability Coordination Task Force (RCTF), and timing variances related to the Department of Energy (DOE) grants. A summary of significant overall variances (greater than $10,000 and 10 percent) is described in this document. For significant program area line-item variances, see the detailed statements of activities. WECC substantially completed all of its goals and key deliverables as contained in the 2013 Business Plan and Budget. Allocation of Indirect Costs Administrative Services costs are allocated to program activities based on a full-time equivalent (FTE) ratio that is consistent with NERC s accounting methodology for allocation of overhead. Federal Grants In WECC s 2010 Amended Business Plan and Budget, WECC included revenue and associated costs related to three U.S. Department of Energy grants. FERC determined that the activities performed under the three grants received by WECC qualify as Section 215 activities. The Western Interconnection Synchrophasor Program (WISP) (budgeted in the Situation Awareness program area) increases reliability by, among other things, enhancing the situation awareness of WECC s Reliability Coordinator Offices. This Interconnection-wide Synchrophasor system also enables smart grid functionality such as: Improved integrated system operations. W E S T E R N E L E C T R I C I T Y C O O R D I N A T I N G C O U N C I L W W W. W E C C. B I Z 155 NORTH 400 WEST SUITE 200 SALT LAKE CITY UTAH PH FX
SCHIFF HARDIN LLP A Limited Liability Partnership
 SCHIFF HARDIN LLP A Limited Liability Partnership Owen E. MacBride (312) 258-5680 Email: omacbride@schiffhardin.com 233 SOUTH WACKER DRIVE SUITE 6600 CHICAGO, ILLINOIS 60606 Tel.: 312.258.5500 Fax: 312.258.5700
SCHIFF HARDIN LLP A Limited Liability Partnership
 SCHIFF HARDIN LLP A Limited Liability Partnership Owen E. MacBride (312) 258-5680 Email: omacbride@schiffhardin.com 233 SOUTH WACKER DRIVE SUITE 6600 CHICAGO, ILLINOIS 60606 Tel.: 312.258.5500 Fax: 312.258.5700
SCHIFF HARDIN LLP A Limited Liability Partnership
 SCHIFF HARDIN LLP A Limited Liability Partnership Owen E. MacBride (312) 2585680 Email: omacbride@schiffhardin.com 233 SOUTH WACKER DRIVE SUITE 6600 CHICAGO, ILLINOIS 60606 Tel.: 312.258.5500 Fax: 312.258.5700
November 4, 2013 VIA ELECTRONIC FILING
 November 4, 2013 VIA ELECTRONIC FILING Doreen Friis Regulatory Affairs Officer/Clerk Nova Scotia Utility and Review Board 3 rd Floor 1601 Lower Water Street P.O. Box 1692, Unit âmâ Halifax, Nova Scotia
SCHIFF HARDIN LLP A Limited Liability Partnership
 SCHIFF HARDIN LLP A Limited Liability Partnership Owen E. MacBride (312) 258-5680 Email: omacbride@schiffhardin.com 233 SOUTH WACKER DRIVE SUITE 6600 CHICAGO, ILLINOIS 60606 Tel.: 312.258.5500 Fax: 312.258.5700
BEFORE THE CROWN INVESTMENT CORPORATION OF THE PROVINCE OF SASKATCHEWAN
 BEFORE THE CROWN INVESTMENT CORPORATION OF THE PROVINCE OF SASKATCHEWAN NORTH AMERICAN ELECTRIC ) RELIABILITY CORPORATION ) NOTICE OF FILING OF THE NORTH AMERICAN ELECTRIC RELIABILITY CORPORATION OF ITS
September 8, 2017 VIA ELECTRONIC FILING
 !! September 8, 2017 VIA ELECTRONIC FILING Kirsten Walli, Board Secretary Ontario Energy Board P.O Box 2319 2300 Yonge Street Toronto, Ontario, Canada M4P 1E4 Re: North American Electric Reliability Corporation
September 15, 2016 VIA ELECTRONIC FILING
 !! September 15, 2016 VIA ELECTRONIC FILING Rachelle Verret Morphy Saskatchewan Electric Reliability Authority 2025 Victoria Avenue Regina, Saskatchewan, Canada S4P 0S1 Re: North American Electric Reliability
123 FERC 61,282 UNITED STATES OF AMERICA FEDERAL ENERGY REGULATORY COMMISSION. North American Electric Reliability Corporation
 123 FERC 61,282 UNITED STATES OF AMERICA FEDERAL ENERGY REGULATORY COMMISSION Before Commissioners: Joseph T. Kelliher, Chairman; Suedeen G. Kelly, Marc Spitzer, Philip D. Moeller, and Jon Wellinghoff.
BEFORE THE ONTARIO ENERGY BOARD OF THE PROVINCE OF ONTARIO
 BEFORE THE ONTARIO ENERGY BOARD OF THE PROVINCE OF ONTARIO NORTH AMERICAN ELECTRIC ) RELIABILITY CORPORATION ) NOTICE OF FILING OF THE NORTH AMERICAN ELECTRIC RELIABILITY CORPORATION OF ITS 2012 BUSINESS
SCHIFF HARDIN LLP. December 17, 2010 VIA ELECTRONIC FILING
 SCHIFF HARDIN LLP Owen E. MacBride (312) 2585680 Email: omacbride@schiffhardin.com 233 SOUTH WACKER DRIVE SUITE 6600 CHICAGO, ILLINOIS 60606 Tel.: 312.258.5500 Fax: 312.258.5700 www.schiffhardin.com December
Agenda Conference Call Finance and Audit Committee
 Agenda Conference Call Finance and Audit Committee January 24, 2011 8:309:00 a.m. ET DialIn: 8007058289 (No Code Needed) Introductions and Chair s Remarks NERC Antitrust Compliance Guidelines 1. Texas
June 29, 2016 VIA OVERNIGHT MAIL
 !! June 29, 2016 VIA OVERNIGHT MAIL Doreen Friis Regulatory Affairs Officer/Clerk Nova Scotia Utility and Review Board 3 rd Floor 1601 Lower Water Street P.O. Box 1692, Unit M Halifax, Nova Scotia B3J
133 FERC 61,062 UNITED STATES OF AMERICA FEDERAL ENERGY REGULATORY COMMISSION. North American Electric Reliability Corporation
 133 FERC 61,062 UNITED STATES OF AMERICA FEDERAL ENERGY REGULATORY COMMISSION Before Commissioners: Jon Wellinghoff, Chairman; Marc Spitzer, Philip D. Moeller, John R. Norris, and Cheryl A. LaFleur. North
UNITED STATES OF AMERICA BEFORE THE FEDERAL ENERGY REGULATORY COMMISSION. North American Electric Reliability ) Corporation ) Docket No.
 Corporation ) Docket No.") UNITED STATES OF AMERICA BEFORE THE FEDERAL ENERGY REGULATORY COMMISSION North American Electric Reliability ) Corporation ) Docket No. FA11-21-000 COMPLIANCE FILING OF THE NORTH AMERICAN ELECTRIC RELIABILITY
UNITED STATES OF AMERICA BEFORE THE FEDERAL ENERGY REGULATORY COMMISSION North American Electric Reliability ) Corporation ) Docket No. FA11-21-000 COMPLIANCE FILING OF THE NORTH AMERICAN ELECTRIC RELIABILITY
Total ERO Enterprise 2019 Budgets and Assessments Analysis
 Total ERO Enterprise 2019 Budgets and Assessments Analysis The following includes an overview of the development of the proposed NERC, Regional Entity, and WIRAB 2019 Business Plan and Budgets (BP&Bs)
April 6, 2018 VIA OVERNIGHT MAIL. Sheri Young, Secretary of the Board National Energy Board th Avenue SW Calgary, Alberta T2R 0A8
 !! April 6, 2018 VIA OVERNIGHT MAIL Sheri Young, Secretary of the Board National Energy Board 517 10 th Avenue SW Calgary, Alberta T2R 0A8 Re: North American Electric Reliability Corporation Dear Ms. Young:
Analysis of 2018 Total ERO Enterprise Budget
 Agenda Item 3.b.iii Finance and Audit Committee Meeting August 9, 2017 Analysis of Total ERO Enterprise Total ERO Enterprise and Assessments The proposed budget for the Total ERO Enterprise 1, inclusive
Via . April 28, 2015
 Via Email April 28, 2015 North American Electric Reliability Corporation 3343 Peachtree Road, NE Fourth Floor East Tower Suite 400 Atlanta, Georgia 30326 Attention: Mr. Michael Walker Subject: NPCC True
Via . May 1, 2017
 Via Email May 1, 2017 North American Electric Reliability Corporation 3353 Peachtree Road NE Suite 600, North Tower Atlanta, GA 30326 Attention: Mr. Scott Jones Subject: NPCC True Up Actual vs. Variance
165 FERC 61,023 UNITED STATES OF AMERICA FEDERAL ENERGY REGULATORY COMMISSION. North American Electric Reliability Corporation
 165 FERC 61,023 UNITED STATES OF AMERICA FEDERAL ENERGY REGULATORY COMMISSION Before Commissioners: Cheryl A. LaFleur, Neil Chatterjee, and Richard Glick. North American Electric Reliability Corporation
Agenda Finance and Audit Committee May 9, :30-9:30 a.m. Eastern
 Agenda Finance and Audit Committee May 9, 2018 8:30-9:30 a.m. Eastern The Ritz-Carlton, Pentagon City 1250 S. Hayes Street Arlington, VA 22202 Conference Room: Ritz Carlton Grand Ballroom (2 nd Floor)
westdrift Manhattan Beach, Autograph Collection 1400 Park View Avenue Manhattan Beach, California Conference Room: Loftlight Lobby
 Agenda Finance and Audit Committee February 6, 2019 10:45-11:15 a.m. Pacific (Please note the Schedule may be adjusted real-time should meetings conclude early and/or extend past their scheduled end time.)
Agenda Conference Call Finance and Audit Committee
 Agenda Conference Call Finance and Audit Committee July 19, 2010 2:00-3:00 p.m. EDT Dial-In: 800-672-4749 (No Code Needed) Introductions and Chairman s Remarks NERC Antitrust Compliance Guidelines *1.
Agenda Finance and Audit Committee November 6, :00-9:45 a.m. Eastern
 Agenda Finance and Audit Committee November 6, 2018 9:00-9:45 a.m. Eastern Grand Hyatt Atlanta in Buckhead 3300 Peachtree Rd NE Atlanta, GA 30305 Conference Room: Grand Ballroom Lower Lobby Level Call
Analysis of NERC Compliance Registry & Registration Appeals
 Electric Reliability Organization (ERO) Compliance Analysis Report NERC Compliance Registry and Registration Appeals May 2011 Table of Contents ERO Compliance Analysis Report... 2 Background Information...
161 FERC 61,131 UNITED STATES OF AMERICA FEDERAL ENERGY REGULATORY COMMISSION
 161 FERC 61,131 UNITED STATES OF AMERICA FEDERAL ENERGY REGULATORY COMMISSION Before Commissioners: Neil Chatterjee, Chairman; Cheryl A. LaFleur, and Robert F. Powelson. North American Electric Reliability
December 31, Ms. Kimberly D. Bose Secretary Federal Energy Regulatory Commission 888 First Street, N.E. Washington, D.C.
 December 31, 2012 Ms. Kimberly D. Bose Secretary Federal Energy Regulatory Commission 888 First Street, N.E. Washington, D.C. 20426 Re: NERC Spreadsheet Notice of Penalty FERC Docket No. NP13- -000 Dear
2017 Budget Presentation to MRO Board of Directors
 MIDWEST RELIABILITY ORGANIZATION 2017 Presentation to MRO Board of Directors June 30, 2016 Silvia Parada Mitchell, Finance and Audit Committee Chair Dan Skaar, President and CEO Sue Clarke, VP-Finance
June 27, Ms. Kimberly D. Bose Secretary Federal Energy Regulatory Commission 888 First Street, N.E. Washington, D.C
 June 27, 2013 Ms. Kimberly D. Bose Secretary Federal Energy Regulatory Commission 888 First Street, N.E. Washington, D.C. 20426 Re: NERC Spreadsheet Notice of Penalty FERC Docket No. NP13- -000 Dear Ms.
129 FERC 61,040 UNITED STATES OF AMERICA FEDERAL ENERGY REGULATORY COMMISSION
 129 FERC 61,040 UNITED STATES OF AMERICA FEDERAL ENERGY REGULATORY COMMISSION Before Commissioners: Jon Wellinghoff, Chairman; Marc Spitzer, and Philip D. Moeller. North American Electric Reliability Corporation
UNITED STATES OF AMERICA Before the FEDERAL ENERGY REGULATORY COMMISSION. NORTH AMERICAN ELECTRIC ) RELIABILITY CORPORATION ) Docket No.
 RELIABILITY CORPORATION ) Docket No.") UNITED STATES OF AMERICA Before the FEDERAL ENERGY REGULATORY COMMISSION NORTH AMERICAN ELECTRIC ) RELIABILITY CORPORATION ) Docket No. RR07-16- ) REQUEST OF THE NORTH AMERICAN ELECTRIC RELIABILITY CORPORATION
UNITED STATES OF AMERICA Before the FEDERAL ENERGY REGULATORY COMMISSION NORTH AMERICAN ELECTRIC ) RELIABILITY CORPORATION ) Docket No. RR07-16- ) REQUEST OF THE NORTH AMERICAN ELECTRIC RELIABILITY CORPORATION
December 17, 2013 VIA ELECTRONIC FILING
 December 17, 2013 VIA ELECTRONIC FILING Ellen Desmond Director of Legal Affairs & Administration New Brunswick Energy and Utilities Board P.O. Box 5001 15 Market Square, Suite 1400 Saint John, NB E2L 4Y9
Agenda Finance and Audit Committee February 7, :15-11:00 a.m. Eastern
 Agenda Finance and Audit Committee February 7, 2018 10:15-11:00 a.m. Eastern Hilton Fort Lauderdale Marina 1881 SE 17 th Street Fort Lauderdale, FL 33316 Conference Room: Grand Ballroom (1 st Floor) Call
NERC Unaudited Summary of Results March 31, Finance and Audit Committee Meeting May 4, 2016
 NERC Unaudited Summary of Results March 31, 2016 Finance and Audit Committee Meeting May 4, 2016 First Quarter 2016 Significant Variances NERC was $186k (1.1%) under budget, including CRISP NERC was $407k
2016 Business Plan and Budget. Southwest Power Pool Regional Entity. Preliminary Budget
 2016 Business Plan and Budget Southwest Power Pool Regional Entity Preliminary Budget April 27, 2015 Table of Contents Introduction... 3 Section A 2015 Business Plan... 10 Reliability Standards Program...11
August 31, Ms. Kimberly D. Bose Secretary Federal Energy Regulatory Commission 888 First Street, N.E. Washington, D.C
 August 31, 2011 Ms. Kimberly D. Bose Secretary Federal Energy Regulatory Commission 888 First Street, N.E. Washington, D.C. 20426 Re: NERC Administrative Citation Notice of Penalty FERC Docket No. NP11-
Agenda Finance and Audit Committee Conference Call
 Agenda Finance and Audit Committee Conference Call November 2, 2009 10 a.m. EST Dial-In: 800-940-0570 Introductions and Chairman s Remarks Antitrust Compliance Guidelines *1. Minutes Review and Approve
NERC TPL Standard Overview
 NERC TPL-001-4 Standard Overview Attachment K Quarter 3 Stakeholder s Meeting September 29, 2016 1 Background New NERC TPL Standard 2016 TPL Plan and Status Update 2015 Planning Assessment Results Compliance
2018 Business Plan and Budget Southwest Power Pool Regional Entity. Approved by SPP Regional Entity Trustees
 2018 Business Plan and Budget Southwest Power Pool Regional Entity Approved by SPP Regional Entity Trustees June 30, 2017 Table of Contents Introduction...3 Section A 2018 Business Plan... 10 Reliability
Agenda Finance and Audit Committee Open Conference Call and Webinar May 20, :00-3:30 p.m. Eastern
 Agenda Finance and Audit Committee Open Conference Call and Webinar May 20, 2013 2:00-3:30 p.m. Eastern DIAL-IN: 800-272-6255 Webex Registration Link: https://cc.readytalk.com/r/45l4p1np7adz Broadcast
M RO NERC FAC 2016 Budget Review
 M ID W EST RELIABILITY ORGAN IZ ATION M RO NERC FAC 2016 Review July 22, 2015 Sue Clarke, VP-Finance and Administration Improving RELIABILITY and mitigating RISKS to the Bulk Power System 2016 Overview
ieso Re: NERC 2016 Business Plan and Budget, Draft #1 June 30, 2015
 June 30, 2015 Mr. Michael Walker Senior Vice President and Chief Financial and Administrative Officer North American Electric Reliability Corporation 3353 Peachtree Road NE Suite 600, North Tower Atlanta,
2017 Business Plan and Budget
 2017 Business Plan and Budget Draft 1 May 19, 2016 I Table of Contents About NERC... 1 Overview... 1 Membership and Governance... 1 Scope of Oversight... 2 Statutory and Regulatory Background... 3 Funding...
NERC Summary of Unaudited Results Third Quarter Andy Sharp, Controller Finance and Audit Committee Meeting November 6, 2018
 NERC Summary of Unaudited Results Third Quarter 2018 Andy Sharp, Controller Finance and Audit Committee Meeting November 6, 2018 2018 Third Quarter Results Total funding is on budget Interest income is
2017 Business Plan and Budget. Texas Reliability Entity, Inc. Approved by Texas RE Board of Directors. Date:, 2016
 2017 Business Plan and Texas Reliability Entity, Inc. Approved by Texas RE Board of Directors Date:, 2016 Approved by the Texas RE Board of Directors, 2016 1 Table of Contents Table of Contents... 2 Introduction...
BES Definition Implementation Guidance
 BES Definition Implementation Guidance August 25, 2014 3353 Peachtree Road NE Suite 600, North Tower Atlanta, GA 30326 NERC BES Definition Implementation Guidance June 23, 2014 404-446-2560 www.nerc.com
Compliance Monitoring and Enforcement Program Report
 Compliance Monitoring and Enforcement Program Report Q3 2016 November 1, 2016 NERC Report Title Report Date I Table of Contents Preface... iii Introduction...1 Highlights from Q3 2016...1 Enforcement...1
SERC Reliability Corporation Business Plan and Budget
 SERC Reliability Corporation 3701 Arco Corporate Drive, Suite 300 Charlotte, NC 28273 704.357.7372 Fax 704.357.7914 www.serc1.org SERC Reliability Corporation 2018 Business Plan and Budget FINAL June 28,
APPENDIX 4D TO THE RULES OF PROCEDURE
 APPENDIX 4D TO THE RULES OF PROCEDURE PROCEDURE FOR REQUESTING AND RECEIVING TECHNICAL FEASIBILITY EXCEPTIONS TO NERC CRITICAL INFRASTRUCTURE PROTECTION STANDARDS Effective: July 1, 2016 TABLE OF CONTENTS
May 13, 2016 VIA ELECTRONIC FILING. Veronique Dubois Régie de l'énergie Tour de la Bourse 800, Place Victoria Bureau 255 Montréal, Québec H4Z 1A2
 !! May 13, 2016 VIA ELECTRONIC FILING Veronique Dubois Régie de l'énergie Tour de la Bourse 800, Place Victoria Bureau 255 Montréal, Québec H4Z 1A2 RE: North American Electric Reliability Corporation Dear
APPENDIX 4D TO THE RULES OF PROCEDURE
 APPENDIX 4D TO THE RULES OF PROCEDURE PROCEDURE FOR REQUESTING AND RECEIVING TECHNICAL FEASIBILITY EXCEPTIONS TO NERC CRITICAL INFRASTRUCTURE PROTECTION STANDARDS Effective: April 1, 2016 TABLE OF CONTENTS
2016 Business Plan and Budget
 2016 Business Plan and Budget Draft 1 May 19, 2015 I Table of Contents About NERC... iv Overview... iv Membership and Governance... iv Scope of Oversight... v Statutory and Regulatory Background... vi
Re: Analysis of NERC Standard Process Results, Fourth Quarter 2013 Docket Nos. RR , RR
 VIA ELECTRONIC FILING January 29, 2014 Ms. Kimberly D. Bose Secretary Federal Energy Regulatory Commission 888 First Street, NE Washington, D.C. 20426 Dear Ms. Bose: Re: Analysis of NERC Standard Process
Approved Business Plan and Budget. Florida Reliability Coordinating Council, Inc.
 Approved 2015 Business Plan and Budget Florida Reliability Coordinating Council, Inc. Approved: 6/25/2014 Table of Contents Introduction... 3 Organizational Overview... 3 Membership and Governance... 4
SERC Reliability Corporation Business Plan and Budget
 SERC Reliability Corporation 3701 Arco Corporate Drive, Suite 300 Charlotte, NC 28273 704.357.7372 Fax 704.357.7914 www.serc1.org SERC Reliability Corporation 2018 Business Plan and Budget DRAFT April
UNITED STATES OF AMERICA BEFORE THE FEDERAL ENERGY REGULATORY COMMISSION
 UNITED STATES OF AMERICA BEFORE THE FEDERAL ENERGY REGULATORY COMMISSION NORTH AMERICAN ELECTRIC ) Docket No. RR10-1- RELIABILITY CORPORATION ) Docket No. RR13-3- ANNUAL REPORT OF THE NORTH AMERICAN ELECTRIC
UNITED STATES OF AMERICA BEFORE THE FEDERAL ENERGY REGULATORY COMMISSION ) ) )
 ) )") UNITED STATES OF AMERICA BEFORE THE FEDERAL ENERGY REGULATORY COMMISSION North American Electric Reliability Corporation ) ) ) Docket No. RM13-13-000 INFORMATIONAL FILING OF THE NORTH AMERICAN ELECTRIC
UNITED STATES OF AMERICA BEFORE THE FEDERAL ENERGY REGULATORY COMMISSION North American Electric Reliability Corporation ) ) ) Docket No. RM13-13-000 INFORMATIONAL FILING OF THE NORTH AMERICAN ELECTRIC
DRAFT Business Plan and Budget. Approved by: MRO Board of Directors. Date May 4June 28, 2012
 MIDWEST RELIABILITY ORGANIZATION DRAFT 2013 Business Plan and Budget Approved by: MRO Board of Directors Date May 4June 28, 2012 380 St. Peter Street, Suite 800 Saint Paul, MN 55102 Phone (651) 8551760
May 30, Ms. Kimberly D. Bose Secretary Federal Energy Regulatory Commission 888 First Street, N.E. Washington, DC 20426
 Ms. Kimberly D. Bose Secretary Federal Energy Regulatory Commission 888 First Street, N.E. Washington, DC 20426 Re: NERC Full Notice of Penalty regarding, FERC Docket No. NP12-_-000 Dear Ms. Bose: The
Approved Business Plan and Budget. Florida Reliability Coordinating Council, Inc.
 Approved 2016 Business Plan and Budget Florida Reliability Coordinating Council, Inc. Approved: 6/25/2015 Table of Contents Introduction... 3 Organizational Overview... 3 Membership and Governance... 4
NERC FAC M eeting July 20, 2017
 M ID W EST RELIABILITY ORGAN IZ ATION NERC FAC M eeting July 20, 2017 2018 Business Plan and Budget Approved by the M RO Board of Directors June 2 2, 2017 Sue Clarke, VP of Finance and Administration Improving
Minutes Board of Trustees
 Minutes Board of Trustees Action Without a Meeting September 8, 2008 On September 8, 2008, a majority of the members of the Board of Trustees of the North American Electric Reliability Corporation consented
UNITED STATES OF AMERICA BEFORE THE FEDERAL ENERGY REGULATORY COMMISSION
 UNITED STATES OF AMERICA BEFORE THE FEDERAL ENERGY REGULATORY COMMISSION U.S. Department of Energy, Portsmouth/Paducah Project Office Docket No. RC08-5- REQUEST FOR REHEARING AND CLARIFICATION OF THE NORTH
2017 Business Plan & Budget
 2017 Business Plan & 2017 Overview Approved on June 2, 2016 by ReliabilityFirst Board Total 2017 : $19,908,939 2.8% $541,729 Personnel Expense 3.7% $582,486 Operating and Fixed Asset -1.1% ($ 40,757) Total
FINAL Business Plan and Budget. Florida Reliability Coordinating Council, Inc. Approved by: FRCC Board of Directors
 FINAL 2013 Business Plan and Budget Florida Reliability Coordinating Council, Inc. Approved by: FRCC Board of Directors DATE: June 28, 2012 Table of Contents Introduction... 3 Organizational Overview...
SCENARIO Proposed Business Plan and Budget 2020 Transitional Reliability Coordinator. Peak Reliability
 SCENARIO 1 2019 Proposed Business Plan and Budget 2020 Transitional Reliability Coordinator Peak Reliability Draft: Date: Version 1 June 1, 2018 Table of Contents Introduction... 3 Scenario 1 Status Quo
2019 Business Plan and Budget. Texas Reliability Entity, Inc. Approved by Texas RE Board of Directors
 2019 Business Plan and Budget Texas Reliability Entity, Inc. Approved by Texas RE Board of Directors Date: May 23, 2018 1 Table of Contents Table of Contents... 2 Introduction... 3 Section A Statutory
Compliance Monitoring and Enforcement Program Quarterly Report
 Compliance Monitoring and Enforcement Program Quarterly Report Q2 2018 August 15, 2018 NERC Report Title Report Date I Table of Contents Preface... iii Executive Summary... iv Chapter 1 : CMEP Activities...
2013 Business Plan and Budget
 MIDWEST RELIABILITY ORGANIZATION 2013 Business Plan and Budget Approved by: MRO Board of Directors Date June 28, 2012 380 St. Peter Street, Suite 800 Saint Paul, MN 55102 Phone (651) 8551760 Fax (651)
March 16, 2009 TO: INDUSTRY STAKEHOLDERS. Ladies and Gentlemen:
 March 16, 2009 TO: INDUSTRY STAKEHOLDERS Ladies and Gentlemen: REQUEST FOR COMMENTS ON PROPOSED PROCEDURE FOR REQUESTING AND RECEIVING TECHNICAL FEASIBILITY EXCEPTIONS TO NERC CRITICAL INFRASTRUCTURE PROTECTION
First Draft 2015 Business Plan and Budget May 16, 2014
 First Draft 2015 Business Plan and Budget May 16, 2014 1 Table of Contents Table of Contents Table of Contents... 2 About NERC... 4 Overview... 4 Membership and Governance... 5 Scope of Oversight... 5
UNITED STATES OF AMERICA BEFORE THE FEDERAL ENERGY REGULATORY COMMISSION. North American Electric Reliability ) Docket No. RC Corporation )
 Docket No. RC Corporation )") UNITED STATES OF AMERICA BEFORE THE FEDERAL ENERGY REGULATORY COMMISSION North American Electric Reliability ) Docket No. RC11-6-000 Corporation ) NORTH AMERICAN ELECTRIC RELIABILITY CORPORATION S ANNUAL
UNITED STATES OF AMERICA BEFORE THE FEDERAL ENERGY REGULATORY COMMISSION North American Electric Reliability ) Docket No. RC11-6-000 Corporation ) NORTH AMERICAN ELECTRIC RELIABILITY CORPORATION S ANNUAL
2019 Business Plan and Budget. Western Electricity Coordinating Council. Approved by: WECC Board of Directors Date: June XX, 2018
 2019 Business Plan and Budget Western Electricity Coordinating Council Approved by: WECC Board of Directors Date: June XX, 2018 155 North 400 West, Suite 200 Salt Lake City, Utah 84103-1114 Table of Contents
Cyber Security Risk Information Sharing Program (CRISP) Overview, Budget Projection and Proposed Funding Allocation
 Overview, Budget Projection and Proposed Funding Allocation") Cyber Security Risk Information Sharing Program (CRISP) Overview, Budget Projection and Proposed Funding Allocation Introduction and Executive Summary This document provides additional background on CRISP,
Cyber Security Risk Information Sharing Program (CRISP) Overview, Budget Projection and Proposed Funding Allocation Introduction and Executive Summary This document provides additional background on CRISP,
Northeast Power Coordinating Council, Inc. (NPCC) 2017 Business Plan and Budget
 2017 Business Plan and Budget") Northeast Power Coordinating Council, Inc. (NPCC) 2017 Business Plan and Budget Draft 1 Submitted to NERC April 28, 2016 Table of Contents Introduction... 3 Personnel Analysis... 12 Section A 2017 Regional
Northeast Power Coordinating Council, Inc. (NPCC) 2017 Business Plan and Budget Draft 1 Submitted to NERC April 28, 2016 Table of Contents Introduction... 3 Personnel Analysis... 12 Section A 2017 Regional
2015 BUSINESS PLAN AND BUDGET FINAL VERSION
 2015 BUSINESS PLAN AND BUDGET FINAL VERSION Approved by ReliabilityFirst Board of Directors JUNE 25, 2014 Table of Contents About ReliabilityFirst... 4 Organizational Overview... 4 Membership and Governance...
2017 Business Plan and Budget
 2017 Business Plan and Western Electricity Coordinating Council Approved by: WECC Board of Directors Date: June XX, 2016 155 North 400 West, Suite 200 Salt Lake City, Utah 84103 1114 Table of Contents
2016 Business Plan and Budget. Texas Reliability Entity, Inc. Approved by Texas RE Board of Directors. Date: May 21, 2015
 2016 Business Plan and Texas Reliability Entity, Inc. Approved by Texas RE Board of Directors Date: May 21, 2015 1 Table of Contents Table of Contents... 2 Introduction... 3 Section A 2016 Business Plan
Northeast Power Coordinating Council, Inc. Financial Statements December 31, 2017 and 2016
 Northeast Power Coordinating Council, Inc. Financial Statements Index Page(s) Independent Auditor s Report... 1 Financial Statements Statements of Financial Position... 2 Statements of Activities... 3
SERC Reliability Corporation Business Plan and Budget
 SERC Reliability Corporation 3701 Arco Corporate Drive, Suite 300 Charlotte, NC 28273 704.357.7372 Fax 704.357.7914 www.serc1.org SERC Reliability Corporation 2016 Business Plan and Budget DRAFT 1.0 April,
Northeast Power Coordinating Council, Inc. Financial Statements December 31, 2015 and 2014
 Northeast Power Coordinating Council, Inc. Financial Statements Index Page(s) Report of Independent Auditors... 1 Financial Statements Statements of Financial Position... 2 Statements of Activities...
January 31, Ms. Kimberly Bose Secretary Federal Energy Regulatory Commission 888 First Street, N.E. Washington, DC 20426
 January 31, 2011 Ms. Kimberly Bose Secretary Federal Energy Regulatory Commission 888 First Street, N.E. Washington, DC 20426 Re: NERC Abbreviated Notice of Penalty regarding Sharyland Utilities, LP, as
2015 Business Plan and Budget Draft 1.0. Approved by: MRO Board of Directors. Date: May 16, 2014
 Midwest Reliability Organization 2015 Business Plan and Budget Draft 1.0 Approved by: MRO Board of Directors Date: May 16, 2014 380 St. Peter Street, Suite 800 Saint Paul, MN 55102 Phone (651) 8551760
May 31, 2016 VIA ELECTRONIC FILING. Ms. Kimberly D. Bose Secretary Federal Energy Regulatory Commission 888 First Street, N.E. Washington, DC 20426
 May 31, 2016 VIA ELECTRONIC FILING Ms. Kimberly D. Bose Secretary Federal Energy Regulatory Commission 888 First Street, N.E. Washington, DC 20426 Re: NERC Full Notice of Penalty regarding Florida Power
BEFORE THE RÉGIE DE L'ÉNERGIE THE PROVINCE OF QUÉBEC
 BEFORE THE RÉGIE DE L'ÉNERGIE THE PROVINCE OF QUÉBEC NORTH AMERICAN ELECTRIC ) RELIABILITY CORPORATION ) NOTICE OF FILING OF THE NORTH AMERICAN ELECTRIC RELIABILITY CORPORATION OF RETIREMENT OF REQUIREMENTS
2018 Business Plan and Budget
 2018 Business Plan and Western Electricity Coordinating Council Approved by: WECC Board of Directors Date: June XX, 2017 155 North 400 West, Suite 200 Salt Lake City, Utah 84103-1114 Table of Contents
BES Frequently Asked Questions
 BES Frequently Asked Questions Version 1.6 February 25, 2015 3353 Peachtree Road NE Suite 600, North Tower Atlanta, GA 30326 404-446 - 2560 www.nerc.com Table of Contents Preface... iii 1. Version History...
March 7, The Honorable Kimberly D. Bose Secretary Federal Energy Regulatory Commission 888 First Street, NE Washington, DC 20426
 California Independent System Operator Corporation The Honorable Kimberly D. Bose Secretary Federal Energy Regulatory Commission 888 First Street, NE Washington, DC 20426 March 7, 2012 Re: California Independent
2019 & 2020 Proposed Business Plan and Budget Wind Down. Peak Reliability
 2019 & 2020 Proposed Business Plan and Budget Wind Down Peak Reliability Draft: Date: Board Approval Draft September 4, 2018 Table of Contents Introduction... 3 2019 & 2020 Business Plan and Budget Wind
2014 Business Plan and Budget. Texas Reliability Entity, Inc. Approved by Texas RE Board of Directors
 2014 Business Plan and Budget Texas Reliability Entity, Inc. Approved by Texas RE Board of Directors Date: June 14, 2013 Table of Contents Introduction... 3 Section A 2014 Business Plan...12 Reliability
November 30, Ms. Kimberly D. Bose Secretary Federal Energy Regulatory Commission 888 First Street, N.E. Washington, D.C.
 November 30, 2012 Ms. Kimberly D. Bose Secretary Federal Energy Regulatory Commission 888 First Street, N.E. Washington, D.C. 20426 Re: NERC Spreadsheet Notice of Penalty FERC Docket No. NP13- -000 Dear
NORTHEAST POWER COORDINATING COUNCIL, INC. Financial Statements (Together with Accountants Compilation Report)
") NORTHEAST POWER COORDINATING COUNCIL, INC. Financial Statements (Together with Accountants Compilation Report) Nine Months Ended September 30, 2016 NORTHEAST POWER COORDINATING COUNCIL, INC. CONTENTS FOR
NORTHEAST POWER COORDINATING COUNCIL, INC. Financial Statements (Together with Accountants Compilation Report) Nine Months Ended September 30, 2016 NORTHEAST POWER COORDINATING COUNCIL, INC. CONTENTS FOR
Entergy Services, Inc., Docket No. ER Informational Filing of Annual Transmission Formula Rate Update
 Entergy Services, Inc. 101 Constitution Ave., N.W. Suite 200 East Washington, DC 20001 Tel: 202 530 7323 Fax: 202 530 7350 E-mail: mgriffe@entergy.com Michael C. Griffen Assistant General Counsel Federal
2018 Business Plan and Budget Supplemental Information May 1, 2017
 2018 Business Plan and Budget Supplemental Information May 1, 2017 Today we posted our 2018 Business Plan and Budget (BP&B) for stakeholder comment. WECC staff had productive dialogue with the members
GridLiance West Transco LLC Docket No. ES Amendment to Application Under Section 204 of the Federal Power Act
 January 12, 2017 VIA ELECTRONIC FILING Kimberly D. Bose Secretary Federal Energy Regulatory Commission 888 First Street, NE Washington, DC 20426 Re: GridLiance West Transco LLC Docket No. ES17-9-000 Amendment
American Electric Power Service Corporation Docket No. ER10- -
 American Electric Power 801 Pennsylvania Avenue N.W. Suite 320 Washington, DC 20004 AEP.com May 3, 2010 Honorable Kimberly D. Bose Secretary Federal Energy Regulatory Commission 888 First Street, N.E.
Draft 1. Jen Kelly Director of Finance & HR
 2014 Business Plan and Budget Draft 1 Jen Kelly Director of Finance & HR 1 2014 Budget Overview 2 Increase in penalty sanctions ($915,500 vs. $51,000) Staffing Addition of.88 FTEs compared to 2013 budget
Please contact the undersigned if you have any questions concerning this filing.
 !! November 17, 2016 VIA ELECTRONIC FILING Ms. Katie Mitchell Chief Clerk New Brunswick Energy and Utilities Board P.O. Box 5001 15 Market Square, Suite 1400 Saint John, NB E2L 4Y9 Re: North American Electric
NERC Abbreviated Notice of Penalty regarding Sierra Pacific Power Company, FERC Docket No. NP
 January 31, 2011 Ms. Kimberly Bose Secretary Federal Energy Regulatory Commission 888 First Street, N.E. Washington, DC 20426 Re: NERC Abbreviated Notice of Penalty regarding Sierra Pacific Power Company,