Introduction: Redistribution, Growth and Welfare
|
|
|
- Theodore Pope
- 5 years ago
- Views:
Transcription
1 Introduction: Redistribution, Growth and Welfare EC307 ECONOMIC DEVELOPMENT Dr. Kumar Aniket University of Cambridge & LSE Summer School Lecture 1 created on June 6, 2010
2 READINGS Tables and figures in this lecture are taken from: Chapters 1 & 2 of Ray (1998) Basu, K. and Maertens, A. (2007). The pattern and causes of economic growth in India. Oxford Review of Economic Policy, 23: Collier, P. and Gunning, J. (1999). Why Has Africa Grown Slowly? Journal of Economic Perspectives, 13:2, Summer. pp Banerjee, A.V. and Duflo, E. (2007). The Economic Lives of the Poor. The Journal of Economic Perspectives. 21(1): Class based on Besley, T. and Burgess, R. (2003). Halving Global Poverty. The Journal of Economic Perspectives, 17(3):3 22.
3 INTRODUCTION This course will give you a comprehensive overview of the field of development economics Framework: Understand how tools of economic public policy can be used to improve economic performance and social welfare in low income countries We will focus on the key areas of public policy debate
4 THE ECONOMIC LIVES OF THE POOR Based on household surveys conducted in 13 countries The poor were identified as those living in households with consumption per capita less that $1.08 per person per day and well as merely poor, those living under $2.16.
5 PATTERNS Typical poor family tends to be large with 6 to 12 family members Young to Old ratio within families high between 3 and 9 Food represents 1 2 to 3 4 of total consumption Poorest spend 1 2 of a marginal dollar to get more calories and 1 2 to purchase more expensive calories
6 LAND Land ownership varies tremendously across the world Apart from land, the poor own very few other assets many operate their own businesses without any productive assets capital constraint Land reforms Financial instruments
7 HEALTH The pattern is a remarkably high level of morbidity While the poor certainly feel poor, their levels of self-reported hapiness or self reported health levels are not particularly low Banerjee, Duflo & Deaton (2004) Health Policy
8 EDUCATION Low level of household expenditure on education Children from poor household normally attend non-fee charging schools, which often tend to be dysfunctional Education Policy absent teachers and incentives to attract able teachers infrastructure within school and around the school Teacher absenteeism tends to be low in schools easily accessible by roads
9 ENTREPRENEURSHIP Substantial fraction of poor acts as entrepreneurs raise capital, invest, are full residual claimant of earnings Pattern of multiple occupation agriculture is often not the only occupation diversify risks lack of specialisation has costs businesses run on small scale Temporary migration for work is common though permanent migration is not
10 SAVINGS AND CREDIT High proportion have loans from informal source but very few have loans from formal institution credit from informal source is expensive high interest rate reflect the cost of screening, monitoring, and enforcement and not the cost of default delay in repayment is frequent, default is rare Lack of saving instruments participation in semi-formal saving institutions not as common as expected Financial Market Intervention
11 INSURANCE Lack of formal and informal insurance from the social networks. Informal insurance has a limited ability to protect households from risks consumption of household strongly affected by variation in their own income Townsend (1994) shows limited informal insurance in Indian Villages Availability of physical infrastructure varies quite a lot Access to public goods or infrastructure greater for the urban than rural poor Cost of essentials vary a lot between areas Components of an effective Welfare State
12 ECONOMIC GROWTH Is there some action a government of India could take that would lead the Indian economy to grow like Indonesia s or Egypt s? If so, what exactly? If not, what is it about the nature of India that makes it so? The consequences for human welfare involved in questions like these are simply staggering. Once starts to think about them, it is hard to think about anything else. - Robert E. Lucas (1985)
13 BOTTOM BILLION... there is a group of countries at the bottom that are falling behind, and often falling apart... countries at the bottom exist with the 21st century, but their reality is the fourteenth century: civil war, plague, ignorance. They are concentrated in Africa and Central Asia, with a scattering elsewhere. Paul Collier (2007)
14 AGGREGATE PRODUCTION FUNCTION Aggregate Production Function: Y t = A t Kt α H β t L(1 α β) t Y ( ) α ( t Kt Ht = A t L t L t L t ) β Output Y t at time period t depends on K t capital, H t the human capital L t labour A t technology and other residual things
15 AGGREGATE PRODUCTION FUNCTION Aggregate Production Function: Y t = A t Kt α H β t L(1 α β) t Y ( ) α ( t Kt Ht = A t L t L t L t ) β where A t is the technology, K t the capital, H t the human capital and L t the labour at time period t. Aggregate production function suggests that ) Δ( Yt L t differences in per capita income across countries are due the following differences ΔK t capital stocks (includes public capital) ΔH t human capital stocks ΔA t difference in technology Almost impossible to measure stocks accurately, but national accounts try to do so.
16 K t Capital stock: the total stock of capital used in production of goods and services in the economy L t Labour force: all the workers matched with capital in the economy H t Human Capital stock: Education and skill level of the workforce A t Technology: reduced form representative of everything that leads to differences between economies that cannot be explained by differences in stocks of K, L and H. Includes efficiency of resource allocation institutions government
17 ALGEBRA OF GROWTH RATES Example. If k, m and n are linked in the following way ( ) mt θ k t = B nλ t l ψ their growth rates would be ( ) ( ) ( ) ( ) Δk Δmt Δnt Δlt = θ + λ ψ k m t n t l t g k = θg m + λg n ψg l If variable multiplied, growth rates get added up Powers become coefficient Constant disappear
18 GROWTH RATE OF THE RESIDUAL Since technology is the least well measured, it is often treated as the residual component in growth, i.e., the component which does not come from growth in K t, H t and L t. [ ] [ ] [ ] [ ] [ ] ΔAt ΔYt ΔKt ΔHt ΔLt = α β (1 α β) A t Y t K t H t L t g A = g Y αg K βg H (1 α β)g L g A Solow residual: measures productivity growth in the economy (or a sector of the economy)
19 INCOME PER-CAPITA GDP per capita (constant 1995 USD) Growth * East Asia & Pacific % OECD 9,944 19,666 29, % Latin America & Caribbean 1,985 3,525 3, % Middle East & North Africa.. 2,072 2, % South Asia % Sub-Saharan Africa % * Average annual growth rate ( for ME&NA) Source: World Development Indicators
20 POVERTY Many ways of measuring poverty. One of the most common way is to study the proportion of the population with incomes below a particular poverty line z P = #(i : y i z) (total population) The objective of the Millennium Development Goals (based on a $1 day poverty line) is to halve the proportion of people living below $1 a day from around 30% (of the developing world s population) in 1990 to 15% by 2015.
21 GALAPAGOS ECOSYSTEM Near the end of The Origin of Species, Charles Darwin wrote, reflecting on the Galapagos Islands: [The plants and animals of the Galapagos differ radically among islands that have] the same geological nature, the same height, climate, etc... This long appeared to me a great difficulty, but it arises in chief part from the deeply seated error of considering the physical condition of a country as the most important for its inhabitants; whereas it cannot, I think, be disputed that the nature of the other inhabitants, with which each has to compete, is at least as important, and generally a far more important element of success. (Darwin [1859] 1993: 540)
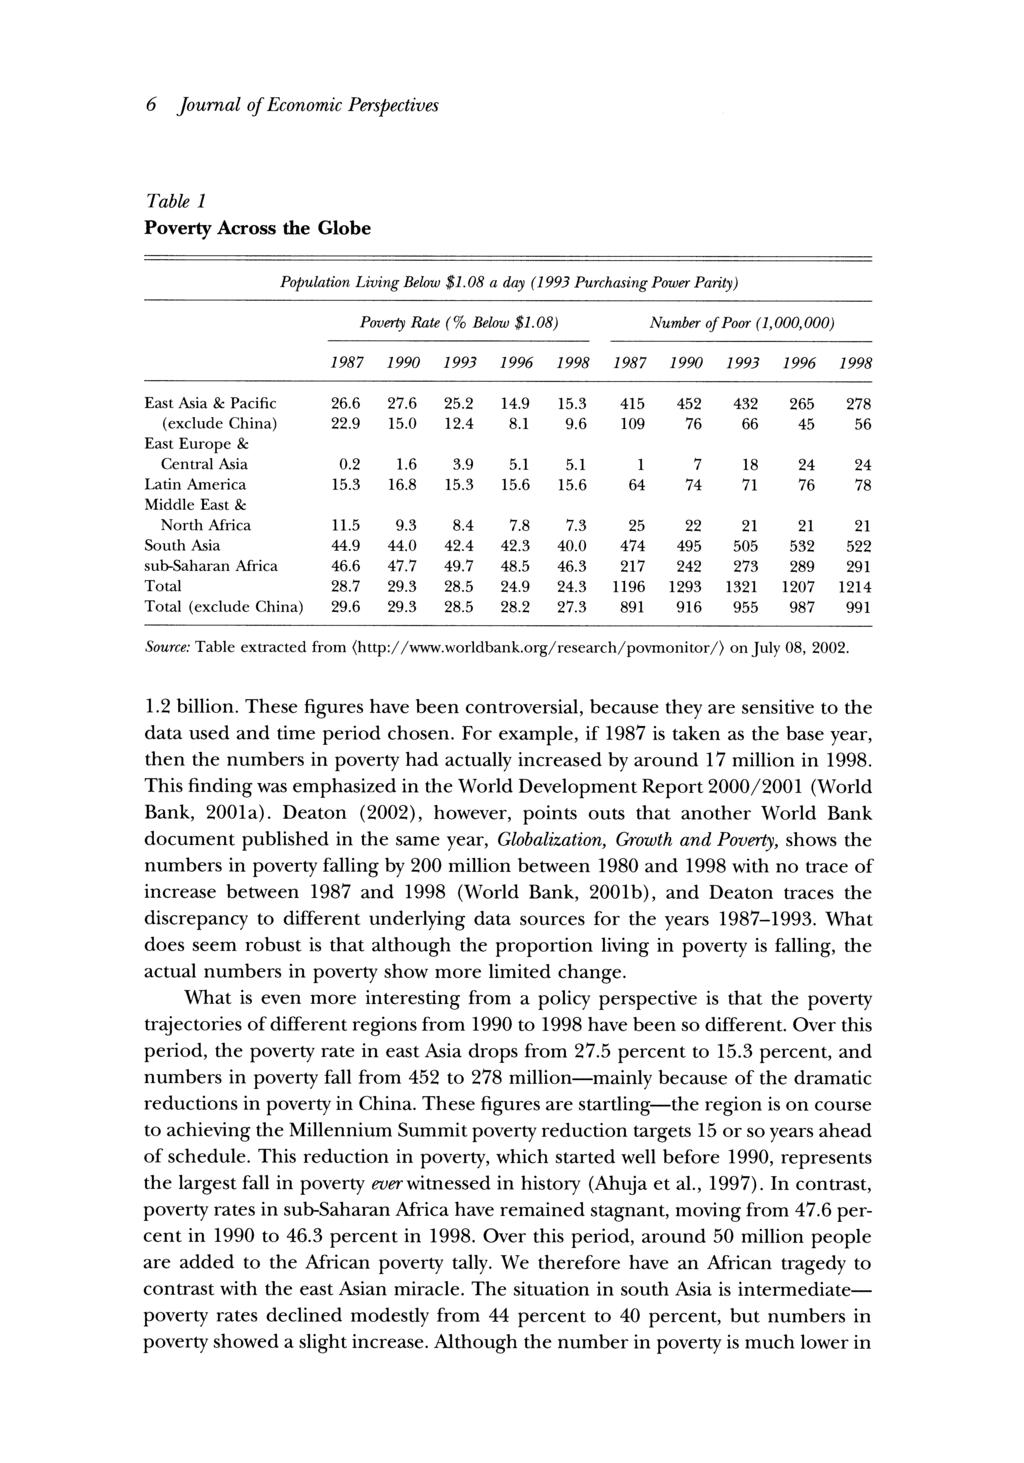
22 HALVING GLOBAL POVERTY Where do the Poor Live? See Table 1: Poverty around the World Main concentrations of the poor are in Sub-Saharan Africa, East Asia and South Asia : East Asia s poverty rate from 27.58% to 15.32% (44% )... absolute numbers from 452 to 278 (38% ) million... China has made significant strides in reducing poverty - Impressive the region has come close to halving the proportion in poverty over 8 years 15 years ahead of schedule they represent the largest fall in poverty ever witnessed in history and have led to referred to a miracle taking place in East Asia.
23
24 SUB-SAHARAN AFRICA ( ) Completely different - Poverty rates remained stagnant 47.67% to 46.30% - Absolute numbers in poverty increased from 242 to 291 million No sense in which sub-saharan Africa is on route to achieving the Millennium Poverty Reduction Goals - if anything it is threatening to go in the opposite direction This African tragedy stands in stark contrast with the East Asian miracle.
25 SOUTH ASIA ( ) In between East Asia s and sub-saharan Africa s situation - Poverty rates from 44.01% to 39.99% Absolute numbers in poverty from 495 to 522 million - Between 1990 and 1998, the proportion of world s poor living in South Asia and sub-saharan Africa has from 57% to 67% whereas the proportion living in East Asia has from 35% to 23% based on this evidence, South Asia, which has the largest concentration of poor people, cannot be deemed to be on track in terms of halving the proportion in poverty by 2015
26 Poverty varies strongly over space and time (Table 1) - suggests that the factors which affect poverty are also time & space varying. - This pattern is difficult to square with some fixed effect argument, whether this has to do with resource endowments, disease burden, geography or societal norms. Political and social factors are clearly at work - these institutional factors affect not only the rate of capital accumulation but also the willingness and power to redistribute towards the poor. - The divergent trends, for example, in East Asia and sub-saharan Africa, are a function of the policy and institutional reforms implemented in the countries that make up those regions.
27 Role of modern economics is to identify the policy and the institutional reforms that are capable of attacking poverty Or put differently, as the argument cuts both ways, we want to identify policy and institutional choices that keep countries or regions poor. Backwardness and poverty do not have to be taken as a fact of life. There is real scope to confront them and over reasonable time periods. Period of huge potential - major role for economic policy analysis
28 POVERTY &GROWTH Are the millennium development goals achievable? Run a regression of the form: where logp it = θ i + η log µ it + ε it P it is the head-count poverty rate for country i at time t based on the $1 a day poverty line θ i is a country i s fixed effect µ it is the country i s real per-capita national income at time t ε it is the error term η is the elasticity of poverty with respect to income per capita η = % change in P % change in µ (1)
29 on track not on track higher growth rate leads to poverty reduction but growth rates required for MDG are large relative to historical
30 REDISTRIBUTION AND POVERTY We can examine how inequality affects poverty to get a handle on whether redistribution might be a route for reducing poverty Run a regression of the form: where logp it = θ i + η log µ it + βσ it + ε it σ it is income inequality for country i at time t measured by the standard deviation of the income distribution in logs β turns out to be positive and significant. (See Table 3: Inequality and Poverty Reduction) reducing inequality can reduce poverty
31 2.77*0.24= *0.11= *0.11= *0.16= *0.12= *0.06= *0.22=0.62
32 Acemoglu eet. al (2001)
33 GROWTH, POVERTY AND INEQUALITY IN INDIA Data for 16 main states of India over the period these 16 states account for over 95% of Indian population Suggestions that states that experienced greater structural transformation and economic growth experience more rapid reductions in poverty real agricultural output per capita relatively flat over period growth in agricultural output basically keeps track with growth in population
34 GROWTH, POVERTY AND INEQUALITY IN INDIA real non-agricultural output per capita begins to diverge from agricultural output around mid-1970s but pattern highly varied across states Assam, Bihar, Jammu and Kashmir, Madhya Pradesh, Orissa, Rajasthan, Uttar Pradesh had limited structural change and economic growth, they are backward states with poor economic and social indicators Andhra Pradesh, Gujarat, Haryana, Karnataka, Kerala, Maharashtra, Punjab, Tamil Nadu, West Bengal - they are modern states with good economic and social indicators pattern even more marked when we look registered and unregistered manufacturing and services sector.
35 Rural poverty Urban poverty Andhra Pradesh Assam Bihar Gujarat Haryana Jammu & Kashmir Karnataka Kerala 90 Poverty headcount Madhya Pradesh Maharashtra Orissa Punjab Rajasthan Tamil Nadu Uttar Pradesh West Bengal year Figure 5: Poverty in Indian states:
36 Non-agricultural output Agricultural output Andhra Pradesh Assam Bihar Gujarat Haryana Jammu & Kashmir Karnataka Kerala Real GDP per capita Madhya Pradesh Maharashtra Orissa Punjab 0 Rajasthan Tamil Nadu Uttar Pradesh West Bengal year Figure 6: Output in Indian states:
37 Secondary sector output Tertiary sector output Andhra Pradesh Assam Bihar Gujarat Haryana Jammu & Kashmir Karnataka Kerala Real GDP per capita Madhya Pradesh Maharashtra Orissa Punjab 50 Rajasthan Tamil Nadu Uttar Pradesh West Bengal year Figure 7: Non-agricultural output in Indian states:
38 Registered manufacturing output Unregistered manufacturing outp Andhra Pradesh Assam Bihar Gujarat Haryana Jammu & Kashmir Karnataka Kerala Real GDP per capita Madhya Pradesh Maharashtra Orissa Punjab 0 Rajasthan Tamil Nadu Uttar Pradesh West Bengal year Figure 8: Manufacturing output in Indian states:
39 Rural inequality Urban inequality Andhra Pradesh Assam Bihar Gujarat Haryana Jammu & Kashmir Karnataka Kerala 45 Gini coefficient Madhya Pradesh Maharashtra Orissa Punjab Rajasthan Tamil Nadu Uttar Pradesh West Bengal year Figure 9: Inequality in Indian states:
40 Table 9: Poverty-growth regressions for aggregate India ( ) Dependent variable: log of poverty headcount (1) (2) (3) (4) (5) (6) log real GDP per capita [0.059]** [0.063]** [0.063]** [0.193]** diversification (non-ag GDP/ag GDP) [0.0017]** [0.0017]** standard deviation of log income [0.148] [0.144] [2.373] log real GDP per capita* std deviation of log income [0.345] constant, state, year fixed effects YES YES YES YES YES YES Number of observations R-squared Notes: Robust standard errors are in parentheses. * significant at 5% level; ** significant at 1% level.
41 SOME INTERESTING CORRELATIONS in poverty associated with in income structural change as proxied by share of non-agricultural output in total output non-agricultural output limited relationship with agricultural output uncorrelated with inequality... but some evidence that lower inequality heightens the poverty impact of economic growth rural poverty inversely correlated with unregistered manufacturing and services urban poverty inversely correlated with registered manufacturing
42 COMPARATIVE POVERTY REDUCTION EXPERIENCES Examine the link between poverty and income per capita in different Indian states - by describing the data using 16 time series regressions of the form: p st = α s + β s y st + ε st where p st = log of poverty head count; y st = log of income per capita. the explained component of poverty reduction between any two time periods is: Δˆp st = β s g s = β s Δy s where the coefficient β s represents the efficiency of poverty reduction due to economic growth within states. We find that it varies a fair bit across states.
43 DECOMPOSING REDUCTIONS IN POVERTY When we look at the comparative poverty performance across the states, we can use the following decomposition: Δˆp st = β s g s = β ( ) ḡ + ˆβ β g s + β s (g s ḡ) Thus, we have β ḡ : the average reduction ( ˆβs β ) g s : the effect of β s deviation from its mean β s (g s ḡ): the effect associated with deviation of growth rate from its mean β s g s β ( ) ḡ = ˆβ β g s + β s (g s ḡ)
44 Table 11: Classification of states according to total poverty elasticity and growth components (+) High growth (-) Low growth (+) High poverty elasticity (-) Low poverty elasticity
45 Table 10: Poverty and growth by Indian state ( ) Coefficients from regression of: poverty on GDP poverty on inequality State (1) (2) (3) (4) (5) Andhra Pradesh -0.75** Assam -0.42** ** Bihar -0.33** Gujarat -0.63** * Haryana -0.6** ** Jammu & Kashmir -0.57** Karnataka -0.48** Kerala -1.16** Madhya Pradesh -0.39** * Maharashtra -0.4** Orissa -0.69** Punjab -1.07** ** Rajasthan -0.39** Tamil Nadu -0.58** Uttar Pradesh -0.64** West Bengal -1.13** Average Notes: All regressions include state and year fixed effects. Significance levels obtained using robust standard errors, where * indicates significance at the 5% level, and ** significance at 1% level. Elements in columns (3) and (4) have been divided through by the average amount of poverty reduction, or by.
46 Table 12. Total poverty-growth elasticity by productive sector
47 1. HUMAN CAPITAL Developed & developing countries each additional year of schooling is associated with a 6 10 % increase in earnings (Duflo, 2001) investment in education can be used to attack poverty both by encouraging economic growth and being a method of redistributing to the poor But how can education be expanded? Merely increasing the school budget is not enough. Effective delivery mechanisms have to be found. The poorer the area, more difficult to deliver education
48 1. HUMAN CAPITAL Expanding Education Policy redesign: randomised experiments in Western Kenya look at whether increasing the supply of textbooks or improving child health affects attendance and attainment in NGO run schools (Glewwe, Kremer and Moulin, 2000; Kremer and Miguel, 2002) Reorganization of how policy is delivered: public schooling, for example, may require a variety of monitors and competitors including different levels of government, community and NGOs and private sector in order to be accountable and effective (Reinikka and Svensson, 2002; Hsieh and Urquiola, 2002)
49 2. FINANCE Poor often do not have access to financial services provided by formal financial institutions. Access to financial services (credit and saving opportunities) central to expanding productive opportunities A central concern in this literature is whether changes in institutional design can overcome the problems of elite and political capture which have plagued formal credit.
50 2. FINANCE Need to examine whether changing the way that formal and informal institutions work can affect outcomes for the poor. Formal Credit: Burgess and Pande (2004) social banking experiment in India licensing rules were used to force commercial banks to open over 30,000 branches in rural areas reductions rural poverty Informal Credit / Microfinance: - innovation in the design of informal institutions institutions in order to provide finance to a wider range of individuals (greater outreach) and projects. (Aniket, 2005, 2006) Important to analyse the role savings can play in uplifting the poor from poverty (Aniket 2006)
51 3. PROPERTY RIGHTS Increasing evidence that secure land rights, in particular, are an important vehicle for the poor that may promote both equity and efficiency Acemoglu Johnson Robinson (2001) countries with less risk of expropriation (more secure property rights) experience higher growth rates. Lin (1992) shows that the move from collective to household farming in China starting in 1978 led to large productivity increases in agriculture.
52 4. REGULATION Postwar model of economic development was built on a raft of regulation benevolent governments intent on correcting market failures central planning was in fashion Djankov et al. (2002) collect data on the time and number of procedures an entrepreneur must complete to start a business in 85 countries finds that heavy regulation of entry is associated with less democratic governments, greater corruption and larger unofficial economies which supports the idea that entry regulations are not in the public interest. Besley and Burgess (2004) finds that pro-worker state-level amendments to the Industrial Disputes Act in India were associated with lower output, employment, investment and productivity in registered (formal sector) manufacturing and higher urban poverty.
53 5. RESPONSIVENESS & ACCOUNTABILITY OF GOVERNMENT Recent research has begun to look at how governments can be made more responsive and accountable for their actions Besley and Burgess (2002) show that state governments in India are more responsive to falls in food production and crop flood damage via public food distribution and calamity relief expenditure where local newspaper circulation is higher. They also find that higher political competition and electoral turnout are associated with greater responsiveness to food production shortfalls and floods. Djankov et al. (2001) develop a remarkable data set on media ownership patterns in 97 countries and find that state ownership of the media is, on the whole, negatively correlated with good government.
54 SUMMING UP Empirical approaches based on sub-national data provide the most credible base for economists to influence the debate about global poverty reduction. The evidence based approach to policy has proven effective in a range of industrialised countries and its expansion into the developing world is long overdue. The overarching theme is the centrality of the institutional context in which policy decisions are made. Responsibility for achieving the goal of cutting global poverty rates in half lies firmly at the door of domestic governments. Aid and debt reduction can play a limited role.
55 ADVANTAGES OF ECONOMIC EVIDENCE BASED APPROACH it provides a consistent and common theoretical framework within which we can evaluate policy and institutional reforms provides some quantification of the effects of various measures advances in theoretical and empirical political economy provide a basis for encompassing an agenda that puts more weight on aleinstitutional change deliver a better understanding of the micro-economic processes that generate income growth. The kind of evidence currently being built by micro-economic research at the sub-national level will doubtless be the most persuasive and credible advice to policy makers in the decade to come. But it is clear that there is no magic bullet to halve global poverty.
56 ELASTICITY Elasticity measures the responsiveness of variable of y to a change in variable x Elasticity = % change in y % change in x = dlny dlnx = dy/y dx/x Note: If we run a regression on the log values of the variables, the coefficients gives us the elasticity of the dependent variable with respect to the independent variable.
57 ORDINARY LEAST SQUARES (OLS) REGRESSION OLS regression minimises the square of the residuals. We can run a regression of the form: Y = α + βx + ε and obtain the OLS estimators ˆα and ˆβ by minimising the square of the residuals given by (Y ˆα ˆβX) 2. The regression gives us a functional (causal) relationship which predicts the value of Y given that value of X. E[Y X]= ˆα + ˆβX. where ˆα is the intercept and ˆβ is the slope in the X Y space representation of this functional relationship.
58 CROSS-SECTION DATA AND PANEL DATA Regression for cross-sectional data: Y i = α + βx i + ε i where i represent individual units of interest. Regression for panel data with fixed effect: Y it = α i + βx it + ε it where i represent individual units of interest and t represents time. α i is the fixed effect or the intercept term that varies for each i. Of course, this intercept term varies over i but does not vary over t.
59 OLS Estimate a linear relationship between variable x and y y i = α + βx i + ε i Estimation: minε 2 i where ε i = y i ˆα ˆβx i variance of ˆβ = 1 N variance of residuals variance of x i Testing: t = ˆβ > 2 variance of ˆβ
THE INDIAN HOUSEHOLD SAVINGS LANDSCAPE
 THE INDIAN HOUSEHOLD SAVINGS LANDSCAPE Cristian Badarinza National University of Singapore Vimal Balasubramaniam University of Oxford Tarun Ramadorai University of Oxford, CEPR and NCAER July 2016 Savings
Credit, Saving and Insurance
 Credit, Saving and Insurance EC307 ECONOMIC DEVELOPMENT Dr. Kumar Aniket University of Cambridge & LSE Summer School Lecture 8 created on June 6, 2010 READINGS Tables and figures in this lecture are taken
Finance and Poverty: Evidence from India. Meghana Ayyagari Thorsten Beck Mohammad Hoseini
 Finance and Poverty: Evidence from India Meghana Ayyagari Thorsten Beck Mohammad Hoseini Motivation Large literature on positive effect of finance and growth Distributional repercussions of financial deepening?
ROLE OF PRIVATE SECTOR BANKS FOR FINANCIAL INCLUSION
 270 ROLE OF PRIVATE SECTOR BANKS FOR FINANCIAL INCLUSION ABSTRACT DR. BIMAL ANJUM*; RAJESHTIWARI** *Professor and Head, Department of Business Administration, RIMT-IET, Mandi Gobindgarh, Punjab. **Assistant
Employment and Inequalities
 Employment and Inequalities Preet Rustagi Professor, IHD, New Delhi. Round Table on Addressing Economic Inequality in India Bengaluru, 8 th January 2015 Introduction the context Impressive GDP growth over
Bihar: What is holding back growth in Bihar? Bihar Development Strategy Workshop, Patna. June 18
 Bihar: What is holding back growth in Bihar? Bihar Development Strategy Workshop, Patna. June 18 Ejaz Ghani World Bank. Structure of Presentation How does Bihar compare with other states? What is constraining
TRENDS IN SOCIAL SECTOR EXPENDITURE - AN INTER STATE COMPARISON
 TRENDS IN SOCIAL SECTOR EXPENDITURE - AN INTER STATE COMPARISON Mercy W.J Social sector public outlay and social development An inter state comparison Thesis. Department of Economics, Dr. John Matthai
CHAPTER VII INTER STATE COMPARISON OF REVENUE FROM TAXES ON INCOME
 CHAPTER VII INTER STATE COMPARISON OF REVENUE FROM TAXES ON INCOME In this chapter we discuss the growth of total revenue from taxes on income. We also examine the growth of revenue from agricultural income
Banking Sector Liberalization in India: Some Disturbing Trends
 SPECIAL REPORT Banking Sector Liberalization in India: Some Disturbing Trends Kavaljit Singh In the first week of August 2005, Reserve Bank of India (RBI), country s central bank, issued a list of 391
Rich-Poor Differences in Health Care Financing
 Rich-Poor Differences in Health Care Financing Role of Communities and the Private Sector Alexander S. Preker World Bank October 28, 2003 Flow of Funds Through the System Revenue Pooling Resource Allocation
ECON 450 Development Economics
 ECON 450 Development Economics Classic Theories of Economic Growth and Development The Empirics of the Solow Growth Model University of Illinois at Urbana-Champaign Summer 2017 Introduction This lecture
Inclusive Development in Bihar: The Role of Fiscal Policy. M. Govinda Rao
 Inclusive Development in Bihar: The Role of Fiscal Policy M. Govinda Rao Introduction Fiscal policy is a means to achieving inclusive growth. Despite impressive growth performance, uneven regional spread.
IJPSS Volume 2, Issue 9 ISSN:
 REGIONAL DISPARITY IN THE DISTRIBUTION OF AGRICULTURAL CREDIT DR.S.GANDHIMATHI* DR.P.AMBIGADEVI** V.SHOBANA*** _ ABSTRACT The Eleventh Five year plan makes specific focus on the inclusive growth of the
CHAPTER-3 DETERMINANTS OF FINANCIAL INCLUSION IN INDIA
 CHAPTER-3 DETERMINANTS OF FINANCIAL INCLUSION IN INDIA Indian economy has changed a lot over the past 60 years. Over the next 40 years the changes could be dramatic. Using the latest demographic projection
Creating Jobs in India s Organised Manufacturing Sector
 Creating Jobs in India s Organised Manufacturing Sector Come, Make in India. Sell anywhere but come and manufacture here. Prime Minister, Narendra Modi, 15 th August, 2014 Stagnant Contribution of the
In the estimation of the State level subsidies, the interest rates that have been
 Subsidies of the State Governments s ubsidies provided by the State governments have been estimated for 15 major States for 1993-94. As explained earlier, the major data source is the Finance Accounts
10+ Years of PETS What We Have Learned. Ritva Reinikka The World Bank June 19, 2008
 10+ Years of PETS What We Have Learned Ritva Reinikka The World Bank June 19, 2008 Principal Agent: Relationships of accountability have five features Delegating Actors (principals) including clients,
POPULATION PROJECTIONS Figures Maps Tables/Statements Notes
 8 POPULATION PROJECTIONS Figures Maps Tables/Statements 8 Population projections It is of interest to examine the variation of the Provisional Population Totals of Census 2011 with the figures projected
INDICATORS DATA SOURCE REMARKS Demographics. Population Census, Registrar General & Census Commissioner, India
 Public Disclosure Authorized Technical Demographics Public Disclosure Authorized Population Urban Share Child Sex Ratio Adults Population Census, Registrar General & Census Commissioner, India Population
West Bengal Budget Analysis
 0.3% 3. 2.3% 6.4% 5.9% 8.8% 8. 8. 11.4% 10.2% 11. 15. West Bengal Budget Analysis The Finance Minister of West Bengal, Dr. Amit Mitra presented the Budget for financial year on January 31, 2018. Budget
POVERTY TRENDS IN INDIA: A STATE WISE ANALYSIS. Kailasam Guduri. M.A. Economics. Kakatiya University
 Available online at: http://euroasiapub.org, pp. 348~355 POVERTY TRENDS IN INDIA: A STATE WISE ANALYSIS Abstract Kailasam Guduri M.A. Economics Kakatiya University First Millennium Development Goal (MDG
Issues in Health Care Financing and Provision in India. Peter Berman The World Bank New Delhi
 Issues in Health Care Financing and Provision in India Peter Berman The World Bank New Delhi Financing and Provision of Health Care: Some Introductory Concepts Consider whole system Government and non-government,
How would an expansion of IDA reduce poverty and further other development goals?
 Measuring IDA s Effectiveness Key Results How would an expansion of IDA reduce poverty and further other development goals? We first tackle the big picture impact on growth and poverty reduction and then
ECONOMIC DEVELOPMENT AND POVERTY IN INDIA: AN INTER STATE ANALYSIS
 International Journal of Economic Issues, Vol. 4, No. 2 (July-December, 2011): 343-356 International Science Press ECONOMIC DEVELOPMENT AND POVERTY IN INDIA: AN INTER STATE ANALYSIS MANJIT SINGH Lecturer
α = 1 gives the poverty gap ratio, which is a linear measure of the extent to which household incomes fall below the poverty line.
 We used some special measures of poverty under the broad class of measures called the Foster-Greer- Thorbecke metric[chapter2, globalisation and the poor in asia]. Under this scheme, we use an indicator
Forthcoming in Yojana, May Composite Development Index: An Explanatory Note
 1. Introduction Forthcoming in Yojana, May 2014 Composite Development Index: An Explanatory Note Bharat Ramaswami Economics & Planning Unit Indian Statistical Institute, Delhi Centre In May 2013, the Government
Bihar Budget Analysis
 -1. -0. 1.6% 4. 6.6% 5. 4.9% 8. 7. 10. 10. 14. Bihar Budget Analysis The Finance Minister of Bihar, Mr. Sushil Kumar Modi, presented the Budget for financial year on February 27, 2018. Budget Highlights
Indian Regional Rural Banks Growth and Performance
 Indian Regional Rural Banks Growth and Performance Syed Mahammad Ghouse ghouse.marium@gmail.com Narayana Reddy tnreddy.jntua@gmail JNTU College of Engineering Regional rural Banks play a vital role for
Bi-Variate Causality between States per Capita Income and State Public Expenditure An Experience of Gujarat State Economic System
 IOSR Journal of Business and Management (IOSR-JBM) e-issn: 2278-487X.Volume 8, Issue 5 (Mar. - Apr. 2013), PP 18-22 Bi-Variate Causality between States per Capita Income and State Public Expenditure An
CHAPTER IV INTER STATE COMPARISON OF TOTAL REVENUE. and its components namely, tax revenue and non-tax revenue. We also
 CHAPTER IV INTER STATE COMPARISON OF TOTAL REVENUE This chapter deals with the inter state comparison of total revenue and its components namely, tax revenue and non-tax revenue. We also examine the growth
FOREWORD. Shri A.B. Chakraborty, Officer-in-charge, and Dr.Goutam Chatterjee, Adviser, provided guidance in bringing out the publication.
 FOREWORD The publication, Basic Statistical Returns of Scheduled Commercial Banks in India, provides granular data on a number of key parameters of banks. The information is collected from bank branches
CHAPTER - 4 MEASUREMENT OF INCOME INEQUALITY BY GINI, MODIFIED GINI COEFFICIENT AND OTHER METHODS.
 CHAPTER - 4 MEASUREMENT OF INCOME INEQUALITY BY GINI, MODIFIED GINI COEFFICIENT AND OTHER METHODS. CHAPTER-4. MESUREMENT OF INCOME INEQUALITY BY GINI, MODIFIED GINI COEFFICIENT AND OTHER METHODS 4.1 Income
Testing the predictions of the Solow model: What do the data say?
 Testing the predictions of the Solow model: What do the data say? Prediction n 1 : Conditional convergence: Countries at an early phase of capital accumulation tend to grow faster than countries at a later
The Revenue Impact of VAT in Madhya Pradesh: Empirical Evidence from India
 International Journal of Economics and Finance; Vol. 8, No. 5; 2016 ISSN 1916-971X E-ISSN 1916-9728 Published by Canadian Center of Science and Education The Revenue Impact of VAT in Madhya Pradesh: Empirical
INVESTMENT CLIMATE AND TOTAL FACTOR PRODUCTIVITY IN MANUFACTURING: ANALYSIS OF INDIAN STATES
 WORKING PAPER NO. 127 INVESTMENT CLIMATE AND TOTAL FACTOR PRODUCTIVITY IN MANUFACTURING: ANALYSIS OF INDIAN STATES C. VEERAMANI BISHWANATH GOLDAR April 2004 INDIAN COUNCIL FOR RESEARCH ON INTERNATIONAL
What is Inclusive growth?
 What is Inclusive growth? Tony Addison Miguel Niño Zarazúa Nordic Baltic MDB meeting Helsinki, Finland January 25, 2012 Why is economic growth important? Economic Growth to deliver sustained poverty reduction
Karnataka Budget Analysis
 -4. 3. 8.9% 7.7% 8.6% 7. 8. 10.3% 14. 19.7% 19.8% 15. 13.4% 13.6% 13.4% 11.8% 11. 11.8% 12. 17.4% Karnataka Budget Analysis The Chief Minister and Finance Minister, Mr. H. D. Kumaraswamy presented the
Economics 270c. Development Economics Lecture 11 April 3, 2007
 Economics 270c Development Economics Lecture 11 April 3, 2007 Lecture 1: Global patterns of economic growth and development (1/16) The political economy of development Lecture 2: Inequality and growth
Performance of RRBs Before and after Amalgamation
 Performance of RRBs Before and after Amalgamation DR. MINAXI M. JARIWALA Lecturer, Vivekanand College for B.Ed. Gujarat (India) DR. MARTINA R. NORONHA Vice-Principle S.P.B. English Medium College of Commerce
ECONOMIC REFORMS AND GROWTH PERFORMANCE OF INDIAN MANUFACTURING SECTOR AN INTERSTATE ANALYSIS
 Chapter IV ECONOMIC REFORMS AND GROWTH PERFORMANCE OF INDIAN MANUFACTURING SECTOR AN INTERSTATE ANALYSIS The basic objective of economic reforms was to improve productivity growth and competitiveness in
STATE DOMESTIC PRODUCT
 CHAPTER 4 STATE DOMESTIC PRODUCT The State Domestic Product (SDP) commonly known as State Income is one of the important indicators to measure the economic development of the State. In the context of planned
What to do when markets and governments fail poor people
 What to do when markets and governments fail poor people Shanta Devarajan World Bank www.brookings.edu/futuredevelopment Market failures and their solutions Area Market Failure Intervention Trade and industrialization
Testing the predictions of the Solow model:
 Testing the predictions of the Solow model: 1. Convergence predictions: state that countries farther away from their steady state grow faster. Convergence regressions are designed to test this prediction.
Post and Telecommunications
 Post and Telecommunications This section presents operating and financial data relating to the different branches of the Department of Posts including the Post Office Savings Banks. It comprises statistics
Financial Inclusion and its Determinants: An Empirical Study on the Inter-State Variations in India
 IJA MH International Journal on Arts, Management and Humanities 6(1): 08-18(2017) ISSN No. (Online): 2319 5231 Financial Inclusion and its Determinants: An Empirical Study on the Inter-State Variations
International Journal for Research in Applied Science & Engineering Technology (IJRASET) Status of Urban Co-Operative Banks in India
 Status of Urban Co-Operative Banks in India") Status of Urban Co-Operative Banks in India Siddhartha S Vishwam 1, Dr. B. S. Chandrashekar 2 1 Research Scholar, DOS in Economics and Co-operation, University of Mysore, Manasagangothri, Mysore 2 Assistant
Status of Urban Co-Operative Banks in India Siddhartha S Vishwam 1, Dr. B. S. Chandrashekar 2 1 Research Scholar, DOS in Economics and Co-operation, University of Mysore, Manasagangothri, Mysore 2 Assistant
LABOUR PRODUCTIVITY IN SMALL SCALE INDUSTRIES IN INDIA: A STATE-WISE ANALYSIS
 The Indian Journal of Labour Economics, Vol. 49, No. 3, 2006 LABOUR PRODUCTIVITY IN SMALL SCALE INDUSTRIES IN INDIA: A STATE-WISE ANALYSIS R.K. Sharma and Abinash Dash* Based on the latest available NSS
Chapter 4. Economic Growth
 Chapter 4 Economic Growth When you have completed your study of this chapter, you will be able to 1. Understand what are the determinants of economic growth. 2. Understand the Neoclassical Solow growth
Poverty Underestimation in Rural India- A Critique
 MPRA Munich Personal RePEc Archive Poverty Underestimation in Rural India- A Critique Marimuthu Sivakumar and A Sarvalingam Chikkaiah Naicker College, Erode 30. March 2010 Online at https://mpra.ub.uni-muenchen.de/21748/
Chapter 4: Micro Kuznets and Macro TFP Decompositions
 Chapter 4: Micro Kuznets and Macro TFP Decompositions This chapter provides a transition from measurement and the assemblage of facts to a documentation of ey underlying drivers of the Thai economy. The
Did Gujarat s Growth Rate Accelerate under Modi? Maitreesh Ghatak. Sanchari Roy. April 7, 2014.
 Did Gujarat s Growth Rate Accelerate under Modi? Maitreesh Ghatak Sanchari Roy April 7, 2014. The Gujarat economic model under Narendra Modi continues to dominate the media and public discussions as the
Dr. Najmi Shabbir Lecturer Shia P.G. College, Lucknow
 Banking Development after Nationalization and Social Control in India (1967 To 1991) Dr. Najmi Shabbir Lecturer Shia P.G. College, Lucknow Abstract: This paper mainly analyses the impact of Nationalisation
Commercial Banks, Financial Inclusion and Economic Growth in India
 International Journal of Business and Management Invention ISSN (Online): 2319 8028, ISSN (Print): 2319 801X Volume 2 Issue 5 ǁ May. 2013ǁ PP.01-06 Commercial Banks, Financial Inclusion and Economic Growth
The Indian Labour Market : An Overview
 The Indian Labour Market : An Overview Arup Mitra Institute of Economic Growth Delhi University Enclave Delhi-110007 e-mail:arup@iegindia.org fax:91-11-27667410 1. Introduction The concept of pro-poor
Development Economics: Microeconomic issues and Policy Models
 MIT OpenCourseWare http://ocw.mit.edu 14.771 Development Economics: Microeconomic issues and Policy Models Fall 2008 For information about citing these materials or our Terms of Use, visit: http://ocw.mit.edu/terms.
OLD AGE POVERTY IN THE INDIAN STATES: WHAT THE HOUSEHOLD DATA CAN SAY? May 4, 2005
 OLD AGE POVERTY IN THE INDIAN STATES: WHAT THE HOUSEHOLD DATA CAN SAY? Sarmistha Pal, Brunel University * Robert Palacios, World Bank ** May 4, 2005 Abstract: In the absence of any official measures of
Financial Innovation in Indian Agricultural Credit Market: Progress and Performance of Kisan Credit Card
 Ind. Jn. of Agri.Econ. Vol.66, No.3, July-Sept. 2011 SUBJECT III INNOVATIONS IN AGRICULTURAL CREDIT MARKET - RATIONALISATION OF POLICY RESPONSE Financial Innovation in Indian Agricultural Credit Market:
Introduction to economic growth (1)
") Introduction to economic growth (1) EKN 325 Manoel Bittencourt University of Pretoria M Bittencourt (University of Pretoria) EKN 325 1 / 32 Introduction In the last century the USA has experienced a tenfold
Introduction to economic growth (1) EKN 325 Manoel Bittencourt University of Pretoria M Bittencourt (University of Pretoria) EKN 325 1 / 32 Introduction In the last century the USA has experienced a tenfold
JOINT STOCK COMPANIES
 This section contains statistics relating to joint stock companies which are based on returns received from Registrars of Joint Stock Companies. Tables 25.1 (A) (B) to 25.4 These tables present data regarding
The Global Findex Database. Adults with an account at a formal financial institution (%) OTHER BRICS ECONOMIES REST OF DEVELOPING WORLD
 OTHER BRICS ECONOMIES REST OF DEVELOPING WORLD") 08 NOTE NUMBER FINDEX NOTES Asli Demirguc-Kunt Leora Klapper Douglas Randall WWW.WORLDBANK.ORG/GLOBALFINDEX FEBRUARY 2013 The Global Findex Database Financial Inclusion in India In India 35 percent of
08 NOTE NUMBER FINDEX NOTES Asli Demirguc-Kunt Leora Klapper Douglas Randall WWW.WORLDBANK.ORG/GLOBALFINDEX FEBRUARY 2013 The Global Findex Database Financial Inclusion in India In India 35 percent of
Equality and Fertility: Evidence from China
 Equality and Fertility: Evidence from China Chen Wei Center for Population and Development Studies, People s University of China Liu Jinju School of Labour and Human Resources, People s University of China
Macroeconomics II. Growth. Recent phenomenon Great diversity of growth experiences across countries. Why do some countries grow and others not?
 Macroeconomics II Growth Growth Theory Facts about growth Recent phenomenon Great diversity of growth experiences across countries What drives growth? Inputs Technology Why do some countries grow and others
Session 1: Domestic resource mobilization. Presentation
 MINISTRY OF FINANCE REPUBLIC OF INDONESIA Asia-Pacific Outreach Meeting on Sustainable Development Financing 10-11 June 2014 Djuanda Hall, Ministry of Finance Complex, Jakarta Session 1: Domestic resource
Microfinance Industry Penetration in India: A State - wise Analysis in Context of Micro Credit
 24 Microfinance Industry Penetration in India: A State - wise Analysis in Context of Micro Credit Laxmi Devi, Assistant Professor, Gargi College, University of Delhi Umed Yadav, Student, Dept. of Commerce,
Dependence of States on Central Transfers: State-wise Analysis
 Dependence of States on Central : State-wise Analysis C. Bhujanga Rao and D. K. Srivastava Working Paper No. 2014-137 May 2014 National Institute of Public Finance and Policy New Delhi http://www.nipfp.org.in
Telangana Budget Analysis
 -5.8% -4.9% -2.9% 3.6% 6.8% 6. 6.1% 12.9% 6.2% 11. 8.6% 12.2% 10.2% 10.1% 11.1% 10.4% Budget Analysis The Finance Minister of, Mr. Eatala Rajender, presented the Budget for financial year on March 15,
Chhattisgarh Budget Analysis
 -0.2% -1.6% 2.7% 2.9% 1.8% 6.6% 6.5% 7.8% 5.8% 8.9% 3.6% 5.5% 6.8% 9.5% 6. 8.4% 6.7% 10. 13.8% 15.6% Chhattisgarh Budget Analysis The Finance Minister of Chhattisgarh, Dr. Raman Singh, presented the Budget
Nutrition and productivity
 Nutrition and productivity Abhijit Banerjee Department of Economics, M.I.T. 1 A simple theory of nutrition and productivity The capacity curve (fig 1) The capacity curve: It relates income and work capacity
Food security and child malnutrition in India
 Final report Food security and child malnutrition in India Anders Kjelsrud Rohini Somanathan October 2017 When citing this paper, please use the title and the following reference number: F-35125-INC-1
Civil Service Pension Reform: Time to Act By Mukul Asher and Deepa Vasudevan 1
 Civil Service Pension Reform: Time to Act By Mukul Asher and Deepa Vasudevan 1 (Published in Economic and Political Weekly, Vol.39, No.51, December 18-24, 2004, pp 5363-5365) The urgency of implementing
Kerala Budget Analysis
 2.1% 4.3% 2.9% 5.2% 5.7% 4. 7.2% 6.7% 4.3% 6.6% 7.4% Kerala Budget Analysis The Finance Minister of Kerala, Dr. T.M. Thomas Isaac, presented the Budget for financial year on February 2, 2018. Budget Highlights
Educational Enrollment and Attainment in India: Household Wealth, Gender, Village, and State Effects
 Educational Enrollment and Attainment in India: Household Wealth, Gender, Village, and State Effects Deon Filmer Lant Pritchett September 22, 1998 Abstract: This paper uses the National Family Health Survey
Will Growth eradicate poverty?
 Will Growth eradicate poverty? David Donaldson and Esther Duflo 14.73, Challenges of World Poverty MIT A world Free of Poverty Until the 1980s the goal of economic development was economic growth (and
State Government Borrowing: April September 2015
 November 5, 2015 Economics State Government Borrowing: April September 2015 State Development Loans (SDL) are debt issued by state governments to fund their fiscal deficit. States in India like the centre,
CHAPTER VI ANALYSIS OF BORROWINGS
 6.1 Introduction CHAPTER VI ANALYSIS OF BORROWINGS When women move forward, the family moves, the village moves and the nation moves. Jawaharlal Nehru Access to finance, especially by the poor and vulnerable
Commentary: The Search for Growth
 Commentary: The Search for Growth N. Gregory Mankiw For evaluating economic well-being, the single most important statistic about an economy is its income per capita. Income per capita measures how much
State level fiscal policy choices and their impacts
 State level fiscal policy choices and their impacts Analysis using a regional social accounting matrix for India, 2011-12 A. Ganesh-Kumar 1 and Manoj Panda 2 1 Professor, Indira Gandhi Institute of Development
Export Earnings Instability in Pakistan
 The Pakistan Development Review 34 : 4 Part III (Winter 1995) pp. 1181 1189 Export Earnings Instability in Pakistan AHMAD TARIQ and QAZI NAJEEB 1. INTRODUCTION Since independence, Pakistan, like many other
Applied Economics. Growth and Convergence 1. Economics Department Universidad Carlos III de Madrid
 Applied Economics Growth and Convergence 1 Economics Department Universidad Carlos III de Madrid 1 Based on Acemoglu (2008) and Barro y Sala-i-Martin (2004) Outline 1 Stylized Facts Cross-Country Dierences
Incidence, Intensity, and Correlates of Catastrophic Out-of-Pocket Health Payments in India
 Economics and Research Department ERD Working Paper Series No. 102 Incidence, Intensity, and Correlates of Catastrophic Out-of-Pocket Health Payments in India Sekhar Bonu, Indu Bhushan, and David H. Peters
MICRO FINANCE: A TOOL FOR SELF EMPLOYMENT WITH SPECIAL REFERENCE TO RURAL POOR
 MICRO FINANCE: A TOOL FOR SELF EMPLOYMENT WITH SPECIAL REFERENCE Dr. Babaraju K. Bhatt* Ronak A. Mehta** TO RURAL POOR Abstract: Indian population comprises roughly one sixth of the world s population.
National Rural Employment Guarantee Act (NREGA 2005) Santosh Mehrotra Senior Adviser (Rural Development) Planning Commission Government of India
 Santosh Mehrotra Senior Adviser (Rural Development) Planning Commission Government of India") National Rural Employment Guarantee Act (NREGA 2005) Santosh Mehrotra Senior Adviser (Rural Development) Planning Commission Government of India 1 30 yr history of WEPs but Problems Low programme coverage
National Rural Employment Guarantee Act (NREGA 2005) Santosh Mehrotra Senior Adviser (Rural Development) Planning Commission Government of India 1 30 yr history of WEPs but Problems Low programme coverage
South Asia Working Paper Series
 South Asia Working Paper Series Growth, Structural Change, and Poverty Reduction: Evidence from India Rana Hasan, Sneha Lamba, and Abhijit Sen Gupta No. 22 November 2013 ADB South Asia Working Paper Series
Informality in the Formal Sector Evidence from India s manufacturing sector. Radhicka Kapoor and P.P. Krishnapriya May 11, 2018
 Informality in the Formal Sector Evidence from India s manufacturing sector Radhicka Kapoor and P.P. Krishnapriya May 11, 2018 Dualism India s manufacturing sector is characterized by its dualistic structure
Marginal Benefit Incidence of Pubic Health Spending: Evidence from Indonesian sub-national data
 Marginal Benefit Incidence of Pubic Health Spending: Evidence from Indonesian sub-national data Ioana Kruse Menno Pradhan Robert Sparrow The 2010 IRDES Workshop on Applied Health Economics and Policy Evaluation
Chapter 10 Non-income Dimensions, Prevalence, Depth and Severity of Poverty: Spatial Estimation with Household-Level Data in India
 Chapter 10 Non-income Dimensions, Prevalence, Depth and Severity of Poverty: Spatial Estimation with Household-Level Data in India Panchanan Das Abstract This chapter examines the incidence, depth and
Uttar Pradesh Budget Analysis
 -2. -0.1% -0.9% 2.8% 2.3% 4. 5.5% 5.1% 4.7% 5.8% 4. 6.8% 6.8% 7.1% 7.9% 9. 8. 7. 8. 7. Uttar Pradesh Budget Analysis The Finance Minister of Uttar Pradesh, Mr. Rajesh Agarwal, presented the Budget for
Delhi Budget Analysis
 Delhi Budget Analysis The Minister of Finance of Delhi, Mr. Manish Sisodia, presented the Budget for financial year on March 22, 2018. Budget Highlights The Gross State Domestic Product (GSDP) of Delhi
Note on ICP-CPI Synergies: an Indian Perspective and Experience
 2 nd Meeting of the Country Operational Guidelines Task Force March 12, 2018 World Bank, Washington, DC Note on ICP-CPI Synergies: an Indian Perspective and Experience 1. Meaning and Scope 1.1 International
Sarva Shiksha Abhiyan, GOI
 Sarva Shiksha Abhiyan, GOI 2012-13 The Sarva Shiksha Abhiyan (SSA) is the Government of India's (GOI) flagship elementary education programme. Launched in 2001, it aims to provide universal primary education
Did Crop Insurance Programmes Change the Systematic Yield Risk?
 Ind. Jn. of Agri. Econ. Vol.68, No.1, Jan.-March 2013 Did Crop Insurance Programmes Change the Systematic Yield Risk? Saleem Shaik* I INTRODUCTION Modeling crop yield, revenue, or loss cost ratio distributions
Does India s Employment Guarantee Scheme Guarantee Employment?
 Does India s Employment Guarantee Scheme Guarantee Employment? Puja Dutta, Rinku Murgai, Martin Ravallion, Dominique van de Walle An analysis of the National Sample Survey data for 2009-10 confirms expectations
Inclusive Growth: What is so exclusive about it?
 WP-2008-019 Inclusive Growth: What is so exclusive about it? M.H. Suryanarayana Indira Gandhi Institute of Development Research, Mumbai October 2008 http://www.igidr.ac.in/pdf/publication/wp-2008-019.pdf
ADB Economics Working Paper Series. Demographic Dividends for India: Evidence and Implications Based on National Transfer Accounts
 ADB Economics Working Paper Series Demographic Dividends for India: Evidence and Implications Based on National Transfer Accounts Laishram Ladusingh and M. R. Narayana No. 292 December 2011 ADB Economics
CHAPTER \11 SUMMARY OF FINDINGS, CONCLUSION AND SUGGESTION. decades. Income distribution, as reflected in the distribution of household
 CHAPTER \11 SUMMARY OF FINDINGS, CONCLUSION AND SUGGESTION Income distribution in India shows remarkable stability over four and a half decades. Income distribution, as reflected in the distribution of
Growth and Inclusion: Theoretical and Applied Perspectives
 THE WORLD BANK WORKSHOP Growth and Inclusion: Theoretical and Applied Perspectives Section III Part 2 2 + 2 = 3: The Orwellian Record of Inclusive Growth in India Surjit Bhalla Oxus Investments January
Topic 3: Endogenous Technology & Cross-Country Evidence
 EC4010 Notes, 2005 (Karl Whelan) 1 Topic 3: Endogenous Technology & Cross-Country Evidence In this handout, we examine an alternative model of endogenous growth, due to Paul Romer ( Endogenous Technological
14 th Finance Commission: Review and Outcomes. Economics. February 25, 2015
 February 25, 2015 Economics 14 th Finance Commission: Review and Outcomes The 14th Finance Commission (FFC) was constituted on 2nd January, 2013 and submitted its report on 15 th December, 2014. The recommendations
3.1 Introduction. 3.2 Growth over the Very Long Run. 3.1 Introduction. Part 2: The Long Run. An Overview of Long-Run Economic Growth
 Part 2: The Long Run Media Slides Created By Dave Brown Penn State University 3.1 Introduction In this chapter, we learn: Some tools used to study economic growth, including how to calculate growth rates.
GOVERNMENT FINANCING OF HEALTH CARE IN INDIA SINCE 2005 WHAT WAS ACHIEVED, WHAT WAS NOT, AND WHY
 GOVERNMENT FINANCING OF HEALTH CARE IN INDIA SINCE 2005 WHAT WAS ACHIEVED, WHAT WAS NOT, AND WHY OUTLINE 1 Key takeaways 2 Total Government Health Expenditure (TGHE): A flow of funds view 3 TGHE in 29