FISCAL YEAR BUDGET. Adopted June 23, 2017
|
|
|
- Nicholas Martin
- 5 years ago
- Views:
Transcription

1
2 SOUTHERN CALIFORNIA REGIONAL RAIL AUTHORITY FISCAL YEAR BUDGET Including Forecast for FY and FY (informational purposes only) Adopted June 23, 2017 Los Angeles County Metropolitan Transportation Authority Orange County Transportation Authority Riverside County Transportation Commission San Bernardino County Transportation Authority Ventura County Transportation Commission June 23,
3 This page intentionally left blank June 23,
4 SOUTHERN CALIFORNIA REGIONAL RAIL AUTHORITY FY BUDGET TABLE OF CONTENTS SECTION 1: Executive Summary Introduction Metrolink in Perspective Metrolink in Comparison Accomplishments in FY Objectives for FY FY Budget in Brief Key FY Budget Information The FY Operational Budget Statistics Administrative Requirements Budget Development and Assumptions Summary of Operating Revenues and Subsidy Funding Summary of Operating Expenses Summary of Capital Program Exhibits...19 Exhibit 1.1: Metrolink Systemwide Map...19 SECTION 2: Introduction to the Budget Mission Statement Board Governance SCRRA Background...24 SECTION 3: Budget Summary Budget Policy Budget Authorization Budgetary Control and Reporting Accounting Methodology Budget Assumptions Total Operating Budget Operating Revenues and Subsidy Funding Operating Expenses...28 June 23,
5 3.5 Capital Program Summary of the Total FY Budget Exhibits...30 Exhibit 3.1a Summary of FY to FY Statistics by Line Exhibit 3.1b Summary of FY to FY Statistics by Line...34 Exhibit 3.1c Summary of FY to FY Statistics by Line...35 Exhibit 3.1d Summary of FY to FY Statistics by Line...36 Exhibit 3.2 Operating Expense, Revenues and Operating Subsidy...37 Exhibit 3.3 Train Miles, Fares and Average Weekday Ridership...38 Exhibit 3.4 Revenue Recovery, Farebox Recovery and Operating Expense per Train Mile...39 Exhibit 3.5 Operating Expense per Passenger Mile, Operating Subsidy per Rider and Operating Subsidy per Passenger Mile...40 Exhibit 3.6 FY to FY Annual Operating Budget by Cost Component by Fiscal Year Exhibit 3.7 FY Annual Operating Budget by Cost Component by Member Agency...42 Exhibit 3.8 FY to FY Revenue Sources Trend 43 Exhibit 3.9 FY Budget Revenue Sources and Use by Member Agency SECTION 4: Operating Revenues Introduction Farebox Revenues Marketing Maintenance-of-Way (MOW) Revenues Dispatching Revenues Exhibits...49 Exhibit 4.1 FY to FY Fare Revenue and Ridership...50 Exhibit 4.2 FY to FY Maintenance-of-Way (MOW) Revenue Trends..51 Exhibit 4.3 FY to FY Dispatching Revenue Trends...52 Exhibit 4.4 FY to FY Other Operating Revenue Trends SECTION 5: Operating Expenses Introduction...55 June 23,
6 5.2 Operating Budget Assumptions Service Levels Cost Allocations Train Operations Train Operations Components Train Operations Note Maintenance-of-Way (MOW) Assumptions Conditions and Trends in the MOW Budget MOW Statistics MOW Expenditure Components MOW Net Revenue, Expenditure and Member Agency Funding MOW Projections by Line Extraordinary Maintenance-of-Way Insurance Expense Exhibits...67 Exhibit 5.1 June 23, FY Service Assumptions...68 Exhibit 5.2 FY to FY Service Train Miles...69 Exhibit 5.3 FY Maintenance-of-Way Expenditures and Revenue Offsets...70 Exhibit 5.4 FY to FY Maintenance-of-Way Expenditures by Line Segment/Territory Operating Lines...71 Exhibit 5.5 FY to FY Maintenance-of-Way Expenditures by Line Segment/Territory Non-Operating Lines and Total...72 SECTION 6: Member Agency Subsidies Member Agency Funding...73 SECTION 7: Capital Program Budget Introduction Rehabilitation Program Railroad Rehabilitation Cycles Rehabilitation Elements Consequences of Deferred Rehabilitation FY Ongoing Rehabilitation Projects FY New Rehabilitation Projects FY New Capital Carryover Projects...88
7 7.6 FY New Capital New Authority Projects Exhibits...88 Exhibit 7.1 FY Rehabilitation Carryover Projects Summary...90 Exhibit 7.2 FY Rehabilitation New Authority Projects Summary by Subdivision...91 Exhibit 7.3 FY New Capital Carryover Projects...92 Exhibit 7.4 FY New Capital New Authority Projects...93 Exhibit 7.5 FY Rehabilitation Carryover Projects Detail...94 Exhibit 7.6 FY Rehabilitation New Authority Projects Detail...96 Exhibit Capital Summary and Cash Flow Detail All Agencies..98 Exhibit Exhibit Exhibit Exhibit Exhibit Capital Summary and Cash Flow Detail Metro...99 Capital Summary and Cash Flow Detail OCTA Capital Summary and Cash Flow Detail RCTC Capital Summary and Cash Flow Detail SBCTA Capital Summary and Cash Flow Detail VCTC Exhibit Capital Summary and Cash Flow Detail Other Fund Sources SECTION 8: General and Administrative Budget General and Administrative Expenses Indirect Cost Allocation Plan (ICAP) Pool One Pool Two Pool Three Allocation of Indirect Costs Future Revision in ICAP Rate(s) Organizational Summary Exhibits Exhibit 8.1 FY General and Administrative Expenses Exhibit 8.2 FY Indirect Cost Allocation Plan (ICAP) Cost Calculations Exhibit 8.3 FY Roster of Positions SECTION 9: Budget Forecasts FY and FY Background Basis for Forecast Exhibits June 23,
8 Exhibit 9.1 FY and FY Forecast New Service Requests Exhibit 9.2 FY Forecast of Operating Budget by Cost Component by Member Agency Exhibit 9.3 FY Forecast of Operating Budget by Cost Component by Member Agency SECTION 10: Appendix Introduction Revenue and Cost Allocation Methodology Detail Formulae for Allocation to Members Formulae for Allocation to Lines Allocation of Revenues Allocation of Expenses SCRRA Policy on Debt SCRRA Leveraged Lease Transactions Remaining Lease Agreement Description of GASB-34 Condition Assessment Ratings SCRRA Information Date of Formation Form of Government Purpose Member Agencies Counties Served SCRRA Statistical Information Glossary of Budget Terms Key Acronyms Associated with Southern California Regional Rail Authority Exhibits Exhibit 10.1 FY Formulae Used to Allocate Expenses by Member Agency Exhibit 10.2 FY Formulae Used to Allocate Expenses by Line June 23,
9 This page intentionally left blank June 23,
10 SOUTHERN CALIFORNIA REGIONAL RAIL AUTHORITY FY BUDGET SECTION 1: Executive Summary 1.1 Introduction This year, the Southern California Regional Rail Authority (SCRRA), operating as Metrolink, celebrates its 25 th year. Metrolink is Southern California s only intercounty commuter rail provider, furnishing transportation services for over 11.5 million passenger rides per year. As the second largest transit provider, in terms of passenger miles, Metrolink has one of the lowest subsidy per passenger mile of all major transit operators in Southern California. Metrolink service reduces car congestion at a fraction of the cost of expanding highways, removing approximately 8.7 million annual auto trips from our local roadways. For 25 years, SCRRA has enhanced the quality of life in Southern California by reducing highway congestion and improving mobility throughout the region. Metrolink is governed by SCRRA, a Joint Powers Authority made up of an 11- member board representing the transportation commissions of Los Angeles, Orange, Riverside, San Bernardino and Ventura counties. At a time when mass transportation providers across the region and country continue to experience steep declines, demand for Metrolink service remains steady. 1.2 Metrolink in Perspective Service Metrolink is the nation s third largest commuter rail system, with 409 unduplicated route miles. Metrolink is the largest transportation provider for inter-county travel in Southern California. Metrolink service encompasses 2.8 million train miles annually. Metrolink is the second largest transit provider in Southern California, in terms of passenger miles, servicing more than 400 million passenger miles annually. Each weekday, Metrolink riders travel more than 1.3 million miles, nearly enough to cover three roundtrips to the moon. 81% of Metrolink weekday trips are work related. 60% of Metrolink riders travel across county lines constituting a truly regional system. 47% of all Metrolink boardings are in LA County. June 23,


11
12 1.3 Metrolink in Comparison Agency Avg Fare/ Passenger Revenue/ Passenger mile Revenue/ Train mile Operating cost/ Train mile Operating Cost/ Passenger Operating Cost/ Passenger Mile Subsidy/ Passenger Subsidy/ Passenger Mile Farebox Recovery Ratio METROLINK $5.95 $0.20 $30.87 $77.11 $14.86 $0.51 $8.91 $ % Commuter Rail Maryland Transit Administration MTA $4.66 $0.16 $36.52 $ $15.36 $0.52 $10.70 $ % Massachussetts Bay Transportation Authority MBTA $3.79 $0.18 $30.43 $98.90 $12.31 $0.60 $8.52 $ % Northeaster Illonois Regional Commuter Railroad METRO $4.65 $0.21 $48.97 $ $9.73 $0.44 $5.08 $ % Peninsula corridor Joint Powers Board CALTRAIN $4.39 $0.18 $61.19 $84.73 $6.08 $0.24 $1.69 $ % Southeastern Pennsylvania Transportation Authority SEPTA $4.02 $0.31 $30.26 $53.92 $7.17 $0.55 $3.14 $ % Virginia Railway Express VRE $8.15 $0.24 $ $ $14.61 $0.43 $6.46 $ % Local Transit Agencies Los Angeles County Metropolitan Transportation Authority METRO $0.78 $0.17 N/A N/A $3.06 $0.67 $2.28 $ % Riverside Transit Agency RTA $1.04 $0.15 N/A N/A $5.19 $0.75 $4.15 $ % OMNITRANS $0.96 $0.20 N/A N/A $4.13 $0.87 $3.17 $ % Orange County Transportation Authority OCTA $1.27 $0.28 N/A N/A $5.16 $1.13 $3.88 $ % Source: FY2015 NTD Data Metrolink compares favorably with other forms of Southern California mass transit, as well as with the largest commuter rail organizations in the nation. As shown in the chart above, Metrolink s operating cost per train mile and per passenger mile is lower than many of the largest rail lines. While maintaining this exceptional performance, SCRRA works continuously to achieve new goals and meet new challenges to better serve our customers and the community. The leading-edge technology Metrolink brings to the service of our customers also improves our internal efficiency. 1.4 Accomplishments in FY Below are highlights of Metrolink accomplishments during FY : Metrolink continued to be the nation s only commuter railroad to achieve Positive Train Control (PTC) in-service on all the train lines that it services and manages on behalf of its Member Agencies. PTC is the centerpiece of our unwavering focus on safety, providing protective collision avoidance and over-speed prevention. Metrolink was one of the earliest implementers of mobile ticketing technology. Mobile ticketing allows passengers to conveniently purchase tickets on their mobile devices. In the first full year since launch, passenger use of mobile ticketing exceeded all expectations. The average adoption rate across the entire system is currently at 22%, while our Inland Empire/Orange County line reached a 53% adoption rate in May June 23,
13 A pilot program adding the convenience of Sunday Service on 6 national holidays was well received by passengers resulting in a farebox recovery rate of 55%. These positive results have led the Authority to conduct a full year pilot program in FY to measure passenger response. FY has seen the first full year of the extension of the 91 Line, providing new service from Riverside to Perris Valley, adding 4 new stations, 23 miles to our routes, and 71,760 train miles to our service. The Metrolink 91/Perris Valley Line Extension Project, funded by Riverside County Transportation Commission (RCTC), was selected by California Transportation Foundation as the 2016 Transit Project of the Year. A total of eleven new Tier 4 Locomotives arrived in FY When all these state-of-the-art locomotives are in service, they will eliminate up to 500 tons of emissions annually. This will achieve the elimination of 70% of current emissions. In FY , a proposed project system allowed us to produce a detailed listing of all rehabilitation needed on Metrolink rail, bridges, structures and rolling stock, allowing us to better communicate the extent of current maintenance needs to our Member Agencies. The Project Delivery Improvement Program (PDIP) was instituted to ensure maximum efficiency and effectiveness in the delivery, record keeping, and billing of Rehabilitation, New Capital and Third Party projects. In December 2016, a Transit Asset Management Plan (TAM) and a TAM Policy conforming to the statutory requirements of MAP-21, was adopted by the SCRRA Board for implementation agency-wide. A major milestone was reached in our goal to be employer of choice with the completion of a comprehensive Class and Compensation Study was completed by our Human Resources Department in collaboration with Segal Waters Consulting. A peer review of the Metrolink Internal Audit Department by the Association of Local Government Auditors returned a clean review stating the following: The Metrolink Marketing Department had again garnered an AdWheel (APTA) Grand Prize for 5 years running. In 2017, the wins were: Grand Prize Mobile Ticketing 1 st Place I-5 Billboard 1 st Place Mobile Ticketing June 23,
14 1.5 Objectives for FY The FY Budget reflects objectives and priorities consistent with the back to basics approach outlined in our Strategic Plan, adopted by the SCRRA Board in March The budget provides funding in alignment with the Authority s strategic goals, and includes the following priorities for the upcoming fiscal year: Continue emphasis on safe operations, with the perfected operation of Positive Train Control (PTC) as the centerpiece of our efforts. Enhance customer experience, implementing upgrades to the mobile ticketing application and modernize ticket vending system. Implement additional one-year pilot program to provide our passengers the added convenience of Sunday Service on the 6 national holidays. Passenger response to this service will be monitored to determine whether this service will become permanent. Increase ridership and regional mobility by way of new San Bernardino Transit Center. Enhance reliability and on-time performance, through fleet improvement provided by the arrival of an additional 29 new Tier 4 Locomotives during FY ; in combination with an adherence to regular performance of required equipment maintenance consistent with the Fleet Management Plan. Secure funding to maintain existing assets in a state of good repair and determine a path forward to ensure funding availability in the future. Completion of the Project Delivery Improvement Program (PDIP) to improve processes accelerating project delivery. Implement a process to maximize use of newly available Federal Preventive Maintenance funds to supplement Member Agency subsidies. Implement the Transit Asset Management plan agency-wide, optimizing safety and maximize benefit of capital investments while extending the useful life of assets. Execution of fuel hedging program to better stabilize the fuel budget, an expense that represents almost 10% of our annual budget. Incorporate recommendations from the Class and Compensation Study. Ongoing workforce development by training and engaging employees. 1.6 FY Budget in Brief The FY Operating Budget of $243.0 million is a decrease of 0.3% from the FY Adopted Budget. The Capital Program seeks $94.9 million in additional capital authorization: $89.6 million in New Authority for Rehabilitation Projects and $5.3 million in New Authority for New Capital Projects. Total SCRRA revenues are $100.6 million, 1.2% less than the FY Adopted Budget. June 23,
15 Member Agency subsidies are $142.4 million, an increase of $0.4 million or 0.3% over the FY Adopted Budget. The FY Budget, as adopted, was modified to the amount approved by each Member Agency for Operating and Rehabilitation/New Capital during their respective budget adoption processes. The Operating Budget was adopted as proposed while the additions to the Capital Program Budget were adopted in the amount of $56.6 million for Rehabilitation and $2.8 million for New Capital. Staff is in continued discussion to fully fund the Capital Program request for FY The primary objective is to secure funding necessary to "ensure safe and reliable train operations", maintain a State of Good Repair and provide continued investment in our identified backlog of prior years Deferred Maintenance. We are hopeful that a mid-year budget adjustment can be executed that will allow these FY Rehabilitation and New Capital Projects to proceed in a timely manner. 1.7 Key FY Budget Information SCRRA is a Joint Exercise of Powers Authority (JPA) originally created to plan, design, build and operate the Metrolink commuter rail service in the Southern California region. In FY , Metrolink will provide service on 7 routes to 60 stations with over 536 route miles. The system map is provided as Exhibit 1.1. During FY , Metrolink will operate 171 weekday trains and 90 weekend trains. Average weekday one-way ridership is projected at 39,885 daily. Additionally, we estimate 21,580 riders will take advantage of Saturday and Sunday services offered on the Antelope Valley, Inland Empire-Orange County, Orange County, 91, and San Bernardino lines. Metrolink operates approximately 75% of Member Agency-owned territory. Daily, SCRRA will dispatch 171 Metrolink trains and up to 34 Amtrak and 60 freight trains. Metrolink is also responsible for the maintenance of right-of-way owned by SCRRA Member Agencies that span 392 track miles. SCRRA s Capital Program includes ongoing rehabilitation of right-of-way, facilities, equipment and rolling stock, and expansion of the commuter rail system through the acquisition and construction of new assets. 1.8 The FY Operational Budget Statistics Operating Expenses per train mile are $85.54, excluding MOW extraordinary maintenance (0.1% decrease from the FY Adopted Budget). Subsidy per passenger mile equals $0.35 (a 6.8% increase from the FY Adopted Budget). Operating Expense per passenger mile is $0.60 (a 6.4% increase from the FY Adopted Budget). June 23,
16 Total revenue recovery is projected to equal 41.4% (a 0.9% decrease from the FY Adopted Budget). Farebox recovery is projected at 35.1% (a 0.9% increase from the FY Adopted Budget). Member Agency subsidies are estimated to provide 58.6% of the required Operating Revenues in FY Diesel fuel costs will be managed using a fuel hedging program which is expected to assist in stabilizing the fuel budget. 1.9 Administrative Requirements Under the terms of the JPA establishing SCRRA, the Chief Executive Officer submits a Preliminary Fiscal Year Budget for the following fiscal year to the SCRRA Board for transmittal to Member Agencies no later than May 1 of each year. The Preliminary Budget includes projected Authority revenues, administrative and operating costs, and capital project carryforwards and requests. The net of revenues and expenses represent the anticipated Member Agency subsidies required to carry out the purposes of the Authority. Decisions involving capital, operating fund allocations, and annual approval of each Member Agency s share of SCRRA s annual budget, require approval by the Member Agencies. The SCRRA Board approved the transmittal of the FY Preliminary Budget on April 21, 2017, and the document was submitted to the Member Agencies on May 1, A revision was then made upon further review of the April 21, 2017 Board Meeting minutes related to the transmitted FY Preliminary Budget, which indicated an additional $777K to be included as a potential increase for the Rail-2-Rail Program. The revised budget document accommodating this change was forwarded to Member Agencies on May 5, At the May 12, 2017 Board Meeting, further revisions were requested by the SCRRA Board, including a oneyear pilot program for Sunday Service on Holidays and several IT Projects. The resulting budget document and transmittal letter was forwarded to Member Agencies on May 18, The FY18 budget was adopted by the SCRRA Board on June 23, Budget Development and Assumptions The development of SCRRA s FY Budget was based on revenues, operating costs, and capital investment required to provide a safe, efficient and reliable commuter rail operation. The SCRRA budget is made up of two principal components: Operating Budget (Train Operations, Maintenance-of-Way (MOW), and Insurance) and, Capital Program (Rehabilitation Projects and New Capital Projects). June 23,
17 Funding for these costs is derived from SCRRA fare revenue and other income, with the balance provided by grants and subsidies paid by the five Member Agencies. Under the terms of the JPA, each Member Agency approves its individual Operating and Capital subsidies for the upcoming fiscal year. These subsidies are based on a series of formulated allocations that distribute revenue and costs across operating line segments and Member Agencies. In FY , Member Agencies requested SCRRA identify a consulting firm to reevaluate SCRRA allocation formulas and methodology. This ensures that the current system produces the fairest and most equitable distribution of costs among the Member Agencies. In July 2016, an agreement was signed with AECOM to contract LTK Engineering Services in providing consultation services. The cost allocation review study began in September 2016 with our consultant surveying and holding individual meetings with each Member Agency. With an analysis of the impacts of alternative allocations, and comments from the Member Agencies, the allocation consultant researched how peer agencies in the United States allocated the cost of commuter rail service. Member Agencies received formal and informal comments, and the consultant plans to present a draft proposal to the working group on July 14, 2017, and a subsequent presentation at the CEO Meeting on July 21, Summary of Operating Revenues and Subsidy Funding SCRRA generates Operating Revenue from four principal sources: Fares, Dispatching, Maintenance-of-Way (MOW), and Other Revenue. Fare Revenues The FY Budget assumes ridership of 11.5 million passengers will generate Fare Revenues equal to $85.2 million, an increase of $0.6 million or 0.7% from the FY Adopted Budget. The FY Budget includes continued implementation of the Fare Enforcement Policy, including enhanced fare enforcement efforts on the Antelope Valley Line to be funded by Metro, and a 25% fare reduction on the Antelope Valley Line, also funded by Metro. Dispatching Revenue As the operating administrator of its member-owned rightsof-way, SCRRA receives revenues from freight railroads and Amtrak Intercity Services for the right to operate in its territories. These revenues are volumebased, and individual rates are contained in existing agreements that govern rate increases. The total dispatching revenues are projected at $2.1 million; $0.5 million less than the FY Adopted Budget, and consistent with FY estimated actual revenue forecasted in the Third Quarter. Maintenance-of-Way (MOW) Revenue Member Agency subsidies for ordinary maintenance are partially offset by revenues received from freight railroads and Amtrak Intercity Services. Most of the MOW revenue rates were negotiated based on the historical expenditures on Maintenance-of-Way by freight railroads prior to the purchase of these right-of-way properties by the Member Agencies. Consequently, these revenue rates do not completely offset the escalating costs June 23,
18 of maintaining a higher standard of quality for passenger rail service. The FY Budget projects MOW revenues at $13.4 million, which is $1.3 million, or 8.8% less than the FY Adopted Budget. The reduction is primarily related to lower revenue from Union Pacific on the Saugus line where revenues are calculated on the basis of freight traffic (car miles). The most recent annual cost reconciliation, resulted in the establishment of rates which create revenue lower by $1.1 million. This is, however, an upward trend from estimated actual FY Other Revenues SCRRA will continue to offer advertising space on Metrolink trains to select organizations. We have budgeted $12K for FY Summary of Operating Expenses In FY , SCRRA s Operating Expenses include Train Operations, Maintenance-of-Way (MOW) and Insurance. The combined total expense for the FY Budget is $243.0 million. Train Operations A variety of expenses are included in the broad category of Train Operations. These include: operating crews, dispatching, equipment maintenance, fuel, non-scheduled rolling stock repairs, operating facilities maintenance, rolling stock lease payments, sheriffs and security guards, public safety programs, passenger relations, Ticket Vending Machine maintenance, revenue collection, marketing and market research, media/external relations, utilities and leases, passenger transfers to other operators, Rail-2-Rail program, station maintenance, freight rail agreements, and general administrative costs that support the Authority s operation. Total Train Operations costs are $183.8 million, a 1.4% increase over the FY Adopted Budget. MOW Ordinary and extraordinary maintenance of Member Agency-owned track, signals, bridges, road crossings, other elements of the infrastructure, and rightsof-way totals $41.6 million. This is a 4.7% increase over the FY Adopted Budget. Insurance Insurance expenses of $17.7 million increased by 5.2% over the FY Adopted Budget Summary of Capital Program SCRRA s overall Capital Program Budget consists of two major components totaling $395.2 million. The Authority s Rehabilitation and New Capital programs, which total $177.0 million and $218.2 million, respectively. The Rehabilitation component is comprised of $87.5 million in carryforward from prior years, and the FY request for additional Rehabilitation authority of $89.6 million. The New Capital component is comprised of $212.9 million in carryforward from prior years, and the FY request for additional New Capital authority of $5.3 million. June 23,
19 The FY Budget, as adopted, was modified to the amount approved by each Member Agency for Operating and Rehabilitation/New Capital during their respective budget adoption processes. The Operating Budget was adopted as proposed while the additions to the Capital Program Budget were adopted in the amount of $56.6 million for Rehabilitation and $2.8 million for New Capital. Staff is in continued discussion to fully fund the Capital Program request for FY The primary objective is to secure funding necessary to "ensure safe and reliable train operations", maintain a State of Good Repair and provide continued investment in our identified backlog of prior years Deferred Maintenance. We are hopeful that a mid-year budget adjustment can be executed that will allow these FY Rehabilitation and New Capital Projects to proceed in a timely manner. As adopted for FY , the Capital Program Budget reflects new projects totaling $56.6 million for Rehabilitation and $2.8 million for New Capital. When combined with carryforward from prior years the Capital Program Budget totals $359.8 million with $144.1 million in Rehabilitation and $215.7 million in New Capital. A detailed schedule is shown in Section 7 of this Budget Document. Rehabilitation projects within the program renovate or remanufacture worn-out assets to preserve and/or extend the useful life of the asset. New Capital projects expand the railroad infrastructure, and include items such as sidings, additional track, material upgrades of the signals and communication systems and new rolling stock. June 23,


20
21 This page intentionally left blank June 23,
22 SOUTHERN CALIFORNIA REGIONAL RAIL AUTHORITY FY BUDGET SECTION 2: Introduction to the Budget 2.1 Mission Statement Our mission is to provide safe, efficient, dependable and on-time transportation service that offers outstanding customer experience and enhances quality of life. Metrolink is a premier regional rail system that links passengers to employment and activity centers. Metrolink accomplishes its mission by employing state-of-the-art safety operations technology for which it is known throughout the country. Metrolink is proud to provide affordable, dependable, and high-quality service to its customers. Metrolink s strategically located network of lines and stations, and connection with other modes of transit, provide the most cost-effective method of removing cars from the Southern California freeway system. Metrolink embraces community involvement and partnerships with both public and private sectors. June 23,
23 2.2 Board Governance The SCRRA Board Roster, as of June 30, 2017, consists of 11 voting members and 11 alternates: County Votes Members Alternates Riverside County 2 Andrew Kotyuk (Chair) Council Member City of San Jacinto RCTC Board Debbie Franklin Mayor Pro Tem At Large City of Banning RCTC Board Brian Berkson 1 Council Member City of Jurupa Valley RCTC Board Adam Rush 1 Council Member City of Eastvale RCTC Board Ventura County 1 Brian Humphrey (Vice-Chair) Citizen Representative VCTC Board Ginger Gherardi Vice Mayor City of Santa Paula VCTC Board Los Angeles County 4 Ara Najarian (2 nd Vice Chair) Councilmember City of Glendale Metro Board Kathryn Barger Supervisor, 5 th District County of Los Angeles Metro Board Paul Krekorian Councilmember, 2 nd District City of Los Angeles Metro Board Hilda Solis Supervisor, 1 st District County of Los Angeles Metro Board Walter Allen, III Mayor Pro Tem City of Covina Metro Appointee Roxana Martinez Metro Appointee Borja Leon Metro Appointee Joseph J. Gonzales Councilmember City of South El Monte Metro Appointee San Bernardino County 2 Larry McCallon Mayor Pro Tem City of Highland SBCTA Board Paul Eaton Mayor City of Montclair SBCTA Board Jon Harrison 1 Council Member City of Redlands SBCTA Board Alan D. Wapner 1 Council Member City of Ontario SBCTA Board June 23,
24 Orange County 2 Shawn Nelson Supervisor, 4 th District County of Orange OCTA Board Gregory T. Winterbottom Public Member OCTA Board Laurie Davies 1 Council Member City of Laguna Niguel OCTA Board Richard D. Murphy 1 Council Member City of Los Alamitos OCTA Board Ex-officio members of SCRRA: Agency Southern California Association of Governments (SCAG) San Diego Association of Governments (SANDAG) State of California: Department of Transportation (Caltrans) Ex Officio Members Art Brown Council Member, City of Buena Park Currently awaiting appointment Contact: Linda Culp Principal Planner Rail Ryan Chamberlain Director, Caltrans District 12 Alternate: Gary Slater Deputy Director, Caltrans, District 7 SCRRA has organized the Authority into cost centers under business units to support core functionalities, institute best practices and increase overall efficiency. These business units include: Executive Office: Operations Office: External Affairs: General Counsel Office: Finance Office: Internal Audit Office: Arthur T. Leahy, Chief Executive Officer Elissa K. Konove, Deputy Chief Executive Officer Gary Lettengarver, Chief Operating Officer Patricia Bruno, Chief of External Affairs Don O. Del Rio, General Counsel Ronnie Campbell, Chief Financial Officer Elisabeth Lazuardi, Audit Manager The FY Budget includes 273 authorized positions, a reduction of 2 positions from the FY Adopted Budget. 1 Alternates represent either member June 23,
25 2.3 SCRRA Background In June 1990, the California Legislature enacted Senate Bill 1402, Chapter 4 of Division 12 of the Public Utilities Code. This bill required each transportation commission of the counties of Los Angeles, Orange, Riverside, San Bernardino, and Ventura to jointly develop a plan for regional transit services within the multicounty region. In August 1991, the Southern California Regional Rail Authority (SCRRA), a regional Joint Powers Authority (JPA), was formed. Voting members with their respective number of votes are: Los Angeles County Metropolitan Transportation Authority (Metro), four votes; Orange County Transportation Authority (OCTA), two votes; Riverside County Transportation Commission (RCTC), two votes; San Bernardino County Transportation Authority (SBCTA), two votes; and Ventura County Transportation Commission (VCTC), one vote. These five county transportation commissions are defined as SCRRA s Member Agencies. Ex-officio members of SCRRA include the Southern California Association of Governments (SCAG), the San Diego Association of Governments (SANDAG) and the State of California Department of Transportation (Caltrans). The purpose of the newly formed SCRRA was to plan, design, construct and administer the operation of regional passenger rail lines serving the counties of Los Angeles, Orange, Riverside, San Bernardino and Ventura. The SCRRA named the regional commuter rail system "Metrolink". Metrolink has grown from just three lines in 1992 to seven lines today. The first three lines - San Bernardino, Santa Clarita (now Antelope Valley) and Ventura County - began operation in October The Riverside Line was added in June 1993, and the Orange County Line (which extends 19 miles into northern San Diego County) was added in April The sixth line, Inland Empire-Orange County, the nation s first suburb-to-suburb commuter rail line, was added in October In May of 2002, the 91 Line was added to provide an alternative to Inland Empire and western Orange County commuters traveling through Fullerton. In June 2016, the 91 Line was extended to Perris Valley to provide service to an additional section of the Inland Empire. June 23,
26 SOUTHERN CALIFORNIA REGIONAL RAIL AUTHORITY FY BUDGET SECTION 3: Budget Summary 3.1 Budget Policy Budget Authorization The primary objective of the SCRRA Budget is to provide the financial road map to achieve the Authority s priorities and objectives as presented in the SCRRA 10- Year Strategic Plan. The objective is consistent with its provision of safe, reliable, and high-quality commuter rail service under the Metrolink banner. The Operating Budget provides funds to enable the provision of such rail service and the associated administrative functions to manage that service, for the period of a single fiscal year. The Capital Program budget approves multi-year individual projects that may proceed within the approved funding level. The SCRRA Board must adopt a final budget no later than June 30 of each year. The Budget shall contain a financial plan that includes: Goals and objectives for the new fiscal year Assumptions underlying revenue and expense projections Planned service for the following fiscal year Summarized Revenue Budget Summarized Operating Budget Revenue sources by line item Expenses by summary line item Authorized headcount roster In adopting the budget and any Board-initiated amendments, the Board authorizes SCRRA to expend funds under the direction of the Chief Executive Officer consistent with: Total amount appropriated for Train Operations and Maintenance-of-Way (MOW) Total amount appropriated for each Rehabilitation and New Capital project Individual Member Agency funding commitments Total number of authorized positions June 23,
27 3.1.2 Budgetary Control and Reporting Budgetary control refers to SCRRA s approved procedures for monitoring actual expenses against planned expenditures as adopted in the annual budget. The introduction of controls by the project and task elements were installed coincident with the Oracle R12 implementation in Absolute budgetary controls with respect to project and task elements are maintained in the financial information system. The system is designed to prevent spending which exceeds the approved budget with regard to these elements without specific documented approval. By adopting an annual budget, the SCRRA Board delegates to the Chief Executive Officer the authority to manage the annual budget within the following parameters: A budget transfer represents changes in projected expenses between line items within or across departments in the budget. The Office of Finance shall review the impact of any requested budget transfer to ensure no amount above the approved subsidy level will accrue to any individual member as a result of the transfer. Transfers must be approved by the Chiefs of all business units involved in the transfer. Documentation of approved transfers are maintained by the Office of Finance. Certain budget transfers may require Board approval and result in Budget Amendments. Budget Amendments will be submitted to the Board, as required, when a budget transfer: Negatively impacts Member Agency funding commitments Negatively impacts the total Operating Budget or individual capital projects Increases the total authorized level of personnel The SCRRA Board, by approving a Budget Amendment, amends the Adopted Budget for the fiscal year. Budget Amendments that require an increase in a Member Agency s funding commitment additionally requires the approval of that Member Agency. The Adopted Budget, or subsequently Amended and Adopted Budget, is the baseline for all comparisons to actual revenue and expenditures during a fiscal year. Operational Statements with accompanying reports, comparing budget to actual for the year-to-date are presented to the SCRRA Board each quarter. Forecasts to the end of the current fiscal year are provided in the second, third and fourth quarter. Internal performance reporting, periodic forecasting and the preparation of the Comprehensive Annual Financial Report (CAFR) also provide tools for managing and reporting Authority activities compared to the budget plan. June 23,
28 3.1.3 Accounting Methodology SCRRA reports its financial position and activities as a special-purpose governmental entity engaged in business-type activities and presents financial statements required for enterprise funds. The accrual basis of accounting is utilized. Under this method, revenues are recorded when earned and expenses are recorded at the time liabilities are incurred. SCRRA, as part of its implementation of Government Accounting Standards Board Pronouncement 34 (GASB-34), has elected to use the Modified Approach for the Metrolink Railroad Infrastructure. Under the Modified Approach, infrastructure assets that are part of a network, or subsystem of a network, are not required to be depreciated as long as two requirements are met: 1) The government manages the eligible infrastructure assets using a qualified asset management system. 2) The government documents that the eligible infrastructure assets are being preserved approximately at (or above) a condition level established and disclosed by the government. The SCRRA Board adopted a condition rating of 75 points (of a maximum of 100) as the minimum acceptable Railroad Condition Index (RCI) for the entire railroad network, including all subsystems. The actual index value of the condition of SCRRA s infrastructure network was 81 as of June 30, 2015, as determined by a systemwide assessment. In accordance with GASB-34, the next systemwide condition assessment is due for the year ending June 30, As an approved alternative to conducting a systemwide assessment every three years, SCRRA has chosen to perform annual assessments of a third of its infrastructure so that all assets will have been reviewed over the three-year period. For a complete description of the rating values and their meanings, please see Section 10.5 Appendix Budget Assumptions Ridership has remained unchanged for several years. On this basis, it was determined prudent to hold fare revenue flat. No fare increase is included in the FY Budget. No new service has been added. The approach for budgeting was a zero base. Equipment Maintenance is comprised of the contract with Bombardier for providing equipment maintenance. This category also includes cost of parts for the repair of rolling stock which are projected based on Fleet Maintenance plans. June 23,
29 The budget for fuel purchases has been calculated using an assumption of the consumption of 9 million gallons of diesel fuel, with fuel prices managed through a hedging program. 3.2 Total Operating Budget SCRRA s FY budgeted Operating Expense totals $243.0 million, a decrease of $0.8 million, or 0.3% less than the FY Adopted Budget. Total Operating Revenues are projected to total $100.6 million, $1.2 million less than the FY Adopted Budget, a decrease of 1.2%. Member Agency operating subsidies for the year are an estimated $142.4 million, an increase of $0.4 million, or 0.3% over the FY Adopted Budget. 3.3 Operating Revenues and Subsidy Funding The Authority s Operating Revenue is derived from three principal sources: Fares, Dispatching and Maintenance-of-Way (MOW). In order to minimize the impact to Member Agency subsidy requirements, the Authority continues to pursue, where available, other potential revenue enhancements. One revenue source currently under consideration is a fee for the provision of our PTC expertise to other entities. Average weekday ridership is projected to total 39,885 thousand. Total ridership, including all weekend services, is expected to equal 11.5 million passenger trips. Fare revenues are assigned to the operating line segment using Origin/Destination pairs, passenger and train counts (shared stations and weekends). Farebox Revenue is projected to equal $85.2 million, an increase of $0.6 million or 0.7% more than FY Adopted Budget. No fare increase is included in the FY Budget. Freight railroads and Amtrak Intercity Services operating over territory owned by SCRRA Member Agencies provide dispatching and MOW revenues, based upon existing agreements. Dispatching Revenues are estimated to equal approximately $2.1 million, a decrease of 18.0% from FY Adopted Budget, as a result of reduced on-time performance by Amtrak. MOW revenues are estimated at $13.4 million, a decrease of 8.8% from FY Adopted Budget, as a result of reduced freight traffic. 3.4 Operating Expenses Total Operating Expenses include Train Operations, maintenance of Member Agency-owned rights-of-way and insurance. The FY Budget includes a Train Operations budget of $183.8 million, Maintenance-of-Way (MOW) budget of $41.6 million, and Insurance budget of $17.7 million. The total of $243.0 million is a decrease of $0.8 million or 0.3% less than the FY Adopted Budget. June 23,

30
31 3.7 Exhibits Exhibits 3.1a 3.1d: Summary of FY to FY Statistics by Line provide the estimated operating statistics by line for FY and the calculation of various performance ratios. Revenues and expenses are allocated to lines using formulae that associate rail operational statistics to achieve an equitable distribution. Detailed listings of allocation categories and the methodology of their use is detailed in Sections 8 - General and Administrative Budget. Section 10 Appendix, Exhibit 10.2 details the percentages utilized to allocate by operating line. Average trip length for FY is projected at 34.8 miles. Dependent on ridership and revenues received, individual line operating statistics vary considerably. The Orange County Line (including MSEP) has the highest revenue recovery rate at 61.8%. The San Bernardino revenue recovery is estimated at 47.9%, the Riverside Line at 44.3%, the IEOC Line at 34.2%, the Antelope Valley Line at 34.4%, the Ventura County Line at 29.0%, and the 91 Line at 27.1%. Exhibits : Performance Data (FY to FY ) provide a summary of the projected annual operating performance data as represented in the FY Budget compared to the FY Adopted Budget and 24 years of historical actuals since FY Exhibit 3.2 through 3.5, displays this information in an expanded and graphic form to provide illustrative and trending prospective. Exhibit 3.2: Exhibit 3.3: Exhibit 3.4: E Exhibit 3.5: Operating Expense, Revenues and Operating Subsidy Train Miles, Fares and Average Weekday Ridership Revenue Recovery, Farebox Recovery and Operating Expense per Train Mile Operating Expense per Passenger Mile, Operating Subsidy per Rider and Operating Subsidy per Passenger Mile Exhibit 3.6: FY to FY Annual Operating Budget by Cost Component by Fiscal Year displays the line items that comprise the FY Operating Budget and includes both Revenues and Expenses, with each line broken out by key components. This exhibit breaks down projected expenses for SCRRA s FY Budget and compares these with actual expenses for the fiscal years FY to FY and the FY Adopted Budget. Operating Expenses include all costs required to operate the Metrolink system including Train Operations, maintenance of equipment, fuel, security, utilities, transfer payments to other transit operators, revenue collection, payments to freight railroads for dispatching, station maintenance, passenger services, Maintenance-of-Way (MOW), general and administrative expenses, professional services and insurance. For FY and FY , these expenses included the BNSF Lease Locomotive costs. Exhibit 3.7: FY Annual Operating Budget by Cost Component by Member Agency includes the line items that comprise the FY Budget (both Revenues and Expenses) with each line broken out by key components and June 23,
32
33 subsidies at $142.4 million, a 0.3% increase over FY Adopted Budget. With respect to Capital Revenues: The amounts shown can be traced to the Cash Flows shown in Exhibit of $4.7 million added to the Carryover spending of $176.9 million. Total dollars are separated into funding categories, including state and federal grants, interest on lease proceeds, freight railroad and local funds. The FY Budget detailed allocations are compared to budgeted or actual funding sources for FY through FY See proviso regarding budget modifications in second paragraph of Section 3.6. Exhibit 3.9: FY Budget Revenue Sources and Use by Member Agency provides a summary of the FY Budget Revenue Source and Use to cover Operating Expenses of $243.0 million and capital program authority of $181.6 million by Member Agency. Operating Budget expenses represent only FY expenditures, while the Capital Program Budget includes both current year and carryover Board approved authority. Total dollars are separated into funding categories including state and federal grants, interest on lease proceeds, freight railroad participation and local funds. See proviso regarding budget modifications in second paragraph of Section 3.6. June 23,
34 Exhibit 3.1a Summary of FY to FY Statistics by Line San Ventura Antelope Orange Orange Co 91/ LINE Bernardino County (1) Valley Riverside County MSEP IEOC PVL Line (2) Total Service Levels Weekday Train Trips - FY 16 Actual Weekend Train Trips - FY 16 Actual Total Train Trips - FY 16 Actual Weekday Train Trips - FY 17 Budget Weekend Train Trips - FY 17 Budget Total Train Trips - FY 17 Budget Weekday Train Trips - FY 18 Budget Weekend Train Trips - FY 18 Budget Total Train Trips - FY 18 Budget Passenger Boardings (3) FY16 Actual 3,073, ,336 1,847,900 1,144,944 2,379,192 89,756 1,251, ,288 11,504,399 FY17 Budget 3,074,700 1,029,879 2,090,009 1,171,603 2,704,372 97,773 1,294, ,031 12,201,102 FY18 Budget 2,731,308 1,056,752 1,635, ,769 2,689,140 87,620 1,458, ,324 11,492,287 % Change-FY16 Actual to FY18 Budget (11.1%) 7.6% (11.5%) (13.8%) 13.0% (2.4%) 16.5% 15.2% (0.1%) % Change-FY17 Budget to FY18 Budget (11.2%) 2.6% (21.8%) (15.8%) (0.6%) (10.4%) 12.6% 14.8% (5.8%) Service Train Miles FY16 Actual 658, , , , ,669 92, , ,450 2,727,922 FY17 Budget 663, , , , ,750 93, , ,353 2,829,668 FY18 Budget 663, , , , ,750 93, , ,353 2,829,668 % Change-FY16 Actual to FY18 Budget 0.9% 1.3% 1.4% 1.3% 1.2% 1.3% 1.9% 42.9% 3.7% % Change-FY17 Budget to FY18 Budget 0.0% 0.0% 0.0% 0.0% 0.0% 0.0% 0.0% 0.0% 0.0% Passenger Miles (000s) (4) FY16 Actual 110,470 26,040 71,701 40,069 84,030 1,043 41,548 28, ,923 FY17 Budget 110,479 26,947 80,035 40,825 93,774 1,662 45,812 28, ,485 FY18 Budget 98,714 27,651 62,518 34,384 93,867 1,490 50,089 33, ,238 % Change-FY16 Actual to FY18 Budget (10.6%) 6.2% (12.8%) (14.2%) 11.7% 42.8% 20.6% 19.6% (0.2%) % Change-FY17 Budget to FY18 Budget (10.6%) 2.6% (21.9%) (15.8%) 0.1% (10.4%) 9.3% 15.8% (6.1%) Average Weekday Ridership FY16 Actual 10,744 3,959 5,886 4,651 8, ,613 2,419 41,355 FY17 Budget 10,779 3,890 5,929 4,679 8, ,508 2,317 41,186 FY18 Budget 9,104 4,064 5,421 3,795 9, ,599 2,925 39,885 % Change-FY16 Actual to FY18 Budget (15.3%) 2.7% (7.9%) (18.4%) 7.5% 98.3% (0.3%) 20.9% (3.6%) % Change-FY17 Budget to FY18 Budget (15.5%) 4.5% (8.6%) (18.9%) 9.2% 24.5% 2.0% 26.3% (3.2%) Average Trip Length (Miles) (5) Numbers may not foot due to rounding. (1) Includes LAUS - Burbank Bob Hope Airport Trains. (2) Includes PVL Services (3) Passenger Boardings are based on ticket sales and unlinked trips (4) Passenger is calculated based on ticket sales with origin and destination (5) Average trip length is calculated based on ticket sales June 23,
35 Exhibit 3.1b Summary of FY to FY Statistics by Line San Ventura Antelope Orange Orange Co 91/ LINE Bernardino County Valley Riverside County MSEP IEOC PVL Line Total Operating Cost (w/ MOW) (1) FY16 Actual 50,615 27,768 47,180 19,492 32,689 6,010 25,470 17, ,680 FY17 Budget 53,373 28,727 49,960 20,658 34,592 5,866 27,781 22, ,814 FY18 Budget 52,441 28,914 49,562 20,339 34,905 6,261 27,282 23, ,045 % Change-FY16 Actual to FY18 Budget 3.6% 4.1% 5.0% 4.3% 6.8% 4.2% 7.1% 33.7% 7.2% % Change-FY17 Budget to FY18 Budget (1.7%) 0.7% (0.8%) (1.5%) 0.9% 6.7% (1.8%) 2.1% (0.3%) Operating Cost (w/o MOW Extraordinary Maint) (1) FY16 Actual 50,282 27,538 46,935 19,285 32,434 6,010 25,267 17, ,163 FY17 Budget 53,042 28,498 49,706 20,466 34,350 5,866 27,590 22, ,325 FY18 Budget 52,215 28,757 49,377 20,221 34,750 6,261 27,161 23, ,044 % Change-FY16 Actual to FY18 Budget 3.8% 4.4% 5.2% 4.9% 7.1% 4.2% 7.5% 33.8% 7.5% % Change-FY17 Budget to FY18 Budget (1.6%) 0.9% (0.7%) (1.2%) 1.2% 6.7% (1.6%) 2.2% (0.1%) Operating Cost (w/o MOW) FY16 Actual 39,235 21,091 38,053 18,269 27,867 5,269 21,751 15, ,227 FY17 Budget 41,825 22,714 41,395 19,471 30,064 5,170 23,885 19, ,223 FY18 Budget 40,696 22,454 40,439 19,152 29,922 5,477 23,335 19, ,438 % Change-FY16 Actual to FY18 Budget 3.7% 6.5% 6.3% 4.8% 7.4% 3.9% 7.3% 27.2% 7.6% % Change-FY17 Budget to FY18 Budget (2.7%) (1.1%) (2.3%) (1.6%) (0.5%) 5.9% (2.3%) 1.3% (1.4%) Subsidy (w/mow) FY16 Actual 24,588 19,240 30,502 10,353 8,924 5,287 15,817 12, ,173 FY17 Budget 27,137 19,971 32,930 11,545 10,202 4,799 18,222 17, ,989 FY18 Budget 27,327 20,547 32,511 11,332 10,670 5,050 17,950 17, ,399 % Change-FY16 Actual to FY18 Budget 11.1% 6.8% 6.6% 9.5% 19.6% (4.5%) 13.5% 36.5% 12.0% % Change-FY17 Budget to FY18 Budget 0.7% 2.9% (1.3%) (1.8%) 4.6% 5.2% (1.5%) (1.0%) 0.3% Farebox Revenue FY16 Actual 22,419 6,467 11,669 8,870 21, ,473 4,830 84,524 FY17 Budget 22,604 6,574 10,829 8,910 21, ,312 4,924 84,582 FY18 Budget 21,493 6,230 12,122 8,780 21, ,173 5,580 85,159 % Change-FY16 Actual to FY18 Budget (4.1%) (3.7%) 3.9% (1.0%) 2.3% 107.3% (3.5%) 15.5% 0.8% % Change-FY17 Budget to FY18 Budget (4.9%) (5.2%) 11.9% (1.5%) 0.9% 20.6% (1.7%) 13.3% 0.7% Other Revenues (2) FY16 Actual 3,608 2,060 5, , , ,983 FY17 Budget 3,632 2,182 6, , , ,243 FY18 Budget 3,621 2,138 4, , , ,487 % Change-FY16 Actual to FY18 Budget 0.4% 3.8% (1.6%) (15.8%) (1.0%) (0.2%) (1.9%) 359.5% 3.4% % Change-FY17 Budget to FY18 Budget (0.3%) (2.0%) (20.5%) 11.9% (12.6%) (6.2%) (7.0%) (0.6%) (10.2%) Numbers may not foot due to rounding. Notes: (1) Costs include all expenses for Metrolink and MOW on operating and non-operating lines (2) Other revenues include dispatching fees and MOW revenues from freight and Amtrak due to individual member agencies. June 23,
36 Exhibit 3.1c Summary of FY to FY Statistics by Line San Ventura Antelope Orange Orange Co LINE Bernardino County Valley Riverside County MSEP IEOC 91 Line (1) Total Average Fare/Passenger FY16 Actual $7.29 $6.58 $6.31 $7.75 $8.97 $5.07 $6.77 $6.57 $7.35 FY17 Budget $7.35 $6.38 $5.18 $7.61 $8.00 $8.00 $6.42 $6.67 $6.93 FY18 Budget $7.87 $5.89 $7.41 $8.90 $8.12 $10.77 $5.61 $6.59 $7.41 % Change-FY16 Actual to FY18 Budget 7.9% (10.5%) 17.4% 14.9% (9.5%) 112.4% (17.2%) 0.3% 0.9% % Change-FY17 Budget to FY18 Budget 7.0% (7.6%) 43.1% 17.0% 1.5% 34.6% (12.7%) (1.3%) 6.9% Op Cost/Passenger (w/o MOW Extraordinary Maint) FY16 Actual $16.36 $28.03 $25.40 $16.84 $13.63 N/A $20.20 $23.68 $19.57 FY17 Budget $17.25 $27.67 $23.78 $17.47 $12.70 N/A $21.31 $30.90 $19.86 FY18 Budget $19.12 $27.21 $30.20 $20.49 $12.92 N/A $18.63 $27.50 $21.06 % Change-FY16 Actual to FY18 Budget 16.9% (2.9%) 18.9% 21.7% (5.2%) N/A (7.8%) 16.1% 7.6% % Change-FY17 Budget to FY18 Budget 10.8% (1.7%) 27.0% 17.3% 1.7% N/A (12.6%) (11.0%) 6.0% Op Cost/Passenger Mile (w/o MOW Extraordinary Maint) FY16 Actual $0.46 $1.06 $0.65 $0.48 $0.39 N/A $0.61 $0.62 $0.56 FY17 Budget $0.48 $1.06 $0.62 $0.50 $0.37 N/A $0.60 $0.79 $0.57 FY18 Budget $0.53 $1.04 $0.79 $0.59 $0.37 N/A $0.54 $0.70 $0.60 % Change-FY16 Actual to FY18 Budget 16.2% (1.7%) 20.7% 22.2% (4.1%) N/A (10.8%) 11.9% 7.7% % Change-FY17 Budget to FY18 Budget 10.2% (1.7%) 27.2% 17.3% 1.1% N/A (10.0%) (11.8%) 6.4% Subsidy/Passenger FY16 Actual $8.00 $19.59 $16.51 $9.04 $3.75 N/A $12.64 $16.95 $11.05 FY17 Budget $8.83 $19.39 $15.76 $9.85 $3.77 N/A $14.07 $23.28 $11.64 FY18 Budget $10.01 $19.44 $19.88 $11.48 $3.97 N/A $12.31 $20.08 $12.39 % Change-FY16 Actual to FY18 Budget 25.1% (0.7%) 20.4% 27.0% 5.8% N/A (2.6%) 18.5% 12.1% % Change-FY17 Budget to FY18 Budget 13.4% 0.3% 26.2% 16.5% 5.2% N/A (12.5%) (13.8%) 6.5% Subsidy/Passenger Mile FY16 Actual $0.22 $0.74 $0.43 $0.26 $0.11 N/A $0.38 $0.44 $0.32 FY17 Budget $0.25 $0.74 $0.41 $0.28 $0.11 N/A $0.40 $0.59 $0.33 FY18 Budget $0.28 $0.74 $0.52 $0.33 $0.11 N/A $0.36 $0.51 $0.35 % Change-FY16 Actual to FY18 Budget 24.4% 0.6% 22.2% 27.6% 7.0% N/A (5.9%) 14.1% 12.2% % Change-FY17 Budget to FY18 Budget 12.7% 0.3% 26.4% 16.5% 4.5% N/A (9.9%) (14.5%) 6.8% Op Cost/Service Train Mile (w/o MOW Extraordinary Maint) FY16 Actual $76.40 $ $77.84 $ $74.45 $64.96 $75.16 $ $82.54 FY17 Budget $79.89 $ $81.29 $ $77.93 $62.60 $80.53 $99.44 $85.64 FY18 Budget $78.65 $ $80.76 $ $78.84 $66.81 $79.27 $ $85.54 % Change-FY16 Actual to FY18 Budget 2.9% 3.1% 3.7% 3.5% 5.9% 2.9% 5.5% (6.4%) 3.6% % Change-FY17 Budget to FY18 Budget (1.6%) 0.9% (0.7%) (1.2%) 1.2% 6.7% (1.6%) 2.2% (0.1%) Numbers may not foot due to rounding. Notes: (1) Includes PVL Services June 23,
37 Exhibit 3.1d Summary of FY to FY Statistics by Line San Ventura Antelope Orange Orange Co LINE Bernardino County Valley Riverside County MSEP IEOC 91 Line (3) Total Operating Cost/Service Train Mile (w/o MOW) FY16 Actual $59.62 $84.54 $63.11 $94.87 $63.96 $56.95 $64.70 $97.80 $68.63 FY17 Budget $63.00 $89.86 $67.70 $99.79 $68.21 $55.17 $69.71 $85.89 $72.17 FY18 Budget $61.30 $88.83 $66.14 $98.16 $67.89 $58.45 $68.11 $87.04 $71.19 % Change-FY16 Actual to FY18 Budget 2.8% 5.1% 4.8% 3.5% 6.1% 2.6% 5.3% (11.0%) 3.7% % Change-FY17 Budget to FY18 Budget (2.7%) (1.1%) (2.3%) (1.6%) (0.5%) 5.9% (2.3%) 1.3% (1.4%) Farebox Recovery (1) FY16 Actual 44.4% 23.4% 24.8% 45.7% 65.5% 7.6% 33.4% 27.7% 37.4% FY17 Budget 42.4% 22.9% 21.7% 43.2% 62.7% 13.3% 30.0% 21.6% 34.7% FY18 Budget 41.0% 21.6% 24.5% 43.2% 62.6% 15.1% 30.0% 23.9% 35.1% % Change-FY16 Actual to FY18 Budget (7.7%) (7.7%) (1.3%) (5.5%) (4.4%) 99.0% (10.2%) (13.7%) (6.2%) % Change-FY17 Budget to FY18 Budget (3.3%) (6.0%) 12.8% (0.1%) (0.1%) 13.0% 0.0% 11.0% 0.9% Revenue Recovery (2) FY16 Actual 51.6% 30.8% 35.4% 47.1% 72.9% 12.0% 38.0% 28.6% 44.0% FY17 Budget 49.2% 30.5% 34.1% 44.2% 70.6% 18.2% 34.5% 24.8% 41.8% FY18 Budget 47.9% 29.0% 34.4% 44.3% 69.5% 19.3% 34.2% 27.1% 41.4% % Change-FY16 Actual to FY18 Budget (7.1%) (6.0%) (2.8%) (5.9%) (4.7%) 60.7% (10.0%) (5.3%) (5.9%) % Change-FY17 Budget to FY18 Budget (2.7%) (5.2%) 0.9% 0.2% (1.6%) 6.3% (0.7%) 9.1% (0.9%) Numbers may not foot due to rounding. Notes: (1) Farebox recovery is the ratio of farebox revenue to total expenses net of Non-BNSF operating category "Rolling Stock Lease" = $151K in FY18. (2) Revenue recovery is the ratio of operating revenues to operating expenses net of Non-BNSF operating category "Rolling Stock Lease" = $151K in FY18. (3) Includes PVL Services June 23,
38 Exhibit 3.2 Operating Expense, Revenues and Operating Subsidy OPERATING EXPENSE ($Millions) $250 $200 $150 $100 $50 $0 FY93 FY94 FY95 FY96 FY97 FY98 FY99 FY00 FY01 FY02 FY03 FY04 FY05 FY06 FY07 FY08 FY09 FY10 FY11 FY12 FY13 FY14 FY15 FY16 FY17B FY18B $19 $45 $58 $64 $68 $74 $78 $75 $80 $90 $101 $101 $113 $122 $127 $142 $162 $166 $168 $173 $188 $199 $209 $227 $244 $243 REVENUES ($Millions) $125 $100 $75 $50 $25 $- FY93 FY94 FY95 FY96 FY97 FY98 FY99 FY00 FY01 FY02 FY03 FY04 FY05 FY06 FY07 FY08 FY09 FY10 FY11 FY12 FY13 FY14 FY15 FY16 FY17B FY18B $4 $15 $23 $31 $38 $38 $39 $42 $45 $48 $57 $61 $63 $71 $80 $88 $93 $88 $92 $97 $102 $102 $99 $100 $102 $101 OPERATING SUBSIDY ($Millions) $140 $120 $100 $80 $60 $40 $20 $- FY93 FY94 FY95 FY96 FY97 FY98 FY99 FY00 FY01 FY02 FY03 FY04 FY05 FY06 FY07 FY08 FY09 FY10 FY11 FY12 FY13 FY14 FY15 FY16 FY17B FY18B $16 $28 $34 $34 $31 $36 $38 $33 $34 $42 $44 $40 $50 $50 $47 $54 $69 $78 $77 $77 $86 $98 $110 $127 $142 $142 Actuals to FY16, Budget for FY17 and FY18 FY16 Actual and FY17 Budget include BNSF Lease Locomotives costs. June 23,
39 Exhibit 3.3 Train Miles, Fares and Average Weekday Ridership SERVICE TRAIN MILES ($Thousands) 3,000 2,500 2,000 1,500 1, FY93 FY94 FY95 FY96 FY97 FY98 FY99 FY00 FY01 FY02 FY03 FY04 FY05 FY06 FY07 FY08 FY09 FY10 FY11 FY12 FY13 FY14 FY15 FY16 FY17B FY18B ,156 1,296 1,406 1,611 1,757 1,792 1,873 2,086 2,123 2,190 2,250 2,402 2,458 2,523 2,503 2,394 2,622 2,685 2,734 2,721 2,728 2,830 2,827 FARES ($Millions) $100 $80 $60 $40 $20 $- FY93 FY94 FY95 FY96 FY97 FY98 FY99 FY00 FY01 FY02 FY03 FY04 FY05 FY06 FY07 FY08 FY09 FY10 FY11 FY12 FY13 FY14 FY15 FY16 FY17B FY18B $2.6 $11.7 $17.2 $21.8 $24.5 $27.1 $29.1 $31.9 $35.3 $37.6 $41.7 $44.6 $47.8 $54.7 $62.3 $69.9 $73.1 $71.8 $74.1 $80.0 $84.4 $85.7 $83.0 $84.5 $84.6 $85.2 AVERAGE WEEKDAY RIDERSHIP 50,000 40,000 30,000 20,000 10,000 - FY93 FY94 FY95 FY96 FY97 FY98 FY99 FY00 FY01 FY02 FY03 FY04 FY05 FY06 FY07 FY08 FY09 FY10 FY11 FY12 FY13 FY14 FY15 FY16 FY17B FY18B 5,399 12, , , , , , , , , , , , , , , , , , , , ,403 41,355 40,272 42,390 39,885 Presented with imputed riders starting FY16 Actuals to FY16, Budget for FY17 and FY18 June 23,
40
41 Exhibit 3.5 Operating Expense per Passenger Mile, Operating Subsidy per Rider and Operating Subsidy per Passenger Mile OPERATING EXPENSE/PASSENGER-MILE $1.00 $0.75 $0.50 $0.25 $0.00 FY93 FY94 FY95 FY96 FY97 FY98 FY99 FY00 FY01 FY02 FY03 FY04 FY05 FY06 FY07 FY08 FY09 FY10 FY11 FY12 FY13 FY14 FY15 FY16 FY17B FY18B $0.71 $0.41 $0.37 $0.33 $0.34 $0.32 $0.32 $0.29 $0.26 $0.29 $0.30 $0.28 $0.31 $0.32 $0.31 $0.34 $0.38 $0.40 $0.40 $0.41 $0.39 $0.41 $0.46 $0.49 $0.52 $0.61 OPERATING SUBSIDY/RIDER $20 $15 $10 $5 $- FY93 FY94 FY95 FY96 FY97 FY98 FY99 FY00 FY01 FY02 FY03 FY04 FY05 FY06 FY07 FY08 FY09 FY10 FY11 FY12 FY13 FY14 FY15 FY16 FY17B FY18B $16.7 $8.63 $7.75 $6.18 $5.55 $5.66 $5.59 $4.75 $4.16 $4.90 $4.92 $4.11 $4.64 $4.69 $4.07 $4.61 $6.20 $5.94 $6.83 $6.79 $7.18 $8.32 $9.41 $11.0 $11.6 $12.3 OPERATING SUBSIDY/PASSENGER-MILE $0.80 $0.60 $0.40 $0.20 $0.00 FY93 FY94 FY95 FY96 FY97 FY98 FY99 FY00 FY01 FY02 FY03 FY04 FY05 FY06 FY07 FY08 FY09 FY10 FY11 FY12 FY13 FY14 FY15 FY16 FY17B FY18B $0.59 $0.26 $0.22 $0.17 $0.15 $0.16 $0.15 $0.13 $0.11 $0.13 $0.13 $0.11 $0.14 $0.13 $0.12 $0.13 $0.17 $0.16 $0.18 $0.18 $0.18 $0.21 $0.25 $0.28 $0.30 $0.36 Actuals to FY16, Budget for FY17 and FY18 FY16 Actual and FY17 Budget include BNSF Lease Locomotives costs. Passenger miles and riders used in the calculation are based on ticket sales starting FY12 June 23,
42 Exhibit 3.6 FY to FY Annual Operating Budget by Cost Component by Fiscal Year FY FY FY FY * FY17-18 Budget vs. FY ($000's) FY16-17 Budget Operating Revenue Actual Actual Actual Budget Budget Variance % Farebox Revenue 85,673 83,134 83,652 83,556 83, % Metro Fare Reduction Subsidy 873 1,025 1, % Subtotal-Pro Forma FareBox 85,673 83,134 84,524 84,582 85, % Dispatching 2,480 2,493 2,120 2,590 2,125 (465) (18.0%) Other Revenues % MOW Revenues 12,922 13,207 12,434 14,641 13,350 (1,291) (8.8%) Subtotal Operating Revenue 101,394 99,207 99, , ,646 (1,179) (1.2%) Operating Expenses Operations & Services Train Operations 37,043 40,569 41,887 43,942 44, % Equipment Maintenance 28,542 32,649 33,751 37,581 36,691 (890) (2.4%) Contingency (Train Ops) n/a Fuel 26,161 24,454 17,381 22,772 19,656 (3,116) (13.7%) Non-Scheduled Rolling Stock Repairs % Operating Facilities Maintenance 1,056 1,120 1,149 1,418 1, % Other Operating Train Services (26) (5.3%) Rolling Stock Lease (219) (59.2%) Security - Sheriff 4,482 5,136 4,912 5,511 5, % Security - Guards 2,170 1,591 1,685 2,000 2, % Supplemental Additional Security % Public Safety Program (44) (13.6%) Passenger Relations 1,622 1,639 1,748 2,069 1,795 (274) (13.2%) Holiday Trains n/a TVM Maintenance/Revenue Collection 5,343 5,984 6,554 7,495 7, % Marketing ,137 1,220 1, % Media & External Communications % Utilities/Leases 3,180 2,622 2,046 2,778 3, % Transfers to Other Operators 6,469 7,081 6,488 6,577 6, % Amtrak Transfers ,287 1,400 2, % Station Maintenance 1,190 1,121 1,418 1,640 1, % Rail Agreements 4,992 4,997 5,207 5,379 5,366 (12) (0.2%) Subtotal Operations & Services 125, , , , ,234 (919) (0.6%) Maintenance-of-Way MoW - Line Segments 28,152 33,043 37,936 38,570 40,606 2, % MoW - Extraordinary Maintenance 1,322 1,235 1,518 1,175 1,001 (174) (14.8%) Subtotal Maintenance-of-Way 29,475 34,278 39,453 39,745 41,607 1, % Administration & Services Ops Salaries & Fringe Benefits 11,127 11,535 12,892 14,019 13,961 (59) (0.4%) Ops Non-Labor Expenses 3,424 3,651 5,322 5,378 7,374 1, % Indirect Administrative Expenses 12,679 11,791 12,417 15,507 15, % Ops Professional Services ,019 1,816 3,084 1, % Subtotal Admin & Services 27,694 27,946 32,651 36,720 40,289 3, % Contingency (Non-Train Ops) (103) (29.0%) Total Operating Expenses 182, , , , ,382 4, % Insurance Expense/(Revenue) Liability/Property/Auto 14,252 12,597 11,634 12,588 12,475 (113) (0.9%) Claims / SI 1,457 1,884 3,876 3,000 4,000 1, % Claims Administration 743 1, ,198 1,187 (11) (0.9%) PLPD Revenue (178) (1) (22) n/a Net Insurance Expense 16,273 15,625 15,909 16,787 17, % Total Expense Before BNSF 198, , , , ,045 5, % Loss Before BNSF (97,598) (110,257) (116,776) (135,934) (142,399) (6,465) 4.8% Member Subsidies Operations 83,052 92, , , ,736 5, % Insurance 17,302 17,678 18,079 16,787 17, % Total Member Subsidies 100, , , , ,399 6, % Surplus / (Deficit) Before BNSF 2,757 (328) 10, BNSF LEASED LOCOMOTIVE COSTS Lease cost Inc. ship - - 4,449 2,525 - (2,525) n/a Major Component Parts n/a Labor for Maintenance - - 2, (900) n/a Additional Fuel - - 1,341 1,230 - (1,230) n/a Wheel truing, Software Mods, Brakes n/a Temp Facility Mods n/a PTC Costs - - 1,116 1,399 - (1,399) n/a Total BNSF Lease Loco Expenses ,397 6,055 - (6,055) n/a Member BNSF Lease Subsidies ,545 6,055 - (6,055) n/a Surplus / (Deficit) - BNSF Lease - - 1, TOTAL EXPENSE 198, , , , ,045 (769) (0.3%) Net Loss (97,598) (110,257) (127,173) (141,989) (142,399) (410) 0.3% All Member Subsidies 100, , , , , % Surplus / (Deficit) 2,757 (328) 11, Numbers may not foot due to rounding. (1) FY17 budget was adjusted subsequent to adoption, to the amounts as shown here, due to MOW project expense re-distribution. Member agency subsidies are not effected by the adjustment June 23,
43
44


45
46
47 Below is an executive summary of the efforts outlined in the Marketing Plan: The primary marketing programs for FY focus on growing corporate accounts, targeting new residents who move near a station, students, as well as retaining existing riders. These programs are designed to attract and maintain work week commuter ridership. Digital programs to attract new markets are also a primary objective. Marketing plan tactics have shifted to focus on digital (i.e. social media platforms) as compared to traditional tactics (i.e. radio and print). Digital tactics are electronic, have features that provide measurement and are highly targeted. This shift is designed to reach more Millennials (born ) and Gen X riders who tend to be digitally literate. This demographic represents 53% of Metrolink s ridership and are the fastest growth segment. Transit survey data indicates that the millennial generation expects enhanced technology including mobile ticketing and apps as part of the ridership experience. The Marketing Department is working closely with IT, PTC and Operations staff to develop essential enhancements in FY including a new website, real time train information and improvements to the Metrolink app. This plan aims to enhance technology offerings to meet customer needs. Metrolink must take a more proactive approach to responding to technology trends. In 2012, 83% of Metrolink s website audience viewed our site from a desktop. In January of 2016, 65% viewed the site from a mobile device. This dramatic shift to mobile devices is expected to grow and Metrolink must meet those expectations by providing a mobile experience that is designed for smart devices utilizing responsive design. Four recollectables programs in the Marketing Plan are funded by Third Parties or Member Agencies. These programs supplement the Authority s marketing efforts, but they have specific objectives that must be met to fulfill funding criteria. Furthermore, there are secondary programs that are designed to focus on offpeak markets such as the bike community, seniors and the school-related group trips. Non-fare revenue generating programs are also part of the Plan and include filming opportunities, charter trains and revenue advertising. It is a goal to grow non-fare revenues to offset the costs of labor for marketing staff. Metrolink will celebrate its 25 th anniversary in October Staff will leverage existing resources and communication channels to highlight the bright future for Metrolink. The 25 th anniversary messaging will be forward thinking and focus on the improvements in safety, technology and customer convenience. June 23,
48 The Board has directed staff work in coordination with our Member Agencies to develop ridership acquisition marketing campaign that will have a budget of up to $3.9 million. The campaign will span throughout Southern California with a goal to increase Metrolink ridership. Staff will develop the campaign details and work with each Member Agency to receive approval and fund the plan. Strategic Plan Alignment The chart below outlines the Strategic Plan Goal, the Strategic Plan Measurable Outcome and Marketing Goal for programs identified in the Marketing Plan. The outline indicates alignment with goals identified to support the adopted strategic plan; there are 26 separate programs that relate to each Strategic Plan Goal. Each program includes background information, objective/target audience, previous results, the strategic goal alignment, goals and tactics. Strategic Plan Goal Strategic Plan Measurable Outcome Marketing Goal Goal 1: Maintain Fiscal Sustainability Increase Ticket Sales Increase overall (weekday and weekend) revenue as indicated in the budget Goal 2: Increased Non-Fare Revenues Increase Non-Fare revenues through advertising, grants, and potential local sales tax increases for both operating support and capital investment. Grow the revenue advertising program Goal 4: Retain and Grow Ridership Strategy B: Develop a comprehensive Marketing Plan, update it annually and include performance measurements. Areas of focus could include: Highlight areas of potential growth, develop marketing partnerships with Member Agencies Develop an annual marketing plan Conduct monthly meetings with Member Agencies to coordinate marketing efforts June 23,
49 Goal 5: Increase Regional Mobility Strategy A: Increased and improved connectivity of local and regional transit systems to Metrolink Use existing channels to communicate /market seamless transfers by purchasing a Metrolink ticket/pass. Create co-marketing opportunities with rideshare services to solve last mile solution Goal 6: Improve Communications to Customers and Stakeholders Strategy A: Improve Customer Amenities, Online Ticketing and Mobile Device Amenities Offer online ticket purchases through metrolinktrains.com Using the strategic plan as a foundation, the Marketing Department will continue in their efforts of meeting with Member Agencies on a monthly basis. These meetings help to maintain brand consistency and coordinate efforts to utilize channels available to each Member Agency in promoting Metrolink. This approach streamlines creative design, web development, public relations, partnerships, print and advertising space for the benefit of Metrolink and Member Agencies. 4.3 Maintenance-of-Way (MOW) Revenues Freight railroads and Amtrak Intercity Services operating over territory owned by Member Agencies provide MOW revenues, based upon existing agreements. MOW revenue is projected at $13.4 million, or $1.3 million less than the FY Adopted Budget. The details of MOW payments and their source are as shown in Exhibit 4.2, which displays the primary drop in revenue associated with payments from Union Pacific Railroad on the Coast & Saugus lines. This is the result of reduced freight. 4.4 Dispatching Revenues Freight railroads and Amtrak Intercity Services operating over territory owned by Member Agencies provide dispatching revenues, based upon existing agreements. Dispatching Revenues in FY are estimated to equal $2.1 million, down $0.5 million from the FY Adopted Budget. Details are shown in Exhibit 4.3, displaying a reduction in Amtrak payments due to lower on-time performance. June 23,
50 4.5 Exhibits Exhibit 4.1: FY Fare Revenue and Ridership provides average daily ridership, total fare revenue and revenue per rider for weekend and weekdays. Data is provided for each operating line with comparisons to prior year. Exhibit 4.2: FY to FY Maintenance-of-Way (MOW) Revenue Trends details various MOW revenue agreements by territory and source with annual actual revenues for FY and FY , and budgeted revenues for FY and FY Exhibit 4.3: FY to FY Dispatching Revenue Trends lists various dispatching revenue agreements by territory with annual actual revenues for FY and FY , and budgeted revenues for FY and FY Exhibit 4.4: FY to FY Other Operating Revenue Trends lists various revenue sources such as Amtrak TVM and interest with annual actual revenues for FY and FY , and budgeted revenues for FY and FY June 23,
51 Exhibit 4.1 FY to FY Fare Revenue and Ridership ($000) Average Daily Ridership Revenue/Rider ($'s) Fare Revenue ($000's) FY16-17 FY17-18 % Change from FY16-17 FY17-18 FY16-17 FY17-18 % Change from Operating Line Budget Budget FY17 Budget Budget Budget Budget Budget FY17 Budget San Benardino Weekday 10,419 9,104 (12.6%) ,581 19,208 (6.7%) Weekend 3,517 3,502 (0.4%) ,023 2, % Ventura County 3,961 4, % ,574 6,230 (5.2%) Antelope Valley Weekday 6,894 5,421 (21.4%) ,504 10, % Weekend 2,861 2,172 (24.1%) ,326 1, % Riverside 4,506 3,795 (15.8%) ,910 8,780 (1.5%) Orange County Weekday 9,326 9, % ,100 20, % Weekend 2,690 2,293 (14.8%) ,546 1, % OC MSEP % % IEOC Weekday 4,278 4, % ,613 7,513 (1.3%) Weekend 1,754 1, % (5.5%) 91/Perris Valley Weekday 2,630 2, % ,745 5, % Weekend % % Totals Weekday 42,390 39,885 (5.9%) ,809 78,599 (0.3%) Weekend 11,343 10,790 (4.9%) ,773 6, % Total 53,733 50,675 (5.7%) ,582 85, % Numbers may not foot due to rounding. June 23,
52 Exhibit 4.2 FY to FY Maintenance-of-Way (MOW) Revenue Trends ($000) FY14-15 FY15-16 FY16-17 FY17-18 Change from Agreement/Territory Actuals Actuals Budget Budget FY17 Budget Amtrak Intercity 1, , (22.8%) LAUS Rail Yard Operations & Maintenance (Amtrak) % Azusa Branch Shared Use (UPRR/SPTC) % Baldwin Park Branch Shared Use (UPRR/SPTC) % Coast & Saugus Shared Use (UPRR/SPTC) 5,838 5,161 6,332 5,250 (17.1%) East Bank Joint Facility (UPRR/SPTC) 1, (0.7%) Mission Tower (UPRR/SPTC) % San Diego & Olive Subdivision Shared Use (BNSF) 1,649 1,708 1,778 1,754 (1.3%) Pasadena Subdivision Shared Use (BNSF) 2,442 2,219 2,310 2,279 (1.4%) State Grade Crossing (CPUC) % PVL/San Jacinto Subdivision Shared Use (BNSF) (1.4%) Redlands Subdivision Shared Use (BNSF) (1.1%) Crossing Maintenance Fees (18.8%) Federal/Other Funds Total 13,207 12,434 14,641 13,350 (8.8%) Numbers may not foot due to rounding. June 23,
53 Exhibit 4.3 FY to FY Dispatching Revenue Trends ($000) FY14-15 FY15-16 FY16-17 FY17-18 Change from Agreement/Territory Actuals Actuals Budget Budget FY17 Budget Amtrak Intercity 1,846 1,425 1,876 1,424 (24.1%) Coast & Saugus Shared Use (UPRR/SPTC) % East Bank Joint Facility (UPRR/SPTC) % Mission Tower (UPRR/SPTC) (0.4%) San Diego & Olive Subdivision Shared Use (BNSF) % Pasadena Subdivision Shared Use (BNSF) (16.9%) San Jacinto Subdvision (5.0%) North County Transit District (NCTD) Total 2,493 2,120 2,590 2,125 (18.0%) Numbers may not foot due to rounding. June 23,
54 Exhibit 4.4 FY to FY Other Operating Revenue Trends ($000's) FY14-15 FY15-16 FY16-17 FY17-18 Change from Revenue Source Actuals Actuals Budget Budget FY17 Budget Marketing Revenues % Amtrak TVM Revenues Lease Proceeds Insurance Recoveries Interest Miscellaneous Revenues TPA Earnings Scrap and Salvage Sales Numbers may not foot due to rounding. Total % June 23,
55 This page intentionally left blank June 23,
56 SOUTHERN CALIFORNIA REGIONAL RAIL AUTHORITY FY BUDGET SECTION 5: Operating Expenses 5.1 Introduction SCRRA s Operating Expenses for FY are projected at $243.0 million. This cost includes three key budgetary components: Train Operations, Maintenanceof-Way (MOW) and Insurance Expense. Note: the categories of Administration & Services and Non-Train Ops Contingency are herein referred to as Train Operations. Train Operations costs are $183.8 million, or 75.6% of the total Operating Budget. MOW costs are $41.6 million, or 17.1% of the total Operating Budget. Insurance expenses are $17.7 million, or 7.3% of the total Operating Budget. The approach for budgeting was a zero base. Each item submitted for inclusion in the FY Budget required specific justification. Justification for cost submissions were reviewed, cost center by cost center, line by line. Tighter controls were instituted to ensure conformance to already established guidelines for example, all supplies and mailing costs are to be ordered through the HQ administrative function. Meetings were then held with budgeters, managers, Deputy Chiefs and Chiefs to reach agreement on necessary and appropriate expense in the current environment. A particularly stringent review was dedicated to the Big Five vendors (Amtrak, Bombardier, Sheriff, Mass Electric, VTMI) as they comprise more than 40% of the Operating Expenses. Exhibit 3.7 FY Annual Operating Budget by Cost Component by Member Agency presents a detail of Operating Expenses by line item. 5.2 Operating Budget Assumptions Service Levels The FY Budget reflects the operation of 171 weekday trains on seven lines and 90 regular weekend trains operating on five lines. Currently, weekend services offered both Saturday and Sunday, will be operated on the San Bernardino, Orange County, 91 Line, IEOC and Antelope Valley lines. No new regular service has been included in the FY Budget. A pilot program of Sunday service on the 6 national holidays has been included in the budget. June 23,
57 5.2.2 Cost Allocations Operations expenses are distributed to the operating lines, and subsequently to Member Agencies, based on several formulae approved by the Member Agencies. Multiple allocation categories are used to apply SCRRA operating costs to the various line segments and Member Agencies. Key formula types include train miles, train miles lagged, ridership, route miles dispatched, track miles and unduplicated stations. These allocation categories are applied to specific budget line item components as outlined in Member Agency agreements. Examples include current budget year train miles to allocate Train Operations, fuel and operating contingency funds. More complex allocations are applied directly to line segments or territories, and are used for rail agreements, Maintenance-of-Way (MOW), transfer payments and Amtrak passenger transfers. Items such as direct Train Operations expenses and fuel are distributed based on train miles, while payments to freight railroads are charged directly to operating lines associated with the specific freight lines. These allocation formulae are described in Section 10 Appendix. A Member Agency working group is currently working with a consultant to identify whether there is a way to simplify this allocation method, while still preserving an equitable division of costs among the Member Agencies. 5.3 Train Operations Train Operations expenses of $183.8 million have increased $2.5 million, or 1.4%, over the FY Adopted Budget. These costs include multiple functional subcomponents, which are segmented to permit allocation to operating line segments and to Member Agencies. This portion of the Operating Budget includes expenses required to operate the Metrolink system, including rail operations, maintenance of equipment, fuel, security, utilities, transfer payments to other transit operators and revenue collection. Payments to freight railroads for dispatching services, station maintenance, passenger services, general and administrative expenses and professional service also add to Operating Expenses Train Operations Components There are several key groupings of costs associated with Train Operations. These categories relate to groupings that are then allocated to Member Agencies. Train Operations - Crews Discussions with our current vendor for daily operation of trains (Amtrak) during the budget process kept base costs flat in FY in line with the FY approved amount. June 23,
58 Train Operations - Dispatching The costs of SCRRA-provided dispatching services over the right-of-way territories owned by the SCRRA Member Agencies increased by 9.2% or 0.4 million in FY This was the result of contractual salary escalation and the addition of a management position. Equipment Maintenance The Equipment Maintenance budget for FY totals $36.7 million, a decrease of $890K, or 2.4% from the FY Adopted Budget. This is comprised of three types of expense items: Outsourced mechanical services (primarily Bombardier) = $24.9 million Materials issued from inventory to effect repairs = $11.3 million Other Mechanical Service items = $553K Outsourced mechanical service expenses increased by $2.5 million or 10.0%. A new service-specific, performance based, 8-year contract was negotiated to provide a 3.5% maximum escalator on these costs for same service after year one. The new contract increased costs by $2.1 million in the first year. Additionally, a mobilization fee of $399K was required for the function of conversion of contract to a performance specific mode. Materials for rolling stock repairs have decreased $2.7 million, or 19.4%, as compared to the FY Adopted Budget. Actuals in FY are forecasted to be under budget by approximately $3.8 million. SCRRA has an aging fleet and until old equipment is replaced or rehabilitated, rolling stock will continue to require increased levels of maintenance to ensure safe and reliable operation. Rolling Stock Maintenance Services (washing, buffing, extermination, etc.) were reclassified as Facilities Repairs and Maintenance. Consequently, Other Mechanical service items were $723K lower than the FY Adopted Budget. Fuel Usage of approximately 9 million gallons is based on projected consumption levels. FY fuel prices are to be managed through a fuel hedging program. Use of a more formalized Fuel Hedging Program will allow SCRRA to lower fuel budget risk and fuel cost volatility, and allow for better planning and forecasting of fuel costs. The fuel budget of $19.7 million is a $3.1 million decrease from the FY Adopted Budget. Non-Scheduled Rolling Stock Repairs/Modifications Repairs to accommodate unforeseen medium-scaled damage to rolling stock or rolling stock modifications is budgeted at $100K, flat with the FY Adopted Budget. June 23,
59 Operating Facilities Maintenance This category includes: janitorial services; maintenance and hazardous materials compliance at the Central Maintenance Facility and other SCRRA facilities; the repair, fueling and maintenance of Authority-owned rubber tire vehicles and facilities equipment (forklifts, cranes, etc.); Rolling Stock service maintenance; and cost of tax on underground Fuel Storage tank. The total estimate for this category for FY is $1.6 million, an increase of $233K over the FY Adopted Budget. An increase due to the Authority s decision to purchase vehicles in lieu of renting Amtrak employee-vehicles as provided for in the Amtrak agreement. The acquisition will cost an additional $200K in FY and FY , but will eliminate rental fees and additional costs associated with the Amtrak agreement. Other Operating Train Services This category involves items directly related to operating the rail system: weather data forecast and earthquake reporting services, publications, printing of required manuals and the largest line item, emergency bus services. The projected expenditures of $470K is a decrease of $26K or 5.3% from the FY Adopted Budget. Rolling Stock Leases In FY , rolling stock leases were utilized for PTC Testing, such costs included subsequent removal of PTC. Our Tier 4 Locomotive supplier has agreed to reimburse us for this lease, which will mean only the cost of removal will be incurred at the end of FY which is expected to be $151K, or $219K less than prior year. Security Sheriff Our contract with the Los Angeles County Sheriff s Department at $5.8 million for FY is 6.1% higher than the FY Adopted Budget, but will provide security on late night Antelope Valley and San Bernardino trains. Security Guards FY Security Guard costs of $2.8 million are higher than prior year by $0.8 million or 41.9%. In an effort to maintain an adequate level of security despite rising costs, some security was shifted from Sheriffs to lower cost guards last year. The FY contract was settled following the budget at $2.3 million. The supplemental security category was used to provide funding. Therefore, the FY contract is $0.5 million or 25% higher than the FY Adopted Budget. The steep increase is the second year of a multiyear contract with rates far lower in the first year. However, when considering the entire contract, this was the lowest bidder. Supplemental Additional Security This program is funded through an increment on fare revenues originally implemented in FY calculated at 0.75% of fare revenues. These funds provide for specific non-recurring security-related expenses, such as improvements to station cameras, fences, lighting and other improvements. June 23,
60 Availability of these funds vary directly with the growth, or decline, in fare revenues. In FY , this amount is estimated at $690K. Public Safety Program Public Safety is a subset of the System Safety Department created to handle OSHA training; public safety posters, materials and activities; employee Drug and Alcohol random testing as mandated by FRA; and Operation Lifesaver participation. The FY Public Safety program has decreased by $44K, or 13.6% from the FY Adopted Budget. Passenger Relations The Passenger Relations budget is primarily for the Call Center which provides information to passengers. The $1.8 million budget is a $274K decrease from the FY Adopted Budget, resulting from non-repetition of upgrades to the Call Center system and reduction in replacement or repair of call boxes. Holiday Celebration Train The SCRRA Board elected not to run the Holiday Celebration Train in FY Ticket Vending Machine (TVM) Maintenance/Revenue Collection This includes maintenance of TVM, validators and all software related to mobile ticketing, revenue collection, ticket stock, fare change programming and merchant fees for credit and debit card usage. The total for this line item in the FY Budget is $7.5 million, flat with the FY Adopted Budget. TVM repairs have decreased, while credit card fees have increased. Marketing The Marketing category totaling $1.36 million is comprised of Marketing Department s budget of $884K and Planning Department s market research budget of $480K. For FY , the overall budget for Marketing Department decreased by $126K whereas Planning Department s budget increased by $270K from the FY Adopted Budget. The Marketing Department s budget includes advertising, Metrolink s weekend/destination programs, Corporate Partner Program, new resident direct mail campaign and customer outreach onboard trains and at stations. The Planning Department s increased budget will be used to conduct a new Onboard Survey which has not been completed since Media/External Communications This includes media, public and community relations, website content development and the production of printed timetable schedules and Ride Guides. At $443K, this line item is slightly up from the FY Adopted Budget due to increased translations and Community Outreach. Utilities/Leases Utility and lease budgets are estimated at current monthly average costs. The total amount in FY Budget is $3.3 million, an increase of $512K, resulting from June 23,
61 reclassification of a utility formerly charged to Ops Non-Labor Expenses category in the Administrative & Services section of the Operating Statement. Transfers to Other Operators These are amounts Metrolink pays to other Transit Operators to allow Metrolink ticket holders to transfer without further cost. The cost paid to other transit operators at $6.6 million is flat with the FY Adopted Budget. The largest share of $5.1 million is paid to Metro. Amtrak Transfers These funds represent costs to the Authority for the Rail-2-Rail program. Under this program, SCRRA, Amtrak and Caltrans agreed to collaborate in allowing complementary service to passengers on said lines as means of convenience to their travel needs for valid Metrolink monthly pass and Amtrak ticket holders. LOSSAN (the operator of Amtrak) has increased their per passenger price to Metrolink. The $2.2 million budget is $777K, or 55.5%, higher than the FY Adopted Budget. Station Maintenance For FY , Station Maintenance is budgeted at $1.7 million. This line item represents the costs to maintain station equipment, including station displays, and maintenance of the Union Station Platform and related common area expenses. We are currently in the process of reviewing changes to common area maintenance costs of $1.2 million to determine the current equity of Union Station charges. This category is flat with the FY Adopted Budget. Rail Agreements This line item represents payments to freight railroads, the Union Pacific and the Burlington Northern Santa Fe, for dispatching and other operation-related services over property owned by these railroads. The amount budgeted is $5.4 million, reflecting an amount almost flat with the FY Adopted Budget. Operations Salaries and Fringe Benefits Salaries and fringe benefits are projected based on the actual salary rate of each position charged directly to the Train Operations Budget and assumes a fringe benefit additive. A 2.0% COLA and a merit pool of 3.0% is included in the FY budget. The total salary and fringe benefit budget for Train Operations is down from the FY Adopted Budget by $59K or 0.4%. Exhibit 8.3 shows the complete current roster of SCRRA s 273 Full Time Equivalent (FTE) positions by department. Operations Direct Non-Labor Costs This category totals $7.4 million for FY , an increase of $2.0 million from the FY Adopted Budget. This increase to maintenance of the PTC Wabtec system which was included in the base contract in Capital, is now in Operations. A total of $5.4 million of the category, or 74.5%, is PTC software and utility costs (including the $2.0 million increase). Other costs include operations related IT June 23,
62 expenses $862K, travel and lodging expenses, gasoline and maintenance for operating department vehicles and minor miscellaneous expenses. Indirect Administrative Expenses Costs allocated to Train Operations represent this budget sector s share of the Authority s General and Administrative (G&A) costs. Indirect expenses allocated here total $15.9 million for FY , up $364K, or 2.3%, from the FY Adopted Budget. Please refer to Section 7 for a discussion of G&A costs and their allocation to the various budget pools. Other Post-Employment Benefits (OPEB) will total $1.6 million. Operations Professional Services This category includes consultants and other outside professional services. In FY , the total budget is $3.1 million, which is an increase of $1.3 million or 69.9% from the FY Adopted Budget. Outside legal services comprise $1.1 million or 35.5% of the costs in this category and are slightly down as compared to last year. The increases are: PTC Qualified MP for 24/7 desk coverage (expected to be an FRA requirement next year) - $364K; specialized management to monitor new Condition Based Maintenance contract - $500K; a consultant for establishment of a Retail Ticketing Sales network - $400K. Contingency This line item is traditionally budgeted at $500K for use under authority of the Chief Executive Officer. This helps to deflect any unanticipated increase in expenses, avoid subsequent increases to Member Agency subsidies, in the event short-term negative expense impacts are realized during the fiscal year. It represents the primary general reserve fund of the budget. This year, we have reduced that contingency to $252K, representing 0.1% of the Operating Budget for FY Train Operations Note FY cost components by line item expenditure for Train Operations, see Exhibit 3.6 FY Annual Operating Budget by Cost Component by Fiscal Year and Exhibit 3.7 FY Annual Operating Budget by Cost Component by Member Agency. 5.4 Maintenance-of-Way (MOW) This portion of the Operating Budget represents ordinary maintenance of the rights-of-way owned by Member Agencies and includes routine maintenance, inspection and repairs of track, structures, signal system, grade crossing warning system and the communication infrastructure. MOW expenses of $41.6 million have increased $1.8 million, or 4.7%, compared to the FY Adopted Budget. The increase is primarily the result of maintenance needs for Signals and Communications of $1.2 million, which were deferred from FY as a result of necessary rehabilitation efforts on critical areas of Track and Structures. An June 23,
63 additional $400K of the increase is in Track while the other $200K is a combination of many categories. MOW expenses are developed by SCRRA to ensure the level of ordinary maintenance is sufficient to prevent any loss of service quality. The levels of maintenance required on individual lines are contingent upon conditions of infrastructure, levels of commuter and freight train traffic, the number of road crossings and curves, and exposure to weather conditions. In turn, this condition is highly dependent on funds provided for rehabilitation of aging infrastructure in the Capital portion of the Budget. After years of inadequate funding of rehabilitation projects, in November 2016, Metrolink felt it was necessary to request an urgent budget amendment to provide $49.2 million in additional rehabilitation funds to preserve the safety levels of the system at current speeds and weights. On April 21, 2017, the SCRRA Board voted to amend the FY Adopted Budget to add $34.2 million to the FY Rehabilitation capital funding. The projects in this approved amendment have been added to the Rehabilitation Carryforward shown in this FY Budget. Metrolink s backlog of deferred maintenance remains significant. Economic realities suggest that several years will be required to reduce the backlog to acceptable levels Assumptions MOW expenses are expenditures that provide ordinary maintenance of Member Agency-owned track, signals, bridges, road crossings and other elements of the infrastructure and rights-of-way. The most economical methods of replacement of railroad elements (rail, ties, crossings, etc.) are through large specialized operations. Best practice indicates periodic replacement of elements, as they approach the end of their life cycle, using rehabilitation budgets while costs to perform inspections and routine repairs required to ensure reliable, safe operation of trains, should be covered in the Operating Budget. The MOW philosophy of SCRRA is to perform ordinary maintenance sufficient to meet SCRRA maintenance standards in addition to regulatory requirements. Furthermore, to prevent loss of service quality and to budget for Rehabilitation at practical intervals, we strive to utilize the full life cycle of components/elements. This substantially reduces repairs and replacements from overwhelming the ordinary MOW budget. This philosophy is consistent with other successful freight railroads on their main routes. The core of the ordinary maintenance effort is a perpetual cycle of inspections and reports on the condition of track, signals, grade crossings and bridges, and the performance of ordinary adjustments and/or repairs of any exceptions found in those inspections. The Federal Railroad Administration (FRA) has guidelines for minimum inspection schedules; standards for track, signal and grade crossing conditions; qualifications of inspectors and repairers; and documentation requirements for most inspections. To assure a high level of safety and quality on June 23,
64 track and signal operation, SCRRA adheres to its own maintenance standards. These standards are stricter and inspections more frequent compared to the FRA minimum level. Thus, SCRRA shows that most conditions are discovered and repaired at an early stage of degradation before they become defects or violations under FRA regulations. The GASB-34 method of accounting for maintenance of infrastructure includes a requirement to budget and expend a level of rehabilitation to preserve the infrastructure at Authority adopted utility level. Assuming a certain level of rehabilitation funding is received, SCRRA s utility level specifies for no loss-ofservice performance and an irreducible risk to safety of train operations. GASB- 34 policy also requires a triennial rating (SCRRA rates 1/3 of the property each year) of the quality of the infrastructure to facilitate the adopted rehabilitation investments/expenses for maintaining State of Good Repair consistent with the adopted policy Conditions and Trends in the MOW Budget Current year MOW budgets are developed annually to maintain the infrastructure in a state of high reliability and safety. They are based on assumptions for the actual number of units comprising the physical infrastructure, the number of contracted and maintenance personnel (SCRRA technicians, supervisors, inspectors, and managers/support) needed to perform the inspections and repairs, including amounts for material purchases, vehicles, supplies and support activities. Labor costs of contracted service providers are the largest component of the MOW budget. The labor rates are bid rates obtained through competitively bid maintenance contracts. They are underpinned by California Department of Labor Statistic prevailing wages for railroad maintenance operations and adjusted annually by indexes specified in the contract. Labor is budgeted with a percentage for overtime to support system failures, repair of systems caused by outside forces and vacancies in personnel headcount while recruitment efforts occur and to recover from unusual situations. Due to the number of commuter and freight trains operated mid-day, a large majority of MOW work is being performed at night or during non-revenue service hours. Most contracts and labor agreements permit scheduled night work at premium straight time shift rates, if sufficient advance notice is given for a change of shift starting time. The MOW labor budget includes two-shift coverage of track maintenance to assure that ordinary operations are accomplished with minimal disruption to peakperiod commuter rail operations. Increases in MOW expenses since FY can be attributed to two factors. One of those factors is the installation of Positive Train Control (PTC). The other factor is the lack of funding which has been available for Rehabilitation projects in the Capital Program budget. While PTC will become consistent, without adequate Rehabilitation funding, a continuing escalation of MOW cost will be unavoidable. June 23,
65 5.4.3 MOW Statistics Various factors are considered when developing the MOW budget. Consideration is given to track type, number of turnouts, control points, grade crossings and added infrastructure improvements, construction elements of the track, track geometry, traffic, operating speeds and prevailing weather conditions. Through discussions with contracted vendors, MOW activity plans are outlined and cost estimated to manage the work safely, consistently and efficiently. Track Types include main track, branch track, yard track and siding. Turnouts include main track power, main track manual, yard track power, yard track manual, siding and industry. Construction elements of the track include type of tie, rail section, ballast section, ballast type, subgrade type and condition. Track geometry includes curvature, grade, gauge and surface. Traffic includes an analysis of annual million gross ton miles for sole freight, sole passenger and mixed freight/passenger. Operating speeds range from lows of 10/15 mph to highs of 50/90 mph. Prevailing weather conditions include rain, snow, flooding, freezing and thaw cycles, extreme heat or cold. Other factors that can impact the annual cost of MOW include: increased FRA inspection and reporting requirements; continuous training requirements (including increased training under PTC regulations); monitoring of employees working near tracks ( roadway worker safety ); increased rehabilitation programs to improve track, signals and switches; heavier freight car axle loads; more freight traffic and inflation in some supply and material costs (e.g., fuel, steel, crushed rock, etc.). To offset such increases, SCRRA seeks opportunities to reduce expenditures with better quality power tools, trucks and roadway machines, ongoing replacement of older, more trouble-prone track, bridge and signal elements under the rehabilitation/renovation programs, improved right-of-way security (fencing and enforcement), and continuous emphasis on safety and efficiency training of MOW workers. Because many factors impact costs, the actual operating allocations per line vary. For example, the Orange County, San Bernardino, and Ventura County lines have high density passenger train traffic and road crossings. Conversely, the River Corridor segment of tracks (both sides of the Los Angeles River from Redondo Junction on the south to CP Taylor on the north), carries heavy freight in addition to the passenger train traffic (including all SCRRA non-revenue movements in and out of the Central Maintenance Facility CMF ). The Antelope Valley Line is a high curve and grade territory, which equates to an increased maintenance and inspection effort. The Ventura County line has light to moderate curves and grades, but older, unimproved signal and grade crossing warning systems. June 23,
66 5.4.4 MOW Expenditure Components The MOW category includes six primary cost areas. Totals by area and line segments are shown on Exhibits 5.4 and 5.5. Track includes MOW contractor costs of providing labor, equipment and some of the materials required to perform inspections mandated by the FRA, as well as additional special inspections and routine maintenance of SCRRA track. Signal & Communications and Train Control Systems includes Signal and Communications contractor costs of providing labor, equipment and some of the materials required to perform inspections mandated by the FRA, as well as additional special inspections and routine maintenance of SCRRA signal and communication systems. Structures includes MOW contractor costs of providing labor, equipment and some of the materials required to perform inspections mandated by the FRA, as well as additional special inspections and routine maintenance of SCRRA bridges, tunnels and other structures. Procurement includes payments for items utilized in repair of track, signals, grade crossing warning and communication systems, or structures which are allocated to segments and counties on the basis of track miles. Agency Costs include SCRRA labor, overhead and non-labor costs allocated to the Maintenance-of-Way (MOW) budget that are subsequently allocated to specific line segments on the basis of track miles. Other Costs include payments for Positive Train Control elements, vegetation control, vehicle and equipment expense, rail flaw detection and engineering, which are also allocated to segments and counties on the basis of track miles MOW Net Revenue, Expenditure and Member Agency Funding Total FY MOW expenditures are projected at $41.6 million and are funded by SCRRA generated MOW revenue and Member Agency subsidies. These costs and revenues are allocated over operating line and Member Agencies. Exhibit 5.3 FY Maintenance-of-Way Expenditures and Revenue Offsets shows the Operating and Non-Operating line allocation. Since FY , SCRRA has had an arrangement to exchange MOW revenues for an equal amount of Orange County Gas Tax Funds. These funds are reflected outside the ordinary MOW budget and have zero net budget impact MOW Projections by Line The FY MOW Line Segment Budget of $41.6 million is allocated across June 23,
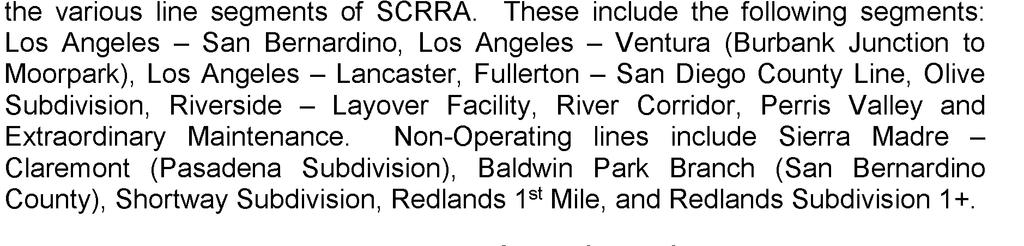

67
68 signal, grade crossing warning and communications equipment and systems are made with consideration to current technologies. The rapid pace of changing technology and regulatory requirements, and the lack of vendor support for obsolete equipment as these technologies change, require that we make repairs with current and not obsolete products and technology. Where possible, reimbursement for expenditures is sought if a responsible party is identifiable (e.g. derailment caused by freight railroad or damage caused by a motorist covered with insurance). The Authority will also look to emergency funding if available (e.g. FEMA). After deductibles are met, SCRRA insurance coverage may reimburse the Authority for these costs. For FY , the budget for extraordinary MOW equals $1.0 million, a decrease of $174K. 5.5 Insurance Expense This category includes insurance premiums for Property, Liability, and Auto, in addition to claims, self-insurance costs and claims administration. In FY , Insurance total expenses of $17.7 million have increased by $876K or 5.2% from the FY Adopted Budget. This change has been caused primarily by a $1.0 million increase (FY was $2.0 million, while the amount in FY is $3.0 million) in the set aside for FY to recognize possible liabilities arising from the Oxnard incident in February Exhibits Exhibit 5.1: FY Service Assumptions details the operating service assumptions for weekday, Saturday and Sunday trains by operating line. FY includes 171 weekday trains and 90 weekend trains. Exhibit 5.2: FY Service Train Miles provides revenue train miles by operating line. No firm start date has been provided for the additional one mile for the new San Bernardino station. It is not included in this chart. Exhibit 5.3: FY Maintenance-of-Way Expenditures and Revenue Offsets provides projections of MOW expenditures and funding sources. The revenues and expenditures are allocated by territory and Member Agency. Exhibit 5.4: FY Maintenance-of-Way Expenditures by Line Segment/Territory Operating Lines provides the cost of MOW for operating lines allocated across operating lines and Member Agencies. Exhibit 5.5: FY Maintenance-of-Way Expenditures by Line Segment/Territory Non-Operating Lines and Total provides the cost of MOW for non-operating lines and the total costs allocated across operating lines and Member Agencies. June 23,
69 Exhibit 5.1 FY Service Assumptions Number of Trains Weekday Saturday Sunday San Bernardino Line San Bernardino-LAUS Ventura County Line Chatsworth-LAUS 6 Moorpark-LAUS 8 East Ventura-LAUS 6 Antelope Valley Line Santa Clarita-LAUS 2 Via Princessa-LAUS 8 Palmdale-LAUS 2 Lancaster-LAUS Riverside Line Riverside-LAUS 12 91/Perris Valley Line Riverside-LAUS South Perris-LAUS 6 South Perris-Riverside 6 Orange County Line Irvine-LAUS 3 Laguna Niguel-LAUS 6 Oceanside-LAUS Fullerton-Laguna Niguel (MSEP) 8 Fullerton-Oceanside (MSEP) 2 IEOC Line San Bernardino-Irvine 1 San Bernardino-Laguna Niguel 4 San Bernardino-Oceanside Riverside-Laguna Niguel 7 Riverside-Oceanside 1 Burbank/Bob Hope Airport Burbank Airport-LAUS 11 Total June 23,
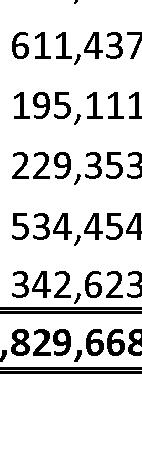
70
71 Exhibit 5.3 FY Maintenance-of-Way Expenditures and Revenue Offsets Revenue Forecast Allocation Line Segment/Territory ($000s) Metro OCTA RCTC SBCTA VCTC FY17-18 Budget Operating Lines 7,002 2, , ,058 LA - San Bernardino ,314-1,812 LA - Ventura (Burbank Jct to Moorpark) ,373 LA - Lancaster 4, ,304 CRI-BURBANK JCT Fullerton - San Diego County Line - 2, ,342 Olive Subdivision Riverside Layover Facility River Corridor 1, ,371 Perris Valley Extraordinary Maintenance (Storm Damage, Vandalism, Gate Knockdowns) Non-Operating Lines 1, ,292 Sierra Madre - Claremont (Pasadena Sub) 1, ,050 Rialto Sub (San Bernardino Co.) Shortway Sub Redlands 1st Mile Redlands Sub MP Total 8,052 2, , ,350 Net Subsidy Allocation Line Segment/Territory ($000s) Metro OCTA RCTC SBCTA VCTC FY17-18 Budget Operating Lines 13,667 5,816 2,484 3,259 1,914 27,139 LA - San Bernardino (1) 3, ,288-5,694 LA - Ventura (Burbank Jct to Moorpark) (2) 2, ,477 3,826 LA - Lancaster 3, ,471 CRI-BURBANK JCT Fullerton - San Diego County Line 710 3, ,013 Olive Subdivision Riverside Layover Facility (3) River Corridor (4) 2, ,962 Perris Valley ,398 Extraordinary Maintenance (5) ,001 (Storm Damage, Vandalism, Gate Knockdowns) Non-Operating Lines ,118 Sierra Madre - Claremont (Pasadena Sub) Rialto Sub (San Bernardino Co.) Shortway Sub Redlands 1st Mile Redlands Sub MP Total 13,994 5,915 2,532 3,902 1,914 28,257 Total Expenditure Forecast Line Segment/Territory ($000s) Metro OCTA RCTC SBCTA VCTC FY17-18 Budget Operating Lines 20,669 8,347 3,151 4,572 2,458 39,198 LA - San Bernardino 3, ,601-7,505 LA - Ventura (Burbank Jct to Moorpark) 3, ,021 5,199 LA - Lancaster 7, ,775 CRI-BURBANK JCT Fullerton - San Diego County Line 710 5, ,354 Olive Subdivision Riverside Layover Facility River Corridor 3, ,333 Perris Valley (6) , ,066 Extraordinary Maintenance ,001 (Storm Damage, Vandalism, Gate Knockdowns) Non-Operating Lines 1, ,410 Sierra Madre - Claremont (Pasadena Sub) 1, ,269 Rialto Sub (San Bernardino Co.) Shortway Redlands 1st Mile Redlands Sub MP Total 22,046 8,446 3,200 5,458 2,458 41,607 Numbers may not foot due to rounding. (1) MoW net subsidy split by route miles (59.82% LACMTA and 40.18% SBCTA). (2) MoW net subsidy split by train miles (61.41% LACMTA and 38.59% VCTC). (3) Net subsidy split by train miles of trains using the Riverside Layover, excluding San Diego County (44.41% LACMTA, 18.33% OCTA, 27.88% RCTC, and 9.38% SBCTA). (4) Split is assumed All Share (47.5% LACMTA, 19.8% OCTA, 11.1% RCTC, 14.4% SBCTA, and 7.2% VCTC) of cost in excess of revenues. (5) Allocation based on percent of route miles owned (58.66% LACMTA, 12.87% OCTA, 9.69% RCTC, 10.78% SBCTA, and 8.00% VCTC) (6) Allocation based on train miles of 91 line (23.98% LACMTA, 22.51% OCTA, 53.28% RCTC, 0.23% SBCTA) June 23,
72 Exhibit 5.4 FY to FY Maintenance-of-Way Expenditures by Line Segment/Territory Operating Lines ($000s) FY FY FY FY17-18 Expenditure Expenditure Expenditure Expenditure Variance FY17-18 vs. FY16-17 Line Segment/Territory Actuals Actuals Budget (1) Budget $ % Operating Lines 32,677 37,752 37,291 39,198 1, % LA - San Bernardino 7,221 7,823 7,096 7, % Track 1,133 1,427 1,285 1, % Signal & Communications 2,514 2,900 2,440 2, % Structures % Procurement % Other 1,239 1,182 1,179 1, % Agency Costs 1,837 1,667 1,724 1, % LA - Ventura (Burbank Jct to Moorpark) 4,800 5,399 4,873 5, % Track 884 1,193 1,010 1, % Signal & Communications 1,266 1,473 1,387 1, % Structures % Procurement (54) (25.8%) Other % Agency Costs 1,388 1,249 1,278 1, % LA - Lancaster 7,134 7,779 7,404 7, % Track 1,228 1,461 1,220 1, % Signal & Communications 1,780 2,077 2,018 2, % Structures % Procurement % Other 1,328 1,449 1,428 1, % Agency Costs 2,332 2,124 2,182 2, % CRI-BURBANK JCT (7) (100.0%) Agency Costs (7) (100.0%) Fullerton - San Diego County Line 6,636 6,954 7,038 7, % Track 981 1,293 1,090 1, % Signal & Communications 2,448 2,549 2,714 2, % Structures % Procurement % Other ,121 1,109 (12) (1.1%) Agency Costs 1,803 1,635 1,695 1, % Olive Subdivision (35) (3.9%) Track () (0.3%) Signal & Communications % Structures % Procurement (34) (58.4%) Other (6) (4.4%) Agency Costs (16) (8.9%) Riverside Layover Facility (82) (41.7%) Track (5) (18.0%) Signal & Communications % Structures % Procurement (20) (64.4%) Other (57) (70.7%) Agency Costs (3) (6.5%) River Corridor 4,758 6,003 5,812 6, % Track 926 1,295 1,081 1, % Signal & Communications 2,146 2,583 2,980 3, % Structures % Procurement % Other % Agency Costs (3) (0.4%) Perris Valley 1,460 2,805 3, % Track % Signal & Communications , % Structures % Procurement (72) (49.9%) Other % Agency Costs % Extraordinary Maintenance 1,235 1,518 1,175 1,001 (174) (14.8%) (Derailments, Storm Damage, Gate Knockdowns, Vandalism) Numbers may not foot due to rounding. (1) FY17 budget was adjusted subsequent to adoption, to the amounts as shown here, due to MOW project expense re-distribution. Member agency subsidies are not effected by the adjustment June 23,
73 Exhibit 5.5 FY to FY Maintenance-of-Way Expenditures by Line Segment/Territory Non-Operating Lines and Total ($000) FY FY FY FY17-18 Expenditure Expenditure Expenditure Expenditure Variance FY17-18 vs. FY16-17 Line Segment/Territory Actuals Actuals Budget (1) Budget $ % Non-Operating Lines 1,601 1,701 2,454 2,410 (45) (1.8%) Sierra Madre - Claremont (Pasa. Sub.) 1,438 1,242 1,214 1, % Track (6) (10.2%) Signal & Communications % Structures % Procurement (6) (10.3%) Other % Agency Costs (32) (7.4%) Rialto Subdivision (San Bernardino Co.) % Track % Signal & Communications % Structures % Procurement % Other (1) (2.4%) Agency Costs % Shortway Sub (26) (7.2%) Track (61) (57.8%) Signal & Communications % Structures % Procurement (1) (28.8%) Other % Agency Costs % Redlands 1st Mile (46) (27.1%) Track (2) Signal & Communications % Structures % Procurement (2) (58.0%) Other (22) (63.5%) Agency Costs (37) (54.6%) Redlands Sub MP (53) (12.7%) Track (73) (72.4%) Signal & Communications % Structures % Procurement % Other % Agency Costs - (57) % FY FY FY FY17-18 Expenditure Expenditure Expenditure Expenditure Variance FY17-18 vs. FY16-17 Line Segment/Territory Actual Actuals Budget (1) Budget $ % Total Maintenance-of-Way 34,278 39,453 39,745 41,607 1, % Track 5,489 7,351 6,858 7, % Signal & Communications 10,914 12,706 13,623 14,851 1, % Structures 1, ,265 1, % Procurement 1,300 2,585 1,471 1, % Other 5,404 5,990 6,367 6, % Extraordinary Maintenance 1,235 1,518 1,175 1,001 (174) (14.8%) Agency Costs 8,913 8,493 8,987 9, % Numbers may not foot due to rounding. (1) FY17 budget was adjusted subsequent to adoption, to the amounts as shown here, due to MOW project expense re-distribution. Member agency subsidies are not effected by the adjustment. June 23,
74 SOUTHERN CALIFORNIA REGIONAL RAIL AUTHORITY FY BUDGET SECTION 6: Member Agency Subsidies 6.1 Member Agency Funding For FY , total Member Agency subsidies are projected at $142.4 million. This represents an increase of $0.4 million over the FY Adopted Budget, an increase of 0.3%. FY FY FY FY FY17-18 Actual (1) Actual Actual (1) Budget (2) Budget Subsidy $ 97,598 $ 110,257 $ 127,173 $ 141,989 $ 142,399 % Change 12.5% 13.0% 15.3% 11.7% 0.3% Numbers may not foot due to rounding. (1) Actual includes BNSF Lease costs beginning October (2) Budget includes BNSF Lease costs ending November June 23,
75 This page intentionally left blank June 23,
76
77 our Member Agencies. Listed below are expenditures on the 273 Third Party Projects completed in FY : PROJECT DESCRIPTION COST PERRIS VALLEY LINE-MOU012 $5,235,603 SIMI VALLEY GRADE XING IMPROV $3,381,851 MOORPARK AVE GRADE XING CONST. $2,797,724 PERRIS VALLEY LINE-MOU013 $1,185,819 MTA - OUTSIDE 20' $966,444 SANBAG EMF & DSBPRP $867,706 CALTRANS I-5 PRMOTE PUBLC TRNS $807,385 I-5 N ENHANCEMNTS PROJECT $476,215 SPEED INCREASE@ CP SOLEDAD-DES $422,870 I-5/SR-14 CAP DRAINAGE IMPR $331,573 GRADE XING IMPRV@RAMONA-DESIGN $304,584 GRADE XING IMPRV@CITRUS-DESIGN $286,968 MGE-RIVERSIDE DRIVE BRIDGE $286,603 CITY LA 6TH STRT VIADUCT REPLC $227,304 LNIGUEL/SJ CAPISTRANO SIDING $167,890 LAGUNA-PASEO DE COLONIAS $166,295 CALTRANS- N ANAHEIM WIDENING $156,829 SAN CLEMENTE RIP RAP-PHASE II $152,358 BNSF - ORANGE $123,042 SANBAG - OUTSIDE 20' $113,383 PROJECT STUDY RPTS LA CNTY $102,016 BRANFORD XING CONSTRUCTION $98,240 SPRING STREET BRIDGE $90,374 AT GRADE XING AT HELLMAN AVE $76,718 METRO GOLD LINE-FOOTHILL EXT. $69,116 MAINT REDLANDS SUBDIV MP0-MP4 $67,322 SIKAND-NEAR OAKRIDGE DRIVE $62,520 SAN CLEMENTE RIP RAP-PHASE I $58,834 CLEAR CHANNEL-BILLBOARDS/MEDIA $50,692 BOBHOPE AIRPORT STATION $50,549 HNTB SJ CAP RAIL SIDE PASSING $44,663 VAN NUYS STN CONSTR REVIEW $43,897 HIGH SPEED RAIL PLANNING/COORD $41,148 BNSF - SAN GABRIEL $40,095 SURVEY/MAP BRIGHTON/ROXFORD $34,411 OCTA-PLACENTIA DESIGN REVIEW $32,770 COLICH+SONS, RPR AN INVERT SEC $29,988 VIACOM-REBUILD OUTDOOR SIGNS $29,300 METRO GOLDLINE PHASE 2B $28,823 Numbers may not foot due to rounding. June 23,
78 Third Party Projects Completed in FY (continued) TETRA-PETERS CANYON PROJ $27,602 LOSSAN ROW SLOPE STABILIZATION $26,595 STV SURVEY WORK $25,933 STA CLARITA VISTA CANYON STN $25,543 SF BIKE PATH 3 W/COLA $22,211 BNSF - PASADENA $20, FOOT HIGH SOUND WALL $19,959 BALDWIN PARK-GRAFFITI $17,489 JUNIPER AVE GRADE CROSSING $17,063 ANAHEIM CANYON MTROLNK STN $16,362 ENVIRON CORP S/P REVIEW $16,086 MOORPARK-SPRING ROAD $15,410 OCTA WO#6-10 CROSSING $14,521 SIERRA AVE GRADE CROSSING $14,405 LACMTA VINCENT SIDING EXTION $14,373 17TH ST GRADE SEPARATION $14,238 O/H LINE S CLARITA S FERNANDO $14,138 SCE ARROW HWY & WHEELER AVE $14,077 FIX PIPE LA PAZ MISSION VIEJO $13,153 PAG OC BLOCK WALL AUTO MALL DR $12,991 LAUREL ST GRADE PROJECT $11,668 AMERICAN HEAVY MOVING-3 MOVES $11,405 CEDAR AVENUE STORM DRAIN $9,840 CLARK ARTIC FLAGGING/TRAINING $9,451 QWEST: BHA PROJECT E $9,178 PED CROSSING BOB HOPE AIRPORT $8,834 CROSSING TRACKS FOR BORING $8,216 RCFC&WCD-CNCRTE BX IN MENIFEE $7,769 SDG&E PROJECT IN SJCAPISTRANO $7,511 SANTA CLARITA STATION PAINTING $7,467 RJ NOBLE PAVEMENT MAINTENANCE $7,442 UNDERGROUND CABLE WHEELER AVE $7,368 SDG-TRANSMISSION LINE $7,187 LA PAZ OVERHEAD WIDENING $6,726 IRVINE-SAND CANYON AVE. $6,474 SANTA CLARITA YR OVERLAY PROJ $6,358 BJD ARMY CORP ENGINEERS $6,333 SCE-REPLCE TRANS LINE SOLEDAD $6,259 I-5 WIDENING IN OC $5,923 I-10 TOLL LANES FLAGGING $5,773 CALTRANS BRIDGE INSPECTION $5,620 Numbers may not foot due to rounding. June 23,
79 Third Party Projects Completed in FY (continued) MATICH CORP RIALTO OVERLAY $5,091 SPARTA NEWHALL STN PAINTING $5,048 TRAFFIC CONTROL ORANGE $4,995 REPAIR CONCRETE ARTIC STATION $4,768 FOOTHILL TRANST CONSTCTRS $4,733 REPAIR TWO MANHOLES $4,530 SCE POWER POLE PROJECT COVINA $4,291 NU-LINE REHAB MANHOLES SJ CAP $4,100 IRWD 20" RECY WATER TRANS $3,985 TWC PLACE & REMOVE TTC DEVICES $3,975 SUBSURFACE UTIL POTHOLING $3,969 ELYSIAN VIADUCT OH $3,955 CALTRANS-PROVIDENCIA O/H WIDNG $3,779 RELOCATE UTILITY POLE BURBANK $3,745 LAG NIGUEL MISS VIEJO STN WORK $3,600 SCE REPLACE 7POLES $3,520 LOCATE UTILITIES S BERNARDINO $3,505 STREET RESURFACING HOLLENBECK $3,457 INSPECT/MAINTAIN VALVE 384 $3,296 K&B-TWC FO ANAHEIM $3,286 SCE REMOVE 21 POLES ANAHEIM $3,271 REDLANDS PASSENGER RAIL $3,252 INSTALNEW FOC TO XO COMM $3,179 SDGE MANHOLE H $2,998 SCE RE-ROUTE EXISTING LINE $2,948 LADWP POLE REPLACE TAMPA AVE $2,942 FORMWORK REMOVAL FORBES RD $2,869 MNWD REPLC PIPE NEAR MP $2,743 PUENTE WATER PHASE 1B & 2 $2,701 TWO BROS. PLAN REVIEW $2,580 BOB HOPE HOLLYWOOD WY $2,577 LAMAR BILLBOARD MAINTENANCE $2,563 SPARTA DEMOLITION RAILROAD AVE $2,496 GRAFFITI REMOVAL 1734 MAIN ST $2,442 CARDNO POTHOLING LA VERNE $2,340 INSTALL F/O CABLE WHEELER AVE $2,248 NCTD-WHEEL SETS IN CMF $2,185 SURVEY LAGUNA NIGUEL $2,181 XFINITY COMMERCIAL CMF $2,159 ALL AMERICAN AGGREGATES $2,004 CALEX-PRIVATE XING $1,988 Numbers may not foot due to rounding. June 23,
80 Third Party Projects Completed in FY (continued) SANTA CLARITA NEW MEDIANS $1,968 INSTALL O/H LINE ORANGE $1,961 STATE ST OH WIDE & SEISMIC $1,953 KGC GRANDVIEW SUBSTATION $1,907 W.ENG-PRKNG LT IN RIALTO $1,903 INSTALL FENCE UNIV OF LA VERNE $1,870 SURVEYS/MAPPING GOLD LINE 2B $1,860 DIAZ BORINGS VAN NUYS STATION $1,849 SDG&E POLES P & Z $1,848 LA RIVER WATER WHEEL $1,833 TRAFFIC CONTROL 8860 VINEYARD $1,774 SCE REPLACE POLE VALENCIA $1,765 SUNESYS INSTALL LINE ORANGE $1,757 REMOVE/REPLACE ASPHALT $1,744 T.HOLDING-PLAN REVIEW $1,740 SCE REPLACE ONE POLE PERRIS $1,700 SCE REPLACE THREE POLES $1,687 CITY LA-NORTH MAIN ST. BRIDGE $1,621 REMOVE FOUR TREES ORANGE $1,523 O/H LINE ORANGE PLAN REVIEW $1,520 SCE-REPLC POLE IN SANTA ANA $1,478 SUN VALLEY WATERSHED PHASE I $1,448 SCE-REPLACE POLE IN ORANGE... $1,361 PIPELINE RELOC PERRIS VALLEY $1,356 PRESSURE CONTROL VALVE $1,348 SDG+E CAMINO CAP &.89 MILES $1,343 PIPE INSPECTION SIMI VALLEY $1,327 SDGE: REPLACE POLE Z $1,314 SCE STRUCTURE REPLACEMENT $1,298 BNSF - PERRIS VALLEY $1,272 INSTALL CABLE LORAINE AVE $1,264 SCE CABLE MT VERNON 4TH ST $1,254 CA DEPT TRANS COMM LINE PERRIS $1,228 FYDAQ REPLACE PIPE IRVINE $1,184 SCE- REPL POLE IN LA VERNE $1,133 ETIC-SAMPLING GRND WATER $1,133 SCE REPLACE E & E $1,128 LEMON GROVE LP - 36" DRAIN $1,126 FIRE SPRINKLERS ANAHEIM STN $1,068 ICDC LANDSCAPE TECH DR IRVINE $1,033 CCTV & FIBER OPTIC LAWNDALE $1,015 Numbers may not foot due to rounding. June 23,
81 Third Party Projects Completed in FY (continued) TETRA-GRND H2O MNITR IN BURBNK $1,001 REPLACE POLE 3800 VANOWEN ST $980 RSE PHOTOS POMONA $953 ERM-SOIL SMPLING IN LA $936 BOB HOPE AIRPT PED BRIDGE $890 VCI PULL BOX JEFFREY RD IRVINE $876 NEW CREATION PLATFORM LIGHTING $869 SCE REPLACE FOUR POLES PERRIS $867 WRIGHT CNST COAST TRAIL $852 GLENDALE WASTEWATER PROJECT $849 WATER MAINS WALNUT GROVE AVE $844 WATER MAINS SAN GABRIEL BLVD $844 TUNNEL UNDER TRACKS GLENDALE $844 KB ENG FOR TW CABLE PLAN $840 F/O CABLE FLOWER ST GLENDALE $835 INSTALL CONDUIT LASSEN ST $835 TRAFFIC SIGNAL & O/H SIGN $829 LNIGUEL/MISSION V METROLNK STN $821 YALE AVE PAVEMENT REHAB IRVINE $821 ALPHA INSTALL FENCE $821 SCE REPLACE POLE VINEYARD AVE $814 ANHEUSER-BUSCH PIPE WOODLEY $810 INSTALL O/H F/O CABLE ACTON $803 LACSD REHAB PIPELINE CARSON $762 REPAIRS TUSTIN & IRVINE STNS $760 MNWD WATERMAIN ABANDONMENT $757 TECHNOLOGY DR PROJECT IRVINE $722 GLENN SPRINGS PROJ IN LAVERNE $700 REMOVE INNERDUCT ALHAMBRA $696 SCE REPLACE POLE E $687 SAND CANYON TRAIL PHASE 3 $683 CITY OF ANAHEIM-ARTIC $675 BORINGS STATE ST POMEROY AVE $655 SCE POLES RIALTO AVE D ST $648 SCE REPLACE 8 POLES RIVERSIDE $637 SCE POLES E & E $599 IRISH COMM CO SAFETY TRAINING $586 SCE REPLACE POLE WINCHESTER $576 TRAFFIC CONTROL FIRST & AGNEW $576 HDR FLAGGING UNION STATION $564 PR FOR BEACHWOOD PROJ IN B $488 Numbers may not foot due to rounding. June 23,
82 Third Party Projects Completed in FY (continued) BURBANK-RELOCATE FACILITIES $485 POMONA MAJOR ST RR PROJECT $477 LONE HILL TO WHITE DOUBLE TRK $464 FALL PROTECTION SYSTEM ORANGE $416 SUNESYS PLACE UG CONDUIT CABLE $393 SCE REPLACE E& E $391 SCE-REPLACE POLE IN COVINA, $384 EDWARDS ADV-BILLBOARD RMVL $381 SEMPRA SAFETY CLASSES 8/4/15 $379 COAST-SURVEY ROW & BRIDGE $369 SCE RECONDUCTOR 4A RIALTO $332 RIVER BED SURVEY SANTA CLARITA $321 SCE REPLACE O/H CONDUCTOR $318 SCE POLE FRANCISQUITO & GARVEY $317 SKANSKA BRIDGE WORK 6TH STREET $314 GLENDALE STATION LIGHTING $290 CALTRANS-BASSETT O/H BRIDGE $276 REPLACE POLE HARVILL AVE $269 REPLACE POLE AVE A 8TH ST $269 REPLACE POLE NANDINA AVE $269 SCE REPLACE POLE E $262 REPLACE POLE FAIRPLEX LA VERNE $249 CROWN VALLEY WIDENING $249 SCE POLE TECH DRIVE I-5 IRVINE $246 SCE REPLACE POLE ONTARIO $241 SCE INSTALLATION TORRANCE $230 COVINA - GRAFFITI ABATEMENT $228 SCE REPLACE POLE SANTA ANA $225 SCGC PIPELINE PROJ IN SYLMAR $224 REHAB AT SIMI VALLEY-GRANITE $214 INSTALL O/H CABLE MISSION RD $207 MANHOLE REHAB RED HILL AVE $207 SCE POLES E & E $206 VCI VERIZON MCI MANHOLE $206 AZTEC: FOR OCTA UTIL POTHOLING $199 INSTALL O/H CABLE RIALTO $186 REPLACE POLE CALLE TORO GRANDE $186 CONDUIT EAST AVE PALMDALE $186 ASPHALT OVERLAY PALMDALE $184 L&SCONST-BEE CANYON IMPRVMNTS $172 SYNERGY NEW O/H LINE BURBANK $168 Numbers may not foot due to rounding. June 23,
83 Third Party Projects Completed in FY (continued) SEMPRA TRAINING CLASSES $168 SCE REPLACE POLE RIALTO & MACY $154 SITE/PLAN REV-FREEDOM COMM $107 LADWP GUY WIRES 6TH ST BRIDGE $87 RELOCATE TRANSMISSION POLES $83 REPAIR/MAINTAIN MANHOLE $83 INSTALL CONDUITS PEPPER AVE $63 RJ TRAFFIC CONTROL ORANGE $63 POWER POLE RELOCATION ANAHEIM $63 SCE REPLACE POLES COVINA $63 LS IMPRO NEAR RR AVE & 13TH ST $63 ANAHEIM SAFETY TRAINING $62 SCE-REPLACE POLES IN PERRIS $61 VCI MANHOLE JAMBOREE & HARVARD $61 SCE-INSTALL CABLE IN SAN DIMAS $58 SCE REPLACE POLE LA PALMA $57 SCE REPLACE POLES IRVINE $57 SCE REPLACE POLE E $55 SCE REPLACE POLE E $55 GEOTECH FIELD INVESTIGATION $55 DYNALECTRIC WOODLEY $55 DYNALECTRIC-THERMO LIMIT LINES $55 BGB: AERIAL FLYOVER/SURVEY $41 ROAD WIDENING & NEW MEDIAN $31 CALLEGUAS WATER SITE ACC XING $28 AESCO-GEOTECH AT 6 LOC $26 GEOTECH FOR DIAZ YOURMAN'S SUB $26 ARADIS, GRND SAMPLING MVIEJO $13 SCE TO REMOVE 4KV CIRCUIT $13 $20,278,108 Numbers may not foot due to rounding. A number of Third Party Projects were undertaken in FY The exact amount is not identified at this time as we are in the midst of the fiscal year end. Based on historical data, we expect to complete approximately $21 million in Third Party Projects during FY Rehabilitation Program Rehabilitation (Rehab) projects are those that extend the useful life of existing capital assets through activities such as the replacement of: worn ties and rail, worn or outdated signal system components, tunnels, bridges and culverts, rolling June 23,
84 stock components such as Car Door Operators and Heating/Ventilation/Air Conditioning (HVAC), and midlife overhaul of rail cars and locomotives. SCRRA, as part of its implementation of Government Accounting Standards Board Pronouncement 34 (GASB-34), has elected to use the Modified Approach for the Metrolink Railroad Infrastructure. Under the Modified Approach, infrastructure assets that are part of a network, or subsystem of a network, are not required to be depreciated if two requirements are met: 1. The government manages the eligible infrastructure assets using a qualified asset management system; and, 2. The government documents that the eligible infrastructure assets are being preserved approximately at (or above) a condition level established and disclosed by the government. During FY , the SCRRA Board adopted a minimum condition rating of 75 points (of a maximum of 100) as the minimum acceptable Railroad Condition Index (RCI) for the entire railroad network, including all subsystems. As of June 30, 2015, SCRRA completed a three-year systemwide assessment of the infrastructure, which resulted in an average acceptable level of 81 points. The next systemwide assessment of the infrastructure is due at year end, June 30, Rehab projects are those projects that replace worn-out, functionally obsolete and commercially unviable assets. These assets are replaced, repaired or otherwise modified with new assets that preserve and extend the useful life of these capital assets. Rehab projects and programs are also sometimes known as State of Good Repair or Capital Reinvestment. In 2012, Congress enacted a federal transportation program known as Moving Ahead for Progress in the 21st Century (MAP-21). This legislation replaced section 5309 Rail Modernization formula funds with section 5337 funds specifically for State of Good Repair projects, underscoring the federal government s commitment to maintaining transportation infrastructure. MAP-21 contains Transit Asset Management provisions requiring transit agencies that receive federal transportation funds to develop and implement Transit Asset Management (TAM) Plans. A TAM Plan was adopted by the SCRRA Board in December 2016 and is compliant with MAP Railroad Rehabilitation Cycles Railroad infrastructure deteriorates due to traffic, time, environmental conditions (weather) and wear. Railroad infrastructure, especially systems hardware and software, with time and changes in technology, can become functionally obsolete or unsupported. At minimum, a Rehab program is required to overcome this deterioration and maintain a State of Good Repair. A Rehab program typically incorporates state-of-the-art or state-of-the-industry components to support service levels and replace older designs, resulting in reduced maintenance expense, improved operations or improved reliability. June 23,
85 Rehabilitation is performed when the infrastructure has worn or deteriorated to a level that does not yet impair serviceability, but the assets are close to being consumed. In order to utilize 100% of the assets service life, their replacement is performed on the first day of asset failure. This requires meticulous inspection procedures, multiple disruptions to train service, and intensive labor to replace assets. Instead, the railroad industry adopted a cycle of rehabilitation where groups of assets are replaced when they are nearing the end of usefulness. Inefficiency is minimized because workforces and machines are economized to perform the work and minimize disruption of train service Rehabilitation Elements A. Rails Rails are subject to head and gauge face wear, and metal fatigue due to traffic loadings, and expansion and contraction of metal resulting from changes in temperatures and corrosion. Rehabilitation and renovation of rail consists of periodic grinding to restore the original contour, replacement of welds, replacement of insulated joints, transposing rail on curves, and replacement of the entire rail when limits of wear or fatigue are reached. B. Crossties The rail is supported on crossties of either wood or concrete. Wood ties have steel tie plates beneath the rail to spread the weight of the rail. Concrete ties have elastomeric pads to separate the steel rail from the ties. Both ties have fasteners to hold the track together, either cut or screw spikes on the wood ties, and some form of proprietary spring steel clip on concrete ties. There are 3,250 wood ties per mile, spaced at 19½ inches, and concrete ties are spaced at 24 inches, for 2,640 per mile. 1. Wood Ties Creosote treated wood ties have a service life of between 30 and 35 years. Wood ties deteriorate by organic decay and by mechanical abrasion and crushing from the spikes and the tie plates supporting the rail. Wood ties also deteriorate faster in curves because the centrifugal force of turning trains pushes the rail and spikes. Weak ties in curves are a serious safety consideration. They are usually maintained in a cycle method whereby 25-35% (800-1,000 per mile) of the wood ties are replaced every 7 to 10 years, depending upon specific local conditions. 2. Concrete Ties Concrete crossties are more resistant to wear and decay; however, they can be affected by fouled ballast. Severely fouled ballast creates an abrasive paste of rock particles, which grind away the concrete surface, which exposes the reinforcing strands and can cause the tie to break. Though concrete ties last longer than wood ties, the elastic clips and the bearing pads require changing when rail is replaced on about 10 to 12 year intervals. Concrete ties are expected to last at least 50 years. June 23,
86 C. Ballast The crushed rock ballast that supports the track deteriorates through weathering and abrasion. The fine particles eroded from the stone, plus fine soil particles that are blown or washed into the track, or migrate upward from underlying soil, cause the ballast to retain water, which has two adverse effects. The moisture degrades the ties and softens the subgrade, leading to settlement of the whole track structure. D. Special Track Work Two areas of the track structure, turnouts and road crossings, have higher levels of stress and require additional investment. 1. Turnouts and Crossing Diamonds Turnouts (switches) are the special track work which diverts trains from one track to another. They consist of a set of movable point rails to divert the wheels, a frog to cross the rails, and special braces, supports, tie plates, guard rails, gauge plates, and long timber ties to support these components. Due to the impacts of wheels being steered to diverging routes by the points and of crossing the open flange way at the frog, these components require special attention. Even with careful maintenance they wear out in about ¼ of the time of the general track structure. 2. Road Crossings Road Crossings have precast concrete or rubber blocks set on top of the crossties to permit roadway vehicles to cross the rails. Because the deflection of the rails under passing trains and large trucks, there is movement in the crossing structure. This motion can cause the adjoining roadway surface to become broken, or cause the track profile to become irregular and require repair. Rehabilitation of road crossings is difficult because they require detour routes for highway traffic, and halt train traffic while the crossing is under repair. Rehabilitation includes a periodic removal of the crossing surface to raise and tamp the track (at about 6-year intervals) and a complete renewal of the crossing, track, and subgrade (at about 20-year intervals). E. Bridges Railroad bridges have steel, concrete, and timber elements, all of which have differing, and generally very long life cycles. The critical elements are the timber parts: the decks and stringers. Timber elements in railroad bridges typically last years. Since the 1980s, they have generally been replaced with concrete or steel elements. F. Signal, Communication, Train Traffic Control, Electrical Systems Railroad signal, communication, train traffic control (dispatch), and electrical systems termed here as Systems generally experience wear of moving parts in equipment such as switch machines and grade crossing gate mechanisms, June 23,
87 exposure to the environment, and have electronic and power supply components with specific lifespans. These Systems also become obsolete due to changes in Federal regulations or in the state-of-the-art of the industry. Virtually all Systems are microprocessor, computer, or server-based and are subject to hardware and software obsolescence due to changes in technology or changes in commercial arrangements that lead to loss of support. Rehabilitation of these Systems consists of unit exchange replacement of components to avoid service disruptions, regulatory infractions, replacement of outdated, or unsupported, hardware and software with current industry standard hardware and software. Some components can be returned to manufacturing plants for rebuilding and reused on a cyclical basis of maintenance. G. Embankment The embankment supporting the railroad erodes under the action of rain. In cut sections, this deposits mud and silt near or in the track structure, causing water to be blocked from draining away from the track. This results in saturation of the track bed, deterioration of the ties (both wood and concrete ties are adversely affected by muddy embankments), and settlement of the track into a rough profile. H. Rolling Stock Beginning June 2017, the Metrolink rolling stock fleet consists of 55 diesel locomotives (including 3 leased) and 258 rail cars. Rolling stock directly affects the passenger experience, and must be maintained in a state of good repair to ensure safety, reliability and comfort. Rolling stock goes through regular preventative maintenance on a cyclical basis as part of normal operations. Additional rehabilitation is performed on key rail car subsystems such as the heating, ventilation, air conditioning (HVAC) system, door control systems, lighting systems and battery systems. For depreciation purposes, SCRRA established a useful life of 30 years for revenue rolling stock. Initial locomotive and rail car purchases occurred in , making the vehicles years old. To date, these vehicles have not undergone comprehensive midlife overhauls, and vehicle replacement or rebuild is necessary to prevent service degradation. Of SCRRA s 52 locomotives, 37 have exceeded the point at which a midlife overhaul should be performed. SCRRA has ordered 40 new Tier-4 locomotives, 37 of which will replace the oldest of the locomotives. The remaining 15 locomotives will begin to need midlife overhauls sometime after FY Funding will be necessary for this important effort. I. Facilities SCRRA office space, warehouses, maintenance shops and rail yards are used to operate and maintain the system. The Central Maintenance Facility (CMF) is Metrolink s largest facility and contains specialized machinery such as a wheel true machine, drop table, overhead cranes, and train wash to June 23,
88 service and repair rail rolling stock. Yard equipment such as ground power stations, locomotive sanders, and fuel and urea dispensing systems are also critical for service. All items must be maintained in a state of good repair to ensure safe and efficient operation Consequences of Deferred Rehabilitation There are five consequences of deferred maintenance: Reduced train speeds and headways; Reduced operational reliability; Higher cost of ordinary maintenance; Regulatory fines and sanctions; or Potential accidents and loss of mission capability. The track structure has a considerable amount of redundancy. Weakness in specific elements can be carried by the stronger elements. Thus a few decayed or split wood ties, if scattered throughout the length of the track, do not cause any of these problems. However, if there are many weak ties at one location, then the track as a whole is weak and the above consequences become inevitable. Rehabilitation projects are summarized in Exhibits 7.1 and 7.2. A number of the projects will not be completed in FY and will be carried forward into the 2018 fiscal year. They amount to $87.5 million, include Board approved amendment to the FY Rehabilitation Budget and are described in the Ongoing Rehabilitation Projects section. The new projects seeking initial authority in FY amount to $89.6 million and are discussed in the New Rehabilitation Projects section below. 7.3 FY Ongoing Rehabilitation Projects Ongoing projects authorized in FY or earlier that are not anticipated to be completed prior to June 30, 2017 are depicted on Exhibits 7.1 and 7.5. The exhibit represents staff s estimate of the outstanding authorized balance on each project as of the adoption of the FY fiscal year budget. These estimations in no way alter the actual project authority as approved by the SCRRA Board. 7.4 FY New Rehabilitation Projects New projects proposed for Rehabilitation in FY are depicted in Exhibits 7.2 and 7.6 in summary and detail respectively. June 23,
89 7.5 FY New Capital Carryover Projects New Capital Carryover projects authorized in FY or earlier that are not anticipated to be completed prior to June 30, 2017 are depicted on Exhibit 7.3. The New Capital Carryover amount totals $212.9 million. 7.6 FY New Capital New Authority Projects New Capital projects proposed in FY are shown in Exhibit 7.4, and total $5.3 million. 7.7 Exhibits Exhibit 7.1: FY Rehabilitation Carryover Projects Summary lists Rehabilitation carryover authority by subdivision, project category and funding source. Exhibit 7.2: FY Rehabilitation New Authority Projects Summary by Subdivision lists proposed Rehabilitation projects for New Authorization by subdivision, project category and funding source. Exhibit 7.3: FY New Capital Carryover Projects lists New Capital carryover authority by subdivision, project category and funding source. Exhibit 7.4: FY New Capital New Authority Projects lists New Capital authority by project and funding source. Exhibit 7.5: FY Rehabilitation Carryover Projects Detail provides a detailed listing of Rehabilitation carryover authority by project. Exhibit 7.6: FY Rehabilitation New Authority Projects Detail provides a detailed listing of the proposed Rehabilitation projects for New Authorization by project. Exhibit 7.7.1: Capital Summary and Cash Flow Detail All Agencies provides a capital summary and cash flow estimate for New Authority Rehab and New Capital projects for FY as well as estimated capital authority requests for FY and FY Exhibit 7.7.2: Capital Summary and Cash Flow Detail METRO provides a capital summary and cash flow estimate for New Authority Rehabilitation and New Capital projects for FY as well as estimated capital authority requests for FY and FY Exhibit 7.7.3: Capital Summary and Cash Flow Detail OCTA provides a capital summary and cash flow estimate for New Authority Rehabilitation and New June 23,
90 Capital projects for FY as well as estimated capital authority requests for FY and FY Exhibit 7.7.4: Capital Summary and Cash Flow Detail RCTC provides a capital summary and cash flow estimate for New Authority Rehabilitation and New Capital projects for FY as well as estimated capital authority requests for FY and FY Exhibit 7.7.5: Capital Summary and Cash Flow Detail SBCTA provides a capital summary and cash flow estimate for New Authority Rehabilitation and New Capital projects for FY as well as estimated capital authority requests for FY and FY Exhibit 7.7.6: Capital Summary and Cash Flow Detail VCTC provides a capital summary and cash flow estimate for New Authority Rehabilitation and New Capital projects for FY as well as estimated capital authority requests for FY and FY Exhibit 7.7.7: Capital Summary and Cash Flow Detail Other Fund Sources provides a capital summary and cash flow estimate for New Authority Rehabilitation and New Capital projects for FY as well as estimated capital authority requests for FY and FY June 23,


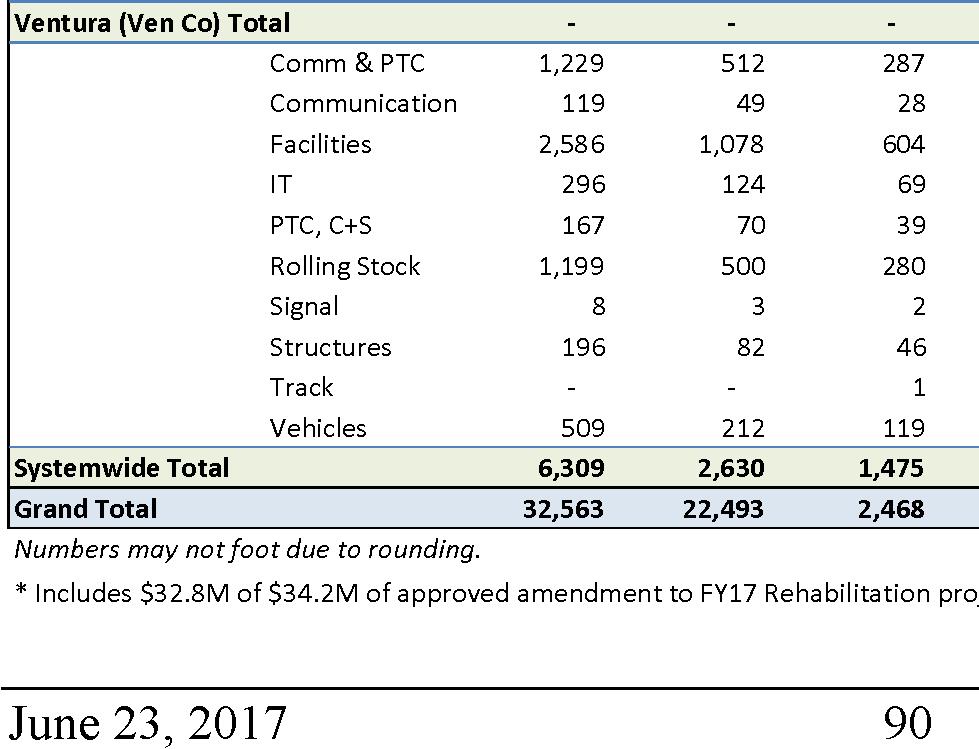
91
92 Exhibit 7.2 FY Rehabilitation New Authority Projects Summary by Subdivision ($000) SUBDIVISION CATEGORY METRO OCTA RCTC SBCTA VCTC OTHER TOTAL Communications Olive Total Communications Grade Crossing Structures 1,225-1,225 Orange Total 1,861-1,861 Communications Grade Crossing Signals 1, ,454 Track ,882 River Total 2, ,967 Communications Grade Crossing 1,814 1,209-3,023 Signals Track 2,784 1, ,452 San Gabriel Total 5,011 3, ,163 Communications San Jacinto (PVL) Total Communications Facilities Grade Crossing 1,606-1,606 Signals 2,792-2,792 Structures 3,639-3,639 Track 4,065-4,065 Valley Total 13,153-13,153 Track Valley, Ventura - LA County Total Communications Grade Crossing 2,829-2,829 Signals Structures Track 4,546-4,546 Ventura - LA County Total 8,388-8,388 Communications Grade Crossing Signals Track 1,700-1,700 Ventura - VC County Total 3,155-3,155 Business Systems ,819 Facilities Non-Revenue Fleet ,163 Rolling Stock 7,342 3,060 1,716 2,226 1,113 26,144 41,600 Signals 1, ,675 Track Systemwide Total 10,618 4,426 2,481 3,219 1,609 26,144 48,497 Proposed FY Rehab New Authority Projects 39,779 7,345 3,083 7,274 5,122 26,956 89,559 Unfunded (32,960) (32,960) Adopted FY Rehab New Authority Projects 6,819 7,345 3,083 7,274 5,122 26,956 56,599 Rotem Settlement Amounts 5,409 (6,059) Unfunded (2,567) 2,567 - Total Adopted FY Rehab New Authority Projects 9,662 3,853 3,083 7,924 5,122 26,956 56,599 w/ Rotem settlement Total Carryovers from Prior Years 32,563 22,493 2,468 6,069 11,748 12,113 87,455 Total Rehab Projects Including Carryovers 45,067 22,854 5,551 14,643 16,870 39, ,053 Numbers may not foot due to rounding. 1) Metro funding is Measure R. 2) OCTA funding is FTA Section Match is from Toll Revenue Credits. 3) RCTC funding is FTA Section Match is from Toll Revenue Credits. 4) SBCTA funding is anticipated to be FTA Section Match is from Toll Revenue Credits. 5) VCTC funding is FTA Section Match is from Toll Revenue Credits. 6) Other funds are anticipated from CalTrans, UPRR, and Amtrak. June 23,
93 Exhibit 7.3 FY New Capital Carryover Projects ($000) SUBDIVISION CATEGORY PROJECT METRO OCTA RCTC SBCTA VCTC OTHER TOTAL CARRYOVER Orange Signal , ,356 San Gabriel Signal , ,904 San Gabriel Signal , ,004 San Gabriel Signal San Gabriel Signal Valley Track Valley Track Systemwide Comm ,609 1, ,492 Systemwide Comm , ,984 Systemwide Equipment ,799 3,799 Systemwide Equipment ,682 9,218 Systemwide Equipment ,317 79,317 Systemwide Equipment ,460 86,460 Systemwide Equipment ,152 10,152 Systemwide Equipment ,076 5,076 Systemwide Facility ,019 Systemwide Facility Systemwide Facility Total 8,826 4,451 1,187 3, , ,908 Numbers may not foot due to rounding. June 23,
94 Exhibit 7.4 FY New Capital New Authority Projects ($000) PROJECT DESCRIPTION CATEGORY METRO OCTA RCTC SBCTA VCTC OTHER TOTAL Laptop and Server Upgrade Business Systems Central Maintenance Facility West Entrance Phase A - focused on Track ,000 Design, Engineering, & putting together contract documents of the CMF West Enterance Porject Interoperable Positive Train Control Rung II Non-Vital to Vital System Upgrade PTC Systems 1, ,070 TOTAL FY PROPOSED AUTHORITY FOR NEW FUNDING $ 2,507 $ 1,045 $ 586 $ 760 $ 380 $ - $ 5,278 Unfunded (2,507) (2,507) Adopted FY New Capital New Authority Projects - 1, ,770 PRIOR YEAR CARRYOVERS $ 8,826 $ 4,451 $ 1,187 $ 3,740 $ 762 $ 193,943 $ 212,908 TOTAL FY AUTHORITY INCLUDING CARRYOVERS $ 8,826 $ 5,496 $ 1,773 $ 4,500 $ 1,142 $ 193,943 $ 215,678 Numbers may not foot due to rounding. June 23,
95 Exhibit 7.5 FY Rehabilitation Carryover Projects Detail ($000) Project Subdivision Category METRO OCTA RCTC SBCTA VCTC OTHER TOTAL Olive Signal Olive Structures Orange Facilities Orange Signal Orange Structures Orange Structures - 5, , Orange Structures Orange Structures Orange Structures - 1, , Orange Structures Orange Track - 1, , Orange Track - 6, , Orange & Olive Comm & PTC Orange & Olive Communication Orange & Olive Signal Orange & Olive Signal Perris Valley Comm & PTC Perris Valley Signal River Signal River Track River Track , River Track TBD River Track , River East Bank Comm & PTC River East Bank Signal River East Bank Track ,906 2, River East Bank Track River East Bank Track River East Bank Track ,032 3, River East Bank Track TBD River East Bank Track ,811 6, Riverside Facilities San Gabriel Communication San Gabriel Signal San Gabriel Signal San Gabriel Signal San Gabriel Signal San Gabriel Signal San Gabriel Structures TBD San Gabriel Structure , San Gabriel Track San Gabriel Track San Gabriel Track TBD San Gabriel Track 1, , Shortway Facilities June 23,
96 Exhibit 7.5 FY Rehabilitation Carryover Projects Detail (continued) ($000) Project Subdivision Category METRO OCTA RCTC SBCTA VCTC OTHER TOTAL Systemwide Comm & PTC 1, , Systemwide Communication Systemwide Facilities Systemwide Facilities Systemwide Facilities , Systemwide Facilities , Systemwide IT Systemwide PTC, C+S Systemwide Rolling Stock Systemwide Rolling Stock Systemwide Rolling Stock Systemwide Signal Systemwide Signal Systemwide Structures TBD Systemwide Structure 1, , Systemwide Track Systemwide Vehicles Systemwide Vehicles Valley Signal Valley Structures Valley Structures Valley Structures 1, ,028 TBD Valley Structure 5, , Valley Track Valley Track 1, ,981 TBD Valley Track 2, , Ventura & Valley Facilities Ventura (LA Co) Communication TBD Ventura (LA Co) Structure 1, , Ventura (LA Co) Track Ventura (LA Co) Track TBD Ventura (LA Co) Track 3, , Ventura (Ven Co) Comm & PTC Ventura (Ven Co) Facilities Ventura (Ven Co) Signal Ventura (Ven Co) Structures ,003-1, Ventura (Ven Co) Structures Ventura (Ven Co) Structures ,680-1, Ventura (Ven Co) Structures Ventura (Ven Co) Structures TBD Ventura (Ven Co) Structures ,460-1, Ventura (Ven Co) Track Ventura (Ven Co) Track Ventura (Ven Co) Track Ventura (Ven Co) Track TBD Ventura (Ven Co) Track ,088-3,088 Grand Total 32,563 22,493 2,468 6,069 11,748 12,113 87,455 Numbers may not foot due to rounding. June 23,
97 Exhibit 7.6 FY Rehabilitation New Authority Projects Detail ($000) PROJECT DESCRIPTION SUBDIVISION CATETORY METRO OCTA RCTC SBCTA VCTC OTHER TOTAL Wayside Communication System Replacment Parts - Olive Olive Communications Wayside Communication System Replacement Parts - Orange Orange Communications Grade Crossing Rehab - Rehab 2 Locations per Year - Orange Orange Grade Crossing Sub (rehab entrance gates, gate savers, predictor units, batteries and other misc crossing equipment.) Orange Sub Struct (Culvert replacement , , , , San Clemente area) Orange Structures - 1, ,225 Wayside Communication System Replacement Parts - River River Communications Grade Crossing Rehab - 2 grade crossings - River Sub River Grade Crossing Phase 1 - Signal System Rehab - CP Terminal Rehab Turnouts River Signals ,000 3X, 5, 5X, 7, 7X and Power Switch Machines. Replace Worn Electric Switch Lock at West Bank River Signals Signal System Rehab - Replace EL1A Logic Controller at CP River Signals Capital Signal System Rehab - River Sub, including backup battery River Signals ,017 banks, and signal system cables. Replace electrologic units with VHLC or Electrologix. Replace Electrocode 4 with EC5 at high-priority locations. LA Union Station Track Rehabilitation, including leads, River Track ,882 turnouts and ties leading into LAUS. Wayside Communication System Replacement Parts - San San Gabriel Communications Gabriel - LA County Wayside Communication System Replacement Parts - San San Gabriel Communications Gabriel - SB County Grade Crossing Rehab - Rehab 2 Locations per Year - SG Sub- San Gabriel Grade Crossing LA County(rehab entrance gates, gate savers, predictor units, batteries and other misc crossing equipment.) Grade Crossing Rehab - Rehab 2 Locations per Year - SG Sub- San Gabriel Grade Crossing SB County(rehab entrance gates, gate savers, predictor units, batteries and other misc crossing equipment.) Rehabilitation of grade crossings on the San Gabriel San Gabriel Grade Crossing 1, ,965 Subdivision in Los Angeles County (Replace rail, ties, crossing panels, fasteners and ballast at Azusa, Irwindale and North Garey Avenues. Place new asphalt road surface from edge of crossing panels to 2 ft from end of ties.) Rehab Worn or Defective Cables - SG Sub San Gabriel Signals Replacement of the turnouts on the San Gabriel Subdivision in San Gabriel Track ,000 Los Angeles County, specifically CP Barranca and CP Irwin. The replacement will involve installing new turnout frog and switch packages, rail, ties and OTM. Replacement of the turnouts on the San Gabriel Subdivision in San Gabriel Track ,342 San Bernardino County, specifically CP Central, CP Beech 1 & 3, CP Locust, and CP Rancho. (see note 1). Replacement will involve installing new turnout frog and switch pkgs, rail, ties and other track matls. San Gabriel Track Rehabilitation (replace fastenings, tie plugs San Gabriel Track 1, ,110 and anchors. Destress rail and surface and stablize track). Wayside Communication System Replacement Parts - PVL San Jacinto (PVL) Communications Condition Based Maintenance Tools, PC and Analysis Systemwide Business Systems Software Perform State of Good Repair Engineering, Track Measurements, and Prioritization to support and populate the annual SOGR/Rehab/TAM Program. Systemwide Business Systems Trapeze Maintenance Management System Software Upgrade Systemwide Business Systems Replace Car shop Jacks at CMF. Current jacks are 24 years Systemwide Facilities old. Replace public address system at CMF. Systemwide Facilities MOW VEHICLE REPLACEMENT - 6 SUVs for train ops, 1 welding truck, 4 hy-rail inspection/repair trucks, 2 signal maintainer vehicles. Systemwide Non-Revenue Fleet ,163 Bombardier (Sentinel) passenger rail cars Midlife Overhaul on Systemwide Rolling Stock 6,819 2,843 1,594 2,067 1,034 26,144 40, cars (see note 3) PTC On-Board Software updates, hardware repairs PTC onboard equipment Systems on 57 cab cars and 52 locomotives. Systemwide Rolling Stock ,100 Backoffice Hardware & Software Replacement (DOC & MOC) Systemwide Signals ,130 for mission critical train control and PTC systems. SCRRA Positive Train Control Lab Systems Support and Testing Systemwide Signals SCRRA Production Backoffice Systems Upgrades and Testing Support Systemwide Signals Rail Grinding Systemwide to maintain rail profile and improve Systemwide Track running surface of the rail. Wayside Communication System Replacement Parts - Valley Valley Communications June 23,
98 Exhibit 7.6 FY Rehabilitation New Authority Projects Detail (continued) ($000) PROJECT DESCRIPTION SUBDIVISION CATETORY METRO OCTA RCTC SBCTA VCTC OTHER TOTAL Replace Expand Lancaster Crew Base by installing new Valley Facilities modular building and portable weather resistant communication shelter for train operations and mechanical crews. The existing crew base has 18 crew members reporting daily, and currently comfortably seats 2 people. Grade Crossing Rehab - 2 Locations per Year - Valley Sub Valley Grade Crossing Rehabilitation of grade crossings on the Valley Subdivision in Valley Grade Crossing 1, ,049 Los Angeles County (Drayton Street, Aliso Canyon Road, Doran Street, and Arvilla Ave.) Rehab Worn or Defective Cables - Valley Sub Valley Signals Replace Temporary AC Power Feed to signal 761 with Permanent and sustainable solar power supply - Valley Sub. Valley Signals Signal System Rehab - Rehab Logic Controllers and Supporting Valley Signals 1, ,131 Equipment - Valley Sub. Replace signal system backup battery banks, and worn underground signal cables. Replace Electrologic with VHLC or electrologix. Replace Electocode 4 units with Electrocode 5 at high priority locations. Signal System Rehab - Replace EL1A Logic Controller at CP Valley Signals Harold Signal System Rehab - Replace Track Turnout and Power Valley Signals Switch at CP Harold Valley Sub Structures - bridge & 8 culverts (38.64, Valley Structures 3, , , 43.55, 66.86, 66.90, , 46.24). Valley Track Rehabilitation. Install new fastenings, tie plugs, Valley Track 4, ,065 anchors, and destress rail, surface and stablizie track. MP Station Pedestrian Crossing panels at downtown Burbank, Valley, Track Burbank Airport and Chatsworth stations. Current panels are Ventura - LA at end of useful life and are not ADA compliant. County Wayside Communication System Replacement Parts - Ventura Ventura - LA Communications LA County County Grade Crossing Rehab 2 Locations per Year Ventura - LA Grade Crossing County Rehabilitation of grade crossings on the Ventura Subdivision Ventura - LA Grade Crossing 2, ,297 in Los Angeles County County Rehab Signal and Grade Crossing Cables - Ven Sub Ventura - LA County Signals Ventura Sub (LA CO) Struct. Construct replacement of bridge Ventura - LA which is partially funded in FY 16. Bridge is 101 years County old. Structures Ventura (LA) Tie Rehabilitation - replace 7,500 ies using a production tie gang. Ventura - LA County Track 3, ,010 Ventura (LA) Track Rehabilitation. Install new fastenings, tie plugs, anchors, and destress rail, surface and stabilize track. Ventura - LA County Track 1, ,535 Wayside Communication System Replacement Parts - Ventura Ventura - VC Communications Ventura County County Grade Crossing Rehab - 2 Locations per Year - Ven Sub Ventura - VC Grade Crossing County Rehabilitation of grade crossings on the Ventura Subdivision Ventura - VC Grade Crossing in Ventura County County Rehab Signal and Grade Crossing Cables - Ven Sub Ventura - VC County Signals Replace rail ties and ballast on Arroyo Simi Bridges - Ventura Ventura - VC Track ,026-1,026 Sub VN Cty - MP , , , and County track feet each, 1,200 track feet total). Ventura (VC) Tie Rehabilitation - replace 1,550 ties using a Ventura - VC Track production tie gang. County Proposed FY Rehab New Authority Projects 39,779 7,345 3,083 7,274 5,122 26,956 89,559 Unfunded (32,960) (32,960) Adopted FY Rehab New Authority Projects 6,819 7,345 3,083 7,274 5,122 26,956 56,599 ROTEM SETTLEMENT AMOUNTS 5,409 (6,059) Unfunded (2,567) 2,567 Total Adopted FY Rehab New Authority Projects w/ Rotem Settlement 9,662 3,853 3,083 7,924 5,122 26,956 56,599 PRIOR YEAR CARRYOVERS 32,563 22,493 2,468 6,069 11,748 12,113 87,455 TOTAL FY17-18 REHAB NEW AUTHORITY AND CARRYOVERS 45,067 22,854 5,551 14,643 16,870 39, ,053 Numbers may not foot due to rounding. June 23,
99 Exhibit Capital Summary and Cash Flow Detail All Agencies ($000) FISCAL YEAR REHABILITATION PROJECTS NEW CAPITAL PROJECTS TOTAL 2017/18 1 $ 89,559 $ 5,278 $ 94, /19 $ 194,925 $ 9,842 $ 204, /20 $ 113,349 $ 4,907 $ 118,256 TOTALS $ 397,832 $ 20,026 $ 417, Excludes prior year budget carryover amounts CAPITAL BUDGET SUMMARY CONSOLIDATED CASH FLOW BY FISCAL YEAR ($000) BUDGET FISCAL YEAR 2017/ / / / / /23 TOTAL 2017/2018 REHABILITATION $ 4,478 $ 31,346 $ 26,868 $ 26,868 $ 89,559 NEW CAPITAL $ 264 $ 1,583 $ 1,847 $ 1,583 $ 5,278 SUBTOTAL $ 4,742 $ 32,929 $ 28,715 $ 28,451 $ 94, /2019 REHABILITATION $ 9,746 $ 68,224 $ 58,477 $ 58,477 $ 194,925 NEW CAPITAL $ 492 $ 2,953 $ 3,445 $ 2,953 $ 9,842 SUBTOTAL $ 10,238 $ 71,176 $ 61,922 $ 61,430 $ 204, /2020 REHABILITATION $ 5,667 $ 39,672 $ 34,005 $ 34,005 $ 113,349 NEW CAPITAL $ 245 $ 1,472 $ 1,717 $ 1,472 $ 4,907 SUBTOTAL $ 5,913 $ 41,144 $ 35,722 $ 35,477 $ 118,256 TOTALS REHABILITATION $ 4,478 $ 41,092 $ 100,759 $ 125,017 $ 92,482 $ 34,005 $ 397,832 NEW CAPITAL $ 264 $ 2,075 $ 5,045 $ 6,500 $ 4,670 $ 1,472 $ 20,026 TOTAL PROJECTED CASH FLOW BY FISCAL YEAR $ 4,742 $ 43,167 $ 105,804 $ 131,517 $ 97,152 $ 35,477 $ 417,859 PROJECT BUDGETS BY FISCAL YEAR $ 94,837 $ 204,767 $ 118,256 N/A N/A N/A N/A Numbers may not foot due to rounding. Note: A total of $108.1 million has been moved from the original FY18 Rehab submissions, and added in equal parts to the FY19 & FY20 submissions. Budget assumption is that for these portions added to FY19 and FY20, that cash flow amounts will be allocated in the same percentage proportions across the years and same funding pattern for each member that was used for FY18. Note: Based on proposed Capital Budget June 23,
100 Exhibit Capital Summary and Cash Flow Detail Metro ($000) FISCAL YEAR REHABILITATIO N PROJECTS NEW CAPITAL PROJECTS TOTAL 2017/18 $ 39,779 $ 2,507 $ 42,286 ROTEM SETTLEMENT $ 5,409 $ 5,409 TOTAL 2017/18 $ 45,189 $ 2,507 $ 47, /19 $ 130,878 $ 9,600 $ 140, /20 $ 52,258 $ 2,427 $ 54,685 TOTALS $ 228,325 $ 14,533 $ 242,858 Numbers may not foot due to rounding. Note: 18/19 AND 19/20 REHAB BUDGETS EXCLUDE ROTEM SETTLEMENT CAPITAL BUDGET SUMMARY Metro CASH FLOW BY FISCAL YEAR ($000) BUDGET FISCAL YEAR 2017/ / / / / /23 TOTAL 2017/2018 REHABILITATION $ 1,989 $ 13,923 $ 11,934 $ 11,934 $ 39,779 ROTEM SETTLEMENT $ 270 $ 1,893 $ 1,623 $ 1,623 $ 5,409 NEW CAPITAL $ 125 $ 752 $ 877 $ 752 $ 2,507 SUBTOTAL $ 2,385 $ 16,568 $ 14,434 $ 14,309 $ 47, /2019 REHABILITATION $ 6,544 $ 45,807 $ 39,263 $ 39,263 $ 130,878 NEW CAPITAL $ 480 $ 2,880 $ 3,360 $ 2,880 $ 9,600 SUBTOTAL $ 7,024 $ 48,687 $ 42,623 $ 42,143 $ 140, /2020 REHABILITATION $ 2,613 $ 18,290 $ 15,678 $ 15,678 $ 52,258 NEW CAPITAL $ 121 $ 728 $ 849 $ 728 $ 2,427 SUBTOTAL $ 2,734 $ 19,018 $ 16,527 $ 16,406 $ 54,685 TOTALS REHABILITATION AND ROTEM $ 2,259 $ 22,360 $ 61,977 $ 71,110 $ 54,941 $ 15,678 $ 228,325 NEW CAPITAL $ 125 $ 1,232 $ 3,879 $ 4,840 $ 3,729 $ 728 $ 14,533 TOTAL PROJECTED CASH FLOW BY FISCAL YEAR $ 2,385 $ 23,592 $ 65,855 $ 75,950 $ 58,670 $ 16,406 $ 242,858 PROJECT BUDGETS BY FISCAL YEAR $ 47,696 $ 140,478 $ 54,685 N/A N/A N/A N/A Numbers may not foot due to rounding. Note: EXCLUDES ROTEM SETTLEMENT AMOUNTS FOR FY 18/19 AND 19/20 Note: Based on proposed Capital Budget June 23,
101 Exhibit Capital Summary and Cash Flow Detail OCTA ($000) FISCAL YEAR REHABILITATION PROJECTS NEW CAPITAL PROJECTS TOTAL 2017/18 $ 7,345 $ 1,045 $ 8,390 ROTEM SETTLEMENT Metro ($ 5,409) ($ 5,409) ROTEM SETTLEMENT RCTC - - ROTEM SETTLEMENT SBCTA ($ 650) ($ 650) ROTEM SETTLEMENT VCTC - - TOTAL 17/18 $ 1,286 $ 1,045 $ 2, /19 $ 13,525 $ 91 $ 13, /20 $ 16,139 $ 1,012 $ 17,150 TOTALS $ 30,950 $ 2,148 $ 33,098 Numbers may not foot due to rounding. Note: 18/19 AND 19/20 REHAB BUDGETS EXCLUDE ROTEM SETTLEMENT CAPITAL BUDGET SUMMARY OCTA CASH FLOW BY FISCAL YEAR ($000) BUDGET FISCAL YEAR 2017/ / / / / /2023 TOTAL 2017/2018 REHABILITATION $ 367 $ 2,571 $ 2,203 $ 2,203 $ 7,345 ROTEM SETTLEMENT Metro ($ 270) ($ 1,893) ($ 1,623) ($ 1,623) ($ 5,409) ROTEM SETTLEMENT RCTC ROTEM SETTLEMENT SBCTA ($ 32) ($ 227) ($ 195) ($ 195) ($ 650) ROTEM SETTLEMENT VCTC NEW CAPITAL $ 52 $ 314 $ 366 $ 314 $ 1,045 SUBTOTAL $ 117 $ 764 $ 752 $ 699 $ 2, /2019 REHABILITATION $ 676 $ 4,734 $ 4,058 $ 4,058 $ 13,525 NEW CAPITAL $ 5 $ 27 $ 32 $ 27 $ 91 SUBTOTAL $ 681 $ 4,761 $ 4,090 $ 4,085 $ 13, /2020 REHABILITATION $ 807 $ 5,649 $ 4,842 $ 4,842 $ 16,139 NEW CAPITAL $ 51 $ 303 $ 354 $ 303 $ 1,012 SUBTOTAL $ 858 $ 5,952 $ 5,196 $ 5,145 $ 17,150 TOTALS REHABILITATION NET OF ROTEM $ 64 $ 1,126 $ 5,927 $ 10,092 $ 8,899 $ 4,842 $ 30,950 NEW CAPITAL $ 52 $ 318 $ 444 $ 649 $ 381 $ 303 $ 2,148 TOTAL PROJECTED CASH FLOW BY FISCAL YEAR $ 117 $ 1,444 $ 6,370 $ 10,741 $ 9,281 $ 5,145 $ 33,098 PROJECT BUDGETS BY FISCAL YEAR $ 2,331 $ 13,616 $ 17,150 N/A N/A N/A N/A Numbers may not foot due to rounding. Note: EXCLUDES ROTEM SETTLEMENT AMOUNTS FOR FY 18/19 AND 19/20 Note: Based on proposed Capital Budget June 23,
102 Exhibit Capital Summary and Cash Flow Detail RCTC ($000) FISCAL YEAR REHABILITATION PROJECTS NEW CAPITAL PROJECTS TOTAL 2017/18 $ 3,083 $ 586 $ 3, /18 $ 10,092 $ 51 $ 10, /19 $ 7,093 $ 567 $ 7,661 TOTALS $ 20,268 $ 1,204 $ 21,472 Numbers may not foot due to rounding. Note: EXCLUDES ROTEM SETTLEMENT FOR FY 18/19 AND 19/20 ($000) CAPITAL BUDGET SUMMARY RCTC CASH FLOW BY FISCAL YEAR BUDGET FISCAL YEAR 2017/ / / / / /2023 TOTAL 2017/2018 REHABILITATION $ 154 $ 1,079 $ 925 $ 925 $ 3,083 NEW CAPITAL $ 29 $ 176 $ 205 $ 176 $ 586 SUBTOTAL $ 183 $ 1,255 $ 1,130 $ 1,101 $ 3, /2019 REHABILITATION $ 505 $ 3,532 $ 3,028 $ 3,028 $ 10,092 NEW CAPITAL $ 3 $ 15 $ 18 $ 15 $ 51 SUBTOTAL $ 507 $ 3,548 $ 3,046 $ 3,043 $ 10, /2020 REHABILITATION $ 355 $ 2,483 $ 2,128 $ 2,128 $ 7,093 NEW CAPITAL $ 28 $ 170 $ 198 $ 170 $ 567 SUBTOTAL $ 383 $ 2,653 $ 2,327 $ 2,298 $ 7,661 TOTALS REHABILITATION $ 154 $ 1,584 $ 4,812 $ 6,435 $ 5,156 $ 2,128 $ 20,268 NEW CAPITAL $ 29 $ 178 $ 249 $ 364 $ 214 $ 170 $ 1,204 TOTAL PROJECTED CASH FLOW BY FISCAL YEAR $ 183 $ 1,762 $ 5,060 $ 6,799 $ 5,370 $ 2,298 $ 21,472 PROJECT BUDGETS BY FISCAL YEAR $ 3,668 $ 10,143 $ 7,661 N/A N/A N/A N/A Numbers may not foot due to rounding. Note: EXCLUDES ROTEM SETTLEMENT FOR FY 18/19 AND 19/20 Note: Based on proposed Capital Budget June 23,
103 Exhibit Capital Summary and Cash Flow Detail SBCTA ($000) FISCAL YEAR REHABILITATION PROJECTS NEW CAPITAL PROJECTS TOTAL 20/17/18 $ 7,274 $ 760 $ 8,034 ROTEM SETTLEMENT $ 650 $ 650 TOTAL 17/18 $ 7,924 $ 760 $ 8, /19 $ 11,096 $ 66 $ 11, /20 $ 13,025 $ 736 $ 13,761 TOTALS $ 32,045 $ 1,562 $ 33,607 Numbers may not foot due to rounding. Note: EXCLUDES ROTEM SETTLEMENT FOR FY 18/19 AND 19/20 ($000) CAPITAL BUDGET SUMMARY SBCTA CASH FLOW BY FISCAL YEAR BUDGET FISCAL YEAR 2017/ / / / / /2023 TOTAL 2017/2018 REHABILITATION $ 364 $ 2,546 $ 2,182 $ 2,182 $ 7,274 ROTEM SETTLEMENT $ 32 $ 227 $ 195 $ 195 $ 650 NEW CAPITAL $ 38 $ 228 $ 266 $ 228 $ 760 SUBTOTAL $ 434 $ 3,001 $ 2,643 $ 2,605 $ 8, /2019 REHABILITATION $ 555 $ 3,883 $ 3,329 $ 3,329 $ 11,096 NEW CAPITAL $ 3 $ 20 $ 23 $ 20 $ 66 SUBTOTAL $ 558 $ 3,903 $ 3,352 $ 3,349 $ 11, /2020 REHABILITATION $ 651 $ 4,559 $ 3,907 $ 3,907 $ 13,025 NEW CAPITAL $ 37 $ 221 $ 257 $ 221 $ 736 SUBTOTAL $ 688 $ 4,779 $ 4,165 $ 4,128 $ 13,761 TOTALS REHABILITATION NET OF ROTEM $ 396 $ 3,328 $ 6,912 $ 10,265 $ 7,236 $ 3,907 $ 32,045 NEW CAPITAL $ 38 $ 231 $ 323 $ 472 $ 277 $ 221 $ 1,562 TOTAL PROJECTED CASH FLOW BY FISCAL YEAR $ 434 $ 3,560 $ 7,235 $ 10,737 $ 7,514 $ 4,128 $ 33,607 PROJECT BUDGETS BY FISCAL YEAR $ 8,684 $ 11,162 $ 13,761 N/A N/A N/A N/A Numbers may not foot due to rounding. Note: EXCLUDES ROTEM SETTLEMENT FOR FY 18/19 AND 19/20 Note: Based on proposed Capital Budget June 23,
104 Exhibit Capital Summary and Cash Flow Detail VCTC ($000) FISCAL YEAR REHABILITATION PROJECTS NEW CAPITAL PROJECTS TOTAL 2017/18 $ 5,122 $ 380 $ 5, /19 $ 8,360 $ 33 $ 8, /20 $ 8,560 $ 165 $ 8,725 TOTALS $ 22,042 $ 579 $ 22,620 Numbers may not foot due to rounding. Note: EXCLUDES ROTEM SETTLEMENT FOR FY 18/19 AND 19/20 ($000) CAPITAL BUDGET SUMMARY VCTC CASH FLOW BY FISCAL YEAR BUDGET FISCAL YEAR 2017/ / / / / /2023 TOTAL 2017/2018 REHABILITATION $ 256 $ 1,793 $ 1,537 $ 1,537 $ 5,122 NEW CAPITAL $ 19 $ 114 $ 133 $ 114 $ 380 SUBTOTAL $ 275 $ 1,907 $ 1,670 $ 1,651 $ 5, /2019 REHABILITATION $ 418 $ 2,926 $ 2,508 $ 2,508 $ 8,360 NEW CAPITAL $ 2 $ 10 $ 12 $ 10 $ 33 SUBTOTAL $ 420 $ 2,936 $ 2,520 $ 2,518 $ 8, /2020 REHABILITATION $ 428 $ 2,996 $ 2,568 $ 2,568 $ 8,560 NEW CAPITAL $ 8 $ 50 $ 58 $ 50 $ 165 SUBTOTAL $ 436 $ 3,046 $ 2,626 $ 2,618 $ 8,725 TOTALS REHABILITATION $ 256 $ 2,211 $ 4,891 $ 7,040 $ 5,076 $ 2,568 $ 22,042 NEW CAPITAL $ 19 $ 116 $ 151 $ 175 $ 68 $ 50 $ 579 TOTAL PROJECTED CASH FLOW BY FISCAL YEAR $ 275 $ 2,326 $ 5,042 $ 7,216 $ 5,144 $ 2,618 $ 22,620 PROJECT BUDGETS BY FISCAL YEAR $ 5,502 $ 8,393 $ 8,725 N/A N/A N/A N/A Numbers may not foot due to rounding. Note: EXCLUDES ROTEM SETTLEMENT FOR FY 18/19 AND 19/20 Note: Based on proposed Capital Budget June 23,
105 Exhibit Capital Summary and Cash Flow Detail Other Fund Sources ($000) FISCAL YEAR REHABILITATION PROJECTS NEW CAPITAL PROJECTS TOTAL 2017/18 $ 26,956 - $ 26, /19 $ 20,974 - $ 20, /20 $ 16,274 - $ 16,274 TOTALS $ 64,203 - $ 64,203 Numbers may not foot due to rounding. ($000) CAPITAL BUDGET SUMMARY OTHER CASH FLOW BY FISCAL YEAR BUDGET FISCAL YEAR 2017/ / / / / /23 TOTAL 2017/2018 REHABILITATION $ 1,348 $ 9,435 $ 8,087 $ 8,087 $ 26,956 NEW CAPITAL SUBTOTAL $ 1,348 $ 9,435 $ 8,087 $ 8,087 $ 26, /2019 REHABILITATION $ 1,049 $ 7,341 $ 6,292 $ 6,292 $ 20,974 NEW CAPITAL SUBTOTAL $ 1,049 $ 7,341 $ 6,292 $ 6,292 $ 20, /2020 REHABILITATION $ 814 $ 5,696 $ 4,882 $ 4,882 $ 16,274 NEW CAPITAL SUBTOTAL $ 814 $ 5,696 $ 4,882 $ 4,882 $ 16,274 TOTALS REHABILITATION $ 1,348 $ 10,483 $ 16,241 $ 20,075 $ 11,174 $ 4,882 $ 64,203 NEW CAPITAL TOTAL PROJECTED CASH FLOW BY FISCAL YEAR $ 1,348 $ 10,483 $ 16,241 $ 20,075 $ 11,174 $ 4,882 $ 64,203 PROJECT BUDGETS BY FISCAL YEAR $ 26,956 $ 20,974 $ 16,274 N/A N/A N/A N/A Numbers may not foot due to rounding. Note: Based on proposed Capital Budget June 23,
106 SOUTHERN CALIFORNIA REGIONAL RAIL AUTHORITY FY BUDGET SECTION 8: General and Administrative Budget 8.1 General and Administrative Expenses Indirect costs are those incurred by an organization for common or joint objectives that cannot be readily or specifically identified with a particular cost grouping. SCRRA accounts for agency costs that cannot be directly attributed to any specific agency program or mode, and therefore serve to benefit the agency as a whole, or benefit at least three of the Authority s business modes by grouping them in the General and Administrative (G&A) Budget. SCRRA business modes are Train Operations, Maintenance-of-Way (MOW), New Capital, Rehabilitation and recollectables or Third Party Agreements (TPA s). For FY , the adopted SCRRA G&A budget, using the compilation of costs as described above, is $22.4 million or an increase of $1.2 million, or 5.5%, over the FY Adopted Budget. Exhibit 8.1 identifies the key elements of this budget by expenditure type. 8.2 Indirect Cost Allocation Plan (ICAP) Funding the cost of SCRRA s various business modes is derived from grantor funding sources. Indirect costs have historically been charged to the grantor by project based on a percentage of the projects direct labor costs. This chargeable percentage is called the indirect cost rate. As part of the FY Indirect Cost Allocation Plan (ICAP), SCRRA developed a cost allocation based primarily on labor costs and the benefit each cost center receives from support departments. SCRRA has received approval of the FY , FY , FY and FY Plans from the Federal Transit Administration (FTA), SCRRA s cognizant agency. In October of 2012, a letter was received from the FTA advising that SCRRA s FY and FY did not require approval, because those rates did not exceed the previous rate by more than 20%. The ICAP for FY and FY were submitted to the FTA in FY and final audits are pending. SCRRA received provisional approval to use those rates for FY , FY , and FY The FY plan, based on FY actuals has been submitted to the FTA and is pending provisional or final approval. The FY Plan contains a specific ICAP rate for each cost center that receives shared service support, as indicated on Exhibit 8.2. SCRRA further divides costs within General and Administrative into three distinct cost collector pools. June 23,
107 8.2.1 Pool One The first grouping of expenses consists of specified costs, as identified in Office of Management and Budget Circular A-87 (OMB A-87), which are authorized for allocation to federal grant funding sources. Items in the G&A budget include: lease costs of the Authority s administrative headquarters; general administrative items such as office supplies, postage and the lease of office equipment; labor costs of non-project, non-operational staff such as Budget and Financial Analysis, General Accounting; certain financial services; the Internal Audit function; and the costs of operating and maintaining the Information Technology infrastructure Pool Two The second grouping of expenses is made up of costs that, while benefiting three or more of the Authority s business modes, are specifically excluded from allocation by federal regulation and therefore funded locally. Examples of costs recognized within this group include the costs of the Chief Executive Officer and legislative advocacy Pool Three The third grouping of expenses represents Administrative Capital costs, treated as depreciable assets according to GAAP guidelines. Costs in this pool are primarily related to the procurement of Information Technologies equipment and other administrative equipment purchases. 8.3 Allocation of Indirect Costs A double-step down allocation methodology is used to allocate the allowable costs of the central services departments. This methodology recognizes the cross support provided between central service departments. The double-step down methodology requires an initial sequencing of allocating departments. The two steps are: 1. Allowable costs from central service departments are allocated in the defined numeric sequence to all departments and divisions including other central service departments. All operating costs recorded in the central service department as well as all allocated costs received from other central service departments up to this point in the calculation cycle are allocated in the first step. 2. The double-step down methodology is made to fully account for the cross support provided between central service departments. Costs received from other central service departments subsequent to the department s first allocation are allocated in the second step. Central service departments are closed after the second step in the methodology and cannot receive additional allocations from other central services. For the remaining G&A expenses ineligible for federal June 23,
108 reimbursement, allocation is made to the various operating budget modes based on the modal labor distribution. 8.4 Future Revision in ICAP Rate(s) SCRRA is in the process of modifying the ICAP calculation methodology as follows: Changing from a project category based rate to a cost center rate that better aligns service costs with cost centers and ultimately projects benefitting from those services. With the exception of Operations and Maintenance-of-Way, projects which are trued-up at year-end, the unrecovered or over-recovered balances will be carried over to Plan calculations for the next period. This FY Budget reflects the historic ICAP calculation methodology. Should the modified methodology be approved, it will be applied to actuals for FY in the reconciliation process. 8.5 Organizational Summary Under the leadership of the Chief Executive Officer, Deputy Chief Executive Officer, Chief Financial Officer, Chief Operations Officer, and Chief of External Affairs, SCRRA manages 273 full time equivalent (FTE) headcounts. Agency FTE Headcount FY REPORTING GROUP FTE's Executive 3 Internal Audit 4 Legal 4 Office of the DCEO 61 Administration 42 Operations Executive group includes the Chief Executive Officer, Deputy Chief Executive Officer and an Administrative Management Specialist. Internal Audit reports directly to the SCRRA Board and includes a team of internal auditors. June 23,
109 Legal includes the General Counsel who is a direct report to the SCRRA Board and oversees the activities of in-house and outside counsel, litigation, and Risk Management. Deputy Chief Executive Officer group includes Finance, Human Resources, Contracts and Compliance, and Information Technology. Administration includes Government Affairs, Office of External Affairs, Sales and Marketing, Public Affairs, Customer Relations and Customer Engagement. Operations includes responsibility for Positive Train Control (PTC), dispatching services, facilities and fleet maintenance, field operations, materials management and warehousing, fare collection services, program management, the execution of rehabilitation and new capital projects, management of outsourced vendors for Train Operations, equipment maintenance, track, signal & structure maintenance and rehabilitation, Maintenance-of-Way, rail corridor crossings and encroachment, and security and system safety. Exhibit 8.3 identifies the classification titles in the approved budgeted cost centers for a total of 273 FTE headcount. Total Authority labor and fringe costs are allocated across the business modes. 8.6 Exhibits Exhibit 8.1: FY General Administrative Expenses identifies the individual cost components included in the general and administrative cost grouping. Exhibit 8.2: FY Indirect Cost Allocation Plan (ICAP) Cost Calculations illustrates the proposed SCRRA business modes and the cost allocations that support the FY ICAP rates. Exhibit 8.3: FY Roster of Positions provides a roster of FY FTE headcount identified by specific positions within each Executive Office and Department. June 23,
110 Exhibit 8.1 FY General and Administrative Expenses ($000) Fiscal Year FY Budget vs. FY Federally Local FY Budget Expenditure Description Budget Eligible Funding Total Budget Variance % Agency Costs Audting and Accounting % Consultants (446) (70.1%) Recruitment Services % Medical Examinations (4) (46.7%) Office Equip Maint & Repair % Document Management & Storage (25) (49.3%) In-House Training Services % Bank Service Charges (1) (3.2%) Materials & Supplies (18) (12.5%) Office Equipment (25) (71.4%) Computer Software % Printing & Reproduction % Claims Administration Fees % Professional Memberships % Subscriptions & Reference Materials (0) (2.0%) Meeting Expenses % Registration Fees (1) (1.3%) Transportation (7) (8.5%) Meals & Entertainment (3) (17.2%) Lodging % Mileage/Parking % Misc Expenses % Media Relations 1 (1) (100.0%) Event Marketing % Legal & Meeting Notices % Postage & Messenger (11) (13.2%) Fines & Penalties % Other Misc Expense % Total Agency Costs 1,992 1, ,674 (318) (16.0%) Staff Labor SCRRA Wages & Salaries 8,039 7, , % Wages Interns (20) (7.4%) Wages Job Core / Grads on Track % Merit Increase % Allocated Fringe Benefits 3,047 2, ,589 (458) (15.0%) OPEB - GASB45 1,768 1,627 1,627 (141) (8.0%) Total Staff Labor 13,280 10,140 2,864 13,004 (276) (2.1%) Professional Services Legal Services % Auditing & Accounting % Consultants 876 1, , % Lobby Services % Service Contract % Total Professional Services 1,791 2, ,914 1, % MIS Consultants 1,300 1,448 1, % Computer S/W / H/W Maintenance % Office Equip Maint & Repair % Document Management & Storage % Materials & Supplies % Office Equipment % Computer H/W % Computer S/W % Printing & Reproduction License & Registration Fees % Total MIS 3,000 3,594 3, % Employee Recognition Bonus Pay Total Employee Recognition Utilities/Leases Office Equipment Rental 5 (5) (100.0%) Office Space Rental (82) (8.5%) Total Utilities/Leases (87) (9.0%) Board Related Items Board Travel/Meeting Expenses % Board Travel % Board Per Diem % Board Development Program % Total Board Related Items % Total General & Administrative Expenses 21,183 18,471 3,888 22,359 1, % Numbers may not foot due to rounding. June 23,
111 Exhibit 8.2 FY Indirect Cost Allocation Plan (ICAP) Cost Calculations General & Adminstrative Expenses ($000) FY Federally Eligible G&A 18,471 Non-Federal Eligible G&A 3,888 Total G&A Expenses 22,359 Tier 1 Cost Distribution Operating Capital Train Subtotal New Equipment Rehabilitation Subtotal Grand Operations MOW Operating Capital Procurement & Renovation Capital Recollectable Total SCRRA Labor Distribution (%) 68.4% 14.0% 82.4% 3.8% 0.3% 9.6% 13.7% 3.9% 100.0% Federally Eligible G&A Allocation (Proj# ) 12,642 2,583 15, ,772 2, ,471 Non-Federal Eligible Labor Distribution (%) 83.0% 17.0% 100.0% 100.0% Non-Federal Eligible G&A Allocation (Proj# ) 3, ,888 3,888 Total G&A Expense Allocation 15,870 3,243 19, ,772 2, ,359 Numbers may not foot due to rounding. Tier 2 Allocation and Calculation of Direct Rates Collector Pool Expenses Salaries & Wages 2, , ,479 Fringe Benefits ,048 Other Expenses 8, , ,853 Subtotal - Indirect Expenses 11, , , ,380 G&A Expense Allocation 15,870 3,243 19, ,772 2, ,359 Total Indirect and Allocable Expenses 27,094 3,883 30,977 1, ,539 3, ,738 Direct Expenses Salaries & Wages 11,993 2,543 14, ,403 1, ,058 Fringe Benefits 3, , ,516 Other Expenses 158,421 34, ,805 11, ,509 57, ,347 15, ,764 Total Direct Expenses 174,344 37, ,068 11, ,531 59, ,807 16, ,337 Grand Total 201,438 41, ,045 12, ,648 62, ,628 17, ,076 Total Indirect and Allocable Expenses as % of Direct Labor Numbers may not foot due to rounding. 226% 153% 257% 705% 181% 145% June 23,
112 Exhibit 8.3 FY Roster of Positions Business Unit Cost Center Cost Center/Division Position Total Executive 1100 Office of the CEO Chief Executive Officer 1 Deputy Chief Executive Officer 1 Administrative Management Specialist 1 Office of the CEO Total 3 Internal Audit 1110 Internal Audit Audit Manager 1 Senior Auditor 1 Senior Auditor, Governmental Compliance 1 Staff Auditor II 1 Internal Audit Total 4 Legal 1115 Office of the General Counsel Associate General Counsel 1 General Counsel 1 Business Analyst 1 Office of the General Counsel Total Risk Management Senior Counsel, Risk Manager 1 Risk Management Total 1 Deputy CEO 1130 Human Resources HR Analyst 4 Assistant Manager, Human Resources 1 Department Assistant 2 Director, Human Resources 1 Manager, Human Resources 1 Manager, Learning & Development 1 Human Resources Total Finance Grants Accountant I 2 Financial Analyst II 3 Senior Accountant 1 Accounting Assistant 1 Manager, Special Projects 1 Accountant I 1 Cost Accountant I 2 Accounts Payable Specialist I 2 Chief Financial Officer 1 Controller 1 Cost Accountant II 1 Fare Collections Services (FCS) Revenue Specialist 1 Executive Assistant 1 Financial Analyst I 1 Manager, Budgets + Financial Analysis 1 Manager, General Accounting 1 Manager, Grants Admin + Fiscal Mngmt 1 Capital Budget Analyst 1 Payroll Accountant I 1 Cash Management Analyst I 1 Grants Accountant II 1 Finance Total 26 June 23,
113 Exhibit 8.3 FY Roster of Positions (continued) Business Unit Cost Center Cost Center/Division Position Total Deputy CEO 4220 Purchasing, Contracts & Contract Compliance Assistant Director, Contracts 1 Senior Contract & Compliance Administrator 5 Contract + Compliance Administrator 3 Contracts Data Analyst I 1 Administrative Assistant 1 Principal Contract + Compliance Administrator 2 Purchasing, Contracts & Contract Compliance Total Information Technology Business Intelligence Architect 2 IT Systems Manager - Applications 1 Functional Lead, Operations and Engineering 1 Information Systems Supervisor 1 Lead, Oracle Finance + Procurement 2 Salesforce.com Administrator 1 Senior Director, Information Technology 1 Senior Network Engineer 1 IT Systems Manager (Infrastructure) 1 Webmaster 1 Information Technology Total 12 Administration 1105 Government Affairs Government & Regulatory Affairs Manager 1 Government Relations Administrator 1 Government Affairs Total Office of the C.E.A. Chief of External Affairs 1 Department Assistant 1 Assistant to the CEO/Board Secretary 1 Assistant Board Secretary (AMS) 1 Office of the C.E.A. Total Sales + Marketing Department Assistant 1 Marketing Manager (Digital Systems) 1 Manager, Corporate Accounts 1 Manager, Sales + Marketing 1 Marketing Manager 1 Sales & Marketing Coordinator 1 Social Media Specialist 1 Sales + Marketing Total 7 June 23,
114 Exhibit 8.3 FY Roster of Positions (continued) Business Unit Cost Center Cost Center/Division Position Total Administration 3300 Customer Relations Assistant Manager, Customer Engagement LAUS 1 Assistant Manager, Customer Engagement MOC 1 Customer Engagement Representative 11 Communications Coordinator 2 Lead, Customer Engagement Representative 6 Customer Relations Supervisor 2 Manager, Customer Engagement LAUS 1 Customer Relations Supervisor (PM) 1 Customer Relations Total Public Affairs Assistant Public Affairs Officer 2 Public Affairs Specialist (AMS) 1 Director, Public Affairs 1 Public Affairs Total 4 Operations 2875 PTC, C+S Systems Management Manager, PTC Network Architecture (Acting/Dir, Network C 1 PTC, C+S Systems Management Total Planning + Development Director, Planning and Development 1 Grants Funding and Compliance Administrator 1 Planning Manager (Performance Data and Metrics) 1 Planning Manager, Asset Data 1 Manager, Research & Planning 1 Planning Manager 1 Sr. Public Projects Specialist 1 Assistant Director, Grants 1 Planning Manager (Planning and System Performance Analy 1 Planning + Development Total Office of the COO Department Assistant 1 Deputy Chief Operating Officer (PPD) 1 Chief Operating Officer 1 Deputy Chief Operating Officer (Disp + OS) 1 Executive Assistant 1 Business Manager 1 Office of the COO Total Operations + Security Business Administrator 2 Manager, Special Projects 1 Operations + Security Total 3 June 23,
115 Exhibit 8.3 FY Roster of Positions (continued) Business Unit Cost Center Cost Center/Division Position Total Operations 2210 System Safety Assistant Director, System Safety 1 Business Administrator 1 Administrative Management Specialist 1 Director, System Safety + Security 1 Public Safety + Environment Manager 1 Security Manager 1 Deputy Chief Operating Officer (System Safety & Complianc 1 System Safety Total Dispatching Services Communications Coordinator 6 Customer Relations Supervisor 1 Dispatching Manager (PM) 1 Director, Dispatching Operations 1 Dispatching Manager 1 Supervisor, Dispatching Operations 6 Train Dispatcher 21 Dispatching Services Total Field Operations Management Field Operations Administrator (Trainee) 3 Director, Compliance 1 Field Operations Administrator 1 Operations Compliance Officer 5 Field Operations Management Total Equipment Assistant Director, Maintenance of Equipment 1 Business Administrator 1 Business Analyst 1 Department Assistant 1 Director, Maintenance of Equipment 1 Program Manager (Fleet) 1 Mechanical Compliance Officer 2 Project Engineer II 1 Program Manager 1 Equipment Total 10 June 23,
116 Exhibit 8.3 FY Roster of Positions (continued) Business Unit Cost Center Cost Center/Division Position Total Operations 2310 Facilities + Fleet Maintenance Customer Experience Administrator 1 Department Assistant 1 Facilities + Fleet Maintenance Manager 1 Fleet Maintenance Coordinator 1 Lead, Maintenance Technician 1 Maintenance Technician 4 Facilities + Fleet Maintenance Total Engineering & Construction Director, Engineering & Construction 1 Executive Assistant (Office Engineer) 1 Engineering & Construction Total Track Assistant Director, T+S Rehabilitation 1 Business Administrator 1 District T + S Maintenance Supervisor 1 ROW Maintenance Coordinator 1 Track Maintenance Engineer 1 Track Total Standards + Design Principal Engineer (Design & Engineering) 1 Civil Design CADD Operator 1 Project Engineer I 1 ROW Crossings Coordinator 1 Standards + Design Total C+S Train Control Maintenance Assistant Director, Signal Systems 1 Business Administrator 1 Planning Manager 1 Project Engineer I 1 District C + S Supervisor 1 C+S Train Control Maintenance Total PTC Systems Management Department Assistant 1 Director, Network Control Systems 1 Director, Signals and Communications 1 Deputy Chief Operating Officer (PTC&Engineering) 1 PTC Systems Management Total PTC Communications Systems Communication Systems Manager 1 District Supervisor, Communications Network 2 Manager, On Board PTC Systems 1 PTC Equipment Engineer I 3 PTC Equipment Engineer II 1 PTC Communications Systems Total 8 June 23,
117 Exhibit 8.3 FY Roster of Positions (continued) Business Unit Cost Center Cost Center/Division Position Total Operations 2877 PTC Technical Support Services Assistant Director, PTC Technical Services 1 Business Analyst 1 Project Engineer, Communication Systems 1 Project Engineer, Signal Systems 1 PTC Configuration Engineer 1 PTC Records Engineer 1 PTC Technical Services Manager 1 PTC Technical Support Services Total PTC Network Control Operations Business Intelligence Architect 1 Senior Network Engineer 1 Senior Systems Engineer 2 PTC Network Control Operations Total Public Projects Principal Engineer (Project Management) 1 Project Engineer I (Railroad Civil Engineer II) 1 Civil Engineer 1 Project Engineer I 1 Senior Civil Engineer 1 Public Projects Total Capital Construction + Rehabilitation Principal Engineer (Structures & Stations) 1 Project Engineer I 1 Capital Construction + Rehabilitation Total Fare Collection Services Manager, Special Projects (Fare Collections) 1 Fare Collections Services Specialist 1 Principal Planner 1 Fare Collections Services Specialist 1 Fare Collection Services Total Materials Management + Warehousing Business Analyst 1 Director, Special Projects 1 Inventory Control Analyst 1 Manager, Special Projects 1 Material Handler/Operator 8 Materials Management + Warehousing Total Program Management Assistant Director, Program Management 1 Department Assistant 1 Program Management Analyst II 2 Program Management Analyst I 1 Program Management Total 5 TOTAL 273 June 23,
118 SOUTHERN CALIFORNIA REGIONAL RAIL AUTHORITY FY BUDGET SECTION 9: Budget Forecasts FY and FY Background At the request of the SCRRA Board, and in conjunction with the ongoing development of the strategic plan, SCRAA has created a two year forward budget forecast for the fiscal years 2019 and It is to be noted that the forecast years are provided for informational purposes only. No approval is requested for the two forecasted years. 9.2 Basis for Forecast Estimates of expenses were constructed by individual Cost Centers when submitting their FY Budget amounts. These estimates included contractual amounts where available, estimates on known activities planned for the future, and minor escalations for inflation. No headcount increase was included. A 2% Cost of Living Adjustment (COLA) and Merit pool of 3% was included in each year. No New service was included for FY and FY The Authority is currently in the process of negotiating new office space. Because a final agreement has not been reached with respect to this possible future event, the existing lease is reflected in FY , FY or FY Exhibits Exhibit 9.1: FY and FY Forecast New Service Requests No new service was included for FY and FY Exhibit 9.2: FY Forecast of Operating Budget by Cost Component by Member Agency Exhibit 9.3: FY Forecast of Operating Budget by Cost Component by Member Agency June 23,
119
120
121 This page intentionally left blank June 23,
122 SOUTHERN CALIFORNIA REGIONAL RAIL AUTHORITY FY BUDGET SECTION 10: Appendix 10.1 Introduction In this section, supplementary descriptions and information are provided on SCRRA allocations methodology, policy on debt, GASB-34 Condition Assessment Ratings, Authority information and statistics, glossary of budget terms, and key acronyms associated with Southern California Regional Rail Authority Revenue and Cost Allocation Methodology Detail Formulae for Allocation to Members Under the terms of the JPA governing the actions of the SCRRA, each Member Agency shall approve its individual Operating and Capital subsidies for an upcoming fiscal year. Because of its JPA structure, SCRRA utilizes a number of formulae for the purposes of allocating costs to both Member Agencies and Operating Line Segments. The goal is to allocate or assign the costs based on the root causes of the common costs instead of merely spreading the costs. Subsidies for each Member Agency are determined by each budgeting cycle based on a series of previously agreed allocations for each budget component line item. This includes both revenues and expenses. Exhibit 10.1 provides detailed information on allocation percentages Formulae for Allocation to Lines In addition to calculating allocations by Member Agency, the FY Budget is also allocated across operating rail lines to provide the costs associated with providing system-wide services across the counties served. The lines are defined as San Bernardino, Ventura County, Antelope Valley, Riverside, Orange County, Orange County MSEP, Inland Empire/Orange County and the 91/Perris Valley Line. Exhibit 10.2 provides detailed information on allocation percentages by line. This allocation is used to provide Operating Expenses, revenues, subsidies and statistics by line. June 23,
123 Allocation of Revenues Farebox revenues are received by each operating line based on point of sale origin/destination pairs, and allocated to Member Agencies (counties) on the basis of county train-miles for each line. Dispatching/Other revenues are allocated directly to those line segments that are subject to agreements with freight railroads and Amtrak. These revenues are allocated to the counties that own the particular segments and to the lines that are made up of these segments. At the end of each fiscal year, the interest on fares and other funds received in advance for operations and capital projects is assigned to counties based upon a calculation of funds on account throughout the year which were provided by each Member Agency Allocation of Expenses Operating Expenses are allocated using a variety of railroad metrics. Most expenses in the Operating Budget are allocated on a combination of allocation and tier applications. Some exceptions are described as follows: fuel and Amtrak services related to the operation of trains are allocated to operating lines and counties based on train miles for each line or county; dispatching is allocated directly to operating lines and counties based on the ownership of line segments over which the Authority has dispatching authority. Additionally, transfers to other Operators, Rail Agreements, and MOW expenses are allocated directly to line segments. MOW (expenditure and revenue) net subsidies on lines shared by more than one operating line segment are split to the counties by the respective share of train miles in each county of the respective lines segments. There are specific expenditures related to particular lines. For example, the expenditures related to the Riverside Layover Facility are allocated to lines with services originating or terminating at the layover and subsequently to counties based train miles on the participating line segments. In contrast, the River Corridor is shared by all lines, thus the expenditures in excess of revenues on this segment are split to lines and counties on the basis of the All-Share formula. Extraordinary Maintenance expenses for derailments are split on the All-Share formula, and for storm damage, gate knockdowns and vandalism using the formula representing route miles owned by county SCRRA Policy on Debt The purpose of issuing debt is to finance essential capital facilities and equipment. The issuance of debt spreads the cost of the facilities and equipment over their useful life. Historically, SCRRA has not issued debt for the development of facilities or the purchase of equipment. Rather, the capital has been funded by a combination of federal, state, Member Agency, and other local sources. In the absence of the need to issue debt, SCRRA has not adopted a formal debt policy. June 23,
124 State law defines the process under which a Joint Powers Authority (JPA) may issue debt. The Marks-Roos Local Bond Pooling Act (Government Code, Sec. 6584) provided flexibility to a JPA by permitting the identification of future revenues for the maintenance of debt. Under this statute, a JPA is given powers to issue bonds to pay for the cost of capital, including facilities and equipment. The statute requires the establishment of a new joint powers authority for the exclusive purpose of financing capital projects or acquisitions for its members. If future capital funding requirements ever require the issuance of debt, the Member Agencies and SCRRA Board may be asked to review and adopt a debt policy incorporating the establishment of a new joint powers authority as permitted in the Marks-Roos Local Bond Pooling Act SCRRA Leveraged Lease Transactions Although SCRRA has never issued debt for the construction of facilities or acquisition of equipment, three U.S. leveraged lease transactions were completed. Only one of these leases remain Remaining Lease Agreement In FY , SCRRA s Board entered into an agreement to lease 94 coach and cab cars and 31 locomotives and simultaneously entered into a sublease agreement with the lessee to lease them back. SCRRA received proceeds of approximately $193.9 million of which it used approximately $152.3 million to prepay future lease payments and defease part of its obligation. This prepayment amount was sufficient to cover the loan amount taken by the lessee through the years 2012 and 2014 for the locomotives and the cars, respectively. In addition, the Board invested approximately $21.2 million in U.S. Zero Coupon Treasury strips. The Treasury strips will mature at values sufficient to cover all remaining lease payments due under the lease agreement as well as amounts necessary to exercise the repurchase options. As a result, all obligations under this lease/leaseback transaction are considered to be defeased in substance. Additionally, in July 2003, SCRRA entered into a restructured agreement related to the 1996 transaction. The restructuring included 92 coach and cab cars related to the original 1996 transaction; two of the cars in the original transaction were damaged beyond repair in previous years. As a result of this 1996-A restructuring, SCRRA received proceeds of approximately $2.9 million. The total net gain recognized by SCRRA from this leaseback agreement of $19.1 million was fully amortized in FY Description of GASB-34 Condition Assessment Ratings SCRRA, as part of its implementation of Government Accounting Standards Board Statement 34 (GASB-34), has elected to use the Modified Approach for the Metrolink Railroad Infrastructure. Under the modified approach, infrastructure June 23,
125 assets that are part of a network, or subsystem of a network, are not required to be depreciated as long as two requirements are met: 1) The government manages the eligible infrastructure assets using a qualified asset management system; and 2) The government documents that the eligible infrastructure assets are being preserved approximately at (or above) a condition level established and disclosed by the government. In FY , to comply with the requirements of GASB-34, the SCRRA Board adopted a condition rating of 75 points (of a maximum of 100) as the minimum acceptable Railroad Condition Index (RCI) for the entire railroad network, including all subsystems. The actual index value of the condition of SCRRA s infrastructure network at the time of adoption is 86. The following ratings values are utilized to describe the asset condition of various railroad infrastructure components: Excellent (90+) An asset that exhibits no conditions of wear or degradation and is suitable for continued use for 5 plus years with only routine inspection and repair; essentially a like new condition. Good (80 to 89) An asset rated as good has some components that will require repair or replacement within the next 5 years, but is expected to be fully serviceable for the next 5 years. Fair (70 to 79) An asset rated as fair will be in serviceable condition at the time of the rating, but will require rehabilitation of two or more components within 5 years. Poor (60 to 69) An asset that is operating at less than full capacity (e.g. a speed restriction is imposed) due to maintenance conditions and will require rehabilitation of at least one component before becoming fully operational. Critical (59 or below) An asset that is operating at less than full capacity and must have repairs or rehabilitation within the year in order to continue operating. The system-wide condition assessment conducted as of the year ended June 30, 2015 and June 30, 2014, resulted in an overall rating of 81 points SCRRA Information Date of Formation SCRRA was formed through a Joint Powers Agreement in August June 23,
126 Form of Government SCRRA operates as a Joint Exercise of Powers Authority Purpose The purpose of SCRRA is to plan, design, create and administer the operation of regional passenger rail lines Member Agencies There are five Member Agencies associated with SCRRA: Los Angeles County Metropolitan Transportation Authority (Metro), Orange County Transportation Authority (OCTA), Riverside County Transportation Commission (RCTC), San Bernardino County Transportation Authority (SBCTA), and Ventura County Transportation Commission (VCTC) Counties Served SCRRA serves Los Angeles County, Northern San Diego County, Orange County, Riverside County, San Bernardino County and Ventura County SCRRA Statistical Information Population by County Los Angeles County 10.2 million Orange County 3.2 million Riverside County 2.4 million San Bernardino County 2.2 million San Diego County 3.3 million Ventura County 0.9 million Total Population: 22.2 million California Population 39.5 million June 23, % of State Population located within SCRRA Service Area 56% Route Miles in System Los Angeles County 220 (Duplicated) Orange County 117 Riverside County 79 San Bernardino County 41 Northern San Diego 38 County Ventura County 41 Total Miles: 536
127 Route Miles Los Angeles County 184 (Unduplicated) Orange County 67 Riverside County 58 San Bernardino County 40 Northern San Diego 19 County Ventura County 41 Total Miles: 409 Available Equipment Locomotives 54 Cab Cars 56 Coaches 160 Stations Los Angeles County 26 Orange County 11 Riverside County 9 San Bernardino 8 Northern San Diego 1 County Ventura County 5 Total Stations: 60 Ticket Vending Machines Installed TVMs 123 Test TVMs Validators Installed Ticket Office Machines 4 Number of Annual Auto Trips Removed 8,724,464 Percent of Passenger Miles Removed on Regional Freeways up to 0.7% Percent of Freeway Traffic Removed on I-10 and SR 60 corridor (peak hours) up to 30% Average Metrolink weekday Trip Length 34.8 miles Percent of Metrolink Riders Formerly Driving Alone 81.5% June 23,
128 Percent of Riders with Los Angeles Union Station Destination 61.3% Percent of Minority Riders by Line Corridor San Bernardino Line 75% Riverside Line 81% Antelope Valley Line 70% Ventura County Line 49% Orange County Line 54% Inland Empire-OC Line 56% 91 Line 66% June 23,
129 This page intentionally left blank June 23,
130 10.8 Glossary of Budget Terms Approved Budget: The official budget as approved by the five Member Agencies and the SCRRA Board of Directors. Adopted Budget: The approved budget as Adopted by the SCRRA Board of Directors during a fiscal year. Appropriation: Legal authorization to make expenditures and to incur obligations for specific purposes. An appropriation is usually limited in amount and to the time it may be expended. Budget: A plan of financial operations comprised of estimated expenditures for a given period (one fiscal year) and the proposed means of revenue generation to finance the expenditures. Contracted Services: Services rendered in support of SCRRA operations and other activities by external parties. These are generally based upon formal contracts or purchase orders. Cost Center: The accounting designated summary of all expenditures related to an individual SCRRA department. Department: An organizational subgroup of SCRRA. Expenditures/Expenses: Decreases in net financial resources during a specific period. Extraordinary Maintenance: The expenditures related to repairing damages due to vandalism, crossing gate knockdowns, accidents, derailments, fires, storm and other severe weather conditions. Farebox Revenue: Fares received from passengers for travel on Metrolink trains. Farebox Recovery: Ratio of farebox revenue to total expenses net of non-bnsf rolling stock leases. Fiscal Year: A 12-month period to which the annual budget applies and at the end of which SCRRA determines its financial position, the results of its operations and capital program, and adopts a budget for the coming fiscal year. SCRRA s fiscal year is from July 1 through June 30. Full Time Equivalent (FTE): The conversion of full-time and part-time employee hours to the equivalent of a full-time position. Member Agency: The designated and defined five county entities in the Joint Powers of Authority agreement: Los Angeles County Metropolitan Transportation June 23,
131 Authority (Metro), Orange County Transportation Authority (OCTA), Riverside County Transportation Commission (RCTC), San Bernardino County Transportation Authority (SBCTA), and Ventura County Transportation Commission (VCTC). Modes: Discrete business units of operation within an organization. SCRRA business modes are Train Operations, MOW, new capital, rehabilitation and recollectables. Operating Budget: A financial forecast that focuses on everyday operating activities and programs. For SCRRA, the Operating Budget includes Train Operations, Maintenance-of-Way and Insurance Expense. Positive Train Control (PTC): GPS-based safety technology capable of preventing train-to-train collisions, over speed derailments, unauthorized incursion into work zones and train movement through switches left in the wrong position. PTC monitors and, if necessary, controls train movement in the event of human error. PTC can also bring trains to a safe stop in the event of a natural disaster. Preliminary Budget: A budget in its preliminary preparation stage prior to adoption by the SCRRA Board of Directors. Rehabilitation Expenditure: Those expenditures that replace worn-out assets with like or improved assets and thus extend the useful life of these capital assets. Such costs are generally capitalized. Revenue: Monies that SCRRA receives as income in the form of farebox revenue, payments from other railroads, local funds for operating or capital, grants, interest, and advertising, among others. Revenue Recovery: The ratio of Operating Revenues to Operating Expenses net of Non-BNSF Rolling Stock Lease. Ridership: The number of one-way trips by passengers on Metrolink trains. Salary and Fringe Benefit Expenses: Compensation paid to or on behalf of SCRRA employees for salaries, wages, overtime, and benefits. June 23,
132 10.9 Key Acronyms Associated with Southern California Regional Rail Authority ADA Americans with Disabilities Act Amtrak National Railroad Passenger Corporation (Intercity Rail Service) APTA American Public Transportation Association AQMD Air Quality Management District ARRA American Recovery and Reinvestment Act BNSF Burlington Northern Santa Fe Railroad CAFR Comprehensive Annual Financial Report Caltrans California Department of Transportation CAM Capital Asset Management CEQA California Environmental Quality Act CMAQ Congestion Mitigation Air Quality CMF Central Maintenance Facility CTC California Transportation Commission DBE Disadvantaged Business Enterprises DOL Federal Department of Labor DOT Federal Department of Transportation EIR Environmental Impact Report EIS Environmental Impact Study EPA Federal Environmental Protection Agency ETC Employer Transportation Coordinator FCR Flexible Congestion Relief FHWA Federal Highway Administration FRA Federal Railroad Administration FTA Federal Transit Administration GHG Green House Gas ICAP Indirect Cost Allocation Plan IEOC Inland Empire to Orange County Line ISTEA Intermodal Surface Transportation Efficiency Act ITS Intelligent Transportation System JPA Joint Powers Authority MAP-21 Moving Ahead for Progress in the 21st Century Act (P.L ) Metro Los Angeles County Metropolitan Transportation Authority MOC Metrolink Operations Center MOW Maintenance-of-Way LNG Liquefied Natural Gas MOU Memorandum of Understanding MTA Los Angeles County Metropolitan Transportation Authority OCTA Orange County Transportation Authority PA/CMS Public Address/Changeable Message Sign PDIP Project Delivery Improvement Plan PERS Public Employees Retirement System PRESS Passenger Rail Equipment Safety Standards PTC Positive Train Control RCI Railroad Condition Index RCTC Riverside County Transportation Commission June 23,
133 ROW RTIP RTPA SBCTA SCAG SCAQMD SCRRA SHA SPRR STA STIP STP TAC TAM TCI TDA TEA-21 TIP TPA TSM TVM UP VCTC VMT Right-of-Way Regional Transportation Improvement Program Regional Transportation Planning Agency San Bernardino County Transit Authority Southern California Associated Governments South Coast Air Quality Management District Southern California Regional Rail Authority State Highway Account Southern Pacific Railroad State Transit Assistance State Transportation Improvement Plan Surface Transportation Program Technical Advisory Committee Transit Asset Management Transit Capital Improvement (funds/program) Transportation Development Act Transportation Equity Act for the 21 st Century Transportation Improvement program Third Party Agreement Transportation Systems Management Ticket Vending Machine Union Pacific Railroad Ventura County Transportation Commission Vehicle Miles Traveled June 23,
134 10.10 Exhibits Exhibit 10.1: FY Formulae Used to Allocate Expenses by Member Agency lists the allocation categories and the percentages allocated for each across Member Agencies. Exhibit 10.2: FY Formulae Used to Allocate Expenses by Line lists the allocation categories and the percentages allocated for each across the operating rail lines. June 23,
135 Exhibit 10.1 FY Formulae Used to Allocate Expenses by Member Agency Allocation Metro OCTA RCTC SBCTA VCTC Train Miles Lagged (FY16) 53.32% 24.29% 7.60% 11.47% 3.32% FY18 Budget Train Miles (Base Services) 54.35% 20.94% 9.50% 11.17% 4.04% FY18 Budget Train Miles (All Services) 52.03% 23.76% 9.78% 11.18% 3.25% Revenue Moves Thru LAUS 65.50% 12.93% 4.43% 13.39% 3.75% Unduplicated Stations (Incl Buena Park) 43.33% 20.00% 15.00% 13.33% 8.34% TVMs (Excl TOMs & Flower St) 41.67% 21.97% 16.67% 13.64% 6.05% Ridership Lagged (FY16) 51.56% 24.20% 8.00% 12.93% 3.31% Current Ridership w/o IEOC (Transfer Payments) 55.35% 21.08% 6.83% 12.64% 4.10% FY18 Fare Revenue 49.36% 26.37% 9.11% 12.34% 2.82% 75% Train Miles Lagged/25% Unduplicated Station 50.82% 23.22% 9.45% 11.94% 4.57% S.B. Line Trn Miles 59.82% 0.00% 0.00% 40.18% 0.00% SB Weekend 59.82% 0.00% 0.00% 40.18% 0.00% S.B. Incremental (100% SBCTA) % Ven Line Trn Miles 61.41% 0.00% 0.00% 0.00% 38.59% A.V. Line Trn Miles (combine wk and we) % 0.00% 0.00% 0.00% 0.00% Riv Line Trn Miles 60.54% 0.00% 23.13% 16.33% 0.00% O.C. Line Trn Miles (combine wk and we) 30.50% 69.50% 0.00% 0.00% 0.00% O.C. Line Trn Miles - Incremental (100% OCTA) % OC MSEP % IEOC Line Trn Miles 0.00% 63.02% 32.00% 4.98% 0.00% IEOC Weekday Incremental Trn Miles 0.00% 63.87% 35.78% 0.35% 0.00% IEOC Line: San Bernardino-Oceanside 69.23% 24.18% 6.59% IEOC Line: Riverside-Oceanside 77.00% 23.00% 91 Line Trn Miles 26.68% 25.04% 48.02% 0.26% 0.00% Route Miles Dispatched 58.45% 17.76% 7.82% 9.76% 6.21% All-Share (MoW) 47.50% 19.80% 11.10% 14.40% 7.20% All-Share (MoW) w/o IEOC/MSEP 47.50% 19.80% 11.10% 14.40% 7.20% Route Miles Owned (MoW Storm Damage) 58.66% 12.87% 9.69% 10.78% 8.00% Undup Route Miles (Excl S.D.) 47.14% 17.24% 14.96% 10.22% 10.44% MTA Train Miles % OCTA Train Miles % RCTC Train Miles % SBCTA Train Miles % VCTC Train Miles % June 23,
136 Exhibit 10.2 FY Formulae Used to Allocate Expenses by Line Allocation San Bernardino Ventura Antelope Valley Riverside Orange County OC MSEP IEOC 91/PVL Train Miles Lagged (FY16) 24.12% 9.15% 22.10% 7.06% 15.97% 3.40% 12.32% 5.88% FY18 Budget Train Miles (Base Services) 22.72% 10.46% 22.24% 8.58% 16.18% 0.00% 12.46% 7.36% FY18 Budget Train Miles (All Services) 23.48% 8.94% 21.63% 6.90% 15.59% 3.32% 12.03% 8.11% Revenue Moves Thru LAUS 31.19% 12.87% 22.39% 8.90% 16.65% 0.00% 0.00% 8.00% Unduplicated Stations (Incl Buena Park) 20.28% 16.94% 15.28% 9.16% 10.28% 4.17% 11.67% 12.22% TVMs (Excl TOMs & Flower St) 20.20% 14.14% 14.90% 9.72% 10.48% 4.30% 13.51% 12.75% Ridership Lagged (FY16) 26.74% 8.54% 16.06% 9.96% 20.64% 10.88% 7.18% Current Ridership w/o IEOC (Transfer Payments) 27.40% 10.60% 16.40% 9.90% 27.19% 0.00% 0.00% 8.51% FY18 Fare Revenue 25.12% 7.32% 12.65% 10.31% 26.18% 0.00% 10.07% 8.35% 75% Train Miles Lagged/25% Unduplicated Station 23.16% 11.10% 20.40% 7.59% 14.55% 3.59% 12.16% 7.45% S.B. Line Trn Miles % 0.00% 0.00% 0.00% 0.00% 0.00% 0.00% SB Weekend % 0.00% 0.00% 0.00% 0.00% 0.00% 0.00% S.B. Incremental (100% SBCTA) % Ven Line Trn Miles 0.00% % 0.00% 0.00% 0.00% 0.00% 0.00% A.V. Line Trn Miles (combine wk and we) 0.00% 0.00% % 0.00% 0.00% 0.00% 0.00% Riv Line Trn Miles 0.00% 0.00% 0.00% % 0.00% 0.00% 0.00% O.C. Line Trn Miles (combine wk and we) 0.00% 0.00% 0.00% 0.00% % 0.00% 0.00% 0.00% O.C. Line Trn Miles - Incremental (100% OCTA) % OC MSEP % IEOC Line Trn Miles 0.00% 0.00% 0.00% 0.00% 0.00% % 0.00% IEOC Weekday Incremental Trn Miles 0.00% 0.00% 0.00% 0.00% 0.00% % 0.00% IEOC Line: San Bernardino-Oceanside % IEOC Line: Riverside-Oceanside % 91 Line Trn Miles 0.00% 0.00% 0.00% 0.00% 0.00% 0.00% 0.00% % Route Miles Dispatched 29.26% 15.20% 26.46% 2.08% 6.49% 5.67% 6.42% 8.42% All-Share (MoW) 21.94% 15.10% 15.90% 13.84% 16.85% 13.43% 2.94% All-Share (MoW) w/o IEOC/MSEP 25.34% 17.44% 18.37% 15.98% 19.47% 0.00% 0.00% 3.40% Route Miles Owned (MoW Storm Damage) 25.94% 18.97% 32.20% 0.66% 8.15% 4.84% 9.24% Undup Route Miles (Excl S.D.) 14.62% 16.59% 18.13% 15.03% 7.76% 2.75% 11.09% 14.03% MTA Train Miles 24.73% 11.82% 41.55% 9.41% 8.94% 3.55% OCTA Train Miles 53.87% 0.00% 37.49% 8.64% RCTC Train Miles 0.00% 21.50% 41.96% 36.54% SBCTA Train Miles 81.93% 12.35% 5.56% 0.16% VCTC Train Miles % June 23,
137 This page intentionally left blank June 23,

138
FISCAL YEAR ADOPTED BUDGET With FY17-18 Projection (Informational only) FY18-19 Projection (Informational only)
 FY18-19 Projection (Informational only)") SOUTHERN CALIFORNIA REGIONAL RAIL AUTHORITY FISCAL YEAR 2016-17 ADOPTED BUDGET With FY17-18 Projection (Informational only) FY18-19 Projection (Informational only) Adopted June 24, 2016 Los Angeles County
SOUTHERN CALIFORNIA REGIONAL RAIL AUTHORITY FISCAL YEAR 2016-17 ADOPTED BUDGET With FY17-18 Projection (Informational only) FY18-19 Projection (Informational only) Adopted June 24, 2016 Los Angeles County
SPECIAL BOARD OF DIRECTORS
 SPECIAL BOARD OF DIRECTORS J U N E 2 8, 2 0 1 3 SOUTHERN CALIFORNIA REGIONAL RAIL AUTHORITY BOARD ROSTER SOUTHERN CALIFORNIA REGIONAL RAIL AUTHORITY County Member Alternate San Bernardino: Patrick Morris
FY METROLINK BUDGET AND LACMTA'S COMMUTER RAIL PROGRAM
 9 One Gateway Plaza Los Angeles, CA 90012-2952 213.922.2ooo Tel metro. net FINANCE, BUDGET AND AUDIT COMMITTEE JUNE 19, 2013 SUBJECT: ACTION: FY 2013-14 METROLINK BUDGET AND LACMTA'S COMMUTER RAIL PROGRAM
BOARD ROSTER SOUTHERN CALIFORNIA REGIONAL RAIL AUTHORITY
 BOARD OF DIRECTORS MARCH 23, 2018 BOARD ROSTER SOUTHERN CALIFORNIA REGIONAL RAIL AUTHORITY County Member Alternate Riverside: Andrew Kotyuk (Chair) Brian Berkson* 2 votes Council Member Mayor Pro Tem City
B O A R D O F D I R E C T O R S O C T O B E R
 BOARD OF DIRECTORS O C T O B E R 2 3, 2 0 1 5 SOUTHERN CALIFORNIA REGIONAL RAIL AUTHORITY BOARD ROSTER SOUTHERN CALIFORNIA REGIONAL RAIL AUTHORITY County Member Alternate Orange: Shawn Nelson (Chair) Jeffrey
B O A R D O F D I R E C T O R S A P R I L
 BOARD OF DIRECTORS A P R I L 1 0, 2 0 1 5 SOUTHERN CALIFORNIA REGIONAL RAIL AUTHORITY BOARD ROSTER SOUTHERN CALIFORNIA REGIONAL RAIL AUTHORITY County Member Alternate Orange: Shawn Nelson (Chair) Jeffrey
BOARD ROSTER SOUTHERN CALIFORNIA REGIONAL RAIL AUTHORITY
 BOARD OF DIRECTORS JANUARY 12, 2018 BOARD ROSTER SOUTHERN CALIFORNIA REGIONAL RAIL AUTHORITY County Member Alternate Riverside: Andrew Kotyuk (Chair) Brian Berkson* 2 votes Council Member Mayor Pro Tem
PLANNING AND FINANCE COMMITTEE
 PLANNING AND FINANCE COMMITTEE O C T O B E R 2 5, 2 0 1 3 ROSTER PLANNING & FINANCE COMMITTEE COUNTY MEMBER RCTC: Daryl Busch (Chair) 1 Vote Mayor City of Perris Adam Rush Mayor Pro Tem City of Eastvale
B O A R D O F D I R E C T O R S F E B R U A R Y
 BOARD OF DIRECTORS F E B R U A R Y 2 6, 2 0 1 6 SOUTHERN CALIFORNIA REGIONAL RAIL AUTHORITY BOARD ROSTER SOUTHERN CALIFORNIA REGIONAL RAIL AUTHORITY County Member Alternate Orange: Shawn Nelson (Chair)
P L A N N I N G & D E V E L O P M E N T C O M M I T T E E S E P T E M B E R
 BOARD OF DIRECTORS J U N E 1 0, 2 0 1 1 SOUTHERN CALIFORNIA REGIONAL RAIL AUTHORITY BOARD ROSTER SOUTHERN CALIFORNIA REGIONAL RAIL AUTHORITY County Member Alternate Los Angeles: Richard Katz (Chair) Jaime
METROLINK: A GOOD INVESTMENT
 METROLINK: A GOOD INVESTMENT BOARD OF DIRECTORS WORKSHOP JULY 27, 2018 AGENDA Welcome I. Panel discussion II. III. Strong foundation for investment Improving on the investment Short-term initiatives IV.
COMMUTER RAIL DIVISION OF THE REGIONAL TRANSPORTATION AUTHORITY AND THE NORTHEAST ILLINOIS REGIONAL COMMUTER RAILROAD CORPORATION
 Financial Statements and Supplementary Information (With Independent Auditors Report Thereon) Table of Contents Page(s) Independent Auditors Report 1 2 Management s Discussion and Analysis (Unaudited)
FY METROLINK BUDGET AND LACMTA'S COMMUTER RAIL PROGRAM
 9 One Gateway Plaza Los Angeles, CA 90012-2952 213.922.2ooo Tel metro. net FINANCE, BUDGET AND AUDIT COMMITTEE JUNE 19, 2013 SUBJECT: ACTION: FY 2013-14 METROLINK BUDGET AND LACMTA'S COMMUTER RAIL PROGRAM
PLANNING AND FINANCE COMMITTEE MEETING
 PLANNING AND FINANCE COMMITTEE MEETING A P R I L 2 2, 2 0 1 1 SOUTHERN CALIFORNIA REGIONAL RAIL AUTHORITY ROSTER PLANNING & FINANCE COMMITTEE COUNTY MEMBER Riverside: Daryl Busch (Chair) 1 Vote Mayor City
COMMUTER RAIL DIVISION OF THE REGIONAL TRANSPORTATION AUTHORITY AND THE NORTHEAST ILLINOIS REGIONAL COMMUTER RAILROAD CORPORATION
 Financial Statements and Supplementary Information (With Independent Auditors Report Thereon) Table of Contents Page(s) Independent Auditors Report 1 2 Management s Discussion and Analysis (Unaudited)
Caltrain Service Preparing for FY2012 Caltrain Benefits Environment, Economy, Quality of Life
 Caltrain Service Preparing for FY2012 Caltrain Benefits Environment, Economy, Quality of Life If traveling via automobile, Caltrain riders would increase regional CO2 emissions by 89,850 metric tons or
SAFETY AND OPERATIONS COMMITTEE MEETING
 SAFETY AND OPERATIONS COMMITTEE MEETING M a r c h 2 2, 2 0 1 3 SOUTHERN CALIFORNIA REGIONAL RAIL AUTHORITY ROSTER SAFETY AND OPERATIONS COMMITTEE COUNTY San Bernardino: 1 vote MEMBER Paul Eaton (Chair)
PLANNING AND FINANCE COMMITTEE
 PLANNING AND FINANCE COMMITTEE J A N U A R Y 2 4, 2 0 1 4 SOUTHERN CALIFORNIA REGIONAL RAIL AUTHORITY ROSTER PLANNING & FINANCE COMMITTEE COUNTY MEMBER RCTC: Daryl Busch (Chair) 1 Vote Mayor City of Perris
SOUTHERN CALIFORNIA REGIONAL RAIL AUTHORITY A Joint Exercise of Powers Agreement Among:
 SOUTHERN CALIFORNIA REGIONAL RAIL AUTHORITY A Joint Exercise of Powers Agreement Among: Los Angeles County Metropolitan Transportation Authority Orange County Transportation Authority Riverside County
AGREEMENT FOR MOVING OVERSIZED LOADS OVER HIGHWAY-RAIL GRADE CROSSINGS SCRRA FORM NO. 4
 AGREEMENT FOR MOVING OVERSIZED LOADS OVER HIGHWAY-RAIL GRADE CROSSINGS SCRRA FORM NO. 4 SCRRA File No. SCRRA Project/Task No. Subdivision Mile Post The Contractor, hereby requests permission to cross the
COOPERATIVE AGREEMENT FY 2004/05 VENTURA INTERCITY SERVICE TRANSIT AUTHORITY (VISTA) CONEJO CONNECTION
 CONEJO CONNECTION") COOPERATIVE AGREEMENT FY 2004/05 VENTURA INTERCITY SERVICE TRANSIT AUTHORITY (VISTA) CONEJO CONNECTION This Agreement is made and entered into by the City of Calabasas (Calabasas) and the Ventura County
COOPERATIVE AGREEMENT FY 2004/05 VENTURA INTERCITY SERVICE TRANSIT AUTHORITY (VISTA) CONEJO CONNECTION This Agreement is made and entered into by the City of Calabasas (Calabasas) and the Ventura County
San Bernardino County Transportation Authority Short-Range Transit Plan, FY 2016 FY 2020
 San Bernardino County Transportation Authority Short-Range Transit Plan, FY 2016 FY 2020 Volume 2: Service Plans, Capital Plans, and Financial Plans Chapters 5 10 December 19, 2016 THIS PAGE INTENTIONALLY
AGENDA CITIZEN S TRANSPORTATION ADVISORY COMMITTEE/ SOCIAL SERVICES TRANSPORTATION ADVISORY COUNCIL (CTAC/SSTAC)
") AGENDA CITIZEN S TRANSPORTATION ADVISORY COMMITTEE/ SOCIAL SERVICES TRANSPORTATION ADVISORY COUNCIL (CTAC/SSTAC) TUESDAY, OCTOBER 16, 2018 -- 1:30 PM 3:30 PM County Government Center Hall of Administration
AGENDA CITIZEN S TRANSPORTATION ADVISORY COMMITTEE/ SOCIAL SERVICES TRANSPORTATION ADVISORY COUNCIL (CTAC/SSTAC) TUESDAY, OCTOBER 16, 2018 -- 1:30 PM 3:30 PM County Government Center Hall of Administration
Caltrain Funding 101
 Caltrain Funding 101 Prepared for: SFMTA Board Meeting Prepared by: Caltrain Staff Date: February 7, 2012 Caltrain Funding 101 Overview Funding contribution is guided by Joint Powers Agreement Funding
BOARD OF DIRECTORS MEETING
 Revised 12/10/14 See Item No. 11 SOUTHERN CALIFORNIA REGIONAL RAIL AUTHORITY BOARD OF DIRECTORS MEETING FRIDAY, DECEMBER 12, 2014 10:00a.m. LOS ANGELES COUNTY METROPOLITAN TRANSPORTATION AUTHORITY (METRO)
SAN BERNARDINO ASSOCIATED GOVERNMENTS BASIC FINANCIAL STATEMENTS FOR THE YEAR ENDED JUNE 30, 2011
 SAN BERNARDINO ASSOCIATED GOVERNMENTS BASIC FINANCIAL STATEMENTS FOR THE YEAR ENDED JUNE 30, 2011 BASIC FINANCIAL STATEMENTS JUNE 30, 2011 TABLE OF CONTENTS SECTION I: INTRODUCTORY SECTION Letter of Transmittal
CHAPTER 9 FINANCIAL CONSIDERATIONS
 CHAPTER 9 FINANCIAL CONSIDERATIONS 9.1 INTRODUCTION This chapter presents anticipated costs, revenues, and funding for the Berryessa Extension Project (BEP) Alternative and the Silicon Valley Rapid Transit
ORANGE COUNTY TRANSPORTATION AUTHORITY. Fiscal Year Comprehensive Business Plan. Attachment A
 ORANGE COUNTY TRANSPORTATION AUTHORITY Fiscal Year 2010-11 Comprehensive Business Plan Attachment A Comprehensive Business Plan Proposed FISCAL YEAR 2010-2011 Orange County Transportation Authority INTRODUCTION
CHAPTER 9 FINANCIAL CONSIDERATIONS
 CHAPTER 9 FINANCIAL CONSIDERATIONS 9.1 INTRODUCTION This chapter presents anticipated costs, revenues, and funding for the BEP and the SVRTP. A summary evaluation of VTA s financial plan for the proposed
Financial Analysis Working Paper 1 Existing Funding Sources Draft: April 2007
 Financial Analysis Working Paper 1 Existing Funding Sources Draft: April 2007 Prepared for: By: TABLE OF CONTENTS INTRODUCTION... 1 REVIEW OF FRED AND VRE EXISTING FUNDING SOURCES... 1 Federal Funding...
PLANNING AND FINANCE COMMITTEE
 PLANNING AND FINANCE COMMITTEE A P R I L 2 5, 2 0 1 4 SOUTHERN CALIFORNIA REGIONAL RAIL AUTHORITY ROSTER PLANNING & FINANCE COMMITTEE COUNTY MEMBER RCTC: Daryl Busch (Chair) 1 Vote or City of Perris Adam
May 31, 2016 Financial Report
 2016 May 31, 2016 Financial Report Capital Metropolitan Transportation Authority 7/13/2016 Table of Contents SUMMARY REPORTS Budgetary Performance - Revenue 2 - Sales Tax Revenue 6 - Operating Expenses
SOUTHEASTERN PENNSYLVANIA TRANSPORTATION AUTHORITY. Financial Statements June 30, 2018 and (With Independent Auditors Report Thereon)
") SOUTHEASTERN PENNSYLVANIA TRANSPORTATION AUTHORITY Financial Statements June 30, 2018 and 2017 (With Independent Auditors Report Thereon) SOUTHEASTERN PENNSYLVANIA TRANSPORTATION AUTHORITY YEARS ENDED
SOUTHEASTERN PENNSYLVANIA TRANSPORTATION AUTHORITY Financial Statements June 30, 2018 and 2017 (With Independent Auditors Report Thereon) SOUTHEASTERN PENNSYLVANIA TRANSPORTATION AUTHORITY YEARS ENDED
Washington Metropolitan Area Transit Authority Metro Budget Overview
 Washington Metropolitan Area Transit Authority Metro Budget Overview February 2011 Metro 10,877 Employees (10,974 budgeted) 1,491 Buses 588 Escalators and 237 Elevators 106 Miles of Track 92 Traction Power
A N T E L O P E V A L L E Y T R A N S I T A U T H O R I T Y C O M P R E H E N S I V E A N N U A L F I N A N C I A L R E P O R T
 A N T E L O P E V A L L E Y T R A N S I T A U T H O R I T Y L A N C A S T E R, C A L I F O R N I A C O M P R E H E N S I V E A N N U A L F I N A N C I A L R E P O R T F O R T H E Y E A R E N D E D J U
Chapter 9 Financial Considerations. 9.1 Introduction
 9.1 Introduction Chapter 9 This chapter presents anticipated costs, revenues, and funding for the NEPA BART Extension Alternative. A summary of VTA s financial plan for the BART Extension Alternative is
Metro. Los Angeles County Metropolitan Transportation Authority One Gateway Plaza 3rd Floor Board Room. Los Angeles, CA. RECAP of Proceedings
 Metro Los Angeles County Metropolitan Transportation Authority One Gateway Plaza 3rd Floor Board Room Los Angeles, CA RECAP of Proceedings Thursday, January 25, 2018 9:00 AM One Gateway Plaza, Los Angeles,
Measure I Strategic Plan, April 1, 2009 Glossary Administrative Committee Advance Expenditure Agreement (AEA) Advance Expenditure Process
 Advance Expenditure Process") Glossary Administrative Committee This committee makes recommendations to the Board of Directors and provides general policy oversight that spans the multiple program responsibilities of the organization
Glossary Administrative Committee This committee makes recommendations to the Board of Directors and provides general policy oversight that spans the multiple program responsibilities of the organization
Total Operating Activities for FY17 are $56.9 million, an increase of $5.1M or 9.8% from FY16.
 FY17 ADOPTED ANNUAL OPERATING AND CAPITAL BUDGET Valley Metro Rail, Inc. (VMR) is a public non-profit corporation whose members are the cities of Chandler, Glendale, Mesa, Phoenix, and Tempe. VMR plans,
AGENDA* *Actions may be taken on any item listed on the agenda CAMARILLO CITY HALL 601 CARMEN DRIVE CAMARILLO, CA FRIDAY, JANUARY 11, :00 AM
 VENTURA COUNTY TRANSPORTATION COMMISSION AIRPORT LAND USE COMMISSION SERVICE AUTHORITY FOR FREEWAY EMERGENCIES CONSOLIDATED TRANSPORTATION SERVICE AGENCY CONGESTION MANAGEMENT AGENCY www.goventura.org
Fair Share: Allocation of Transit O&M Costs Between Multiple Partners
 Fair Share: Allocation of Transit O&M Costs Between Multiple Partners Nathan M. Macek, AICP Parsons Brinckerhoff Washington, D.C. Amanda Wall Vandegrift, EIT Parsons Brinckerhoff Washington, D.C. INTRODUCTION
MEMORANDUM. Santa Clara Valley Transportation Authority Board of Directors. Michael T. Burns General Manager. DATE: August 4, 2008
 MEMORANDUM TO: FROM: Santa Clara Valley Transportation Authority Board of Directors Michael T. Burns General Manager DATE: August 4, 2008 SUBJECT: BART Operating Subsidy This memorandum summarizes and
POTOMAC AND RAPPAHANNOCK TRANSPORTATION COMMISSION
 POTOMAC AND RAPPAHANNOCK TRANSPORTATION COMMISSION FINANCIAL AND COMPLIANCE REPORTS YEAR ENDED JUNE 30, 2017 ASSURANCE, TAX & ADVISORY SERVICES TABLE OF CONTENTS FINANCIAL SECTION INDEPENDENT AUDITOR S
VALLEY METRO RAIL FY18 Budget EXECUTIVE SUMMARY
 VALLEY METRO RAIL FY18 Budget EXECUTIVE SUMMARY FY18 ADOPTED ANNUAL OPERATING AND CAPITAL BUDGET Valley Metro Rail, Inc. (VMR) is a public non-profit corporation whose members are the cities of Chandler,
TEX Rail Fort Worth, Texas Project Development (Rating Assigned November 2012)
") TEX Rail Fort Worth, Texas Project Development (Rating Assigned November 2012) Summary Description Proposed Project: Commuter Rail 37.6 Miles, 14 Stations (12 new, two existing) Total Capital Cost ($YOE):
TEX Rail Fort Worth, Texas Project Development (Rating Assigned November 2012) Summary Description Proposed Project: Commuter Rail 37.6 Miles, 14 Stations (12 new, two existing) Total Capital Cost ($YOE):
CHAPTER 7: Financial Plan
 CHAPTER 7: Financial Plan Report Prepared by: Contents 7 FINANCIAL PLAN... 7-1 7.1 Introduction... 7-1 7.2 Assumptions... 7-1 7.2.1 Operating Revenue Assumptions... 7-2 7.2.2 Operating Cost Assumptions...
METRO. Metro Funding. Associated Master Plan: Comprehensive Master Transportation Plan (MTP) for Arlington. Neighborhood(s):
 for Arlington. Neighborhood(s):") METRO METRO METRO 2017 2026 CIP Metro Funding Project Description The Washington Metropolitan Area Transit Authority (WMATA/Metro) is a unique federal-state-local partnership formed to provide mass transit
METRO METRO METRO 2017 2026 CIP Metro Funding Project Description The Washington Metropolitan Area Transit Authority (WMATA/Metro) is a unique federal-state-local partnership formed to provide mass transit
Proposed FY2012 Operating Budget
 Proposed FY2012 Operating Budget June 2, 2011 Overview Began budget discussions in January 2011 Reviewed FY2012 Preliminary Operating Budget at the May 5, 2011 JPB meeting Followed up Board member questions
In their own words. From the Orange County Transportation Authority:
 In their own words The Southern California News Group asked each special district with cash and investments exceeding $250 million to tell us more about why they need that cash (see detailed table of cash
April 30, 2016 Financial Report
 2016 April 30, 2016 Financial Report Capital Metropolitan Transportation Authority 6/15/2016 Table of Contents SUMMARY REPORT Budgetary Performance - Revenue 2 - Sales Tax Revenue 6 - Operating Expenses
PLANNING AND FINANCE COMMITTEE MEETING
 PLANNING AND FINANCE COMMITTEE MEETING M A R C H 2 3, 2 0 1 2 SOUTHERN CALIFORNIA REGIONAL RAIL AUTHORITY ROSTER PLANNING & FINANCE COMMITTEE COUNTY MEMBER Riverside: Daryl Busch (Chair) 1 Vote Mayor City
MTA Long Island Rail Road
 MTA Long Island Rail Road Budget July Financial Plan -2008 MISSION STATEMENT The mission of the MTA Long Island Rail Road is to provide a safe, accessible, clean, cost-effective, customer-focused rail
Fare Policy. Discussion Document November 23, 2015
 Fare Policy Discussion Document November 23, 2015 Key legislation regarding fare levels 2013 Session Law Chapter 46 SECTION 6A. Set goal of an increase in the farebox recovery ratio of at least 10 per
Chairman Skinner and the VRE Operations Board. Authorization to Issue a Request for Proposals for Federal Legislative Services
 Agenda Item 8-A Consent Item To: From: Chairman Skinner and the VRE Operations Board Doug Allen Date: February 19, 2016 Re: Authorization to Issue a Request for Proposals for Federal Legislative Services
VALLEY METRO RPTA FY18 Budget EXECUTIVE SUMMARY
 VALLEY METRO RPTA FY18 Budget EXECUTIVE SUMMARY FY18 ADOPTED ANNUAL OPERATING AND CAPITAL BUDGET Valley Metro Regional Public Transportation Authority (RPTA) provides public transportation services for
Strategic Performance measures
 Strategic Performance measures 2012 RepoRt background In 2007, the RTA worked with CTA, Pace, and Metra as well as other community stakeholders to develop a Regional Transportation Strategic Plan. This
SOUTHEASTERN PENNSYLVANIA TRANSPORTATION AUTHORITY. Financial Statements June 30, 2017 and (With Independent Auditors Report Thereon)
") SOUTHEASTERN PENNSYLVANIA TRANSPORTATION AUTHORITY Financial Statements June 30, 2017 and 2016 (With Independent Auditors Report Thereon) SOUTHEASTERN PENNSYLVANIA TRANSPORTATION AUTHORITY YEARS ENDED
SOUTHEASTERN PENNSYLVANIA TRANSPORTATION AUTHORITY Financial Statements June 30, 2017 and 2016 (With Independent Auditors Report Thereon) SOUTHEASTERN PENNSYLVANIA TRANSPORTATION AUTHORITY YEARS ENDED
Metro. Board Report. Fare revenue projections, based on preliminary assumptions for ridership
 Metro Board Report Los Angeles County Metropolitan Transportation Authority One Gateway Plaza 3rd Floor Board Room Los Angeles, CA SUBJECT: FY18 BUDGET DEVELOPMENT UPDATE ACTION: RECEIVE AND FILE RECOMMENDATION
CHICAGO TRANSIT AUTHORITY. FINANCIAL STATEMENTS AND SUPPLEMENTARY INFORMATION December 31, 2011 and 2010 (With Independent Auditors Report Thereon)
") FINANCIAL STATEMENTS AND SUPPLEMENTARY INFORMATION (With Independent Auditors Report Thereon) Chicago, Illinois FINANCIAL STATEMENTS CONTENTS Independent Auditors Report... 1 Management s Discussion and
FINANCIAL STATEMENTS AND SUPPLEMENTARY INFORMATION (With Independent Auditors Report Thereon) Chicago, Illinois FINANCIAL STATEMENTS CONTENTS Independent Auditors Report... 1 Management s Discussion and
Metropolitan Transportation Authority Proposed Capital Program
 Metropolitan Transportation Authority Proposed 2008-2013 Capital Program Thomas P. DiNapoli New York State Comptroller Kenneth B. Bleiwas Deputy Comptroller Report 11-2008 March 2008 The proposed capital
FY18 Final Results Budget Outlook, FY20-22
 FY18 Final Results Budget Outlook, FY20-22 Objectives Provide background necessary for consideration of fiscal pressures that exist prior to electrification Service levels Ridership Member agency funding
TSCC Budget Review TriMet
 TSCC Budget Review 2017-18 TriMet 1. Introduction to the District: The Tri-County Metropolitan Transportation District (TriMet) boundary covers about 575 square miles of the urban portions of Multnomah,
BOARD OF DIRECTORS WORKSHOP MEETING MINUTES
 BOARD OF DIRECTORS WORKSHOP MEETING April 25, 2008 MINUTES 1. CALLED TO ORDER The Workshop Meeting of the Santa Clara Valley Transportation Authority s (VTA) Board of Directors was called to order by Chairperson
Central Puget Sound Regional Transit Authority
 Central Puget Sound Regional Transit Authority Single Audit Reports for the Year Ended December 31, 2017 This page intentionally left blank. TABLE OF CONTENTS Audited Financial Statements Statement of
Central Puget Sound Regional Transit Authority
 Central Puget Sound Regional Transit Authority Single Audit Reports for the Year Ended December 31, 2014 TABLE OF CONTENTS Audited Financial Statements Management s Discussion and Analysis... 1 Independent
MOW Spending: Transit Rail Infrastructure Investments
 2018 MOW Spending: Transit Rail Infrastructure Investments Bigger budgets and bigger workloads emerge in the 17th annual Progressive Railroading MOW Spending Report. By Jeff Stagl, Managing Editor TABLE
PLANS AND PROGRAMS COMMITTEE WEDNESDAY, JANUARY 22, 2014, 2:00 P.M. OMNITRANS METRO FACILITY 1700 WEST 5TH STREET SAN BERNARDINO, CA 92411
 PLANS AND PROGRAMS COMMITTEE WEDNESDAY, JANUARY 22, 2014, 2:00 P.M. OMNITRANS METRO FACILITY 1700 WEST 5TH STREET SAN BERNARDINO, CA 92411 The meeting facility is accessible to persons with disabilities.
ORANGE COUNTY TRANSPORTATION AUTHORITY. Orange County Transportation Authority's Fiscal Year Budget Workshop. PowerPoint
 ORANGE COUNTY TRANSPORTATION AUTHORITY Orange County Transportation Authority's Fiscal Year 2013-14 Budget Workshop PowerPoint Budget Workshop Fiscal Year 2013-14 Board of Directors Meeting May 13, 2013
ITEM 5 Approve Resolution of the Board of Commissioners of the San Joaquin Regional Rail Commission Authorizing a Purchase of Four (4) New Tier IV AC
 New Tier IV AC") ITEM 5 Approve Resolution of the Board of Commissioners of the San Joaquin Regional Rail Commission Authorizing a Purchase of Four (4) New Tier IV AC Traction Passenger Locomotives with Siemens Industry,
ITEM 5 Approve Resolution of the Board of Commissioners of the San Joaquin Regional Rail Commission Authorizing a Purchase of Four (4) New Tier IV AC Traction Passenger Locomotives with Siemens Industry,
Financial Practices and Reporting Review Committee. Committee Meeting July 15, 2011
 Financial Practices and Reporting Review Committee Committee Meeting July 15, 2011 Finance Presentation Metra Financial Practices & Reporting Review Committee July 15, 2011 Presented by Jim Mickus Budget
CHAPTER 4 FINANCIAL STRATEGIES: PAYING OUR WAY
 The financial analysis of the recommended transportation improvements in the 2030 San Diego Regional Transportation Plan: Pathways for the Future (RTP or the Plan ) focuses on four components: Systems
Arlington County, Virginia
 Arlington County, Virginia METRO METRO 2015 2024 CIP Metro Funding Project Description The Washington Metropolitan Area Transit Authority (WMATA/Metro) is a unique federal-state-local partnership formed
Metra Board of Directors. Board Meeting September 16, 2011
 Metra Board of Directors Board Meeting September 16, 2011 Continued Discussion on FY2012 Budget Metra Board of Directors September 16, 2011 2012 Capital Program Metra Board of Directors September 16, 2011
10 Financial Analysis
 10 Financial Analysis This chapter summarizes the financial analysis for the No-Build Alternative and the proposed METRO Blue Line Light Rail Transit (BLRT) Extension project. This chapter also describes
METRO: RICHARD KATZ (VICE-CHAIR) 1 1 (4 votes) MICHAEL ANTONOVICH 1 1 ARA NAJARIAN 1 DON KNABE 1 1 JAIME DE LA VEGA 1 BEATRICE PROO BOB BARTLETT
 1 1 (4 votes) MICHAEL ANTONOVICH 1 1 ARA NAJARIAN 1 DON KNABE 1 1 JAIME DE LA VEGA 1 BEATRICE PROO BOB BARTLETT") SOUTHERN CALIFORNIA REGIONAL RAIL AUTHORITY M I N U T E S O F T H E S C R R A B O A R D O F D I R E C T O R S M E E T I N G A N D B U D G E T W O R K S H O P J A N U A R Y 2 2, 2 0 1 0 ITEM 5 BOARD MEMBERS/ALTERNATES
SOUTHERN CALIFORNIA REGIONAL RAIL AUTHORITY M I N U T E S O F T H E S C R R A B O A R D O F D I R E C T O R S M E E T I N G A N D B U D G E T W O R K S H O P J A N U A R Y 2 2, 2 0 1 0 ITEM 5 BOARD MEMBERS/ALTERNATES
RIVERSIDE COUNTY TRANSPORTATION COMMISSION
 RIVERSIDE COUNTY TRANSPORTATION COMMISSION DATE: May 9, 2012 TO: FROM: THROUGH: Riverside County Transportation Commission Budget and Implementation Committee Michele Cisneros, Accounting and Human Resources
20 Years of Commuter Benefits: Where We've Been and Where We're Going
 December 19, 2006 20 Years of Commuter Benefits: Where We've Been and Where We're Going By Larry Filler President and CEO, TransitCenter Inc This summer, as gas prices reached a national average of nearly
Whatcom Transportation Authority
 Whatcom Transportation Authority Annual Budget 12/14/2017 This Page Intentionally Left Blank Whatcom Transportation Authority (WTA) Annual Budget Table of Contents General Manager s Budget Message... 2
REPORT OF INDEPENDENT AUDITORS AND SINGLE AUDIT REPORTS SOUTHERN CALIFORNIA REGIONAL RAIL AUTHORITY
 REPORT OF INDEPENDENT AUDITORS AND SINGLE AUDIT REPORTS SOUTHERN CALIFORNIA REGIONAL RAIL AUTHORITY June 30, 2017 Table of Contents Report of Independent Auditors on the Financial Statements for the Year
The Future Scenarios
 The Future Scenarios Developing the Scenarios Once the policy approach for each scenario was defined, the financial, service, and capital assumptions were developed further and are detailed in three supporting
August 31, 2016 Financial Report
 August 31, 2016 Financial Report Capital Metropolitan Transportation Authority 10/14/2016 Table of Contents SUMMARY REPORTS Budgetary Performance - Revenue 2 - Sales Tax Revenue 6 - Operating Expenses
Review of 91 Toll Road Funding
 Review of 91 Toll Road Funding 1. Summary The Orange County Grand Jury became interested in studying the financial feasibility of the 91 Toll Road because of newspaper articles and public interest. Our
Central Puget Sound Regional Transit Authority
 Central Puget Sound Regional Transit Authority Single Audit Reports for the Year Ended December 31, 2013 TABLE OF CONTENTS Audited Financial Statements Management s Discussion and Analysis...1 Independent
Metropolitan Transportation Authority (A Component Unit of the State of New York) Independent Auditors Review Report
 Independent Auditors Review Report") Metropolitan Transportation Authority (A Component Unit of the State of New York) Independent Auditors Review Report Consolidated Interim Financial Statements as of and for the Three-Month Period Ended
Metropolitan Transportation Authority (A Component Unit of the State of New York) Independent Auditors Review Report Consolidated Interim Financial Statements as of and for the Three-Month Period Ended
Title VI Approval of Major Service Change, Disparate Impact and Disproportionate Burden
 Customer Service and Operations Committee Board Action Item III-A October 10, 2013 Title VI Approval of Major Service Change, Disparate Impact and Disproportionate Burden Page 3 of 42 Washington Metropolitan
BOARD OF DIRECTORS MEETING
 BOARD OF DIRECTORS MEETING A P R I L 2, 2 0 1 0 SOUTHERN CALIFORNIA REGIONAL RAIL AUTHORITY BOARD ROSTER SOUTHERN CALIFORNIA REGIONAL RAIL AUTHORITY County Member Alternate Ventura: Keith Millhouse (Chair)
CHICAGO TRANSIT AUTHORITY. FINANCIAL STATEMENTS AND SUPPLEMENTARY INFORMATION December 31, 2010 and 2009 (With Independent Auditors Report Thereon)
") FINANCIAL STATEMENTS AND SUPPLEMENTARY INFORMATION (With Independent Auditors Report Thereon) Chicago, Illinois FINANCIAL STATEMENTS CONTENTS Independent Auditors Report... 1 Management s Discussion and
FINANCIAL STATEMENTS AND SUPPLEMENTARY INFORMATION (With Independent Auditors Report Thereon) Chicago, Illinois FINANCIAL STATEMENTS CONTENTS Independent Auditors Report... 1 Management s Discussion and
Metropolitan Transportation Authority (A Component Unit of the State of New York)
") (A Component Unit of the State of New York) Independent Auditors Review Report as of and for the Six-Month Period Ended June 30, 2018 Table of Contents INDEPENDENT AUDITORS REVIEW REPORT 3 MANAGEMENT S
(A Component Unit of the State of New York) Independent Auditors Review Report as of and for the Six-Month Period Ended June 30, 2018 Table of Contents INDEPENDENT AUDITORS REVIEW REPORT 3 MANAGEMENT S
Performance Management Accountability Meeting Data as of October, 2012
 Performance Management Accountability Meeting Data as of October, 2012 Richard A. Davey, Secretary & CEO Office of Performance Management and Innovation Celia J. Blue, Assistant Secretary November 27,
CITY OF LOS ANGELES INTER-DEPARTMENTAL CORRESPONDENCE
 CITY OF LOS ANGELES INTER-DEPARTMENTAL CORRESPONDENCE DATE: TO: Honorable City Council c/o City Clerk, Room 395, City Hall Attention: Honorable Nury Martinez, Chair, Energy and the Environment Committee
Washington Metropolitan Area Transit Authority
 Washington Metropolitan Area Transit Authority Financial Report For the Fiscal Years Ended June 30, 2017 and 2016 Table of Contents Washington Metropolitan Area Transit Authority Financial Report For the
Public Transportation Department Anchorage: Performance. Value. Results.
 Anchorage: Performance. Value. Results. Mission Serve Anchorage residents and visitors by providing public transportation that emphasizes quality, safety, cost effectiveness, and economic vitality. Core
4TH QUARTER 2016 QUARTERLY FINANCIAL AND PERFORMANCE REPORT
 4TH QUARTER 2016 QUARTERLY FINANCIAL AND PERFORMANCE REPORT February 2017 0 Quarterly Financial and Performance Report 4th Quarter 2016 4th Quarter 2016 Financial and Performance Report Table of Contents
Transit Subsidy. Mission Statement. Mandates
 Mission Statement The Potomac and Rappahannock Transportation Commission (PRTC) is a multi-jurisdictional agency representing Prince William, Stafford, and Spotsylvania Counties and the Cities of Manassas,
Operating Budget. Third Quarter Financial Report (July 2005 March 2006)
") Third Quarter Financial Report (July 2005 March 2006) INDEX A. Executive Summary...page 2 B. Revenue and Expense Analysis...page 3 C. Budget Variance Reports...page 14 D. Ridership and Performance Measures...page
Third Quarter Financial Report (July 2005 March 2006) INDEX A. Executive Summary...page 2 B. Revenue and Expense Analysis...page 3 C. Budget Variance Reports...page 14 D. Ridership and Performance Measures...page
INVEST IN TRANSIT. The Regional Transit Strategic Plan for Chicago and Northeastern Illinois ANNUAL PROGRESS REPORT FEBRUARY 2019
 ANNUAL PROGRESS REPORT FEBRUARY 2019 INVEST IN TRANSIT The 2018-2023 Regional Transit Strategic Plan for Chicago and Northeastern Illinois Read the full plan at StrategicPlan.RTAChicago.org Chicago and
Northern Virginia Transportation Commission: 2018 Legislative and Policy Agenda
 Northern Virginia Transportation Commission: 2018 Legislative and Policy Agenda Northern Virginia s economic growth and global competitiveness are directly tied to the region s transit network. Transit
RESOLUTION ALLOCATING $5,820,000 IN PROP K FUNDS, WITH CONDITIONS, FOR
 BD091217 RESOLUTION NO. 18XX RESOLUTION ALLOCATING $5,820,000 IN PROP K FUNDS, WITH CONDITIONS, FOR THIRTEEN REQUESTS WHEREAS, The Transportation Authority received thirteen requests for a total of $5,820,000
SAN FRANCISCO MUNICIPAL TRANSPORTATION AGENCY
 THIS PRINT COVERS CALENDAR ITEM NO. : 11 DIVISION: Communications BRIEF DESCRIPTION: SAN FRANCISCO MUNICIPAL TRANSPORTATION AGENCY Presentation and discussion regarding the Fiscal Year (FY) 2013 SFMTA
MODERNIZING METRA & INVESTING IN OUR FUTURE CHAPTER 1: POSITIVE TRAIN CONTROL (PTC) & ROLLING STOCK
 & ROLLING STOCK") MODERNIZING METRA & INVESTING IN OUR FUTURE CHAPTER 1: POSITIVE TRAIN CONTROL (PTC) & ROLLING STOCK BACKGROUND Maintaining Metra s extensive system in a state of good repair is the agency s biggest challenge.
MODERNIZING METRA & INVESTING IN OUR FUTURE CHAPTER 1: POSITIVE TRAIN CONTROL (PTC) & ROLLING STOCK BACKGROUND Maintaining Metra s extensive system in a state of good repair is the agency s biggest challenge.