the State of the Nation s Housing
|
|
|
- Doris Holmes
- 5 years ago
- Views:
Transcription


1 the State of the Nation s Housing 2 4 J OINT C ENTER FOR H OUSING S TUDIES OF H ARVARD U NIVERSITY
2 J OINT C ENTER FOR H OUSING S TUDIES OF H ARVARD U NIVERSITY Graduate School of Design John F. Kennedy School of Government Principal funding for this report was provided by the Ford Foundation and the Policy Advisory Board of the Joint Center for Housing Studies. Additional support was provided by: America s Community Bankers Fannie Mae Foundation Federal Home Loan Banks Freddie Mac Housing Assistance Council Mortgage Bankers Association National Association of Affordable Housing Lenders National Association of Home Builders National Association of Housing and Redevelopment Officials National Association of Local Housing Finance Agencies National Association of Realtors National Council of State Housing Agencies National Housing Conference National Housing Endowment National League of Cities National Low Income Housing Coalition National Multi Housing Council U.S. Conference of Mayors 24 President and Fellows of Harvard College. The opinions expressed in The State of the Nation s Housing: 24 do not necessarily represent the views of Harvard University, the Policy Advisory Board of the Joint Center for Housing Studies, the Ford Foundation, or the other sponsoring agencies.

3 Executive Summary Despite job losses in the rest of the economy, housing had another record-breaking year in 23. Home sales, single-family housing starts, residential fixed investment, homeownership rates, mortgage originations, refinances, and home prices all reached new peaks. The only weak spots were the uneven rental market and the depressed manufactured housing sector. This housing boom has been both longer and more broadly based than previous expansions (Figure 1). Construction activity has remained strong in most states and real house prices have climbed in nearly all metropolitan areas. Rents have increased in more areas than they have decreased, and industry indicators suggest that rents are stabilizing in some locations that have seen recent declines. With the economic recovery under way, the question now is whether housing will achieve a soft landing in which house prices, sales, and new construction ease rather than drop off sharply. Several factors favor this possible outcome. Housing construction appears to be in line with long-run demand, and a strengthening economy should support house prices. In addition, changes in the housing finance system have made markets more resilient and better able to adjust quickly to interest-rate movements. Figure This Housing Boom Has Outlasted Both the Recent Recession and Jobless Recovery Percent change in housing starts and home sales Housing Starts 1979 Q3 198 Q1 2 Q3 21 Q1 199 Q1 199 Q3 22 Q1 23 Q4 Existing Home Sales Notes: Percent change is measured from two quarters preceding the start of a recession/softening through the first quarter of the recession/softening. Recessions are defined by the NBER Business Cycle Dating Committee. The last time period reflects the recovery. Sources: Census Bureau, Construction Statistics and National Association of Realtors. Although refinancing activity would drop off significantly if interest rates rise even gradually, construction would probably hold near its current pace and house price inflation moderate rather than turn negative. If job growth falters or interest rates spike, however, housing could be in for a rougher ride. Uninterrupted Growth The housing boom has outlasted an international finance crisis in 1998, an economic recession in 21, and job losses in Throughout most of this period, low interest rates kept housing markets thriving as home prices and sales continued to climb. Rising home values in turn generated wealth effects that helped to sustain consumer spending. In fact, the wealth effects related to home price appreciation, realized capital gains, and heavy home equity borrowing appear to have contributed more than one-quarter of the growth in personal consumption in both 22 and 23. 1
4 Residential construction has been on the rise for most of the last 12 years, adding significantly to the housing stocks in both metropolitan and nonmetropolitan areas particularly in the South and West (Figure 2). While large metros such as Atlanta and Las Vegas have seen spectacular increases in new construction, the rate of growth in many small and medium metros exceeded 25 percent. for a crash. Although more locations are now at greater risk of a home price decline than a year or two ago, a sharp correction is unlikely unless the economy unexpectedly contracts. Sharply higher interest rates would, however, quickly erode affordability for homebuyers. In that case, home prices would come under pressure unless employment and income growth were strong enough to offset the rate increases. Despite growing concern over the pace of development, housing construction over the next 1 years is likely to exceed that over the last 1. The Census Bureau s newly revised population estimates imply that household growth from will be as much as million more than the Joint Center for Housing Studies previously projected. Add to that the growing demand for second homes and replacements of units lost from the stock, and the total number of homes built in could reach million units. This compares with 16.4 million homes added in the 199s. In the meantime, house prices in many areas of the country have risen considerably faster than household incomes. This rapid appreciation has raised concerns that housing is headed The first line of defense that potential homebuyers can take against rising rates is to choose mortgages that adjust annually or hybrid mortgages that have fixed rates for a set number of years before adjusting. While these maneuvers blunt the shortrun impact of higher rates, they do expose owners to higher monthly payments if interest rates continue to climb. Demand Transformed The changing demographic structure of the population is reshaping housing demand. Immigration has been, and will continue to be, an important driver. Immigrants have accounted for more than a third of household growth since the 199s adding not only directly to the number of households, but also indirectly as their native-born children begin Figure 2 During the 199s, Construction Contributed Significantly to the Housing Stock Share of 2 housing stock built in the 199s Over 25% % % % 9.9% Source: 2 Decennial Census. 2 the State of the Nation s Housing 24
5 Figure 3 4 Growth in Minority Households Will Offset Baby Bust Led Reductions in the Age Range Net change in households (millions) 34 percent by 22. Minority household growth over the next 1 years will add significantly to the growth in household heads aged 55 to 74 and help to offset losses of white household heads aged 35 to 54 as the baby bust cohort reaches middle age (Figure 3) This will only add to the already important contributions that minorities have made to housing demand in recent years. In particular, without the rapid growth in minorities, the number of renter households would have fallen during the 199s. Instead, the renter population increased modestly and the minority share of renter households surged from 31 percent to 39 percent over the decade. Figure White Households Source: JCHS Interim Household Projections. Minority Households to live on their own. Although recent immigrants have lower homeownership rates than native-born Americans of comparable races, ethnicities, and ages, with time many foreign-born households eventually join the ranks of owners. Owing to immigration and higher rates of natural increase, the minority share of households increased from 17 percent in 198 to 26 percent in 2, and will likely reach about Unmarried Women Are Increasingly Heading Up Their Own Households Millions of unmarried household heads Male Owners Female Owners Male Renters Source: JCHS tabulations of the 198, 199 and 2 Census 1% PUMS. Female Renters In addition to keeping rental demand from sagging, minorities also accounted for fully two out of every five net new homeowners from 1994 to 23. Despite these strong gains, though, minority homeownership rates still lag those of whites by nearly 25 percentage points. Narrowing this persistent gap remains a challenge for both the government and the mortgage finance industry. Meanwhile, social and economic trends have given women a more powerful presence in housing markets. Between 198 and 2, the number of households headed by unmarried women increased by almost 1 million (Figure 4). Over the same period, the median contribution of wives earnings to dual-earner households rose from 3 percent to 37 percent. As a result, unmarried women now head a larger share of households and married women make larger contributions to household income than ever before. While both women and minorities make up increasing shares of middle-income households, they are still over-represented in the lowest-income category. The incidence of housing problems is therefore higher among minorities than whites and among unmarried women than unmarried men of comparable ages. Housing Finance Innovations Several changes in the finance industry have served to strengthen housing markets. Consolidation has brought new economies of scale, reducing the costs of mortgage originations and servicing. The ability to fund mortgages in domestic and global capital markets has also reduced the risk of credit 3
6 Figure crunches by tapping a larger investor base through the broadening of secondary mortgage markets. In addition, automation has accelerated approvals, lowered costs, expanded access to credit, and reduced blatant discrimination. Loan loss mitigation tools have also limited the share of problem loans that end in foreclosure, which is costly to all parties. And finally, multiple mortgage products are available with a range of amortization lengths, loan terms, and repayment options, helping to keep homebuyers in the market even when interest rates rise. Today, capital is far more readily available in low-income and minority communities. While the number and share of prime loans to these borrowers have increased steadily since the 199s, the growth of higher-cost subprime loans has been even greater. Indeed, the subprime share in low-income, predominantly minority communities mushroomed from only a few percentage points in 1993 to 13 percent of home purchase and 28 percent of refinance loans in 21. Although innovation in housing finance has expanded access to credit, it has also brought new risks and challenges. The proliferation of mortgage choices and prices can confuse homebuyers and provide fertile soil for predatory lending. In Severely Cost-Burdened Households Have Little to Spend on Other Basic Needs Average monthly expenditures (23 dollars) Bottom Quintile Food Clothes Lower-Middle Quintile Transportation Health Care Middle Quintile Notes: Refers to households devoting more than half their outlays to housing. Housing costs include mortgage principal and interest, insurance, taxes, maintenance, rents and utilities. Quintiles are defined by total expenditures rather than income because one out of five households in the survey fails to report income. Source: JCHS tabulations of the Consumer Expenditure Survey, using the Quarterly Interview Surveys data for calendar 21. addition, statistical credit scores now govern both access to and the pricing of mortgage credit. These scores are lower on average for minorities than for whites of comparable incomes, implying that some minority borrowers pay more for their loans. Furthermore, the growth in subprime lending has resulted in rising foreclosures in some of the low-income and minority communities where these loans are concentrated. Housing Challenges Although the overwhelming majority of Americans are well housed, nearly a third of all households spend 3 percent or more of their incomes on housing and 13 percent spend 5 percent or more. In addition to widespread affordability problems, crowding is on the increase, some million people are homeless at some point in a given year, and nearly 2 million households still live in severely inadequate units. Not surprisingly, housing challenges are most severe among those at the bottom of the income distribution. Fully half of lowest-income households spend at least 5 percent of their incomes on housing. Severely cost-burdened households in the bottom quintile by expenditures have little left over to pay for other basic necessities, spending just $161 on average each month on food and $34 on healthcare (Figure 5). By comparison, households in the bottom expense quintile that devote less than 2 percent of their budgets to housing managed to spend $8 more a month on food and $49 more on healthcare on average. Unfortunately, affordability pressures are unlikely to ease. Many of the low-wage jobs created by the economy do not pay enough for a household to afford (at 3 percent of income) even a modest one-bedroom rental anywhere in the country. Similarly, retirement incomes are so meager that many seniors face heavy housing cost burdens on top of escalating healthcare costs. Adding to the pressures on low-income households is the cost of supplying new affordable housing. Restrictive regulations and public resistance to high-density development make it difficult to replace or add lower-cost units. Prospects for additional income supports or housing subsidies are equally bleak. As the federal deficit balloons, the calls to cut spending on social and housing programs are growing even as the demand for and costs of these programs continue to escalate. 4 the State of the Nation s Housing 24

7 Housing and the Economy previous peaks. Fully half of mortgage debt outstanding was originated or refinanced last year. Housing helped to shore up the economy again in 23. Residential fixed investment alone accounted for about one-tenth of GDP growth, while commissions from home sales pumped an estimated $8 billion into the economy. In fact, it was a record-setting year not just for residential fixed investment, but also for home sales, prices, rents, and mortgage originations (Figure 6). Starts totaled 1.85 million, driven by 1.5 million single-family starts (Table A-2). Not since the 197s, when the baby boomers started to form their own households, have starts been so strong. And buoyed by the lowest interest rates in over four decades, mortgage originations hit a staggering $3.8 trillion as both home purchase and refinance loans eclipsed Sales and Production Still Strong Low interest rates pushed home sales to new heights, fueling owner-occupied housing markets from coast to coast even as some rental markets softened. After dipping in mid-year to levels not seen since the early 195s, rates on 3-year fixed mortgages averaged 5.83 percent for the year. This is more than two percentage points (or 38 percent) below their average when the housing boom started to build steam in 2. Buyers took advantage of the low rates to push sales of existing single-family homes to 6.1 million units and of new singlefamily homes to 1.1 million units. Low rates also helped to hold down monthly mortgage payments and keep home prices on the rise. Indeed, the median sales prices of both new and existing single-family homes hit all-time highs in 23. Starts of single-family homes stood at their highest level in over 4 years, while starts of multifamily housing edged up to 348,7 units on the strength of higher condominium Figure 6 Strong Homeownership Demand Has Propelled Housing to New Heights Change (%) Homeownership Rate (%) New Single-Family Home Sales (Units) 973, 1.1 million 11.5 Existing Single-Family Home Sales (Units) 5.6 million 6.1 million 9.6 New Single-Family Home Price $188,78 $195, 3.3 Median Existing Single-Family Home Price $162,569 $17, 4.6 Home Equity $7.9 trillion $8.4 trillion 6.1 Mortgage Debt $6.2 trillion $6.8 trillion 9.9 Mortgage Refinancing $1.4 trillion $2.4 trillion 71.4 Residential Fixed Investment $57.4 billion $554.3 billion 9.2 Notes: All dollar figures are in 23 dollars. Homeownership rate is from the Housing Vacancy Survey. Percent change was calculated using unrounded numbers. Sources: Tables A-2, A-6; Federal Reserve Flow of Funds Accounts; Bureau of Economic Analysis, National Income and Product Accounts; Census Bureau, C-5. 5
8 production. Manufactured housing placements, meanwhile, declined for the fifth consecutive year to 134,8 a low not seen since the 196s. This segment may, however, have reached bottom now that dealer inventories are leaner. Just five states Florida, California, Texas, Georgia, and North Carolina accounted for 4 percent of housing permits issued in 23. Of these, Georgia and North Carolina posted small dips from a year earlier, while permits in Florida and California continued a climb that began in Overall, just 1 states and the District of Columbia issued fewer permits in 23 than in 22, with only Colorado and North Carolina reporting a second straight year of decline (Figure 7). Condominium markets are also booming. Both sales and prices of existing condos/co-ops have risen steadily for eight consecutive years, with sales at a record 898, units in 23. The median price of condos/co-ops has increased roughly twice as fast as that of existing single-family homes in all four regions. Even so, the median price remains below that of single-family homes, making condos/co-ops attractive to first-time and other buyers in expensive housing markets. After more than a nine percent surge in 22, growth in homeowner spending on improvements and repairs fell in 23. Rising home values have given homeowners a ready source of equity to finance remodeling projects, while simultaneously providing an incentive to protect their increased equity. Strong home sales should support higher levels of improvement spending in the future, since buyers are most likely to remodel soon after purchasing their homes. After adjusting for inflation, home prices were up 5.9 percent nationally in 22 3 (fourth-quarter to fourth-quarter). The largest real gains were in the Pacific states (1.6 percent), followed by the Middle Atlantic (9.4 percent) and New England (8.7 percent) states. Even though appreciation slowed in 81 of the 163 metropolitan areas tracked by Freddie Mac, inflationadjusted house prices continued to rise in all but 4 (Austin, Boulder, Provo and Salt Lake City). Two of these areas were hard-hit by the end of the technology boom, while Utah suffered from a post-olympics slump. Even in these four places, though, house prices were still up in nominal terms. Given that housing is typically a leveraged Figure 7 Housing Production Expanded in Four Out of Five States Last Year Change in single-family and multifamily permits, 22 3 Over 2% 11 2% 1 1% Declining Source: Census Bureau, Construction Statistics. 6 the State of the Nation s Housing 24
9 Figure Housing Wealth Buoyed Consumer Spending During and After the Recession Growth in personal consumption expenditures (Percentage points) Expansion Recession and Recovery price increases) accounted for the other half of housing s wealth effects. Freddie Mac estimates that homeowners with prime mortgages not insured by the government cashed out about $86 billion in 21, $18 billion in 22, and $139 billion in 23. The total of $333 billion dwarfs the next highest three-year level of $114 billion posted in Housing-related Effects Other Sustaining the Boom Housing remains in uncharted territory. The strength and endurance of the boom have raised concerns that a significant correction may be in store. During a typical national recession, housing investment, residential construction, employment, and home sales all plunge while average home prices dip slightly. These cyclical downswings often set the stage for upswings as deferred demand and a strengthening job market push housing activity sharply higher. Notes: 1995 to 22 is a four-quarter average. 23 is the average of the first three quarters. Source: JCHS and Macroeconomic Advisers, LLC, under contract to the National Association of Realtors. investment, owners may therefore still earn real capital gains even when nominal home prices rise more slowly than general inflation. Support for the Economy In 23, investment in new homes and remodeling directly contributed to economic growth and helped to anchor job markets. At the same time, housing wealth supported consumer spending as never before. In fact, housing-related wealth effects were responsible for about a third of the growth in personal consumption last year (Figure 8). What has made this possible is the unique confluence of strong house price appreciation, low interest rates, record cash-out refinances, high home-equity lending, and brisk home sales. Home price appreciation alone drove about half of housing s contribution to consumer spending gains. The Joint Center and Macroeconomic Advisers estimate that households spend on average about 5.5 cents a year out of every dollar increase in house values. This additional spending hits its long-run average within a year of when the increase in value occurs much more quickly than households spend gains in stock wealth, which they may view as less secure. Spending from home equity extracted through cash-out refinances and realized capital gains (made possible by home This time around, though, housing construction climbed straight through the recession and into the recovery even as total employment declined. Rather than dropping precipitously before and during the recession, residential fixed investment in fact rose 2.2 percent in 21. Indeed, even without the typical slowdown in household growth, fixed investment grew faster two years into this recovery than it did after the downturn. And rather than edging lower (or even plummeting in some locations as they did in the early 199s), average house prices continued to soar as lower interest rates kept monthly payments stable. At this stage of the cycle, the biggest threats are that job growth will stall or interest rates climb. If jobs are shed, the housing market will have a hard time sustaining its heady pace unless rates fall as well, setting up another scenario like 23. A significant increase in mortgage rates would surely put an end to the refinance boom and, if large enough, also dampen both existing home sales and home price inflation. But even interest rate increases of one percentage point or more may not have much of an impact on home sales and prices as long as job growth and productivity gains continue. If long-term interest rates rise, many homebuyers would choose a hybrid adjustable-rate mortgage with a 5- or 7-year fixed term instead of a 3-year fixed-rate mortgage. This could blunt some of the impact of higher rates and keep buyers in the market. Higher rates would, however, likely reduce the 7
10 number of homes on the market because owners would think twice before selling and giving up their current low fixed-rate mortgages. This reduction in supply would help stabilize house prices. As for housing starts and new home sales, both depend less on interest rates and more on whether construction is growing in line with demand. So far, household growth appears to be running near trend while the months supply of new housing (a measure of the leanness of the inventory) has stayed low. During past cycles, new construction activity did not retreat until the months supply had reached at least eight months. For current inventory to exceed even a six-month level, though, new home sales would have to drop by more than a third a magnitude of decline not seen since interest rates skyrocketed in the early 198s. This makes a sharp inventory correction unlikely. Still, the blistering pace of home price appreciation in many metropolitan areas has heightened fears that price bubbles have developed in at least some markets. But steep declines even at the metropolitan level are rare in the absence of concentrated job losses. In the event of such an employment drop, homes for sale often flood the market at a time when few are in a position to buy. In today s market, though, house prices have continued to escalate even in areas where sizable job losses have occurred. In Boston, for example, prices were up by 7.8 percent at the end of 23 even though payroll employment fell by 1.5 percent. This has only added to concerns about an impending crash. But the current house price run-up is still less extreme than that preceding the retreat in the late 198s and early 199s (Figure 9). In addition, labor markets are stabilizing or improving in most areas. With a resumption of job growth, overheated housing markets may well see only modest house price corrections. Diverse Growth Patterns Since 199, housing construction has been concentrated in large metropolitan areas (with populations of more than 1 million). Nevertheless, medium-size metros (with populations Figure 9 House Prices Have Appreciated Steadily Since the Mid-199s Across the Nation Real percent change in home prices (Q4 to Q4) New England Middle Atlantic South Atlantic East South Central West South Central West North Central East North Central Mountain Pacific Source: Freddie Mac Conventional Mortgage Home Price Index. 8 the State of the Nation s Housing 24
11 Figure 1 Metros of All Sizes Saw Their Housing Stocks Expand by More Than One-Fourth in the 199s Metro area permits issued as shares of 199 stock Small Metros Medium Metros Large Metros Less than 1% % 25% or More Note: The 141 small metros had populations of less than 25,; the 116 medium metros had populations between 25, and 1 million; and the 61 large metros had populations above 1 million as of 2. Source: US Census Bureau, Construction Statistics. of 25, to 1 million) accounted for 22 percent of construction growth, small metro areas (with populations under 25,) for 8 percent, and non-metro areas for 16 percent, for a combined 46 percent of production gains. In fact, new construction has been so feverish in many locations that local ballot initiatives to limit growth have surged. Topping the list of the fastest-growing metro areas is Las Vegas, where the number of permits issued between 199 and 22 nearly equaled the number of housing units that existed in 199. Permits issued in Atlanta, Austin, Charlotte, Phoenix, Orlando, and Raleigh represent about half the 199 count of housing units. Building activity was equally intense in the medium-size metros of Naples and Fort Myers on Florida s Gulf Coast, the Texas border town of McAllen, Fort Collins on the outskirts of Denver, Boise City, and Provo. Small metros with strong building activity included Greeley near Denver, Laredo on the US-Mexico border, and Wilmington and Myrtle Beach on the Carolina coasts. Indeed, the pace of new construction has been brisk in a wide range of places (Figure 1). Work done by the Joint Center and Economy.com suggests that both the level and volatility of housing construction are influenced by metro size and economic structure. Activity in smaller places tends to be more volatile overall, although much of this volatility reflects the lack of diversification in their economic bases rather than size per se. Over the past decade or so, housing construction has generally grown less and been more volatile in locations with economies based on manufacturing than in places with economies based on the healthcare industry. Looking Ahead While the short- and medium-term outlook depends on interest rates and the course of the economy, the longer-term prospects for housing rely far more on demographic trends. Several forces bode well for housing investment over the next 1 years, including higher-than-expected household growth, the aging of the baby boomers into their peak income and wealth years, and the backfilling of the baby bust generation through immigration. As strong as production was during the 199s, the level of new construction should thus be even higher in Assuming the 199s ratio of projected household growth to total housing completions holds over the coming decade, completions should reach at least 18.5 million housing units and could easily top 19.5 million if immigration continues at current levels. In any case, new construction will exceed the growth of households because a significant fraction of building activity offsets losses from the existing housing stock, adds to the supply of second homes, and accommodates the greater turnover of units that accompanies a larger household base. 9

12 Demographic Drivers of Demand Despite a brief cyclical slowdown following the 21 recession, 1.3 million net new households have formed each year on average since the start of the decade. Bolstered by strong immigration during the 199s, household growth has been set upon a higher path that is likely to continue over the next 1 years. for housing markets in that a larger share of households will be younger, foreign-born, and minority than recently predicted. With their relatively low average incomes, these overlapping groups will add to the demand for modest starter homes and affordable rental housing. In the meantime, women continue to expand their presence in housing markets as the numbers of dual-earner married couples and unmarried female-headed households remain on the rise. But because women still earn less on average than men do, they are more likely to face housing problems than either married-couple households or households headed by unmarried men. The growing presence of the foreign-born is in turn redefining the age distribution and racial and ethnic composition of the US population. These shifts have important implications Household Projections Future household growth depends primarily on adult population growth. Given the unexpectedly high levels of immi- Figure 11 Household Growth Is Now Projected to Reach 13.3 Million Over the Next Decade Projected household growth (millions) Age of Household Head 75+ New Interim Projections (Total = 13.3 million) Old Joint Center Projections (Total = 12.3 million) Source: JCHS Interim Household Projections. 1 the State of the Nation s Housing 24
13 Figure 12 gration in the 199s, together with other evidence supporting a higher 2 population count, the Census Bureau has recently revised its population projections. Based on these new estimates, the Joint Center has prepared an interim set of household projections that point to consistently stronger growth ahead (Figure 11). The new household projections assume that the rates at which the population of different ages, races, and ethnicities head their own households remain at the levels reported in the 23 Current Population Survey. Under this assumption, household growth between 25 and 215 will be about 1 percent higher than previously projected bringing the total increase to 13.3 million households. The net gain in households largely reflects a smaller-thananticipated drop in the number of households who will be in their 4s in 215. Because the vast majority of immigrants are young adults, those who arrived in the 198s and 199s have helped to supplement the native baby-bust generation (born While Over Half of Immigrant Households Live in Just 1 Gateway Metros Distribution of foreign-born households 1965 to 1974) and offset larger losses that would have occurred in this age group over the next 1 years. Immigrants have also added to the numbers of the youngest baby boomers (born between 1955 and 1964), thereby lifting the number of households who will be in their 5s in 215. Finally, longer life expectancies favor stronger growth among the population over 75 years of age than previously predicted. The impact of future immigration on projected household growth remains somewhat of a wild card. The Census Bureau s revised population projections assume immigration of only about 8.5 million persons between 25 and 215. Current government estimates, however, indicate that immigration has in fact been running at more than 1.2 million per year since 2 (even faster than the pace of the 199s). If the influx continues at this higher level, household formations could be as much as million higher over the next 1 years than the Joint Center currently projects. The Foreign-Born in Housing Markets Overall, more than one in ten households is now headed by a person born outside the United States. The shares among younger households are even higher. Furthermore, of the 12 million foreign-born householders in the US in 2, 3.4 million (28 percent) arrived in this country during the 199s alone. As a result, the foreign-born contributed more than a third of household growth over the decade and will likely account for an even larger share of growth in the years ahead Gateway Metros Other Metros Non-Metro Areas The Foreign-Born Are a Majority in Only One Percent of households that are foreign-born Miami Los Angeles New York San Francisco Houston Chicago Washington, DC Boston Dallas Atlanta Rapid growth in foreign-born households has added significantly to housing demand. Between 1998 and 21, foreignborn households purchased about 8 percent of new homes and 11 percent of existing homes sold. The foreign-born also made up 12 percent of first-time homebuyers in 21, boosting the demand for starter homes. With their relatively low homeownership rates, immigrants played an even more vital role in rental markets accounting for fully 17 percent of all renters in 2. While their homeownership rates lag those of the native-born, many foreign-born citizens eventually become owners. Generally in the country longer than non-citizens, naturalized Americans soon begin to close the homeownership gap. Indeed, among households headed by a person aged 25 to 34, the homeownership rate of foreign-born citizens is on par Note: Excludes households where the metro status cannot be identified. Source: Table A

14 with that of the native-born. Among older households, their homeownership rates lag by less than 1 percentage points. Homeownership rates among non-citizens aged 25 and older, in contrast, are more than 3 percent lower than those of native-born Americans of comparable ages. Much of this gap reflects the fact that most non-citizens have been in the United States only a short time and have yet to establish themselves economically. Many are also unfamiliar with the mortgage application process and may even be unaware that they could qualify to finance a home. Stronger outreach to these newer arrivals could thus increase their homeownership rates. While important to overall housing demand, the foreign-born are highly concentrated in just 1 metropolitan markets (Figure 12). Indeed, these so-called gateway areas are home to over half of all immigrant households. Nevertheless, foreignborn households are increasingly choosing to live in a wider range and expanding number of locations, with 15 states now reporting a foreign-born share of 1 percent or more (Table A-3). Immigrants are also making gains in non-metropolitan areas, particularly rural communities of the Southeast, Southwest, and Pacific Northwest. Although some areas have experienced declines in foreign-born share, they are far outnumbered by places where the share has increased in some cases dramatically (Figure 13). The foreign-born are highly diverse. While fully one-fifth are of Mexican origin, the next largest immigrant groups are Chinese (with only a 4.7 percent share) and Indian (with a 3.7 percent share). Indeed, only 21 of the more than 9 nationalities represented in this country each make up more than one percent of total foreign-born households. The foreign-born are especially adding to Hispanic and Asian household counts. Two-thirds of Asian and just over half of Hispanic householders now living in the US were born elsewhere, compared with just seven percent of black and five percent of white householders. But given their numerous countries of origin as well as their settlement patterns, average lengths of stay, education levels, incomes, and reasons for emigrating, immigrants have markedly different homeownership rates. Even within major Figure 13 Despite Their Geographic Concentration, Immigrants Are Gaining in a Variety of Locations Increase/decrease in foreign-born share of population, (Percentage points) Over Less than Zero Source: 199 and 2 Decennial Census. 12 the State of the Nation s Housing 24
15 Figure Minority Shares in Housing Markets Are Up Across the Board Percent of households that are minority First-Time Homebuyers Trade-Up Homebuyers All Homeowners Remodeling Homeowners Source: JCHS tabulations of the 1991 and 21 American Housing Surveys. All Renters immigrant groups, substantial differences are apparent. Among Hispanics, for example, Cuban immigrants have a homeownership rate of 58 percent, reflecting in part their relatively long residency in the US and relatively high shares of college graduates. The ownership rate among Mexican immigrants, with their shorter average residency and smaller share of college graduates, is a much lower 44 percent. Among Asian immigrants, homeownership patterns are equally uneven. In addition, ownership rates do not seem to bear a relationship to education levels and length of stay. Vietnamese immigrants, for example, have a higher ownership rate (54 percent) than Korean immigrants (41 percent), even though they have a smaller share of college graduates and a shorter average residency in the United States. The Growing Contribution of Minorities Largely as a result of immigration, minorities make up an increasingly large share of households. From about 17 percent in 198, the minority share climbed to 2 percent in 199 and to 26 percent in 2, and is expected to reach 3 percent by 21 and 34 percent by 22. As a result of this rapid increase, minorities will likely contribute at least two-thirds of household growth over the coming decades. Minorities are clearly redefining housing markets as they increase as a share of renters, homebuyers, homeowners, and remodelers (Figure 14). After accounting for only 14 percent of homeowners in 1991, minorities were responsible for some 4 percent of the growth in owners over the ensuing decade. Not surprisingly, minority homeownership gains have bolstered remodeling markets. Of the additional $64 billion spent on home remodeling in 2 1 compared with , over $13 billion (21 percent) was due to growth in minority spending. Overall, the remodeling outlays of minority households totaled $37.8 billion in 2 1. Accompanying this trend is the turnover of older housing to minorities as their white owners die or move to newer homes. In fact, between 1991 and 21, about 2 million homes built before 1985 switched to minority ownership. This older stock tends to require more maintenance and repair than newer homes, suggesting that minority remodeling expenditures are set to increase as they expand their ownership of homes in central cities and inner-ring suburbs. Minority households many headed by recent immigrants have also kept rental demand going during the homeownership boom. Indeed, had it not been for growth in minority renters, the overall number of renter households would have declined rather than increased modestly. Between 199 and 2, the number of renter households headed by minorities in the central cities and inner-ring suburbs jumped by more than 2.6 million. Persistent Income Gaps Despite some progress, minority workers still earn much less than whites of similar age and education. For example, the median earnings of college-educated minorities aged 35 to 44 and employed full-time stood at $46, in 22 while those of their white counterparts were $11, higher. Within the same age group, minorities with some college education working full time earned $7, less than whites, while those with a high school education earned $5, less. With minorities representing a growing share of all households, the number of middle-income minorities increased by 4.6 million between 199 and 2, while the number of upper-income minorities rose by 1.5 million. Among blacks, the share in the bottom income quartile (less than $21,521 in 2) declined from 44.2 percent in 198 to 37.6 percent 13
16 As the number of immigrant, minority, and female-headed households continues to grow over the next 1 years, demand for starter homes and for affordable rentals will increase. Figure in 2, while the share in the top quartile (over $73, in 2) moved up from 11.7 percent to 13.4 percent. Furthermore, even though half of all adult Hispanics are immigrants and many have little education, they too have eked out modest gains in share in the middle and upper income quartiles. Meanwhile, a larger share of Asians than even whites is in the top income quartile (Table A-9). Women s Expanding Role Women play a larger role in housing markets today than ever before, thanks to delayed marriage, higher divorce rates, lower remarriage rates, greater longevity, and increasing labor force participation. The shares of two-worker, married-couple households and of households headed by unmarried women have both swelled over the past 2 years. As the male-female earnings gap has decreased, the contribution of wives incomes to married-couple households has increased. In fact, the median contribution of wives earnings rose from 3 percent in 198, to 34 percent in 199, and to 37 percent in 2. More Unmarried Women than Unmarried Men Struggle to Afford Housing Percent of household heads with severe cost burdens At the same time, unmarried women accounted for 3 percent of the growth in homeowners from 1994 to 22. Over this period, the number of unmarried females owning homes climbed from 13.9 million to 17.5 million, including increases in divorced owners from 4.2 million to 5.7 million and in widowed owners from 6.7 million to 7.1 million. Even so, unmarried women struggle more than unmarried men of comparable ages to pay for housing because their earnings still lag (Figure 15). The male-female earnings gap among college-educated, middle-aged workers is especially wide. In 22, for example, the gap between the median earnings of college-educated men and women aged 35 to 44 employed full-time was $24,5, for those aged 45 to 54 it was $25,6, and for those aged 55 to 64 it was $22,. By comparison, the gap among 25 to 34 year-olds was only $1,2. At the greatest disadvantage are the nation s nearly eight million single mothers. About one-quarter (two million) of these women spend more than half of their incomes on housing, compared with about one-tenth (2,) of households headed by single fathers. Even relative to other unmarried women, single mothers spend the largest share of their incomes on housing. Looking Ahead The pace of household growth over the next 1 years is expected to surpass that over the last 1. Together with the wealth gains achieved by each age group in the 199s, strong household growth should propel residential fixed investment, mortgage debt, and home sales to unprecedented heights All Ages Unmarried Women Unmarried Men Note: Severe cost burdens are defined as spending 5% or more of monthly income on housing. Source: JCHS tabulations of the 21 American Housing Survey. Immigration will continue to shape housing demand and lift both the minority and young adult shares of households. Meanwhile, as women continue to make economic progress, they will expand their participation in housing markets. In response to the rapid growth of these groups, the housing industry and housing finance system will continue to develop additional products and marketing strategies to better serve lower-income households in general, and minority, foreignborn, and female-headed households in particular. 14 the State of the Nation s Housing 24

17 Homeownership With interest rates near 45-year lows, home sales and mortgage refinances reached new heights in 23. Existing single-family home sales climbed 9.6 percent and new single-family home sales rose 11.5 percent, while mortgage refinances shot up by an astounding 71 percent. In combination, low rates, mortgage innovations, and home price appreciation helped push the national homeownership rate up to 68.3 percent. Home price appreciation and new housing construction lifted aggregate real home equity 6 percent to a record $8.4 trillion in the last quarter of 23. Unlike stock wealth, aggregate home equity has moved up steadily for the past 4 years with only brief, shallow dips (Figure 16). Housing wealth is also more broadly based than stock wealth. Indeed, with the strong growth of home equity, homeownership has now reasserted itself as the cornerstone of household wealth. Affordability Conditions Thanks to lower interest rates, after-tax mortgage payments in 23 fell for buyers of a median-priced home assuming they could come up with the additional downpayment demanded by higher home prices. But even with real home price appreciation at 5.9 percent, after-tax payments for buyers putting 1 percent down on a 3-year fixed-rate mortgage were still marginally lower than in 22 (Table A-1). As a result, the share of income typical homebuyers put toward monthly housing costs changed little last year. Figure 16 Aggregate Home Equity Is More Stable than Aggregate Stock Wealth Trillions of 23 dollars Homeowners Equity Stocks Directly Held by Households Source: Federal Reserve Board, Flow of Funds Accounts, Quarterly Data. Home prices were up in nominal terms in all 163 metropolitan areas tracked by Freddie Mac s Conventional Mortgage Home Price Index. Even after adjusting for inflation, only four metro areas posted home price declines last year. Some 34 metros 15 of which are in California saw double-digit increases. In markets with these outsized gains, housing affordability is a growing concern. Higher house prices force prospective buyers to come up with larger downpayments, choose less expensive homes, or increase the amount that they borrow. Over the short run, strong home price inflation has not seriously eroded affordability because lower interest rates enabled homebuyers to borrow more with little impact on their monthly payments. From 22 to 23, for example, a 1 percent downpayment on a typical home increased by $1,19. Buyers who could not 15
18 save that much and instead rolled the additional amount into the mortgage paid only $4.54 more per month than they would have in 22. Over the long run, though, the erosion in affordability is much greater for homebuyers unable to keep up with escalating downpayment requirements. For example, the difference between a 1-percent downpayment on the median-priced home in 1995 and in 23 is substantially more at $6,35. If the buyer rolled this larger amount into the mortgage, the payments (including mortgage insurance) would be about $54 more each month. end of 23. Meanwhile, total mortgage debt expanded by $62 billion last year. The housing finance system has also boosted homeownership rates by extending credit to buyers who would have previously been denied a mortgage. Credit-impaired borrowers or those willing to devote larger shares of their income to housing payments now qualify for subprime mortgages. As a result, the subprime share of loans surged from under one percent in the early 199s to six percent of home purchase loans and ten percent of refinance loans by 21 (Table A-7). All in all, subprime lending mushroomed from a roughly $43 billion market in 1994 to a $385 billion market in 23. Figure Despite Recent Gains, Minority Homeownership Rates Still Lag Homeownership rate (Percent) White Asian/Other Black Hispanic But mortgage interest rates and fees are substantially higher in the subprime than in the prime market. Even a two percentage-point premium on an $85, loan (typical of low-income homebuyers) entails additional interest payments of about $18, just halfway into a 3-year fixed-rate loan. A loan that is five percentage points above prime rates imposes nearly $47, in additional interest after 15 years. Subprime loans may also carry prepayment penalties, limiting borrowers ability to refinance if rates fall or if their financial circumstances improve. Furthermore, while 9 percent or more of subprime borrowers manage to repay their mortgage loans, large numbers also lose their homes to foreclosure Notes: Due to changes in the racial definitions in 23, 22 data are used. White, black, and Asian/other are non-hispanic. Hispanic householders may be of any race. Asian/other includes Pacific Islanders, Aleuts and Native Americans. Source: Table A-6. Despite the obstacles imposed by higher home prices, the homeownership boom has been remarkably broad-based. Homeownership rates are up across all ages, household types, races, and ethnicities. Even so, the wide and persistent gap between white and minority homeownership rates has improved little since 1994 (Figure 17). Finance Fueling the Boom The ability to tap into broader capital markets both here and abroad has helped to meet the skyrocketing demand for mortgage credit. Indeed, the nation s housing finance system attracted enough capital to originate an astounding one-half of the $6.8 trillion in home mortgage debt outstanding at the Fortunately, the introduction of automated underwriting and credit-scoring tools in the 199s also coincided with growth in the share of applicants able to qualify for lower-cost prime loans. For example, Freddie Mac s minority share of loan purchases increased from 8.5 percent in 1995 (when it first started using automated underwriting) to 14.9 percent in 2. Over the same period, the share of loans to borrowers with incomes below the area median increased from 32 percent to 41 percent. As a result, prime credit is now more accessible to low-income and minority mortgage applicants. Automation has also helped to speed approvals and lower origination costs. Indeed, initial mortgage fees and charges as a percent of loan value dropped from a high of 2.6 percent in 1982 to a low of about.4 percent in 23. As a result, rather than a full percentage point or more, it now takes only a 5 basis-point dip in mortgage interest rates to trigger a wave of refinancing activity. 16 the State of the Nation s Housing 24
19 Figure Mortgage Origination and Servicing Have Become Highly Consolidated Percentage of originations or servicing contracts Top 25 Lenders Top 25 Servicers Top 25 Subprime Lenders Notes: In 199, subprime loans were less than 1% of the market. The lender is the bank or mortgage company that makes the home loan. The servicer administers the loan. Source: Inside Mortgage Finance, The 23 Mortgage Market Statistical Annual. Top 25 Subprime Servicers Efficiencies from Industry Consolidation Consolidation in the mortgage industry has led to greater efficiencies. In 199, the largest 25 mortgage companies originated fewer than 3 in 1 prime loans (Figure 18). Today, the top 25 issue almost 8 in 1. On the subprime side, the top 25 share of originations is even higher, nearly doubling from 47 percent in 1996 to 88 percent in 22. These mortgage giants compete fiercely and harvest massive amounts of information to find new ways to improve their operations. Using low-cost marketing and outreach techniques, mortgage lenders battle to attract customers during refinance booms. While homeowners once had to figure out for themselves when it was advantageous to refinance, some lenders now alert them to the opportunity and encourage them to do so at lower cost with lender affiliates. This competition has spurred additional refinance activity. Automated systems and scoring techniques have also helped servicers separate borrowers in default who are likely to get back on track from those who are likely headed toward foreclosure. These systems have reduced servicing costs and increased loan reinstatements. Avoiding foreclosures benefits everyone from investors, credit risk insurers, and servicers to homeowners and communities. Mortgage industry consolidation has, however, altered the relationships between community-based organizations and lenders at the local level. Under regulatory pressure throughout the 198s and 199s, banks worked with community groups to create innovative products for hard-to-serve borrowers. Indeed, bank-lending consortia pioneered products and underwriting techniques later adopted by the secondary market. Now community organizations must forge relationships with larger bank and non-bank institutions to accomplish their missions. Foreclosure Risks Strong home price appreciation has provided most homeowners with healthy equity cushions. When last measured in 21, almost 9 in 1 owners had equity equal to 2 percent or more of their homes value, while only 1 in 25 had equity of less than 5 percent. This has surely helped to avert higher rates of foreclosures since many owners can sell their homes for more than the purchase price if they have serious loan repayment problems. In addition, lower interest rates give lenders As recently as 199, only 4 percent of single-family mortgage loans were securitized and sold into the secondary market. Today, that figure is approaching 6 percent. more room to negotiate loan modifications to reduce monthly payments, providing a viable alternative to foreclosure for distressed borrowers. Foreclosure rates on conventional prime loans, although up in the wake of the recession and subsequent layoffs, were nevertheless lower at the end of 23 than when employment was expanding in (Figure 19). Payments on just.3 percent of such loans were more than 9 days late, while.55 percent of prime loans were in foreclosure. The comparable shares of subprime loans were significantly higher, at 2.55 percent and 5.63 percent. And the share of FHA loans in foreclosure at the end of 23 reached a record 2.93 percent. 17
20 Figure 19 Despite Recent Job Losses, Foreclosures on Prime Conventional Loans Remain Relatively Low Thousands of jobs, seasonally adjusted Percent of prime conventional loans in foreclosure 1,25 1, , Change in Non-Farm Payroll Employment Percent of Prime Conventional Loans in Foreclosure Note: Loans in foreclosure represent the inventory at the end of the quarter. Source: Bureau of Labor Statistics and Mortgage Bankers Association. Subprime borrowers are clearly more vulnerable than prime borrowers to default even when home prices are rising. Complicating matters, subprime lending is heavily concentrated in low-income, predominantly minority communities (Figure 2). Reminiscent of the late 196s when FHA loan insurance became available in previously redlined communities, the rapid expansion of subprime lending has led to rising defaults in many of these locations. When foreclosures are geographically concentrated, they can threaten revitalization efforts as homes that lenders want to unload quickly flood the market. Homeowners with adjustable-rate mortgages are also vulnerable in a rising interest-rate environment. In fact, during and after the 21 recession, overall credit losses remained relatively modest in part because interest rates were so low. Favorable interest rates persuaded more borrowers to take out fixed-rate mortgages and reduced the monthly payments on adjustable-rate loans. If interest rates rise, the share of borrowers choosing one-year adjustable mortgages will likely rise as well. New and existing adjustable-rate mortgage borrowers will then be subject to higher monthly payments if interest rates continue to increase. At present, the states with the highest exposure to payment shocks from rising rates are California, Colorado, the District of Columbia, Illinois, Massachusetts, Michigan, and Minnesota. According to the Federal Housing Finance Board, the adjustable-rate share of mortgages originated in 23 in each of these locations is 25 percent or more, compared with just 9 percent for the rest of the nation. At the metropolitan level, the adjustable-rate shares of originations in Denver, Detroit, San Diego, and San Francisco were one-third or more in 23. Homeowners with severe cost burdens are also at risk. As of 21, 2 million borrowers in the middle two income quartiles spent half or more of their incomes on housing (including 18 the State of the Nation s Housing 24
21 The subprime share of refinances in low-income, predominantly minority communities is fully 2 percentage points higher than that in high-income, predominantly white communities. property taxes and utilities). That number is likely even higher today following three years of sustained job losses and the expansion of subprime lending at high debt-to-income ratios. Many low-income borrowers have inadequate savings and are unprepared to handle a job loss or unanticipated expenses. This has led financial institutions and others to create programs that allow borrowers to miss a certain number of payments, for pre-specified reasons, in return for a higher interest rate or a monthly fee. These products resemble the debt cancellation programs that have long been a staple of the credit card industry. Looking Ahead The combination of rapid home price appreciation and low interest rates has produced unusually favorable conditions for homeownership. The scope of future gains and losses will depend on whether these conditions persist and what direction job and income growth takes. In the meantime, risks in the system remain relatively contained. Most worrisome are the many homeowners with scant savings who are spending half or more of their incomes on housing, along with the growing share of subprime borrowers who are by definition more likely to default. If the recovery stalls, these owners will be at substantially higher risk of losing their homes. Figure 2 Subprime Lending Is Much More Prevalent in Low-Income and Minority Communities Subprime share of loans (Percent) Home Purchase Refinance Low-Income, Predominantly Minority Low-Income, Predominantly White High-Income, Predominantly Minority High-Income, Predominantly White Low-Income, Predominantly Minority Low-Income, Predominantly White High-Income, Predominantly Minority High-Income, Predominantly White Notes: Includes only loans made in metropolitan areas as defined by the Office of Management and Budget for 1993 Home Mortgage Disclosure Act (HMDA) reporting. Predominantly white neighborhoods were less than 1% minority in 199. Predominantly minority neighborhoods were 5% or more minority as of 199. Low-income neighborhoods had incomes of less than 8% of metro area median in 199, while high-income neighborhoods had incomes of 12% or greater. Source: JCHS tabulations of enhanced HMDA database. 19

22 Rental Housing (Figure 21). The recession was especially hard on renters in the bottom two income quintiles, whose median incomes dropped four percent in Rental markets softened in many parts of the country in 23 as the combination of weak labor markets and rising homeownership took its toll. While house prices climbed nearly everywhere, rents fell in 9 of the 27 metros tracked by the federal government. Nationally, real contract and gross rents barely increased last year. Still, the upward creep in rents along with recent income losses pushed the median share of income renters spend on housing back up to 29 percent about where it stood in 1994 Broad rental market measures mask the fact that average real effective rents (contract rents less concessions offered by landlords to attract tenants) for larger properties actually fell in 23. At least in this segment of the market, rents have declined modestly since 21 after several years of strong growth particularly in areas where the technology bubble formed and then burst. In response to the drop-off in demand, producers of multifamily (2+ unit) rental properties cut back on construction last year. Starts of multifamily rentals edged down from 275, units in 22 to 262, units in 23. This reduction was not enough, however, to stop the multifamily rental vacancy rate from climbing to a record-setting 1.7 percent. Figure Renter Affordability Problems Are Back on the Rise Median share of income spent on gross rent (Percent) Source: Table A-1. Despite the softness in rents, property owners increased their spending on improvements and repairs last year. Expenditures were up 7.5 percent in 23, on top of a 6 percent gain in 22. However, this spurt of investment follows a prolonged period of cutbacks and sub-par gains in rental improvement and repair spending. The Uneven Recovery In general, the rental markets that held up the best in 23 were in areas experiencing the strongest economic growth, including those in Florida and Southern California, and especially in metros with strong ties to the defense industry, such as Baltimore, Jacksonville, and Los Angeles (Figure 22). The hardest-hit markets include places with large technology sectors, such as Austin, San Jose, and Seattle all of which saw real effective rents drop by more than six percent. 2 the State of the Nation s Housing 24
23 Figure 22 Rental Market Performance Has Been Mixed Percent change in real effective rents on large properties, Q Metros with Greatest Rent Declines Metros with Greatest Rent Increases Austin, TX Portland, OR Charlotte, NC San Jose, CA Seattle, WA Atlanta, GA Oakland, CA Memphis, TN Denver, CO Greenville, SC Tucson, AZ Miami, FL Jacksonville, FL Orange County, CA Oklahoma City, OK Baltimore, MD Riverside, CA Middlesex, NY Birmingham, AL Los Angeles, CA Notes: Metros shown are the top and bottom 1 by change in real rents among the 58 metro areas surveyed by M PF Research. All rent changes are shown net of inflation using the CPI-U. Effective rents are net of concessions. Large properties have 4 or more units except in California metros, which have 15 or more units. Rent increases/decreases are measured fourth quarter to fourth quarter. Source: M PF Research, Inc. Figure New Construction Has Offset Losses from the Stock Change in rental stock (Millions of units) Northeast Midwest South West New Construction Conversions/Losses Total Net Additions Source: JCHS tabulations of the 1991 and 21 American Housing Surveys. Although rents for units in larger properties declined on average last year, they did so at a slower pace than in 22. Rents for newer and especially higher-end units were under the most pressure. In 22, only 59 percent of newly completed units were leased up within 3 months. While the absorption rate began to improve in 23, it fell off again in the second half of the year. Vacancy rates on rental units built since 199 continued their ascent, edging up from 15.3 percent in 22 to 16.5 percent in 23. To fill units, many landlords resorted to rent concessions. A survey by M PF Research conducted in the fourth quarter of 23 reveals that 41 percent of the properties surveyed were offering some kind of concession, typically a discount of 11.5 percent off market rents. Concessions were most common in markets with high vacancies and falling effective rents, with more than half of the surveyed properties in Atlanta, Houston and the San Francisco Bay Area (including Oakland and San Jose) reporting rent breaks. With the economy improving, however, some soft rental markets have begun to revive. In particular, the decline in average 21

24 inflation-adjusted effective rents slowed to near-zero in 23. Indeed, it appears average rents nationally will eke out some gain this year even with concessions. Furthermore, 32 percent of developers surveyed by the National Multi Housing Council in April 24 reported that rental markets were tightening, while only 14 percent reported loosening conditions the best showing in four years. While welcome news to property owners, stronger rental markets will likely erode affordability in a growing number of locations in the coming years. Changes in the Rental Stock Despite the slow growth in rental demand since homeownership demand took off, nearly 3.3 million new rentals were built between 1992 and 21 (Table A-11). However, most of these units were built to offset losses from the existing stock. Indeed, for every three rental units added during this interval, two were removed. In the Midwest, new construction did not even fully cover the loss of one million rentals, while in the Northeast, additions only exceeded losses by 1, units (Figure 23). Rental demand grew more strongly in the South and West, where new construction added substantially to rental stocks in many metro areas (Figure 24). As a result, the shares of rental housing and renter households in these two regions have increased. These changes have altered not only the geographical distribution of the rental housing stock, but also the distribution of units by structure type. Over the decade, more than 1.3 million apartments in two- to four-unit buildings were lost nationwide while only 45, were added. Net losses were concentrated in the Northeast and Midwest, where the stock of rentals in these small structures shrank by more than 15 percent. Along with these losses went many opportunities for resident landlords to own homes while also generating income from their properties. In contrast, nearly 75, single-family rentals and 1.3 million units in buildings with five or more apartments were gained on net in the 199s. Construction of larger properties added 1.7 million apartments, while both new construction and conversion of owner-occupied homes fed the growth in single-family rentals. Indeed, despite the strength of home- Figure 24 Despite Only Modest Net Growth Nationally, Rental Construction Has Been Intense in Some Metros Share of 2 metro area rental stock built in the 199s Over 2.% % % % Less than 5.% Note: Metro areas are based on 1999 boundaries as defined by the Office of Management and Budget. Source: 2 Decennial Census. 22 the State of the Nation s Housing 24
25 Figure The Income Gap Between White and Minority Renters Has Narrowed Percent difference in median incomes, Middle market rentals provide a vital source of new housing for those seeking relatively modest rents primarily low- and moderate-wage working families. But in the lower market (the bottom 4 percent of the rent distribution), new construction is highly constrained by the amount of government subsidies available to make this production economic. As a result, only about one-fifth of all new rental construction over the past decade has been targeted to the bottom tier of the market Demographic and Income Changes While the number of renter households has grown only slowly since 199, the composition of the renter population has changed dramatically. Over the course of the decade, the minority share of renters jumped from 31 percent to 39 percent, while the foreign-born share grew from 12 percent to 17 percent. With incomes of minority and foreign-born renters generally lower than those of white and native-born renters, this shift has lowered the median income of renters overall. Indeed, the growth in minority and foreign-born renters increased the number of low-income renters by 4, over the decade. Meanwhile, the homeownership boom encouraged millions of higher-income renters to buy, reducing the number of upper-income renters by 1 percent. As a result, the already large income gap between owners and renters widened from $18,7 in 1991 to $22,1 in 21. Within the renter population, though, the income gap between whites and minorities narrowed significantly. Given the decrease in the number of white renter households of all incomes, the median income of white renters remained essentially unchanged from 1991 to 21. In the meantime, minority renter incomes increased by a strong 13 percent as the booming economy drove up the share of minority renters in the middle income quintile. In combination, these shifts reduced the difference between white and minority renter incomes from 26 percent in 1991 to 17 percent in 21 (Figure 25). Rental Property Finance As with financing for homeownership, rental property finance has changed dramatically over the past 1 years. Most notably, the share of multifamily mortgages (defined in the industry as loans to properties with five or more apartments) bought and sold in the secondary market has increased. Nonetheless, the multifamily share of loans sold as mortgage- Whites- Blacks Whites- Hispanics Whites- Asians/Others Whites-All Minorities Note: Blacks, Whites and Asians/others are non-hispanic. Hispanic householders may be of any race. Asians/others includes Pacific Islanders, Aleuts and Native Americans. Source: JCHS tabulations of the 1991 and 21 American Housing Surveys. ownership demand over the decade, conversions of singlefamily homes to renter occupancy outnumbered conversions of single-family rentals to owner occupancy by 27,. The recent pattern of rental additions and losses has also served to shift the stock toward the higher end of the rent distribution, since newer units tend to provide more amenities than older ones. In 21, nearly half of the units built since 199 were renting for at least $75, compared with only 29 percent of those built earlier. While depreciation of the stock clearly accounts for some of the lower rents on older units, the difference in the features that older and newer units offer is also a key factor. In 21, for example, only 15 percent of rental units built before 199 had two or more bathrooms, while almost half of the units built since then had multiple bathrooms. Similarly, the share of older units with central air conditioning was 4 percent, while that of newer units was three-quarters. Although new construction over the past 1 years has been disproportionately concentrated in the top fifth of the rent distribution in individual metropolitan areas, building for the middle market (units with rents between the 4th and 8th percentile) has also been robust. Indeed, when summed across metropolitan and non-metropolitan areas, the middle-market share of new construction nationally is in line with its 4 percent share of the overall rental market. 23
26 Figure backed securities and traded in capital markets still stands well below the so-called single-family (defined as one- to four-unit properties) share (Figure 26). The growth of the secondary market for multifamily mortgages brings many advantages, including greater liquidity, better diversification of risk for investors, and a larger and more stable supply of capital. While investment banks and others have led the way, Fannie Mae and Freddie Mac are becoming increasingly important players in the multifamily market. The two companies now account for nearly 25 percent of total multifamily mortgage debt outstanding, up from just 13 percent in The participation of Fannie Mae and Freddie Mac has also transformed multifamily finance by standardizing underwriting practices and loan documents. Greater uniformity in turn reduces costs and further enhances liquidity. In addition, because of their public charters, the two companies often provide capital when others might not. Within the multifamily mortgage market, though, smaller loans mostly bypass the secondary market. Instead, bank and thrift portfolio lenders remain the principal providers of loans for properties with 5 to 49 units. In 1999, for example, more than half of all multifamily loans financed by banks and thrifts had balances of $1 million or less, compared with about 15 percent of the multifamily loans financed by Fannie Mae and Freddie Mac. Securitized Mortgages Represent a Growing Share of Multifamily Lending Percent of mortgage debt outstanding held in mortgage-backed securities In contrast, financing for rental properties with fewer than five apartments is much better integrated into secondary markets. Loans to resident landlords of two- to four-unit properties are treated much like those for owner-occupied, singlefamily properties. Although Fannie Mae and Freddie Mac s reserve and downpayment requirements may be higher for these loans, the interest rates are no different and credit scores remain an important element in underwriting. For investors in single-family rentals and non-resident landlords of two- to four-unit properties, however, Fannie Mae and Freddie Mac impose larger downpayment requirements and a 1.5 percentage-point delivery fee (sometimes rolled into a slightly higher interest rate). Despite these advances, after-tax rental property financing in most cases is still more expensive than after-tax financing for owner-occupied properties. In particular, the depreciation allowances and losses extended to investors in rental housing are less generous than the mortgage interest and property tax deductions extended to investors in owner-occupied housing. Looking Ahead Buffeted by the recession, sagging labor markets, and strong demand for homeownership, growth in rental demand has been weak for the past 1 years. Rents in many markets have been under pressure, with newer properties especially hardhit. Nevertheless, more markets saw rents climb than fall in 23, with a few reporting hefty increases. Any imbalances between supply and demand may, however, prove temporary if the economy continues to expand and generate new jobs. In fact, rental demand could even surge if interest rates and/or house prices rise, making homeownership less affordable. Independent of the economy, the age distribution of the US population will soon start to favor rental markets. The foreign-born population continues to swell the ranks of young adults, and the echo baby-boom generation will soon be old enough to form their own households. Because both young adults and the foreign-born are more likely, at least initially, to rent than own their housing, these demographic trends point to strengthening rental markets over the coming decade. Single-Family Multifamily Note: Single-family properties have 1 4 units, multifamily properties have 5+ units. Share of debt is as of the fourth quarter from 199 to 22, and as of the third quarter in 23. Source: Federal Reserve Board. 24 the State of the Nation s Housing 24

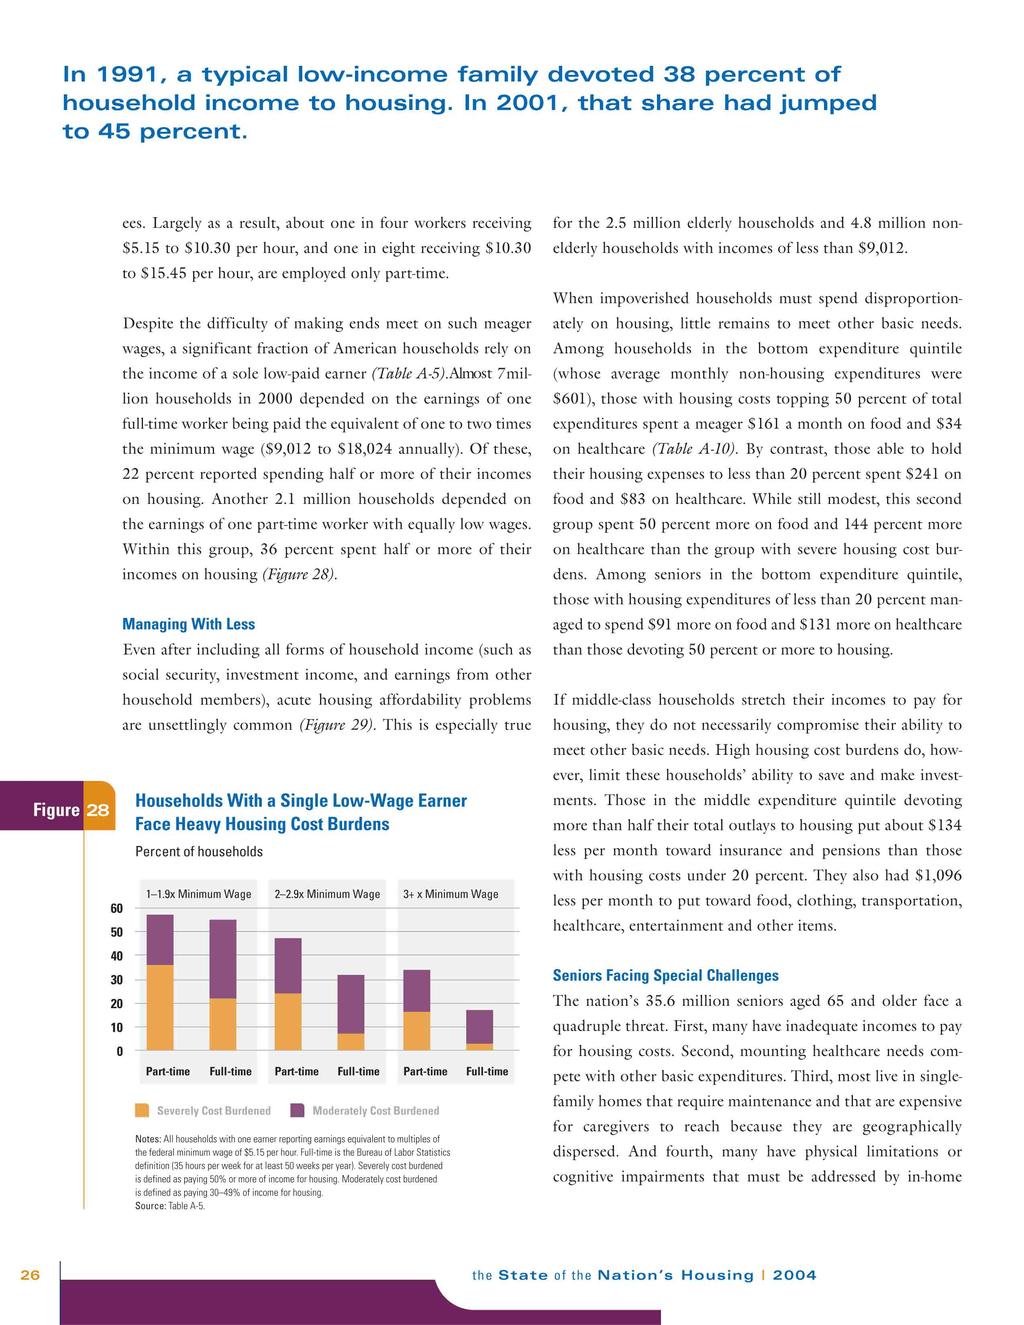
27 Housing Challenges Affordability is by far the most prevalent challenge, although crowding made a comeback in the 199s. In addition, 1 in 5 households live in housing that is seriously substandard. And, on any given night, at least 85, people are homeless. Over the course of a year, the number of Americans experiencing some period of homelessness many of them children is in the range of million. Despite unusually strong income growth in the 199s, an astonishing 95 million Americans had housing cost burdens or lived in crowded or inadequate conditions in 21. In fact, more than twice as many people in this country face housing problems as lack health insurance. The worst housing problems are overwhelmingly concentrated among those at the bottom of the income distribution (Figure 27). Nevertheless, the number of middle quintile households (earning $32, to $5,) who spent 3 percent or more of their incomes on housing jumped from 3.2 million in 1997 to 4.5 million in 21. Even full-time workers earning the minimum wage cannot cover the costs of a basic one-bedroom apartment at local fair market rents without topping 3 percent of income. Households depending on the earnings from a single lowwage job, especially if it is part-time, must therefore sacrifice other basic needs to remain in their homes. Many low-income seniors also face this struggle, including many on fixed incomes who have paid off their mortgages but are confronting rising property taxes. Figure Large Shares of Low-Income Americans Have Housing Problems Percent of bottom income quintile households Severe Cost Burden Moderate Cost Burden Structural Inadequacy Crowded Conditions Multiple Housing Problems Notes: Severely cost-burdened households are those spending 5% or more of monthly income on housing. Moderately cost burdened households are those spending 3 49% of monthly income on housing. Structural inadequacy is defined by HUD. Crowded households are those with more than one person per room. The cut-off for the bottom income quintile in 21 was $17,5. Source: JCHS tabulations of the 21 American Housing Survey. Low-Wage Worker Woes Many of the nation s most urgent housing challenges arise from what might be called an income problem. The millions of low-wage jobs that the economy creates do not provide enough income to enable workers to afford even the most modest housing. The 2 Census reported that about 128 million workers earned at least the equivalent of the federal minimum wage of $5.15 an hour. Of these, about 32 percent earned merely $5.15 to $1.3 an hour (one to two times the minimum wage), while another 26 percent earned $1.3 to $15.45 an hour (two to three times the minimum wage). Many of this group work part-time because their employers do not want to provide the same level of benefits they offer full-time employ- 25
28
29 Figure 29 Even Households With Full-Time Equivalent Minimum Wage Incomes Have Affordability Problems Percent of households 1 Elderly Non-Elderly x 1 1.9x 2 2.9x 3+ x.9x 1 1.9x 2 2.9x 3+ x Household Income in Full-Time Minimum Wage Equivalents Severely Cost Burdened Moderately Cost Burdened Notes: Elderly is defined as age 65 and older. For other definitions, see note in Figure 28. Source: JCHS tabulations of the 2 Census Supplemental Survey. care or structural modifications. In the 2 Census, for example, 9.5 million seniors reported a physical disability and 3.6 million reported a mental disability. More than a third of the 21.8 million households with heads aged 65 or older are in the bottom income quintile (incomes at or below $17,5 as measured by the 21 American Housing Survey). Of these, about 7 percent are homeowners. In 21, 18 percent of elderly homeowners spent half or more of their incomes on housing. The share of severely costburdened elderly renters was even higher at 38 percent. Elderly renters are of particular concern because they typically do not have any home equity to tap into to meet basic needs. According to the 21 Survey of Consumer Finances, 46 percent of elderly renters in the bottom income quintile (defined in that survey as $16, or less) had net wealth of less than $1, and 35 percent had less than $25. Most low-income seniors moved into their homes before they reached their 6s. Since many of these homes are not centrally located, it can be expensive for care providers to reach them (Figure 3). In addition, because of their low fixed incomes, many seniors find it difficult to make important repairs to their homes. Although their units are older and in poorer condition on average than those of younger homeowners, bottom quintile seniors (with incomes at or below $17,5) spent $2,465 less on major replacements, such as a roof or heating system, in 2 1 than other homeowners. Many seniors also lack the home modifications that would ensure their comfort and safety. These structural modifications range from minor improvements, such as satisfactory lighting and low-slip surfaces, to more significant changes, such as grab bars, stair lifts, and widened passageways. In 1995 (the last time seniors were surveyed about home modifications), only about half of those with limited mobility had at least one of the home modifications they needed and a much smaller share had all the features they needed. Still, many seniors are reluctant to move, preferring instead to age in place close to family and friends while relying on home healthcare, transportation and meal delivery services. In fact, only a small percentage of seniors live in assisted-living facilities. Although such settings can provide special services more efficiently than in-home care, they are too expensive for lowand moderate-income seniors to afford. 27
30 Crowding Creeps Back Up After decreasing steadily since the 196s, the problem of crowding is once again on the rise. According to the Fannie Mae Foundation, the number of crowded households (with more than one person per room) climbed by 9, during the 198s and another 1.5 million during the 199s. By 2, 6.1 million households (5.8 percent) lived in crowded conditions the largest number since 196. Immigrants are far more likely to live in crowded housing than the native-born (Figure 31). Overall, the share of foreignborn households experiencing such conditions is 26 percent, compared with only 3 percent of the native-born (Table A-8). Moreover, the problem of crowding is not restricted only to the higher-cost metropolitan areas where many immigrants settle. Even in non-metro areas, 22 percent of foreign-born households live in crowded conditions. The return of crowding as a housing problem is almost entirely due to strong growth in foreign-born households. The rates of crowding among native-born whites, blacks, Hispanics and Asians/others have been flat since 198. And even among foreign-born whites, blacks and Hispanics, the incidence of crowding has been nearly unchanged since 199 and has in fact declined among foreign-born Asians. But because the share of foreign-born households is growing and immigrant households are more likely than the native-born to cope with high housing costs by doubling up, the overall incidence of crowding has increased. The Dwindling Low-Cost Stock The already-scarce supply of low-cost housing continues to shrink because of physical deterioration on the one hand and gentrification on the other. Government programs such as Low Income Housing Tax Credits (LIHTC), Housing Bonds, the HOME Investment Partnerships Program, Community Development Block Grants and the USDA Rural Housing Service are crucial to stave off further net losses. Administered largely by state housing finance agencies, the LIHTC program, for example, financed approximately 1.4 million affordable units between 1987 and 2. The HOME program has also helped to produce or rehabilitate hundreds of thousands of rental units since the early 199s, and is a vital tool for providing assistance to extremely low-income households. But long-term contracts for subsidized rental units continue to expire, placing huge demands on the limited supply. As a result, resources are increasingly put toward retaining rather Figure 3 Most Seniors in the Bottom Income Quintile Age in Place Age at move-in (Percent) And Live in Single-Family Homes Outside Central Cities Location of low-income seniors (Percent) Before Age 4 Age 4 49 Single-Family Home in Central City Single-Family Home in Suburb Age 5 6 Age 6 and Later Single-Family Home in Non-Metro Not in Single-Family Home Notes: Seniors in the bottom income quintile had incomes of $17,5 or less in 21. Seniors are householders 65 years of age and older. Source: JCHS tabulations of the 21 American Housing Survey. 28 the State of the Nation s Housing 24
31 Figure The Problem of Crowding Primarily Affects the Foreign-Born Share of households that are crowded (Percent) Hispanic Asian/Other Black White Foreign-Born Native-Born Notes: Crowded is defined as more than one person per room. White, black, and Asian/other householders are non-hispanic. Hispanic householders may be of any race. Asian/other includes Pacific Islanders, Aleuts and Native Americans. Source: JCHS tabulations of the 2 Census 1% PUMS. than expanding the stock of dedicated, subsidized rentals. Furthermore, many affordable housing units are in the hands of owners who would incur a significant tax upon sale of the property. Unless relieved of this exit tax, these owners will remain reluctant to sell their properties at a price that would allow community organizations to purchase and preserve the affordable units. Although preserving low-cost housing can be expensive (especially if lead paint abatement is involved), replacement is typically even more costly. Meanwhile, state and local government regulations add to the costs of building new affordable units by restricting development, dictating the minimum size and maximum densities of homes, and imposing other fees and costs. So far, limited attempts to ease burdensome housing development regulations have come up short. Looking Ahead Even at current levels, housing assistance programs reach only a small fraction of the lowest-income households who are in desperate need. According to the National Low Income Housing Coalition, three-fourths of eligible households receive no assistance. Nonetheless, the pressures to cut rental assistance for extremely low-income families and eliminate the HOPE VI public housing revitalization program are mounting. A proposal is now on the table to cap tenant rental assistance funds at a level that does not keep pace with changes in housing costs and distributes the funds solely through block grants to public housing authorities. With rents rising ahead of inflation in many major metropolitan areas, this move would put many tenants at risk of losing assistance. In addition, this plan would reduce property income and thus owners ability to support debt, which in turn would threaten both new development and investment in existing rental housing. In the end, even fewer low-income households would be served. In the meantime, the economy continues to generate strong and growing demand for low-wage workers. According to the Bureau of Labor Statistics (BLS), the median wages in the industries adding the most jobs since the recession are fully 21 percent lower than those in the industries losing the most jobs. Over the next 1 years, the BLS expects 11 of the 2 fastest-growing occupations to be service jobs paying a median wage of less than $2, per year. Even households with better-paying jobs, though, cannot or do not adequately invest to fund a comfortable retirement. And within the non-working population, millions of seniors, the disabled, and others continue to live in poverty despite government transfer payments. Unfortunately, there is little hope of relief on any of these fronts. Attempts to raise the minimum wage have met with stiff resistance, and the talk in Washington has shifted from strengthening the safety net to curbing benefits. Along with the looming shortfall in the Social Security fund, Medicare and Medicaid expenses are set to soar when the baby boomers start to retire at the end of this decade. Even at the peak of the full-employment economy in the late 199s, housing problems in the nation failed to improve and some even worsened. Without fundamental changes, these challenges will continue to escalate, further dividing the twothirds of Americans who are well-housed and the remaining third who are not including a substantial minority who must struggle simply to keep a roof over their heads and meet other basic needs. 29

32 Appendix Tables Table A-1 Income and Housing Costs: Table A-2 Housing Market Indicators: Table A-3 Numbers and Shares of Foreign-Born Households by State: 2 Table A-4 Terms on Conventional Single-Family Mortgages: Table A-5 Housing Cost Burdens of Single-Earner Households by Earnings and Employment Status: 2 Table A-6 Homeownership Rates by Age and Race/Ethnicity: Table A-7 Home Purchase and Refinance Lending: Table A-8 Crowded Households by Nativity, Race/Ethnicity and Location: Table A-9 Distribution of Households by Income Quartiles and Race/Ethnicity: Table A-1 Average Monthly Non-Housing Spending by Expenditure Quintiles: 21 Table A-11 Change in Rental Stock by Structure Type and Region: Table A-12 Foreign-Born Households by Location and Year of Arrival: 2 The following information can be downloaded in Microsoft Excel format from the Joint Center s website at Table W-1 Interim Joint Center Household Projections: Table W-2 Home Prices by Region and Metropolitan Area: Table W-3 Median Net Wealth of Owner and Renter Households: Table W-4 Absorption Rates and Asking Rents for Newly Constructed Apartments: Table W-5 Turnover of Occupied Housing Units: 199 and 2 Table W-6 Numbers and Shares of Foreign-Born Households by State and Tenure: 2 Table W-7 Characteristics of Foreign-Born Households by Region of Origin: 2 Table W-8 Permit Growth as a Share of 199 Housing Stock by Metro Size: Table W-9 Effective Rents by Metropolitan Area: Table W-1 Earning Gaps among Full-Time Workers by Gender: the State of the Nation s Housing 24
33 Table A-1 Income and Housing Costs: dollars Monthly Income Homebuyer Costs Renter Costs Cost as Percent of Income Homebuyers Renters Before-Tax After-Tax Before-Tax After-Tax Home Mortgage Mortgage Mortgage Contract Gross Mortgage Mortgage Contract Gross Year Owner Renter Price Rate (%) Payment Payment Rent Rent Payment Payment Rent Rent ,161 2, , ,137 2, , ,151 2,49 124, ,195 2, , ,21 2, , , ,944 2, , , ,831 2, , ,334 1, ,837 2, , ,323 1, ,923 2, , , ,26 2,32 118, , ,133 2, , , ,279 2, , ,36 2, , ,33 2, , ,387 2,51 134, , ,258 2, , , ,195 2,33 129, ,163 2, , ,128 2, , ,169 2, , ,29 2,27 128, ,28 2,29 13, ,377 2, , ,58 2, , ,67 2, , ,56 2,49 146, ,467 2, , ,442 2, , ,385 2,388 17, Notes: All dollar amounts are expressed in 23 constant dollars using the Bureau of Labor Statistics Consumer Price Index for All Urban Consumers (CPI-U). Owner and renter median incomes through 22 from Current Population Survey P6 published reports. Renters exclude those paying no cash rent. 23 incomes estimated from annual percent change in HUD median family income applied to 22 CPS income for all households and adjusted by 3-year average ratio of owner and renter incomes to all household income. Home price is the 23 median sales price of existing single-family homes determined by the National Association of Realtors indexed by the Freddie Mac Conventional Mortgage Home Price Index. Mortgage rates are from the Federal Housing Finance Board Monthly Interest Rate Survey. Mortgage payments assume a 3-year mortgage with 1% down. After-tax mortgage payment equals mortgage payment less tax savings of homeownership. Tax savings are based on the excess of housing (mortgage interest and real-estate taxes) plus non-housing deductions over the standard deduction. Non-housing deductions are set at 5% of income through 1986, 4.25% in 1987, and 3.5% from 1988 on. Contract rent equals median 21 contract rent from the American Housing Survey, indexed by the CPI residential rent index with adjustments for depreciation in the stock before Gross rent is equal to contract rent plus fuel and utilities. 31
34 Table A-2 Housing Market Indicators: dollars Sales Price Residential Upkeep Permits 1 Starts 2 Size 3 Single-Family Homes and Improvements 6 Vacancy Rates 7 Thousands Thousands Median Square Feet 23 Dollars Millions of 23 Dollars Percent Single- Multi- Single- Multi- Manu- Single- Multi- Owner- Year family family family family factured family family New 4 Existing 5 occupied Rental For Sale For Rent , , ,385 65,17 27, , , ,29 119,716 74,634 27, , , , , ,459 79,574 24, , , , ,5 132,194 85,36 3, , , ,48 133,342 89,343 29, , , ,58 9,836 27, , ,85 121,893 78,4 28, , ,88 118,31 72,847 26, , , , ,48 75,591 27, , , , ,72 82,839 42, , , , ,689 87,785 52, , , , ,3 125,776 98,663 59, , , , , ,946 95,16 62, , , , ,638 15,538 6, , , , ,561 97,928 62, , ,46 131,962 94,76 67, , , ,126 9,157 55, , , , ,84 99,259 52, , ,945 1,5 171, ,85 11,614 53, , , ,94 1,15 175, , ,554 49, , ,92 1,4 175,22 128,584 11,39 49, , , ,95 1,3 173,374 13,44 13,822 5, , , ,975 1,5 174,41 132,287 17,72 45, , , , 1,2 176,65 137,3 112,26 38, , , ,25 1,54 18, ,552 19,65 48, , , ,79 1,91 182, , ,751 51, , , ,12 1,94 183, , ,914 49, , , ,115 1,92 188,78 162, ,277 52, , , ,126 1,17 195, 17, 119,919 56, Note: All value series are deflated by the Bureau of Labor Statistics Consumer Price Index for All Urban Consumers (CPI-U). Sources: 1. US Census Bureau, Construction Statistics, New Residential Construction, New Privately Owned Housing Units Authorized by Building Permits, (as of May 24). 2. US Census Bureau: Construction Statistics, New Residential Construction, New Privately Owned Housing Units Started, (as of May 24); and Manufactured Housing Statistics Placements of New Manufactured Homes, (as of May 24). Manufactured housing starts defined as placements of new manufactured homes. 3. US Census Bureau, Construction Statistics, New Residential Construction, New Privately Owned Housing Units Started in the United States, by Intent and Design, (as of May 24). 4. New home price is the 23 national median new home price from the US Census Bureau, indexed by the US Census Bureau, Construction Statistics, New Residential Sales, Price Indexes of New One-Family Houses Sold Including Value of the Lot, (as of May 24). 5. Existing home price is the 23 median sales price of existing single-family homes determined by the National Association of Realtors, indexed by the Conventional Mortgage Home Price Index from Freddie Mac. 6. US Census Bureau, Construction Statistics, Residential Improvements, Expenditures by Region and Property Type, (as of May 24). 7. US Census Bureau, Housing Vacancy Survey. 8. US Census Bureau, Construction Statistics, Value of Construction Put in Place, Annual Value of Private Construction Put in Place, (as of May 24). Note that figures on residential fixed investment in the text are from the Bureau of Economic Analysis, National Income and Product Accounts, because they are discussed in the context of Gross Domestic Product. 9. US Census Bureau, Construction Statistics, New Residential Sales, Houses Sold by Region, (as of May 24). 1. National Association of Realtors, Existing Single-Family Home Sales. 32 the State of the Nation s Housing 24
35 Table A-3 Numbers and Shares of Foreign-Born Households by State: 2 Value Put in Place 8 Home Sales Billions of 23 Dollars Thousands Single- Multi- Additions & family family Alterations New 9 Existing 1 11,368 22,843 52, , ,832 22,345 56, ,64 188,91 3,415 6, ,65 25,36 36,213 68, , ,131 43,123 68, , ,173 37,39 68, ,973 15,188 35,343 6, ,419 79,57 29,627 52, ,99 133,962 41,468 57, , , 49,978 71, , ,372 48,83 76, , ,818 52,18 93, , ,857 41,225 92, , ,789 34,682 96, , ,443 33,96 9, , ,921 27,1 83, , ,321 2,464 69, ,22 159,969 17,172 84, ,52 178,427 13,737 94, ,82 21,517 17,482 12, , ,346 21,598 91, ,812 2,289 23,834 15, ,196 2,828 26,233 14, , ,1 27,74 12, ,97 247,215 3,299 19, ,25 253,14 3, , , ,791 31, , , ,949 33,33 125, ,566 36,553 34,86 125,179 1,86 6,1 Percent 2 Number Total Percent Foreign-Born Households Foreign-Born Total 12,35,54 15,48,11 11 California 3,228,687 11,55, New York 1,593,868 7,56, New Jersey 592,549 3,64, Hawaii 72,83 43, Florida 1,12,426 6,338, Nevada 111,432 75, Texas 1,92,95 7,391, Massachusetts 334,356 2,444, Rhode Island 53,445 48,52 13 Illinois 596,29 4,591, DC 31,87 248, Connecticut 162,31 1,31, Arizona 235,23 1,91, Maryland 27,589 1,981,797 1 Washington 236,44 2,272,632 1 New Mexico 63,58 677,722 9 Colorado 136,541 1,658,531 8 Oregon 18,184 1,333,258 8 Virginia 215,791 2,698,832 8 Utah 52,985 71,254 8 Georgia 194,669 3,6,962 6 Michigan 232,492 3,785,89 6 Delaware 17, ,787 6 Alaska 11, ,11 5 Minnesota 96,98 1,894,646 5 New Hampshire 22, ,799 5 Kansas 49,948 1,37,782 5 Idaho 22, ,733 5 North Carolina 145,717 3,132,527 5 Vermont 11,1 24,916 5 Pennsylvania 216,162 4,776,397 5 Nebraska 26, ,777 4 Oklahoma 48,458 1,341,625 4 Wisconsin 73,897 2,84,87 4 Ohio 153,32 4,444,389 3 Indiana 77,528 2,335,676 3 Maine 15,28 518,51 3 Louisiana 47,617 1,656,249 3 Tennessee 62,35 2,232,59 3 Missouri 6,43 2,194,33 3 South Carolina 41,882 1,533,597 3 Iowa 31,232 1,148,71 3 Arkansas 26,636 1,43,258 3 Wyoming 4,98 193,856 2 Alabama 32,899 1,736,817 2 Kentucky 29,791 1,59,664 2 Montana 6, ,928 2 South Dakota 4,758 29,98 2 North Dakota 4,83 257,21 2 Mississippi 15,154 1,46,59 1 West Virginia 6, ,119 1 Note: See Table W-6 on the JCHS website for the breakdown by owners and renters. Source: JCHS tabulations of the 2 Census 1% PUMS. 33
36 Table A-4 Terms on Conventional Single-Family Mortgages: Annual averages, all homes Percent of Loans With Mortgage Loan Purchase Price Loan-to-Price Effective Interest Term to Amount (Thousands (Thousands of Loan-to-Price Ratio Adjustable Year Rate (%) Maturity (Years) of 23 dollars) 23 dollars) Ratio (%) More than 9% Rates na na Notes: The effective interest rate includes the amortization of initial fees and charges. na indicates data not available. Loans with adjustable rates do not include hybrid products. Source: Federal Housing Finance Board, Monthly Interest Rate Survey. Table A-5 Housing Cost Burdens of Single-Earner Households by Earnings and Employment Status: 2 Annual Averages, All Homes Multiples of Work Single-Earner Households Not Cost Moderately Severely Minimum Wage Status (Thousands) Burdened (%) Cost Burdened (%) Cost Burdened (%).9x Total 5, Full Time 3, Part Time 1, x Total 9, Full Time 6, Part Time 2, x Total 7, Full Time 6, Part Time x Total 14, Full Time 12, Part Time 1, All Total 36, Full Time 29, Part Time 6, Notes: Single-earner households are those in which only one household member, and not necessarily the householder, reported working for a wage in Per hour wage of earners estimated from annual earnings divided by weeks worked and usual hours worked per week. Minimum wage is $5.15 per hour. Full-time year-round workers are defined by the Bureau of Labor Statistics as working at least 35 hours in a usual work week and at least 5 weeks a year. The equivalent annual income for a full-time earner at the minimum wage was $9,12. Moderately (severely) cost-burdened households spend 3 49% (5% or more) of income on monthly housing expenses. Cost burden calculated from share of total income (earnings, interest and transfer payments) spent on monthly housing costs. Source: JCHS tabulations of the 2 Census Supplemental Survey. 34 the State of the Nation s Housing 24
37 Table A-6 Homeownership Rates by Age and Race/Ethnicity: Percent Total US White Under Age Age Age Age Age Age 75 and Over Total Black Under Age Age Age Age Age Age 75 and Over Total Hispanic Under Age Age Age Age Age Age 75 and Over Total Asian/Other Under Age Age Age Age Age Age 75 and Over Total All Races/Ethnicities Under Age Age Age Age Age Age 75 and Over Notes: White, black and Asian/other are non-hispanic. Hispanic householders may be of any race. Asian/other includes Pacific Islanders, Aleuts and Native Americans. In 23 a multi-race category was introduced. Only 1.12% of householders reported multi-race. Their homeownership rates are: 3.% for those under age 35; 58.2% for age 35 44; 67.% for age 45 54; 7.3% for age 55 64; 8.7% for age 65 74; 73.4% for age 75 and over; and 55.% for the total. Data in this table are net of the.86% of homeowners who reported multi-race. In 22, the data were rebenchmarked to the 2 Census. Caution should be used in interpreting year-over-year changes since 21 for certain age/race categories due to small sample sizes, rebenchmarking, and the introduction of the new multi-race category. Sources: Total US homeownership rate from the Census Bureau s Housing Vacancy Survey annual estimates; all other data from JCHS tabulations of the March Current Population Surveys. 35
38 Table A-7 Home Purchase and Refinance Lending: Thousands Conventional Prime Subprime Government Manufactured Housing All Home Purchase Loans 1, , , Borrower Characteristics White 1,4.1 1, , Minority Low-Income Moderate-/High-Income 1, , , Neighborhood Characteristics Predominantly White Predominantly Minority , , Low-Income High-Income ,78.1 1, Low-Income/Predominantly White High-Income/Predominantly White Low-Income/Predominantly Minority High-Income/Predominantly Minority All Refinance Loans 4,85.6 1, , Borrower Characteristics White 3, , Minority Low-Income , Moderate-/High-Income 3, , Neighborhood Characteristics Predominantly White 1, , Predominantly Minority Low-Income High-Income 1, , Low-Income/Predominantly White High-Income/Predominantly White Low-Income/Predominantly Minority High-Income/Predominantly Minority Notes: Includes only loans made in metropolitan areas as defined by the Office of Management and Budget for 1993 Home Mortgage Disclosure Act (HMDA) reporting. Low-income borrowers have incomes less than 8% of area median income. Moderate-/high-income borrowers have incomes of 8% or greater than area median. Predominantly white neighborhoods were less than 1% minority in 199. Predominantly minority neighborhoods were 5% or more minority as of 199. Low-income neighborhoods had tract median incomes less than 8% of metro area median in 199. High-income neighborhoods had tract median incomes of 12% or greater than metro area median. Subprime lending is an estimate based on a HUDmaintained list of subprime lending specialists. Over the period 1993 to 21, the number of loans with race missing increased by nearly 4, and 1.6 million for home purchase and refinance loans, respectively. In 21 information on borrower race was missing for some 12.1% of home purchase loans and 18.6% of refinance loans. Source: JCHS tabulations of enhanced HMDA database. 36 the State of the Nation s Housing 24
39 Table A-8 Crowded Households by Nativity, Race/Ethnicity and Location: Rates of crowding (Percent) Foreign-Born Native-Born White Black Hispanic Asian/Other Total White Black Hispanic Asian/Other Total US New York Los Angeles San Francisco Chicago Miami New York Los Angeles San Francisco Chicago Miami Notes: Crowded households have more than one person per room. White, black and Asian/other households are non-hispanic. Hispanic householders may be of any race. Asian/other includes Pacific Islanders, Aleuts and Native Americans. Metro areas shown have the largest numbers of foreign-born households. Source: JCHS tabulations of the 197,198,199 and 2 Census 1% PUMS. Table A-9 Distribution of Households by Income Quartiles and Race/Ethnicity: Rates of crowding by race Number of Households (Thousands) Share of Households (Percent) White Quartile 1 (Low) 15,5 16,29 17, Quartile 2 16,75 18,6 19, Quartile 3 17,77 19,49 2, Quartile 4 (High) 18,53 2,65 22, All Quartiles 68,1 75,3 79, Black Quartile 1 (Low) 3,866 4,527 4, Quartile 2 2,29 2,674 3, Quartile 3 1,564 2,42 2, Quartile 4 (High) 1,24 1,286 1, All Quartiles 8,744 1,529 13, Hispanic Quartile 1 (Low) 1,293 2,187 3, Quartile 2 1,162 1,772 2, Quartile ,413 2, Quartile 4 (High) , All Quartiles 3,96 6,219 9, Asian/Other Quartile 1 (Low) Quartile Quartile , Quartile 4 (High) , All Quartiles 1,612 2,529 4, Notes: White, black and Asian/other households are non-hispanic. Hispanic householders may be of any race. Asian/other includes Pacific Islanders, Aleuts and Native Americans. Caution should be used in interpreting year-over-year changes for certain age/race categories because of small sample sizes. The cut-offs for the income quartiles were $9,11, $17,7 and $28,484 in 198, $15,161, $29,9 and $49,529 in 199, and $21,521, $42,24 and $73, in 2. All figures in 23 dollars. Source: JCHS tabulations of the March 1981, 1991 and 21 Current Population Surveys. 37
40 Table A-1 Average Monthly Non-Housing Outlays by Household Expenditure Quintiles: dollars Average Monthly Expenditures Quintile 1 (Low) Quintile 2 Share of Expenditures on Housing Share of Expenditures on Housing <2% 2-29% 3-5% >5% All <2% 2-29% 3-5% >5% All All Total Non-Housing Expenditures ,53 1,287 1, ,187 Food Clothes Transportation Healthcare Personal Insurance & Pensions Entertainment Other Elderly Total Non-Housing Expenditures ,479 1,264 1,2 61 1,29 Food Clothes Transportation Healthcare Personal Insurance & Pensions Entertainment Other Non-Elderly Total Non-Housing Expenditures ,514 1,295 1, ,179 Food Clothes Transportation Healthcare Personal Insurance & Pensions Entertainment Other Notes: Quintiles are defined by total expenditures rather than income because one out of five households in the survey fail to report income. Housing costs include mortgage principal and interest, insurance, taxes, maintenance, rents, and utilities. Transportation expenditures were adjusted for those who paid cash to buy cars and calculated at 1% of the cash payment. Source: JCHS tabulations of the Consumer Expenditure Survey, using the Quarterly Interview Survey data for calendar year the State of the Nation s Housing 24
41 Quintile 3 Quintile 4 Quintile 5 (High) Share of Expenditures on Housing Share of Expenditures on Housing Share of Expenditures on Housing <2% 2-29% 3-5% >5% All <2% 2-29% 3-5% >5% All <2% 2-29% 3-5% >5% All 2,219 1,96 1, ,796 3,264 2,786 2,297 1,51 2,73 6,482 5,252 4,19 2,967 5, ,474 1, , ,959 1, ,435 2,26 1,879 1, ,838 3,274 2,76 2,22 1,348 2,76 6,77 8,537 3,944 2,434 6, ,195 1, , ,724 4,637 1, ,565 2,223 1,911 1,564 1,23 1,787 3,262 2,788 2,36 1,53 2,699 6,445 5,94 4,117 3,27 5, ,511 1, , ,86 1, ,345 39
42 Table A-11 Change in Rental Stock by Structure Type and Region: Thousands of occupied and vacant for rent units Net Gain/Loss Built Total Units Lost (Gained) All Rental Units Total 36,243 37,36 1,117 3,333 2,216 Northeast 7,653 7, Midwest 7,979 7, ,21 South 12,19 12, , West 8,593 9, Single-Family Units Total 13,5 13, , Northeast 1,43 1, (29) Midwest 2,788 2, South 5,494 5, West 3,293 3, (1) 2- to 4-Unit Structures Total 8,335 7, ,341 Northeast 2,479 2, Midwest 2,94 1, South 2,13 1, West 1,659 1, Unit Structures Total 14,93 16,16 1,257 1, Northeast 3,744 3, (17) Midwest 3,97 3, South 4,421 5, West 3,64 4, Notes: Total units gained/lost is the net change in units minus those built 1992 to 21, and includes conversions from owner-occupied to rental and vice versa. Total units gained, shown in parentheses, result when net conversions are greater than permanent losses from the stock counts are weighted with 1991 weights, 21 counts and count of units built 1992 to 21 are weighted with 21 weights. Source: JCHS tabulations of the 1991 and 21 American Housing Surveys. Table A-12 Foreign-Born Households by Location and Year of Arrival: 2 Thousands of units (occupied and vacant for rent) Foreign-Born Households (Thousands) Foreign-Born Share of All Households (%) As a Share of All Households Arrived Arrived Arrived Arrived All Foreign-Born Location (Thousands) Total After 199 Before 199 Total After 199 Before 199 Nationally (%) Top Ten Gateway Metro Areas New York 6,272 1, , Los Angeles 4,73 1, , Chicago 3, San Francisco 1, Miami Houston 1, Washington DC 1, Dallas 1, Boston 1, Atlanta 1, Other Metros by Region Northeast 9, Midwest 14, South 19,314 1, , West 13,125 2, , Non-Metro Areas by Region Northeast 1, Midwest 5, South 7, West 2, Metro Status Unidentifiable 7, US Total 15,48 12,59 3,417 8, Source: JCHS tabulations of the 2 Census 5% PUMS. 4 the State of the Nation s Housing 24

43 Prepared by the Barbara Alexander Martha Andrews William Apgar Kermit Baker Pamela Baldwin Michelle Barnes Eric Belsky Allegra Calder Baoyan Cheng James DeNormandie Zhu Xiao Di Cushing Dolbeare Rachel Bogardus Drew Elizabeth England Gary Fauth Jack Goodman Ruby Henry Jackie Hernandez Sonya Lai Alvaro Martin-Guerrero George Masnick John Meyer Rachel Roth Nicolas Retsinas Rebecca Russell Laurel Trayes Alexander von Hoffman Margaret Wei Design and Project Management Oxygen For additional copies, please contact 133 Massachusetts Avenue, 5th Floor Cambridge, MA

44 133 Massachusetts Avenue, 5th Floor, Cambridge, MA p f
DEMOGRAPHIC DRIVERS. Household growth is picking up pace. With more. than a million young foreign-born adults arriving
 DEMOGRAPHIC DRIVERS Household growth is picking up pace. With more than a million young foreign-born adults arriving each year, household formations in the next decade will outnumber those in the last
The state of the nation s Housing 2013
 The state of the nation s Housing 2013 Fact Sheet PURPOSE The State of the Nation s Housing report has been released annually by Harvard University s Joint Center for Housing Studies since 1988. Now in
SLUGGISH HOUSEHOLD GROWTH
 3 Demographic Drivers Household growth has yet to rebound fully as the weak economic recovery continues to prevent many young adults from living independently. As the economy strengthens, though, millions
Demographic Drivers. Joint Center for Housing Studies of Harvard University 11
 3 Demographic Drivers Household formations were already on the decline when the recession started to hit in December 27. Annual net additions fell from 1.37 million in the first half of the decade to only
INTRODUCTION AND SUMMARY
 1 INTRODUCTION AND SUMMARY Rising house prices and incomes, an aging housing stock, and a pickup in household growth are all contributing to today s strong home improvement market. Demand is robust in
SINGLE-FAMILY SLOWDOWN
 1 Executive Summary With promising increases in home construction, sales, and prices, the housing market gained steam in early 13. But when interest rates notched up at mid-year, momentum slowed. This
HOMEOWNERSHIP. Low interest rates, stronger job growth, and. rapid house price appreciation all helped to. sustain the homeownership boom through its
 HOMEOWNERSHIP Low interest rates, stronger job growth, and rapid house price appreciation all helped to sustain the homeownership boom through its 12th year. With well over one million owners added in
THE STATE OF THE NATION S HOUSING. Joint Center for Housing Studies of Harvard University
 THE STATE OF THE NATION S HOUSING 26 Joint Center for Housing Studies of Harvard University Joint Center for Housing Studies of Harvard University Graduate School of Design John F. Kennedy School of Government
THE HOUSING MARKET REVIVAL
 1 Executive Summary The long-awaited housing recovery finally took hold in 2012, heralded by rising home prices and further rental market tightening. While still at historically low levels, housing construction
National Housing Market Summary
 1st 2017 June 2017 HUD PD&R National Housing Market Summary The Housing Market Recovery Showed Progress in the First The housing market improved in the first quarter of 2017. Construction starts rose for
Homeownership. Cycling Demand
 4 Homeownership Falling home prices, stringent credit standards, and stubbornly high inventories of vacant homes roiled homeownership markets throughout 7 and into 8. Homeowners whose mortgage interest
Weakness in the U.S. Housing Market Likely to Persist in 2008
 Weakness in the U.S. Housing Market Likely to Persist in 2008 Commentary by Sondra Albert, Chief Economist AFL-CIO Housing Investment Trust January 29, 2008 The national housing market entered 2008 mired
GRIM CONSTRUCTION AND SALES REPORTS
 2 Housing Markets Despite the most favorable mortgage rates in decades and two rounds of homebuyer tax credits, major housing market indicators stood at or near record lows in 2010. Construction was particularly
Executive Summary. Joint Center for Housing Studies of Harvard University 1
 1 Executive Summary Despite unprecedented federal efforts to jumpstart the economy and help homeowners keep up with their mortgage payments, home prices continued to fall and foreclosures continued to
From Crisis to Transition Demographic trends and American housing futures, with lessons from Texas
 From Crisis to Transition Demographic trends and American housing futures, with lessons from Texas Rolf Pendall, Ph.D. The Urban Institute Presentation to the Bipartisan Housing Commission, San Antonio,
AND LABOR TRENDS EMERGING TRENDS IN THE REMODELING MARKET JOINT CENTER FOR HOUSING STUDIES OF HARVARD UNIVERSITY 11
 3INDUSTRY STRUCTURE AND LABOR TRENDS Remodeling contractors are experiencing a strong rebound, especially larger-scale firms that could take advantage of their size to gain market share during the downturn.
The State of the Nation s Housing Report 2017
 The State of the Nation s Housing Report 217 Tennessee Governor s Housing Conference Nashville, Tennessee September 2, 217 The Report s Major Themes National home prices have regained their previous peak,
Housing Recovery is Underway, But Not for Everyone
 Housing Recovery is Underway, But Not for Everyone Eric Belsky August 2013 Dallas, TX Housing Markets Have Corrected In Significant Ways Both price and quantity reductions have occurred Even after price
(Table A-2). Again, this is the first time in recorded history. Plumbing the Depths. Promising Signs. The State of the Nation s Housing 2010
. Again, this is the first time in recorded history. Plumbing the Depths. Promising Signs. The State of the Nation s Housing 2010") 2 Housing Markets Housing markets showed some signs of recovery in 29. The question now is whether the large overhang of vacant units combined with high unemployment and record foreclosures will allow
2 Housing Markets Housing markets showed some signs of recovery in 29. The question now is whether the large overhang of vacant units combined with high unemployment and record foreclosures will allow
Socio-economic Series Changes in Household Net Worth in Canada:
 research highlight October 2010 Socio-economic Series 10-018 Changes in Household Net Worth in Canada: 1990-2009 introduction For many households, buying a home is the largest single purchase they will
Investment Company Institute and the Securities Industry Association. Equity Ownership
 Investment Company Institute and the Securities Industry Association Equity Ownership in America, 2005 Investment Company Institute and the Securities Industry Association Equity Ownership in America,
JOINT CENTER FOR HOUSING STUDIES OF HARVARD UNIVERSITY
 6 Housing Challenges In the aftermath of the Great Recession, growing numbers of owners and renters alike cannot afford housing. Federal efforts to limit the fallout have managed to hold the line on homelessness
Update on Homeownership Wealth Trajectories Through the Housing Boom and Bust
 The Harvard Joint Center for Housing Studies advances understanding of housing issues and informs policy through research, education, and public outreach. Working Paper, February 2016 Update on Homeownership
Texas: Demographically Different
 FEDERAL RESERVE BANK OF DALLAS ISSUE 3 99 : Demographically Different A s the st century nears, demographic changes are reshaping the U.S. economy. The largest impact is coming from the maturing of baby
THE FINANCIAL SITUATIONS OF OLDER ADULTS
 4. Since THE FINANCIAL SITUATIONS OF OLDER ADULTS housing is typically the single largest item in the household budget, housing affordability has important repercussions for overall well-being. For homeowners,
Homeownership. The State of the Nation s Housing 2009
 Homeownership Entering 9, foreclosures were at a record high, price declines were keeping many would-be buyers on the sidelines, and tighter underwriting standards were preventing many of those ready to
The Impact of the Student Debt Crisis on Housing: Five Takeaways for the U.S. Real Estate Industry
 The Impact of the Student Debt Crisis on Housing: Five Takeaways for the U.S. Real Estate Industry By Cari Smith, Vice President, and Steven Wang, Senior Associate Between 2000 and 2014, the total volume
SPECIAL REPORT. TD Economics CONDITIONS ARE RIPE FOR AMERICAN CONSUMERS TO LEAD ECONOMIC GROWTH
 SPECIAL REPORT TD Economics CONDITIONS ARE RIPE FOR AMERICAN CONSUMERS TO LEAD ECONOMIC GROWTH Highlights American consumers have has had a rough go of things over the past several years. After plummeting
UNDER ATTACK TEXAS' MIDDLE CL ASS AND THE OPPORTUNITY CRISIS
 IDEAS & ACTION UNDER ATTACK TEXAS' MIDDLE CL ASS AND THE OPPORTUNITY CRISIS THE AMERICA N DREA M is about working hard in return for decent wages, economic stability, and being able to provide a better
Milwaukee's Housing Crisis: Housing Affordability and Mortgage Lending Practices
 University of Wisconsin Milwaukee UWM Digital Commons ETI Publications Employment Training Institute 2007 Milwaukee's Housing Crisis: Housing Affordability and Mortgage Lending Practices John Pawasarat
Florida: An Economic Overview
 Florida: An Economic Overview December 26, 2018 Presented by: The Florida Legislature Office of Economic and Demographic Research 850.487.1402 http://edr.state.fl.us Shifting in Key Economic Variables
A LOOK BEHIND THE NUMBERS
 KEY FINDINGS A LOOK BEHIND THE NUMBERS Home Lending in Cuyahoga County Neighborhoods Lisa Nelson Community Development Advisor Federal Reserve Bank of Cleveland Prior to the Great Recession, home mortgage
Home Mortgage Disclosure Act Report ( ) Submitted by Jonathan M. Cabral, AICP
 Submitted by Jonathan M. Cabral, AICP") Home Mortgage Disclosure Act Report (2008-2015) Submitted by Jonathan M. Cabral, AICP Introduction This report provides a review of the single family (1-to-4 units) mortgage lending activity in Connecticut
Home Mortgage Disclosure Act Report (2008-2015) Submitted by Jonathan M. Cabral, AICP Introduction This report provides a review of the single family (1-to-4 units) mortgage lending activity in Connecticut
Additional Slack in the Economy: The Poor Recovery in Labor Force Participation During This Business Cycle
 No. 5 Additional Slack in the Economy: The Poor Recovery in Labor Force Participation During This Business Cycle Katharine Bradbury This public policy brief examines labor force participation rates in
CEPR CENTER FOR ECONOMIC AND POLICY RESEARCH
 CEPR CENTER FOR ECONOMIC AND POLICY RESEARCH The Wealth of Households: An Analysis of the 2016 Survey of Consumer Finance By David Rosnick and Dean Baker* November 2017 Center for Economic and Policy Research
Managing Your Money: "Housing and Public Policy the Bubble, Present, and Future
 Managing Your Money: "Housing and Public Policy the Bubble, Present, and Future PLATO (Participatory Learning and Teaching Organization) J. Michael Collins UW Madison Center for Financial Security Overview
Socio-economic Series Long-term household projections 2011 update
 research highlight October 2011 Socio-economic Series 11-008 INTRODUCTION This Research Highlight presents an update of the projections of household growth for Canada reported in the 2009 Canadian Housing
Millennials Have Begun to Play Homeownership Catch-Up
 Millennials Have Begun to Play Homeownership Catch-Up Since the onset of the housing bust, bad news has inundated the homeownership market. The national homeownership rate has fallen to multi-decade lows,
CRS Report for Congress Received through the CRS Web
 Order Code RL33387 CRS Report for Congress Received through the CRS Web Topics in Aging: Income of Americans Age 65 and Older, 1969 to 2004 April 21, 2006 Patrick Purcell Specialist in Social Legislation
The Office of Economic Policy HOUSING DASHBOARD. March 16, 2016
 The Office of Economic Policy HOUSING DASHBOARD March 16, 216 Recent housing market indicators suggest that housing activity continues to strengthen. Solid residential investment in 215Q4 contributed.3
Adults in Their Late 30s Most Concerned More Americans Worry about Financing Retirement
 1 PEW SOCIAL & DEMOGRAPHIC TRENDS Adults in Their Late 30s Most Concerned By Rich Morin and Richard Fry Despite a slowly improving economy and a three-year-old stock market rebound, Americans today are
May 1965 CONSTRUCTION AND MORTGAGE MARKETS. Digitized for FRASER Federal Reserve Bank of St. Louis
 May 1965 CONSTRUCTION AND MORTGAGE MARKETS May 1965 outlays for new construction in April continued at the high established in the first quarter. Total outlays for the first 4 months of the year were moderately
A Divided Real Estate Nation
 Real Estate Reality Check Explanation of "What Happened" from the 26 Leadership Conference Boom ended August 2 Mortgage rates rose almost one point Affordability conditions deteriorated Speculative investors
AUGUST THE DUNNING REPORT: DIMENSIONS OF CORE HOUSING NEED IN CANADA Second Edition
 AUGUST 2009 THE DUNNING REPORT: DIMENSIONS OF CORE HOUSING NEED IN Second Edition Table of Contents PAGE Background 2 Summary 3 Trends 1991 to 2006, and Beyond 6 The Dimensions of Core Housing Need 8
JOINT CENTER FOR HOUSING STUDIES OF HARVARD UNIVERSITY
 1 Executive Summary After several false starts, there is reason to believe that 212 will mark the beginning of a true housing market recovery. Sustained employment growth remains key, providing the stimulus
UBS Leveraged Finance Conference
 UBS Leveraged Finance Conference Las Vegas, NV - May 12, 2005 2 Comment to Investors This presentation includes forwardlooking statements as characterized in the Private Securities Litigation Reform Act
Florida: An Economic Overview
 Florida: An Economic Overview August 21, 2013 Presented by: The Florida Legislature Office of Economic and Demographic Research 850.487.1402 http://edr.state.fl.us Key Economic Variables Improving Global
A Nation of Renters? Promoting Homeownership Post-Crisis. Roberto G. Quercia Kevin A. Park
 A Nation of Renters? Promoting Homeownership Post-Crisis Roberto G. Quercia Kevin A. Park 2 Outline of Presentation Why homeownership? The scale of the foreclosure crisis today (20112Q) Mississippi and
Freddie Mac Community Lender Presentation State of AAPI Housing August 23 rd, 2016
 Freddie Mac Community Lender Presentation State of AAPI Housing August 23 rd, 2016 TABLE OF CONTENTS I. Introduction to AREAA a. Brief History b. Current membership c. Geographic Distribution d. Policy
Joint Center for Housing Studies of Harvard University NATION S
 Joint Center for Housing Studies of Harvard University THE STA TE OF THE NATION S HOUSING 28 Joint Center for Housing Studies of Harvard University Graduate School of Design Harvard Kennedy School Principal
Now What? Key Trends from the Mortgage Crisis and Implications for Policy
 THE FUTURE OF FAIR HOUSING and FAIR CREDIT Sponsored by: W. K. KELLOGG FOUNDATION Now What? Key Trends from the Mortgage Crisis and Implications for Policy DAN IMMERGLUCK School of City and Regional Planning,
Florida: An Economic Overview
 Florida: An Economic Overview January 26, 2016 Presented by: The Florida Legislature Office of Economic and Demographic Research 850.487.1402 http://edr.state.fl.us Key Economic Variables Improving Economy
ECONOMIC CURRENTS. Look for little growth in the first half of High energy costs and cooling housing market a drag on near term growth
 T H E S T A T E O F T H E S T A T E E C O N O M Y ECONOMIC CURRENTS Look for little growth in the first half of 2006 High energy costs and cooling housing market a drag on near term growth MODERATE GROWTH
Florida: An Economic Overview
 Florida: An Economic Overview May 1, 2012 Presented by: The Florida Legislature Office of Economic and Demographic Research 850.487.1402 http://edr.state.fl.us Key Economic Variables Mixed Economy Turned
2019 Outlook. January
 2019 Outlook January 2019 0 Performance in the multifamily market remained healthy during 2018 and is expected to continue into 2019, but with more modest growth in comparison to recent years. The multifamily
Fast Facts & Figures About Social Security, 2005
 Fast Facts & Figures About Social Security, 2005 Social Security Administration Office of Policy Office of Research, Evaluation, and Statistics 500 E Street, SW, 8th Floor Washington, DC 20254 SSA Publication
U.S. Residential. Mortgage Default. Performance Update. & Market Analysis
 2016 U.S. U.S. RESIDENTIAL MORTGAGE DEFAULT PERFORMANCE UPDATE & MARKET ANALYSIS The residential mortgage servicing industry is worlds away from where it was six years ago at the peak of the housing crisis,
First Quarter 2016 Quarterly narrative REGIONAL SUMMARIES Fort Smith region Northwest Arkansas Central Arkansas Jonesboro
 First Quarter 2016 Quarterly narrative An independent economic analysis of four Arkansas metro areas: Central Arkansas Northwest Arkansas The Fort Smith region Jonesboro metro REGIONAL SUMMARIES Fort Smith
Don t Raise the Federal Debt Ceiling, Torpedo the U.S. Housing Market
 Don t Raise the Federal Debt Ceiling, Torpedo the U.S. Housing Market Failure to Act Would Have Serious Consequences for Housing Just as the Market Is Showing Signs of Recovery Christian E. Weller May
Women in the Labor Force: A Databook
 Cornell University ILR School DigitalCommons@ILR Federal Publications Key Workplace Documents 12-2011 Women in the Labor Force: A Databook Bureau of Labor Statistics Follow this and additional works at:
AIA / COMPENSATION REPORT Compensation Report 2015 SAMPLE CHAPTER
 NATIONAL REPORT Compensation Report 2015 4 Like employers in the broader construction industry, U.S. architecture firms are still recovering from the economic effects of the Great Recession. In recent
Roger W Ferguson, Jr: Economic progress and small business
 Roger W Ferguson, Jr: Economic progress and small business Speech by Mr Roger W Ferguson, Jr, Vice-Chairman of the Board of Governors of the Federal Reserve System, before the African American Chamber
Subprime Originations and Foreclosures in New York State: A Case Study of Nassau, Suffolk, and Westchester Counties.
 Subprime Originations and Foreclosures in New York State: A Case Study of Nassau, Suffolk, and Westchester Counties Cambridge, MA Lexington, MA Hadley, MA Bethesda, MD Washington, DC Chicago, IL Cairo,
New England Economic Partnership May 2013: Massachusetts
 Executive Summary and Highlights MASSACHUSETTS ECONOMIC OUTLOOK The Massachusetts economy is in the fourth year of the expansion that began in the summer of 2009. During this expansion, real gross state
High LTV Lending Conference
 High LTV Lending Conference Eric Belsky May 213 Chapel Hill, NC Homeownership Has Mattered Profoundly to Wealth Accumulation Even After Crude Control for Income 12 Median Net Worth of Middle Income Quintile
Out of the Shadows: Projected Levels for Future REO Inventory
 ECONOMIC COMMENTARY Number 2010-14 October 19, 2010 Out of the Shadows: Projected Levels for Future REO Inventory Guhan Venkatu Nearly one homeowner in ten is more than 90 days delinquent on his mortgage
Women in the Labor Force: A Databook
 Cornell University ILR School DigitalCommons@ILR Federal Publications Key Workplace Documents 9-2007 Women in the Labor Force: A Databook Bureau of Labor Statistics Follow this and additional works at:
Despite Growing Market, African Americans and Latinos Remain Underserved
 Despite Growing Market, African Americans and Latinos Remain Underserved Issue Brief September 2017 Introduction Enacted by Congress in 1975, the Home Mortgage Disclosure Act (HMDA) requires an annual
Indicators of a recovering economy Building permits through the roof
 Indicators of a recovering economy The resale and new home market continues to improve nationwide. The National Association of Realtors reported that previously-owned homes sold at an annual pace of 4.92
Population and Labor Force Projections for New Jersey: 2008 to 2028
 Population and Labor Force Projections for New Jersey: 2008 to 2028 by Sen-Yuan Wu, Division of Labor Market and Demographic Research Similar to other northern states, New Jersey has had slower population
The Real Estate Report Volume 41, Number 2 Fall 2017 GENERAL SUMMARY
 OVERVIEW GENERAL SUMMARY What are the demographic patterns of the market? What does the inventory look like? What are the characteristics of the labor market and the income patterns? In the long history
A Look at Tennessee Mortgage Activity: A one-state analysis of the Home Mortgage Disclosure Act (HMDA) Data
 Data") September, 2015 A Look at Tennessee Mortgage Activity: A one-state analysis of the Home Mortgage Disclosure Act (HMDA) Data 2004-2013 Hulya Arik, Ph.D. Tennessee Housing Development Agency TABLE OF CONTENTS
September, 2015 A Look at Tennessee Mortgage Activity: A one-state analysis of the Home Mortgage Disclosure Act (HMDA) Data 2004-2013 Hulya Arik, Ph.D. Tennessee Housing Development Agency TABLE OF CONTENTS
COMMERCIAL REAL ESTATE PRICES INCREASE A MODEST 1.1% IN FOURTH QUARTER AS PROPERTY PRICING LEVELS OFF IN DECEMBER
 FEBRUARY 2012 CCRSI RELEASE (With data through December 2011) COMMERCIAL REAL ESTATE PRICES INCREASE A MODEST 1.1% IN FOURTH QUARTER AS PROPERTY PRICING LEVELS OFF IN DECEMBER MULTIFAMILY LED ALL PROPERTY
TECHNICAL REPORT NO. 11 (5 TH EDITION) THE POPULATION OF SOUTHEASTERN WISCONSIN PRELIMINARY DRAFT SOUTHEASTERN WISCONSIN REGIONAL PLANNING COMMISSION
 THE POPULATION OF SOUTHEASTERN WISCONSIN PRELIMINARY DRAFT SOUTHEASTERN WISCONSIN REGIONAL PLANNING COMMISSION") TECHNICAL REPORT NO. 11 (5 TH EDITION) THE POPULATION OF SOUTHEASTERN WISCONSIN PRELIMINARY DRAFT 208903 SOUTHEASTERN WISCONSIN REGIONAL PLANNING COMMISSION KRY/WJS/lgh 12/17/12 203905 SEWRPC Technical
TECHNICAL REPORT NO. 11 (5 TH EDITION) THE POPULATION OF SOUTHEASTERN WISCONSIN PRELIMINARY DRAFT 208903 SOUTHEASTERN WISCONSIN REGIONAL PLANNING COMMISSION KRY/WJS/lgh 12/17/12 203905 SEWRPC Technical
JOINT CENTER FOR HOUSING STUDIES OF HARVARD UNIVERSITY
 JOINT CENTER FOR HOUSING STUDIES OF HARVARD UNIVERSITY THE STATE OF THE NATION S HOUSING 25 Joint Center for Housing Studies of Harvard University Graduate School of Design John F. Kennedy School of Government
Florida Economic Outlook State Gross Domestic Product
 Florida Economic Outlook The Florida Economic Estimating Conference met in July 2017 to revise the forecast for the state s economy. As further updated by the Legislative Office of Economic and Demographic
Women in the Labor Force: A Databook
 Cornell University ILR School DigitalCommons@ILR Federal Publications Key Workplace Documents 2-2013 Women in the Labor Force: A Databook Bureau of Labor Statistics Follow this and additional works at:
Metropolitan Washington Area Key Economic & Demographic Indicators
 Metropolitan Washington Area Key Economic & Demographic Indicators Arlington County Community Facilities Study March 11, 2015 Lisa A. Sturtevant, PhD Vice President of Research National Housing Conference
How Affordability Affects Housing s Spring Season
 MARCH 2017 How Affordability Affects Housing s Spring Season Recent indications of stronger growth convinced the Federal Reserve to raise the Federal funds rate this month and to signal further increases
District Economic. Structurally Deficient Bridges, 2001 (Percent)
") District Economic BY ROBERT LACY Apprehension about terrorism and political developments regarding Iraq cast a pall over the Fifth District economy in the last three months of. Many businesses continued
District Economic BY ROBERT LACY Apprehension about terrorism and political developments regarding Iraq cast a pall over the Fifth District economy in the last three months of. Many businesses continued
Multifamily Market Commentary May 2017
 Millions Multifamily Market Commentary May 2017 : Fundamentals Soften but Remain Healthy in First Quarter 2017 Seniors housing fundamentals softened modestly in the first quarter of 2017, with elevated
2015 Mortgage Lending Trends in New England
 Federal Reserve Bank of Boston Community Development Issue Brief No. 2017-3 May 2017 2015 Mortgage Lending Trends in New England Amy Higgins Abstract In 2014 the mortgage and housing market underwent important
Millennial Homeownership
 H O U S I N G F I N A N C E P O L I C Y C E N T E R R E S E A RCH REPORT Millennial Homeownership Why Is It So Low, and How Can We Increase It? Jung Choi Jun Zhu Laurie Goodman Bhargavi Ganesh Sarah Strochak
RENTAL MARKETS LOCALLY AND ACROSS THE COUNTRY: A YEAR OF CHANGE. Dr. Skylar Olsen, Senior Economist Zillow.com/research
 RENTAL MARKETS LOCALLY AND ACROSS THE COUNTRY: A YEAR OF CHANGE Dr. Skylar Olsen, Senior Economist Zillow.com/research 1 National rent appreciation has slowed significantly from a boom in 2015 Source:
The Province of Prince Edward Island Employment Trends and Data Poverty Reduction Action Plan Backgrounder
 The Province of Prince Edward Island Employment Trends and Data Poverty Reduction Action Plan Backgrounder 5/17/2018 www.princeedwardisland.ca/poverty-reduction $000's Poverty Reduction Action Plan Backgrounder:
Joseph S Tracy: A strategy for the 2011 economic recovery
 Joseph S Tracy: A strategy for the 2011 economic recovery Remarks by Mr Joseph S Tracy, Executive Vice President of the Federal Reserve Bank of New York, at Dominican College, Orangeburg, New York, 28
Banks at a Glance: Economic and Banking Highlights by State 4Q 2017
 Economic and Banking Highlights by State 4Q 2017 These semi-annual reports highlight key indicators of economic and banking conditions within each of the nine states comprising the 12th Federal Reserve
ICI RESEARCH PERSPECTIVE
 ICI RESEARCH PERSPECTIVE 1401 H STREET, NW, SUITE 1200 WASHINGTON, DC 20005 202-326-5800 WWW.ICI.ORG APRIL 2018 VOL. 24, NO. 3 WHAT S INSIDE 2 Mutual Fund Expense Ratios Have Declined Substantially over
Finland falling further behind euro area growth
 BANK OF FINLAND FORECAST Finland falling further behind euro area growth 30 JUN 2015 2:00 PM BANK OF FINLAND BULLETIN 3/2015 ECONOMIC OUTLOOK Economic growth in Finland has been slow for a prolonged period,
JOINT CENTER FOR HOUSING STUDIES OF HARVARD UNIVERSITY THE STATE OF THE NATION S HOUSING
 JOINT CENTER FOR HOUSING STUDIES OF HARVARD UNIVERSITY THE STATE OF THE NATION S HOUSING 2011 JOINT CENTER FOR HOUSING STUDIES OF HARVARD UNIVERSITY GRADUATE SCHOOL OF DESIGN JOHN F. KENNEDY SCHOOL OF
LISC Building Sustainable Communities Initiative Neighborhood Quality Monitoring Report
 LISC Building Sustainable Communities Initiative Neighborhood Quality Monitoring Report Neighborhood:, Kansas City, MO The LISC Building Sustainable Communities (BSC) Initiative supports community efforts
After housing s best year in a decade, what s next?
 DECEMBER 2016 After housing s best year in a decade, what s next? The year is drawing to a close and it is time to take stock of where housing and mortgage markets have been and where they likely are headed.
2014: Started with a Deep Hole, Ending with a Whimper Growth Received an Upgrade But Some Payback is in the Cards
 2014: Started with a Deep Hole, Ending with a Whimper The year 2014 will be remembered for its roller-coaster pattern of economic growth. The unusually cold winter weather helped put growth in deep negative
Key Findings from Recent Joint Center Research Chris Herbert Real Estate Trends in Central Ohio January 26, 2017
 Key Findings from Recent Joint Center Research Chris Herbert Real Estate Trends in Central Ohio January 26, 2017 Outlook for Household Growth Through 2035 Millennials and Baby Boomers Will Drive Coming
Women in the Labor Force: A Databook
 Cornell University ILR School DigitalCommons@ILR Federal Publications Key Workplace Documents 12-2010 Women in the Labor Force: A Databook Bureau of Labor Statistics Follow this and additional works at:
Health Insurance Coverage in 2013: Gains in Public Coverage Continue to Offset Loss of Private Insurance
 Health Insurance Coverage in 2013: Gains in Public Coverage Continue to Offset Loss of Private Insurance Laura Skopec, John Holahan, and Megan McGrath Since the Great Recession peaked in 2010, the economic
U.S. Property Markets Shake Off Slowdown and Power On
 U.S. Research Report CAPITAL FLOWS 2017 Midyear Update U.S. Property Markets Shake Off Slowdown and Power On Andrew J Nelson, Chief Economist USA The slowdown in U.S. commercial property markets that began
Data Brief. Dangerous Trends: The Growth of Debt in the U.S. Economy
 cepr Center for Economic and Policy Research Data Brief Dangerous Trends: The Growth of Debt in the U.S. Economy Dean Baker 1 September 7, 2004 CENTER FOR ECONOMIC AND POLICY RESEARCH 1611 CONNECTICUT
Is U.S. Real Estate Over-Priced?
 Is U.S. Real Estate Over-Priced? If U.S. commercial real estate prices are at a peak, should savvy investors be selling their holdings? J A CQUES N. GORDON WILLIAM J. MAHER FRESH EXAMPLES OF high prices
Outlook for the Hawai'i Economy
 Outlook for the Hawai'i Economy May 3, 2001 Dr. Carl Bonham University of Hawai'i Economic Research Organization Summary The Hawaii economy entered 2001 in its best shape in more than a decade. While the