Orders, Level 2, Price Action COPYRIGHTED MATERIAL: ANDREW AZIZ (C) 1
|
|
|
- Gavin Webster
- 5 years ago
- Views:
Transcription
 WWW.BEARBULLTRADERS.")
1 Orders, Level 2, Price Action ANDREW AZIZ SESSION 3 COPYRIGHTED MATERIAL: ANDREW AZIZ (C) 1
2 Disclaimer BearBullTraders.com employees, contractors, shareholders and affiliates, are NOT an investment advisory service, a registered investment advisor or a broker-dealer and does not undertake to advise clients on which securities they should buy or sell for themselves. You understand that NO content published as part of the BearBullTraders Room and its Website constitutes a recommendation that any particular investment, security, portfolio of securities, transaction or investment strategy is suitable for any specific person. You further understand that none of the creators or providers of our Services or their affiliates will advise you personally concerning the nature, potential, value or suitability of any particular investment, security, portfolio of securities, transaction, investment strategy or other matter. COPYRIGHTED MATERIAL: ANDREW AZIZ (C) 2
3 Class Overview Class 1: Before Start Trading Trading Platform Class 2: Before Market Opens Finding the Stocks in Play Finding Trading Levels Class 3: Technical Orders: Market, Limit, Marketable limit Understanding Level 2 Price Action Trade Management Class 4: Trading Strategies Strategies Risk Management COPYRIGHTED MATERIAL: ANDREW AZIZ (C) 3
4 Understanding Montage and Level 2 Level 1 Level 2 Market depth (Liquidity) Hotkeys Order entry COPYRIGHTED MATERIAL: ANDREW AZIZ (C) 4
5 Market Orders Buy me at any price! Now! Sell me at any price! Now! You remove liquidity Limit Orders: add liquidity Buy me at this price (or better) only! Not higher! Sell me at this price (or better) only! Not lower! You add liquidity COPYRIGHTED MATERIAL: ANDREW AZIZ (C) 5
 WWW.BEARBULLTRADERS.")
6 Market Orders are like blank check, you may get some nasty surprises These sudden downward spikes are probably market orders getting filled almost 100% lower than market price. Previous day close 18 April 2017 COPYRIGHTED MATERIAL: ANDREW AZIZ (C) 6


7 Marketable Limit Orders Buy me now, but up to this price! Not higher! Sell me now, but down to this price! Not lower! COPYRIGHTED MATERIAL: ANDREW AZIZ (C) 7
8 Level 2 Depth: Bid-Ask Spread: Market Makers Territories Bid-Ask Spread: 1 cent 0.02% slippage = 1cent/$34.76 Bid-Ask Spread: 11 cents %1.7 slippage = 11 cents/$6.42 COPYRIGHTED MATERIAL: ANDREW AZIZ (C) 8


9 Stop loss order will be placed in the market book. That is why I do not use hard stops, it can get manipulated! COPYRIGHTED MATERIAL: ANDREW AZIZ (C) 9
 WWW.BEARBULLTRADERS.")
10 COPYRIGHTED MATERIAL: ANDREW AZIZ (C) 10
: Beairsh!")

11 Level 2 Signals Big Bids (big buyer): Beairsh! Big Asks (big seller): Bullish! COPYRIGHTED MATERIAL: ANDREW AZIZ (C) 11


12 Level 2 Signals Volume & Traders Psychology Aggressive Buying: Buyers pay more on ask (why?) Aggressive Selling: Sellers accept less on bid (why?) Color in time and sales shows traders psychology COPYRIGHTED MATERIAL: ANDREW AZIZ (C) 12
13 Level 2 Signals Aggressive Buying? Not really Buyers are not willing to pay more They are low balling! COPYRIGHTED MATERIAL: ANDREW AZIZ (C) 13
!")
14 Level 2 Signals: Big bid/ask are only close to current price are real. Other big numbers are kind of fake: NITF orders (no intention to fill orders)! NITF order COPYRIGHTED MATERIAL: ANDREW AZIZ (C) 14
 WWW.BEARBULLTRADERS.")
15 COPYRIGHTED MATERIAL: ANDREW AZIZ (C) 15
 WWW.")
16 See it LIVE Yourself: COPYRIGHTED MATERIAL: ANDREW AZIZ (C) 16


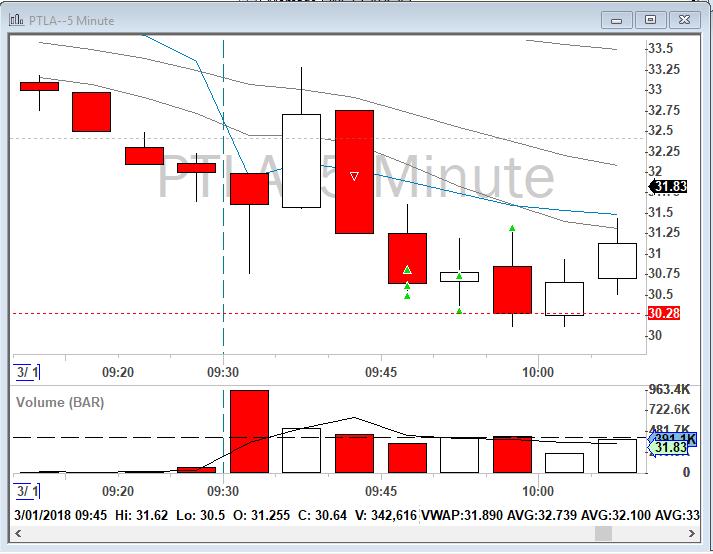
17 NOTE: Level 2 signals are only one piece of information You have to look at other indicators too before making any trade. In this example, both the Scanner, 5-min and daily chart are also indicating a short position. COPYRIGHTED MATERIAL: ANDREW AZIZ (C) 17
18 Key Points 1. To get fast fills in day trading, you can use marketable limit orders. 2. Market orders are usually filled good, but sometimes you can get nasty fills! 3. Pay attention of bid-ask spread as it cost you in day trading. 4. Big bids are usually bearish. Big asks are bullish. 5. Level 2 signals can be used for trading, but they are only part of the big picture. COPYRIGHTED MATERIAL: ANDREW AZIZ (C) 18
 WWW.")
19 Price Action Candlesticks for Social Psychology COPYRIGHTED MATERIAL: ANDREW AZIZ (C) 19
20 Bullish Candlesticks COPYRIGHTED MATERIAL: ANDREW AZIZ (C) 20
 WWW.BEARBULLTRADERS.")
21 Bearish Candlesticks A series of bearish candles shows bears (sellers) are in control of the price. COPYRIGHTED MATERIAL: ANDREW AZIZ (C) 21
 WWW.")
22 Price Action Analysis for Trade Management How to Use Price Action short Initial stop loss stop loss after first cover Note: I bring my stop loss to break even (b/e) after first profit taking. I did not wait, because of bullish pattern right after bearish pattern. Cover half in 2 steps Covered all Also, failed to make a new 5-min low COPYRIGHTED MATERIAL: ANDREW AZIZ (C) 22
 WWW.BEARBULLTRADERS.")
23 Initial stop loss stop loss after first cover short VWAP All out Cover half 50 SMA final profit target COPYRIGHTED MATERIAL: ANDREW AZIZ (C) 23
 WWW.")
24 Indecision candlesticks COPYRIGHTED MATERIAL: ANDREW AZIZ (C) 24
25 Indecision for reversals COPYRIGHTED MATERIAL: ANDREW AZIZ (C) 25
26 5-min Pattern Higher highs, higher lows: Bullish pattern Lower highs, lower lows: Bearish pattern COPYRIGHTED MATERIAL: ANDREW AZIZ (C) 26
27 Where did the uptrend start? Most people think at point D (wrong) Uptrend started after point B (higher highs, higher lows) COPYRIGHTED MATERIAL: ANDREW AZIZ (C) 27
 WWW.BEARBULLTRADERS.")
28 Trade Management How to Use Price Action in Real Trade Stopped out Bearish bar bullish bar Add more Short VWAP Low of the day COPYRIGHTED MATERIAL: ANDREW AZIZ (C) 28
 WWW.BEARBULLTRADERS.")
29 Trade Management How to Use Price Action in Real Trade COPYRIGHTED MATERIAL: ANDREW AZIZ (C) 29
 WWW.BEARBULLTRADERS.")
30 Trade Management How to Use Price Action in Real Trade COPYRIGHTED MATERIAL: ANDREW AZIZ (C) 30
 WWW.BEARBULLTRADERS.")
31 Engulfing Patterns: Reversals Signs COPYRIGHTED MATERIAL: ANDREW AZIZ (C) 31
 WWW.BEARBULLTRADERS.")
32 Trade Management How to Use Price Action in Real Trade COPYRIGHTED MATERIAL: ANDREW AZIZ (C) 32
 WWW.BEARBULLTRADERS.")
33 Trade Management How to Use Price Action in Real Trade COPYRIGHTED MATERIAL: ANDREW AZIZ (C) 33
 WWW.BEARBULLTRADERS.")
34 COPYRIGHTED MATERIAL: ANDREW AZIZ (C) 34

35 COPYRIGHTED MATERIAL: ANDREW AZIZ (C) 35
 WWW.BEARBULLTRADERS.")
36 COPYRIGHTED MATERIAL: ANDREW AZIZ (C) 36

 WWW.BEARBULLTRADERS.")
37 High Frequency Trading Small movements, high volume Choppy price action Big candlesticks Big wicks, No 5-min trend can be seen Good price action Small candlesticks 5-min patterns can be seen: higher highs Higher lows lower lows lower highs COPYRIGHTED MATERIAL: ANDREW AZIZ (C) 37
38 Key Points 1. Candlesticks with big white bodies are bullish, it is not a good idea to short after them. 2. Candlesticks with big red bodies are bearish, it is not a good idea to go long after them. 3. Take partial profits, and bring your stop loss to break-even min higher highs higher lows are bullish. 5-min lower lows lower highs are bearish. 5. Engulfing patterns are powerful reversal signs. 6. Understanding price action is key in your trade management. COPYRIGHTED MATERIAL: ANDREW AZIZ (C) 38
39 THANK YOU. COPYRIGHTED MATERIAL: ANDREW AZIZ (C) 39
Orders, Level 2, Price Action
 Orders, Level 2, Price Action ANDREW AZIZ SESSION 3 Disclaimer BearBullTraders.com employees, contractors, shareholders and affiliates, are NOT an investment advisory service, a registered investment advisor
Day Trading Strategies. Day Strategies. and Examples. & Risk Management COPYRIGHTED MATERIAL: ANDREW AZIZ (C)
") Day Trading Strategies Day Strategies and Examples & Risk Management ANDREW AZIZ SESSION 4 Disclaimer BearBullTraders.com employees, contractors, shareholders and affiliates, are NOT an investment advisory
Day Trading Strategies Day Strategies and Examples & Risk Management ANDREW AZIZ SESSION 4 Disclaimer BearBullTraders.com employees, contractors, shareholders and affiliates, are NOT an investment advisory
How to Day Trade for a Living
 How to Day Trade for a Living A Beginner s Guide to Tools and Tactics, Money Management, Discipline and Trading Psychology Andrew Aziz, Ph.D. Founder and Head Trader at Bear Bull Traders DISCLAIMER: The
Risk Management ANDREW AZ IZ SESSION 5
 Risk Management ANDREW AZIZ SESSION 5 Disclaimer BearBullTraders.com employees, contractors, shareholders and affiliates, are NOT an investment advisory service, a registered investment advisor or a broker-dealer
Candlesticks Discoveries Probability of Success Aug 6, 2016
 Candlesticks Discoveries Probability of Success Aug 6, 2016 The Art & Science of Active Trend Trading Disclaimer U.S. Government Required Disclaimer Commodity Futures Trading Commission Futures and Options
Chapter 3. Price Action
 Chapter 3 Price Action The movement of price in any market is called Price Action. This movement is caused by the beliefs and trading systems of hundreds of thousands of worldwide traders that the market
The Engulfing Trader Copyright 2014
 Www.ForexWinners.Ru Prologue and Introduction This book is for all those that are just fed up with all the hype out there in the market. So called guru s selling expensive strategies and systems guaranteeing
Candlesticks What They Really Mean! March 3, 2018
 Candlesticks What They Really Mean! March 3, 2018 Active Trend Trading Dennis W. Wilborn Disclaimer U.S. Government Required Disclaimer Commodity Futures Trading Commission Futures and Options trading
How to Day Trade with the VWAP COPYRIGHT (C) ANDREW AZIZ
 ANDREW AZIZ") How to Day Trade with the VWAP Disclaimer BearBullTraders.com employees, contractors, shareholders and affiliates, are NOT an investment advisory service, a registered investment advisor or a broker-dealer
How to Day Trade with the VWAP Disclaimer BearBullTraders.com employees, contractors, shareholders and affiliates, are NOT an investment advisory service, a registered investment advisor or a broker-dealer
Presents. SPY the MARKET. With. Bill Corcoran
 Presents SPY the MARKET With Bill Corcoran I am not a registered broker-dealer or investment adviser. I will mention that I consider certain securities or positions to be good candidates for the types
Technical Analysis Workshop Series. Session Six 1, 2, 3 Price-Bars Patterns
 Technical Analysis Workshop Series Session Six 1, 2, 3 Price-Bars Patterns DISCLOSURES & DISCLAIMERS This research material has been prepared by NUS Invest. NUS Invest specifically prohibits the redistribution
Lighting the Way: Using Candlestick Patterns. The Art & Science of Active Trend Trading
 Lighting the Way: Using Candlestick Patterns The Art & Science of Active Trend Trading Disclaimer U.S. Government Required Disclaimer Commodity Futures Trading Commission Futures and Options trading has
CHARTS. Bar Line Candlestick Charts are the basis of technical analysis They are a graphic display of price action. Notes:
 TECHNICAL ANALYSIS CHARTS Bar Line Candlestick Charts are the basis of technical analysis They are a graphic display of price action Candlestick charts have become the industry standard for technical traders.
Mastering the Markets
 www.mastermindtraders.com Presents Mastering the Markets Your Path to Financial Freedom DISCLAIMER Neither or any of its personnel are registered broker-dealers or investment advisors. We may mention that
Reversal Candles. Candlestick Bearish Reversal Patterns. Bearish Confirmation. Existing Downtrend
 Candlestick Bearish Reversal Patterns There are dozens of bearish reversal patterns. We have elected to narrow the field by selecting a few of the most popular patterns for detailed explanations. Below
CONNECING THE DOTS Candlesticks & Convergence of Clues. The Art & Science of Active Trend Trading
 CONNECING THE DOTS Candlesticks & Convergence of Clues The Art & Science of Active Trend Trading Disclaimer U.S. Government Required Disclaimer Commodity Futures Trading Commission Futures and Options
The Art & Science of Active Trend Trading
 CONNECTING THE DOTS Candlesticks & Convergence of Clues The Art & Science of Active Trend Trading Copywrite ATTS 2007-2015 1 Dennis W. Wilborn, P.E. Founder, President Active Trend Trading dww@activetrendtrading.com
The Art & Science of Active Trend Trading
 CONNECTING THE DOTS Candlesticks & Convergence of Clues The Art & Science of Active Trend Trading Copyright ATTS 2007-2015 1 Dennis W. Wilborn, P.E. Founder, President Active Trend Trading dww@activetrendtrading.com
Buy rules: Sell rules: Strategy #2. Martingale hedging with exponential lot increase... 6
 Contents Introduction... 2 Data... 2 Short instructions on how to use Forex Tester.... 2 Sum up... 3 STRATEGIES... 3 Martingale strategies... 3 Strategy #1. Martingale Grid & Hedging... 4 Buy rules:...
The Art & Science of Active Trend Trading
 Candlesticks Looking for U-Turns The Art & Science of Active Trend Trading Copywrite ATTS 2007-2015 1 Disclaimer U.S. Government Required Disclaimer Commodity Futures Trading Commission Futures and Options
If you have traded forex long enough, you will notice that sometimes, price has an uncanny ability to reverse exactly at or around fibonacci levels.
 Fibonacci Forex Trading Strategy With Reversal Candlesticks The Fibonacci forex trading strategy with reversal candlesticks is simply about using fibonacci retracements in conjunction with reversal candlesticks.
Chapter Eight. Japanese Candle Chart
 Chapter Eight Japanese Candle Chart Candle chart (also called candlestick) analysis has been used since the 18 th century by Japanese rice traders to predict the rice price s movement. According to sources,
1. Introduction 2. Chart Basics 3. Trend Lines 4. Indicators 5. Putting It All Together
 Technical Analysis: A Beginners Guide 1. Introduction 2. Chart Basics 3. Trend Lines 4. Indicators 5. Putting It All Together Disclaimer: Neither these presentations, nor anything on Twitter, Cryptoscores.org,
I prefer to use the CCI indicator to trade divergences and it has worked well for me over the past 10 years.
 Make 100 pips Trading Divergences. There are several ways to trade divergences and several indicators that can help you identify the divergence between price and the indicator itself. I prefer to use the
Technicals & Time Frame
 Advanced Charting Neither Better Trades or any of its personnel are registered broker-dealers or investment advisers. I will mention that I consider certain securities or positions to be good candidates
2.0. Learning to Profit from Futures Trading with an Unfair Advantage! Income Generating Strategies Essential Trading Tips & Market Insights
 2.0 Learning to Profit from Futures Trading with an Unfair Advantage! Income Generating Strategies Essential Trading Tips & Market Insights Income Generating Strategies Essential Trading Tips & Market
NEWSLETTER SWING TRADING. 28 Feb Intelligent Analysis to point your decisions in the right direction
 NEWSLETTER 28 Feb 2018 Intelligent Analysis to point your decisions in the right direction SWING TRADING Newsletter contains index, stocks and sector recommendations along with market outlook. It also
INTERMEDIATE EDUCATION GUIDE
 INTERMEDIATE EDUCATION GUIDE CONTENTS Key Chart Patterns That Every Trader Needs To Know Continution Patterns Reversal Patterns Statistical Indicators Support And Resistance Fibonacci Retracement Moving
Part 2: ASX charts - more charting tools. OHLC / Bar chart
 Part 2: ASX charts - more charting tools OHLC / Bar chart A bar chart simply takes the information from the day's trading and plots that information on a single vertical 'bar'. A tab on the left side of
Candlestick Charts Types of Orders Price Action Examples Change Your Mindset. Trading Styles. BearBullTraders.com. All Right Reserved.
 Candlestick Charts Types of Orders Price Action Examples Change Your Mindset Trading Styles Most common chart in the trading world 2 High Close High Open Open Low Bullish Candle Close Low Bearish Candle
presented by Thomas Wood MicroQuant SM Divergence Trading Workshop Day One Naked Trading Part 2
 presented by Thomas Wood MicroQuant SM Divergence Trading Workshop Day One Naked Trading Part 2 Risk Disclaimer Trading or investing carries a high level of risk, and is not suitable for all persons. Before
Compass FX
 SYNERGY Trading Method Disclaimer Unique experiences and past performances do not guarantee future results. Trading in the off-exchange Foreign Exchange market (Forex) is very speculative in nature, involves
Monster Market Movers
 Monster Market Movers Prerequisite Manual Better Trades Coach Robert Roy Neither Mastermind Traders or any of its personnel are registered broker-dealers or investment advisers. I will mention that I consider
Knowing When to Buy or Sell a Stock
 Knowing When to Buy or Sell a Stock Overview Review & Market direction Driving forces of market change Support & Resistance Basic Charting Review & Market Direction How many directions can a stock s price
Technical Analysis Workshop Series. Session Two
 Technical Analysis Workshop eries ession Two DICLOURE & DICLAIMER This research material has been prepared by NU Invest. NU Invest specifically prohibits the redistribution of this material in whole or
Candlestick Secrets for Profiting in Options Seminar Nison Candlesticks to Guide Your Option Trades. Nison Chart Challenge 7 - Read Steve s Mind
 Nison Chart Challenge 7 - Read Steve s Mind 1) How could we have used NCS after the first hammer to find a good trade set up and decrease time decay? 2) What outright or spread could we have done? 3) When
Forex Sentiment Report Q2 FORECAST WEAK AS LONG AS BELOW April
 Forex Sentiment Report 08 April 2015 www.ads-securities.com Q2 FORECAST WEAK AS LONG AS BELOW 1.1200 Targets on a break of 1.1534/35: 1.1740/50 1.1870/75 1.2230/35 Targets on a break of 1.0580/70: 1.0160
Introduction. Technical analysis is the attempt to forecast stock prices on the basis of market-derived data.
 Technical Analysis Introduction Technical analysis is the attempt to forecast stock prices on the basis of market-derived data. Technicians (also known as quantitative analysts or chartists) usually look
Trading With Price Action Alone
 Trading With Price Action Alone The very premise of technical analysis, based on the efficient market hypothesis, is that all the information about a financial product or market is reflected in its price.
Presents. Forex Profit Boost
 Presents Forex Profit Boost Forex Profit Boost Published by Alzaiak Trading CC Nominee Old Tree Publishing CC Suite 509, Private Bag X503 Northway, 4065, KZN, ZA www.oldtreepublishing.com Copyright 2014
BUY SELL PRO. Improve Profitability & Reduce Risk with BUY SELL Pro. Ultimate BUY SELL Indicator for All Time Frames
 BUY SELL PRO Improve Profitability & Reduce Risk with BUY SELL Pro Ultimate BUY SELL Indicator for All Time Frames Risk Disclosure DISCLAIMER: Crypto, futures, stocks and options trading involves substantial
Binary Options Trading Strategies How to Become a Successful Trader?
 Binary Options Trading Strategies or How to Become a Successful Trader? Brought to You by: 1. Successful Binary Options Trading Strategy Successful binary options traders approach the market with three
Icoachtrader Consulting Service WELCOME TO. Trading Boot Camp. Day 5
 Icoachtrader Consulting Service www.icoachtrader.weebly.com WELCOME TO Trading Boot Camp Day 5 David Ha Ngo Trading Coach Phone: 1.650.899.1088 Email: icoachtrader@gmail.com The information presented is
An Introduction to Candlesticks for Options Using Nison Candlesticks as the Foundation to your option trading
 Using Nison Candlesticks as the Foundation to your option trading, CMT President: Candlecharts.com Candlestick Benefits Easy to Understand Early Reversals Safety First East + West All markets All Time
Candlestick Secrets for Profiting in Options Seminar Nison Candlesticks to Guide Your Option Trades
 I was long a stock and saw bearish candles so I bought a put to protect my position. Being able to employ some defensive timing measures REALLY reduces my anxiety The candles provide the final piece before
Price Action - The Footprint of the Money Judy MacKeigan - Buffy
 Price Action - The Footprint of the Money Judy MacKeigan - Buffy "What is Price Action?" is a frequently asked question by aspiring traders. Traders who ask, feel it is a well kept secret when all they
User Guide. PivotBreaker. Brought to you by Equitimax. A trading method for forex. Equitimax
 User Guide PivotBreaker Brought to you by Equitimax A trading method for forex Equitimax Disclaimer The PivotBreaker is provided to you by Equitimax, free of charge. We provide no warranty or promise of
PART 3 - CHART PATTERNS & TECHNICAL INDICATORS
 Tyler Chianelli s EASYOPTIONTRADING by OPTION TRADING COACH PART 3 - CHART PATTERNS & TECHNICAL INDICATORS A SIMPLE SYSTEM FOR TRADING OPTIONS WORKS IN UP, DOWN, AND SIDEWAYS MARKETS PART 3.1 - PRIMARY
Table Of Contents. Introduction. When You Should Not Use This Strategy. Setting Your Metatrader Charts. Free Template 15_Min_Trading.tpl.
 Table Of Contents Introduction When You Should Not Use This Strategy Setting Your Metatrader Charts Free Template 15_Min_Trading.tpl How To Trade 15 Min. Trading Strategy For Long Trades 15 Min. Trading
Stacking Indicators Getting a GREAT entry! TWEEZERS Tweezer top/bottom at the band The stock is trending up Gap down (against the trend) Any moving
 Any moving") Dean Storholt I am not a registered broker-dealer or investment adviser. I will mention that I consider certain securities or positions to be good candidates for the types of strategies we are discussing
Dean Storholt I am not a registered broker-dealer or investment adviser. I will mention that I consider certain securities or positions to be good candidates for the types of strategies we are discussing
Technical analysis & Charting The Foundation of technical analysis is the Chart.
 Technical analysis & Charting The Foundation of technical analysis is the Chart. Charts Mainly there are 2 types of charts 1. Line Chart 2. Candlestick Chart Line charts A chart shown below is the Line
Introduction. Technicians (also known as quantitative analysts or chartists) usually look at price, volume and psychological indicators over time.
 usually look at price, volume and psychological indicators over time.") Technical Analysis Introduction Technical Analysis is the study of market action, primarily through the use of charts, for the purpose of forecasting future price trends. Technicians (also known as quantitative
Technical Analysis Introduction Technical Analysis is the study of market action, primarily through the use of charts, for the purpose of forecasting future price trends. Technicians (also known as quantitative
3 Price Action Signals to Compliment ANY Approach to ANY Market
 3 Price Action Signals to Compliment ANY Approach to ANY Market Introduction: It is important to start this report by being clear that these signals and tactics for using Price Action are meant to compliment
Tradeciety s Price Action Guide
 Tradeciety s Price Action Guide Welcome... 3 Who am I?... 3 Some impressions from my trading & traveling lifestyle... 4 What Is Price Action?... 6 Candlesticks vs. Chart patterns... 7 Top 3 Candlestick
The Most Important Price Action Patterns for Babon Traders
 The Most Important Price Action Patterns for Babon Traders There are dozens of different Price Action formations and Japanese candles' formations, as a matter of fact almost any so called "expert" and
Candlestick Secrets for Profiting in Options Seminar Nison Candlesticks to Guide Your Option Trades
 I was long a stock and saw bearish candles so I bought a put to protect my position. Being able to employ some defensive timing measures REALLY reduces my anxiety The candles provide the final piece before
The One Path Trading System. The foundation of the trading system is Supply and Demand and Support and Resistance.
 The One Path Trading System This trading system is based on Price Action read done by the indicators to make trading simpler and more automated for the trader. All the calculations that are performed in
What Came First... Fundamentals or the Technicals? By Jared Martinez
 What Came First... Fundamentals or the Technicals? By Jared Martinez I am honored to share my thoughts on our methodologies, focusing on the current technical movements and conditions of the FOREX Markets,
2 Powerful Price Patterns & Simple Truth About Trends. Trading Concepts, Inc.
 2 Powerful Price Patterns & Simple Truth About Trends RANGE Price Action Analysis Interpreting the OPEN, HIGH, LOW, & CLOSE on a Price Bar or Candlestick & comparing it to the Prior Price Bar or Candlestick
FOREX. analysing made easy. UNDERSTANDING TECHNICAL ANALYSIS An educational tool by Blackwell Global
 FOREX analysing made easy UNDERSTANDING TECHNICAL ANALYSIS An educational tool by Blackwell Global Risk Warning: Forex and CFDs are leveraged products and you may lose your initial deposit as well as substantial
Scalp Trading Strategies
 Scalp Trading Strategies Services Disclaimer (for full disclosure, see Disclaimers section of website) Information Contained within our website and affiliates is not a substitute for professional advice
Understanding of Price-Volume -Open Interest in futures market
 Understanding of Price-Volume -Open Interest in futures market Introduction Price, Volume and Open interest are the most important market determinants in futures market. Among these, price is more important.
Interactive Practice Questions
 Bonus Handouts Interactive Q and A companion for video workshop Secrets of Becoming a Samurai Trader: Advanced Candlestick Charting Techniques with Steve Nison These extra handouts (which are not part
S&P Cash Long Term: Uptrend Intact. Monthly Log Chart
 Andy Dodd MSTA - +44 020 7031 4651 adodd@louiscapital.com Twitter : @louiscaptech S&P Cash Long Term: Uptrend Intact Despite an initial slowdown in momentum following the break above 2120 in July, which
For general trading knowledge, please get a beginners guide or simply got to :
 www.forexripper.com About The System For general trading knowledge, please get a beginners guide or simply got to : www.babypips.com For more interactive information about the market, there are hundreds
The Launchpad Strategy
 presented by Thomas Wood MicroQuant SM Divergence Trading Workshop Day One The Launchpad Strategy Risk Disclaimer Trading or investing carries a high level of risk, and is not suitable for all persons.
The 4 Step Process for FOREX Trading Mastery
 The 4 Step Process for FOREX Trading Mastery The 4 Step Process for FOREX Trading Mastery 1. Identifying Market Condition 2. Identifying a Trade Set-Up Steps 1 & 2 were discussed in the 2 nd Video 3. Determining
 Disclaimer The candlestick patterns explained in this book are intended to provide information only.. Use these patterns is at your discretion. The use and application of the included patterns can involve
THE HARWOOD REPORT. To start, we will look through the equity chart for WTW to see what we think the market should do next:
 Stocks Highlighted With the market more stable to start the day, my focus will be on two names that have been trending. I expect these names to continue their trends after breaking out yesterday. With
NEWSLETTER SWING TRADING. 17 Jan Intelligent Analysis to point your decisions in the right direction
 NEWSLETTER 17 Jan 2018 Intelligent Analysis to point your decisions in the right direction SWING TRADING Newsletter contains index, stocks and sector recommendations along with market outlook. It also
FOREX INDICATORS. THEIR PRIORITY and USE
 FOREX INDICATORS THEIR PRIORITY and USE by G. C. Smith U.S. Government Required Disclaimer Trading foreign exchange markets on margin carries a high level of risk, and may not be suitable for all investors.
NEWSLETTER SWING TRADING. 26 Feb Intelligent Analysis to point your decisions in the right direction
 NEWSLETTER 26 Feb 2018 Intelligent Analysis to point your decisions in the right direction SWING TRADING Newsletter contains index, stocks and sector recommendations along with market outlook. It also
How I Trade Forex Using the Slope Direction Line
 How I Trade Forex Using the Slope Direction Line by Jeff Glenellis Copyright 2009, Simple4xSystem.net By now, you should already have both the Slope Direction Line (S.D.L.) and the Fibonacci Pivot (FiboPiv)
Naked Trading - Double Top Chart Pattern Strategy
 Naked Trading - Double Top Chart Pattern Strategy If you really want to learn a profitable way to trade then look no further, the Double Top chart pattern strategy uses simple and sound trading principles
Significant Gaps. Is volume greater than average? Where is it gapping to? What are the indices doing? Is the gap clearing supply/demand?
 Mastery Series This Lesson: Significant vs. Insignificant gaps Rating significant gaps Finding significant gaps Gap impacts on indicators Trade Setups with Gaps Significant vs. insignificant gaps Significant
Page 1 of 96 Order your Copy Now Understanding Chart Patterns
 Page 1 of 96 Page 2 of 96 Preface... 5 Who should Read this book... 6 Acknowledgement... 7 Chapter 1. Introduction... 8 Chapter 2. Understanding Charts Convention used in the book. 11 Chapter 3. Moving
Resistance to support
 1 2 2.3.3.1 Resistance to support In this example price is clearly consolidated and we can expect a breakout at some time in the future. This breakout could be short or it could be long. 3 2.3.3.1 Resistance
How many of you are or will be trading a small account?
 Dean Storholt I am not a registered broker-dealer or investment adviser. I will mention that I consider certain securities or positions to be good candidates for the types of strategies we are discussing
DAILY DAY TRADING PLAN
 DAILY DAY TRADING PLAN Gatherplace will be used to place all of your trades. You will be using the 5 minute chart for the trade setup and the 1 minute chart for your entry, stop and trailing stop.you will
Ichimoku Kinko Hyo System PDF Strategy Guide + MT4 Indicator Download
 Ichimoku Kinko Hyo System PDF Strategy Guide + MT4 Indicator Download ForexStrategiesWork.com Congratulations! You might not know it yet but you are in for a REAL treat in the Forex World. You now have
Active Trend Trading Rules Review
 Active Trend Trading Rules Review Active Trend Trader: Dennis W. Wilborn A Trend Should Be Assumed to Continue in Effect Until Such Time as Its Reversal Has Been Definitely Signaled Edwards & Magee Disclaimer
Stacking Indicators Getting a GREAT entry! TWEEZERS Tweezer top/bottom at the band The stock is trending up Gap down (against the trend) Any moving
 Any moving") Dean Storholt I am not a registered broker-dealer or investment adviser. I will mention that I consider certain securities or positions to be good candidates for the types of strategies we are discussing
Dean Storholt I am not a registered broker-dealer or investment adviser. I will mention that I consider certain securities or positions to be good candidates for the types of strategies we are discussing
So let s get into the meat of the matter. Here s how you are going to become the most successful and profitable Forex trader you know.
 Learn to Trade Forex and Make $250 Every Day *Don't Forget To Take a Look at My Advanced Strategies For Making Over $750 Dollars a Day With Forex -> Go To My Website Click Here The $250 Per Day System
TWEEZERS TOPS AND BOTTOMS
 88 The Basics TWEEZERS TOPS AND BOTTOMS Tweezers are two or more candlestick lines with matching highs or lows. They are called tweezers because they are compared to the two prongs of a tweezers. In a
Trading Lessons from the Intraday Frame (study)
") 1 Daily "Idealized Trades" Report Trading Lessons from the Intraday Frame (study) 1 2018 TheoTrade LLC. All rights reserved. 2 Trading Lessons from the Intraday Frame (1-mi) 2 2018 TheoTrade LLC. All rights
1 Daily "Idealized Trades" Report Trading Lessons from the Intraday Frame (study) 1 2018 TheoTrade LLC. All rights reserved. 2 Trading Lessons from the Intraday Frame (1-mi) 2 2018 TheoTrade LLC. All rights
Multi Indicator Usage Concepts 4/1/2012 Brooky-Indicators.com Brooky
 Multi Indicator Usage Concepts www.brooky-indicator.com 4/1/2012 Brooky-Indicators.com Brooky U.S. Government Required Disclaimer Commodity Futures Trading Commission Futures, Currency and Options trading
MAGIC FOREX DIVERGENCE Trading Guide
 Tim Trush & Julie Lavrin Introducing MAGIC FOREX DIVERGENCE Trading Guide Your guide to financial freedom. Tim Trush, Julie Lavrin, T&J Profit Club, 2017, All rights reserved www.forexmystery.com Table
DAY TRADING GUIDE TRADE ON EVERY MOVE CATCH ME IF YOU CAN.
 DAY TRADING GUIDE TRADE ON EVERY MOVE CATCH ME IF YOU CAN. RISK WARNING PAST PERFORMANCE DOES NOT INDICATE FUTURE RESULTS. TRADE WITH STRICT MINIMAL MONEY MANAGEMENT TO AVOID PSYCHOLOGICAL EMOTION WHILE
How to perform accurate market analysis
 How to perform accurate market Roman Sadowski Good market combines the fundamental and the technical. This combination is essential to form a longer-term bias in the market. Good market needs to consider
2.0. Learning to Profit from Futures Trading with an Unfair Advantage! Income Generating Strategies Starting the Trading Day
 2.0 Learning to Profit from Futures Trading with an Unfair Advantage! Income Generating Strategies Starting the Trading Day Income Generating Strategies Starting the Trading Day Pre-Market Analysis Before
This is the complete: Fibonacci Golden Zone Strategy Guide
 This is the complete: Fibonacci Golden Zone Strategy Guide In this strategy report, we are going to share with you a simple Fibonacci Trading Strategy that uses the golden ratio which is a special mathematical
Class 8: Trading Neutral. I. Learning to Trade Neutral. Today s Class
 Today s Class Psychology of Trading Neutral Anatomy of a trade Bracket trading/trading neutral Determining stops Journaling Class 8: Trading Neutral I. Learning to Trade Neutral Learning to Trade Neutral/Psychology
An Overview of the ZMA : The Superior Moving Average Page 2. ZMA Indicator: Infinite Flexibility and Maximum Adaptability Page 4
 An Overview of the ZMA : The Superior Moving Average Page 2 ZMA Indicator: Infinite Flexibility and Maximum Adaptability Page 4 ZMA PaintBar: Moving Average Color-Coding Page 5 Responsiveness and Inertia:
Trading Patterns For Stocks And Commodities
 Trading Patterns For Stocks And Commodities It doesn t matter if you are a long-term investor, short swing trader or day trader, you are always looking for an advantageous spot to enter your position.
Fundamental Analysis is the study of Financial Statements and Ratios which help evaluate a company s overall Value and Growth potential.
 Trading vs. Investing Investing is defined as taking a stake in a company in hopes of benefiting from their prosperity through price appreciation and dividend payouts. Fundamental Analysis is the study
How to Spot Candlestick Formations in the Stock Market & What to Do Once You Spot Them
 How to Spot Candlestick Formations in the Stock Market & What to Do Once You Spot Them WHAT IS A CANDLESTICK? ACandlestick measures price fluctuations within a defined period of time. Colors differentiate
Introduction...1 Part I: Getting Familiar with Candlestick Charting and Technical Analysis...7. Part V: The Part of Tens...315
 Contents at a Glance Introduction...1 Part I: Getting Familiar with Candlestick Charting and Technical Analysis...7 Chapter 1: Understanding Charting and Where Candlesticks Fit In...9 Chapter 2: Getting
Introduction to the Gann Analysis Techniques
 Introduction to the Gann Analysis Techniques A Member of the Investment Data Services group of companies Bank House Chambers 44 Stockport Road Romiley Stockport SK6 3AG Telephone: 0161 285 4488 Fax: 0161
Trading Execution Risks
 Trading Execution Risks Version 2.0 Updated 3 rd March 2017 0 P a g e TRADING EXECUTION RISKS In order to have the best possible trading experience, all traders, regardless of their previous experience,
Covert Code. (previously known as Currency Messenger System 1)
") Covert Code (previously known as Currency Messenger System 1) COVERT CODE INDICATORS Covert Code uses 5 different indicators Mes Signal 1 Indicator which gives you buy and sell arrow signal on the screen.
Covert Code (previously known as Currency Messenger System 1) COVERT CODE INDICATORS Covert Code uses 5 different indicators Mes Signal 1 Indicator which gives you buy and sell arrow signal on the screen.