CPI or PPI? BLS Data for Contract Price Adjustment
|
|
|
- Peregrine Ray
- 5 years ago
- Views:
Transcription

 Program U.S.")
1 CPI or PPI? BLS Data for Contract Price Adjustment Lana Conforti Economist Producer Price Index (PPI) Program U.S. Bureau of Labor Statistics August 23, 2016, 10:15AM 11:15AM

2 BLS Data & Your To-Do List Contract Price Adjustment Administrative interpreting contracts & maintaining customers Sourcing market research, competitive negotiations, mitigating risk, drafting contracts Supply Management Strategic Planning forecasting, analyzing economic trends 2 U.S. BUREAU OF LABOR STATISTICS bls.gov 2
3 BUREAU OF LABOR STATISTICS (BLS) DATA IN THE HEADLINES


4 BLS Wage and Price Index Data 4 U.S. BUREAU OF LABOR STATISTICS bls.gov
5 Quarterly BLS Data on Hospital Pay & Prices (rebased to Jan. 2013) ECI for Hospitals (CIU I) PPI for Hospitals (PCU ) ECI is up 6.2% Jan Apr PPI is up 3.1% Jan Apr Jan-13 Jul-13 Jan-14 Jul-14 Jan-15 Jul-15 Jan-16 5 U.S. BUREAU OF LABOR STATISTICS bls.gov


6 6 U.S. BUREAU OF LABOR STATISTICS bls.gov
7 Employment Cost Index (ECI) Measures changes in employers costs of wages and benefits for their employees Available quarterly by 15 industry sectors 9 occupation groups (e.g. manager, production worker) Private vs. Government Region Union vs. Nonunion Limitations Groupings are broad Contract Uses Accounting for labor input costs Labor intensive areas (i.e. service industries) of PPI/CPI non-coverage NCSINFO@BLS.GOV U.S. BUREAU OF LABOR STATISTICS bls.gov
 www.flickr.")
 www.flickr.")

8 Examples of ECI Data Compensation for Private industry workers in Management, business, and financial occupations (CIU I) Compensation for State and local government workers in Elementary and secondary schools (CIU I) Compensation for Private industry workers in Retail trade (CIU I) 8 U.S. BUREAU OF LABOR STATISTICS bls.gov
9 Consumer Price Index (CPI) Measures changes in prices average households (a.k.a. consumers) pay for everyday purchases Available monthly by 211 items 8 subgroupings Various special groupings (e.g. All items less food) Available quarterly by Region or Metropolitan Area Limitations Only goods and services bought by your average household Groupings are relatively broad Contract Uses General measure of inflation (i.e. CPI-U, All items) Adjusting wage, rent, and other payments to account for changes in the cost of living Areas of noncoverage in the PPI (e.g. public transportation) Items subject to long-run regional influences on price changes CPI_INFO@BLS.GOV U.S. BUREAU OF LABOR STATISTICS bls.gov

 DC-Baltimore Metro Area Recreation")

10 Examples of CPI Data Breakfast cereal (CUUR0000SEFA02) Food away from home (CUUR0000SEFV) DC-Baltimore Metro Area Recreation (CUURA311SAR) U.S. BUREAU OF LABOR STATISTICS bls.gov
11 Import Price Index (IMP) Measures changes in prices for goods purchased by U.S. entities from non-u.s. entities Available monthly by End use of the import (BEA classification) Industry which produces the import (NAICS classification) Harmonized system classification (Customs) Locality of origin (i.e. China, Canada, etc.) Limitations Only service data is for air freight Groupings for some goods are relatively broad Contract Uses Areas of non/light coverage by PPI for imports (e.g. computers) Analysis of competitiveness of imports to PPI for same products U.S. BUREAU OF LABOR STATISTICS bls.gov
 www.flickr.")
 Seafood products from the Pacific Rim")

12 Examples of IMP Data Automobile and light duty motor vehicle manufacturing (EIUIZ33611) Selected Building materials (EIUIR13) Seafood products from the Pacific Rim (EIUCOPRIMZ3117) 12 U.S. BUREAU OF LABOR STATISTICS bls.gov
13 Producer Price Index (PPI) Measures changes in selling prices domestic producers receive for their output Available monthly by Nearly all goods and 75% of services (1500+ detailed indexes) Industry of origin 500+ NAICS classification Similarity or end use ( Commodity classification) Level of processing and end use (Final Demand-Intermediate Demand) Industry of consumption (Inputs to Industry) Various special groupings Limitations Some service industries not covered Contract Uses General measure of inflation from the producers perspective (e.g. PPI for final demand, PPI for materials for food mfg) Goods and services bought by businesses as inputs to production, including materials, services, and equipment Consumer goods and services from the seller s perspective PPI-INFO@BLS.GOV U.S. BUREAU OF LABOR STATISTICS bls.gov
 www.flickr.")
 Canned vegetables (WPU02440102) www.flickr.")
 www.")

14 Examples of PPI Data Janitorial services (WPU491) Hard surface soaps and detergents (WPU ) Intermediate demand: Materials for food mfg (WPUID61111) Canned vegetables (WPU ) Software maintenance, technical support, and other services (PCU ) Inputs to highways and streets construction (WPUIP231231) 14 U.S. BUREAU OF LABOR STATISTICS bls.gov
15 CPI vs. PPI? vs. IMP vs. ECI Under which index you would look for 15 U.S. BUREAU OF LABOR STATISTICS bls.gov
16 BLS Index Data Coverage Summary PPI Nearly all goods and most services ECI Labor costs IMP Imported goods CPI Household goods and services 16 U.S. BUREAU OF LABOR STATISTICS bls.gov
17 BLS Index Data Uses Summary ECI Accounting for labor costs For service industries with CPI/PPI noncoverage CPI To track general inflation use the CPI-U, all items Accounting for prices of goods and services households buy Areas of PPI noncoverage When the region influences long-run prices IMP PPI For goods not or lightly covered by PPI Analysis of U.S. vs. foreign price competitiveness Accounting for prices of nearly all goods and most services bought by households, businesses, and the government For general inflation, look to the FD-ID PPIs Supply chain analysis 17 U.S. BUREAU OF LABOR STATISTICS bls.gov
18 Contract Price Adjustment Steps using BLS index data BLS Guides Available at 18 U.S. BUREAU OF LABOR STATISTICS bls.gov
19 Contracting Scenario You are a public procurement office who regularly buys individually bagged snack foods from a supplier to be sold to students in public schools. 19 U.S. BUREAU OF LABOR STATISTICS bls.gov


20 Start by Listing the Input Costs of the Supplier Choose an index or indexes representing the costs for providing a particular product or service, rather than an index for the product itself. e.g. If contracting for purchases of potato chips, it would be advisable to tie the escalation clause to a PPI for potatoes rather than the finished snacks. Research Inputs: Ask the supplier Look up industry input data from Census.gov BEA input-output table: Use of commodities by industry valued at producers prices Browse trade publications Web search 20 U.S. BUREAU OF LABOR STATISTICS bls.gov
21 Food inputs 20% Packaging 15% Energy 15% Labor 50% Contracting Scenario: Supplier s Inputs In which index would you start to look for each of these? 21 U.S. BUREAU OF LABOR STATISTICS bls.gov

22 22 U.S. BUREAU OF LABOR STATISTICS bls.gov Get Data Step 1: Go to DATA.BLS.GOV
23 Get Data Step 2: Scroll --- down to select a database 23 U.S. BUREAU OF LABOR STATISTICS bls.gov
 Each one-screen")
 24 U.S.")
24 Get Data Step 3: Follow Data Tool Instructions All programs: Follow all steps on one screen (Requires JAVA software and pop-ups) Each one-screen step on individual screens without the need for pop-ups (TIP: Hold Ctrl on your keyboard for multiple selections) 24 U.S. BUREAU OF LABOR STATISTICS bls.gov

25 PPI s Data Seeker s Guide U.S. BUREAU OF LABOR STATISTICS bls.gov

 indexes")

26 PITFALLS TO AVOID WHEN CHOOSING DATA Avoid using All Commodities, Industrial Commodities, or other highly aggregated PPIs Use FD-ID PPIs instead for tracking general inflation Avoid using seasonally adjusted indexes Do not use trade (retailer or wholesaler) indexes in place of product PPIs e.g. A PPI for electronics stores is not a substitute for a computers PPI 26 U.S. BUREAU OF LABOR STATISTICS bls.gov
27 Food inputs 20% Contracting Scenario: Supplier s Inputs WPUID61111 Intermediate Demand - Materials for food manufacturing Packaging 15% WPU Coated and laminated single and multi-web film Energy 15% WPU0543 Industrial electric power Labor 50% 27 U.S. BUREAU OF LABOR STATISTICS bls.gov 27


28 Get Data Step 2: Scroll --- down to select a database 28 U.S. BUREAU OF LABOR STATISTICS bls.gov


29 29 U.S. BUREAU OF LABOR STATISTICS bls.gov


30 30 U.S. BUREAU OF LABOR STATISTICS bls.gov
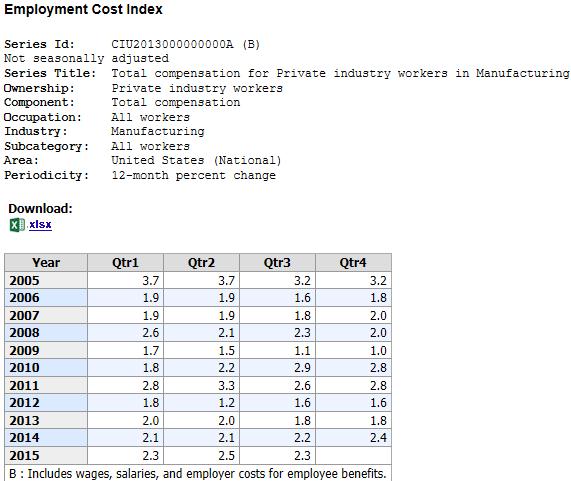
31 Analyze Your Index Options Food inputs 20% WPUID61111 Intermediate Demand - Materials for food manufacturing Packaging 15% See all potential data side-by-side with Series Report DATA.BLS.GOV WPU Coated and laminated single and multi-web film Energy 15% WPU0543 Industrial electric power Labor 50% (ECI data) CIU I Total compensation for Private industry workers in Manufacturing 31 U.S. BUREAU OF LABOR STATISTICS bls.gov
32 Risk Assessment Using Historical Data 32 U.S. BUREAU OF LABOR STATISTICS bls.gov
33 Risk Assessment Using Historical Data 33 U.S. BUREAU OF LABOR STATISTICS bls.gov
34 Write a Price Adjustment Clause using Index Data Base terms Index specifications Calculation method Exceptions and caveats 34 U.S. BUREAU OF LABOR STATISTICS bls.gov
35 Write the Base Terms for the Contract Price Adjustment The base selling price for a pallet of 1,000 1oz bags of snacks is set at $ as of December 2013, to remain in effect for 1 year. December 2013 is hereafter called the reference base period. The base selling price shall be adjusted on March 1st of each subsequent year, based upon the percent changes (whether up or down) in the indexes described below, between the reference base period and December of the most recent year. All calculations for the index shall be based upon the latest version of data published as of February 20th each year. 35 U.S. BUREAU OF LABOR STATISTICS bls.gov
36 How to Specify Index(es) and Source A specific index should be cited by referring to the Producer Price Index for followed by the exact title and code. Industry Data Example Industry: Scheduled passenger air transportation Product: Domestic Series ID: PCU Commodity Data Example Group: Fuels Item: Gasoline Series ID: WPU0571 For the most up-to-date data, including revisions, access the databases at For preliminary data, access the PPI Detailed Report at 36 U.S. BUREAU OF LABOR STATISTICS bls.gov
37 Add Index Specifications to the Contract in the indexes described below, between the reference base period and December of the most recent year. All calculations for the index shall be based upon the latest version of data published as of February 20th each year. From the U.S. Bureau of Labor Statistics official database (data.bls.gov): LABOR: Employment Cost Index (ECI), Total Compensation for Private industry workers in Manufacturing, All workers, U.S. (CIU I) FOOD: Producer Price Index (PPI), Intermediate Demand Materials for food manufacturing (WPUID61111) PACKAGING: PPI for Coated and laminated single and multi-web film (WPU ) ENERGY: PPI for Industrial electric power (WPU0543) 37 U.S. BUREAU OF LABOR STATISTICS bls.gov
38 Calculating a price adjustment using one index Escalation agreements using the PPI usually involve changing the contract s base price by the percent change in the level of the PPI between the reference base period and the time period of the price adjustment. Here is the basic formula using a single index: New price = Old price x (current period index/base period index) = $ x (203.1/199.7) = $ x = $ (this is also a 1.7% increase, although we didn t explicitly calculate it) 38 U.S. BUREAU OF LABOR STATISTICS bls.gov
39 Calculating price adjustment by creating a composite index 39 U.S. BUREAU OF LABOR STATISTICS bls.gov
40 Include an Example of Calculation Mechanics in the Contract ENERGY: PPI for Industrial electric power (WPU0543) 40 U.S. BUREAU OF LABOR STATISTICS bls.gov
41 AVOID NOT ACCOUNTING FOR REVISIONS OR DATA ERRORS Current Revision Policies PPI CPI IPP ECI All data subject to revision 4 mo. after original publication Not revised Data subject to revision each of 3 mo. after original publication Solutions Not revised Set your base terms to wait for revised data before escalating Specify using the latest non-preliminary index data Recalculate upon the release of revision Only recalculate if the percentage change is a certain amount different Do nothing (If you always escalate from the base, you ll make up for it next adjustment) 41 U.S. BUREAU OF LABOR STATISTICS bls.gov
42 AVOID NOT ACCOUNTING FOR MISSING/DISCONTINUED DATA An index may go out of publication for if we can t collect enough data to calculate a reliable estimate PPI re-samples to update the mix of products and services (currently 3x/year) indexes may be added, deleted, or recoded Solutions Allow for the use of the next higher aggregate index (if it makes sense) Allow a proxy index Replace the index with its re-code Compare the deleted code with new indexes available 42 U.S. BUREAU OF LABOR STATISTICS bls.gov
43 Account for Exceptions and Caveats in the Contract Terms If an index is recoded, that is the replacement is a direct substitute according to the BLS, this contract will instead use the recode. If an index becomes unavailable the supplier may propose a proxy index prior to December 31. The buyer will approve or disapprove in 10 business days. If there is not direct substitute or a proxy index approved, the next higher aggregate index available will be used. 43 U.S. BUREAU OF LABOR STATISTICS bls.gov
44 AVOID FORGETTING EVERYTHING UNTIL IT S TIME TO UPDATE PRICES By the time you revisit the contract, the PPI might have changed! Solutions Sign up for PPI Notices ( Try retrieving your index a couple times a year; if it becomes unavailable, check recent PPI Detailed Reports for resampling ( 44 U.S. BUREAU OF LABOR STATISTICS bls.gov
45 Other Uses of PPI Data for Procurement 45 U.S. BUREAU OF LABOR STATISTICS bls.gov
46 How to use PPI s aggregate indexes for Market Analysis PPI for Unprocessed Foods & Feeds; Apr-14; PPI for Processed Foods; Apr-14; PPI for Consumer Foods; Apr-14; Base: 1982= U.S. BUREAU OF LABOR STATISTICS bls.gov
47 How to use PPI s detailed indexes for Supply Chain Analysis Analysis using PPI Data *Indexes rebased to December 2004 = U.S. BUREAU OF LABOR STATISTICS bls.gov
48 How to use industry-level PPIs for Industry Analysis & Contract Decisions *Indexes rebased to January 2010 = U.S. BUREAU OF LABOR STATISTICS bls.gov

49 Contact Information Lana Conforti BLS Producer Price Index Program U.S. BUREAU OF LABOR STATISTICS bls.gov
50 Supplemental Slides 50 U.S. BUREAU OF LABOR STATISTICS bls.gov
51 PPI data mostly covers the supply chain, but other BLS data adds depth Price Inflation Data for Contract Price Adjustment Differences: Producer Price Index Prices received by domestic producers for goods and services Consumer Price Index Prices paid by consumers/households for goods and services Import Price Index Prices paid by purchasers to non-u.s. entities Wage Data for Contracts: Employment Cost Index Costs to employers of for employee compensation Wage Data for Analysis: At a Glance Summaries for Market Analysis By Industry ( By Areas of the U.S. ( The U.S. Economy ( 51 U.S. BUREAU OF LABOR STATISTICS bls.gov
52 PPI for Final demand combines data like the formula for GDP GDP 1Q 2015 $17.7 trillion = Consumption 69% C Government Purchases 18% Investment 17% Net Exports -3% Exports Imports 13% -16% + G + I + ( X - M ) PPI for Final Demand = (1) BEA.gov, Interactive Data, GDP & Personal Income, NIPA, released: July 30, 2015: (2) BLS.gov/PPI, PPI News Release Table 1 C 66% PPI for Personal Consumption + G + I + 8% PPI for Total Government Purchases 14% Private Capital Equip. & Investment PPIs X 12% PPI for Total Exports 52 U.S. BUREAU OF LABOR STATISTICS bls.gov
53 Price data from Industry #1 Industry Data Price data from Industry #2 Product Product Product Product Product Product Product Product Primary Products Secondary & Misc. Primary Products Secondary & Misc. Industry #1 PPI Family of PPIs Industry #2 PPI Items Item Commodity Data FD-ID Aggregations Item Group Item Inputs to Industries Aggregations Items Item 53 U.S. BUREAU OF LABOR STATISTICS bls.gov
54 Pitfalls Not accounting for revisions and errors Not accounting for missing or discontinued data Not keeping in touch with PPI Solutions Wait for revised data before escalating Recalculate upon the release of revision Only readjust if the percentage change is a certain amount different Do nothing (If you always escalate from the base, you ll make up for it next adjustment) Allow for the use of the next higher aggregate index (if it makes sense) Allow a proxy index Replace the index with its re-code Compare the deleted code with new indexes available Sign up for PPI Notices ( Try retrieving your index a couple times a year; if it becomes unavailable, check recent PPI Detailed Reports for resampling ( 54 U.S. BUREAU OF LABOR STATISTICS bls.gov
Finding, Understanding, and Using BLS Price Indexes. Get to know our audience. Get to know our audience
 Finding, Understanding, and Using BLS Price Indexes Steve Reed Economist, Consumer Price Index, BLS Joseph Kowal Economist, Producer Price Index, BLS NIGP Webinar January 21, 2010 1PM ET Get to know our
HELP! I m an Accidental Government Information Librarian
 HELP! I m an Accidental Government Information Librarian Economic Indicators Mary G. Scanlon Brought to you by NCLA Government Resources Section Economic indicators For each indicator: Definition Users
Amendment XX ECONOMIC PRICE ADJUSTMENT- DEPARTMENT OF LABOR PRICE INDEX (DECEMBER 2011 SUBSISTENCE TAILORED)
") Page 2 of 7 1. The Offer Due Date as listed on Amendment 0010 Page 1, Block 14 is updated to March 15, 2012 10:00 AM Philadelphia Time. 2. Solicitation Page 37, Contract Clauses, 52.216-9030 Economic Price
Page 2 of 7 1. The Offer Due Date as listed on Amendment 0010 Page 1, Block 14 is updated to March 15, 2012 10:00 AM Philadelphia Time. 2. Solicitation Page 37, Contract Clauses, 52.216-9030 Economic Price
The relatively slow growth of employment has
 NationalEconomicTrends August Please go to researchstlouisfedorg/publications/net for important information about your subscription Labor s Share The relatively slow growth of employment has been a prominent
With the tax filing season in full swing, these summary
 NationalEconomicTrends March Income Taxes: Who Pays and How Much? With the tax filing season in full swing, these summary figures may provide some perspective on the issue of who is paying federal individual
NationalEconomicTrends
 NationalEconomicTrends August 001 The Switch to NAICS Measuring economic activity when the composition and quality of goods and services being produced is rapidly changing presents a perpetual challenge.
There has been considerable discussion of the possibility
 NationalEconomicTrends February Housing and the R Word There has been considerable discussion of the possibility that ongoing troubles in the housing market could push the economy into recession 1 But
On October 4, 2006, President Bush signed the
 NationalEconomicTrends December Political Economy of State Homeland Security Grants On October,, President Bush signed the Department of Homeland Security (DHS) Appro pri - ations Act for fiscal year 7
The chorus from Travis s 1947 song about the
 NationalEconomicTrends December 7 What Do You Get for Sixteen Tons? You load sixteen tons, and what do you get? Another day older and deeper in debt Merle Travis The chorus from Travis s 197 song about
House prices in the United States were 14.1 percent
 NationalEconomicTrends August How Much Have US House Prices Fallen? House prices in the United States were 11 percent lower in the first quarter of than they were a year earlier, according to a widely
In the past three decades, the share of foreign-born
 NationalEconomicTrends June New Views on Immigration In the past three decades, the share of foreign-born workers in US total employment has increased markedly, from percent in 197 to 1 percent in Among
The Federal Reserve has set the target range for the federal
 NationalEconomicTrends October Monetary Policy Stance: The View from Consumption Spending The Federal Reserve has set the target range for the federal funds at to 5 percent and intends to keep this near
Nominal price of a burger in 1955 is $0.15. Nominal price of a burger in 2002 is $0.79.
 Applications: Real versus nominal prices. Nominal price actual selling price. Real price deflated for inflation price. The Consumer Price Index for Urban Wage Earners and Clerical Workers (CPI-W) increased
NationalEconomicTrends
 NationalEconomicTrends January 00 Stag-nations Economic growth in the United States has slowed substantially since the days of rapid expansion during the mid to late 1990s. According to preliminary estimates,
Sharp declines in home prices, followed by a financial
 NationalEconomicTrends April Household Retrenchment Sharp declines in home prices, followed by a financial crisis and a steep recession, rattled US households in Economic misfortunes have caused many to
The Economic Impact of Travel on Massachusetts Counties 2009
 The Economic Impact of Travel on Massachusetts Counties 2009 A Study Prepared for the Massachusetts Office of Travel and Tourism by the Research Department of the U.S. Travel Association Washington, D.C.
In 2010, the first of the Baby Boom generation will
 NationalEconomicTrends September 7 Can Social Security Survive the Baby Boomers? In 1, the first of the Baby Boom generation will reach age Many will choose to begin what they hope will be a long and financially
Individual households and firms, as well as local, state,
 NationalEconomicTrends February 9 How Accu Are Forecasts in a Recession? Individual households and firms, as well as local, state, and federal governments, make economic decisions based on their view of
ECON 3010 Intermediate Macroeconomics. Chapter 2 The Data of Macroeconomics
 ECON 3010 Intermediate Macroeconomics Chapter 2 The Data of Macroeconomics IN THIS CHAPTER, YOU WILL LEARN: the meaning and measurement of the most important macroeconomic statistics: gross domestic product
NationalEconomicTrends
 NationalEconomicTrends January 000 The Economic Outlook for 000: Bulls on Parade? The heartening U.S. economic performance during the past four years has seemingly benefited everyone except those in the
ctrends Nominal Vs. Real Wage Growth Growth of Wages Percent Change From Year Ago August 1997
 ctrends August 1997 Nominal Vs. Real Wage Growth Nominal wages, measured by nonfarm compensation per hour, grew at an average annual rate of 5.5 percent between 1947 and 1973 and 6 percent between 1973
NationalEconomicTrends
 NationalEconomicTrends August 1999 Historical CPI Inflation Under Current Calculation Methods During the 1990s, a much-discussed topic among policymakers and in financial markets has been the possibility
The Economic Impact Of Travel on Massachusetts Counties 2015
 The Economic Impact Of Travel on Massachusetts Counties 2015 A Study Prepared for the Massachusetts Office of Travel and Tourism By the Research Department of the U.S. Travel Association Washington, D.C.
Economic Update and Outlook
 Economic Update and Outlook NAIOP Vancouver Chapter Breakfast Seminar Thursday, November 18, 2010 Helmut Pastrick Chief Economist Central 1 Credit Union Outline: Global and U.S. economies Canadian economy
NationalEconomicTrends
 NationalEconomicTrends October 001 Give Me Your Skilled. A previous issue of National Economic Trends (January 001) identified the role of immigration in sustaining the rate of U.S. population growth in
Since the financial crisis began in mid-2007, media
 NationalEconomicTrends August Commercial Bank Lending Data during the Crisis: Handle with Care Since the financial crisis began in mid-7, media sources and academics alike have scrutinized data from the
Topic 2: Macroeconomic Data. (chapter 2) revised 9/15/09. CHAPTER 2 The Data of Macroeconomics slide 0
 revised 9/15/09. CHAPTER 2 The Data of Macroeconomics slide 0") Topic 2: Macroeconomic Data (chapter 2) revised 9/15/09 CHAPTER 2 The Data of Macroeconomics slide 0 Learning objectives In this chapter, you will learn about how we define and measure: Gross Domestic
Topic 2: Macroeconomic Data (chapter 2) revised 9/15/09 CHAPTER 2 The Data of Macroeconomics slide 0 Learning objectives In this chapter, you will learn about how we define and measure: Gross Domestic
Recently the Federal Open Market Committee
 NationalEconomicTrends Deflation, Corrosive and Otherwise Recently the Federal Open Market Committee (FOMC) mentioned deflation as a possible risk for the U.S. economy. In the statement released after
The U.S. economy s remarkable resilience in the face
 NationalEconomicTrends May Please see page for important information about your subscription Entrepreneurship The US economy s remarkable resilience in the face of shocks arguably owes to an array of institutions
Price and Volume Measures Rebasing & Linking
 Regional Course on 2008 SNA (Special Topics): Improving Exhaustiveness of GDP coverage 31 August 4 September 2015 Daejeon, Republic of Korea Price and Volume Measures Rebasing & Linking Alick Nyasulu Statistical
MACROECONOMICS. The Data of Macroeconomics MANKIW. In this chapter, you will learn. Gross Domestic Product: Expenditure and Income.
 C H A P T E R 2 The Data of Macroeconomics MACROECONOMICS N. GREGORY MANKIW 2008 Worth Publishers, all rights reserved SIXTH EDITION PowerPoint Slides by Ron Cronovich In this chapter, you will learn the
COMPTROLLER LEMBO REPORTS EARLY INDICATIONS THAT STATE COULD END FISCAL YEAR 2019 IN SURPLUS
 COMPTROLLER LEMBO REPORTS EARLY INDICATIONS THAT STATE COULD END FISCAL YEAR 2019 IN SURPLUS Comptroller Kevin Lembo today said that there are reasons for cautious optimism that the state could end Fiscal
The effect that housing has on the economy has received
 NationalEconomicTrends May Boom & Gloom in Housing Markets: The Sequel The effect that housing has on the economy has received increased attention in recent years first for the recordhigh boom in house
Preview of the 2018 Comprehensive Update of the National Income and Product Accounts
 Preview of the 2018 Comprehensive Update of the National Income and Product Accounts Pamela Kelly, Erich H. Strassner, and David B. Wasshausen National Association for Business Economics Webinar June 28,
U.S. Economy and Financial Markets
 U.S. Economy and Financial Markets Economic Growth and Output Business Income and Finance Business Inventory Business Investment Consumption Housing Investment Income and Savings U.S. Aggregate Demand
The U.S. economy has experienced sustained trend
 NationalEconomicTrends October Some Incomes Are Less Average than Others The US economy has experienced sustained trend growth of GDP and a decline in the volatility of macroeconomic variables since the
Construction Spending, Labor and Materials Outlook. NASFA Webinar March 15, 2018 Ken Simonson Chief Economist, AGC of America
 Construction Spending, Labor and Materials Outlook NASFA Webinar March 15, 2018 Ken Simonson Chief Economist, AGC of America simonsonk@agc.org AGC members expectations for 2018 Net % who expect dollar
macro macroeconomics The Data of Macroeconomics N. Gregory Mankiw CHAPTER TWO 6 th edition
 macro CHAPTER TWO The Data of Macroeconomics macroeconomics 6 th edition N. Gregory Mankiw Learning objectives In this chapter, you will learn about: Gross Domestic Product (GDP) the Consumer Price Index
Generation and Interpretation of IMPLAN s Tax Impact Report IMPLAN Group LLC
 Generation and Interpretation of IMPLAN s Tax Impact Report IMPLAN Group LLC Introduction This paper describes the wealth of information available in an IMPLAN Social Accounting Matrix (SAM) and how that
Notes II: Measuring the Economy
 Notes II: Measuring the Economy Julio Garín Intermediate Macroeconomics Spring 2018 Intermediate Macroeconomics Notes II - Measuring the Economy Spring 2018 1 / 72 Preliminaries While the GDP and the rest
Macroeconomics CHAPTER 7. Tracking the Macroeconomy
 Macroeconomics CHAPTER 7 Tracking the Macroeconomy PowerPoint Slides by Can Erbil 2006 Worth Publishers, all rights reserved What you will learn in this chapter: How economists use aggregate measures to
The Relative Price Index The CPI and the implications of changing cost pressures on various household groups
 The Relative Price Index The CPI and the implications of changing cost pressures on various household groups Couple with three or more dependent children Renter Unemployment and student allowances Australia
Ch 2. National Income Accounting ECO 402
 Ch 2. National Income Accounting ECO 402 Key Words The circular flow Three approaches to measuring national income Production Income Expenditure Value added Final goods and intermediate goods Gross domestic
Lecture 4: Real GDP, the First of the Big 3 Economic Activity Variables
 Lecture 4: Real GDP, the First of the Big 3 Economic Activity Variables Economists focus on the outlook for material progress. To generate an opinion about overall economic activity, economists perform
Many analysts have argued that a housing boom preceded
 NationalEconomicTrends September The Financial Services Sector: Boom and Recession Many analysts have argued that a housing boom preceded the recent financial crisis and economic slowdown Innovations in
The Economic Impact of Travel on Massachusetts Counties 2016
 The Economic Impact of Travel on Massachusetts Counties 2016 A Study Prepared for the Massachusetts Office of Travel and Tourism By the Research Department of the U.S. Travel Association Washington, D.C.
The 31st Voorburg Group Meeting on Service Statistics Zagreb, Croatia, September 2016
 The 31st Voorburg Group Meeting on Service Statistics Zagreb, Croatia, 19 23 September 2016 Mini-Presentation by Bonnie Murphy United States Producer Price Index (PPI) for Securities Brokerage NAICS 523120
Evaluating Consumer Price Behavior Using JMP. Joshua Klick, Bureau of Labor Statistics, Washington DC
 Paper JP-05 Evaluating Consumer Price Behavior Using JMP Joshua Klick, Bureau of Labor Statistics, Washington DC ABSTRACT The Consumer Price Index for the urban population (CPI-U) represents the month-to-month
Practice Problems: Chapter 7 Tracking the Macroeconomy
 Practice Problems: Chapter 7 Tracking the Macroeconomy 1. The national accounts keep track of: A) the spending of consumers and the government. B) the sales of producers. C) business investment. D) all
Activity 20.1 U.S. Quarterly Real GDP ( )
") Activity 20.1 U.S. Quarterly Real GDP (1979 2013) (in billions of chained 2009 dollars) Year & Quarter Real GDP Year & Quarter Real GDP Year & Quarter Real GDP Year & Quarter Real GDP 1979 Q1 6,426.1 1988
Activity 20.1 U.S. Quarterly Real GDP (1979 2013) (in billions of chained 2009 dollars) Year & Quarter Real GDP Year & Quarter Real GDP Year & Quarter Real GDP Year & Quarter Real GDP 1979 Q1 6,426.1 1988
TRAINING COURSE ON PRICE STATISTICS JULY, 2017, BANDAR SERI BEGAWAN, BRUNEI DARUSSALAM PRICE STATISTICS IN BRUNEI DARUSSALAM
 TRAINING COURSE ON PRICE STATISTICS 18 20 JULY, 2017, BANDAR SERI BEGAWAN, BRUNEI DARUSSALAM PRICE STATISTICS IN BRUNEI DARUSSALAM Department of Statistics Department of Economic Planning and Development
Gross Domestic Product, Third Quarter 2018 (Third Estimate) Corporate Profits, Third Quarter 2018 (Revised Estimate)
 Corporate Profits, Third Quarter 2018 (Revised Estimate)") EMBARGOED UNTIL RELEASE AT 8:30 A.M. EST, FRIDAY, DECEMBER 21, 2018 BEA 18-71 Technical: Lisa Mataloni (GDP) (301) 278-9083 gdpniwd@bea.gov Kate Pinard (Corporate Profits) (301) 278-9417 cpniwd@bea.gov
EMBARGOED UNTIL RELEASE AT 8:30 A.M. EST, FRIDAY, DECEMBER 21, 2018 BEA 18-71 Technical: Lisa Mataloni (GDP) (301) 278-9083 gdpniwd@bea.gov Kate Pinard (Corporate Profits) (301) 278-9417 cpniwd@bea.gov
Tanzania. A: Identification. B: CPI Coverage. Title of the CPI: National Consumer Price Index (NCPI)
") Tanzania A: Identification Title of the CPI: National Consumer Price Index (NCPI) Organisation responsible: National Bureau of Statistics (NBS) Periodicity: Monthly Price reference period: September 2010
Tanzania A: Identification Title of the CPI: National Consumer Price Index (NCPI) Organisation responsible: National Bureau of Statistics (NBS) Periodicity: Monthly Price reference period: September 2010
Chapter 2: The Data of Macroeconomics*
 Chapter 2: The Data of Macroeconomics 1/40 *Slides based on Ron Cronovich's slides, adjusted by Marcel Bluhm for lecture in Macroeconomics at the Wang Yanan Institute for Studies in Economics at Xiamen
Policymakers at the Federal Reserve wage preemptive
 NationalEconomicTrends February The Long-Run Benefits of Sustained Low Inflation Policymakers at the Federal Reserve wage preemptive wars against inflation; that is, they tend to tighten monetary policy
EMBARGOED UNTIL RELEASE AT 8:30 A.M. EST, TUESDAY, NOVEMBER 25, 2003
 EMBARGOED UNTIL RELEASE AT 8:30 A.M. EST, TUESDAY, NOVEMBER 25, 2003 Virginia H. Mannering: (202) 606-5304 (GDP) BEA 03-45 Kenneth A. Petrick: (202) 606-9738 (Profits) Recorded message: (202) 606-5306
A STRUCTURED APPROACH TO PRICE AND VOLUME MEASURES IN THE NATIONAL ACCOUNTS
 A STRUCTURED APPROACH TO PRICE AND VOLUME MEASURES IN THE NATIONAL ACCOUNTS Presentation to the Regional Seminar on Developing a Programme for the Implementation of the 2008 SNA in the Pacific Region Carl
Construction Spending, Labor and Materials Outlook
 Construction Spending, Labor and Materials Outlook AGC Nebraska Building Chapter Kearney, January 23, 2018 Ken Simonson Chief Economist, AGC of America simonsonk@agc.org AGC members expectations for 2018
The Colossus. Reindustrialization in the New World
 The Colossus Reindustrialization in the New World Click to edit Master subtitle style Richard Hastings Macro Strategist Global Hunter Securities, LLC 949.335.0686 rhastings@ghsecurities.com This is not
Economic Update and Outlook
 1 Economic Update and Outlook NAIOP Vancouver Chapter Breakfast Seminar Thursday, November 17, 2011 Helmut Pastrick Chief Economist Central 1 Credit Union 2 Outline: Global and U.S. economies Canadian
The National Bureau of Economic Research (NBER)
") NationalEconomicTrends July Using Stock Market Liquidity to Forecast Recessions The National Bureau of Economic Research (NBER) Business Cycle Dating Committee (the committee that dates U.S. recessions)
NationalEconomicTrends July Using Stock Market Liquidity to Forecast Recessions The National Bureau of Economic Research (NBER) Business Cycle Dating Committee (the committee that dates U.S. recessions)
National Economic Indicators. May 7, 2018
 National Economic Indicators May 7, 18 Table of Contents GDP Release Date Latest Period Page Table: Real Gross Domestic Product Apr-7-18 8:31 Q1-18 Real Gross Domestic Product Apr-7-18 8:31 Q1-18 5 Decomposition
The 2015 Economic Impact Study of the Recreation Vehicle Industry
 The 2015 Economic Impact Study of the Recreation Vehicle Industry Methodology Prepared for Recreation Vehicle Industry Association 1896 Preston White Drive Reston, VA 20191 By John Dunham & Associates,
Chapter 2: The Data of Macroeconomics
 Chapter 2: The Data of Macroeconomics 0 IN THIS CHAPTER, YOU WILL LEARN: the meaning and measurement of the most important macroeconomic statistics:! gross domestic product (GDP)! the consumer price index
Learning objectives. Gross Domestic Product
 Learning objectives In this chapter, you will learn about: Gross Domestic Product (GDP) the Consumer Price Index (CPI) the Unemployment Rate The Data of Macroeconomics slide 1 Gross Domestic Product Two
October 2013 Non-Manufacturing ISM Report On Business
 FOR RELEASE: November 5, 2013 Contact: Rose Marie Goupil ISM, ROB Media Relations Tempe, Arizona 800/888-6276, Ext. 3015 E-mail: rgoupil@ism.ws October 2013 Non-Manufacturing ISM Report On Business NMI
Kazakhstan s economy expanded by 4.2% in 1H17, supported by growth in mining, manufacturing, construction and transportation sectors
 Economics Research Desk Market Highlights: Kazakhstan 18 July 2017 Kazakhstan s economy expanded by 4.2% in 1H17, supported by growth in mining, manufacturing, construction and transportation sectors Review
Nauru. Key Indicators for Asia and the Pacific Item
 Key Indicators for Asia and the Pacific 2018 1 POPULATION Total population a as of 1 July ( 000) 10.1 10.1 10.1 9.9 9.7 9.5 9.1 9.2 9.4 9.5 9.7 10.1 10.3 10.8 11.9 12.5 13.0 13.3 Population density (persons/km
macroeconomics The Data of Macroeconomics N. Gregory Mankiw CHAPTER TWO PowerPoint Slides by Ron Cronovich fifth edition
 CHAPTER TWO The Data of Macroeconomics macroeconomics fifth edition N. Gregory Mankiw PowerPoint Slides by Ron Cronovich 2002 Worth Publishers, all rights reserved Learning objectives In this chapter,
GROSS DOMESTIC PRODUCT
 GROSS DOMESTIC PRODUCT September 2014 2013 HIGHLIGHTS GDP = $5.6 billion, marginally up 0.7% in 2013 In 2013, Gross Domestic Product (GDP), which measures the total value of goods and services produced
2018 Gary R. Evans. This slide set by Gary R. Evans is licensed under a Creative Commons Attribution-NonCommercial-ShareAlike 4.
 Price Behavior, Inflation and Deflation Problems and solutions 2018 Gary R. Evans. This slide set by Gary R. Evans is licensed under a Creative Commons Attribution-NonCommercial-ShareAlike 4.0 International
Macroeconomics, 6e (Williamson) Chapter 2 Measurement. 2.1 Multiple-Choice Questions
 Chapter 2 Measurement. 2.1 Multiple-Choice Questions") Macroeconomics, 6e (Williamson) Chapter 2 Measurement 2.1 Multiple-Choice Questions 1) NIPA means A) New Income and Price Accounting. B) National Investment and Productivity Approach. C) Neutral Increase
Macroeconomics, 6e (Williamson) Chapter 2 Measurement 2.1 Multiple-Choice Questions 1) NIPA means A) New Income and Price Accounting. B) National Investment and Productivity Approach. C) Neutral Increase
Harmonization of base years for index numbers Committee for the Coordination of Statistical Activities September 2004
 Harmonization s for index numbers for the Coordination Activities Title the index number Demography and population rement rement Comments related to Housing Labour Manufacturing Wage Indices ILO 1990 1999
The Data of Macroeconomics
 C H A P T E R 2 MACROECONOMICS SIXTH EDITION N. GREGORY MANKIW PowerPoint Slides by Ron Cronovich 2008 Worth Publishers, all rights reserved In this chapter, you will learn the meaning and measurement
The Economic Impact of Tourism in New York Calendar Year Long Island Focus
 The Economic Impact of Tourism in New York 2010 Calendar Year Long Island Focus Key themes in 2010 The New York State visitor economy rebounded in 2010, recovering 94% of the losses experienced during
GDP Measuring Output and Income Part II. Alternative Measures Real World Approximations. September 13 th, 2017
 GDP Measuring Output and Income Part II Alternative Measures Real World Approximations September 13 th, 2017 But First: A Continual Challenge: Connecting words and equations We describe economic circumstances
The Economic Impact of Tourism in New York
 The Economic Impact of Tourism in New York 2010 Calendar Year Greater Niagara Focus Key themes in 2010 The New York State visitor economy rebounded in 2010, recovering 94% of the losses experienced during
Measuring the Cost of Living
 C H A P T E R 24 Measuring the Cost of Living Economics P R I N C I P L E S O F N. Gregory Mankiw Premium PowerPoint Slides by Ron Cronovich 2009 South-Western, a part of Cengage Learning, all rights reserved
Price Indices: Part 3
 Price Indices: Part 3 MEASUREMENT ECONOMICS ECON 4700 Today Inflation Rates of Change Price Indexes The CPI Problems with inflation measures Prices Division 2 Great inflations of the 20th Century Price
Macroeconomics. Measuring the Cost of Living 8/6/2013. How the CPI Is Calculated. How the CPI Is Calculated. The Consumer Price Index (CPI)
") N. Gregory Mankiw Principles of Macroeconomics Sixth Edition 11 Measuring the Cost of Living Premium PowerPoint Slides by Ron Cronovich How the CPI Is Calculated 1. Fix the basket. The Bureau of Labor
N. Gregory Mankiw Principles of Macroeconomics Sixth Edition 11 Measuring the Cost of Living Premium PowerPoint Slides by Ron Cronovich How the CPI Is Calculated 1. Fix the basket. The Bureau of Labor
How Nevada's Economy Benefits from International Trade & Investment
 How Nevada's Economy Benefits from International Trade & Investment With more than 95 percent of the world s population and 80 percent of the world s purchasing power outside the United States, future
BLS Spotlight on Statistics: BLS 125th Anniversary
 Cornell University ILR School DigitalCommons@ILR Federal Publications Key Workplace Documents 6-2009 BLS Spotlight on Statistics: BLS 125th Anniversary Bureau of Labor Statistics Follow this and additional
Economic growth. The economy s need for workers originates in
 Economic growth 40 The economy s need for workers originates in the demand for the goods and services that they provide. So, in order to project employment, BLS starts by estimating the production of final
Macroeconomics. Measuring the Cost of Living. The Consumer Price Index (CPI) In this chapter, look for the answers to these questions:
 In this chapter, look for the answers to these questions:") C H A P T E R 6 Measuring the Cost of Living B R I E F P R I N C I P L E S O F Macroeconomics N. Gregory Mankiw Premium PowerPoint Slides by Ron Cronovich 2010 South-Western, a part of Cengage Learning,
C H A P T E R 6 Measuring the Cost of Living B R I E F P R I N C I P L E S O F Macroeconomics N. Gregory Mankiw Premium PowerPoint Slides by Ron Cronovich 2010 South-Western, a part of Cengage Learning,
The Economic Impact of Tourism in New York
 The Economic Impact of Tourism in New York 2010 Calendar Year Chautauqua Allegheny Focus Key themes in 2010 The New York State visitor economy rebounded in 2010, recovering 94% of the losses experienced
EMBARGOED UNTIL RELEASE AT 8:30 A.M. EST, THURSDAY, MARCH 30, 2006
 NEWS RELEASE EMBARGOED UNTIL RELEASE AT 8:30 A.M. EST, THURSDAY, MARCH 30, 2006 Virginia H. Mannering: (202) 606-5304 (GDP) BEA 06-11 Greg Key: (202) 606-9727 (Profits) Recorded message: (202) 606-5306
Real GDP: Percent change from preceding quarter
 EMBARGOED UNTIL RELEASE AT 8:30 A.M. EDT, THURSDAY, MARCH 28, 2019 BEA 19-12 Technical: David Sullivan (301) 278-9083 gdpniwd@bea.gov Kate Pinard (Corporate Profits) (301) 278-9417 cpniwd@bea.gov Media:
Organisation responsible: Statistical Office of the Slovak Republic (SO SR) Index reference period: December year t-1=100, December 2000=100
 Index reference period: December year t-1=100, December 2000=100") Slovak Republic A: Identification Title of the CPI: Consumer Price Index Organisation responsible: Statistical Office of the Slovak Republic (SO SR) Periodicity: Monthly Price reference period: December
Slovak Republic A: Identification Title of the CPI: Consumer Price Index Organisation responsible: Statistical Office of the Slovak Republic (SO SR) Periodicity: Monthly Price reference period: December
Measuring Domestic Output and National Income
 Chapter 27 Measuring Domestic Output and National Income Assessing the Economy s Performance National income accounting measures economy s overall performance Bureau of Economic Analysis compiles National
How California's Economy Benefits from International Trade & Investment
 How California's Economy Benefits from International Trade & Investment With more than 95 percent of the world s population and 80 percent of the world s purchasing power outside the United States, future
Volume Title: International Trade in Services and Intangibles in the Era of Globalization
 This PDF is a selection from a published volume from the National Bureau of Economic Research Volume Title: International Trade in Services and Intangibles in the Era of Globalization Volume Author/Editor:
Population coverage: Resident households of nationals and resident households of foreigners in the country.
 South Africa A: Identification Title of the CPI: Consumer Price Index (P0141) Organisation responsible: Statistics South Africa (Stats SA) Periodicity: Monthly Price reference period: 2008 Index reference
PRESS RELEASE. The evolution of the Consumer Price Index (CPI) of March 2018 (reference year 2009=100.0) is depicted as follows:
 of March 2018 (reference year 2009=100.0) is depicted as follows:") HELLENIC REPUBLIC HELLENIC STATISTICAL AUTHORITY Piraeus, 13 April 2018 PRESS RELEASE CONSUMER PRICE INDEX: March 2018, annual inflation -0.2% The evolution of the Consumer Price Index (CPI) of March 2018
HELLENIC REPUBLIC HELLENIC STATISTICAL AUTHORITY Piraeus, 13 April 2018 PRESS RELEASE CONSUMER PRICE INDEX: March 2018, annual inflation -0.2% The evolution of the Consumer Price Index (CPI) of March 2018
Economic Outlook. Connecticut Economic Resource Center, Inc.
 Economic Outlook Alissa DeJonge Vice President of Research January 2018 Connecticut Economic Resource Center, Inc. Private, nonprofit organization; founded in 1992 CERC drives economic development in Connecticut
Single-family home sales and construction are not expected to regain 2005 peaks
 Single-family home sales and construction are not expected to regain 25 peaks Millions of units 8. 7. 6. 5. Housing starts (right axis) 4. Home sales (left axis) 3. 2. 1. 198 1985 199 1995 2 25 21 215
Economic Outlook. Presented to IPMA Executive Seminar. Steve Lerch Chief Economist & Executive Director. September 25, 2012 Chelan, Washington
 Presented to IPMA Executive Seminar Steve Lerch Chief Economist & Executive Director Chelan, Washington WASHINGTON STATE ECONOMIC AND REVENUE FORECAST COUNCIL Summary The updated economic forecast is very
Inflation Education. September Spear Street, Suite 950 San Francisco, CA Phone:
 Inflation Education September 2014 150 Spear Street, Suite 950 San Francisco, CA 94105 Phone: 866-627-6984 DISCLAIMER The charts in this presentation are for illustrative purposes only. Individual clients
SOMALILAND CONSUMER PRICE INDEX
 Methodology This publication provides monthly Consumer Price Indices Composite of Somaliland which is based on two main market baskets of Hargeisa urban households. The current Consumer Price Index was
COMMENTARY NUMBER 378 June Retail Sales, PPI, May Trade Deficit. July 14, 2011
 COMMENTARY NUMBER 378 June Retail Sales, PPI, May Trade Deficit July 14, 2011 At Best, Inflation-Adjusted Retail Sales Showed No Growth in Second-Quarter 2011 Trade Data Should Offer a Positive Contribution
CONSUMER PRICE INDEX
 CONSUMER PRICE INDEX (Base period: January December 2012 = 100) 3 rd Quarter 2017 1. INTRODUCTION This issue of Economic and Social Indicators presents the Consumer Price Index (CPI) for the third quarter