Confidence Intervals for the Mean. When σ is known
|
|
|
- Willis McKinney
- 5 years ago
- Views:
Transcription
1 Confidence Intervals for the Mean When σ is known
2 Objective Find the confidence interval for the mean when s is known.
3 Intro Suppose a college president wishes to estimate the average age of students attending classes this semester. The president could select a random sample of 100 students and find the average age of these students, say, 22.3 years. From the sample mean, the president could infer that the average age of all the students is 22.3 years. This type of estimate is called a.
4 Determine why other measures of central tendency, such as the median and mode, are not used to estimate the population mean. Sample measures (i.e., statistics) are used to estimate population measures (i.e., parameters). These statistics are called.
5 A Good Estimator The estimator should be an estimator. That is, the expected value or the mean of the estimates obtained from samples of a given size is equal to the parameter being estimated. The estimator should be ; i.e., as sample size increases, the value of the estimator approaches the value of the parameter estimated. The estimator should be a estimator. That is, of all the statistics that can be used to estimate a parameter, the relatively efficient estimator has the smallest variance.
6 Confidence Intervals An of a parameter is an interval or a range of values used to estimate the parameter. This estimate may or may not contain the value of the parameter being estimated. The parameter is specified as being between two values. For example, an interval estimate for the average age of all students might be 26.9 m 27.7, or years.
7 Confidence Intervals The of an interval estimate of a parameter is the probability that the interval estimate will contain the parameter, assuming that a large number of samples are selected and that the estimation process on the same parameter is repeated. A is a specific interval estimate of a parameter determined by using data obtained from a sample and by using the specific confidence level of the estimate.
8 Confidence Intervals Three common confidence intervals are used: the 90, the 95, and the 99% confidence intervals. The central limit theorem states that when the sample size is large, approximately 95% of the sample means taken from a population and same sample size will fall within 1.96 standard errors of the population mean, that is,

9 The is the maximum likely difference between the point estimate of a parameter and the actual value of the parameter. Rounding Rule for a Confidence Interval for a Mean When you are computing a confidence interval for a population mean by using raw data, round off to one more decimal place than the number of decimal places in the original data.
10 Example #1: Days It Takes to Sell an Aveo A researcher wishes to estimate the number of days it takes an automobile dealer to sell a Chevrolet Aveo. A sample of 50 cars had a mean time on the dealer s lot of 54 days. Assume the population standard deviation to be 6.0 days. Find the best point estimate of the population mean and the 95% confidence interval of the population mean.

11 Example #1: Days It Takes to Sell an Aveo
12 Example #2: Ages of Automobiles A survey of 30 adults found that the mean age of a person s primary vehicle is 5.6 years. Assuming the standard deviation of the population is 0.8 year, find the best point estimate of the population mean and the 99% confidence interval of the population mean.

13 Example #2: Ages of Automobiles
14 You Do! Data on a sample of the assets (in millions of dollars) of 30 credit unions in southwestern Pennsylvania has been used. The mean is Assume the standard deviation of the population is Find the 90% confidence interval of the mean.

15 You Do!
16 Do Now / Warm-up A recent study showed that high school students experience an average of 4.8 hours per day of distractions (phone calls, e- mails, side conversations, etc.). A random sample of 100 high school students in P.K. Yonge for the Statistics instructor found that these students were distracted an average of 3.6 hours per day and the population standard deviation was 45 minutes. Estimate the true mean population distraction time with 95% confidence, and compare your answer to the results of the study.
17 Confidence Intervals for the Mean Sample size
18 Objective Determine the minimum sample size for finding a confidence interval for the mean.
19 Sample Size Sample size determination is closely related to statistical estimation. In stats and research, quite often you ask: How large a sample is necessary to make an accurate estimate? The answer is not simple, since it depends on three things: #1: #2: #3: How close to the true mean do you want to be (2 units, 5 units, etc.)? How confident do you wish to be (90, 95, 99%, etc.)? Assumption in this topic: population standard deviation of the variable is known or has been estimated from a previous study.
20 Sample Size Formula The formula for sample size is derived from the maximum error of the estimate formula and solved for n.
21 Depth of a River A scientist wishes to estimate the average depth of a river. He wants to be 99% confident that the estimate is accurate within 2 feet. From a previous study, the standard deviation of the depths measured was 4.38 feet.
22 Depth of a River A scientist wishes to estimate the average depth of a river. He wants to be 99% confident that the estimate is accurate within 2 feet. From a previous study, the standard deviation of the depths measured was 4.38 feet. Round the value up to 32. Therefore, to be 99% confident that the estimate is within 2 feet of the true mean depth, the scientist needs at least a sample of 32 measurements.
23 Health Insurance Coverage for Children A federal report stated that 88% of children under age 18 were covered by health insurance in How large a sample is needed to estimate the true proportion of covered children with 90% confidence with a confidence interval 0.05 wide?
24 Health Insurance Coverage for Children A federal report stated that 88% of children under age 18 were covered by health insurance in How large a sample is needed to estimate the true proportion of covered children with 90% confidence with a confidence interval 0.05 wide? Solution: It does not give you a standard deviation, so for now, you can t determined! Answer is 460, because there is a way to estimate when standard deviation is not known and information is given in proportions (for example, 88% of the children) n = pq z E 2 = (0. 88)(0. 12) =
25 Health Insurance Coverage for Children A federal report stated that 88% of children under age 18 were covered by health insurance in How large a sample is needed to estimate the true proportion of covered children with 90% confidence with a confidence interval 0.05 wide?
26 Health Insurance Coverage for Children A federal report stated that 88% of children under age 18 were covered by health insurance in How large a sample is needed to estimate the true proportion of covered children with 90% confidence with a confidence interval 0.05 wide? Solution: It does not give you a standard deviation, so on Wednesday, you weren t able to determine it! Answer is 460, because there is a way to estimate when standard deviation is not known and information is given in proportions (for example, 88% of the children) n = pq z E 2 = (0. 88)(0. 12) =
27 Confidence Intervals for the Mean When σ is unknown
28 Objective Find the confidence interval for the mean when σ is unknown.
29 What we know so far When σ is known and the sample size is 30 or more, or the population is normally distributed if sample size is less than 30, the confidence interval for the mean can be found by using the z distribution
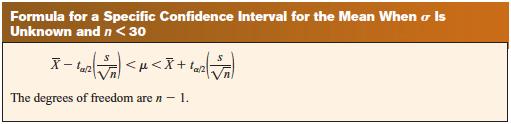
30 However, Most of the time, the value of σ is not known so it must be estimated by using s, namely, the standard deviation of the sample. When s is used, especially when the sample size is small, critical values greater than the values for the z distribution are used in confidence intervals in order to keep the interval at a given level, such as the 95%. These values are taken from the Student t distribution, most often called the.
31 Characteristics of the t distribution The t distribution shares some characteristics of the normal distribution: It is bell-shaped. It is symmetric about the mean. The mean, median, and mode are equal to 0 and are located at the center of the distribution. The curve never touches the x axis.
32 Characteristics of the t distribution The t distribution differs from the standard normal distribution in: The variance is greater than 1. The t distribution is actually a family of curves based on the concept of degrees of freedom, which is related to sample size. As the sample size increases, the t distribution approaches the standard normal distribution.
33 Degrees of Freedom Many statistical distributions use the concept of degrees of freedom, and the formulas for finding the degrees of freedom vary for different statistical tests. The degrees of freedom are the number of values that are free to vary after a sample statistic has been computed, and they tell the researcher which specific curve to use when a distribution consists of a family of curves. The symbol d.f. will be used for degrees of freedom. The degrees of freedom for a confidence interval for the mean are found by subtracting 1 from the sample size. That is, d.f. = n 1.
34
35 Find the t α/2 value for a 95% confidence interval when the sample size is 22.
36 Sleeping Time Ten randomly selected people were asked how long they slept at night. The mean time was 7.1 hours, and the standard deviation was 0.78 hour. Find the 95% confidence interval of the mean time. Assume the variable is normally distributed.

37 Sleeping Time
38 Home Fires Started by Candles Data from the National Fire Protection Association on a sample of the number of home fires started by candles for the past several years have a mean of 7,041.4 and a standard deviation of 1, Find the 99% confidence interval for the mean number of home fires started by candles each year.

39 Home Fires Started by Candles
40 DO NOW Find your number in the lists posted in the bulletin boards (back wall and main entrance). Find the seat with your number and that will be your seat from now on. SILENCE YOUR PHONE and put it in the pocket that has your number in the bulletin board (back wall). NO EXCEPTIONS and NO PHONES in backpack. If I see your phone, I will take it!!! No food allowed in my room. Finish your food outside before you enter my classroom.
41 Confidence Intervals and Sample Size for Proportions
42 Objectives Find the confidence interval for a proportion. Determine the minimum sample size for finding a confidence interval for a proportion.
43 Proportions In USA TODAY it was revealed that 12% of the pleasure boats in the United States were named Serenity. The parameter 12% is called a. It means that of all the pleasure boats in the United States, 12 out of every 100 are named Serenity. A proportion represents a of a whole. It can be expressed as a fraction, decimal, or percentage. Proportions can also represent probabilities. In this case, if a pleasure boat is selected at random, the probability that it is called Serenity is.
44 For example, In a study, 200 people were asked if they were satisfied with their job or profession; 162 said that they were. If p represents the proportion of those surveyed who were satisfied with their job or profession, determine the value of q*.
45 For example, In a study, 200 people were asked if they were satisfied with their job or profession; 162 said that they were. If p represents the proportion of those surveyed who were satisfied with their job or profession, determine the value of q*. p, = = The proportion of people who did not respond favorably when asked if they were satisfied with their job or profession constituted q,. q, = 1 p, = = 0. 19
46 Air Conditioned Households In a recent survey of 150 households, 54 had central air conditioning. Find p and q*, where p is the proportion of households that have central air conditioning.
47 Air Conditioned Households In a recent survey of 150 households, 54 had central air conditioning. Find p and q*, where p is the proportion of households that have central air conditioning. p, = = The proportion of households that do not have central air conditioned constituted q,. q, = 1 p, = = 0. 64
48 Confidence Intervals To construct a confidence interval about a proportion, you must use the maximum error of the estimate, which is E = z α/2 p,q, Remember that p n 5 and q*n 5. When you find E you add it to and subtract it from the proportion. Rounding Rule for a Confidence Interval for a Proportion Round off to three decimal places. n
49 Male Nurses A sample of 500 nursing applications included 60 from men. Find the 90% confidence interval of the true proportion of men who applied to the nursing program.
50 Male Nurses A sample of 500 nursing applications included 60 from men. Find the 90% confidence interval of the true proportion of men who applied to the nursing program. E = z α/2 p,q, n = (0. 88) 500 = true proportion of men who applied to the nursing program. This is 0.12 ± error < p < Hence, you can be 90% confident that the percentage of applicants who are men is between 9.6 and 14.4%.
51 Religious Books A survey of 1721 people found that 15.9% of individuals purchase religious books at a Christian bookstore. Find the 95% confidence interval of the true proportion of people who purchase their religious books at a Christian bookstore.
52 Religious Books A survey of 1721 people found that 15.9% of individuals purchase religious books at a Christian bookstore. Find the 95% confidence interval of the true proportion of people who purchase their religious books at a Christian bookstore. You can say with 95% confidence that the true percentage is between and 17. 6%.
53 Sample Size for Proportions Just a reminder of what we have done so far with this topic To find the sample size needed to determine a confidence interval about a proportion, use this formula: n = p,q, z α/2 E 2
54 Home Computers A researcher wishes to estimate, with 95% confidence, the proportion of people who own a home computer. A previous study shows that 40% of those interviewed had a computer at home. The researcher wishes to be accurate within 2% of the true proportion. Find the minimum sample size necessary.
55 Home Computers A researcher wishes to estimate, with 95% confidence, the proportion of people who own a home computer. A previous study shows that 40% of those interviewed had a computer at home. The researcher wishes to be accurate within 2% of the true proportion. Find the minimum sample size necessary. 2, 305 executives to ask!
56 That s it for Unit 4!!! Time to work!!! UNIT 4 EXAM is on Thursday, November 30, The exam will have 10 questions. Right after you finish the exam, I want you to work on your research proposal and share with me an update of your progress. For today: Exercises 1-8 are for you to work with your partner in your table. Exercise 9-10 are for you to work independently to prove that YOU CAN find the confidence interval for a proportion and that YOU CAN determine the minimum sample size for finding a confidence interval for a proportion.
Chapter 7. Confidence Intervals and Sample Size. Bluman, Chapter 7. Friday, January 25, 13
 Chapter 7 Confidence Intervals and Sample Size 1 1 Chapter 7 Overview Introduction 7-1 Confidence Intervals for the Mean When σ Is Known and Sample Size 7-2 Confidence Intervals for the Mean When σ Is
Chapter Seven: Confidence Intervals and Sample Size
 Chapter Seven: Confidence Intervals and Sample Size A point estimate is: The best point estimate of the population mean µ is the sample mean X. Three Properties of a Good Estimator 1. Unbiased 2. Consistent
Lecture 9. Probability Distributions. Outline. Outline
 Outline Lecture 9 Probability Distributions 6-1 Introduction 6- Probability Distributions 6-3 Mean, Variance, and Expectation 6-4 The Binomial Distribution Outline 7- Properties of the Normal Distribution
Lecture 9. Probability Distributions
 Lecture 9 Probability Distributions Outline 6-1 Introduction 6-2 Probability Distributions 6-3 Mean, Variance, and Expectation 6-4 The Binomial Distribution Outline 7-2 Properties of the Normal Distribution
If the distribution of a random variable x is approximately normal, then
 Confidence Intervals for the Mean (σ unknown) In many real life situations, the standard deviation is unknown. In order to construct a confidence interval for a random variable that is normally distributed
Determining Sample Size. Slide 1 ˆ ˆ. p q n E = z α / 2. (solve for n by algebra) n = E 2
 n = E 2") Determining Sample Size Slide 1 E = z α / 2 ˆ ˆ p q n (solve for n by algebra) n = ( zα α / 2) 2 p ˆ qˆ E 2 Sample Size for Estimating Proportion p When an estimate of ˆp is known: Slide 2 n = ˆ ˆ ( )
Determining Sample Size Slide 1 E = z α / 2 ˆ ˆ p q n (solve for n by algebra) n = ( zα α / 2) 2 p ˆ qˆ E 2 Sample Size for Estimating Proportion p When an estimate of ˆp is known: Slide 2 n = ˆ ˆ ( )
Chapter 6 Confidence Intervals Section 6-1 Confidence Intervals for the Mean (Large Samples) Estimating Population Parameters
 Estimating Population Parameters") Chapter 6 Confidence Intervals Section 6-1 Confidence Intervals for the Mean (Large Samples) Estimating Population Parameters VOCABULARY: Point Estimate a value for a parameter. The most point estimate
Chapter 6 Confidence Intervals Section 6-1 Confidence Intervals for the Mean (Large Samples) Estimating Population Parameters VOCABULARY: Point Estimate a value for a parameter. The most point estimate
The Normal Probability Distribution
 1 The Normal Probability Distribution Key Definitions Probability Density Function: An equation used to compute probabilities for continuous random variables where the output value is greater than zero
Chapter 7. Confidence Intervals and Sample Sizes. Definition. Definition. Definition. Definition. Confidence Interval : CI. Point Estimate.
 Chapter 7 Confidence Intervals and Sample Sizes 7. Estimating a Proportion p 7.3 Estimating a Mean µ (σ known) 7.4 Estimating a Mean µ (σ unknown) 7.5 Estimating a Standard Deviation σ In a recent poll,
T.I.H.E. IT 233 Statistics and Probability: Sem. 1: 2013 ESTIMATION
 In Inferential Statistic, ESTIMATION (i) (ii) is called the True Population Mean and is called the True Population Proportion. You must also remember that are not the only population parameters. There
Normal Probability Distributions
 Normal Probability Distributions Properties of Normal Distributions The most important probability distribution in statistics is the normal distribution. Normal curve A normal distribution is a continuous
Statistical Intervals (One sample) (Chs )
 (Chs )") 7 Statistical Intervals (One sample) (Chs 8.1-8.3) Confidence Intervals The CLT tells us that as the sample size n increases, the sample mean X is close to normally distributed with expected value µ and
7 Statistical Intervals (One sample) (Chs 8.1-8.3) Confidence Intervals The CLT tells us that as the sample size n increases, the sample mean X is close to normally distributed with expected value µ and
8.1 Estimation of the Mean and Proportion
 8.1 Estimation of the Mean and Proportion Statistical inference enables us to make judgments about a population on the basis of sample information. The mean, standard deviation, and proportions of a population
Chapter 7. Sampling Distributions
 Chapter 7 Sampling Distributions Section 7.1 Sampling Distributions and the Central Limit Theorem Sampling Distributions Sampling distribution The probability distribution of a sample statistic. Formed
Math 227 Elementary Statistics. Bluman 5 th edition
 Math 227 Elementary Statistics Bluman 5 th edition CHAPTER 6 The Normal Distribution 2 Objectives Identify distributions as symmetrical or skewed. Identify the properties of the normal distribution. Find
5.1 Mean, Median, & Mode
 5.1 Mean, Median, & Mode definitions Mean: Median: Mode: Example 1 The Blue Jays score these amounts of runs in their last 9 games: 4, 7, 2, 4, 10, 5, 6, 7, 7 Find the mean, median, and mode: Example 2
Chapter Seven. The Normal Distribution
 Chapter Seven The Normal Distribution 7-1 Introduction Many continuous variables have distributions that are bellshaped and are called approximately normally distributed variables, such as the heights
Chapter 6 Confidence Intervals
 Chapter 6 Confidence Intervals Section 6-1 Confidence Intervals for the Mean (Large Samples) VOCABULARY: Point Estimate A value for a parameter. The most point estimate of the population parameter is the
STAT 3090 Test 2 - Version B Fall Student s Printed Name: PLEASE READ DIRECTIONS!!!!
 Student s Printed Name: Instructor: XID: Section #: Read each question very carefully. You are permitted to use a calculator on all portions of this exam. You are NOT allowed to use any textbook, notes,
1 Inferential Statistic
 1 Inferential Statistic Population versus Sample, parameter versus statistic A population is the set of all individuals the researcher intends to learn about. A sample is a subset of the population and
Statistics 13 Elementary Statistics
 Statistics 13 Elementary Statistics Summer Session I 2012 Lecture Notes 5: Estimation with Confidence intervals 1 Our goal is to estimate the value of an unknown population parameter, such as a population
STAT:2010 Statistical Methods and Computing. Using density curves to describe the distribution of values of a quantitative
 STAT:10 Statistical Methods and Computing Normal Distributions Lecture 4 Feb. 6, 17 Kate Cowles 374 SH, 335-0727 kate-cowles@uiowa.edu 1 2 Using density curves to describe the distribution of values of
Confidence Intervals and Sample Size
 Confidence Intervals and Sample Size Chapter 6 shows us how we can use the Central Limit Theorem (CLT) to 1. estimate a population parameter (such as the mean or proportion) using a sample, and. determine
Upcoming Schedule PSU Stat 2014
 Upcoming Schedule PSU Stat 014 Monday Tuesday Wednesday Thursday Friday Jan 6 Sec 7. Jan 7 Jan 8 Sec 7.3 Jan 9 Jan 10 Sec 7.4 Jan 13 Chapter 7 in a nutshell Jan 14 Jan 15 Chapter 7 test Jan 16 Jan 17 Final
Section 7-2 Estimating a Population Proportion
 Section 7- Estimating a Population Proportion 1 Key Concept In this section we present methods for using a sample proportion to estimate the value of a population proportion. The sample proportion is the
Chapter 6. The Normal Probability Distributions
 Chapter 6 The Normal Probability Distributions 1 Chapter 6 Overview Introduction 6-1 Normal Probability Distributions 6-2 The Standard Normal Distribution 6-3 Applications of the Normal Distribution 6-5
ECON 214 Elements of Statistics for Economists
 ECON 214 Elements of Statistics for Economists Session 7 The Normal Distribution Part 1 Lecturer: Dr. Bernardin Senadza, Dept. of Economics Contact Information: bsenadza@ug.edu.gh College of Education
ECON 214 Elements of Statistics for Economists 2016/2017
 ECON 214 Elements of Statistics for Economists 2016/2017 Topic The Normal Distribution Lecturer: Dr. Bernardin Senadza, Dept. of Economics bsenadza@ug.edu.gh College of Education School of Continuing and
MgtOp S 215 Chapter 8 Dr. Ahn
 MgtOp S 215 Chapter 8 Dr. Ahn An estimator of a population parameter is a rule that tells us how to use the sample values,,, to estimate the parameter, and is a statistic. An estimate is the value obtained
AMS7: WEEK 4. CLASS 3
 AMS7: WEEK 4. CLASS 3 Sampling distributions and estimators. Central Limit Theorem Normal Approximation to the Binomial Distribution Friday April 24th, 2015 Sampling distributions and estimators REMEMBER:
Example - Let X be the number of boys in a 4 child family. Find the probability distribution table:
 Chapter8 Probability Distributions and Statistics Section 8.1 Distributions of Random Variables tthe value of the result of the probability experiment is a RANDOM VARIABLE. Example - Let X be the number
LESSON 7 INTERVAL ESTIMATION SAMIE L.S. LY
 LESSON 7 INTERVAL ESTIMATION SAMIE L.S. LY 1 THIS WEEK S PLAN Part I: Theory + Practice ( Interval Estimation ) Part II: Theory + Practice ( Interval Estimation ) z-based Confidence Intervals for a Population
Example - Let X be the number of boys in a 4 child family. Find the probability distribution table:
 Chapter7 Probability Distributions and Statistics Distributions of Random Variables tthe value of the result of the probability experiment is a RANDOM VARIABLE. Example - Let X be the number of boys in
Chapter 8 Estimation
 Chapter 8 Estimation There are two important forms of statistical inference: estimation (Confidence Intervals) Hypothesis Testing Statistical Inference drawing conclusions about populations based on samples
Version A. Problem 1. Let X be the continuous random variable defined by the following pdf: 1 x/2 when 0 x 2, f(x) = 0 otherwise.
 = 0 otherwise.") Math 224 Q Exam 3A Fall 217 Tues Dec 12 Version A Problem 1. Let X be the continuous random variable defined by the following pdf: { 1 x/2 when x 2, f(x) otherwise. (a) Compute the mean µ E[X]. E[X] x
Math 224 Q Exam 3A Fall 217 Tues Dec 12 Version A Problem 1. Let X be the continuous random variable defined by the following pdf: { 1 x/2 when x 2, f(x) otherwise. (a) Compute the mean µ E[X]. E[X] x
Chapter 7 presents the beginning of inferential statistics. The two major activities of inferential statistics are
 Chapter 7 presents the beginning of inferential statistics. Concept: Inferential Statistics The two major activities of inferential statistics are 1 to use sample data to estimate values of population
Continuous Probability Distributions & Normal Distribution
 Mathematical Methods Units 3/4 Student Learning Plan Continuous Probability Distributions & Normal Distribution 7 lessons Notes: Students need practice in recognising whether a problem involves a discrete
Making Sense of Cents
 Name: Date: Making Sense of Cents Exploring the Central Limit Theorem Many of the variables that you have studied so far in this class have had a normal distribution. You have used a table of the normal
CH 5 Normal Probability Distributions Properties of the Normal Distribution
 Properties of the Normal Distribution Example A friend that is always late. Let X represent the amount of minutes that pass from the moment you are suppose to meet your friend until the moment your friend
19. CONFIDENCE INTERVALS FOR THE MEAN; KNOWN VARIANCE
 19. CONFIDENCE INTERVALS FOR THE MEAN; KNOWN VARIANCE We assume here that the population variance σ 2 is known. This is an unrealistic assumption, but it allows us to give a simplified presentation which
χ 2 distributions and confidence intervals for population variance
 χ 2 distributions and confidence intervals for population variance Let Z be a standard Normal random variable, i.e., Z N(0, 1). Define Y = Z 2. Y is a non-negative random variable. Its distribution is
Fall 2011 Exam Score: /75. Exam 3
 Math 12 Fall 2011 Name Exam Score: /75 Total Class Percent to Date Exam 3 For problems 1-10, circle the letter next to the response that best answers the question or completes the sentence. You do not
STAT Chapter 6: Sampling Distributions
 STAT 515 -- Chapter 6: Sampling Distributions Definition: Parameter = a number that characterizes a population (example: population mean ) it s typically unknown. Statistic = a number that characterizes
CHAPTER 8. Confidence Interval Estimation Point and Interval Estimates
 CHAPTER 8. Confidence Interval Estimation Point and Interval Estimates A point estimate is a single number, a confidence interval provides additional information about the variability of the estimate Lower
Key Objectives. Module 2: The Logic of Statistical Inference. Z-scores. SGSB Workshop: Using Statistical Data to Make Decisions
 SGSB Workshop: Using Statistical Data to Make Decisions Module 2: The Logic of Statistical Inference Dr. Tom Ilvento January 2006 Dr. Mugdim Pašić Key Objectives Understand the logic of statistical inference
MULTIPLE CHOICE. Choose the one alternative that best completes the statement or answers the question.
 Exam Name The bar graph shows the number of tickets sold each week by the garden club for their annual flower show. ) During which week was the most number of tickets sold? ) A) Week B) Week C) Week 5
STAT 3090 Test 2 - Version B Fall Student s Printed Name: PLEASE READ DIRECTIONS!!!!
 STAT 3090 Test 2 - Fall 2015 Student s Printed Name: Instructor: XID: Section #: Read each question very carefully. You are permitted to use a calculator on all portions of this exam. You are NOT allowed
Biostatistics and Design of Experiments Prof. Mukesh Doble Department of Biotechnology Indian Institute of Technology, Madras
 Biostatistics and Design of Experiments Prof. Mukesh Doble Department of Biotechnology Indian Institute of Technology, Madras Lecture - 05 Normal Distribution So far we have looked at discrete distributions
The "bell-shaped" curve, or normal curve, is a probability distribution that describes many real-life situations.
 6.1 6.2 The Standard Normal Curve The "bell-shaped" curve, or normal curve, is a probability distribution that describes many real-life situations. Basic Properties 1. The total area under the curve is.
Name PID Section # (enrolled)
") STT 315 - Lecture 3 Instructor: Aylin ALIN 04/02/2014 Midterm # 2 A Name PID Section # (enrolled) * The exam is closed book and 80 minutes. * You may use a calculator and the formula sheet that you brought
STT 315 - Lecture 3 Instructor: Aylin ALIN 04/02/2014 Midterm # 2 A Name PID Section # (enrolled) * The exam is closed book and 80 minutes. * You may use a calculator and the formula sheet that you brought
. 13. The maximum error (margin of error) of the estimate for μ (based on known σ) is:
 of the estimate for μ (based on known σ) is:") Statistics Sample Exam 3 Solution Chapters 6 & 7: Normal Probability Distributions & Estimates 1. What percent of normally distributed data value lie within 2 standard deviations to either side of the
Statistics Sample Exam 3 Solution Chapters 6 & 7: Normal Probability Distributions & Estimates 1. What percent of normally distributed data value lie within 2 standard deviations to either side of the
Chapter 9 Chapter Friday, June 4 th
 Chapter 9 Chapter 10 Sections 9.1 9.5 and 10.1 10.5 Friday, June 4 th Parameter and Statisticti ti Parameter is a number that is a summary characteristic of a population Statistic, is a number that is
Statistical Intervals. Chapter 7 Stat 4570/5570 Material from Devore s book (Ed 8), and Cengage
, and Cengage") 7 Statistical Intervals Chapter 7 Stat 4570/5570 Material from Devore s book (Ed 8), and Cengage Confidence Intervals The CLT tells us that as the sample size n increases, the sample mean X is close to
7 Statistical Intervals Chapter 7 Stat 4570/5570 Material from Devore s book (Ed 8), and Cengage Confidence Intervals The CLT tells us that as the sample size n increases, the sample mean X is close to
AP * Statistics Review
 AP * Statistics Review Normal Models and Sampling Distributions Teacher Packet AP* is a trademark of the College Entrance Examination Board. The College Entrance Examination Board was not involved in the
AP Stats ~ Lesson 6B: Transforming and Combining Random variables
 AP Stats ~ Lesson 6B: Transforming and Combining Random variables OBJECTIVES: DESCRIBE the effects of transforming a random variable by adding or subtracting a constant and multiplying or dividing by a
Introduction to Statistics I
 Introduction to Statistics I Keio University, Faculty of Economics Continuous random variables Simon Clinet (Keio University) Intro to Stats November 1, 2018 1 / 18 Definition (Continuous random variable)
Section Introduction to Normal Distributions
 Section 6.1-6.2 Introduction to Normal Distributions 2012 Pearson Education, Inc. All rights reserved. 1 of 105 Section 6.1-6.2 Objectives Interpret graphs of normal probability distributions Find areas
Math 14, Homework 6.2 p. 337 # 3, 4, 9, 10, 15, 18, 19, 21, 22 Name
 Name 3. Population in U.S. Jails The average daily jail population in the United States is 706,242. If the distribution is normal and the standard deviation is 52,145, find the probability that on a randomly
MA 1125 Lecture 05 - Measures of Spread. Wednesday, September 6, Objectives: Introduce variance, standard deviation, range.
 MA 115 Lecture 05 - Measures of Spread Wednesday, September 6, 017 Objectives: Introduce variance, standard deviation, range. 1. Measures of Spread In Lecture 04, we looked at several measures of central
Chapter 9: Sampling Distributions
 Chapter 9: Sampling Distributions 9. Introduction This chapter connects the material in Chapters 4 through 8 (numerical descriptive statistics, sampling, and probability distributions, in particular) with
Central Limit Theorem
 Central Limit Theorem Lots of Samples 1 Homework Read Sec 6-5. Discussion Question pg 329 Do Ex 6-5 8-15 2 Objective Use the Central Limit Theorem to solve problems involving sample means 3 Sample Means
Chapter 5. Sampling Distributions
 Lecture notes, Lang Wu, UBC 1 Chapter 5. Sampling Distributions 5.1. Introduction In statistical inference, we attempt to estimate an unknown population characteristic, such as the population mean, µ,
Continuous Probability Distributions
 Continuous Probability Distributions Chapter 7 McGraw-Hill/Irwin Copyright 2010 by The McGraw-Hill Companies, Inc. All rights reserved. GOALS 1. Understand the difference between discrete and continuous
Chapter 7 Study Guide: The Central Limit Theorem
 Chapter 7 Study Guide: The Central Limit Theorem Introduction Why are we so concerned with means? Two reasons are that they give us a middle ground for comparison and they are easy to calculate. In this
STATISTICS - CLUTCH CH.9: SAMPLING DISTRIBUTIONS: MEAN.
 !! www.clutchprep.com SAMPLING DISTRIBUTIONS (MEANS) As of now, the normal distributions we have worked with only deal with the population of observations Example: What is the probability of randomly selecting
1. Variability in estimates and CLT
 Unit3: Foundationsforinference 1. Variability in estimates and CLT Sta 101 - Fall 2015 Duke University, Department of Statistical Science Dr. Çetinkaya-Rundel Slides posted at http://bit.ly/sta101_f15
Math 120 Introduction to Statistics Mr. Toner s Lecture Notes. Standardizing normal distributions The Standard Normal Curve
 6.1 6.2 The Standard Normal Curve Standardizing normal distributions The "bell-shaped" curve, or normal curve, is a probability distribution that describes many reallife situations. Basic Properties 1.
MULTIPLE CHOICE. Choose the one alternative that best completes the statement or answers the question.
 Ch. 9 Estimating the Value of a Parameter 9.1 Estimating a Population Proportion 1 Obtain a point estimate for the population proportion. 1) When 390 junior college students were surveyed,115 said that
Chapter 6: The Normal Distribution
 Chapter 6: The Normal Distribution Diana Pell Section 6.1: Normal Distributions Note: Recall that a continuous variable can assume all values between any two given values of the variables. Many continuous
The Normal Distribution
 5.1 Introduction to Normal Distributions and the Standard Normal Distribution Section Learning objectives: 1. How to interpret graphs of normal probability distributions 2. How to find areas under the
Example. Chapter 8 Probability Distributions and Statistics Section 8.1 Distributions of Random Variables
 Chapter 8 Probability Distributions and Statistics Section 8.1 Distributions of Random Variables You are dealt a hand of 5 cards. Find the probability distribution table for the number of hearts. Graph
7 THE CENTRAL LIMIT THEOREM
 CHAPTER 7 THE CENTRAL LIMIT THEOREM 373 7 THE CENTRAL LIMIT THEOREM Figure 7.1 If you want to figure out the distribution of the change people carry in their pockets, using the central limit theorem and
Lecture 6: Chapter 6
 Lecture 6: Chapter 6 C C Moxley UAB Mathematics 3 October 16 6.1 Continuous Probability Distributions Last week, we discussed the binomial probability distribution, which was discrete. 6.1 Continuous Probability
2 DESCRIPTIVE STATISTICS
 Chapter 2 Descriptive Statistics 47 2 DESCRIPTIVE STATISTICS Figure 2.1 When you have large amounts of data, you will need to organize it in a way that makes sense. These ballots from an election are rolled
Confidence Intervals. σ unknown, small samples The t-statistic /22
 Confidence Intervals σ unknown, small samples The t-statistic 1 /22 Homework Read Sec 7-3. Discussion Question pg 365 Do Ex 7-3 1-4, 6, 9, 12, 14, 15, 17 2/22 Objective find the confidence interval for
Prob and Stats, Nov 7
 Prob and Stats, Nov 7 The Standard Normal Distribution Book Sections: 7.1, 7.2 Essential Questions: What is the standard normal distribution, how is it related to all other normal distributions, and how
Confidence Intervals Introduction
 Confidence Intervals Introduction A point estimate provides no information about the precision and reliability of estimation. For example, the sample mean X is a point estimate of the population mean μ
Review. Preview This chapter presents the beginning of inferential statistics. October 25, S7.1 2_3 Estimating a Population Proportion
 MAT 155 Statistical Analysis Dr. Claude Moore Cape Fear Community College Chapter 7 Estimates and Sample Sizes 7 1 Review and Preview 7 2 Estimating a Population Proportion 7 3 Estimating a Population
Chapter 4. The Normal Distribution
 Chapter 4 The Normal Distribution 1 Chapter 4 Overview Introduction 4-1 Normal Distributions 4-2 Applications of the Normal Distribution 4-3 The Central Limit Theorem 4-4 The Normal Approximation to the
Hypothesis Tests: One Sample Mean Cal State Northridge Ψ320 Andrew Ainsworth PhD
 Hypothesis Tests: One Sample Mean Cal State Northridge Ψ320 Andrew Ainsworth PhD MAJOR POINTS Sampling distribution of the mean revisited Testing hypotheses: sigma known An example Testing hypotheses:
Statistics for Business and Economics
 Statistics for Business and Economics Chapter 7 Estimation: Single Population Copyright 010 Pearson Education, Inc. Publishing as Prentice Hall Ch. 7-1 Confidence Intervals Contents of this chapter: Confidence
10/1/2012. PSY 511: Advanced Statistics for Psychological and Behavioral Research 1
 PSY 511: Advanced Statistics for Psychological and Behavioral Research 1 Pivotal subject: distributions of statistics. Foundation linchpin important crucial You need sampling distributions to make inferences:
Law of Large Numbers, Central Limit Theorem
 November 14, 2017 November 15 18 Ribet in Providence on AMS business. No SLC office hour tomorrow. Thursday s class conducted by Teddy Zhu. November 21 Class on hypothesis testing and p-values December
UNIVERSITY OF VICTORIA Midterm June 2014 Solutions
 UNIVERSITY OF VICTORIA Midterm June 04 Solutions NAME: STUDENT NUMBER: V00 Course Name & No. Inferential Statistics Economics 46 Section(s) A0 CRN: 375 Instructor: Betty Johnson Duration: hour 50 minutes
Homework: Due Wed, Nov 3 rd Chapter 8, # 48a, 55c and 56 (count as 1), 67a
, 67a") Homework: Due Wed, Nov 3 rd Chapter 8, # 48a, 55c and 56 (count as 1), 67a Announcements: There are some office hour changes for Nov 5, 8, 9 on website Week 5 quiz begins after class today and ends at
Homework: Due Wed, Nov 3 rd Chapter 8, # 48a, 55c and 56 (count as 1), 67a Announcements: There are some office hour changes for Nov 5, 8, 9 on website Week 5 quiz begins after class today and ends at
8.3 CI for μ, σ NOT known (old 8.4)
") GOALS: 1. Learn the properties of the student t distribution and the t curve. 2. Understand how degrees of freedom, df, relate to t curves. 3. Recognize that t curves approach the SNC as df increases.
GOALS: 1. Learn the properties of the student t distribution and the t curve. 2. Understand how degrees of freedom, df, relate to t curves. 3. Recognize that t curves approach the SNC as df increases.
Lecture 2 INTERVAL ESTIMATION II
 Lecture 2 INTERVAL ESTIMATION II Recap Population of interest - want to say something about the population mean µ perhaps Take a random sample... Recap When our random sample follows a normal distribution,
6.4 approximating binomial distr with normal curve.notebook January 26, compute the mean/ expected value for the above distribution.
 Discrete: Countable (no fractions or decimals) Continuous: Measurable: distance, time, volume Binomial Distribution n = number of trials r = number of successes p = probability of success q = probability
MATH 118 Class Notes For Chapter 5 By: Maan Omran
 MATH 118 Class Notes For Chapter 5 By: Maan Omran Section 5.1 Central Tendency Mode: the number or numbers that occur most often. Median: the number at the midpoint of a ranked data. Ex1: The test scores
Homework: Due Wed, Feb 20 th. Chapter 8, # 60a + 62a (count together as 1), 74, 82
, 74, 82") Announcements: Week 5 quiz begins at 4pm today and ends at 3pm on Wed If you take more than 20 minutes to complete your quiz, you will only receive partial credit. (It doesn t cut you off.) Today: Sections
Announcements: Week 5 quiz begins at 4pm today and ends at 3pm on Wed If you take more than 20 minutes to complete your quiz, you will only receive partial credit. (It doesn t cut you off.) Today: Sections
Math 140 Introductory Statistics. Next midterm May 1
 Math 140 Introductory Statistics Next midterm May 1 8.1 Confidence intervals 54% of Americans approve the job the president is doing with a margin error of 3% 55% of 18-29 year olds consider themselves
Section 6.5. The Central Limit Theorem
 Section 6.5 The Central Limit Theorem Idea Will allow us to combine the theory from 6.4 (sampling distribution idea) with our central limit theorem and that will allow us the do hypothesis testing in the
CHAPTER 2 Describing Data: Numerical
 CHAPTER Multiple-Choice Questions 1. A scatter plot can illustrate all of the following except: A) the median of each of the two variables B) the range of each of the two variables C) an indication of
STAT Chapter 7: Confidence Intervals
 STAT 515 -- Chapter 7: Confidence Intervals With a point estimate, we used a single number to estimate a parameter. We can also use a set of numbers to serve as reasonable estimates for the parameter.
Statistics for Managers Using Microsoft Excel 7 th Edition
 Statistics for Managers Using Microsoft Excel 7 th Edition Chapter 7 Sampling Distributions Statistics for Managers Using Microsoft Excel 7e Copyright 2014 Pearson Education, Inc. Chap 7-1 Learning Objectives
CHAPTERS 5 & 6: CONTINUOUS RANDOM VARIABLES
 CHAPTERS 5 & 6: CONTINUOUS RANDOM VARIABLES DISCRETE RANDOM VARIABLE: Variable can take on only certain specified values. There are gaps between possible data values. Values may be counting numbers or
MidTerm 1) Find the following (round off to one decimal place):
 Find the following (round off to one decimal place):") MidTerm 1) 68 49 21 55 57 61 70 42 59 50 66 99 Find the following (round off to one decimal place): Mean = 58:083, round off to 58.1 Median = 58 Range = max min = 99 21 = 78 St. Deviation = s = 8:535,
MidTerm 1) 68 49 21 55 57 61 70 42 59 50 66 99 Find the following (round off to one decimal place): Mean = 58:083, round off to 58.1 Median = 58 Range = max min = 99 21 = 78 St. Deviation = s = 8:535,
Population Mean GOALS. Characteristics of the Mean. EXAMPLE Population Mean. Parameter Versus Statistics. Describing Data: Numerical Measures
 GOALS Describing Data: Numerical Measures Chapter 3 McGraw-Hill/Irwin Copyright 010 by The McGraw-Hill Companies, Inc. All rights reserved. 3-1. Calculate the arithmetic mean, weighted mean, median, mode,
MATH 104 CHAPTER 5 page 1 NORMAL DISTRIBUTION
 MATH 104 CHAPTER 5 page 1 NORMAL DISTRIBUTION We have examined discrete random variables, those random variables for which we can list the possible values. We will now look at continuous random variables.
The normal distribution is a theoretical model derived mathematically and not empirically.
 Sociology 541 The Normal Distribution Probability and An Introduction to Inferential Statistics Normal Approximation The normal distribution is a theoretical model derived mathematically and not empirically.