Prob and Stats, Nov 7
|
|
|
- Hilary Day
- 5 years ago
- Views:
Transcription
1 Prob and Stats, Nov 7 The Standard Normal Distribution Book Sections: 7.1, 7.2 Essential Questions: What is the standard normal distribution, how is it related to all other normal distributions, and how can I use it? Standards: S.ID.4
2 The Normal Distribution A normal distribution is a continuous probability distribution for a random variable, x. The graph of the normal distribution is called the normal curve or a bell curve because of its distinct bell shape. A normal distribution has a mean, μ (mu) and a standard deviation, σ (sigma). The exact curve depends entirely on mu and sigma. The equation of the probability density function with mean, μ and standard deviation, σ is: y ( x ) / 2 e 2

3
4 Properties of the Normal Distribution A normal distribution with mean and standard deviation has the following properties: 1. The mean, median, and mode are equal. 2. The normal curve is bell-shaped and is symmetric about the mean. 3. The total area under the normal curve is equal to The normal curve approaches, but never touches, the x-axis. 5. Between μ σ and μ + σ (in the center of the curve), the graph curves downward. The graph curves upward to the left of μ σ and to the right of μ + σ. The point at which the curve changes are called inflection points.

5 Properties of the Normal Distribution
6 Back to the Future We shall now recall the computation of the Z-Score from Chapter 2 when we first considered the normal distribution. A normal distribution can have any mean and any positive standard deviation. These two parameters, μ and σ, determine the shape of the normal curve.
7 The Standard Score The standard score, or z-score (z) is a number that is representative of the number of standard deviations a given value of x falls from the mean. z = (Value Mean) Standard Deviation or z ( ) x Value is the entry you want the z-score of (x).
8 Properties of the Z-Score A z-score can be positive, negative, or zero Positive the x-value was greater than the mean Negative the x-value was less than the mean Zero the x-value was equal to the mean A z-score is how many standard deviations a value is away from the mean. Positive above the mean, negative below the mean.
9 Finding Z-Scores In a normal distribution with a mean of 7 and a standard deviation of 3.2, what is the Z-Score of 8.1?

10 Interpreting Z-Scores In a symmetric distribution, the Empirical rule gave us some percentages for each standard deviation distance from the mean. When a distribution s values are transformed into a z-score, 95% of scores should fall between -2 and % should fall between -3 and 3.
11 The Standard Normal Distribution There are an infinite number of normal distributions, but only one Standard Normal Distribution. The standard normal distribution is a normal distribution with a mean of 0 and a standard deviation of 1. Any distribution can be transformed here by the Z-Score.

12 The Standard Normal Distribution A normal distribution with a mean of 0 and a standard deviation of 1
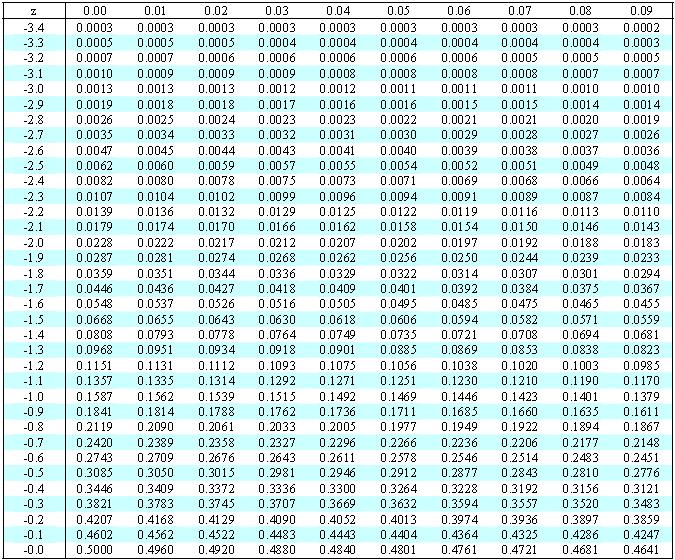
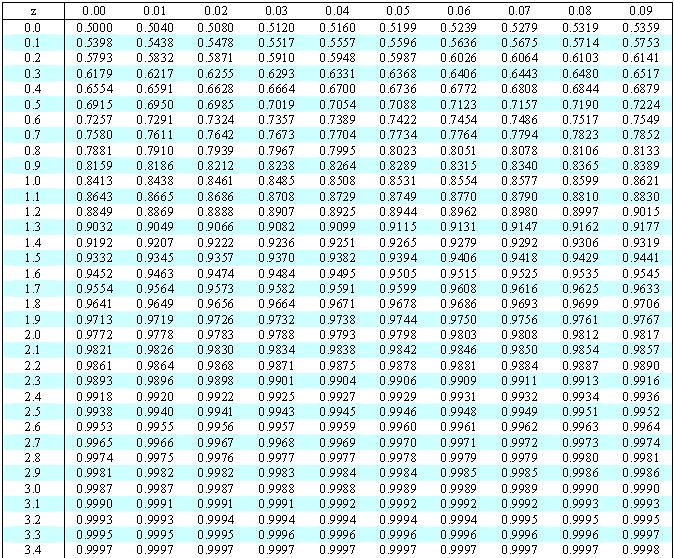
13 Properties of the Standard Normal Distribution 1. The cumulative area is close to 0 for z-scores close to z = The cumulative area increases as the z-scores increase. 3. The cumulative area for z = 0 is The cumulative area is close to 1 for z-scores close to z = 3.49.

14 A Standard Normal table A standard normal table (depicted partially below) provides a cumulative area up to a selected z-score. Z-Scores to 2-decimal places. 1 st Place 2 nd Place Z=-3.13
15
16
17 Three Cases for Standard Normal Area
18 Three Cases for Standard Normal Area
19 Three Cases for Standard Normal Area

20 Using a Table

21 How to do a Lookup

22 How to do a Lookups 2

23 How to do a Lookups 3
24 Example 1 & 2 Find the area under the standard normal curve corresponding to a z-score of Find the area under the standard normal curve corresponding to z = 1.15

25 Example 3 Find the area under the standard normal curve between z = -1.5 and z = 1.25.
26 Example 4 Find the area under the standard normal curve more than z = 0.84.
27 The Standard Normal Distribution Area under a normal curve is interpreted as probability under three models: Model 1: P(x < a) the z-table extraction Model 2: P(a<x<b) the between computation Model 3: P(x>b) the 1-P(x<a) computation
28 Classwork: Handout CW 11/7, 1-9 Homework HW Due 11/10, 1-3
Math Tech IIII, May 7
 Math Tech IIII, May 7 The Normal Probability Models Book Sections: 5.1, 5.2, & 5.3 Essential Questions: How can I use the normal distribution to compute probability? Standards: S.ID.4 Properties of the
The Normal Distribution
 5.1 Introduction to Normal Distributions and the Standard Normal Distribution Section Learning objectives: 1. How to interpret graphs of normal probability distributions 2. How to find areas under the
Normal Probability Distributions
 Normal Probability Distributions Properties of Normal Distributions The most important probability distribution in statistics is the normal distribution. Normal curve A normal distribution is a continuous
The Normal Probability Distribution
 1 The Normal Probability Distribution Key Definitions Probability Density Function: An equation used to compute probabilities for continuous random variables where the output value is greater than zero
6.2 Normal Distribution. Normal Distributions
 6.2 Normal Distribution Normal Distributions 1 Homework Read Sec 6-1, and 6-2. Make sure you have a good feel for the normal curve. Do discussion question p302 2 3 Objective Identify Complete normal model
Section Introduction to Normal Distributions
 Section 6.1-6.2 Introduction to Normal Distributions 2012 Pearson Education, Inc. All rights reserved. 1 of 105 Section 6.1-6.2 Objectives Interpret graphs of normal probability distributions Find areas
Chapter 6. The Normal Probability Distributions
 Chapter 6 The Normal Probability Distributions 1 Chapter 6 Overview Introduction 6-1 Normal Probability Distributions 6-2 The Standard Normal Distribution 6-3 Applications of the Normal Distribution 6-5
Continuous random variables
 Continuous random variables probability density function (f(x)) the probability distribution function of a continuous random variable (analogous to the probability mass function for a discrete random variable),
Chapter ! Bell Shaped
 Chapter 6 6-1 Business Statistics: A First Course 5 th Edition Chapter 7 Continuous Probability Distributions Learning Objectives In this chapter, you learn:! To compute probabilities from the normal distribution!
Lecture 12. Some Useful Continuous Distributions. The most important continuous probability distribution in entire field of statistics.
 ENM 207 Lecture 12 Some Useful Continuous Distributions Normal Distribution The most important continuous probability distribution in entire field of statistics. Its graph, called the normal curve, is
CH 5 Normal Probability Distributions Properties of the Normal Distribution
 Properties of the Normal Distribution Example A friend that is always late. Let X represent the amount of minutes that pass from the moment you are suppose to meet your friend until the moment your friend
Chapter Seven: Confidence Intervals and Sample Size
 Chapter Seven: Confidence Intervals and Sample Size A point estimate is: The best point estimate of the population mean µ is the sample mean X. Three Properties of a Good Estimator 1. Unbiased 2. Consistent
The normal distribution is a theoretical model derived mathematically and not empirically.
 Sociology 541 The Normal Distribution Probability and An Introduction to Inferential Statistics Normal Approximation The normal distribution is a theoretical model derived mathematically and not empirically.
Section 7.5 The Normal Distribution. Section 7.6 Application of the Normal Distribution
 Section 7.6 Application of the Normal Distribution A random variable that may take on infinitely many values is called a continuous random variable. A continuous probability distribution is defined by
Notes 12.8: Normal Distribution
 Notes 12.8: Normal Distribution For many populations, the distribution of events are relatively close to the average or mean. The further you go out both above and below the mean, there are fewer number
Math 227 Elementary Statistics. Bluman 5 th edition
 Math 227 Elementary Statistics Bluman 5 th edition CHAPTER 6 The Normal Distribution 2 Objectives Identify distributions as symmetrical or skewed. Identify the properties of the normal distribution. Find
Department of Quantitative Methods & Information Systems. Business Statistics. Chapter 6 Normal Probability Distribution QMIS 120. Dr.
 Department of Quantitative Methods & Information Systems Business Statistics Chapter 6 Normal Probability Distribution QMIS 120 Dr. Mohammad Zainal Chapter Goals After completing this chapter, you should
Introduction to Statistics I
 Introduction to Statistics I Keio University, Faculty of Economics Continuous random variables Simon Clinet (Keio University) Intro to Stats November 1, 2018 1 / 18 Definition (Continuous random variable)
Statistics 511 Supplemental Materials
 Gaussian (or Normal) Random Variable In this section we introduce the Gaussian Random Variable, which is more commonly referred to as the Normal Random Variable. This is a random variable that has a bellshaped
Chapter 4. The Normal Distribution
 Chapter 4 The Normal Distribution 1 Chapter 4 Overview Introduction 4-1 Normal Distributions 4-2 Applications of the Normal Distribution 4-3 The Central Limit Theorem 4-4 The Normal Approximation to the
ECO220Y Continuous Probability Distributions: Normal Readings: Chapter 9, section 9.10
 ECO220Y Continuous Probability Distributions: Normal Readings: Chapter 9, section 9.10 Fall 2011 Lecture 8 Part 2 (Fall 2011) Probability Distributions Lecture 8 Part 2 1 / 23 Normal Density Function f
Lecture 9. Probability Distributions. Outline. Outline
 Outline Lecture 9 Probability Distributions 6-1 Introduction 6- Probability Distributions 6-3 Mean, Variance, and Expectation 6-4 The Binomial Distribution Outline 7- Properties of the Normal Distribution
Chapter 5 Normal Probability Distributions
 Chapter 5 Normal Probability Distributions Section 5-1 Introduction to Normal Distributions and the Standard Normal Distribution A The normal distribution is the most important of the continuous probability
CHAPTER TOPICS STATISTIK & PROBABILITAS. Copyright 2017 By. Ir. Arthur Daniel Limantara, MM, MT.
 Distribusi Normal CHAPTER TOPICS The Normal Distribution The Standardized Normal Distribution Evaluating the Normality Assumption The Uniform Distribution The Exponential Distribution 2 CONTINUOUS PROBABILITY
Lecture 9. Probability Distributions
 Lecture 9 Probability Distributions Outline 6-1 Introduction 6-2 Probability Distributions 6-3 Mean, Variance, and Expectation 6-4 The Binomial Distribution Outline 7-2 Properties of the Normal Distribution
Week 7. Texas A& M University. Department of Mathematics Texas A& M University, College Station Section 3.2, 3.3 and 3.4
 Week 7 Oğuz Gezmiş Texas A& M University Department of Mathematics Texas A& M University, College Station Section 3.2, 3.3 and 3.4 Oğuz Gezmiş (TAMU) Topics in Contemporary Mathematics II Week7 1 / 19
Lecture 8. The Binomial Distribution. Binomial Distribution. Binomial Distribution. Probability Distributions: Normal and Binomial
 Lecture 8 The Binomial Distribution Probability Distributions: Normal and Binomial 1 2 Binomial Distribution >A binomial experiment possesses the following properties. The experiment consists of a fixed
Chapter 6: The Normal Distribution
 Chapter 6: The Normal Distribution Diana Pell Section 6.1: Normal Distributions Note: Recall that a continuous variable can assume all values between any two given values of the variables. Many continuous
Data Analysis and Statistical Methods Statistics 651
 Data Analysis and Statistical Methods Statistics 651 http://www.stat.tamu.edu/~suhasini/teaching.html Suhasini Subba Rao The binomial: mean and variance Recall that the number of successes out of n, denoted
Chapter 5. Continuous Random Variables and Probability Distributions. 5.1 Continuous Random Variables
 Chapter 5 Continuous Random Variables and Probability Distributions 5.1 Continuous Random Variables 1 2CHAPTER 5. CONTINUOUS RANDOM VARIABLES AND PROBABILITY DISTRIBUTIONS Probability Distributions Probability
Chapter 6: The Normal Distribution
 Chapter 6: The Normal Distribution Diana Pell Section 6.1: Normal Distributions Note: Recall that a continuous variable can assume all values between any two given values of the variables. Many continuous
STAT:2010 Statistical Methods and Computing. Using density curves to describe the distribution of values of a quantitative
 STAT:10 Statistical Methods and Computing Normal Distributions Lecture 4 Feb. 6, 17 Kate Cowles 374 SH, 335-0727 kate-cowles@uiowa.edu 1 2 Using density curves to describe the distribution of values of
AP STATISTICS FALL SEMESTSER FINAL EXAM STUDY GUIDE
 AP STATISTICS Name: FALL SEMESTSER FINAL EXAM STUDY GUIDE Period: *Go over Vocabulary Notecards! *This is not a comprehensive review you still should look over your past notes, homework/practice, Quizzes,
Continuous Probability Distributions & Normal Distribution
 Mathematical Methods Units 3/4 Student Learning Plan Continuous Probability Distributions & Normal Distribution 7 lessons Notes: Students need practice in recognising whether a problem involves a discrete
Chapter Seven. The Normal Distribution
 Chapter Seven The Normal Distribution 7-1 Introduction Many continuous variables have distributions that are bellshaped and are called approximately normally distributed variables, such as the heights
What type of distribution is this? tml
 Warm Up Calculate the average Broncos score for the 2013 Season! 24, 27, 10, 10, 34, 37, 20, 51, 35, 31, 27, 28, 45, 33, 35, 52, 52, 37, 41, 49, 24, 26 What type of distribution is this? http://www.mathsisfun.com/data/quincunx.h
Chapter 7: Random Variables
 Chapter 7: Random Variables 7.1 Discrete and Continuous Random Variables 7.2 Means and Variances of Random Variables 1 Introduction A random variable is a function that associates a unique numerical value
Continuous Distributions
 Quantitative Methods 2013 Continuous Distributions 1 The most important probability distribution in statistics is the normal distribution. Carl Friedrich Gauss (1777 1855) Normal curve A normal distribution
Continuous Probability Distributions
 Continuous Probability Distributions Chapter 7 Learning Objectives List the characteristics of the uniform distribution. Compute probabilities using the uniform distribution List the characteristics of
NORMAL RANDOM VARIABLES (Normal or gaussian distribution)
") NORMAL RANDOM VARIABLES (Normal or gaussian distribution) Many variables, as pregnancy lengths, foot sizes etc.. exhibit a normal distribution. The shape of the distribution is a symmetric bell shape.
NORMAL RANDOM VARIABLES (Normal or gaussian distribution) Many variables, as pregnancy lengths, foot sizes etc.. exhibit a normal distribution. The shape of the distribution is a symmetric bell shape.
Chapter 4 Continuous Random Variables and Probability Distributions
 Chapter 4 Continuous Random Variables and Probability Distributions Part 2: More on Continuous Random Variables Section 4.5 Continuous Uniform Distribution Section 4.6 Normal Distribution 1 / 27 Continuous
Applications of Data Dispersions
 1 Applications of Data Dispersions Key Definitions Standard Deviation: The standard deviation shows how far away each value is from the mean on average. Z-Scores: The distance between the mean and a given
Lecture 6: Chapter 6
 Lecture 6: Chapter 6 C C Moxley UAB Mathematics 3 October 16 6.1 Continuous Probability Distributions Last week, we discussed the binomial probability distribution, which was discrete. 6.1 Continuous Probability
Chapter 7 1. Random Variables
 Chapter 7 1 Random Variables random variable numerical variable whose value depends on the outcome of a chance experiment - discrete if its possible values are isolated points on a number line - continuous
Continuous Probability Distributions
 Continuous Probability Distributions Chapter 07 McGraw-Hill/Irwin Copyright 2013 by The McGraw-Hill Companies, Inc. All rights reserved. LEARNING OBJECTIVES LO 7-1 List the characteristics of the uniform
Math Tech IIII, Mar 13
 Math Tech IIII, Mar 13 The Binomial Distribution III Book Sections: 4.2 Essential Questions: What do I need to know about the binomial distribution? Standards: DA-5.6 What Makes a Binomial Experiment?
Statistics for Managers Using Microsoft Excel 7 th Edition
 Statistics for Managers Using Microsoft Excel 7 th Edition Chapter 7 Sampling Distributions Statistics for Managers Using Microsoft Excel 7e Copyright 2014 Pearson Education, Inc. Chap 7-1 Learning Objectives
On one of the feet? 1 2. On red? 1 4. Within 1 of the vertical black line at the top?( 1 to 1 2
 Continuous Random Variable If I spin a spinner, what is the probability the pointer lands... On one of the feet? 1 2. On red? 1 4. Within 1 of the vertical black line at the top?( 1 to 1 2 )? 360 = 1 180.
Theoretical Foundations
 Theoretical Foundations Probabilities Monia Ranalli monia.ranalli@uniroma2.it Ranalli M. Theoretical Foundations - Probabilities 1 / 27 Objectives understand the probability basics quantify random phenomena
Expected Value of a Random Variable
 Knowledge Article: Probability and Statistics Expected Value of a Random Variable Expected Value of a Discrete Random Variable You're familiar with a simple mean, or average, of a set. The mean value of
Homework: Due Wed, Nov 3 rd Chapter 8, # 48a, 55c and 56 (count as 1), 67a
, 67a") Homework: Due Wed, Nov 3 rd Chapter 8, # 48a, 55c and 56 (count as 1), 67a Announcements: There are some office hour changes for Nov 5, 8, 9 on website Week 5 quiz begins after class today and ends at
Homework: Due Wed, Nov 3 rd Chapter 8, # 48a, 55c and 56 (count as 1), 67a Announcements: There are some office hour changes for Nov 5, 8, 9 on website Week 5 quiz begins after class today and ends at
Chapter 3. Density Curves. Density Curves. Basic Practice of Statistics - 3rd Edition. Chapter 3 1. The Normal Distributions
 Chapter 3 The Normal Distributions BPS - 3rd Ed. Chapter 3 1 Example: here is a histogram of vocabulary scores of 947 seventh graders. The smooth curve drawn over the histogram is a mathematical model
Discrete Probability Distribution
 1 Discrete Probability Distribution Key Definitions Discrete Random Variable: Has a countable number of values. This means that each data point is distinct and separate. Continuous Random Variable: Has
Continuous Probability Distributions
 Continuous Probability Distributions Chapter 7 McGraw-Hill/Irwin Copyright 2010 by The McGraw-Hill Companies, Inc. All rights reserved. GOALS 1. Understand the difference between discrete and continuous
Quantitative Methods for Economics, Finance and Management (A86050 F86050)
") Quantitative Methods for Economics, Finance and Management (A86050 F86050) Matteo Manera matteo.manera@unimib.it Marzio Galeotti marzio.galeotti@unimi.it 1 This material is taken and adapted from Guy Judge
Quantitative Methods for Economics, Finance and Management (A86050 F86050) Matteo Manera matteo.manera@unimib.it Marzio Galeotti marzio.galeotti@unimi.it 1 This material is taken and adapted from Guy Judge
STAT 201 Chapter 6. Distribution
 STAT 201 Chapter 6 Distribution 1 Random Variable We know variable Random Variable: a numerical measurement of the outcome of a random phenomena Capital letter refer to the random variable Lower case letters
Describing Data: One Quantitative Variable
 STAT 250 Dr. Kari Lock Morgan The Big Picture Describing Data: One Quantitative Variable Population Sampling SECTIONS 2.2, 2.3 One quantitative variable (2.2, 2.3) Statistical Inference Sample Descriptive
Measures of Variation. Section 2-5. Dotplots of Waiting Times. Waiting Times of Bank Customers at Different Banks in minutes. Bank of Providence
 Measures of Variation Section -5 1 Waiting Times of Bank Customers at Different Banks in minutes Jefferson Valley Bank 6.5 6.6 6.7 6.8 7.1 7.3 7.4 Bank of Providence 4. 5.4 5.8 6. 6.7 8.5 9.3 10.0 Mean
Normal Distribution. Notes. Normal Distribution. Standard Normal. Sums of Normal Random Variables. Normal. approximation of Binomial.
 Lecture 21,22, 23 Text: A Course in Probability by Weiss 8.5 STAT 225 Introduction to Probability Models March 31, 2014 Standard Sums of Whitney Huang Purdue University 21,22, 23.1 Agenda 1 2 Standard
CHAPTER 6. ' From the table the z value corresponding to this value Z = 1.96 or Z = 1.96 (d) P(Z >?) =
 P(Z >?) =") Solutions to End-of-Section and Chapter Review Problems 225 CHAPTER 6 6.1 (a) P(Z < 1.20) = 0.88493 P(Z > 1.25) = 1 0.89435 = 0.10565 P(1.25 < Z < 1.70) = 0.95543 0.89435 = 0.06108 (d) P(Z < 1.25) or Z
Solutions to End-of-Section and Chapter Review Problems 225 CHAPTER 6 6.1 (a) P(Z < 1.20) = 0.88493 P(Z > 1.25) = 1 0.89435 = 0.10565 P(1.25 < Z < 1.70) = 0.95543 0.89435 = 0.06108 (d) P(Z < 1.25) or Z
Counting Basics. Venn diagrams
 Counting Basics Sets Ways of specifying sets Union and intersection Universal set and complements Empty set and disjoint sets Venn diagrams Counting Inclusion-exclusion Multiplication principle Addition
The graph of a normal curve is symmetric with respect to the line x = µ, and has points of
 Stat 400, section 4.3 Normal Random Variables notes prepared by Tim Pilachowski Another often-useful probability density function is the normal density function, which graphs as the familiar bell-shaped
If the distribution of a random variable x is approximately normal, then
 Confidence Intervals for the Mean (σ unknown) In many real life situations, the standard deviation is unknown. In order to construct a confidence interval for a random variable that is normally distributed
Introduction to Business Statistics QM 120 Chapter 6
 DEPARTMENT OF QUANTITATIVE METHODS & INFORMATION SYSTEMS Introduction to Business Statistics QM 120 Chapter 6 Spring 2008 Chapter 6: Continuous Probability Distribution 2 When a RV x is discrete, we can
2011 Pearson Education, Inc
 Statistics for Business and Economics Chapter 4 Random Variables & Probability Distributions Content 1. Two Types of Random Variables 2. Probability Distributions for Discrete Random Variables 3. The Binomial
AP Statistics Chapter 6 - Random Variables
 AP Statistics Chapter 6 - Random 6.1 Discrete and Continuous Random Objective: Recognize and define discrete random variables, and construct a probability distribution table and a probability histogram
IOP 201-Q (Industrial Psychological Research) Tutorial 5
 Tutorial 5") IOP 201-Q (Industrial Psychological Research) Tutorial 5 TRUE/FALSE [1 point each] Indicate whether the sentence or statement is true or false. 1. To establish a cause-and-effect relation between two variables,
IOP 201-Q (Industrial Psychological Research) Tutorial 5 TRUE/FALSE [1 point each] Indicate whether the sentence or statement is true or false. 1. To establish a cause-and-effect relation between two variables,
Chapter 4 Continuous Random Variables and Probability Distributions
 Chapter 4 Continuous Random Variables and Probability Distributions Part 2: More on Continuous Random Variables Section 4.5 Continuous Uniform Distribution Section 4.6 Normal Distribution 1 / 28 One more
Chapter 8. Variables. Copyright 2004 Brooks/Cole, a division of Thomson Learning, Inc.
 Chapter 8 Random Variables Copyright 2004 Brooks/Cole, a division of Thomson Learning, Inc. 8.1 What is a Random Variable? Random Variable: assigns a number to each outcome of a random circumstance, or,
Statistical Methods in Practice STAT/MATH 3379
 Statistical Methods in Practice STAT/MATH 3379 Dr. A. B. W. Manage Associate Professor of Mathematics & Statistics Department of Mathematics & Statistics Sam Houston State University Overview 6.1 Discrete
Standard Normal Calculations
 Standard Normal Calculations Section 4.3 Cathy Poliak, Ph.D. cathy@math.uh.edu Office in Fleming 11c Department of Mathematics University of Houston Lecture 10-2311 Cathy Poliak, Ph.D. cathy@math.uh.edu
ECON 214 Elements of Statistics for Economists
 ECON 214 Elements of Statistics for Economists Session 7 The Normal Distribution Part 1 Lecturer: Dr. Bernardin Senadza, Dept. of Economics Contact Information: bsenadza@ug.edu.gh College of Education
Module Tag PSY_P2_M 7. PAPER No.2: QUANTITATIVE METHODS MODULE No.7: NORMAL DISTRIBUTION
 Subject Paper No and Title Module No and Title Paper No.2: QUANTITATIVE METHODS Module No.7: NORMAL DISTRIBUTION Module Tag PSY_P2_M 7 TABLE OF CONTENTS 1. Learning Outcomes 2. Introduction 3. Properties
Chapter 4 Random Variables & Probability. Chapter 4.5, 6, 8 Probability Distributions for Continuous Random Variables
 Chapter 4.5, 6, 8 Probability for Continuous Random Variables Discrete vs. continuous random variables Examples of continuous distributions o Uniform o Exponential o Normal Recall: A random variable =
MAS1403. Quantitative Methods for Business Management. Semester 1, Module leader: Dr. David Walshaw
 MAS1403 Quantitative Methods for Business Management Semester 1, 2018 2019 Module leader: Dr. David Walshaw Additional lecturers: Dr. James Waldren and Dr. Stuart Hall Announcements: Written assignment
2017 Fall QMS102 Tip Sheet 2
 Chapter 5: Basic Probability 2017 Fall QMS102 Tip Sheet 2 (Covering Chapters 5 to 8) EVENTS -- Each possible outcome of a variable is an event, including 3 types. 1. Simple event = Described by a single
5.1 Mean, Median, & Mode
 5.1 Mean, Median, & Mode definitions Mean: Median: Mode: Example 1 The Blue Jays score these amounts of runs in their last 9 games: 4, 7, 2, 4, 10, 5, 6, 7, 7 Find the mean, median, and mode: Example 2
STAT Chapter 5: Continuous Distributions. Probability distributions are used a bit differently for continuous r.v. s than for discrete r.v. s.
 STAT 515 -- Chapter 5: Continuous Distributions Probability distributions are used a bit differently for continuous r.v. s than for discrete r.v. s. Continuous distributions typically are represented by
Section 7.4 Transforming and Combining Random Variables (DAY 1)
") Section 7.4 Learning Objectives (DAY 1) After this section, you should be able to DESCRIBE the effect of performing a linear transformation on a random variable (DAY 1) COMBINE random variables and CALCULATE
Section 7.4 Learning Objectives (DAY 1) After this section, you should be able to DESCRIBE the effect of performing a linear transformation on a random variable (DAY 1) COMBINE random variables and CALCULATE
value BE.104 Spring Biostatistics: Distribution and the Mean J. L. Sherley
 BE.104 Spring Biostatistics: Distribution and the Mean J. L. Sherley Outline: 1) Review of Variation & Error 2) Binomial Distributions 3) The Normal Distribution 4) Defining the Mean of a population Goals:
Lecture 5 - Continuous Distributions
 Lecture 5 - Continuous Distributions Statistics 102 Colin Rundel January 30, 2013 Announcements Announcements HW1 and Lab 1 have been graded and your scores are posted in Gradebook on Sakai (it is good
11.5: Normal Distributions
 11.5: Normal Distributions 11.5.1 Up to now, we ve dealt with discrete random variables, variables that take on only a finite (or countably infinite we didn t do these) number of values. A continuous random
Statistics 511 Additional Materials
 Discrete Random Variables In this section, we introduce the concept of a random variable or RV. A random variable is a model to help us describe the state of the world around us. Roughly, a RV can be thought
Frequency Distribution Models 1- Probability Density Function (PDF)
") Models 1- Probability Density Function (PDF) What is a PDF model? A mathematical equation that describes the frequency curve or probability distribution of a data set. Why modeling? It represents and summarizes
Models 1- Probability Density Function (PDF) What is a PDF model? A mathematical equation that describes the frequency curve or probability distribution of a data set. Why modeling? It represents and summarizes
The Central Limit Theorem for Sample Means (Averages)
") The Central Limit Theorem for Sample Means (Averages) By: OpenStaxCollege Suppose X is a random variable with a distribution that may be known or unknown (it can be any distribution). Using a subscript
The Central Limit Theorem for Sample Means (Averages) By: OpenStaxCollege Suppose X is a random variable with a distribution that may be known or unknown (it can be any distribution). Using a subscript
STAT 113 Variability
 STAT 113 Variability Colin Reimer Dawson Oberlin College September 14, 2017 1 / 48 Outline Last Time: Shape and Center Variability Boxplots and the IQR Variance and Standard Deviaton Transformations 2
STA 320 Fall Thursday, Dec 5. Sampling Distribution. STA Fall
 STA 320 Fall 2013 Thursday, Dec 5 Sampling Distribution STA 320 - Fall 2013-1 Review We cannot tell what will happen in any given individual sample (just as we can not predict a single coin flip in advance).
8.3 CI for μ, σ NOT known (old 8.4)
") GOALS: 1. Learn the properties of the student t distribution and the t curve. 2. Understand how degrees of freedom, df, relate to t curves. 3. Recognize that t curves approach the SNC as df increases.
GOALS: 1. Learn the properties of the student t distribution and the t curve. 2. Understand how degrees of freedom, df, relate to t curves. 3. Recognize that t curves approach the SNC as df increases.
Chapter 3. Numerical Descriptive Measures. Copyright 2016 Pearson Education, Ltd. Chapter 3, Slide 1
 Chapter 3 Numerical Descriptive Measures Copyright 2016 Pearson Education, Ltd. Chapter 3, Slide 1 Objectives In this chapter, you learn to: Describe the properties of central tendency, variation, and
Biostatistics and Design of Experiments Prof. Mukesh Doble Department of Biotechnology Indian Institute of Technology, Madras
 Biostatistics and Design of Experiments Prof. Mukesh Doble Department of Biotechnology Indian Institute of Technology, Madras Lecture - 05 Normal Distribution So far we have looked at discrete distributions
Lecture Slides. Elementary Statistics Tenth Edition. by Mario F. Triola. and the Triola Statistics Series. Slide 1
 Lecture Slides Elementary Statistics Tenth Edition and the Triola Statistics Series by Mario F. Triola Slide 1 Chapter 6 Normal Probability Distributions 6-1 Overview 6-2 The Standard Normal Distribution
Overview/Outline. Moving beyond raw data. PSY 464 Advanced Experimental Design. Describing and Exploring Data The Normal Distribution
 PSY 464 Advanced Experimental Design Describing and Exploring Data The Normal Distribution 1 Overview/Outline Questions-problems? Exploring/Describing data Organizing/summarizing data Graphical presentations
Shifting and rescaling data distributions
 Shifting and rescaling data distributions It is useful to consider the effect of systematic alterations of all the values in a data set. The simplest such systematic effect is a shift by a fixed constant.
INF FALL NATURAL LANGUAGE PROCESSING. Jan Tore Lønning, Lecture 3, 1.9
 1 INF5830 2015 FALL NATURAL LANGUAGE PROCESSING Jan Tore Lønning, Lecture 3, 1.9 Today: More statistics 2 Recap Probability distributions Categorical distributions Bernoulli trial Binomial distribution
CHAPTERS 5 & 6: CONTINUOUS RANDOM VARIABLES
 CHAPTERS 5 & 6: CONTINUOUS RANDOM VARIABLES DISCRETE RANDOM VARIABLE: Variable can take on only certain specified values. There are gaps between possible data values. Values may be counting numbers or
MidTerm 1) Find the following (round off to one decimal place):
 Find the following (round off to one decimal place):") MidTerm 1) 68 49 21 55 57 61 70 42 59 50 66 99 Find the following (round off to one decimal place): Mean = 58:083, round off to 58.1 Median = 58 Range = max min = 99 21 = 78 St. Deviation = s = 8:535,
MidTerm 1) 68 49 21 55 57 61 70 42 59 50 66 99 Find the following (round off to one decimal place): Mean = 58:083, round off to 58.1 Median = 58 Range = max min = 99 21 = 78 St. Deviation = s = 8:535,
Section3-2: Measures of Center
 Chapter 3 Section3-: Measures of Center Notation Suppose we are making a series of observations, n of them, to be exact. Then we write x 1, x, x 3,K, x n as the values we observe. Thus n is the total number
Statistics for Business and Economics
 Statistics for Business and Economics Chapter 5 Continuous Random Variables and Probability Distributions Ch. 5-1 Probability Distributions Probability Distributions Ch. 4 Discrete Continuous Ch. 5 Probability
Unit2: Probabilityanddistributions. 3. Normal distribution
 Announcements Unit: Probabilityanddistributions 3 Normal distribution Sta 101 - Spring 015 Duke University, Department of Statistical Science February, 015 Peer evaluation 1 by Friday 11:59pm Office hours:
Unit 2: Statistics Probability
 Applied Math 30 3-1: Distributions Probability Distribution: - a table or a graph that displays the theoretical probability for each outcome of an experiment. - P (any particular outcome) is between 0