THE ECONOMIC SURVEY 2011
|
|
|
- Linda Powell
- 6 years ago
- Views:
Transcription
1 THE UNITED REPUBLIC OF TANZANIA THE ECONOMIC SURVEY 2011 Produced by: President s Office, Planning Commission DAR ES SALAAM TANZANIA August, 2011 Printed by KIUTA Dar es Salaam - Tanzania
2 Table of Contents LIST OF TABLES... i ABBREVIATIONS AND ACRONYMS... vi IMPORTANT ECONOMIC EVENTS IN x CHAPTER THE DOMESTIC ECONOMY... 1 Economic Growth... 1 Price Trend... 4 Capital Formation... 8 CHAPTER THE STATE OF THE WORLD ECONOMY AND INTERNATIONAL ECONOMIC CO-OPERATION World Economic Growth Trends in World Trade The State of African Economy East African Community (EAC) African Union and Economic Commission for Africa Southern Africa Development Community World Trade Organisation CHAPTER EXTERNAL SECTOR INTRODUCTION MERCHANDISE EXPORTS Traditional exports Non-Traditional Exports MERCHANDISE IMPORTS Capital goods Intermediate Goods Consumer Goods SERVICES PAYMENTS TRENDS IN SELECTED REGIONAL AND BILATERAL TRADE.. 51 BALANCE OF PAYMENTS FOREIGN CURRENCY RESERVES EXCHANGE RATE CHAPTER GOVERNMENT FINANCE Introduction Revenue Collection Trend Domestic Revenue Grants and Loans Domestic Loans ii
3 Non concessional borrowing EXPENDITURE Public Debt Service Sectoral Allocation of Government Budget Domestic Debt Stock External Debt Stock External Debt Stock by Creditor Category CHAPTER MONEY AND FINANCIAL INSTITUTIONS Money Supply and Domestic Credit Trends in Credit to Private Sector Deposits in Commercial Banks Trends in Interest Rates Financial Sector Reforms Parastatal Pension Fund (PPF) Public Services Pension Fund (PSPF) National Social Security Fund (NSSF) Government Employees Provident Fund (GEPF) National Health Insurance Fund (NHIF) Local Authorities Pensions Fund (LAPF) Tanzania Insurance Regulatory Authority (TIRA) Dar es Salaam Stock Exchange (DSE) Tanzania Postal Bank (TPB) CHAPTER HUMAN RESOURCES Population and Development Labour Force and Employment CHAPTER PRIVATE SECTOR DEVELOPMENT Investment in the Country Distribution of Projects by Regional Foreign Direct Investment Improving the Enabling Environment for Private Sector ECONOMIC EMPOWERMENT Mwananchi Empowerment Funds Economic Empowerment and Employment Creation Program Issuance and Access to Credit through various Funds CHAPTER CROSS CUTTING ISSUES HIV/AIDS Environment Good Governance Gender iii
4 Public Safety CHAPTER REVIEW OF THE IMPLEMENTATION OF NATIONAL STRATEGY FOR GROWTH AND REDUCTION OF POVERTY Introduction Growth and Reduction of Income Poverty Improving Quality of Life and Social Well-being Good Governance and Accountability CHAPTER THE FIVE YEAR DEVELOPMENT PLAN Introduction The meaning of Five Year Development Plan Tanzania s Historical Perspective on Medium and Long term Plans The National Development Vision The First Five Year Development Plan -2011/ / Process of Preparing FYDP I The Overall Goal of FYDP (2011/ /16) Unleashing Growth Salient Features of FYDP I Strategic Interventions Priority Areas of the FYDP I Financing the Five Year Development Plan Implementation Framework Annual Plan Execution and Coordination Concluding Remarks CHAPTER AGRICULTURE AND COOPERATIVES Growth Rate Food Crops Production Cash crops production Irrigation Farming Training and Extension Services Research Activities Agriculture Input Trust Fund Subsidies Provision for Farming Inputs Livestock Production and its Products Trading of Livestock and its Products Cooperatives Development Trend in Cash Crops Prices CHAPTER NATURAL RESOURCES AND TOURISM Growth Rate Forestry and Beekeeping iv
5 Wildlife Fisheries Tourism Archives and Antiquities CHAPTER MINING Growth Rate Mineral Prospecting Mining and Mineral Sales The value of Mineral Exports CHAPTER MANUFACTURING AND INTERNAL TRADE Growth Rate Small Enterprises Production Costs Production in Selected Industries Internal Trade International Trade Fair CHAPTER CONSTRUCTION AND LAND DEVELOPMENT CONSTRUCTION Growth Rates Road Network Roads and Bridges Maintenance Road Board Fund Contractors Registration Board Engineers Registration Board Architects and Quantity Surveyors Registration Board National Building Council Tanzania Building Agency Tanzania Electrical, Mechanical and Services Agency LAND DEVELOPMENTS Village Survey Inspection and Review of Title Deeds Issuance of Village Land certificates and Customary Title Deeds Title Deeds Issuance Aquatic Land Survey Surveyed Farms and plots Land and House District Councils Land Use Plan National Housing Building Research Agency Land Bank Housing Development v
6 CHAPTER TRANSPORT AND COMMUNICATION Growth Rates Road Transport Urban Commuter Services RAILWAY TRANSPORT Tanzania Railways Limited Tanzania and Zambia Railway Authority AIR TRANSPORT Tanzania Airport Authority Marine Transport Cargo Transportation to/from Neighboring Countries Table No. 16.4: Cargo Transportation to/from Neighboring Countries 199 LAKE TRANSPORT The Marine Service Company Limited SINOTASHIP COMMUNICATION SERVICES Tanzania Posts Corporation Tanzania Communication Regulatory Authority INFORMATION AND COMMUNICATION TECHNOLOGY National ICT Infrastrucure Backbo Developments in Information Technology SCIENCE, TECHNOLOGY AND INNOVATION National Research Registry Human Resource Development Radiation Control CHAPTER ENERGY Growth Rate Electricity Exploration of Petroleum and Gas Oil Imports and Price Trends Alternative Sources of Energy Minor Waterfalls Solar Power Geothermal and Bio-fuel Sustainable Use of Energy CHAPTER WATER Introduction Management and Development of Water Resources Rural Water Service Urban Water Service vi
7 CHAPTER EDUCATION AND TRAINING Pre primary Education Primary Education Secondary Education Teachers Education Adult Education Schools and Colleges Inspection Vocational Training Technical Education Higher Education CHAPTER HEALTH Introduction Health Facilities Health Facilities inspection Treatment outside the Country Community Health Education Maternal and Child Health Life expectancy National Maralia Control Programme Food and Nutrition Social Service Welfare CHAPTER COMMUNITY DEVELOPMENT Folk Development Colleges Gender and Women Development Child Development Coordination of Non-Government Organizations vii
8 LIST OF TABLES Table A: Table B: Table 1: Table 1A: Table 2: Table 2A: Table 2B: Table 3: Table 3A: Table 4: Table 4A: Basic Economic Statistics Tanzania Mainland... xi Trends in Selected Macroeconomic Indicators, xii Gross Domestic Product by Kind of Economic Activity, at current prices Gross Domestic Product (Monetary & non-monetary GDP mp) by Kind of Economic Activity, at current prices Sectoral Contribution to Overall GDP at Market Price (at current prices) Sectoral Contribution to Overall GDP Monetary & Non-Monetary, at current prices Gross Domestic Product and Expenditure, at current Market prices Gross Domestic Product (GDP mp) by Kind of Economic Activity, at constant 2001 prices Gross Domestic Product (Monetary & non-monetary) by Kind of Economic Activity, at constant 2001 prices Gross Domestic Product (GDP mp) by Kind of Economic Activity - Percentage Growth Rates, at constant 2001 prices Gross Domestic Product (Monetary & non-monetary GDP mp) by Kind of Economic Activity - Percentage Growth Rates, at constant 2001 prices Table 4B: Sectoral Contribution to Overall GDP (%) at constant 2001 prices Table 4C: Sectoral Contribution to Overall GDP (%) - Monetary & non-monetary at constant 2001 prices i
9 Table 4D: Gross Domestic Product and Expenditure, at constant 2001 market prices Table 5: Capital Formation by Type of Assets, at current prices Table 6: Capital Formation by Type of Assets, at constant 2001 prices Table 7: Capital Formation by Public and Private Sectors, at current price.27 Table 8: Table 9: Table 10: Table 11: Table 12: Table 13: Table 14: Table 15: Table 16: Index of Retail Prices of goods consumed by minimum wage earners in Dar es Salaam (2001=100) Index of Retail Prices of goods consumed by minimum wage earners in Dar es Salaam (2001 = 100) Cost of Living Index of goods and services consumed by middle grade wage earners in Dar es Salaam (2001=100) Cost of Living Index of goods and services consumed by middle grade wage earners in Dar es Salaam (2001=100) Cost of Living Index for the high income group in Dar es Salaam (2001=100) Cost of Living Index for high income group in Dar es Salaam (2001=100) Cost of Living Index of goods and services consumed by urban dwellers in Tanzania Mainland (2001=100) Cost of Living Index of goods and services consumed by urban dwellers Tanzania Mainland (2001=100) Different Indices of goods and services consumed by urban residents in Tanzania Mainland (2001 =100) Table 17: Value of Tanzania's Foreign Trade Table 18: Volume and Value of Domestic Exports ii
10 Table 19: Volume and Value of Traditional and Non-traditional Exports Table 20: Export Prices of Principal Commodities (Tshs/Ton)...65 Table 21: Export Prices of Principal Commodities (US$/Ton)...66 Table 23: Composition of Imports Table 24: Balance of Payments Table 25: Trends in Government Finance Table 26: Classification of Central Government Expenditure by Purpose Table 27: Monetary Survey: Tanzania Mainland Table 28: Table 29: Growth of Money Supply and Domestic Credit: Tanzania Mainland Trend of Exchange Rates of the Tanzania Shilling against the US$ Table 30: Commercial Banks Lending by Sectors Table 31: Trend of Commercial Banks Deposits Table 32: Average Nominal Interest Rates Table 33: Regional Distribution of Tanzania Population ( ) Table 34: Tanzania Investment Centre (TIC): Approved Projects Table 35: Domestic Production and Consumption of Sugar Table 36: Cotton procurement and local sales Table 37: Tea crop area, production and local sales Table 38: Coffee procurement and local sales Table 39: Sisal plantations, production and local sales iii
11 Table 40: Tobacco procurement and local sales Table 41: Pyrethrum procurement and local sales Table 42: Cashewnuts procurement and local sales Table 43: Summary of Marketed Quantities and Value of Principal Cash Crops Table 45: Tree Planting - Seedlings planted Table 47: Exports of Forestry Products Table 48: Export of Government Trophies Table 48A: Earnings from Tourist Hunting and Export of Live Animals Table 48B: Number of Tourist Hunters Table 50: Production in the Fisheries Sector ( ) Table 51: Export of Fish Products Table 51A: Summary of Fish Export Products ( ) Table 51B Trends of Nile Perch Exports ( ) Table 52: Number of visitors, hotel bed-nights and foreign exchange earnings Table 53: Number of Tourists and Foreign Exchange Earnings Table 55: Number of Tourists Visited Tourists Attractions Table 56: Minerals Production Table 57: Minerals Exports ( ) Table 58: Production and Consumption of Cement Table 59: Production in selected industries iv
12 Table 60: Industries - Estimated number of employees Table 61: Industries - Estimated labour costs Table 62: Industries - Summary Statistics Table 63: Industries - Regional Summaries Table 65: Performance Indicators in the Industrial sector Table 67: Tanzania Railways Corporation (TRC) Table 68: The UHURU Railway (TAZARA) Table 69: Shipping Statistics: Dar es salaam, Tanga & Mtwara Table 70: Postal Services Statistics Table 73: Air Tanzania Corporation (ATC) Table 74: Electricity: Installed Capacity and Total Units Generated by Station Table 75: Electricity sales by Type of Use Table 76: Quantity of Electricity Sold by Region Table 77: Water Supply and Revenue Collection in Urban Areas Table 80: Government Secondary Schools: Number of Students by Form. 226 Table 81: Private Secondary Schools: Number of Students by Form Table 84: Health Facilities in the Country Table 85: Health Services: Training Output Table 87: Number of Health Personnel Table 87A: Number of Hospital Beds in the Country v
13 ABBREVIATIONS AND ACRONYMS APRM - African Peer Review Mechanism ASDP - Agricultural Sector Development Programme ARVs - Anti-retroviral ATMS - Automatic Teller Machine BEST - Business Environment Strengthening for Tanzania BRELA - Business Registration and Licensing Authority BoT - Bank of Tanzania Cif - Cost insurance and freight CSO - Civil Society Organization CARMATEC - Centre for Agricultural Mechanisation and Rural Technology CRDB - CRDB Bank COICOP - Classification of Individual Consumption by Purpose COMESA - Common Market for Eastern and Southern Africa D by D - Decentralization by Devolution DSM - Dar es Salaam DSE - Dar es salaam Stock Exchange DADPs - District Agricultural Development Plan DIT - Dar es Salaam Institute of Technology DPs - Development Partners ECA - Economic Commission for Africa EAC - East African Community EPZ - Economic Processing Zone EWURA - Energy and Water Utilities Regulatory Authority EU - European Union EFD - Electronic Fiscal Device ERP - Economic Recovery Program EMS - Expedited Mail Service FYDP - Five Year Development Plan FTA - Free Trade Area f.o.b - free on board FDI - Foreign Direct Investment GEPF - Government Employees Provident Fund GBS - General Budget Support GDP - Gross Domestic Product HESLB - Higher Education Students Loan Board vi
14 HBS - Household Budget Survey ICT - Information and Communication Technology IMF - International Monetary Fund ILFS - Intergrated Labour Fource Survey JAST - Joint Assistance Strategy for Tanzania JPC - Joint Program Commissions IFMS - Integrated Financial Management System LSRP - Legal Sector Reform Programme LAPF - Local Authorities Pensions Fund LGRP - Local Government Reform Program LGA - Local Government Authority M 2 - Broad Money Supply M 3 - Extended Broad Money Supply MPIP - Medium Term Public Investment Plan MDGs - Millennium Development Goals MDAs - Ministry, Department and Agencies MKUKUTA - Mkakati wa Kukuza Uchumi na Kupunguza Umasikini Tanzania MACEMP - Marine and Coastal Environmental Management Project MAIR - MKUKUTA Annual Implementation Report MMS - MKUKUTA Monitoring System MSCL - Marine Service Company Ltd MTEF - Medium Term Expenditure Framework MRCC - Maritime Rescue Coordination Centre MSMEs - Medium, Small and Micro Enterprises MW - Mega Watts M&E - Monitoring and Evaluation NSGRP - National Stretegy for Growth and Reduction of Povert NAIC - The National Artificial Insemination Centre NCPI - National Consumer Price Index NTB - Non Trade Barriers NSSF - National Social Security Funds NACSAP - National Anti-Corruption Strategy and Action Plan NEMC - National Environmental Management Council NACTE - National Council for Technical Education NEPAD - New Partnership for Africa s Development NGO s - Non-Governmental Organisations NHIF - National Health Insurance Fund NIC - National Insurance Corporation NMB - National Microfinance Bank vii
15 OSBP - One-Stop-Border Posts PHDR - Poverty and Human Development Report PBG - Plan and Budget Guideline PPP - Public Private Partnership PPRA - Public Procurement Regulatory Authority POPC - President s Office Planning Commission PSRP - Public Service Reform Program PAPs - Priority Action Program PSPF - Public Service Pensions Fund PPF - Parastatal Pensions Fund PFMRP - Public Financial Management Reform Program PCCB - Prevention Combating of Corruption Bureau PEDP - Primary Education Development Program PHCSDP Primary Health Care Service Development Programme PLHA - People Living with HIV and AIDS RSs - Regional Secretariets RITA - Registration, Insolvency and Trusteeship Agency SACCOS - Savings and Credit Cooperative Societies SELF - Small Entrepreneur Loan Facility Project SAP - Structure Adjustment Programm SEDP - Secondary Education Development Programm SMECGS - Small and Medium Enterprise Credit Guarantee Schemes SIDO - Small Industries Development Organization SAGCOT - Southern Agriculture Growth Corridor of Tanzania SEZs - Special Economic Zones SADC - Southern Africa Development Community SCULT - Savings and Co-operatives Union League of Tanzania SMEs - Small and Medium Enterprises SUMATRA - Surface and Marine Transport Regulatory Authority TaESA - Tanzania Employment Service Agency TANESCO - Tanzania Electricity Supply Company TAZARA - Tanzania Zambia Railway Authority TEUS - Twenty Equivalent Units TANAPA - Tanzania National Parks TADB - Tanzania Agricultural Development Bank TDV - Tanzania Development Vision TDHS - Tanzania Demographic and Health Survey TIC - Tanzania Investment Centre viii
16 TIRA - Tanzania Insurance Regulatory Authority TAA - Tanzania Airport Authority TCAA - Tanzania Civil Aviation Authority TCRA - Tanzania Communications Regulatory Authority TICTS - Tanzania International Container Terminal Services TRA - Tanzania Revenue Authority TRL - Tanzania Railways Company Limited TTCL - Tanzania Telecommunications Company Limited TWB - Tanzania Women Bank TMRC - Tanzania Mortgage Refinancing Company TISCAN - Tanzania Inspection Services Company Tshs (TZS) - Tanzanian Shilling USD - United States Dollar UFI - Global Association of the Exhibition Industry Formerly known, Union Des Foires Internationales VETA - Vocational Education and Training Authority WEF - World Economic Forum WMO - World Meteorological Organization WTO - World Trade Organization WARCs - Ward Agriculture Resource Centre WSDP - Water Sector Development Program ix
17 IMPORTANT ECONOMIC EVENTS IN 2011 Date Month Events January World Economic Forum WEF The Government through Tanzania Mortgage Refinancing Company (MRC) started implementation of mortgage finance project. 07 June The president of the United Republic of Tanzania launched a composium to discuss the draft Five Year Development Plan (2011/ /16) 08 June Budget day for EAC member countries 1-7 July The International Trade Fair took place in Dar es Salaam, Tanzania 09 July Southern Sudan officially became independent country 02 October Pilot census conducted in 44 enumerated areas 10 November TMRC officially started operations 12 December Tanzania commemorated 50 years of independency 21 December Two consecutive days of heavy rains flooded Dar es Salaam, causing loss of life and assets. The last time for such heavy rain occuered way back in 1954 x
18 Table A BASIC ECONOMIC STATISTICS - TANZANIA MAINLAND p % Change 2010/11 Population (millions) Gross Domestic Product, at current prices (Shs. million) Gross Domestic Product, at constant 2001 prices (Shs. million) GDP per capita, at current prices (Shs.) GDP per capita, at constant 2001 prices (Shs.) Consumer Price Index (%) Balance of merchandise trade (US$ million) Current Account balance (US$ million) Consumption of cement ('000 Tons) Electricity sold (KWH million) Tourist earnings (US$ million) Railways: Cargo transportation ('000 Tons) Education: Students in Primary Schools ('000)* Education: Students in Secondary Schools ('000)* Hospitals: Number of beds Doctors (number) Exports of Cash Crops (Mill.US$) Traditional Commodities Coffee Cotton Sisal Tea Tobacco Cashewnuts Cloves Non-Traditional Commodities Minerals Manufactured goods Other exports Monetary Aggregates 2005/ / / / / / /12p % Change 10/11-11/12 Money supply (Shs. billion) Net domestic credit (Shs. billion) Government Finance Government Recurrent Revenue (Shs. billion) Government Recurrent Expenditure (Shs. billion) Government Development Expenditure (Shs. billion) Source: Ministry of Finance * For Government and Private Schools ** From 1998, Base year is Academic year ending in the respective years 2 Extended Broad Money (M3) - Not available p - Provisional Data xi
19 xii
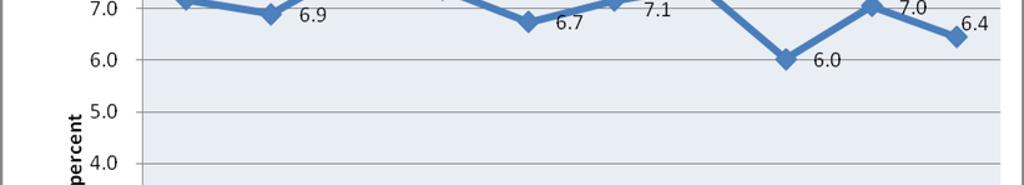
20 Table No. B: TRENDS IN SELECTED MACROECONOMIC INDICATORS NATIONAL ACCOUNTS Real GDP growth at market price 7.4% 6.7% 7.1% 7.4% 6.0% 7.0% 6.4% Agriculture, Hunting and Forestry 4.3% 3.8% 4.0% 4.6% 3.2% 4.2% 3.6% Fishing 6.0% 5.0% 4.5% 5.0% 2.7% 1.5% 1.2% Industry and Construction 10.4% 8.5% 9.5% 8.6% 7.0% 8.2% 6.9% Manufacturing 9.6% 8.5% 8.7% 9.9% 8.0% 7.9% 7.8% Construction 10.1% 9.5% 9.7% 10.5% 7.5% 10.2% 9.0% Services 8.0% 7.8% 8.1% 8.5% 7.2% 8.2% 7.9% Trade and Repair 6.7% 9.5% 9.8% 10.0% 7.5% 8.2% 8.1% Communications 18.8% 19.2% 20.1% 20.5% 21.9% 22.1% 19.0 Money 10.8% 11.4% 10.2% 11.9% 9.0% 10.1% 10.7% GDP growth at current prices 14.3% 12.4% 16.8% 18.3% 13.8% 14.5% 16.2% PRICES AND INTEREST RATES CPI Inflation (annual Average) 5.0% 7.3% 7.0% 10.3% 12.1% 5.5% 12.7% GDP deflator inflation (market price) 6.4% 5.3% 9.0% 10.1% 7.4% 7.1% 9.5% Short term lending rate 15.7% 15.7% 15.0% 13.6% 14.0% 14.4% 13.7% Long term lending rate 14.1% 14.9% 16.7% 16.5% 14.5% 146% 14.3% 12 months deposit rate 7.7% 8.8% 10.1% 8.3% 9.0% 7.1% 9.1% Deposit rates 2.6% 2.6% 2.7% 2.7% 2.8% 2.4% 2.9% MONEY M3 growth rate 34.8% 21.5% 20.5% 19.8% 17.7% 25.4% 18.2% M2 Growth rate 33.9% 16.7% 27.2% 24.4% 20.8% 21.8% 15% Growth rate of credit to private sector 29.3% 40.1% 43.1% 44.6% 9.6% 20.0% 27.2% BALANCE OF PAYMENTS (Ratio to GDP) Exports of Goods 11.9% 12.2% 12.0% 15.0% 15.7% 18.8% 21.1% Exports of goods and Services 20.9% 22.9% 23.1% 24.7% 24.4% 27.7% 30.9% Imports of Goods 21.2% 27.1% 28.8% 33.8% 27.3% 31.0% 40.8% Imports of goods and Services 29.8% 35.8% 37.1% 41.8% 35.3% 39.0% 50.0% Reserves (Months of Imports) GOVERNMENT BUDGETARY OPERATIONS (Ratio to GDP) 2004/ / / / / / /11 Revenue 11.9% 12.4% 14.1% 15.9% 16.2% 15.4% 16.6% Expenditure 29.4% 31.9% 31.7% 22.8% 25.7% 27.0% 26.6% Recurrent Expenditure 22.2% 24.2% 24.8% 14.9% 17.7% 18.3% 19.0% Development Expenditure 7.2% 7.7% 6.9% 7.9% 8.0% 8.6% 7.6% Deficit (exl. Grants) -9.7% -11.4% -9.9% -8.6% -9.3% -11.0% -11.6% Deficit (inl. grants ) -4.9% -5.5% -4.9% -1.7% -4.5% -6.4% -6.9% Foreign Borrowing 3.9% 3.3% 3.7% 3.2% 3.6% 4.6% 3.4% Source: Ministry of Finance and Bank of Tanzania xiii
21 xiv
22 CHAPTER 1 THE DOMESTIC ECONOMY Economic Growth 1. In 2011, real Gross Domestic Product (GDP) grew by 6.4 percent compared to 7.0 percent in The slowdown in growth was a result of drought in different parts of the country, which affected agricultural sector and power supply which eventually affected industrial production and other sectors that depends on electricity. 2. In 2011, the GDP amounted to shs. 37,532,962 million at current prices. Since the population of Tanzania Mainland was estimated at 43,169,305 in 2011, the per capita income was shs. 869,436.3 in 2011 at current prices compared to shs. 770,464.3 in 2010, equivalent to an increase of 12.8 percent. 3. The growth rate in agricultural, hunting and forestry economic activities was 3.6 percent in 2011 compared to 4.2 percent in The slow down in growth was mainly due to unfavourable weather conditions during the 2009/10 season which affected crop production. The growth rate of crops sub activity decreased to 3.5 percent in 2011 from 4.4 percent in 2010 as a result of decrease in production caused by unfavourable weather in 2009/10 season. The growth rate of livestock sub activity was 3.9 percent in 2011 compared to 3.4 percent in Effeciency in the implementation of programs on improving grazing areas and strengthening the quality of livestock products are among reasons that contributed to the increase in the growth rate of this sub activity. Forestry and hunting sub activities grew by 3.5 percent in 2011 compared to 4.1 percent in This was a result of decrease in income from tourism hunting as well as Governmnet initiative to restrict harvesting of forest products thus curtailing harvest and sell of forestry products. 4. The growth rate of monetary agriculture increased by 4.1 percent in 2011 compared to 5.3 percent in 2010 as a result of decrease in crop production caused by unfavourable weather condition. On the other hand, the growth rate of non-monetary agriculture was 2.3 percent in 2011 compared to 2.0 percent in In 2011, agricultural activities contributed 23.7 percent to GDP compared to 24.1 percent in The growth rate of fishing activities decreased to 1.2 percent in 2011, from 1.5 percent in This was a result of continued use of poor fishing gears, destruction of fish hatcheries, low production that is not commensurate with the world demand as well as increase in competition in the world market. For 1
23 the past three years, the share of fishing activities to overall GDP continued to be 1.4 percent. 6. Industry and construction economic activities grew by 6.9 percent in 2011 compared to 10.2 percent in The decline in growth rate was caused by the low growth in all sub activities due to lack of reliable power supply. Nevertheless, the share of industry and construction economic activities to GDP increased to 22.7 percent in 2011 from 22.4 percent in The growth rate in manufacturing sub activity was 7.8 percent in 2011 compared to 7.9 percent in The low growth rate was due to increase in the cost of production following the impact of power rationing that started in the forth quarter of 2010 which to some extent affected industrial production; and increase in the cost of imported raw materials, mainly fuel. Nevertheleess, production in some items such as food and dairy products, cement, beverages and animal feeds increased. The share of manufacturing to GDP increased from 9.0 percent in 2010 to 9.3 percent, in The growth rate of mining and quarrying sub activities decreased to 2.2 percent in 2011 from 2.7 percent in The shortfall was due to decrease in mineral production in large scale mines. The share of mining and quarrying sub activities to GDP remained at 3.3 percent in 2011 as it was in the last two years. 9. In 2011, the construction sub activity grew by 9.0 percent compared to 10.2 percent in The growth was mainly attributed to increase in construction activities in: roads and bridges; residential and non residential buildings; and expansion of water and road infrastructure. The share of construction sub activity to GDP was 8.0 percent in 2011 as it was in The growth rate of electricity and gas sub activities decreased drastically to 1.5 percent in 2011 compared to 10.2 percent in The decrease was due to shortage of rain which led to decline in water levels in the main hydropower dams of Kihansi and Mtera; increase in human economic activities that are detrimental to the sources of water in the power generation dams; delapidated power plants; and temporary clossure of gas power plant for maintenance. The share of electricity and gas sub activity to GDP was 1.8 percent in 2011, as it was in The water supply sub-activity grew by 4.0 percent in 2011 compared to 6.3 percent in The slowdown in growth was on account of several reasons including drought in many parts of the country; dilapidated water infrastrustures; and increase in population growth that outweigh implementation pace of water construction projects. The share of water supply 2
24 sub activity to GDP declined marginally to 0.3 percent in 2011 from 0.4 percent in The growth rate of services economic activities was 7.9 percent in 2011 compared to 8.2 percent in This was due to slowdown in growth in all sub activities except financial intermediation, administration and education sub-activities. Consistent with the decline in the growth rate of electricity and gas in 2011, the growth rate in trade and repair, hotels and restaurant and other sectors that depend on electricity also declined. Nevertheless, service economic activities recorded higher growth compared with other sectors, including communication sub activity which recorded highest growth of 19.0 percent. The share of services economic activities to GDP was 44.0 percent in 2011 compared to 43.9 percent in The trade and repairs sub activities grew at the rate of 8.1 percent in 2011 compared to 8.2 percent in The growth was mainly attributed to improved regional trade and business environment in the country. However, the power shortage challenges affected trade and repair economic activities and thus contributed to the slown down in growth. Trade and repairs sub activities accounted for 12.2 percent of the total GDP in 2011 compared to 12.1 percent in The hotel and restaurants sub activities, which includes tourism grew by 4.6 percent in 2011 compared to 6.1 percent in The slowdown in the growth rate emanated mainly from the decline in the number and spending of local tourists. The share of the hotel and restaurants sub activities to GDP was 2.3 as it was in last two years. 15. The transport sub activity grew by 6.7 percent in 2011 compared to 7.0 percent in This was due to decrease in transport and transportation on roads, railways and air transport particularly through TRL and ATCL. However, the share of transport sub activity to GDP increased to 5.3 percent in 2011, compared to 5.1 percent in The communication sub activity continued to record highest growth compared to other economic activities although the growth pace decelerated in The growth rate for this sub economic activity was 19.0 percent in 2011 compared to 22.1 percent in The growth was attributed to increase in number of customers of mobile phone services and airtime sales. The contribution of communication sub-activity to GDP was 2.2 percent in 2011 compared to 2.1 percent in The financial intermediation services sub activity grew by 10.7 percent in 2011 compared to 10.1 percent in The growth emanated from successful implementation of the Financial Sector Reform Program which exacerbated 3
25 the increase in credit to private sector and increase in the demand for money for investment purposes; insurance; business services and other economic activities. The share of financial intermediation sub activity to GDP was 1.8 percent in 2011 as it was in The growth rate of real estate and business services sub activity slowed down to 6.5 percent in 2011 compared to 7.0 percent in The growth was attributed to increase in demand for residencial and non residential buildings in various parts of the country. The growth rate of monetary real estate and business service activities was 6.2 percent in 2011 compared to 7.5 percent in This was due to the slowdown in the growth of real estate and business services. Nonetheless, the growth rate of non monetary real estate and business services was 7.1 percent in 2011 compared to 6.1 percent in The share of real estate and business services to GDP was 8.6 percent in 2011 compared to 8.8 percent in In 2011, public administration sub-activity grew by 6.8 percent compared to 6.5 percent in This was due to continued efforts by the Government to support implementation of the Public Sector Reform Program and increase of new Government employment and other public services. The share of public administration sub-activity to GDP in 2011 continued to be 8.0 percent as it was in The growth rates in education and health sub-activities were 7.4 and 5.4 percent in 2011 compared to 7.3 and 6.9 percent in 2010 respectively. The growth in education sub-activity was due to continued implementation of Primary Education Development Program Phase II (PEDP II); Secondary Education Development Program (SEDP) and increase in recruitment of teachers. With regard to health sub-activity, the growth was attributed to implementation of immunization; malaria control; Tuberculosis and HIV/AIDS programs. The share of health sub-activity to GDP was 1.7 percent in 2011 compared to 1.6 percent in Further, for three years consecutive, the share of education sub activity to GDP has been 1.4 percent annually. Price Trend 21. The overall annual average inflation rate for 2011 was 12.7 percent compared with an average of 5.5 percent in This was mainly caused by continued increase in the general oil price in the world market; inadequate shot rainy season in the fourth quarter of 2010 that reduced agricultural harvest; increase in electricity tarriffs, prices of gas, cooking oil and sugar; shortage of power supply; depreciation of the shiling; and shortage of food supply in the eastern Africa region resulting from drought in the region. Prices of various goods and services have been increasing due to the increase in the cost of 4
26 production on the account of aforementioned reasons. The annual inflation rate for food and non alcoholic bevarages was 16.0 percent in The annual inflation rate for other main groups of goods and services is as shown in table 1.1 below. The analysis was done only for 2011 since the NCPI has been rebased towards the end of The analytical challenge is based on the mere fact that the new NCPI series became official index starting in October 2010 and thus lacks full year data for comparison that has same series and computed with similar methodology. 5
27 Table 1.1: Monthly Inflation Rate (Jan Dec 2011) S/N 1 2 MAIN GROUPS Weight Jan/111 Feb/11 Mar/11 Apr/11 May/11 Food and Non Alcoholic Beverages Alcoholic, Tobacco and Narcotics Jun/11 Jul/11 Aug/11 Sep/11 Oct/11 Nov/11 Dec/11 Average 3 Clothing and Footwear Housing, Water, Electricity, Gas and Other Fuel Furnishing, Housing Equipment and Routine Maintenance of the House Health Transport Communication Recreation and Culture Education Restaurants and hotels Miscellaneous goods and services Inflation Rate OTHER SELECTED GROUPS Weight Jan/111 Feb/11 Mar/11 Apr/11 May/11 Jun/11 Jul/11 Aug/11 Sep/11 Oct/11 Nov/11 Dec/11 1 Food Energy and Fuels All Items Less Food All Items Less Food and Energy Source: Ministry of Finance 6


28 22. In general, inflation rates for the other selected groups revealed upward trend in every month in 2011 on the account of reasons explained above. Food inflation increased by an average of 15.1 percent in The pace of Nonfood inflation increased to 12.7 percent December 2011 from 4.7 percent December Energy and fuel inflation increased by 41.0 percent December 2011 compared to 12.3 percent in the corresponding period in This was a group with the highest inflation than any other group though has low weight accounting for 5.7 percent in the NCPI basket. The annual average inflation for this group was 28.3 percent in The inflation rate which excludes food and energy for the month of December 2011 was 8.7 percent compared to 3.7 percent recorded in December 2010 and annual average inflation for this group was 7.1 percent in Chart 1.1: Price Movement (April 2011 April, 2012) 7
29 23. The analysis of price indices by income-groups revealed that the rate of inflation decreased for lower and middle income groups. This was a result of decrease in the general price of goods and services commonly consumed by these groups including education and restaurants and hotels. The average inflation rates for the lower and middle income groups were 7.4 and 7.9 percent in 2011 compared to 13.2 and 10.0 percent in respectively. For the higher income group, inflation rate increased by 10.6 percent in 2011 compared to 8.1 percent in 2010 due to the increase in the general price of goods and services commonly consumed by this group particularly food; alcoholic drinks, tobacco; clothing and footwear; electricity, water, housing; and restaurants and hotels. 24. In 2011, the price indices for goods and services for the residents of Dar es Salaam experienced mixed pattern depending on their income status. Whereas the average price indices was high in clothing and footwear (17.3 percent) and transport (15.0 percent) for the residents of Dar es Salaam with lower income, such relative price was high in energy (12.6 percent) and food (9.1 percent) for the middle income group and transportation (14.2 percent) and food (13.5) for the high income group. However, food and energy were the main items that exerted pressures to all residents of Dar es Salaam irrespective of their income status. The inflation rates of these goods and services for the residents of Dar es Salaam for high, middle and lower income groups were as follow: food 13.5, 9.1, and 7.1 percent; and energy 10.9, 12.6 and 7.3 percent respectively. The price indices for other goods and services experienced mixed trend depending on the income status. Tables 8 16 show the price indices for various goods and services Capital Formation 25. In 2011, capital formation at current prices increased by 33.1 percent to shs. 13,762,066 million from shs 10,342,536 million in Further, capital formation at 2001 constant prices increased from shs. 4,385,837 million in 2010 to shs. 5,762,294 million in 2011, equivalent to an increase of 31.4 percent. The ratio of capital formation to Gross Domestic Product at current prices was 36.7 percent in 2011 compared to 32.0 percent in Capital formation which includes buildings, other construction works and equipment increased by 31.4 percent in 2011 to Tshs. 5,694,294 million in 2011 from Tshs. 4,332,960 million in 2010 at 2001 constant prices. Capital formation in building activities at 2001 constant prices increased to Tshs. 1,363,255 million in 2011 from Tshs. 1,284,866 million in 2010, equivalent to an increase of 6.1 percent. In 2011, the growth rates of non residential buildings; residential buildings; and rural own account were 6.3; 6.6; and The figures for 2010 have been revised 8
30 percent respectively as it was in This growth was on account of Government initiatives to improve business enevironment and promote constraction of modern residential and commercial buildings. 27. Other construction works including land improvement, roads and bridges, and water supply increased from 1,004,548 million in 2010 to Tshs. 1,060,483 million in 2011 at 2001 constant prices, equivalent to an increase of 5.6 percent. The growth rate of land improvement and water supply were 5.3 and 6.3 percent in 2011 respectively as it was for the preceeding two years. However, capital formation in roads and bridges activities grew by negative 9.5 percent in 2011 compared to negative 10.2 percent in This was a result of Government decision to reduce expenditures on roads and bridge construction in order to finance other emergency needs that emerged in 2011 such as food and power shortage. 28. Importation of capital equipment increased from Tshs. 2,043,546 million in 2010 to Tshs. 3,270,556 million in 2011 at 2001 constant prices, equivalent to an increase of 60.0 percent. This growth was largely attributed to the increase in importation of power generation plant machinery, generators and other machinery to address the power shortage that occurred in The imports of machinery and other equipment increased by 98.8 percent in 2011 compared to 8.5 percent in In addition, the import value of transport equipment slightly increased by 6.2 percent compared the increase of 27.5 percent in On the other hand, importation of capital equipment at current prices increased by 57.6 percent from Tshs. 3,624,582 million in 2010 to Tshs. 5,711,068 million in The value of change in stock at 2001 constant prices was Tshs. 68,000 million in 2011 compared to Tshs. 52,877 million in 2010, equivalent to an increase of 28.6 percent. In addition, the value of change in stock at current prices increased by 38.3 percent from Tshs. 164,843 million in 2010 to Tshs. 228,000 million in Capital formation in the public sector (including central government, institutions and parastatals) increased from Tshs. 2,607,525 million in 2010 to Tshs. 3,037,067 million in 2011 at current prices, equivalent to an increase of 16.5 percent. The public sector s contribution to capital formation was 22.1 percent in 2011 compared to 25.2 percent in Capital formation in private sector increased from Tshs. 7,570,168 million in 2010 to Tshs. 10,496,998 million in 2011, at current prices, equivalent to an increase of 38.7 percent. Contribution of private sector to capital formation was 76.3 percent in 2011 compared to 73.2 percent in
31 Table No.1 ECONOMIC ACTIVITY Shs.million %change 2010/11 Agriculture, Hunting and Forestry % Crops % Livestock % Hunting and Forestry % Fishing % Industry and construction % Mining and quarrying % Manufacturing % Electricity, gas % Water supply % Construction % Services % Trade and repairs % Hotels and restaurants % Transport % Communications % Financial intermediation % Real estate and business services % Public administration % Education % Health % Other social and personal services % Gross value added before adjustments % less FISIM % Gross value added at current basic prices % add Taxes on products % GDP (At current market prices) % Source : National Bureau of Statistic GROSS DOMESTIC PRODUCT BY KIND OF ECONOMIC ACTIVITY At current prices 10
32 Table No.1A ECONOMIC ACTIVITY Shs.million %change 2010/11 A. MONETARY Gross Domestic Product at market prices % Agriculture, Hunting and Forestry % Crops % Livestock % Forestry and hunting % Fishing % Industry and construction % Mining and quarrying % Manufacturing % Electricity, gas % Water supply % Construction % Services % Trade and repairs % Hotels and restaurants % Transport % Communications % Financial intermediation % Real estate and business services % Public administration % Education % Health % Other social & personal services % Gross value added before adjustments % less FISIM % Gross value added at current basic prices % Add Taxes on products % Non-monetary Gross domestic product at market prices % Agriculture, Hunting and Forestry % Crops % Livestock % Forestry & hunting % Fishing % Industry and construction % Water supply % Construction % Services % Real estate & business services % Total GDP (at market prices) % Source: National Bureau of Statistic GROSS DOMESTIC PRODUCT (Monetary & Non-monetary GDPmp) BY KIND OF ECONOMIC ACTIVITY At current prices 11
33 SHARES OF GROSS DOMESTIC PRODUCT BY KIND OF ECONOMIC ACTIVITY Table No. 2 At market current prices Percentages ECONOMIC ACTIVITY Agriculture, Hunting and Forestry Crops Livestock Hunting and Forestry Fishing Industry and construction Mining and quarrying Manufacturing Electricity, gas Water supply Construction Services Trade and repairs Hotels and restaurants Transport Communications Financial intermediation Real estate and business services Public administration Education Health Other social and personal services Gross value added before adjustments less FISIM Gross value added at current basic prices add Taxes on products GDP (At current market prices) Source: National Bureau of Statistic 12
34 SHARES OF GROSS DOMESTIC PRODUCT BY KIND OF ECONOMIC ACTIVITY - Monetary & Non-monetary Table No. 2A At current prices Percentages ECONOMIC ACTIVITY A. MONETARY Gross domestic product at market prices Agriculture, Hunting and Forestry Crops Livestock Forestry and hunting Fishing Industry and construction Mining and quarrying Manufacturing Electricity, gas Water supply Construction Services Trade and repairs Hotels and restaurants Transport Communications Financial intermediation Real estate and business services Public administration Education Health Other social & personal services Gross value added bef ore adjustments less FISIM Gross value added at c urrent basic prices Add Taxes on products B. NON MONETARY Gross domestic product at market prices Agriculture, Hunting and Forestry Crops Livestock Forestry & hunting Fishing Industry and construction Water supply Construction Services Real estate & business services Total GDP at market prices Source: National Bureau of Statistic 13
35 Table No. 2B GROSS DOMESTIC PRODUCT AND EXPENDITURE At current market prices Sh. Million Gross Domestic Product (GDPmp) Final Consumption Households Government Investment Gross Fixed Capital Formation Changes in Inventory Exports Goods Services Imports Goods ,898,943-15,383,213 Services ,556,047-3,463,966 Source: National Bureau of Statistic 14
36 GROSS DOMESTIC PRODUCT BY KIND OF ECONOMIC ACTIVITY Table No.3 At constant 2001 prices Shs. million Change ECONOMIC ACTIVITY 2010/2011 Agriculture, Hunting and Forestry % Crops % Livestock % Hunting and Forestry % Fishing % Industry and construction % Mining and quarrying % Manufacturing % Electricity, gas % Water supply % Construction % Services % Trade and repairs % Hotels and restaurants % Transport % Communications % Financial intermediation % Real estate and business services % Public administration % Education % Health % Other social and personal services % Gross value added before adjustments % less FISIM % Gross value added at current basic prices % add Taxes on products % GDP (market prices) % Source : National Bureau of Statistic 15
37 GROSS DOMESTIC PRODUCT (Monetary & Non-monetary GDPmp) BY KIND OF ECONOMIC ACTIVITY Table No.3A At constant 2001 prices Shs. million Change ECONOMIC ACTIVITY 2010/2011 A. MONETARY Gross Domestic Product at market prices % Agriculture, Hunting and Forestry % Crops % Livestock % Forestry and hunting % Fishing % Industry and construction % Mining and quarrying % Manufacturing % Electricity, gas % Water supply % Construction % Services % Trade and repairs % Hotels and restaurants % Transport % Communications % Financial intermediation % Real estate and business services % Public administration % Education % Health % Other social & personal services % Gross value added before adjustments % less FISIM % Gross value added at current basic prices % Add Taxes on products % B. NON MONETARY Gross domestic product at market prices % Agriculture, Hunting and Forestry % Crops % Livestock % Forestry & hunting % Fishing % Industry and construction % Water supply % Construction % Services % Real estate & business services % Total GDP (At constant 2001 prices) % Source : National Bureau of Statistic 16
38 Table No.4 GROSS DOMESTIC PRODUCT BY KIND OF ECONOMIC ACTIVITY - ANNUAL GROWTH RATES At constant 2001 prices Percentages ECONOMIC ACTIVITY Agriculture, Hunting and Forestry Crops Livestock Hunting and Forestry Fishing Industry and construction Mining and quarrying Manufacturing Electricity, gas Water supply Construction Services Trade and repairs Hotels and restaurants Transport Communications Financial intermediation Real estate and business services Public administration Education Health Other social and personal services Gross value added before adjustments less FISIM Gross value added at current basic prices add Taxes on products GDP (Constant prices) Source : National Bureau of Statistic 17
39 GROSS DOMESTIC PRODUCT (Monetary & Non-monetary GDPmp) BY KIND OF ECONOMIC ACTIVITY - ANNUAL GROWTH RATES Table No. 4A At constant 2001 prices percentages ECONOMIC ACTIVITY A. MONETARY Gross domestic product at market prices Agriculture, Hunting and Forestry Crops Livestock Forestry and hunting Fishing Industry and construction Mining and quarrying Manufacturing Electricity, gas Water supply Construction Services Trade and repairs Hotels and restaurants Transport Communications Financial intermediation Real estate and business services Public administration Education Health Other social & personal services Gross value added before adjustments less FISIM Gross value added at current basic prices Add Taxes on products B. NON MONETARY Gross domestic product at market prices Agriculture, Hunting and Forestry Crops Livestock Forestry & hunting Fishing Industry and construction Water supply Construction Services Real estate & business services Total GDP at market prices Source : National Bureau of Statistic 18


40 19
41 Table No. 4B ECONOMIC ACTIVITY SHARES OF GROSS DOMESTIC PRODUCT BY KIND OF ECONOMIC ACTIVITY At constant 2001 prices Agriculture, Hunting and Forestry 28.4% 27.4% 26.9% 26.1% 25.4% 24.6% 24.0% 23.3% 22.7% 22.1% Crops 21.1% 20.4% 20.1% 19.6% 19.1% 18.6% 18.2% 17.8% 17.3% 16.8% Livestock 4.8% 4.6% 4.5% 4.4% 4.2% 4.0% 3.8% 3.7% 3.6% 3.5% Hunting and Forestry 2.4% 2.4% 2.2% 2.2% 2.1% 2.0% 2.0% 1.9% 1.9% 1.8% Fishing 1.7% 1.7% 1.7% 1.6% 1.6% 1.6% 1.5% 1.5% 1.4% 1.3% Industry and construction 18.4% 19.1% 19.6% 20.2% 20.5% 20.9% 21.2% 21.4% 21.6% 21.7% Mining and quarrying 1.9% 2.1% 2.3% 2.4% 2.6% 2.7% 2.6% 2.5% 2.4% 2.3% Manufacturing 8.4% 8.6% 8.7% 8.9% 9.0% 9.2% 9.4% 9.5% 9.6% 9.7% Electricity, gas 2.1% 2.1% 2.1% 2.2% 2.0% 2.1% 2.0% 2.1% 2.1% 2.0% Water supply 0.5% 0.5% 0.4% 0.4% 0.4% 0.4% 0.4% 0.4% 0.4% 0.4% Construction 5.5% 5.8% 6.1% 6.2% 6.4% 6.5% 6.7% 6.8% 7.0% 7.2% Services 45.7% 46.1% 46.1% 46.4% 46.9% 47.3% 47.8% 48.3% 48.8% 49.5% Trade and repairs 13.1% 13.5% 13.2% 13.1% 13.5% 13.8% 14.1% 14.3% 14.5% 14.7% Hotels and restaurants 2.7% 2.6% 2.5% 2.5% 2.4% 2.4% 2.3% 2.3% 2.3% 2.2% Transport 5.3% 5.2% 5.2% 5.2% 5.1% 5.1% 5.1% 5.1% 5.1% 5.1% Communications 1.3% 1.4% 1.5% 1.7% 1.9% 2.1% 2.3% 2.7% 3.1% 3.4% Financial intermediation 1.6% 1.6% 1.6% 1.7% 1.8% 1.8% 1.9% 1.9% 2.0% 2.1% Real estate and business services 10.3% 10.3% 10.2% 10.2% 10.2% 10.2% 10.2% 10.2% 10.2% 10.2% Public administration 7.2% 7.4% 7.8% 8.0% 8.0% 8.0% 8.0% 7.8% 7.8% 7.8% Education 2.1% 2.0% 1.9% 1.9% 1.8% 1.8% 1.8% 1.8% 1.8% 1.8% Health 1.3% 1.3% 1.3% 1.4% 1.4% 1.4% 1.4% 1.4% 1.4% 1.4% Other social and personal services 0.9% 0.8% 0.8% 0.7% 0.7% 0.7% 0.7% 0.6% 0.6% 0.6% Gross value added before adjustments 94.2% 94.2% 94.2% 94.3% 94.3% 94.4% 94.4% 94.5% 94.5% 94.6% less FISIM -0.9% -0.9% -1.0% -1.0% -1.1% -1.1% -1.2% -1.2% -1.2% -1.3% Gross value added at current basic prices 93.3% 93.3% 93.3% 93.3% 93.3% 93.3% 93.3% 93.3% 93.3% 93.3% add Taxes on products 6.7% 6.7% 6.7% 6.7% 6.7% 6.7% 6.7% 6.7% 6.7% 6.7% Total GDP (at constant 2001 market price) 100.0% 100.0% 100.0% 100.0% 100.0% 100.0% 100.0% 100.0% 100.0% 100.0% Source : National Bureau of Statistic 20
42 21
43 22
44 SHARES OF GROSS DOMESTIC PRODUCT BY KIND OF ECONOMIC ACTIVITY - Monetary and non-monetary Table No.4C At constant 2001 prices ECONOMIC ACTIVITY A. MONETARY Gross domestic product at market prices 84.3% 84.7% 84.7% 85.4% 85.6% 85.9% 86.1% 86.1% 86.6% 86.5% Agriculture, Hunting and Forestry 19.1% 18.4% 17.7% 17.5% 17.0% 16.5% 16.0% 15.5% 15.2% 14.5% Crops 12.6% 12.1% 11.7% 11.6% 11.2% 10.9% 10.7% 10.3% 10.2% 9.8% Livestock 3.2% 3.1% 3.0% 2.9% 2.8% 2.7% 2.6% 2.5% 2.4% 2.3% Forestry and hunting 1.6% 1.6% 1.5% 1.4% 1.4% 1.3% 1.3% 1.3% 1.2% 1.2% Fishing 1.6% 1.6% 1.6% 1.6% 1.6% 1.5% 1.5% 1.4% 1.4% 1.3% Industry and construction 17.4% 18.2% 18.7% 19.3% 19.6% 20.0% 20.2% 20.4% 20.6% 20.7% Mining and quarrying 1.9% 2.1% 2.3% 2.4% 2.6% 2.7% 2.6% 2.5% 2.4% 2.3% Manufacturing 8.4% 8.6% 8.7% 8.9% 9.0% 9.2% 9.4% 9.5% 9.6% 9.7% Electricity, gas 2.1% 2.1% 2.1% 2.2% 2.0% 2.1% 2.0% 2.1% 2.1% 2.0% Water supply 0.3% 0.3% 0.3% 0.3% 0.3% 0.3% 0.3% 0.3% 0.3% 0.3% Construction 4.7% 5.0% 5.3% 5.5% 5.6% 5.7% 5.9% 6.0% 6.2% 6.3% Services 42.0% 42.4% 42.5% 42.8% 43.3% 43.8% 44.3% 44.7% 45.3% 45.9% Trade and repairs 13.1% 13.5% 13.2% 13.1% 13.5% 13.8% 14.1% 14.3% 14.5% 14.7% Hotels and restaurants 2.7% 2.6% 2.5% 2.5% 2.4% 2.4% 2.3% 2.3% 2.3% 2.2% Transport 5.3% 5.2% 5.2% 5.2% 5.1% 5.1% 5.1% 5.1% 5.1% 5.1% Communications 1.3% 1.4% 1.5% 1.7% 1.9% 2.1% 2.3% 2.7% 3.1% 3.4% Financial intermediation 1.6% 1.6% 1.6% 1.7% 1.8% 1.8% 1.9% 1.9% 2.0% 2.1% Real estate and business s ervices 6.6% 6.6% 6.5% 6.6% 6.7% 6.7% 6.7% 6.7% 6.7% 6.7% Public administration 7.2% 7.4% 7.8% 8.0% 8.0% 8.0% 8.0% 7.8% 7.8% 7.8% Education 2.1% 2.0% 1.9% 1.9% 1.8% 1.8% 1.8% 1.8% 1.8% 1.8% Health 1.3% 1.3% 1.3% 1.4% 1.4% 1.4% 1.4% 1.4% 1.4% 1.4% Other social & personal services 0.9% 0.8% 0.8% 0.7% 0.7% 0.7% 0.7% 0.6% 0.6% 0.6% Gross value added before adjustments 78.5% 78.9% 79.0% 79.6% 79.9% 80.3% 80.5% 80.6% 81.1% 81.1% less FISIM -0.9% -0.9% -1.0% -1.0% -1.1% -1.1% -1.2% -1.2% -1.2% -1.3% Gross value added at current basic prices 77.6% 78.0% 78.0% 78.6% 78.8% 79.2% 79.4% 79.4% 79.9% 79.8% Add Taxes on products 6.7% 6.7% 6.7% 6.7% 6.7% 6.7% 6.7% 6.7% 6.7% 6.7% B. NON MONETARY Gross domestic product at market prices 15.7% 15.3% 15.3% 14.6% 14.4% 14.1% 13.9% 13.9% 13.4% 13.5% Agriculture, Hunting and Forestry 11.0% 10.7% 10.8% 10.2% 10.0% 9.7% 9.5% 9.4% 8.9% 8.9% Crops 8.5% 8.3% 8.5% 8.0% 7.8% 7.7% 7.5% 7.5% 7.1% 7.1% Livestock 1.6% 1.5% 1.5% 1.4% 1.4% 1.3% 1.2% 1.2% 1.2% 1.2% Forestry & hunting 0.8% 0.8% 0.8% 0.7% 0.7% 0.7% 0.7% 0.7% 0.6% 0.6% Fishing 0.0% 0.0% 0.0% 0.0% 0.0% 0.0% 0.0% 0.0% 0.0% 0.0% Industry and construction 0.9% 0.9% 0.9% 0.9% 0.9% 0.9% 1.0% 0.9% 1.0% 1.0% Water supply 0.1% 0.1% 0.1% 0.1% 0.1% 0.1% 0.1% 0.1% 0.1% 0.1% Construction 0.8% 0.8% 0.7% 0.8% 0.8% 0.8% 0.8% 0.8% 0.8% 0.9% Services 3.7% 3.7% 3.6% 3.6% 3.5% 3.5% 3.5% 3.6% 3.6% 3.6% Real estate & business services 3.7% 3.7% 3.6% 3.6% 3.5% 3.5% 3.5% 3.6% 3.6% 3.6% Total GDP at market prices 100.0% 100.0% 100.0% 100.0% 100.0% 100.0% 100.0% 100.0% 100.0% 100.0% Source : National Bureau of Statistic 23
45 Table No. 4D GROSS DOMESTIC PRODUCT AND EXPENDITURE At constant 2001 prices Shs. Million ECONOMIC ACTIVITY Gross Domestic Product (GDPbp) Net taxes on product Gross Domestic Product (GDPmp) EXPENDITURE ON GROSS DOMESTIC PRODUCT Gross Domestic Product (GDPmp) Final Consumption Households Government Investment Gross Fixed Capital Formation Changes in Inventory Exports Goods Services Imports Goods Services Source : National Bureau of Statistic 24
46 Table No. 5 (Shs. million) Type Buildings: Residential Rural Own Account Non-Residential Total Other Works: Land Improvement Roads & Bridges Water Supply Others Total Equipment: CAPITAL FORMATION BY TYPE OF ASSETS (At Current Prices) Transport Equipment Other Equipment Total Fixed Capital Formation Increase in Stocks Total Capital Formation Source: National Bureau of Statistics 25
47 Table No. 6: CAPITAL FORMATION BY TYPE OF ASSETS At Constant 2001 Prices Shs. Million % change, 2010/11 Type Buildings: Residential % Rural Own Account % Non-Residential % Total % Other Works: Land Improvement % Roads & Bridges % Water Supply % Others % Total % Equipment: Transport Equipment % Other Equipment % Total % Fixed Capital Formation % Increase in Stocks % Total Capital Formation % Source: National Bureau of Statistics 26
48 Table No. 7 Shs. million Sector Public Sector: Central Gov't Parastatals Institutions Total Public Sector: Private Sector Total Fixed Capital Increase in Stocks Total Capital Formation Source: National Bureau of Statistics ++ Includes non-profit making organisations CAPITAL FORMATION BY PUBLIC AND PRIVATE SECTORS At Current Prices 27
49 INDEX OF RETAIL PRICES OF GOODS CONSUMED BY MINIMUM WAGE EARNERS IN DAR ES SALAAM (2001=100) Table 8 YEAR ALL ITEMS FOOD INDEX % CHANGE INDEX % CHANGE * Source: National Bureau of Statistics * The reference period for the NCPI has been changed from Sept following the internationally recommended Classification of Individual Consumption by Purpose (COICOP). 28
50 MINIMUM WAGE EARNERS IN DAR ES SALAAM (2001=100) Table No. 9 Beverages Electricity, Clothing Furniture Services Recreation OVERALL Year Food and Rent Kerosene and and and other Health and Transport Education Others PRICE Cigarettes and Water Footwear Household Household Services Entertain. INDEX Utensils Requirements 2005 First Quarter Second Quarter Third Quarter Fourth Quarter First Quarter Second Quarter Third Quarter Fourth Quarter First Quarter Second Quarter Third Quarter Fourth Quarter First Quarter Second Quarter Third Quarter Fourth Quarter First Quarter Second Quarter Third Quarter Fourth Quarter Foo d Alcoholic Clothing Electricity, Furniture Health Transport Communication Recreation Education Hotel and Others OVERALL Year and Drinks and and Household and Services and Restaurants PRICE Beverages Cigarettes Footwear and Water Household Entertain. INDEX Utensils 2010* Source: National Bureau of Statistics * The reference period for the NCPI has been changed from September. 2010, following the internationally recommended Classification of individual Consumption by Purpose (COICOP) 29
51 COST OF LIVING INDEX OF GOODS AND SERVICES CONSUMED BY MIDDLE GRADE WAGE EARNERS IN DAR ES SALAAM (2001=100) Table No. 10 Months Year March June September December Average Change % First Quarter Second Third Fourth Quarter Quarter Quarter * Source: National Bureau of Statistics * The reference period for the NCPI has been changed from September 2010 following the internationally recommended Classification of Individual Consumption by Purpose (COICOP). 30
52 COST OF LIVING INDEX OF GOODS AND SERVICES CONSUMED BY MIDDLE GRADE WAGE EARNERS IN DAR ES SALAAM (2001=100) Table No. 11 Beverages Electricity Clothing Furniture Services Health Recreation OVERALL Year Food and Rent Kerosene and and and other Services and Transport Education Others PRICE Cigarettes and Water Footwear Household Household Entertain. INDEX Utensils Requirements 2004 First Quarter Second Quarter Third Quarter Fourth Quarter First Quarter Second Quarter Third Quarter Fourth Quarter First Quarter Second Quarter Third Quarter Fourth Quarter First Quarter Second Quarter Third Quarter Fourth Quarter First Quarter Second Quarter Third Quarter Fourth Quarter First Quarter Second Quarter Third Quarter Fourth Quarter Foo d Alcoholic Clothing Electricity, Furniture Health Transport ommunicati Recreation Education Hotel and Others OVERALL Year and Drinks and and Household and Services and Restaurants PRICE Beverages Cigarettes Footwear and Water Household Entertain. INDEX Utensils 2010* First Quarter Second Quarter Third Quarter Fourth Quarter First Quarter Second Quarter Third Quarter Fourth Quarter Source: National Bureau of Statistics * The reference period for the NCPI has been changed from Sept. 2010, following the internationally recommended Classification of individual Consumption by Purpose (COICOP) 31
53 COST OF LIVING INDEX OF GOODS AND SERVICES CONSUMED BY HIGH INCOME GROUP IN DAR ES SALAAM (2001=100) Table No. 12 Beverages Electricity Clothing Furniture Services Health Recreation OVERALL Year Food and Rent Kerosene and and and other Services and Transport Education Others PRICE Cigarettes and Water Footwear Household Household Entertain. INDEX Utensils Requirements 2004 March June September December March June September December March June September December March June September December March June September December March June September December Foo d Alcoholic Clothing Electricity, Furniture Health Transport Communicatio Recreation Education Hotel and Others OVERALL Year and Drinks and and Household and Services and Restaurants PRICE Beverages Cigarettes Footwear and Water Household Entertain. INDEX Utensils 2010* March September December March March June September December Source: National Bureau of Statistics * The reference period for the NCPI has been changed from Sept. 2010, following the internationally recommended Classification of individual Consumption by Purpose (COICOP) 32
54 COST OF LIVING INDEX FOR HIGH INCOME GROUP IN DAR ES SALAAM (2001=100) Table No. 13 Year Months Change Average March June Sept. December % * Source: National Bureau of Statistics * The reference period for the NCPI has been changed from Sept following the internationally recommended Classification of Individual Consumption by Purpose (COICOP). 33
55 COST OF LIVING INDEX OF GOODS AND SERVICES CONSUMED BY URBAN DWELLERS IN TANZANIA MAINLAND (2001=100) Table No. 14 Beverages Electricity Clothing Furniture Household Health Recreation OVERALL Year Food and Rent Kerosene and and Operations Services and Transport Education Others PRICE Cigarettes Water Footwear Household Household Entertainment INDEX Utensils Operations 2004 First Quarter Second Quarter Third Quarter Fourth Quarter First Quarter Second Quarter Third Quarter Fourth Quarter First Quarter Second Quarter Third Quarter Fourth Quarter First Quarter Second Quarter Third Quarter Fourth Quarter First Quarter Second Quarter Third Quarter Fourth Quarter First Quarter Second Quarter Third Quarter Fourth Quarter Foo d Alcoholic Clothing Electricity, Furniture Health Transport Communication Recreation Education Hotel and Others OVERALL and Drinks and and Household and Services and Restaurants PRICE Year Beverages Cigarettes Footwear and Water Household Entertain. INDEX Utensils 2010* First Quarter Second Quarter Third Quarter Fourth Quarter First Quarter Second Quarter Third Quarter Fourth Quarter Source: National Bureau of Statistics * The reference period for the NCPI has been changed from Sept. 2010, following the internationally recommended Classification of individual Consumption by Purpose (COICOP) 34
56 COST OF LIVING INDEX OF GOODS AND SERVICES CONSUMED BY URBAN DWELLERS IN TANZANIA MAINLAND (2001=100) Table No. 15 Period Year First Second Third Forth Average Change Quarter Quarter Quarter Quarter % * Source: National Bureau of Statistics * The reference period for the NCPI has been changed from Sept following the internationally recommended Classification of Individual Consumption by Purpose (COICOP). 35
57 36
58 DIFFERENT INDICES OF GOODS AND SERVICES CONSUMED BY URBAN RESIDENTS IN TANZANIA MAINLAND (2001=100) Table No. 16 Index Index (%) Urban Urban Dwellers Dwellers Income Income Year Tanzania Tanzania Mainland Mainland Minimum Middle High Minimum Middle High * Source: National Bureau of Statistics * The reference period for the NCPI has been changed from Sept following the internationally recommended Classification of Individual Consumption by Purpose (COICOP). 37
59 CHAPTER 2 THE STATE OF THE WORLD ECONOMY AND INTERNATIONAL ECONOMIC CO-OPERATION THE STATE OF THE WORLD ECONOMY World Economic Growth 31. In 2011, the prospects for world economic recovery that set in after the aftermath of global financial crisis started to fade. During the period, the global economic growth rate slowed down to 3.9 percent compared to a growth of 5.3 percent in The decline in the global economic growth was due to slow down in the economic growth in the United States of America and European countries as well as debt crisis in some of European countries. Further, the earthquake that caused Tsunami in the Eastern Japan, escalating political unrest in Northern Africa and Middle East, and transitory increase in the world oil prices in the second quarter of 2011 added more challenges to the growth of the world economy. 32. The pace of economic growth for Developed Countries slowed down to 1.6 percent in 2011 compared with a growth rate of 3.2 percent in For the Developing Countries, the pace of growth decreased to 6.2 percent in 2011 from the economic growth rate of 7.5 percent in The slow down in the growth of these countries was due to fiscal consolidation and monetary tightening in the environment of weak economic growth potentials. Similarly, the pace of economic growth for Developing Asian Countries notably China and India decreased to 7.8 percent in 2011 from a growth of 9.7 percent in To some extent, the decline was a result of disruption of supply chains and unreliable markets of goods from Developed Countries. Table 2.1: Global Output Growth in Percentage Global Output Developed Countries Developing Countries Developing Asian Countries Sub-Saharan Africa Source: - International Monetary Fund (IMF), April
60 Trends in World Trade 33. In 2011, the growth of world trade dropped to 5.0 percent from a growth of 13.8 percent in The decrease in the growth of the world trade was caused by a number of factors including political unrest in some Arab countries such as Libya and Egypt which resulted to decline of exports from Africa. Further, the occurence of catastrophic Tsunami in Japan disrupted supply chain of trade in the Developing Countries such as China that ultimately led to low production of goods designated for export. 34. The value of world merchandise exports was US dollar 18.0 trillion in 2011 compared to US Dollar 15.1 trillion in 2010, equivalent to an increase of 19.0 percent. The increase in the value of merchandise exports was driven by increase in prices of those commodities in the world market. In addition, the value of merchandise exports in African countries increased by 17.0 percent in 2011 compared with a growth of 30.0 percent in Moreover, value of merchandise imports in the African countries increased by 18.0 percent in 2011 compared to a growth of 15.0 percent in On the basis of such trade trend, the African countries trade balance had a surplus of US Dollar 42.0 billion in 2011 compared with a surplus of US Dollar 37.0 billion in 2010, equivalent to an increase of 13.5 percent. 39
61 Table 2.2: World Merchandise Trade (Billion USD and Percentage) Exports Imports Value Annual percentage change Value Annual percentage change World 17, , North America 2, , United States 1, , Canada Mexico South and Central America Brazil Other South and Central America Europe 6, , European Union 6, , Germany 1, , France Netherlands United Kingdom Italy Commonwealth of Independent States (CIS) Russian Federation Africa South Africa Africa less South Africa Oil exporters Non oil exporters Middle East 1, Asia 5, , China 1, , Japan India Newly industrialized economies 1, , Memorandum Items Least Developed Countries (LDCs) Source: - World Trade Organisation (WTO) Report April 2012 The State of African Economy 35. In 2011, the pace of African countries economic growth decreased mainly due to political unrest in North Africa and continued slow-down of economic activities in Developed Countries. The strewed social and political turmoil in the North Africa discouraged investors hence decreased foreign capital and private investment. Similarly, production and export of oil which is the mainstay of the economy in North African countries were severely disrupted and also tourism business slumped. For the first time in five years, the pace of growth for the oil export countries in African continent s lagged behind the oil importing countries. The economic growth in the oil-exporting countries decelerated from 5.1 percent in 2010 to 1.5 percent in 2011, despite large windfall oil export gains from rising oil prices. 36. In 2011, the pace of economic growth for Sub-Saharan Africa slowed down to 5.1 percent compared with a growth of 5.3 percent in The slowness in growth was attributed to low pace of economic growth for oil exporting countries which grew at 6.3 percent in 2011 from a growth of 6.5 percent in
62 37. The economic growth for Middle-income countries in Sub-Saharan Africa declined slightly to 3.0 percent in 2011 from a growth of 3.1 percent in On the contrary, the economic growth for Low-income countries in Sub- Saharan Africa increased from 5.3 percent in 2010 to 5.8 percent in In general, the economic prospects for Sub-Saharan Africa are full of signs of returning to its trajectory growth path after suffering the consequences of global financial crisis in In 2011, the inflationary pressure for consumer goods and services in Sub- Saharan Africa increased to an average of 8.2 percent compared with 7.4 percent in This inflationary pressure was also manifested in the Middleand Low-income countries of Sub-Saharan Africa. The increase in the average consumer prices was mainly driven by the rising food and oil prices in the world market. However, the oil exporting countries revealed different pattern of inflationary pressure in which inflation subdued to 10.2 percent in 2011 compared to 12.4 percent in Table 2.3: Selected Sub-Saharan African Economies: Real GDP, Consumer Prices and Current Account Balance ( ) Real GDP Consumer Prices Current Account Balance Annual growth Annual growth Percentage of GDP Sub-Saharan Africa Oil Exporters Nigeria Angola Equatorial Guinea Gabon Republic of Congo Chad Middle-Income South Africa Botswana Ghana Cameroon Cote d'ivoire Senegal Low-Income Ethiopia Kenya Tanzania Uganda Democratic Republic of Mozambique Source:- International Monetary Fund (IMF) April
63 INTERNATIONAL CO-OPERATION East African Community (EAC) 39. The East African Community Heads of States met in April 2011 and ordered a study to be conducted on how to establish Single Customs Territory. The implementation of that directive started in October 2011 and final report was expected to be submitted in April On the other hand, in their endevour of reducing non-tariff trade barriers in the inter-regional trade, the EAC member states put in place the legal framework for establishing One- Stop-Border Posts (OSBPs). Further, the consultant who was commissioned to carry out analytical study on how to harmonize vehicles weight in the region submitted a draft report in February Currently, EAC member states continue to review critically the submitted report. 40. In the implementation of the protocol for establishing the East African Community Common Market, the member states are not allowed to impose trade barriers in the form of tariffs and non-tariffs. Following food and sugar shortage experienced in 2011 amongst the EAC member states, Tanzania imposed restrictions on exporting food and sugar mainly to control illegal movement of goods beyond the borders. However, the move was translated by other member states as Non Trade Barriers (NTB). As a result of, the Council of Sectoral Ministers for agriculture and food safety met in August and November 2011 in Arusha to discuss the food situation in the region and also the removal of trade barriers on food and seeds. In those meetings, the member states agreed that each country had to ascertain the situation of food and submit a report to EAC Secretariat. Further, the Secretariat was directed to prepare a proposal on how to mobilize funds from the Development Partners to implement EAC food security road map. 41. The 13 th Summit of East African Community Heads of States was held in November 2011 at Bujumbura whereby President Pierre Nkurunziza of Burundi handed over the Chairmanship of EAC to President Mwai Kibaki of Kenya. The Summit considered and adopted the report of the team of experts on concerns, fears, and challenges on the political federation and directed the Secretariat to prepare a road map of establishing and strengthening institutions as identified by the team of experts. Among the institutions which were proposed in the recommendations include EAC Customs Authority, EAC Common Market Authority, Commission for EAC Economic Union Authority, EAC Monetary Union Authority, EAC Unified Federal Treasury, EAC Court of Justice and East African Legislative Authority. 42. In intention of having reliable infrastructures which would facilitate the transportation of cargoes and passengers in the East African Community 42
64 region, a number of projects continued to be implemented. In Tanzania the projects that were carried out in 2011 include construction of Arusha Namanga Athi River road with a distance of kilometres of tarmac and 39 bridges. The feasibility study and designe were done for the construction of Malindi Lunga Lunga and Tanga Bagamoyo road with a total distance of 400 kilometres out of which 240 kilometres are in Tanzania. Another project was the construction of Tanga Horohoro road with a distance of 65 kilometres whose implementation has reached 67.5 percent by the end of African Union and Economic Commission for Africa 43. The social and political unrest that happened in the Northern African countries as well as slowdown in global economic growth, contributed to the slim employment opportunities in Africa. In addition, the Africa s economy grew at lower rate of 2.7 percent in 2011 compared to 4.6 percent in 2010, the growth that was not translated into job- creation opportunity and income inequality. Against the backdrop, the African Union and Economic Commission for Africa (ECA) at their 4 th Annual Joint Meeting that took place in Addis Ababa March 2011, discussed on how to govern Development in Africa with a focus on the Role of the State in Economic Transformation. The discussion confined into three main topics that included Greening the Economy the concept aimed at improving human well-being without undermining their resource-base for future generations; health financing and increasing employment opportunities; and leveraging opportunities for accelerated growth. 44. At the meeting, the African countries agreed to key priorities in the next decade for the continent s development. The priorities include: effective resource mobilization; meeting infrastructure challenges; building human capital; strengthening in Regional integration and Intra-Africa trade; and Public Private Partnership strengthened and good governance. During the course of discussion it was observed that market mechanism alone cannot be sufficient for economic transformation, the Government has a central role to play. Moreover, it is important for the States to have political will and capacity to articulate and implement expansionary and transformative policies. Lastly, African countries should put strong institutional regional and continental integration with appropriate mechanism to coordinate, implement and monitor integration policies. Southern Africa Development Community 45. In 2011, the Southern Africa Development Community (SADC) participated in a tripartite meeting to discuss on the issues of Free Trade Area 43
65 for the three regional integrations of East African Community (EAC), Southern Africa Development Community (SADC) and Common Market for Eastern and Southern Africa (COMESA) in Johannesburg. The issue discussed in the meeting was to merge the markets for 26 countries with approximately a total population of 600 million. The establishment of a tripartite Free Trade Area (FTA) will bolster intra-regional trade by creating a wider market, increasing investment flows, enhancing competitiveness and developing crossregional infrastructure. Infrastruture development would enhance connectivity and reduce costs of doing business as well as indusrial development to address the production constraints. 46. Similarly, SADC participated in the first meeting of the COMESA-EAC- SADC Tripartite Trade Negotiation Forum that took place in Nairobi, Kenya December The main purpose of the meeting was to formally constitute the Tripartite Trade Negotiation Forum for the three communities of COMESA, EAC and SADC. In addition, the meeting deliberated on administrative arrangements to facilitate the conduct of the negotiations on the Tripartite Free Trade Area. World Trade Organisation 47. After nearly two decades of trying to become a member of World Trade Organisation (WTO), ultimately Russia gained approval to join the WTO in Previously, Russia was amongst the top six countries with strong economy and a member of G-20 who was not in the group of 153 members of WTO. The Russian membership will stimulate world trade, especially export of commodity (gas and oil) in the European Union (EU) and importation from Euro area at a lower price. 48. In July 2011, The World Trade Organisation and its members; key international aid and development organizations, conducted the Third Global Review of Aid for Trade in Geneva. Aid for Trade aims at helping developing and least-developed countries to increase exports of goods and services, to integrate more effectively into the multilateral trading system and to benefit from liberalized trade and increased market access opportunities. In addition, the initiative aimed at assisting these countries in overcoming their production constraints, develop their economic infrastructure and increase their competitiveness. 44
66 CHAPTER 3 EXTERNAL SECTOR INTRODUCTION 49. In 2011, the trend in export of goods and services was satisfactory although it encountered challenges including low industrial production and declining world price and demand emanating from the euro zone debt crisis. The value of goods and services exported increased by 17.1 percent and merchandise exports increased by 17.9 percent in On the other hand, the value of goods and services imported in 2011 increased by 33.0 percent, largely driven by increase in oil imports. MERCHANDISE EXPORTS 50. In 2011, the value of merchandise exports increased to USD 5,098.8 million compared to USD 4,323.1 million in 2010, equivalent to an increase of This was due to the increase in traditional and non-traditional goods. In addition, the value of merchandise export included unrecorded trade amounting to USD million in The share of traditional goods to total exports in 2011 was 13.1 percent while non-traditional goods accounted for 73.8 percent and unrecorded trade was 13.0 percent. Traditional exports 51. In 2011, the value of traditional exports increased by 16.8 percent to USD million from USD million in This was due to the increase in the volume of goods exported particularly tobacco and coffee, as well as increase in the average price of coffee, cloves and cashewnuts in the world market. The average price of cloves in the world market increased to USD 13,087.3 per tonne from USD 3,449.6 per tonne in This huge increase was due to low production of cloves in Indonesia, which is among the major clove-producing countries in the world. The share of traditional goods to total merchandise exports was 13.1 percent compared to 13.2 percent in Coffee 52. In 2011, the value of coffee exports increased by 40.3 percent to USD million from USD million in This was due to the increase in the volume of coffee exports and rise in the average price of coffee in the world market. The average price of coffee was USD 3,654.9 per tonne in 2011 compared to USD 2,853.1 per tonne in Similarly, the volume of coffee exports increased from 35,600 tonnes in 2010 to 39,000 tonnes in 2011, equivalent to an increase of 9.5 percent. 45
67 Cotton 53. In 2011, the value of cotton exports continued to decrease to USD 61.6 million from USD 84.0 million in 2010, equivalent to a decrease of 26.7 percent. This was due to the decrease in the volume of cotton exports although the average price of cotton increased in the world market. The volume of cotton exports decreased from 67,600 tonnes in 2010 to 40,300 tonnes in 2011, equivalent to a decrease of 40.4 percent. Nevertheless, the average price of cotton in the world market increased to USD 1,529.0 per tonne in 2011 from USD 1,241.9 per tonne in Tea 54. The value of tea exports decreased to USD 47.2 million in 2011 from USD 49.8 million in 2010, equivalent to a decrease of 5.3 percent. The decrease was due to the decline in the average price of tea in the world market. The average price of tea in the world market decreased from USD 1,840.2 per tonne in 2010 to USD 1,739.7 per tonne in In 2011, the volume of tea exports remained at 27,100 tonnes as it was in Tobacco 55. In 2011, the value of tobacco exports increased to USD million compared to USD million in 2010, equivalent to an increase of 21 percent. This was due to the increase in the volume of tobacco exports from 53,600 tonnes in 2010 to 73,300 tonnes in Nonetheless, the average price of tobacco in the world market decreased to USD 3,839.4 per tonne in 2011 from USD 4,337.0 per tonne in 2010, equivalent to a decrease of 11.5 percent. Cashewnuts 56. In 2011, the value of cashewnuts exports increased to USD million from USD 96.9 million in 2010, equivalent to an increase of 10.4 percent. The increase was driven by the rise in average price of cashewnuts in the world market although the volume of cashewnuts exports decreased. The average price of cashewnuts in the world market increased by 15.2 percent, from USD per tonne in 2010 to USD 1,110.0 per tonne in However, the volume of cashewnuts exports decreased to 96,400 tonnes in 2011 from 100,600 tonnes in 2010, equivalent to a decrease of 4.2 percent. Cloves 57. The value of cloves exports increased to USD 29.0 million from USD 7.6 million in 2010, equivalent to an increase of percent. This was due to the increase of average price of cloves in the world market and volume of 46
68 cloves exports. The average price of cloves in the world market increased by percent from USD 3,449.6 per tonne in 2010 to USD 13,087.3 per tonne in This was due to low production of cloves in Indonesia, which is among the major clove-producing countries in the world, following the eruption of a disease that affected the crop. In addition, the volume of cloves exports increased by 0.4 percent from 2,206 tonnes in 2010 to 2,214 tonnes in Non-Traditional Exports 58. In 2011, the value of non-traditional exports increased to USD 3,765.1 million compared to USD 3,186.9 million in 2010, equivalent to an increase of 18.1 percent. The increase was attributed to continued increase in minerals exports, particularly gold, as well as increase in horticultural exports. The share of non-traditional exports to total merchandise exports was 86.9 percent compared to 86.8 percent in 2010 including unrecorded trade. Minerals 59. In 2011, the value of mineral exports increased to USD 2,284.1 million from USD 1,560.2 million in 2010, equivalent to an increase of 46.4 percent. Gold continued to dominate in the export trade, whereby in 2011 gold accounted for 97.4 percent of all minerals exports and 59.1 percent of all nontraditional exports. The value of gold exports increased from USD 1,516.6 million in 2010 to USD 2,224.1 million in 2011, equivalent to an increase of 46.7 percent. This was particulary driven by increase in the volume of gold exports and the average unit price of gold in the world market. The volume of gold exports increased from 35.6 tonnes in 2010 to 40.4 tonnes in 2011, equivalent to an increase of 13.5 percent. In addition, during the same period, the average price of gold in the world market increased by 28.0 percent to USD 1,568.0 per ounce. Manufactured Goods 60. The value of exports of manufactured goods decreased from USD million in 2010 to USD million in 2011, equivalent to a decrease of 10.6 percent. The decrease was caused by the power rationing that led to low production of manufactured goods particularly paper products, plastic products and cotton fibres. In addition, the share of manufactured goods was 22.9 percent of the total non-traditional exports in 2011 compared to 30.3 percent in
69 Fish and Fish Products 61. In 2011, the export value of fish and fish products decreased by 8.4 percent to USD million from USD million in This was due to the decrease in the volume of fish and fish products exported. Horticultural Products 62. In 2011, the value of exports of holticultural products was USD 36.4 million compared to UDS 30.8 million in 2010, equivalent to an increase of 18.3 percent. This was mainly attributed to the increase in the exports of floricultural products following improvement in holticultural investments in the recent years. Other goods exports 63. In 2011, the value of other goods exported (including oil seeds, leather, cereals, cocoa and wood products plant) USD million compared to USD million in 2010, equivalent to a decrease of 0.6 percent. In addition, the value of re-exports was USD 98.3 million in 2011 compared to USD million in 2010, equivalent to a decrease of 25.8 percent. Likewise, the value of unrecorded goods was USD million in 2011 compared to USD million in 2010, equivalent to an increase of 17.9 percent. 48
70 Table No.3.1: VALUE, VOLUME AND PRICES OF GOODS EXPORTS ( ) Goods exports r 2011p (Badi liko) Traditional goods Coffee Value ((US$ million)) % Volume ( 000 tons) % Price (US$ per ton) 2, , , , , % Cotton Value ((US$ million)) Volume ( 000 tons) Price (US$ per ton) 1, , , , , Sisal Value ((US$ million)) Volume ( 000 tons) Price (US$ per ton) , Tea Value ((US$ million)) Volume ( 000 tons) Price (US$ per ton) 1, , , , , Tobacco Value ((US$ million)) Volume ( 000 tons) Price (US$ per ton) 2, , , , , Cashewnuts Value ((US$ million)) Volume ( 000 tons) Price (US$ per ton) , Cloves Value ((US$ million)) Volume ( 000 tons) Price (US$ per ton) 2, , , , , Sub-Total (Traditional exports) Non-Traditional exports Minerals , , , , Gold , , , , Diamond Other minerals Manufactured goods Fish and fish products Holticultural products Re-exports Other exports Sub - Total 1, , , , , Unrecorded Trade Grand Total 2, , , , , Source: Bank of Tanzania and Ministry of Finance - Data not available 49
71 Service Receipts 64. In 2011, receipts from services was USD 2,362.5 million compared to USD 2,045.7 million in 2010, equivalent to an increase of 15.5 percent. This was due to the increase in receipts from tourism and transportation which altogether accounted for more than 80 percent of all service receipts. Receipts from tourism increased by 16.1 percent to USD 1,456.9 million in 2011 from USD 1,254.5 million in 2010 resulting from increase in the number of tourists and Government efforts to promote Tanzania as a tourist destination. Likewise, receipts from transportation services increased by 33.2 percent to USD million from USD million in This was due to the increase in transportation of goods to and from neigbouring countries. MERCHANDISE IMPORTS 65. In 2011, the value of goods imported (f.o.b) was USD 9,827.5 million compared to USD 7,165.5 million in 2010, equivalent to an increase of 37.2 percent. This was mainly due to the increase in oil and machinery imports to address the power shortage that existed in 2011 as well as a rise in the average price of oil in the world market. Capital goods 66. In 2011, the import value of capital goods increased to USD 3,560.5 million from USD 2,715.2 million in 2010, equivalent to an increase of 31.1 percent. This was attributed to the increase of machinery imports due to the increase of investment activities in natural gas and petroleum sectors. Machinery imports increased by 49.1 percent to USD 1,794.3 million in 2011 compared to USD 1,203.4 million in Similarly, the value of import of transport equipment increased by 11.9 percent to USD 1,008.5 million in 2011 from USD million in In addition, imports of construction materials increased by 24.1 percent to USD million in 2011 compared to USD million in Intermediate Goods 67. In 2011, import value of intermediate goods increased to USD 4,139.0 million from USD 2,741.2 million in 2010, equivalent to an increase of 51.0 percent. This was mainly due to increase of oil price in the world market as well as increase in the volume of oil imports for electricity generation. Oil import alone accounted for 32.9 percent of the total cost of goods imported. The value of oil imports was USD 3,228.7 million in 2011 compared to USD 2,024.2 million in 2010, equivalent to an increase of 59.5 percent. The value 50
72 of imports of fertilizer increased from USD 115 million in 2010 to USD million in 2011, equivalent to an increase of 53.6 percent. This was due to the decrease in fertilizer production in the local industries. In addition, the value of industrial raw materials imported increased by 21.9 percent from USD 602 million in 2010 to USD million in Consumer Goods 68. In 2011, imports of consumer goods increased to USD 2,128.0 million from USD 1,709.2 million in 2010, equivalent to an increase of 24.5 percent. This was due to increase in the import value of food and food stuffs and other consumer goods. Imports of food and food stuffs increased by 30.6 percent from USD million in 2010 to USD million in 2011 due to the increase in the importation of grain products especially wheat, as well as increase in the average price of grain products in the world market. The value of imports of wheat increased to USD million in 2011 compared to USD million in 2010, while its average price in the world market increased from USD million per tonne in 2010 to USD million per tonne in In addition, imports of other consumer goods increased by 22.3 percent to USD 1,522.7 million in 2011 compared to USD 1,245.3 in SERVICES PAYMENTS 69. In 2011, service payment was USD 2,165.3 million compared to USD 1,849.6 million in 2010, equivalent to an increase of 17.1 percent. This was due to the increase in the costs of cargo transportation services as well as increase in the volume of imported goods. Payment of transportation services increased from USD to USD 973.3, equivalent to an increase of 34.7 percent. Similarly, payments for tourism services increased by 8.2 percent from USD in 2010 to USD in However, payment of other services decreased from USD million in 2010 to USD million in 2011, equivalent to a decrease of 1.9 percent. TRENDS IN SELECTED REGIONAL AND BILATERAL TRADE 70. In 2011, Tanzania continued to maintain trade relationship with many countries in the world, including countries from Europe, America, Asia and Africa continents. During the period under review, most of Tanzania goods were exported to South Africa which accounted for 16.3 percent of all goods exports followed by Switzerland 16.1 percent, China 12.9 percent, Japan 6.8 percent, Germany 4.4 percent, Kenya 4.1 percent and India 4.0 percent. Most exported goods included: minerals; floricultural products; coffee and tobacco. Moreover, Tanzania imported goods mostly from China, which accounted for 8.1 percent of all goods imported, followed by India at 8.0 percent, South 51
73 Africa 6.9 percent, United Arab Emirates 6.0 percent, Japan 5.1 percent, Switzerland 5.0 percent, Singapore 4.0 percent and Kenya 2.5 percent. Some of the imported goods included tyres, communications equipment such as mobile phones, motorcycles, cars, petroleum products and pharmaceticals. 71. In 2011, the value of goods exports to European countries increased to USD 1,382.0 million from USD 1,151.1 million in 2010, equivalent to an increase of 20.1 percent. This was a result of increase in exports to Switzerland by 19.3 percent. The value of goods exports to Switzerland increased to USD million from USD million in The value of goods imports from Europe increased from USD 1,669.8 million in 2010 to USD 1,721.5 million in 2011, equivalent to an increase of 3.1 percent. In addition, the balance of merchandise trade between Tanzania and European countries improved further to a deficit of USD million in 2011 from a deficit of USD million in In 2011, the value of goods exports to East African Community (EAC) countries decreased by 21.7 percent to USD million compared to USD million in This was due to a decrease in exports to EAC countries except Rwanda. The exports to Rwanda increased by 19.6 percent from USD 55.0 million in 2010 to USD 65.8 million in Exports to Burundi decreased by 39.6 percent, Kenya by 28.9 percent and Uganda by 4.7 percent. Goods exported to Kenya accounted for 59.9 percent of all exports to EAC countries, Rwanda accounted for 18.7 percent, Uganda 12.7 percent and Burundi 8.7 percent. The value of goods imported from East African Countries decreased to USD million in 2011 from USD million in 2010, equivalent to a decrease of 7.5 percent. The balance of merchandise trade between Tanzania and EAC countries recorded a surplus of USD 88.6 million compared to a surplus of USD million in In 2011, the value of goods exports to Southern African Development Community (SADC) increased to USD 1,158.9 million from USD million in 2010, equivalent to an increase of 85.4 percent. This was mainly attributed to increased exports to South Africa. The value of goods exported to South Africa increased by 99.4 percent and accounted for 71.7 percent of all exports to SADC countries in The value of goods imported from SADC countries decreased by 5.6 percent to USD million in 2011 from USD million in This was due to the decrease of imports from all SADC member countries. The balance on merchandise trade between Tanzania and other SADC member countries registered a surplus of USD million in 2011 compared to a deficit of USD million in In 2011, the value of goods exports to all African countries increased to USD 1,579.2 million from USD 1,080.9 million in 2010, equivalent to an 52
74 increase of 46.1 percent. This was mainly attributed to the increase in exports to SADC countries particularly South Africa. The value of goods imported from African countries decreased by 1.3 percent from USD 1,112.9 million in 2010 to USD 1,098.1 million in This was due to the decrease in the value of imports from South Africa and Kenya. The balance on mechandise trade between Tanzania and all African countries recorded a suprlus of USD million in 2011 compared to a deficit of USD 32.0 million in In 2011, the value of goods exports to Asian countries including China, Japan, India, Hong Kong, Singapore and United Arab Emirates increased by 17.9 percent to USD 1,414.6 million from USD 1,200.2 million in This was attributed to the increase in exports to Japan and China. The value of goods imported from Asian countries slightly decreased from USD 4,083.4 million in 2010 to USD 4,037.3 million in 2011, equivalent to a decrease of 1.1 percent. The balance on merchandise trade between Tanzania and Asian countries was slightly improved and recorded a deficit of USD 2,622.7 million in 2011 compared to the deficit of USD 2,957.9 million in In 2011, the value of goods exports to American continent increased to USD 59.9 million from USD 51.0 million in 2010, equivalent to an increase of 17.5 percent. This was due to the increase in exports to America and Canada. The value of goods imported from that Continent decreased by 7.3 percent to USD million in 2011 from USD million in In addition, the balance on merchandise trade between Tanzania and American countries also improved and recorded a deficit of USD million in 2011 compared to a deficit of USD million in Table 3.2: Balance on Trade between Tanzania and Regional Economic Grouping (USD million) Region/Year r 2011p European Continent 3.9 (77.8) (515.2) (567.0) (313.1) (518.7) (339.5) SADC (103.2) (284.8) (355.4) (510.2) (417.8) (202.6) EAC (64.0) (56.7) (46.7) Asian Continent - - (1,582.0) (2,212.8) (2,352.2) (2,957.9) (2,622.7) American Continent - (174) (291.5) (313.7) (217.1) (208.0) (180.3) Source: Bank of Tanzania and Ministry of Finance r = revised p = provisional 53
75 Table 3.3: Tanzania Export by Country/Region of Destination (USD million) COUNTRY/REGION r 2011p 2010/11 (% change) European Union (EU) % Other European Countries % TOTAL - European continent % SOUTHERN AFRICAN DEVELOPMENT COMMUNITY (SADC) South Africa % Zambia % Swaziland Zimbabwe Mozambique % Democtratic Republic of Congo % Other SADC countries TOTAL- SADC % EAST AFRICAN COMMUNITY (EAC) Burundi % Kenya % Rwanda % Uganda % TOTAL EAC % Other African Countries % TOTAL AFRIKA % AMERICAN CONTINENT America % Canada % Other American countries CONTINENT % ASIA China % India % Japan % United Arab Emirates % Hong Kong % Singapore % Other Asian Countries % TOTAL- ASIA % Other Countries % GRAND TOTAL 1, , , , , , , % Source: Bank of Tanzania and Ministry of Finance r = revised p = provisional 54
76 Table 3.4: Tanzania Import by Country/Region o f Origin (Value in M illion USD) COUNTRY/REGION r 2011p 2010/11 (% change) European Union ( EU) Other European Countries TOTAL - European co ntinent AFRICA SOUTHERN AFRICAN DEVELOPM ENT (SADC) South Africa Zimbabwe Zambia Mozambique Democratic Republic of Congo Swaziland Other SADC Countries TOTAL SADC EAST AFRICAN COM MUNITY Burundi Kenya Rwanda Uganda TOTAL EAC Other African Countries AFRICA AMERICAN CONTINENT AMERICAN CONTINENT Canada Other American countries TOTAL-American cont inent ASIA China India Japan Hong Kong Singapore United Arab Emirates Other Asian countries TOTAL - ASIA OTHER COUNTRIES GRAND TOTAL Source: Bank of Tanzania and Ministry of Finance p = provisional r = revised BALANCE OF PAYMENTS Balance of Merchandise Trade 77. In 2011, the balance of merchandise trade recorded a deficit of USD 4,728.8 million compared to a deficit of 2,842.4 million in 2010, equivalent to deficit increase of 66.4 percent. This was due to the increase in the pace of goods imports relative to exports, particularly imports of machinery and oil to address the challenges in the energy sector. 55
77 Balance on Services 78. In 2011, the balance on services registered a surplus of USD million compared to a surplus of million in 2010, equivalent to an increase of 2.0 percent. This was due to the increase in receipts from tourism and transportation services. Balance on trade and services 79. In 2011, the balance on trade and services registered a deficit of USD 4,531.6 million from a deficit of USD 2,649.0 million in 2010, equivalent to an increase of deficit by 71.1 percent. This was due to the increase in goods and service payments. Balance on Investments Receipts and Payments 80. In 2011, the balance on investment receipts which includes of compensation to employees, investment income and interest payments registered a deficit of USD 55.7 million from a deficit of USD 40.8 million in 2010, equivalent to an increase of deficit by 36.5 percent. This was due to the increase in compensation of employees from USD 44.0 million in 2010 to USD 82.9 million in Balance on Current Transfers 81. The balance on current transfer which includes money transfers, grants and debt relief recorded a surplus of USD million in 2011 compared to a surplus of USD million in 2010, equivalent to a decrease of 25.0 percent. This was due to decline in DPs support to the Government since most of them were facing economic and political unrest. In 2011, the Government received grants from Development Partners amounting to USD million compared to USD million received in 2010, equivalent to a decrease of 23.6 percent. Balance on Current Accounts 82. In 2011, the balance on current account which includes balance on merchandise trade, service, investment receipts and payments as well as current transfers, registered a deficit of USD 3,967.4 million compared to a deficit of USD 1,863.8 million in 2010, equivalent to deficit increase of percent. This was mainly caused by increase in deficit on balance of trade and services exarbated by the increase in imports and service payments. Balance on Capital Transfers 83. In 2011, the balance on capital transfers, which includes investment grants and debt cancellation from international financial institutions and Development Partners increased by percent to a surplus of USD million from the surplus of USD million in This resulted from increase in investment grants to the Government. 56
78 Balance on Investment Payments 84. In 2011, the balance on investment payments that comprises Foreign Direct Investments (FDI) and foreign loans registered a surplus of USD 2,582.2 million compared to a surplus of USD 1,732.5 million in 2010, equivalent to an increase of 49.0 percent. This resulted from a decline in foreign resources owned by local commercial banks from USD 75.2 million in 2010 to USD 22.2 million in Overall Balance of Payments 85. In 2011, the overall balance of payments registered a deficit of USD million compared to a surplus of USD million in The deficit in 2011 was mainly due to an increase in the current account deficit. FOREIGN CURRENCY RESERVES 86. As of end - December 2011, foreign reserves was USD 3,761.2 million compared to USD 3,948.0 million recorded in the corresponding period in 2010, equivalent to a decrease of 4.7 percent. This amount of foreign reserves in 2011 was equivalent to 3.8 months of imports of goods and services compared to 5.3 months in EXCHANGE RATE 87. In 2011, the value of Tanzanian Shilling against USD depreciated by 10.3 percent to an annual average of Shilling 1,579.5 per one dollar compared to an average of Shilling 1,432.3 per one dollar in 2010.The value of the Tanzania shilling depreciated due to various reasons particularly: increase in imports of goods and services relative to exports; inflation differences between Tanzania and other trading partners; Market speculation and appreciation of USD against other international currencies. As of end of December 2011 the value of USD was 1,566.7 shillings compared to 1,453.5 shillings recorded at end of December
79 Table No. 17 VALUE OF TANZANIA'S FOREIGN TRADE Shs. million Type of Goods Exports Domestic Exports Re-exports Imports Total Value of Foreign Trade Balance of Merchandise Trade Exchange Rate (Shs/US$) , , , , , , , , ,557.4 Source: National Bureu of Statical, Bank of Tanzania and Tanzania Revenue Authority 58
80 Table No. 18 Commodity Quantity (Tonne) VOLUME AND VALUE OF DOMESTIC EXPORTS Value (Shs. milion) Change (%), 2010/ Change (%), 2010/11 Coffee Cotton Sisal Tea Tobacco Cashewnuts Cloves Diamonds (Carats) Gold (Gms.) Source: National Bureau of Statistics and Tanzania Revenue Authority 59
81 VOLUME AND VALUE OF TRADITIONAL AND NON-TRADITIONAL EXPORTS Table No. 19 Quantity (Tonne) Value (mill.us$) Change (%) Change (%) Commodity r 2011p 2010/ r 2011p 2010/11 Traditional Commodities Coffee Cotton Sisal Tea Tobacco Cashewnuts Cloves Sub-Total Non-Traditional Commodities Minerals Manufactured Goods Fish and Fish Products Horticultural products Re-exports Other Exports Sub-Total Unrecorded Goods GRAND TOTAL Source: National Bureau of Statistics and Bank of Tanzania - Not Available r - Revised figures p - Provisional Figures 60
82 61
83 62
84 63
85 64
86 EXPORT PRICES OF PRINCIPAL COMMODITIES Table No. 20 Shs/Tonne* Change(%) Commodity /11 Coffee 926, ,107, ,380, ,812, ,390, ,668, ,642, ,628, ,069, ,580, Cotton 811, ,051, ,147, ,126, ,221, ,222, ,767, ,462, ,775, ,412, Sisal 491, , , , , ,047, , ,475, Tea 1,166, ,233, ,495, ,322, ,680, ,581, ,861, ,373, ,501, ,711, Tobacco 1,993, ,101, ,109, ,938, ,440, ,869, ,593, ,966, ,586, ,916, Cashewnuts 596, , , , ,058, ,278, ,356, , ,284, ,626, Cloves 3,117, ,901, ,524, ,210, ,285, ,321, ,202, ,008, ,390, ,972, Diamonds (Carats) 114, , , , , , , , , , Gold (Gms.) 7, , , , , , , , , , Source: Custom Department, Tanzania Revenue Authority * Except for diamonds and gold, whose prices are quoted per carat and gram respectively 65
87 EXPORT PRICES O F PRINCIPAL COMM ODITIES Table No. 21 US$/Ton* Change(%) Commodity /11 Coffee , , , , , , , , , Cotton , , , , , , Sisal , , Tea 1, , , , , , , , , , Tobacco 2, , , , , , , , , , Cashewnuts , Cloves 3, , , , , , , , , , Diamonds (Carats) , , , Gold (Gms.) Source: National Bureau of Statistics and Tanzania Revenue Authority * Except for diamonds and gold, whose prices are quoted per carat and gram respectively - Figures not available 66
88 67
89 COMPOSITION OF IMPOR TS Table No. 23 Consumer Intermediate Capital Year Goods Goods Goods Shs. Million Total * Source: Bank of Tanzania * Commencing 1990, the value of imports is quoted at F.O.B. prices (previously quoted at C.I.F. prices) 68
90 BALANCE OF PAYMENTS Table No. 24 US $ milion Actual Actual Actual Actual Actual Actual Actual Actual Actual Likely Outturn GOODS BALANCE Exports (fob) Imports (fob) Service balance Receipts Payments Income Receipts Payments Current transfers Inflows Government Other Sectors Outflows CURRENT ACCOUNT Capital Transfers Inflows Outflows Financial Account Direct Investment Portfolio Investment Other Investment Errors and Omissions OVERALL BALANCE Financing Source: Bank of Tanzania Starting 2006, exports includes unrecorded goods 69
91 70
92 CHAPTER 4 GOVERNMENT FINANCE Introduction 88. The budget frame for 2011/12 considered key areas for implementation including: achieving the objectives of the Tanzania Development Vision 2025; priorities of the Five Year Development Plan (2011/ /16); Phase II of the National Strategy for Growth and Reduction Poverty (MKUKUTA II); The Millennium Development Goals 2015; CCM election manifesto of 2010, the Joint Assistance Strategy for Tanzania (JAST); and the National Debt Strategy. 89. The basis and objectives of the Government budget for 2011/12 were aimed at: addressing the challenges of reducing cost of living to citizens; continued improvement of domestic revenue collection mechanism; improving investment climate to attract local and foreign investments and to develop the private sector; continued with implementation of the national identity cards project; establishment of postal codes and address system; implementation of Property and Business Formalization programme; ensuring that revenues from retention schemes are collected appropriately and remitted to the Consolidated Fund Services; allocating resources in areas that stimulate economic growth; and strengthening good governance and accountability. Other assumptions were to: implement specific plans and strategies that foster economic growth; strengthen balance of payment through processing goods before export; borrow prudently from concessional and non concessional sources; speeding up the implementation of Public Private Partnership Act in order to widen opportunities for executing development projects; and sustaining the achievements attained in the social sectors (Education, Water and Health) 90. Based on macroeconomic policy as well as the assumptions and policy objectives for 2011/12 budget, the Government estimated to collect revenue from different sources amounting to shilling 13,525.9 billion and spend the same amount for recurrent and development expenditures. The revenue sources were as follows: domestic revenue shilling 6,775.9 billion; revenue from Local Government own source shilling billion; programme grants and loans shilling billion; budget support grants and loans for development project and sector basket funds shilling 3,054.1 billion; domestic and foreign loans shilling 1,664.9 billion; and shilling billion was estimated for rollover of matured treasury bills and bonds. On expenditure side, a total of shilling 8,600.3 billion was allocated for recurrent expenditure and shilling 4,925.6 billion for development expenditure. 71
93 Revenue Collection Trend Domestic Revenue 91. During the period July 2011 March 2012, total domestic revenue including LGAs own source amounted to shilling 5,157.6 billion, equivalent to 99 percent of the estimate of shilling 5,217.2 billion during the period under review. Out of this, tax revenue amounted to shilling 4,765.5 billion, equivalent to 106 percent of the estimate of collecting shilling 4,505.6 billion; non tax revenue was shilling billion, being 57 percent of the estimate of collecting shilling billion; and shilling 120 billion was revenue from Local Government own sources, equivalent to 50 percent of the target during the period under consideration. 92. Improved performance in revenue collection was attributed to enhanced administrative measures taken by Tanzania Revenue Authority (TRA). Such measures include: ensuring effective use of Electronic Fiscal Device (EFD), which started in July 2010; Strengthening of the block management system; Establishment of tax payer service and payment centres in strategic areas like Kariakoo, Kimara, Temeke; and Improving the valuation system and strengthening tax audit on tax payer s accounts. 93. Non tax revenue collection was unsatisfactory due to various reasons including failure by parastatals and public institutions to contribute to the Consolidated Fund Services as directed because the laws establishing those institutions have categorically stated the use of profits earned. With regard to retention collected by Government departments, there is no harmonized tax collection system which could improve revenue collection and control tax evasion and embezzlement. Likewise, underperformance of LGA collections was due to delay in the commencement of the business license, among other reasons. Grants and Loans 94. Grants and foreign concessional loans continued to be critical source of Government budget for 2011/12. During the period of July March 2012, Government received programme grants and loans amounting to shilling 759 billion, equivalent to 106 percent of the estimate of shilling billion for the period. This was a result of increase in contribution from Norway and Canada which disabused more than the amount projected earlier. Despite these achievements, several challenges emerged under the General Budget Support (GBS) system including withdrawal by some Development Partners (DPs) in the GBS framework such as Switzerland and Netherland. The other challenge is late disbursement from some DPs contrary to the GBS agreement of disbursing the funds in the beginning of the fiscal year (front loading). In 72
94 addressing the challenges of late disbursement, the Government continued to dialogue with DPs and convince them to honour their commitments as per the JAST principles. 95. On the other hand, project grants and loans including basket funds amounted to shilling 1,269 billion, which is equivalent to 53 percent of budgeted amount of 2,327.2 billion. The shortfall was primarily caused by untimely disbursement of project loans and grants due to Euro zone debt crisis which weakened the ability of these countries to extend grants and loans. Domestic Loans 96. Given high demand for funds to finance development projects and the Government ability to service the loans, the Government has been borrowing from domestic sources to finance development projects and to pay for the rollover of matured Treasury bills and Bonds. During the period of July 2011 to March 2012, the Government borrowed shilling 883 billion. Out of that, shilling billion was for the rollover of matured bonds and shilling billion was used to finance development projects. Non concessional borrowing 97. In 2011/12, the Government envisaged to borrow USD 822 million, equivalent to shilling 1,271.6 billion as non concessional loan. During the period July March 2012, the Government signed a loan agreement for USD 310 with Standard bank and another loan agreement for Euro 61 million with HSBC Bank. Up to March 2012, a total of USD 229 million had been disbursed from Standard bank and part of it was spent on payment of road construction arrears for financial year 2010/11 and Euro 61 million was used to finance Nyakato Mwanza power generation plant which has a capacity of 60 Megawatts under the Export Credit Agency supported loan. In addition, Government signed a mandate letter of USD 350 million from Credit Suisse Bank and the preparation of the loan agreement is in final stages for signing of which USD 200 million is expected to be disbursed before the end of 2011/12 financial year. Discussions with United Kingdom Barclays Bank are at advanced stages to secure the remaining balance from this source. EXPENDITURE 98. In 2011/12, the Government continued to implement expenditure policies based upon availability of domestic revenues, grants together with domestic and external loans. In addition, the Government aimed at improving management and control of public resources, including control in salary payments, development project expenditures, agricultural inputs subsidies, public procurement and continue to control accumulation of arrears. During the period of July 2011 to March 2012, expenditure was aligned with 73
95 availability of resources. During that period, actual expenditure amounted to shilling 7,084.6 billion, equivalent to 80 percent of the estimated shilling 8,895.8 billion. Out of that amount, shilling 4,703.3 billion was recurrent expenditure, equivalent to 66.4 percent of the actual total expenditure during the period and shilling 2,381.2 billion was for development expenditure. 99. Payment for salary and wages for Government employees during July 2011 March, 2012 amounted to shilling 2,026.2 billion, equivalent to 96 percent of the estimated shilling 2,012 during the period under review. Out of that amount, a total of shilling billion was paid to central Government employees, shilling billion was for Regional Secretariats and shilling 1,301.3 billion was for councils, municipalities, cities and districts. In addition, the Government paid shilling billion as salaries to public institutions and parastatal workers during that period During the period of July 2011 to March 2012, expenditure on Other Charges for MDAs, Regions and LGAs amounted to shilling 1,366.3 billion, equivalent to 75 percent of the estimate of shilling 1,832.9 billion for the review period. Development expenditure amounted to shilling 2,381.2 billion, out of which shilling 1,118.4 billion was locally financed equivalent to 105 percent of the period estimate of shilling 1,060.7 billion. Foreign financed development expenditure was shilling 1,263.9 billion, equivalent to 53 percent compared to the estimate of shilling 2,372.9 billion. Public Debt Service 101. During the period July March 2012, public debt service was shilling 759 billion, equivalent to 68.7 percent of the estimate of shilling 1,104.5 billion for the period. External debt service during the period was shilling billion. Out of that, shilling 59.9 billion was for principal payment and shilling 61.5 billion was for interest payment. A big chunk of external debt service is interest payment since most of the loans contracted are new and long term in nature, thus principal payment is yet to mature. During the same period, domestic debt service amounted to billion. Out of that, shilling was for payment of matured government securities on rollover terms and shilling billion was for interest payment. Expenditure on other debt service obligations (CFS others) was shilling billion, equivalent to 73 percent of the estimate of shilling billion. Sectoral Allocation of Government Budget 102. In 2011/12, the Government continued to allocate resources to various sectors in line with the budget priorities. In 2011/12, a total of shilling 2,781.4 billion was allocated for roads, railways, ports and ICT backbone infrastructure compared to shilling 1,505.1 billion spent in 2010/11, equivalent 74
96 to increase of 85 percent. In addition, resources allocated for energy and mineral sector was shilling billion compared to shilling billion in 2010/11, equivalent to an increase of 65 percent During the financial year 2011/12, agriculture and irrigation sector was allocated shilling billion compared to shilling billion in 2010/11, equivalent to an increase of 2.5 percent. In addition, education sector was allocated shilling 2,283 billion compared to shilling 2,045.4 billion in 2010/11, equivalent to an increase of 12 percent. Water sector was allocated shilling billion compared to shilling billion in 2010/11, equivalent to increase of 56 percent, whereas health sector was allocated shilling 1,209.1 billion compared to shilling 1,205.9 in 2010/11, equivalent to an increase of 0.3 percent. National Debt 104. During the period ending December 2011, the national debt stock which comprise of public and private debt amounted to shilling 18,819.4 billion, equivalent to an increase of 12.6 percent compared to shilling 16,708.2 billion recorded during the corresponding period in Out of that amount, a total of shilling 15,928.8 billion was public debt and shilling 2,890.6 billion was private debt. The increase in debt stock was mainly due to increase in new contracted loans to finance development projects; accumulation of interest arrears on external debt for Non Paris Club creditors which have not concluded their debt rescheduling agreement; and depreciation of Tanzania shilling against the US Dollar. Domestic Debt Stock 105. As at end-december 2011, public domestic debt stock stood at shilling 4,641 billion compared to shilling 4,385.4 billion recorded in December 2010, equivalent to an increase of 5.8 percent. This was due to increasing Government need for loans to finance infrastructure projects and issuance of Treasury bills to mop up excess liquidity in the economy The analysis of domestic debt by holder category indicated that commercial banks were leading creditors, holding significant proportional of the total domestic debt. As at end - December 2011, commercial banks were holding 48.5 percent of the total domestic debt compared to 48.8 percent in the corresponding period in This was attributed by expansion of the banking sector and low investment risk in Government securities relative to the private sector. The Bank of Tanzania ranked second holding 26.9 percent, social security funds holds 23.5 percent and individuals and other entities were holding 1.2 percent. 75


97 Chart.4.1: Domestic Debt by Holder Category as at December, 2011 External Debt Stock 107. As at December 2011, external debt stock stood at USD 8,959.6 million compared to USD 8,363 million in December 2010, equivalent to an increase of 7.1 percent. Out of that, USD 7,133 million was public debt and USD 1,826.6 million was private debt. In addition, public external debt stock increased by 9.2 percent compared to USD 6,529.6 million as at end December The increase in debt stock was mainly due to increase in new contracted loans to finance development projects and accumulation of interest arrears on external debt for Non Paris Club creditors which have not concluded their debt rescheduling agreement;. External Debt Stock by Creditor Category 108. The analysis of external debt stock by creditor category showed that, major creditor are multilateral international organisations. As at end - December 2011, multilateral international organisations accounted for 67 percent of total external debt stock compared to 72 percent in 2010, bilateral creditors accounted for 25 percent, same as it was in 2010 and non concessional loans accounted for 8 percent. Government has determined to continue borrowing from non concessional sources and ensure that the loans particularly from non concessional sources are used to finance development projects. 76


98 Chart No.4.2: External Debt Stock by Creditor Category December
99 TRENDS IN GOVERNMENT FINANCE Table No. 25 Sh. milioni 2006/ / / / / / / / /12 Actual to Likely Outturn Actual Actual Actual Actual Actual Actual Budgeted March June A. DOMESTIC REVENUE (incl. Revenues from LGAs) A. DOMESTIC REVENUE Tax Revenue Import Duty and Excise Duty Value Added Tax (VAT) Imports Domestic Income Tax Other Taxes Refunds Accounts Non-Tax Revenue Revenues from LGAs B. TOTAL EXPENDITURE Recurrent Expenditure Development Expenditure Local Funds Foreign Funds C. DEFICIT/SURPLUS (A-B) D. FINANCING External Sources Grants Basket support Import Support/OGL Loans Project Loans Concensional loans Amortization (foregn) Internal Sources Non-Bank Borrowing Bank Borrowing Payment of arrears Proceeds from privatisation Adjustment to Cash Amortization (local) Expenditure float Source: Ministry of Finance 78
100 79
101 Table No. 26 CLASSIFICATION OF CENTRAL GOVERNMENT EXPENDITURE BY PURPOSE Shs. mill 2008/ / /11* 2011/12* Recurrent Development Total Exp. Recurrent Development Total Exp. Recurrent Development Total Exp. Recurrent Development Total Exp. 1.0 GENERAL PUBLIC SERVICES Executive and legislative organs, financial and fiscal affairs external affairs other than foreign aid 1,811, , ,695, , ,311, , ,872, , Foreign economic aid 10, , , ,500 39, Fundamental research affairs and services 19,727 5, ,751 14, ,934 42, ,623 79, General services 141,296 70, ,031 79, ,065 85, ,622 6, General public services n.e.c. 3,448 7, ,098 10, ,955 9, ,235 19, DEFENCE AFFAIRS AND SERVICES ,446 8,959 3,743, ,082 33, , ,355 31, , ,260 19, ,260 Military and civil defence administration and operation 2.2 Foreign military aid , , , , Defence-related applied research and experimental development ,920 47, ,494 7, Defence affairs n.e.c. 43, ,787 21, , PUBLIC ORDER AND SAFETY Police and fire protection 140,819 14,878 1,346, ,538 25, , ,770 17, , ,048 4, , Law courts 49,298 8, ,046 52,882 18,433 71,315 67,379 7,661 75,040 88,710 1,000 89, Prison administration and operation 10, ,064 8, ,402 6, ,552 7,359 26,809 34, Public order and safety n.e.c. 25,927 11, ,065 44,289 19,353 63,642 54,988 28,809 83,796 77,350 5,263 82, EDUCATION AFFAIRS AND SERVICES Pre-primary & primary education affairs & services 6,027 7, ,271 6,977 3,889 10,866 2,839 3,115 5,955 1,355 12,400 13, Secondary education affairs and services 145,276 26,879 1,138,879 2, ,856 1,732 14,680 16,412 1, , , Tertiary education affairs and services 302,705 45,570 2,968, , , , , , , , , Education services not definable by level 0 17,213 66, ,300 5,246 3,315 2,295 5,610 2,260 1,192 3, Subsidiary services to education ,294 10, Education affairs and services n.e.c. 46,908 8, ,245 57,779 13,450 71,230 60,715 12,073 72,789 77, , , HEALTH AFFAIRS AND SERVICES Hospitals affairs and services 34, ,037 1,291,535 36, , ,667 35, , ,472 31, , , Clinics, and medical, dental and paramedical practitioners 179,284 40,939 2,079, ,027 64, , ,311 84, , , ,435 Public health affairs and services , Medicaments, protheses, medical equipment and appliances or other prescribed health-related products 3, ,978 5, ,398 8, ,878 7,898 1,199 9, Applied research and experimental development related to health and medical delivery system health affairs and services n.e.c , ,995 3, , SOCIAL SECURITY AND WELFARE AFFAIRS AND SERVICES Social security affairs and services Welfare affairs and services Social security and welfare affairs n.e.c. 1, ,616 1, ,390 1, , ,337 4,928 64,940 7, ,473 95,620 12, ,285 91,771 5,663 97, ,901 3, ,953 3, ,727 1, ,325 1,460 2,855 4, ,109 4,083 HOUSING AND COMMUNITY AMENITY AFFAIRS AND 7.0 SERVICES Housing and community development 5, ,945 8, ,750 8, ,101 10, , , Water supply affairs and services 7, ,988 1,875,636 8, , ,652 8, , ,278 9, , Sanitary affairs and services including pollution abatement and control 6,367 2, ,600 7,345 9,365 16,711 4,446 18,872 23,318 6,470 18,301 24, Street lightning affairs and services , ,693 2, , Housing and community amenity affairs and services n.e.c. 1, ,234 1, , RECREATIONAL, CULTURAL & RELIGIOUS AFFAIRS & SERVICES Recreational, cultural and religious affairs and services This table continues on the next page 9,715 7,926 17,641 13,434 8,939 22,373 26,413 9,218 35,631 28, , ,432 80
102 ...Table No. 26 (continues) 2008/09* 2009/10* 2010/11* 2011/12* Recurrent Development Total Exp. Recurrent Development Total Exp. Recurrent Development Total Exp. Recurrent Development Total Exp. 9.0 FUEL AND ENERGY AFFAIRS AND SERVICES Fuel affairs and services 33, , ,948 32, , ,348 36, , ,188 39, , , Electricity and other energy sources Fuel and energy affairs and services n.e.c AGRICULTURE, FORESTRY, FISHING AND HUNTING AFFAIRS AND SERVICES Agriculture affairs and services 127,232 55, , , , , , , , , , Forestry affairs and services 11,681 6,481 18,163 14,754 12,399 27,153 16,420 5,473 21,893 14,263 4,970 19, Fishing and Hunting affairs and services 17,116 8,648 25,764 19,888 17,999 37,887 20,764 13,309 34,073 24,991 9,206 34, Agricultural research and experimental development n.e.c. 14,700 9,751 24,450 14,621 13,133 27,754 12,926 11,321 24,247 18, , Agriculture, forestry, fishing and hunting affairs and services n.e.c. 6, ,535 6, , , ,033 17, MINING, MINERAL,MANUFACTURING AND CONSTRUCTION AFFAIRS AND SERVICES Mining and mineral resources affairs and services, other than fuel 5,544 1,537 7,081 13,590 16,095 29,685 21,121 15,580 36,701 24, , Manufacturing affairs and services ,200 1, , Construction affairs and services 1,715 1,800 3,514 4,540 3,000 7,540 5,653 3,000 8,653 6, , Mining, mineral,manufacturing & construction affairs & services n.e.c TRANSPORTATION AND COMMUNICATION AFFAIRS AND SERVICES Road transport affairs and services 166, , , , ,021 3,122 1,200 4, Water transport affairs and services Railway affairs and services Air transport affairs and services ,376,888 1,377, Pipeline transport and other transport affairs and services Transportation system affairs and services n.e.c. 40,914 3,850 44, , , , , ,967 1,135, ,889 3, , Communication affairs and services 11,561 3,580 15,141 14,234 2,100 16,334 11,729 5,917 17,646 11,741 12,270 24, Transportation and communication affairs and services n.e.c. 1, ,295 8,051 25,968 34,019 8,086 10,413 18,499 8,768 5,891 14, OTHER ECONOMIC AFFAIRS AND SERVICES Distribution trade affairs and services including storage 13.1 and warehouse; hotel and restaurant affairs and services 6,211 3,077 9,288 9,520 4,867 14,387 9,795 7,470 17,264 9, , Tourism affairs and services 6,074 1,753 7,827 6,127 4,444 10,571 11, ,583 10, , , Multipurpose development project affairs and services 194, , , , , ,605 52, , ,439 78,956 1,401 80, General economic & commercial affairs other than general labour affairs 9,338 13,337 22,675 10,837 2,275 13,112 12,180 2,523 14,703 11, , General labour affairs and services 3,048 2,934 5,981 4,693 5,010 9,704 4, ,765 7, , Other economic affairs and services n.e.c. 5,461 52,484 57,945 9, , ,067 8, , ,285 8, , , OTHERS Public Debt 693, ,748 1,528, ,528,094 1,783, ,783,211 1,938,483 6,859 1,945, Financial and Capital Subscription 94,218 4,211 98,429 84,483 12,051 96,534 45,805 10,265 56,070 45, , Pension and Gratuities ,916 13, GRAND TOTAL 4,817,137 1,704,934 45,508,092 2,368,047 1,357,396 3,725,443 7,813,631 3,823,755 11,637,386 8,619,311 4,945,359 13,544,770 Source: National Bureau of Statistics * Estimates 81
103 CHAPTER 5 MONEY AND FINANCIAL INSTITUTIONS Money Supply and Domestic Credit 109. In 2010/11, narrow money supply (M1) increased to shs. 4,927.1 billion from shs. 4,134.7 billion in 2009/10, equivalent to an increase of 19.2 percent. The broad money supply (M2) increased by 19.4 percent from shs. 7,287.5 billion in 2009/10 to shs. 8,698.7 billion in 2010/11. Similarly, extended broad money supply (M3) increased to shs. 11,957.9 billion from shs. 9,801.4 billion in 2009/10, equivalent to 22.0 percent increase. Generally, the 2010/11 growth of money supply was lower compared to the growth in the year 2009/ By December 2011, the broad money supply (M2) grew by 15.0 percent, being lower than the targeted growth of 21.3 percent and 21.8 which was recorded in December Likewise, extended broad money supply (M3) grew by 18.2 percent in December 2011 compared with growth of 25.4 percent of similar period in 2010 and the target of 20.7 percent. The slowdown in the growth of money supply was a result of a decrease in the growth of Net Foreign Assets of commercial banks as compared to an increase in the growth of credit to the private sector. During the period under review, Net Foreign Assets grew by 3.5 percent only as compared with the growth of 23.2 percent in December 2010, largely due to increase in demand of foreign currency for imports of goods and services Domestic credit increased by 37.4 percent from shs. 6,164.7 billion in 2009/10 to shs. 8,470.5 billion in 2010/11. In addition, by December 2011, domestic credit increased to shs. 9,053.9 billion compared to shs. 6,790.4 billion of the same period in 2010, equivalent to an increase of 33.3 percent. Trends in Credit to Private Sector 112. In the year ended December 2011, the pace of credit growth to the private sector increased by 27.6 compared to 20.0 percent of similar period in This increament was attributed to decline in growth of net foreign assets of commercial banks and decrease in government borrowing following strong domestic revenue collection Large part of private sector credit was directed to personal loans which had an average of 21.1 percent of total credit created to the private sector. Other economic activities benefited from these credits include business (20.6 percent), manufacturing (12.8 percent) and agricultural activities (12.6 percent). 82
104 114. In 2011, value of Government securities issued declined from shs. 3,124.3 billion in 2010 to shs. 2,268.7 billion, equivalent to a decline of 27.4 percent. Moreover, the Government issued treasury bonds with the value of shs billion compared with shs. 714 billion issued in 2010, equivalent to a decrease of 13.4 percent. Deposits in Commercial Banks 115. In 2011, deposits in commercial banks increased by 16.3 percent to shs. 11,342.4 billion from shs. 9,748.7 billion in Out of those, private sector contributed shs. 10,715.8 billion equivalent to 94.5 percent of total deposits, and the Government contributed 5.5 percent of the remaining deposits. This increament was due to improved security services on money deposits in banks following the effective management of the Bank of Tanzania as well as efforts taken by banks in providing various service incentives to customers. Initiatives taken by commercial banks includes: increasing number of branches in various areas in the country, introduction of sim-banking services and automatic teller machines (ATM). Moreover, the ratio of foreign currency deposits to total deposits increased to 32.8 percent in 2011 from 30.0 percent in 2010 largely due to strengthening of US Dollar against other currencies including Tanzania Shillings. Trends in Interest Rates 116. In 2011, interest rates trend on deposits and lending significantly improved as compared to trend in 2010 due to increased competition among financial institutions. The average deposits rate up to one year increased to 9.14 percent in December 2011 from 7.10 percent in December However, the average lending rate up to one year decreased from percent in December 2010 to percent in December Therefore, the interest rates spread between deposits and lending up to one year narrowed from 7.26 percent in December 2010 to 4.59 percent in December During the period under review, interest rate on Government securities increased to an average of 18.2 compared to 6.32 percent in December Financial Sector Reforms 117. In 2011, the Government continued to implement Financial Sector Reforms Program to ensure its effective contribution in economic activities and GDP growth. Regulations relating to Finance Leasing and Mortgage Finance were published in the Government Gazette on 29 th April Additionally, the Government through Tanzania Mortgage Refinancing Company (TMRC) started implementation of housing finance project in January Similarly, housing sector market study started in September 83
105 2011, while utilization of the funds for the Development of the Mortgage by refinancing of mortgage loans started in November In 2011, the Government continued with the process of establishing the Credit Rerefence Bureau and the Credit Reference Databank. A contract was signed in October 2011 and the consultant has started to work on installation of related hardware and software, commissioning and training of users of the databank. Furthermore, the process of setting up a credit reference database commenced in January This includes reviewing existing credit reference system regulations, and a pilot project for collecting data from banking institutions. The establishment of credit reference bureau will allow banks to monitor credit history of potential borrowers, which is major obstacle in expanding access to financial services in the country In 2011, the study report on the establishment of Tanzania Agricultural Development Bank (TADB) was finalized and recommendations were approved by the Government in January Process of establishing TADB is ongoing as agreed under the special Task Force which was formed to coordinate the implementation. The bank is expected to be operationalized in December Parastatal Pension Fund (PPF) 120. The number of members contributing to the Parastatal Pension Fund increased to 180,049 in 2011 from 160,068 members in 2010, equivalent to an increase of 12.5 percent. Similarly, members contributions including fines increased to shs. 188 billion from shs billion in 2010, equivalent to an increase of 27.3 percent. During the period under review, benefits paid to retired members worth shs billion compared to shs billion which were paid in 2010, equivalent to 12.7 percent increase. This was a result of; increased number of retired members, the lump sum payments to retired employees of various organizations, and increased number of job terminating employees due to institutional reforms or closure. By December 2011, the value of the Parastatal Pension Fund increased to shs billion compared with shs billion of the similar period in 2010, equivalent to an increase of 24.0 percent In 2011, the Parastatal Pension Fund continued to invest in various investments including fixed deposits, securities, equities and real estates. By December 2011, total value of Fund investments was shs billion compared to shs billion in 2010, equivalent to an increase of 23.4 percent. Table No. 5.1 depict the areas of investments. Similarly, income from investment increased from shs billion in 2010 to shs billion in 84
106 2011, equivalent to an increase of percent. This was due to increase in the value of corporate shares (equities) in the capital market. Table No. 5.1: Investment Areas (Tshs. Billion) Area of Investments 2010 (Dec) 2011 (Dec) (%) Change Fixed Deposits and Securities Equities Real Estates Licensed Collective Schemes Total Source: Parastatal Pension Fund Public Services Pension Fund (PSPF) 122. In 2010/11, Public Services Pension Fund conducted registration exercise for members who were not registered by the Fund in Shinyanga, Mbeya, Rukwa, Iringa, Tabora, Mtwara, Ruvuma, Lindi, Kagera, Mara, Manyara, Arusha and Mwanza regions. From this exercise, a total of 21,398 members were registered, equivalent to 58.2 percent of the 36,798 targeted members. This makes a total of 198,823 members registered by the Fund by June Additionally, members contributions were shs. 392, million in 2010/ In 2010/11, the Fund paid benefits worth shs. 282,006.3 million compared to benefits worth shs. 145,298.9 million which were paid in 2009/10, equivalent to an increase of 94.1 percent. The increament was due to increased number of voluntary retired employees, those who absconding their jobs from various reasons including political reasons. Similarly, the value of the Fund increased by 22.6 percent to shs billion in June 2011 from shs billion in June In 2010/11, Public Services Pension Funds continued to invest on various portfolios such as bonds, equities, fixed deposits, loans, real estate, Government securities and special Government projects. A total value of Fund s investment in 2010/11 was shs. 568, million. Out of those, shs. 387, million (Equivalent to 68.2 percent of total investment) were invested in fixed deposits followed by investment in real estate, which was shs. 98, million (17.4 percent). Further, by June 2011, income from investments was shs. 59, million compared with shs. 41,094.2 million 2009/10, equivalent to an increase of 45.3 percent. The increament was 85
107 attributed to increased guarantee of the Fund in financing Government projects. National Social Security Fund (NSSF) 125. In 2010/11, National Social Security Fund had a total of 521,629 members compared to 506,218 members in 2009/10, equivalent to an increase of 3.04 percent. In addition, the Fund collected contributions from members worth shs. 394, million in 2010/11 compared to shs. 295, million collected in 2009/10, equivalent to an increase of percent. The increament was attributed to the registration of 98,894 new members, and the fact that 1,995 new registered employers adhered to regular payment of their member s contributions to the Fund Benefits paid to members amounted shs. 136, million in 2010/11 as compared to shs. 110, million in 2009/10, equivalent to an increase of percent. Moreover, number of members benefited from the Fund increased to 222,776 in 2010/11 from 138,999 members in 2009/10, equivalent to an increase of percent. The increase in the number of benefited members was highly attributed to beneficiaries from the Social Health Insurance Benefit who were 163,944, equivalent to percent of total beneficiaries in the year 2010/ In 2010/11, the value of investment increased to shs. 1,216, million as compared to shs. 1,029, million in 2009/10, equivalent to an increase of percent. The value of investments in Government securities increased to shs. 271, million in 2010/11 from shs. 185,316.8 million in 2009/10, equivalent to an increase of percent. Likewise, investments income of the Fund was shs. 94, million in 2010/11 from shs. 92, million in 2009/10, equivalent to an increase of 2.40 percent. The increase in investments value was attributed to the increase in various activities in capital investments such as real estate, long term loans, fixed deposits and Government securities The value of Fund s total net assets for benefits increased by shs. 224, million from shs. 1,129, million in 2009/10 to 1,353, million in 2010/11, equivalent to an increase of percent. Government Employees Provident Fund (GEPF) 129. In 2010/11, number of members of Government Employees Provident Fund increased to 41,879 from 35,279 members in 2009/10, equivalent to an increase of The increase was a result of registration of many new members from informal sector. Similarly, members contribution increased to shs. 25,688.9 million in 2010/11 from shs. 16,321.5 million in 2009/10, 86
108 equivalent to a 57.4 percent increase. The increase in contribution was a result of increase in membership and the introduction of various collection means including the use of electronic transfers (the use of mobile phones). During the period under review, benefits paid to members increased by 10.6 percent reaching shs. 3,675.5 million compared to shs. 3,323.6 million which were paid in 2009/ In 2010/11, value of investments made by the Fund increased by 24.0 percent to shs. 101,272.5 million compared to shs. 81,673.5 million invested in 2009/10. Moreover, in 2010/11, realized income from investments was shs. 9,809.3 million compared to shs. 7,693.6 million earned in 2009/10, equivalent to an increase of 27.5 percent. This was the outcome of prudent investment decision of considering investments with high returns but careful selected to minimize risks involved The value of net asset of the Fund increased from shs. 91,282.3 million in 2009/10 to shs. 119,404.4 million in 2010/11, equivalent to an increase of 30.8 percent. In addition, the value of total assets of the Fund increased by 31.0 percent from shs. 91,487.5 million in 2009/10 to shs. 119,829.0 million in 2010/11. National Health Insurance Fund (NHIF) 132. In 2010/11, number of members contributing to the National Health Insurance Fund increased to 468,611 from 373,326 members in 2009/10, equivalent to an increase of 25.5 percent. The increase was due to amendment made to the National Health Insurance Fund Act (1999) to include other groups in need of health insurance services but they were not working in formal settings in accordance with the Act which established the Fund. In addition, members contributions increased from shs. 90, million in 2009/10 to shs. 134, million in 2010/11, equivalent to an increase of 49.7 percent. This was due to the increase of recruited new members and salary adjustment made by the Government on annual basis By June, 2011, the Fund accredited a total of 5,673 health facilities as compared to 5,576 health facilities accredited in similar period in 2010, equivalent to an increase of 1.7 percent. Out of the accredited health facilities, 4,661 facilities equivalent to 82.2 percent were Government owned facilities, 655 (11.5 percent) were faith based owned facilities, 26 (0.5 percent) were private owned facilities and 331 (5.8 percent) were pharmacies and Accredited Drugs Dispensing Outlets ( ADDO s). 87
109 134. In 2010/11, the Fund continued to offer various benefits payments to its members through accredited health facilities including Governmet, Private and Faith Based. By June 2011, the Fund paid a total of shs. 44, million, equivalent to 96.2 percent of shs. 46, million of the amount claimed, compared to paid benefits worth shs. 25, million equivalent to 90.4 percent of claimed amount of shs. 27, million in 2009/10. However, benefits payment of 2010/11 increased by 76.3 percent due to the advocacy program which made members to be aware on the use of their identity cards, increase in number of accredited health facilities, improvement of health services, increase in health seeking behaviour for proper treatment In 2010/11, the Fund continued to invest in treasury bills, treasury bonds, fixed deposits, Government projects and equities. During that period, investment income increased to shs. 25, million from shs. 17, million in 2009/10, equivalent to an increase of 46.4 percent. The increase resulted from Funds efforts to utilize fully investment opportunities that emerged during the period under review. Local Authorities Pensions Fund (LAPF) 136. In 2010/11, number of members of the Local Authorities Pension Fund increased by 9.1 percent to 80,529 members compared to 73,833 members in 2009/10. Similarly, collection from members was shs billion in 2010/11 compared to shs billion in 2009/10, equivalent to an increase of 48.4 percent. In addition, benefits paid to members in 2010/11 amounted shs billion compared to shs billion in 2009/10, equivalent to an increase of 17.8 percent Total value of investment increased from shs billion in 2009/10 to shs billion in 2010/11, equivalent to an increase of 31.9 percent. Moreover, value of investments in Government securities increased from shs billion in 2009/10 to shs billion in 2010/11, equivalent to an increase of 9.0 percent In 2010/11, income from Funds investment increased by 9.2 percent to shs billion from shs billion in 2009/10. This was a result of increased investments in equities, corporate bonds, real estate, long term loans and Government securities. Further, the value of net assets of the Fund was shs billion in 2010/11 compared to shs billion in 2009/10, equivalent to an increase of 24.4 percent. Tanzania Insurance Regulatory Authority (TIRA) 139. In 2011, one new company was registered to provide insurance services in the country, this adds to a total of 26 registered insurance 88
110 companies. The services provided by insurance companies are as follows: 21 companies were registered to provide general insurance services only; 2 companies were registered to provide life insurance services only; and 3 companies provided both general and life insurance services. In addition, insurance business earnings in 2011 grew by 19.2 percent to shs billion compared to shs billion earned in While general insurance services contributed 89.2 percent of total market earnings, life insurance contributed the remaining 10.8 percent. Earnings from general insurance services grew by 19.4 percent reaching shs billion in 2011 compared to shs billion in Similarly, life insurance business grew by 18.0 percent to shs billion compared to shs billion in This was due to the increase in general insurance companies providers, improved community awareness on insurance benefits and the strengthening of life insurance market By December 2011, general insurance companies recorded underwriting loss of shs. 9.2 billion compared to underwriting loss of shs. 2.0 billion recorded in These losses were due to increased payments of high valued claims and a rise in operational costs. Total assets value of insurance companies in 2011 increased to shs billion compared to shs billion in 2010, equivalent to an increase of 18.3 percent. Similarly, liabilities of all insurance companies increased to shs billion in 2011 compared to shs billion in 2010, equivalent to an increase of 18.2 percent. Table No. 5.2: Assets Value and Liabilities of Insurance Companies (Million Shs.) Total Assets 212, , , , ,643 Growth (%) Total Liabilities 133, , , , ,845 Growth (%) Balance 79,377 87, , , ,798 Growth (%) Source: Tanzania Insurance Regulatory Authority Dar es Salaam Stock Exchange (DSE) 141. The number of listed companies at Dar es Salaam Stock Exchange increased from 15 companies in 2010 to 18 companies in New listed companies in the year 2011 were National Media Group, African Barrick Gold and Precision Air. Moreover, number of investors increased from 174,013 in 89
111 2010 to 180,882 investors in 2011, equivalent to an increase of 3.9 percent. Likewise, value of all shares listed at Dar es Salaam Stock Exchange was shs. 11,577.1 billion in 2011 compared to shs. 4,895.5 billion in 2010, equivalent to an increase of 136 percent. This was due to the increased number of listed companies and increased number of investors The Dar es Salaam Stock Exchange market traded shares worth shs billion in 2011 compared to shares worth shs billion traded in 2010, equivalent to an increase of 42.7 percent. In addition, the stock market price index increased from 1, in 2010 to 1, in 2011, equivalent to an increase of 12.0 percent In 2011, value of listed Government bonds decreased by 61.9 percent to shs billion compared to shs. 1,615.8 billion which were listed in The decrease was resulted from a drop of bonds market in the second half of year However, the value of traded treasury bonds increased to shs billion in 2011 from shs billion in 2010, equivalent to an increase of percent. This resulted from increased awareness and public education provision regarding capital markets, securities and investments. Table No. 5.3: Dar es Salaam Stock Exchange Market Performance in 2011 Market Criteria (%) Change Total Shares offered in the 6,981,012,16 7,742,072, % Market 0 1 Value of all traded Shares 35,986 50, % (Million Shs.) Value of all listed Shares 4,895 11, % (Million Shs.) Number of traded shares 190,387, ,403, % Number of deals 11,336 12, % All Share Index 1,164 1, % Tanzanians holding CDS account Foreigners holding CDS account Source: Dar es Salaam Stock Exchange 173, , % % Tanzania Postal Bank (TPB) 144. In 2011, customers deposits increased to shs. 120,485 million from 107,327 million in 2010, equivalent to an increase of 12.3 percent. The increase in deposits was due to the expansion of services provision to customers particularly the use of Umoja Switch ATMs. Along with increase in 90
112 deposits, the number of new customers joined the Bank increased from 582,772 customers in 2010 to 612,005 customers by the end of December 2011, equivalent to an increase of 5.0 percent In 2011, Tanzania Postal Bank continued to invest its resources on Government securities, other banks and private companies securities. By December 2011, value of total investments increased to shs. 121,002 million from shs. 112,758 million in 2010, which is 7.3 percent increase. Table No. 5.4: Value of all Investments (Million Shs.) Type of Investment Other banks deposits December December (%) Change 3,348 4, Government securities 16,876 16, Stocks & Government Stocks 26,036 33, Private bonds 1,373 1, All loans 64,635 65, TPC Excess Deposits Total 112, , Source: Tanzania Postal Bank 146. In 2011, investments in loans increased to shs. 65,004 million from shs. 64,635 million in 2010, equivalent to an increase of 0.6 percent. A small increase in the creation of bank loans was accounted by lack of sufficient capital and the consideration of Risk weighted Assets to Core Capital criteria of the Bank of Tanzania. The distribution of loans types are indicated in Table No.5.5. Table No.5.5: Loans Distribution at Tanzania Postal Bank (Miln Shs.) Loan Type (%) Change Business Loans 4,245 4, Consumer Loans 58,537 58, Micro Loans 1,598 1, Government Empowerment Loans Total 64,635 65, Source: Tanzania Postal Bank 91
113 147. Income of the Bank in 2011 increased to shs. 23,849 million compared to shs. 20,122 million earned in 2010, equivalent to an increase of 18.5 percent. Following the increase in income, the Bank realized a profit of shs. 2,267 million after tax deduction compared to shs. 465 million in This was due to increased loans, increased interest and controlled spending on some Bank s activities. In addition, following its contract to work on behalf of the Tanzania Revenue Authority, the Bank realized income from local taxes collection. 92
114 Table No. 27 MONETARY SURVEY: TANZANIA MAINLAND Shs. Billion For the period ended December Change Amount % Base Money (M0)* % Narrow Money (M1) % Time and Saving Deposits % Broad Money (M2) % Foreign Currency Deposits % Extended Broad Money (M3) % Net Foreign Assets % Net Domestic Assets % Net Domestic Credit % Net Claims on Government % Lending to Non-Govt. Sectors % Other Items Net % Source: Bank of Tanzania * Currency in Circulation Outside Banks 93
115 Table No. 28 GROWTH OF MONEY SUPPLY AND DOMESTIC CREDIT - TANZANIA MAINLAND For the period ended December Base Money (M0)* 23.2% 28.1% 16.2% 12.4% 23.8% 8.9% 21.1% 17.9% Narrow Money (M1) 22.7% 31.8% 12.0% 29.1% 21.9% 13.7% 25.9% 23.2% Time and Saving Deposits 15.3% 37.2% 23.8% 24.6% 28.1% 30.4% 16.9% 4.4% Broad Money (M2) 19.8% 33.9% 16.7% 27.2% 24.4% 20.8% 21.8% 15.0% Foreign Currency Deposits 1.1% 36.9% 32.5% 7.0% 8.8% 9.4% 36.5% 27.0% Extended Broad Money (M3) 13.5% 34.8% 21.5% 20.5% 19.8% 17.7% 25.4% 18.2% Net Foreign Assets 8.5% 6.7% 35.7% 0.7% 12.2% 20.9% 23.2% 3.5% Net Domestic Assets Net Domestic Credit 32.6% 64.2% 18.3% 42.2% 14.1% 11.4% 16.3% 12.3% Net Claims on Government 24.1% 47.7% 23.4% 31.7% 24.6% 16.3% 21.2% 15.1% Lending to Non-Govt. Sectors 14.3% 77.7% 7.5% 25.7% -3.2% 30.4% 23.2% -5.5% Other Items Net 32.3% 26.0% 39.6% 36.4% 44.6% 9.6% 20.0% 27.2% Source: Bank of Tanzania * Currency in Circulation Outside Banks 94
116 Jedwali Na.29 TREND OF EXCHANGE RATES OF THE TANZANIA SHILLING AGAINST THE US DOLLAR Shs/US Dollar, End of the Year , , , , , , , , , Change in exchange rate (%) Shs/Dollar, Average for the Year , , , , , , , , , The weighted average exchange rate (%) Source: Bank of Tanzania 95
117 COMMERCIAL BANKS LENDING BY ECONOMIC ACTIVITIES Table No. 30 Type of Activity For the Period ended December (Shs. Million) Growth Shares (%) (%) Agricultural Production Financial intermediaries Mining and Quarrying Manufacturing Buildings and Construction Transport and Communication Trade Tourism Hotels and Restaurants Electricity Personal Other Services Total Source: Bank of Tanzania 96
118 TRENDS OF COMMERCIAL BANKS DEPOSITS Table No.31 Shs. Billion For the Period Ended December Change /11 ( %) Private Deposits Demand Deposits/Transferable deposits , , , , , Saving and Time Deposits , , , , , , , Foreign Currency Deposits , , , , , , , Total 1, , , , , , , , , , , Government Deposits Total of Deposits 1, , , , , , , , , , , Source: Bank of Tanzania Table No. 32 Type AVERAGE NOMINAL INTEREST RATE Percent For the Period Ended December Bank rate Deposit Rates Saving Deposits Fixed Deposits Lending Rates Short term ( Up to 1 year) Long and Medium Term Tresury Bills Rate 91 Days Days Days Source: Bank of Tanzania 97
119 Population and Development CHAPTER 6 HUMAN RESOURCES 148. In 2011, the Government continued with preparation of Population and Housing Census of 2012, which will take place on 26 th August This exercise is under the coordination of National Bureau of Statistics. So far, the following arrangements have been made: enumeration areas was earmarked whereas up to March 2012, the excercise in 27 regions out of 30 was completed; preparation of questionnaires and guidelines aiming at gathering important information like demography, disability, education, deaths, state of residence and ownership of resources, economic activities, emigration and immigration; pilot census which was conducted in October 2011 in 44 enumeration areas with the aim of examining if questionnaires were well understood to public in order to identify shortcomings to be addressed prior to the Census day; and ongoing public sensitization through seminar, workshops, forums, various publications and media In 2011, the population of Tanzania was estimated at 44,484,857 compared to 43,187,823 in Out of those, 22,570,628 were female, equivalent to 50.7 percent, while 21,914,229 were male, equivalent to 49.3 percent. Tanzania mainland had an estimated population of 43,169,305, equivalent to 97.0 percent while Tanzania Zanzibar had an estimated population of 1,315,552 equivalent to 3.0 percent of the total population. Population distribution showed that 32,609,462 people, equivalent to 73.3 percent of the total population live in rural areas, while 11,875,395 people equivalent to 26.7 percent of the total population live in urban areas. These estimates are based on the population growth projections established during the Population and Housing Census of In 2011, the population classification according to age indicate that population aged below five years were 7,974,308 equivalent to 17.9 percent of the total populaation. Among them, boys were 4,020,794 and girls were 3,953,514. Population aged between 5 and 14 years were 11,768,537, eqiuvalent to 26.5 percent of the total population. Among them, boys were estimated at 5,905,655 and girls were 5,862,882. In addition, population of 19,742,845 equilalent to 44.4 percent of the total population were estimated to be aged below 15 years. Among them, boys were estimated at 9,926,449 and girls were 9,816,396. Population aged years was estimated at 8,843,197, equivalent to 19.9 percent of the total population. Among them, 4,408,579 were female and 4,434,618 were male. Population aged years was estimated at 14,539,109, equivalent to 32.7 percent of the total population. 98


120 The population aged between years, which constitute the active labour force population, was estimated at 23,382,306, equivalent to 52.6 of the total population. Among them, 12,036,168 were females and 11,346,138 were males. Population aged 65 years and above were 1,359,706, equivalent to 3.1 percent of the total population. Among them, 718,064 were female and 641,642 were males. Table 6.1: Population Distribution by Age Group Source: Ministry of Finance 151. According to 2011 population estimates, population density was 50 people per square kilometre. Population density in Tanzania Mainland and Tanzania Zanzibar was 49 people and 535 people per square kilometre, respectively. The population density region-wise, showed that Dar es Salaam has highest population which was estimated at 2,294 people per square kilometre, followed by Mwanza with 186, Kilimanjaro with 126, and Mara with 87 people per square kilometre. The region with lowest population density was Lindi with an estimate of 14 people per square kilometre followed by Ruvuma with 22 people and Rukwa with 23 people per square kilometre. In Tanzania Zanzibar, the region with the highest population density was Mjini Magharibi, with population density estimated at 2,152 per square kilometre where as Kusini Unguja region had estimated population density of 135 people per square kilometre The regional population distribution shows that Shinyanga continued to have higher population. In 2011, Shinyanga region had estimated population of 3,998,664 equivalent to 9.3 percent of Tanzania mainland; followed by Mwanza 3,669,380 (8.5 percent) and Dar es Salaam 3,194,903 99
121 (7.4 percent). The higher population in Shinyanga was largely contributed by high fertility rate which was estimated to 7.4 children per woman. Lindi region had the lowest population with an estimate of 941,885 people, equivalent to 2.2 percent of Tanzania Mainland population. In Tanzania Zanzibar, the region with highest population was Mjini Magharibi (495,054) while the region with lowest population was Kusini Unguja (115,035). The lowest population in Lindi and Kusini Unguja regions was due to low fertility rate, migration to other regions with more economic opportunities and social services. Labour Force and Employment 153. According to the Integrated Labour Force Survey (ILFS) of 2006, active labour force was estimated at 18.8 million, out of that 9.0 million were males and 9.7 million were females. In addition, the Survey reveals that 16.6 million people were employed and 2.2 million were not employed. Further, the survey showed that 8.5 million females and 8.0 million males were employed while 967,847 male and 1,226,545 female were not employed. Furthermore, the survey underlined the agriculture sector to be the leading source of employment in the country Integrated Labour Force Survey of 2006 which provides statistics on employment status in the country is the only recent survey to be conducted. The survey is supposed to be conducted after every five years depending on the availability of funds. However, according to the projected estimates of Population and Housing Census of 2002, active labour force population (15 64 years) in 2011 was projected at 23,382,306, equivalent to 52.6 of the total population In 2011, Tanzania Employment Services Agency (TaESA) provided employment services to 2,619 customers. Among them, males were 1,841, equivalent to 70.3 percent and females were 778, equivalent to 29.7 percent. Moreover, the Agency continued to provide various services to job seekers by giving them entrepreneurial skills to improve their employability. Further, TaESA issued the guideline which describes various techniques of securing jobs and advice on issues relating to employment services In 2011, TaESA approached various employers from which a total 543 job openings and 819 job opportunities were obtained. In addition, the Agency conducted preparation sessions to jobseekers on various techniques of securing jobs, how to succeed in interviews, labour market information and advice on issues relating to employment services. 100
122 REGIONAL DISTRIBUTION OF TANZANIA POPULATION ( ) Table No. 33 Region * ** Dodoma 1,786,073 1,896,786 1,951,071 2,004,544 2,058,630 2,111,764 2,163,817 Arusha 1,427,904 1,475,489 1,522,975 1,570,394 1,617,728 1,664,780 1,711,624 Kilimanjaro 1,435,847 1,503,014 1,535,975 1,569,212 1,602,530 1,635,870 1,669,174 Tanga 1,716,271 1,753,284 1,837,661 1,880,389 1,923,468 1,966,908 2,010,480 Morogoro 1,881,113 1,929,087 1,975,160 2,021,713 2,068,426 2,115,275 2,162,197 Pwani 944, , ,586 1,014,968 1,038,654 1,062,574 1,086,658 Dar es Salaam 2,799,241 2,801,675 2,881,548 2,961,150 3,040,118 3,118,132 3,194,903 Lindi 816, , , , , , ,884 Mtwara 1,176,112 1,220,248 1,246,089 1,271,912 1,297,751 1,323,568 1,349,235 Ruvuma 1,192,680 1,235,161 1,268,738 1,303,330 1,338,800 1,375,017 1,412,084 Iringa 1,553,392 1,617,696 1,649,200 1,679,828 1,709,225 1,737,382 1,764,285 Mbeya 2,201,206 2,346,388 2,423,635 2,502,258 2,581,792 2,662,156 2,743,084 Singida 1,150,367 1,222,810 1,258,545 1,294,584 1,330,931 1,367,481 1,404,065 Tabora 1,887,507 2,004,115 2,086,048 2,170,926 2,258,664 2,349,374 2,443,049 Rukwa 1,251,697 1,302,278 1,349,579 1,398,866 1,450,118 1,503,184 1,558,200 Kigoma 1,910,592 1,970,750 1,601,020 1,669,078 1,740,111 1,814,158 1,891,173 Shinyanga 3,060,176 3,277,784 3,411,023 3,549,342 3,692,941 3,841,787 3,998,664 Kagera 2,206,814 2,210,217 2,293,093 2,379,637 2,469,904 2,563,870 2,661,671 Mwanza 3,196,714 3,168,904 3,265,729 3,364,378 3,464,566 3,566,263 3,669,380 Mara 1,461,270 1,572,068 1,631,031 1,692,449 1,756,442 1,822,866 1,891,907 Manyara 1,141,376 1,198,051 1,241,994 1,288,280 1,337,015 1,388,295 1,441,771 Tanzania Mainland 36,197,312 37,526,206 38,291,222 39,474,672 40,683,294 41,914,311 43,169,305 Kaskazini Unguja 146, , , , , , ,209 Kusini Unguja 99, , , , , , ,035 Mjini Magharibi 441, , , , , , ,054 Kaskazini Pemba 196, , , , , , ,677 Kusini Pemba 186, , , , , , ,577 Zanzibar 1,070,217 1,143,538 1,154,777 1,193,054 1,232,505 1,273,512 1,315,552 Tanzania 37,267,529 38,669,744 39,445,999 40,667,726 41,915,799 43,187,823 44,484,857 Source: National Bureau of Statistics ** Projections based on the Population Census
123 102
124 CHAPTER 7 Investment in the Country PRIVATE SECTOR DEVELOPMENT 157. In 2011, Projects registered with Tanzania Investment Centre (TIC) increased by 62.2 percent from 509 projects worth shilling 7,092, million in 2010 to 826 projects valued at shilling 10,909, million. Out of these, 689 projects were new and 136 projects were for expansion and renovation. In addition, projects owned by local investors were 462, projects owned by foreign investors were 172 and projects of joint venture were 191. Employment opportunities from these projects arose to 79,101 compared to 43,640 opportunities in In 2011, tourism activities led in attracting investors with 222 projects worth shilling 798, and employment opportunities of 9,349, followed by manufacturing sector with 206 projects worth shilling 1,074,548.8 million and employment opportunities of 19,779. Investment in other areas were as follows: Transport sector 143 projects worth shilling 1,103,672.0 million with employment opportunities of 15,336; Commercial building 130 projects, worth shilling 1,484,356.0 million with employment opportunities of 16,493; Agriculture 53 projects, worth shilling 1,012,198.4 million with employment opportunities of 8,968; Human resources 29 projects, worth shilling 385,107.2 million with employment opportunities of 2,239; Services 12 projects, worth shilling 35,720.0 million with employment opportunities of 962; Communication 8 projects, worth shilling 413,956.8 million and employment opportunities of 503; Financial 7 projects, worth shilling 132,954.4 million and employment opportunities of 843; Economic infrastructure 4 projects, worth shilling 3,772,776.8 million and employment opportunities of 3,543; Energy 3 projects, worth shilling 469,711.2 million and employment opportunities of 120; Broadcasting 3 projects, worth shilling 23,134.4 million and employment opportunities of 390; Computer 3 projects, worth shilling 9,393.6 million and employment opportunities of 72; Natural resources 2 projects, worth shilling 8,512.0 million and employment opportunities of 313; and Petroleum products and Mining one project with shilling 85,120.0 million and employment opportunities of 191. Distribution of Projects by Regional 159. In 2011, Dar es salaam led in registering investment projects followed by Arusha region, where they registered 460 projects and 119 projects, respectively. Investments in other regions were as follows: Coast 45; Mwanza 40; Iringa 29; Tanga 23; Kilimanjaro 20; Mbeya 18; Morogoro 16; Mtwara 10; Ruvuma and Dodoma 7 projects each; Rukwa and Shinyanga 6 projects each; 103
125 Tabora and Kagera 5 projects each; Manyara 4 projects; Kigoma, Lindi, Mara and Singida 3 projects each. In addition, TIC addressed 13,566 applications compared to 10,822 applications addressed in 2010, as shown in table No Table No. 7.1: Applications addressed by the Tanzania Investment Centre Service Immigration: Grade A Grade B ,386 2,247 Employment ,284 2,542 Company registration Business registration Land , Tax , Total ,822 13,566 Source: Tanzania Investment Centre Foreign Direct Investment 160. In 2011, the value of Foreign Direct Investment increased by 97 percent up to USD million compared to USD million in This large increase was due to massive investment in gas exploration in the region of Mtwara which cost more than USD 300 million. Table No. 7.2 Foreign Direct Investment Year Value of FDI (In UDS million) * Source: Bank of Tanzania (*) Estimates Improving the Enabling Environment for Private Sector 161. In 2011, the Government started implementation of a Program for Improvement of Enabling Environment for Investment which was approved in Through this Program, the Government approved regulations for filing 104
126 and payment of Value Added Tax and Excise Tax through internet via Government Notice No. 242 and 241 respectively. This procedure has increased efficiency by eliminating disturbances and loss of time in paying taxes. Currently, more than 75 percent of large tax payers and other 2,795 taxpayers make their submissions through internet. Similarly, the Government in collaboration with Tanzania Revenue Authority introduced a system which links tax administration (Asycuda, ITAX) and commercial banks to facilitate payment of taxes. So far, the system has connected a total of 25 banks. In addition, the Authority uses the services of Vodacom M-Pesa and NMB- Mobile for payments of property tax and income tax In 2011, the Government in collaboration with Tanzania Port Authority (TPA) and TRA continued with the efforts to eliminate bureaucracy during the process of removing cargo ports. The Government introduced procedure of submitting documents through internet before cargo arrival (Pre Arrival Declaration -PAD). This procedure: allows stakeholders to submit documents wherever there is internet; removed the problem of presenting documents twice or more to Tanzania Inspection Services Company (TISCAN) and Division of Customs; removed the problem of congestions and misplacement of documents in the process of removing cargo ports; and has resulted in reduced time and cost of imports and exports cargo transportation. In addition, the Government introduced a Data Base for Customs revenue valuation (Import/ Export Commodity Data Base-IECDB.) Similarly, the Government allocated an area for construction of a dry port which will accommodate all port stakeholders and the construction process is on progress. The Government also has removed the restrictions on transportation (roadblocks) within the country, from existing 50 to 15, except those located at weighbridge stations and border posts In 2011, the government continued to improve the system of ownership of property including law reform, management and use of modern technologies in registering property. The aim is to reduce time in the process of registering property from existing 73 days to 45 days. In 2011, the last step in registering property declined from 14 days to 9 days. The Government also set a favourable environment to support access to credit, including adopting regulations which will help increase the availability of long-term loans with reasonable interest, and managing the lease and credit facility (Financial Leasing Regulations 2011). In addition, the Government continues with the process of establishing an independent unit to deal with management of Government Loan Guarantee Schemes. 105
127 ECONOMIC EMPOWERMENT Mwananchi Empowerment Funds 164. In 2011, the Government through Mwananchi Empowerment Fund extended loans amounting to shilling 7.1 billion compared to shilling 4.6 billion in 2010, equivalent to an increase of 54.4 percent. These loans were extended to beneficiaries through 30 Savings and Credit Cooperatives (SACCOs) in Coast, Dodoma, Lindi, Manyara, Mtwara, Rukwa, Ruvuma, Singida and Tanga regions. Repayments of these loans were 96 percent of the amount granted. These loans enabled entrepreneurs to establish small projects and purchase of agricultural implements including power tillers and agricultural inputs. Economic Empowerment and Employment Creation Program 165. In 2011, the Government continued to implement the Program for Economic Empowerment and Employment Creation. As at end of December 2011, the Government through this Program, extended loans worth shilling billion to 72,912 entrepreneurs through 12 financial institutions compared to shilling billion issued to 72,179 entrepreneurs in In addition, a total of shilling billion, equivalent to 83.3 of the amount due, were repayed. Issuance and Access to Credit through various Funds 166. In 2011, the Government through Presidential Trust Fund for lowincome citizens issued loans worth shilling 6.8 billion to 167,372 beneficiaries to enable them establish and strengthen various economic activities. Out of the amount due 65 percent has been repaid In 2011, the Bank of Tanzania through Export Credit Guarantee Scheme issued loan guarantee worth shilling 448,590,063,693 to financial institutions to enable them provides loans for exporters. Due to this guarantee, these institutions were able to issue loans worth shilling 584,946,840,280. In addition, 80 percent of guarantee issued were used to support agricultural activities. Similarly, the government through Small and Medium Enterprise Credit Guarantee Schemes (SMECGS) issued guarantee worth shilling 3,135,659,876 for financial institutions, which in return provided loans amounted shilling 6,505,912,000 to entrepreneurs In 2011, the Government through National Entrepreneurs Development Fund which is managed by SIDO extended loans worth shilling 26.0 billion to 51,019 beneficiaries. These loans led to creation of 153,185 employment potentials. In addition, loans repayment rate was 90.4 percent of the amount due. 106
128 169. In 2011, the Government through Youth Development Fund extended loans worth shilling 1.7 billion to youth aged Out of the matured loans only shilling 0.25 billion (14.7 percent) was repaid. This rate reflects that there is a major challenge in the repayment of loans from this Fund. In addition, loans worth shilling 40.2 billion were issued to 84,315 entrepreneurs through Small Entrepreneur Loan Facility (SELF) Project. This project fulfils the tasks of capacity building and providing loans to small entrepreneurs, particularly for those lives in rural areas. Among the beneficiaries who received the loan, women were 58 percent and the repayment of these loans was 92.5 percent 170. In 2011, the Government through Agricultural Inputs Trust Fund (AGTF) issued loan worth billion to famers and suppliers of agricultural inputs. Out of the amount issued, shilling 14.6 billion equivalent to 29.5 percent has been paid. This is due to long repayment period (five years) especially for agricultural implements such as tractors. 107
129 Table No.34 Sector TANZANIA INVESTMENT CENTRE (TIC): APPROVED PROJECTS A B C D E F G H A B C D E F G H Agriculture and Livestock , ,012,198.4 Natural Resources , ,512.0 Tourism , ,243.2 Manufacturing , ,074,548.8 Petroleum Products and Mining ,120.0 Construction ,925, ,484,356.0 Transport , ,103,672.0 Services , ,720.0 Computer , ,393.6 Financial , ,954.4 Communication , ,956.8 Human Resources , ,107.2 Energy ,277, ,711.2 Economic Infrastructure , ,772,776.8 Broadcasting , ,134.4 Total ,092, ,909,404.8 Source: Tanzania Investment Centre (TIC) A Total Number of Approved Projects B New projects C Old projects (expansion and rehabilitation) D Local projects E Foreign projects F Joint projects G Total employment H Total investment (Shs. million) 108
130 CHAPTER 8 HIV/AIDS CROSS CUTTING ISSUES 171. In 2011, the Government continued to implement the National Aids Control Program by providing services on treatment and care to people living with HIV and AIDS (PLHA), counselling and voluntary HIV testing. Futher, the Government continued to improve these services by ensuring that antiretroviral drugs are available in health care centers. In 2011, a total of 1,100 centers were providing treatment and care services to targeted people in all referral, regional and district hospitals; and some health centers and dispensaries countrywide. Futhermore, HIV counselling and testing centers increased by 2.9 percent from 2,137 centers in 2010 to 2,200 centers in In 2011, a total of 14,992,976 people were voluntarily counselled and tested on HIV and AIDS, compared to 8,890,207 people in This was a result of the increase in the number of HIV and AIDS counsellors and testing centers. The number of service providers increased from 5,240 in 2010 to 9,880 in In addition, The number of PLHA and accessing antiretroviral drugs increased by 24.6 percent from 313,384 people in 2010 to 390,390 in Out of those, children under 15 years were 29,918. Environment 173. In 2011, the Government continued to implement the 1997 Environmental Policy and Environment Management Act (Cap. 191). During this period, two regulations for the implementation of the Environment Management Act were formulated, making the Act to have a total of 17 regulations out of the required 29 regulations, compared to 15 regulations in 2010.These regulations include Sustainable Management of Wetlands Regulations and Coastal Management Regulations. Further, in 2011, three environmental management guidelines were prepared. These are: Guidelines on Environmental Management Trust Fund; Guidelines on Management of Environmental Triburnal; and Guidelines on Integrating Climatic Change into sectoral policies, plans and programmes In 2011, the Government continued to enforce investors to adhere to the Environment Management Act by undertaking Environmental Impact Assessment (EIA) before and after executing their projects. During this period, a total of 467 investment projects by were registered for EIA. Out of those, 109
131 163 projects were certified after fulfilling the requirements to 220 projects certified in Moreover, out of the certified projects, 44 were for communication; 36 were for manufacturing; 28 were for energy; 17 infrastructure;16 for construction and tourist attraction development; 12 for water; 7 for mineral exploitation; and three for forestry and agriculture projects In 2011, the Government continued to implement various projects and programmes to conserve biodiversity. The projects include: Gombe Kigoma and Masito Mpanda Ecosystem Environmental Conservation Project which covers an area of 12,047 square kilometers; Kihansi Environment Conservation Project; and Lake Tanganyika Conservation Project which is being implemented in Kigoma and Rukwa regions. In the implementation of this programme, 170,000 trees were planted in 2011 so as to reclaim the severely damaged areas, 19 participatory fishing community groups were formed so as to encourage sustainable fishing, four modern fishing grounds were built and community groups that engage in alternative economic activities were set up in six model villages In addressing the impact of climatic change the Government prepared a National Climatic Change Strategy in This is a five year strategy which sets out short, medium and long term strategies to withstand climatic change and reduce greenhouse gases. In addition, in 2011, the Government continued to implement two projects to address climatic change. These projects are: Climate adaptation projects in agriculture, water, health, Wildlife, livestock and forestry and land sectors; and a Plan to reduce Carbon emissions by reducing deforestation and forests degradation In 2011, the Government through the Marine and Coastal Environment Management Project (MACEMP) continued to fund the coastal communities in the implement their projects. In implementing that, a total of 56 projects worth TTshs.780, 295,425.0 were funded in the district councils of Mtwara D.C. (22), Temeke Municipality (17), Lindi Municipality (8), Tanga City (1), Bagamoyo (3), Lindi District (1) and Mtwara Mikindani (4). A total of 1,066 people benefited from these projects, including 511 men and 555 women. Furthermore, analysis of 32 projects from environmental protection and conservation of marine reserve areas was conducted and recommendations for funding to facilitate its implementation have been completed. Good Governance 178. In 2011, the Government through the Commission for Human Rights and Good Governance continued with its efforts to promote, protect and 110
132 maintain human rights and good governance in the society. Moreover, in 2011, the Commission handled a total of 8,875 old and new people s complaints. Out of those, 1,042 complaints were investigated and completed while 7,833 continued to be investigated compared to 1,003 complaints which were completed in In 2011, the Court of Appeal received 2,857 cases, out of which 798 cases were completed and 2,059 cases continued to be handled, compared to 2,624 cases received in 2010, whereby 627 cases were completed and 1,997 cases continued to be handled. Moreover the High Court received 9,453 new cases, making the total number of cases to be 20,385 compared to 10,932 cases in Out of those cases, 9,669 cases were handled and completed in In addition, 85,323 cases were filed in the District and Resident Magistrate Courts in Out of those, 67,437 cases were heard and completed compared to 62,154 cases filed in 2010, of which 46,977 cases were heard and finalized In 2011, the Government continued to implement the Second Phase of the National Anti-Corruption Strategy and Action Plan (NACSAP II). In the course of implementing the strategy,the Prevention and Combating of Corruption Bureau (PCCB) received and investigated 399 corruption cases. Out of those, a total of 103 cases were finalized and suspects were prosecuted. Out of those prosecuted, 48 suspects were convicted and punished and 55 suspects were found not guilty, compared to 870 cases in 2010, whereby 587 cases were prosecuted of which 64 cases were concluded. Gender 181. In 2011, the Government initiated the process of streamlining the Women and Gender Development Policy of 2000 to cope with the existing changes and challenges including changes in economic situations. Moreover, in 2011, the Government conducted gender violence meeting of experts and ministers from the Great Lakes region countries. The meeting drew participants from 11 Great Lakes region countries. The objective of the meeting was to seek means of eradicating gender violence In promoting gender equality, the Government continued to ensure that involvement of women in decision making is improved. To achieve this, the Government increased women special seats in parliament from 75 seats in the 2005 general elections to 102 seats in Moreover, the Government promoted women into various levels of decision making, including ministers, regional and district commissioners, permanent secretaries and directors in various institutions. Following these initiatives, the number of women in 111
133 decision making positions increased from 31 percent in 2009/10 to 36.4 percent in 2010/11. Public Safety 183. In 2011, the public safety was generally peaceful despite the existence of sporadic crime and traffic offences. A total of 63,703 criminal offences were reported in all police stations in 2011 compared to 62,134 offences reported in 2010, equivalent to a decrease by 2.5 percent. This was on account of strategies implemented by the police to combat crime in the country, including the identification of crime susceptible areas, patrolling the areas and conducting regular and sudden raids In 2011, a total of 24,078 road accidents were reported in police stations compared to 24,296 accidents reported in 2010, equivalent to a decrease of 3.4 percent. In addition, a total of 4,013 people died while 20,917 people were injured in those road accidents compared to 3,687 people who died and 22,064 people who were injured in People who died on road accidents increased by 8.8 percent while the number of injured people decreased by 5.2 percent. Road accidents decreased in 2011 following Government s efforts in restricting overspeeding for passenger cars, seize cars that use non-standard tyres and the inspection of driving licenses and cars. The main causes of road accidents were: reckless driving; defective vehicles; poor infrastructure; negligence on road safety rules by pedestrians, motorcyclist and bicycles riders; and drunkenness In 2011, the total number of refugees in the country was 131,243 compared to 109,286 refugees in A big chunk of those refugees came from Burundi, Democratic Republic of Congo, Somalia and other few from Rwanda, Uganda, Sudan, Ethiopia and Zimbabwe. The breakdown of the number of those refugees and their countries of origin is as follows; Burundi, (67,549 refugees), Democratic Republic of Congo (61,913), Somalia (1,530) and other countries 251 refugees. Furthermore, in 2011, a total of 279 refugees returned to Burundi compared to 1,092 refugees in In 2011, a total of 963,687 foreigners from different countries entered Tanzania compared to 628,795 foreigners in 2010, equivalent to an increase of 53.3 percent. In addition, 999,090 foreigners returned to their respective countries compared to 775,310 foreigners in 2010, equivalent to an increase of 28.9 percent. In 2011, a total of 17,441 residence permits (visas) were granted to foreigners to undertake different economic activities in the country compared to 19,550 visas granted in 2010, equivalent to a decrease of 10.8 percent. 112
134 CHAPTER 9 REVIEW OF THE IMPLEMENTATION OF NATIONAL STRATEGY FOR GROWTH AND REDUCTION OF POVERTY Introduction 187. The first phase of the implementation of National Strategy for Growth and Reduction of Poverty (NSGRP) ended in June During the period of five years of its implementation (2005/ /10), a number of achievements and challenges have been reported through the implementation of MKUKUTA Monitoring System (MMS). These reports includes: MKUKUTA Annual Implementation Report (MAIR), Poverty and Human Development Report (PHDR), Voice of the Peoples Report, and various research and survey reports. The second phase of NSGRP (MKUKUTA-II) was prepared and endorsed by the President of United Republic of Tanzania in October 2010 based on challenges and lessons learned during the implementation of MKUKUTA-I MKUKUTA-II will be implemented for five years (2010/ /15) and will adopt MKUKUTA-I structure of three clusters including: Growth and Reduction of Income Poverty; Quality of Life and Social-wellbeing; and Good Governance and Accountability. Likewise, various indicators to asses the implementation of MKUKUTA-II are described across these three clusters. The analysis of various MKUKUTA-II indicators during the first year of its implemetation is as follows: Growth and Reduction of Income Poverty 189. Real GDP growth in 2011 was 6.4 percent compared to 7.0 percent recorded in This growth is below the envisaged growth target band of 8 percent -10 percent as targeted in NSGRP-II. Improved growth of real GDP was attributed to impressive performance in communication (19.0 percent), financial (10.7 percent), construction (9.0 percent), and services (8.1 percent) The agriculture sector which employs more than 74 percent of the population grew by 3.6 percent in 2011 compared to 4.2 percent in Despite slow growth of agriculture sector, Tanzania continued to be food self sufficient whereby food self sufficient ratio averaged 95 percent. This ratio is obtained by comparing domestic food production and food demand. Food self sufficient ratio in 2010/11 was 112 percent compared to 102 percent in 2009/
135 191. GDP per capita rose by 12.8 percent from TZS 770,464.3 in 2010 to TZS 869,436.3 in Further, indicators trend analysis under this cluster is elaborated in the MKUKUTA Annual Implementation Report (MAIR) for 2010/11. Improving Quality of Life and Social Well-being 192. In 2010/11, the Government in collaboration with other stakeholders continued to implement programs and reforms in the social service sectors with a view of improving quality of life and social well being. The most common applicable indicators under this cluster are those related to education, health, and water. Among the achievements recorded in education include: increased enrollment at the level of pre-primary, secondary, technical and higher education The Net Enrolment Rate (NER) in Pre-Primary Education reached 42.4 percent in 2011 compared to 37.5 percent in However, NER for primary education declined slightly from 95.4 percent in 2010 to 94.0 percent in Pass rate increased from 49.4 percent in 2009 to 53.5 percent in Net Completion Rate for primary school level increased from 53.0 percent in 2010 to 62.6 percent in 2011, whereby Female Completion Rate increased from 54.3 percent to 65.2 percent According to Tanzania Demographic Health Survey of (TDHS) 2009/10, maternal and child health services has improved. Maternal mortality rate declined from 578 maternal deaths per 100,000 live births during 2004/05 to 454 per 100,000 live births in Infant mortality rate was 51 deaths per 1000 live births in 2011 compared to 68 deaths per 1000 live births during 2004/05. The target is to reduce to 38 deaths per 1000 live births by Under-five mortality rate was 81 deaths per 1000 live births in 2011 compared to 112 deaths per 1000 live births during 2004/05. MKUKUTA-II aims at reducing under-five mortality rate to 54 deaths per 1000 live births by HIV prevalence rate for the group aged reached to 2.4 percent in 2010, whereby MKUKUTA-II target is 1.2 percent by According to TDHS 2010, the proportion of stunted children under five years decreased from 38 percent during 2004/05 to 35 percent in 2010; proportion of U-5 underweight children decreased from 22 percent during 2004/05 to 21 percent in The number of households connected to Urban Water Supply Program increased from 234,468 in 2009/10 to 254,236 in 2010/11, equivalent to an 114
136 increase of 8 percent. Water supply coverage in 19 regional headquarters reached 86 percent in 2011 compared to 84 percent in The proportion of rural population with access to protected sources of water had increased from 40.4 percent (HBS 2007) to 47.9 percent (TDHS 2009/10). Good Governance and Accountability 197. During the implementation of MKUKUTA-II, the Government continued with efforts of enhancing transparency and accountability in the use of public resources at all levels with special focus on Local Government Authorities. In that period, the Government ensured that Local Government Authorities publicize their revenue, budgets, and actual expenditures with aim of enabling all stakeholders to access correct information on public expenditures for creating transparency. These efforts resulted to a decrease in the number of LGAs that do not post relevant information relating to budgets, plans and audited accounts on notice board from 93.2 percent in 2009/10 to 87 percent in 2010/ In strengthening the fight against corruption, in 2010/11 the Government investigated a total of 2,258 corruption cases, whereby investigations of 598 cases equivalent to 26 percent were completed. However, due to lack of enough supporting evidences, 80 file cases were sent to the Director of Public Prosecutions and 92 case files were transferred to other Government agencies after it was proved that the submitted evidence were not complying with the Anti-corruption Act In addition, in 2011 a total of 399 cases of corruption were sent to court and 103 cases were completed, of which 48 defendants were found guilty In 2010/11, the Government continued with the issuance of rights to every citizen. The Government also recognizes that information of birth registration is important in budgeting and planning for development. In 2011, registration of birth, death and divorce increased. Table 9.1 Registration trend of Birth, Death and Divorce Activi ty Birth Certificate s Death Certificat es Marr iage Divor ce 2008/ , , , / 469,274 47, , / 625,670 73, , Source: Ministry of Finance Trustees hip Will (law) Legaci es Adopti ons 115
137 116
138 CHAPTER 10 THE FIVE YEAR DEVELOPMENT PLAN Introduction 200. Since independence 1961 until the early 1980s, Tanzania used to have long and medium-term plans as a roadmap to realise national development goals. However, due to repeated global economic crises and limited capacity to manage those crises, the country had to rely on short-term plans of one to three years duration to deal with those crises. In pursuing short-term plans, it was clear that long term aspirations and targets were not acheived. In this context, the Government in 2008 reverted to the medium and long term plans as a strategy to realise Tanzania Development Vision In 2011, the First Five Year Development Plan (2011/ /16) was launched to drive implementation of the National Development Vision for the remaining period up to This is the first Plan, and the expectation is to have other two development plans of 2016/ /21 and 2021/ /26. The meaning of Five Year Development Plan 201. The Five Year Development Plan (FYDP) is a roadmap that guides the country socio-economic development in the period of five year to come. During this period, the Government describes its intention to measures that will be undertaken to ease economic constraints faced various socio-economic sectors in order to raise people s income and bring up sustainable development. In this context, the FYDP 2011/ /16 is the formal implementation tool of the Country's development agenda, articulated in the Tanzania Development Vision 2025, in particular taking Tanzania to middle income country status and eradicating poverty. The FYDP manifested itself in unleashing Tanzania s latent growth potentials in order to use country natural resources such as minerals and geographical advantages such as natural harbours, gateway to neighboring countries to accelerate economic growth. Tanzania s Historical Perspective on Medium and Long term Plans 202. The The FYDP 2011/ /16 is not the first medium term plan to be established in Tanzania since history shows that the country had similar plans soon after independence. During the early years of independence, Tanzania development agenda focused on economic growth and poverty reduction. The primary objective was to ensure that majority of Tanzanians benefit from such development. In an effort to achieve this goal, Tanzania Mainland has had a tradition of formulating and implementing medium and long term development plans. The first plan was a Three Year Development 117
139 Plan ( ), whose objective was to fight against the three development enemies namely illiteracy, poverty and diseases In 1964, based on the experience of implementing the Three Year Development Plan, and the need to entrench people-centred development, the Government adopted the first 15 years Long Term Perspective Development Plan ( ). This Plan was to be executed in three consecutive Five Year Development Plans, starting with the Plan. This Plan was revised in 1967 so as to be consistent with the Arusha Declaration Policy. The Arusha Declaration articulated the ideological and developmental vision for the country and informed the subsequent Plans. The Second Five Year Plan was implemented from 1969 to 1974, and the Third Plan (1975 to 1980) was not implemented due to the economic crisis (drought, oil price shocks and war against Idd Amin of Uganda) In 1981, the Government prepared the second Long Term Perspective Plan ( ) to be executed in four successive Five Year Development Plans. However, the Plan was not implemented effectively due to economic crisis in spite of the Government s desire to implement it. Thus, the Government resorted to a short-term National Economic Survival Programme (NESP /82) as an emergency programme, aimed at addressing commodity shortages in the market. As the crisis intensified due to further oil price shocks, the consequences of the war with Idd Amin of Uganda and prolonged adverse weather conditions, the Government abandoned altogether the envisaged five year plans to implement Long Term Plan, and opted for three consecutive three-year economic stabilisation programmes from 1982/83 to 1991/92. The first was Structural Adjustment Programme (SAP ), which was intended to address the economic crisis, and was followed by two Economic Recovery Programmes (ERP I: ; and ERP II: ) with support from development partners In general, the paradigm shift from five year plan to needs-based three year programmes led to a diversion from the well-articulated and coherent plans commensurate with the national development agenda. Instead, the planning process became ad-hoc and frequently interrupted in order to revert to crisis management, thus losing focus on strategic investments that is in line with long-term growth. The National Development Vision Based on the fact that, implementation of economic stabilization and recovery programmes did not achieve the intended socio-economic results, in 1999, the Government launched the National Development Vision 2025, with 118
140 the aim of transforming Tanzania from low income to middle income country. The aspiration of Vision 2025 is characterized by high levels of industrialization, competitiveness, quality livelihood, good governance and rule of law; and having in place an educated and pro-learning society Vision 2025 was designed to be implemented through a series of five year development plans. However, this was not possible since at the adoption of the Vision 2025, Tanzania had embarked on far-reaching policy and institutional reforms, under the auspice of HIPC. Tanzania started to implement Poverty Reduction Strategies (PRS ), which in the absence of Five Year Development Plans, became the framework to implement the Vision. This three year strategy was later on improved and changed to five year National Strategy for Growth and Reduction of Poverty, commonly known as MKUKUTA I ( ) and MKUKUTA II ( ). The First Five Year Development Plan -2011/ / The FYDP 2011/ /16 is reverting back to the practice of defining a roadmap toward development aspirations in the context of five year horizon. This Five Year Plan implies transiting from a needs-based planning framework to opportunity-based planning. In the former, the nation s ambition to develop is solely limited to available resources, while in the case of the latter, resources are merely a means to realise the country s aspirations. This Plan is the first in a series of three Five Year Development Plans for the implementation of Tanzania Development Vision 2025 based on new planning framework. Process of Preparing FYDP I 209. The process of developing the FYDP I was informed by a number of processes, frameworks and initiatives already in place. Some of the initiatives/frameworks referred to include the review of Tanzania Development Vision (TDV) 2025, MKUKUTA I&II, Sector Strategic Plans, Medium Term Expenditure Frameworks (MTEFs), Priority Action Programs (PAPs) for Ministries, Departments and Agencies (MDAs), the Millennium Development Goals (MDGs), and other national and international frameworks/initiatives which Tanzania has ratified. Thus, the FYDP I reflects priorities already agreed in these processes with modifications to enhance focus on the realisation of the TDV 2025 targets. In addition, the draft Medium Term Public Investment Plan (MPIP), which was prepared under coordination of the Ministry of Finance, formed the basis and strategic direction of the Plan. This plan also took into account directives of the 119
141 President delivered during his inaugural speech to the 10 th Parliament of the United Republic of Tanzania, and various Government policy directives. Moreover, during the preparatory stage, several stakeholders including MDAs, CSOs, DPs, and private sector at large were involved in one way or another. The Overall Goal of FYDP (2011/ /16) 210. The overall goal of FYDPI is to unleash the country s resource potentials in order to fast-track the provision of the basic conditions for broadbased and pro-poor growth. The targeted average GDP growth rate for the FYDP I period is 8.0 percent per annum, building up from a 7.0 percent growth in 2010, and thereafter consistently maintaining growth rate of at least 10 percent per annum from 2016 until The targeted growth has been calculated by taking into account Tanzania s growth record over the past fifteen years, and experiences of countries that managed to reach middleincome status in the last 30 years. Unleashing Growth 211. To achieve the desired growth, five crucial elements will be needed: (i) large investments in energy and transport infrastructure, (ii) strategic investments to facilitate expansion of food and cash crops production and foster industrial development; (iii) improving human resources development and skills, (iv) improving the business environment, and (v) institutional reforms for an effective implementation, monitoring and evaluation of the Plan. This will also require sustaining the following sectoral transitions: agriculture to increase its average annual growth rate from the current level of 4.4 percent to 6.0 percent, manufacturing from 8.0 percent to 12.1 percent, the overall industrial sector from 8.6 percent to 9.4 percent and services from 7.5 percent to 7.8 percent. In order to strengthen economic growth the country will have to create a strong competitive base to ensure efficient use of its comparative advantages such as geographical location, rich natural resources, macro-economic stability, peace and political stability. However, it will also be important to closely monitor the developments in terms of income inequality to ensure that growth is inclusive. Salient Features of FYDP I 212. The first FYDP streamlines the various national development initiatives into a unified and coherent framework mainly to provide guidance in implementation and to give the Government opportunities and formal ways of evaluating the national development process. The FYDP I differs from other policy initiatives especially in the following four major areas: 120
142 i. A shift from short term needs-based planning, which is based on available resources, to embrace opportunity-based planning, which requires enterprising beyond the resource constraints; ii. A shift from prioritization based on sectors to prioritization by intervention with strong emphasis on identifying detailed strategic programmes and activities; iii. Strong emphasis on growth, while sustaining gains in social service delivery as well as gradual improvement of human resources particularly skills development to meet dynamic needs of the labour markets; and iv. Scaling-up the role and participation of the private sector in economic growth, by improving the business climate to efficiently use the factors of production, investing in people and infrastructure development, and sustaining achievements in socio-economic progress. Strategic Interventions 213. The strategic interventions in the implementation of the plan are aimed at identifying existing strategic opportunities; priority areas, key issues that need consideration during implementation; possible challenges that may occur in the course of implementation and identification of current binding constraints in the economy. Basically, Tanzania has immense resources for development compared to neighboring countries and its land is more arable and fertile. There are 44 million hectares of arable land, across varying climatic zones, of which only 24 percent is being utilized for agriculture. In addition, Tanzania has abundant power generation resources particularly for electricity generation using natural gas with 43 billion m³ of proven reserves, 1,200 million tons of coal reserves, uranium, geothermal, hydropower potential of 4.7 GW, wind, solar, and other renewable resources Tanzania is also endowed with high quality limestone for cement production and phosphate deposits that can, in combination with natural gas, provide the basis for the production of fertilizers. Other natural resources include gold, diamonds, tanzanite, ruby, nickel, tin, soda ash and iron ore. In addition. Tanzania has tourist attractions including 15 world famous national parks such as Ngorongoro Conservation Area, Serengeti, Mt. Kilimanjaro; 33 game reserves, 43 game controlled areas and abundance of cultural heritage tourist attractions. Further, there are 35.3 million hectares of forest and woodlands as well as 13.5 million hectares of national forest reserves and local government forest reserves. These are some of the opportunities that 121
143 Tanzania is endowed with, and if appropriate strategic interventions are put in place to harness these potentials, Tanzania can achieve TDV targets before Despite of the opportunities identified above, Tanzania is still faced with basic constraints that when addressed appropriately, the economy will grow rapidly and attract more investment especially in the private sector and eventually expand more employment opportunities and reduce poverty. Constraints facing Tanzania economy are many but the recent study has revealed the following major constraints to growth: i. Unreliable and inadequate supply of electricity; ii. iii. iv. Poor infrastructure: especially transport network, and in particular rural roads, railways and ports; Inadequate supply of skilled labour; Limited access to secure land ownership rights; v. Implications of climate change amidst scarce irrigation facilities; vi. vii. Limited domestic value addition of primary products; and Limited access to finance, especially for SMEs and in the agriculture sector To address the above binding constraints, it calls for the need to consider basic prerequisites that will accelerate the process of sustainable development in various sectors. As such, initial stages of the renewed efforts to unleash Tanzania s growth potential require making some hard choices on how, where and when available resources should be invested. Consistent with this, the need to create enabling environment for sustained macro-economic stability and growth is imperative. Similarly, existence of conducive business environment, ensuring accessibility of land for productive and settlement purposes, and enhancing the prevailing efforts to institute good governance underpinned by the rule of law are also basic prerequisites to achieving the targets of the Plan. Priority Areas of the FYDP I 217. Based on the theme of this Plan, five areas were identified as priority.these are: (i) Infrastructure: especially energy, transportation ( ports, railways, roads, and air), water and sanitation and ICT; 122
144 218. The strategic interventions in this area are categorized into two groups: that is hard and soft infrastructures. Strategic interventions in the hard infrastructure focus on: ensuring availability of reliable electricity; developing a transport sector which includes roads, airports, railways and ports whereby the main objectives is to promote Tanzania as the transport and logistical hub for East and Central African countries; and strengthening water and sanitation infrastructure. On soft infrastructure, strategic intervention mainly focuses on promoting ICT. (ii) Manufacturing: particularly industries that use locally available raw materials such as textiles, fertilisers, cement, steel, coal, and iron ore parallel with developing SEZs and EPZs through PPP arrangement; 219. The underpinning goal for manufacturing sector is to promote transformation in the production of export goods commensurate with the market demand. In view of this, emphasis will be in building a formidable foundation for self propelling industrialisation and export-led growth. Strategic intervention will focus on developing the sector to match with development in the agriculture sector by putting in place strategies for promoting industries particularly agro-processing industries. In addition, the intervention will ensure Tanzania build-up its industrial base, particularly in basic industries (fertilisers, cement, steel, textiles, sugar, paper and petrochemicals) utilising locally available raw materials (coal, iron, natural gas, soda ash, limestone, phosphates, wood, cotton). Similarly, emphasis in the manufacturing sector will be on improving the business environment, especially for labour intensive SMEs, setting up SEZs and EPZs in urban and rural areas, to ensure equitable growth; and promoting PPPs. (iii)agriculture, to have green revolution in order to increase food selfsufficiency and export the surplus, expansion of irrigation agriculture especially in special agricultural corridors, and promote cultivation of high-value crops including vegetables, flowers, spices, and grapes In the next five year, strategic intervention in agriculture will focus on: expanding and improving irrigation infrastructure; easing availability and enhancing utilisation of modern agricultural inputs and mechanisation; improving and strengthening availability of scientific production methodologies through research, training, and provision of extension services; 123
145 improving market access; promoting agro-processing and value addition activities; and promoting climate-compatible agriculture. (iv) Human Resource Development, focus on education and skills especially sciences, technology and innovation. Human resources development includes issues of development of labour force skills, education, health and nutrition Education and Skills Development: Strategic intervention will focus on increasing the quality education at all levels, specifically facilitating accessibility of education for the poor. In addition, the Plan will focus more on re-orient human capital development towards achieving the development goals in the key productive sectors (agriculture, mining, and manufacturing) and economic infrastructure (energy, ICT, transport and tourism) 222. Health: The FYDP will emphasize on interventions to address the challenges facing the health sector. This will imply: increasing accessibility to health services, based on equity and gender-balanced needs; improving the quality of health services; strengthening management of health service policies and regulations; strengthening human resources development for health and social welfare. (v) Supporting Services: especially Tourism, Trade and Financial services The Plan will put in place measures to address challenges encountered in the supporting services in tourism, trade and financial. Priority areas will include: improving tourism services and revenue derived from it; enhancing international trade, economic cooperation and regional integration; and strengthening financial intermediation and financial stability In the next five years the Plan has identified core investment areas emanating from the above priorities. Those core investment areas are as follows: i. Electricity generation to produce 2,780 MW; ii. iii. iv. Expansion of the capacity of the Dar es Salaam port; Rehabilitation of the central railway line and beef-up of the rolling stock (engine and wargons); Construction of regional and district roads in the SAGCOT; v. Country-wide coverage of the ICT backbone infrastructure; vi. Investment in irrigation infrastructure in the SAGCOT; 124
146 vii. viii. ix. Training students in the fields of science, engineering and education in general; Development of SEZs, especially for electronic goods, farm machinery, and agro and mineral-processing industries. Large scale fertiliser production; x. Coal and steel industry. Financing the Five Year Development Plan 225. For any plan to be implemented effectively, mobilisation of financial resources is paramount. For a considerable period of time, the Government has relied on traditional sources of revenue to finance its recurrent and public investment expenditures. Those sources include: domestic tax revenue, non tax revenue (domestic borrowing, dividends, fees, and licenses) and grants and concessional loans from both bilateral and multilateral sources. In addition, for the plan to be effective, the Government need to allocate at least 35 percent of domestic revenue to cater for development expenditure. Notwithstanding the traditional sources of finance, the FYDP I propose innovative sources of financing the Plan. Those include; Infrastructure and Savings Bonds: Diaspora Bonds; Domestic Bonds; Foreign Market Bonds; Pension and Social Security Funds; Strategic Partners Grants and Donations; Government Guarantee through PPP arrangements; Regional Economic Arrangements and South- South Cooperation; Taxation on financial transactions, Carbon Trading and Carbon Tax; Voluntary Based Initiatives; and Super Profit Tax on Minerals Consistent with the core areas of investment outlined in the Plan, the total cost of implementing the Plan is estimated at TShs trillion over the next five years. Out of this, TShs. 8.6 trillion will have to be mobilized by the Government and the remaining amount will be sourced from the private sector, partnerships, development partners, and other stakeholders. Table 10.1 summarises sectoral capital investments requirements. 125
147 Table 10.1: Financing Requirements for Priority Areas, 2011/ /16 (Millions of TShs.) Sector Total Costs 2011/ / / / /16 Agriculture 4,361, , , , , ,164 Crops 2,630, , , , , ,240 Forestry 71,563 29,859 8,580 10,607 11,323 11,196 Fisheries 326,180 90,011 76,670 61,766 52,831 44,902 Livestock 1,333, , , , , ,826 Manufacturing 1,513, , , , , ,120 Mining 1,383, , , , , ,247 Transport 11,293,947 2,283,02 2,759,728 2,228,08 2,199,87 1,823, Roads 7,106,765 1,781,92 2,137,284 1,568,40 993, , Railway 2,097, , , , , ,760 Marine 995, , , , , ,818 Airways 1,094, , , , , ,284 Water 2,326, , , , , ,251 Land 142,645 42,139 34,239 23,139 22,139 20,989 Energy 14,619,211 2,474,12 5,010,213 3,914,55 1,926,84 1,293, ICT 1,606, , , , , ,410 Education 1,814,629 65, , , , ,853 Health 2,765, , , , , ,557 Governance 1,546, , , , , ,043 Tour., Trade & Fin. Serv. 1,130, , , , ,322 80,639 Tourism 185,818 18,250 53,696 43,968 36,918 32,985 Trade 89,370 17,568 17,914 17,916 18,010 17,962 Fin. Serv. 855, ,610 38,854 44, ,394 29,692 Employment 7,200 1,710 1,230 1,400 1,400 1,460 Total 43,656,784 8,376, ,771,988 9,775,372 7,659,872 6,072,743 Source: President s Office, Planning Commission Implementation Framework 227. FYDPs will be implemented through approved annual plans with clearly stated programmes and projects. POPC will develop comprehensive criteria for selecting projects for the Annual Plan. MDAs, RSs and LGAs will in turn submit their Annual Plan proposals to POPC. Prior to submission to 126
148 POPC, these plans will have to be endorsed by relevant committees in the MDAs, RSs and LGAs. All strategic national investment projects will have to be subjected to POPC and MoF scrutiny and endorsement to qualify for incorporation into the annual plans and allocated financial resources. Annual Plan Execution and Coordination 228. The Plan execution and coordination will remain the responsibility of MDAs, RSs and LGAs. The POPC will take the lead role in the coordination, monitoring and evaluation at national level, specifically for strategic national investment projects/programmes. The specific roles and the responsibilities of the lead actors involved in the execution process are described below: Role of POPC 229. Effective monitoring of implementation of the Plan at national level will be spearheaded by the POPC. In addition, the Plan and Budget Guidelines (PBG) will be issued jointly by POPC and MoF. All MDAs, RSs and LGAs will have to adhere strictly to PBG in the preparation of their plans and budget. POPC will be responsible for the preparation of mid-year implementation report at national level to inform the status of implementation. The Planning Commission, apart from providing strategic thinking and advice to the Government on economic management, and preparation and implementation of plans, will advise on the mobilization of financial and human resources for the implementation of development projects. Role of the Ministry of Finance 230. The main preoccupation of MoF will remain: mobilization of resources to finance Government budget; coordination of inter-governmental and international financial and fiscal relations; collaborate with POPC to establish a joint committee to ensure that the annual Plans resonate well with the budget frame; issue the PBG to be observed by all MDAs and Local Authorities; and collaborate with POPC in identifying alternative sources of financing development programmes. Role of MDAs and LGAs 231. The implementation of FYDP s priorities, programmes and projects will be the responsibility of MDAs/RSs/LGAs as well as the Non-State Actors. MDAs/RSs/LGAs will initiate specific projects and programmes to ensure achievement of the envisaged results. Programmes and projects selection by the MDAs/RSs/LGAs will be required to provide implementation report of the Plan to facilitate POPC in its M&E undertakings. LGAs and 127
149 sectoral ministries will be responsible to ensure that priorities identified by communities and sectors respectively are in line with national priorities. Concluding Remarks 232. The FYDP I is the first in a series of three Five Year Development Plans to implement the Tanzania development Vision This Plan will be implemented under the theme of unleashing Tanzania s growth potentials in order to accelerate economic growth. The FYDP I will be followed by two five years consecutive plans ie 2016/ /21, and 2021/ /26. These Plans aim at transforming the economy from an agriculture-based to an industry-based economy which is the main characteristics of middle-income countries. Achievements in this Plan will depend much on collective responsibilities between the Government and citizens, private sector, development partners, non-governmental organizations in executing the Plan through interventions identified in the priority areas. 128
150 129
151 CHAPTER 11 AGRICULTURE AND COOPERATIVES Growth Rate 233. In 2011, agricultural activities which include: crops, livestock; and forestry and hunting grew by 3.6 percent compared to 4.2 percent in Also, crops; livestock; and forestry and hunting sub activities grew by 3.5, 3.9 and 3.5 percent in 2011 compared to 4.4, 3.4 and 4.1 percent in 2010 respectively. On the other hand, the share of agriculture activities to GDP was 23.7 percent in 2011 compared to 24.1 percent in The share of crops and livestock sub activities to the GDP decreased from 17.8 percent and 3.8 percent in 2010 to 17.4 and 3.7 percent in 2011 respectively. However, the share of forestry and hunting to the GDP increased to 2.5 percent in 2011 from 2.4 percent in Food Crops Production 234. In 2011, production of food crops mainly wheat, cassava, beans, bananas and potatoes increased compared 2010 due to favourable weather condition and even rainfall distribution. Production of wheat increased from 62,000 in 2010 to 113,000 tons in 2011, equivalent to 82.3 percent increase. In addition, production of cassava increased to 1,549,000 tons 2011 from 1,464,000 in 2010, equivalent to an increase of 5.8 percent. Production of beans increased from 1,254,000 to 1,632,000, equivalent to 30.1 percent increase. Production of bananas increased from 975,000 tons to 1,048,000, equivalent to an increase of 7.5 percent. Similarly, production of sweet potatoes increased from 1,231,000 tons to 1,710,000 tons, equivalent to 38.9 percent increase. However, production of maize, rice and sorghum decreased in 2011 compared to Production of maize decreased from 4,475,416 tons to 4,340,823 tons, equivalent to a decrease of 3.0 percent. Production of rice decreased by 14.1 percent from 1,700,000 tons to 1,461,000 tons. Production of millet/sorghum decreased from 1,160,000 tons to 1,119,000 tons, equivalent to 3.6 percent decrease. The food crops production trend is as shown in the table below: 130
152 Table No. 11.1: Production of Food Crops (Tons 000) Crop r 2011p Change (%) 2009/10 Maize 3,555 3,324 4,475 4, % Rice ,700 1, % Wheat flour % Millet/Sorghum 1, ,161 1, % Cassava 1,797 1,759 1,464 1, % Beans 1,125 1,184 1,254 1, % Banana , % Sweet potatoes 1,379 1,381 1,231 1, % Source: Ministry of Agriculture, Food and Cooperatives. r: Revised data p: Temporary data Cash crops production 235. In 2011, production of cash crops mainly cotton, sisal, cashewnust, tea and sugar increased compared to The increase in production was a result of several factors including: favourable weather condition, the use of improved seedlings, pesticides and sprayers. Other main factors included: renewed of abandoned tea farms in Rungwe and Korogwe districts, extension of sugar productions machines, commensed sisal harvesting by peasants, and the timely use of pesticides for controlling cashewnut bugs On the other hand, production of coffee, pyrethrum and tobacco decreased in 2011 compared to Production of coffee decreased from 60,575 tons in 2010 to 32,304 tons, equivalent to 88 percent decrease. This was a result of insufficient short rains, variation in rain seasons in Kagera and Mbeya regions and poor use of agricultural inputs. Production of pyrethrum decreased by 9.6 percent from 5,000 tons in 2010 to 4,560 tons in This decrease was a result of shortage in supply of improved seeds/seedlings to farmers. The cash crops production trend is as shown in the table below: 131
153 Table No. 11.2: Production of Cash Crops (Tons 000) Change (%) Crop /11 Cotton 200, , , , Tobacco 55,356 60, , ,904 (4.9) Sugar 276, , , , Tea 34,770 33,160 55, , Pyrethrum 1,500 3,320 5,000 4,560 (9.64) Coffee 58,052 40,000 60,575 32,304 (88) Sisal 33,000 26,363 35,000 33, Cashewnuts 99,107 74, , , Source: Ministry of Agriculture, Food and Cooperatives. Production of Oil seeds 237. In 2011, production of oil seeds which include sunflower, groundnuts, and simsim increased compared to The increase was due to favourable weather condition in growing crops areas and continued expansion of simsim market. However, production of soya decreased by 42.0 percent due to low response of farmers due to lack of reliable market. The production of Oil seed is as shown in the table below. Table No. 11.3: Production of Oil Seeds (Tons 000) Change Crop (%) 2010/11 Sunflower 418, , , , Groundnuts 396, , , , Simsim 46, ,295 65, , Soya 3,450 3,900 4,300 2, Source: Ministry of Agriculture, Food and Cooperatives. Investment in Agricultural Economic Activities 238. In 2011, a total of 3,183 new tractors were imported compared to 1,586 tractors imported in The increase in number of imported tractors was a result of increased demand for tractors following increased opportunity of loans for buying tractors from various institutions e.g Agriculture Input Trust Fund and continued importation of tractors through SUMA JKT project. In 2011, SUMA JKT alone imported 1,190 tractors. However, a total number of power tillers imported in 2011 were 699 compared to 2,553 power tillers imported in
154 Irrigation Farming 239. In 2011, a feasibility study and design were conducted in 54,000 hectares for irrigation compared to 90,000 hectares in This marks a total area of 419,744 hectares compared to 365,744 hectares in 2010, equivalent to 14.8 percent increase. A total of 345,690 hectares for irrigation were developed by constructing irrigation infrastructures compared to 331,490 hectares developed in 2010, equivalent to 4.3 percent increase. In addition, infrastructures for 8 irrigation dams were rehabilitated in In 2011, the number of households benefited from improved irrigation infrastructures increased to 440,892 from 351,720 households in 2010, equivalent to 25.4 percent increase. The number of established and registered groups for sustaining irrigation schemes was 250 in 2011 compared to 210 groups in 2010, equivalent to 19.0 percent increase. A total of 350 farmers and 96 agiculture officers in various cadres were trained on appropriate irrigation technology compared to 510 farmers and 30 agriculture offiers trained in Training and Extension Services 241. In 2011, a total of 2,793 new extension officers were recruited by district councils compared to 1,738 officers making a total number of extension officers recruited to be 7,974 compared to 5,181 officers recruited in Out of these, 1,927 extension officers were diploma holders and the remaining hold certificates In 2011, a total of 33 extension officers for demonstration farms from 10 councils of Mara, Mwanza, Kigoma, Kagera, Tabora and Shinyanga regions attended a course on Training of Trainers. Moreover, the Government through Agriculture Program on Enhancing Productivity and Production trained 25 extension officers for rice farming from Igunga, Nzega, Bahi, Bagamoyo, Rufiji, Kilombero, Mvomero, Kilosa, Kahama, Shinyanga, Sengerema, Misungwi, Kwimba, Bukombe, Maswa, Kibondo, Magu, Mbarali, Kyela and Iringa councils., Further, 73 Ward Agriculture Resource Centre WARCs were constructed and 64 rehabilitated in A total of 23,200 farmers were trained through farmer to farmer extension who are continuing to train other farmers on good farming methods. Also, the Government through District Agriculture Development Programs (DADPs) continued to improve extension services where 1,612 motorcycles and 3,389 bicycles were bought; 78 new houses were contructed and 156 rehabilited. Research Activities 243. In 2011, seven new types of seeds for food crops were introduced and approved for use. The new seeds were for three food crops namely Sorghum 133
155 (two types), beans (one type) and cassava (four types). Also, in 2011 the production of breed seeds for production of primary seeds continued, where 12,361 kilograms of cereals and beans were produced as shown in the table below: Table No. 11.4: Production of Breed seeds (Tons) Breed seeds Cereals Beans Oil Cotton *Cassava (stalk) 27.6 (million) - Source: Ministry of Agriculture, Food and Cooperative. *Stalk/stern -Data not availed Agriculture Input Trust Fund 244. In 2011, the Government through the Agriculture Input Trust Fund issued 6 loans for power tillers compared to 30 loans issued in 2010, equivalent to 80 percent decrease. Likewise, 93 loans for tractors were issued in 2011compared to 89 loans in 2010, equivalent to 4.5 percent increase. Also, in 2011 the Government issued 32 loans for farm and livestock inputs compared to 46 loans issued in This decrease was due to budget constraint that led to failure to meet the demands of lodged loans applications. The Government also issued a single loan for irrigation equipment and another loan for value addition in the farm products. Subsidies Provision for Farming Inputs 245. In 2011, a total of 5,340,000 vouchers were distributed basing on national, regional, district and village needs. Subsidies were continued to be provided to 20 regions as in Households benefited from inputs subsidies increased from 1,500,000 households in 2010 to 2,000,000 households in This was a result of increase in farm inputs shops at village level following motivation of agents for farm inputs due to the introduction of voucher system. Likewise, by February 2011, provision of improved seeds was estimated at 27,772.6 tons equivalent to 92.6 percent of annual requirement of 30,000 tons. Also, by February 2011, the availability of fertilizers was 298,453 tons equivalent to 62 percent of the annual requirement of 485,000 tons. The decrease in availability of fertilizers was due to high importation costs, as about 90 percent of the fertilizers in the country are imported. Following the voucher system, productivity in maize production increased. Provision of inputs subsidies is as shown in the table below: 134
156 Table No. 11.5: Provision of Inputs Subsidies Type of Inputs 2007/ / / /11 Fertilizer(MT) 89, , , ,000 Improved Seed (MT) 1,071 7,180 15, ,150 Cashwnuts Pesticides Litres 50,000 and Tons 1,100 Litres 386,649 and Tons 154 Tons 64,000 Tons 64,000 Cotton Pesticides (Acre-pack) 1,200,000 1,200,000 4,653,900 4,653,900 Coffee Seedling 5,000,000 10,000,000 10,400,000 8,226,091 Tea Seedlings 5,000,000 8,112,515 7,700,000 11,481,528 Improved Cotton seed (MT) -Tons 7,180 15,370 Source: Ministry of Agriculture, Food and Cooperative. LIVESTOCK Livestock Production and its Products 246. In 2011, production of beef, mutton, lamb, pork and chicken increased to 503,496 tons from 449,673 tons produced in 2010, equivalent to 10.7 percent increase. The increase was attributed to the increased demand for meat and its products In 2011, the National Ranch Company sold 8,722 beef cattle worth 2.6 bilion shillings compared to 7,597 cattle worth 2.4 bilion shillings in The increase was attributed to establishment of livestock Fattening Program In 2011, milk production in the country increased by 5.2 percent to 1.74 billion litrers from 1.65 billion litres in Out those, 608 million litres were from high breed cows and 1.13 bilion litres were from tradition cows. Further, milk processing increased to 112,400 litres per day in 2011 compared to 105,380 litres processed per day in 2010, equivalent to 6.2 percent increase. In 2011, a total of 150,000 artificial inseminated seeds were produced compared to 110,000 seeds produced in 2010, equivalent to 36 percent increase. Also, a number of inseminated cows increased from 73,900 cows in 2010 to 76,800 cows in 2011, equivalent to 4 percent increase Production of eggs increased from 2.9 bilion eggs in 2010 to 3.34 billion eggs in 2011, equivalent to an increase of 15 percent. In addition, a total of 38.4 million broilers and eggs chicks were produced in the country in 2011 compared to 35.6 chicks produced in 2010, equivalent to 7.9 percent increase. 135
157 250. In 2011, a total of 48.0 tons of hey seeds were produced in Government farms compared to 45.0 tons produced in 2010, equivalent to 6.7 percent increase. Further, the production of hey from Government farms increased by 15.5 percent to 350,000 pallets compared to 303,000 pallets produced in Furthermore, a total of 420,000 hey pallets were produced by private sector compared to 418,831 pallets produced in In 2011, 852,000 tons of different types of animal feeds were produced compared to 801,727 tons produced in 2010, equivalent to 6 percent increase. Product Meat: Beef Mutton/Lamb Pork Chicken Table No. 11.6: Production of Livestock Products Production /Unit Tons Tons Tons Tons ,629 80,936 31,721 77, ,976 81,173 33,307 77, ,178 82,884 36,000 78, ,943 86,634 38,180 80, , ,709 43,647 93,534 % Change Total 370, , , , , Milk: Tradition cows High breed cows Litres(000) Litres(000) 945, , , ,000 1,012, , , ,596 1,135, , Total 1,421,205 1,500,000 1,604,126 1,649,857 1,738, Eggs Total 2,230,900 2,690,000 2,806,350 2,917,875 3,339, Production of Tons , , , Livestock feeds Source: Ministry of Livestock Development and Fisheries 251. In 2011, the number of livestock was estimated at 21.3 milion cows, 15.2 million goats, and 6.4 milioni sheep compared to 19.2 million cows, 3.6 million sheep and 13.7 million goats in Also, the number of pigs was 1.9 million and 58 million chicken as it was in The average annual consumption of livestock products per person is 12 kilograms of meet, 44 litres of milk and 75 eggs. Nevertheles, this consumption is below the World Food Organisation standard of average annual consumption of 50 kilograms of meet, 200 litres of milk and 300 eggs. Trading of Livestock and its Products 252. In 2011, the number of livestock sold in the auction increased to 925,097 cows, 704,987 goats and 168,313 sheep worth billion shillings compared to 857,208 cows, 682,992 goats and 122,035 sheep worth billion shillings in The increase was attributed to improved auction services, increase in demand for beef in urban and specialised markets like supermarkets, hotels and mines cites. 136
158 253. In 2011, a total of 1,041 cattle and 657 worth 9.65 billion shillings were exported to Comoro, Rwanda and Kenya compared to 2,970 cattle and 302 goats worth 2.89 billion shillings exported in Also, a total of 20.3 tons of beef, 286 tons of mutton and 97 tons of lamb valued at 1.6 billion shillings were exported to Oman and Kuwait compared to 36.9 tons of beef, 122 tons of mutton and 34.6 tons of lamb exported to Comoro, Burundi, Oman, Kuwait, United Arab Emirates, Muscat, Malawi, Kenya and Democratic Republic of Congo in In 2011, a total of 2.5 million pieces of cattle hides, 2.4 million pieces of goats hides and 200,000 pieces sheep hides were collected. Out of those, 1,719,506 pieces of cattle hides, 2,111,176 pieces of goats hides and 83,600 pieces of lamb hides worth 17.4 billion shillings were exported compared to 739,315 pieces of cattle hides, 1,900,000 pieces of goats hides and 176,400 pieces of lamb hides worth 8.2 billion shillings exported in In 2011, a number of processed hides increased to 782,447 pieces of cattle hides, 1,535,562 pieces of goats hides and 61,200 pieces of lamb hides worth 10.6 billion shillings compared to 275,000 pieces of cattle hides, 1,440,000 pieces of goats hides worth 6.2 billion shillings in
159 Table No. 11.7: COLLECTION AND EXPORT OF HIDES A. HIDES COLLECTION (pieces) Year Cattle Goat Hides Sheep Hides ValueTshs. 000 Hides ,400, , ,000 4,500, ,400, , ,000 5,500, ,600,000 1,200, ,000 6,500, ,600,000 1,500, ,160 5,500, ,660,000 1,400, ,000 6,800, ,980,000 1,520,000 1,200,000 8,700, ,500,000 1,900,000 1,500,000 13,500, ,650,000 2,990,000 1,250,000 10,900, ,500,000 2,400, ,000 8,500, ,500,000 2,400, ,000 16,100,000 B. EXPORT OF HIDES Year Cattle Goat Sheep Hides ValueTshs. 000 Hides Hides ,200, , ,000 4,000, ,300, , ,000 4,600, ,774,000 1,431, ,000 5,712, ,400,000 1,200, ,155 4,025, ,363,721 1,216, ,770 7,500, ,700,000 1,055, ,530 16,200, ,300,000 1,600,000 1,100,000 21,500, ,668 2,700, ,936 12,800, ,315 1,912, ,400 8,191, ,719,506 2,111,176 83,600 17,400,000 Source: Ministry of Livestock Development and Fisheries,
160 COOPERATIVES AND MARKETING Cooperatives Development 256. In 2011, the Government continued with the implementation of Cooperative Reform and Mordenization Programme in order to enhance the capacity of cooperative unions and enable them to deliver financial service particularly to people in rural areas. The implementation of this program led to the increase in the number of cooperative unions from 9,596 in 2010 to 9,693 unions in In 2011, the number of Savings and Credit Cooperatives Societies (SACCOS) increased to 5,346 from 5,314 in Similarly, the number of SACCOS members increased by 5.7 percent to 970,655 members from 917,889 members in In addition, members shares, savings and deposits increased from billion shillings in 2010 to billion shillings in 2011, equivalent to 68.5 percent increase. Moreover, loans issued to members increased from billion shillings in 2010 to billion shillings in 2011, equivalent to 16.3 percent increase. Table No. 11.8: Trend in Cooperatives Development Type of Cooperative Year % Change SACCOS 5,314 5, AMCOS 2,819 2, Irrigation Cooperative Other Cooperative 1,309 1, Major Cooperative/Apex/TFC Total 9,596 9, Source: Ministry of Agriculture, Food and Cooperative. Trend in Cash Crops Prices 258. In 2011, the average price of mild Arabica coffee in the external market increased to USD 4.38 per kilogram from USD 3.17 per kilogram in 2010, equivalent to 38.2 percent increase. Hard Arabica coffee was sold at USD 2.60 per kilogram from USD 1.95 per kilogram in 2010, equivalent to an increase of 33 percent. On other hand, Robusta coffee was sold at USD 1.52 per kilogram in 2011 from USD 1.25 per kilogram in 2010, equivalent to 22 percent increase. The price of sisal increased from USD 0.91 per kilogram in 2010 to USD 1.26 per kilogram in The average price of tea declined from USD 1.99 per kilogram in 2010 to USD 1.68 per kilogram in
161 Table No. 11.9: Trend of Average Prices for Cash Crops in the world market Year Crop Coffee- Mild Arabica Coffee- Hard Arabica Coffee- Robusta Tea Cotton Sisal Cloves Price (USD /Kg) Source: Ministry of Trade and Market 140
162 DOMESTIC PRODUCTION AND CONSUMPTION OF SUGAR Table No. 35 Season 1 Sugar Cane Sugar Farmers Consumed 3 Public Private Total Price 2 Production Total Kg. per ('000 Tons) ('000 Tons) ('000 Tons) (Shs/Ton) Ton Ton person / / / / / / / / / / / / / / / / / / / / / / / / / / / / / / / / / / Change (%) 09/10-10/ Increase (%) 77/78-10/ Source: Tanzania Sugar Bord 1 Season is between July and June 2 Price is for sugar cane with 10.5% of Sucrose 3 includes sugar transported to Zanzibar 4 For Tanzania mainland.. Not available 141
163 COTTON PROCUREMENT AND LOCAL SALES Table No. 36 Seed Cotton Lint Cotton Season 1 Local Sales Quantity produced (tons) Average Price (Shs/ton) Quantity (Tons) Qty (tons) Average Price (Shs/ton) AR BR Total AR BR AR BR Total Total 2 AR BR 1976/ / / / / / / / / / / / / / / / / / / / / / / / / / / / / / / / / / / Change (%) 09/10-10/ Increase (%) 77/78-10/ Source: Cotton Marketing Board 1 Season is between July and June 2 Total is for AR and BR.. Not available 142
164 TEA CROP AREA, PRODUCTION AND LOCAL SALES Table No. 37 Crop Area Quantity of leaf tea produced (Tons) Price Local 2 Season 1 (Hectars) Ownership (Farms) Zones (Farms) to Farmers Sales Estates Small scale Total Estates Small scale Total North South Total (Shs/Kg) (Tons) 1976/ / / / / / / / / / / / / / / / / / / / / / / / / / / / / / / / / / / Change (%) 09/10-10/ Increase (%) 76/77-10/ Source: Tanzania Tea Authority 1 Season is between July and June 2 Made Tea.. Not Available 143
165 COFFEE PROCUREM ENT AND LOCAL SALES Table No. 38 Coffee Procurem ent (Tons) Price (Shs/kg) Local Sales + Season 1 ARABICA ROBUSTA TOTAL ARABICA ROBUSTA QUANTITY VALUE Mild Hard Mild Hard Raw (Tons) (shs'000) 1976/ / / / / / / / / / / / / / / / / / / / / / / / / / / / / / / / / / / Change (%) 09/10-10/ Increase (%) 76/77-10/ Source: Coffee Marketing Board + Clean Coff ee 1 Season is between July and June 2 Provisional.. Not available 144
166 SISAL PLANTATIONS, PRODUCTION AND LOCAL SALES Table No. 39 Area (Hectares) Sisal Production Local Sales + Quantity Producer Price Quantity Value Season 1 Matured Unmatured Total (Tons) (Shs/ton) (Tons) (Shs. milion) 1977/ / / / / / / / / / / / / / / / / / / / / / / / / / / / / / / / / / Change (%) 09/10-10/ Increase(%) 77/78-10/ Source: Tanzania Sisal Authority + Types of sisal are Line fibre, Tow and Flume Tow 1 Season is betwe en July and June.. Not available 145
167 TOBACCO PROCUREMENT AND LOCAL SALES Table No. 40 Procurement (Tons) Price(shs/kg) Local Sales + Season 1 Flue cured Fire cured Air cured Total Flue cured Fire cured Air cured Quantity (Tons) Value (shs.mil.) Flue cured Fire cured Flue cured Fire cured 1977/ / / / / / / / / / / / / / / / / / / / / / / / / / / / / / / / / / Change (%) 09/10-10/ Increase (%) 77/78-10/ Source: Tobacco Marketing Board + Sales of fire cured and air cured tobacco 1 Season is between April and March - Not Available 146
168 PYRETHRUM PROCUREMENT AND LOCAL SALES Table No. 41 Procurement (Tons) Local Sales - Quantity (Tons) Local Sales - Value (Shs.'000) Season 1 North South Total Price 2 Crude Extract Powder Dry Mack Crude Extract Powder Dry Mack (Shs./kg) 1977/ / / / / / / / / / / / / / / / / / / / / / / / / /03* / / / / / / / / Change (%) 09/10-10/ Increase (%) 77/78-10/ Source : Tanzania Pyrethrum Bord 1 Season is between July and June 2 Price is for grade five only - No local sales * This data is for the period up to December 2002 of the ongoing season 147
169 CASHEWNUTS PROCUREM ENT AND LOCAL SALES Table No. 42 Procurement (Tons) Price (Shs/Kg) Local Sales Season 1 Upper Lower Upper Lower Quantity Value Grade Grade Total Grade Grade (Kg) (Shs.'000) 1977/ / / / / / / / / / / / / / / * / * / * / * / * / * / * / * / * / * / / / / / / /08 89,639 8,633 98, /09 48,633-48, /10 118, , / Change (%) 09/10-10/ Increase (%) 77/78-10/ Source: Cashew Mark eting Board 1 Season is between October and Septem ber - Not available * Not com piled 148
170 Table No. 43 Crop SUMMARY OF MARKETED QUANTITES AND VALUE OF PRINCIPAL CASH CROPS Quantity (Tons) %Change 2002/ / / / / / / / / / /11 Sisal 23,280 26,758 27,794 30,934 33,327 34,057 25,480 24,092 25, Coffee 76,428 38,704 33,891 34,334 54,838 43,524 68,577 34,599 56, Cotton 1 188, , , , , , ,582 54,851 54,809 (0.1) Tobacco 27,872 43,547 47,451 56,464 50,784 55,357 60,741 94, , Pyrethrum ,000 2,800 1,600 1,470 1,600 1,780 1, Tea 2 132, , , , , , , , ,127 (5.0) Cashewnuts 95,000 80,000 71,000 77,446 90,741 98,273 48, ,180 65,892 (44.7) Sugar Cane 1,813 2,342 2,346 2,501 2,041 2,766 2,749 2,569 3, Source: Respective Marketing Boards 1 Seed cotton 2 Green leaves 149
171 CHAPTER 12 NATURAL RESOURCES AND TOURISM Growth Rate 259. In 2011, forestry and hunting sub-activity grew by 3.5 percent compared with 4.1 percent in 2010 and its share to GDP was 2.5 percent compared with 2.4 percent in Forestry and Beekeeping 260. In 2011, receipts from forestry and beekeeping sub-sector was Tshs 18,982.7 million, which was 59.3 percent less when compared with Tshs 46,590.1 million collected in However, this amount does not include revenue collected by Tanzania Forestry Service Agency as opposed to the records of Further, forestry export earnings declined by 7.1 percent from USD 366,768.3 in 2010 to USD 340,810.7 in The decline in export earnings was a result of Government decision to restrict export of raw products especially logs in order to provide room for value addition and expand employment opportunities In order to address climatic change issues, the Government continued to sensitize tree planting activity which is held annually through the National Tree Planting Day Program. In 2010/11, a total of 161,229,951 tree seedlings were planted compared with 205,840,543 seedlings planted in 2009/ In 2011, a total of 10,115,551 various tree seedlings were nurtured and planted in 3,547 hectares of open space and harvested areas compared with 10,278,681 tree seedlings planted in 7, hectares in In addition, a total of 2, hectares of trees were pruned and weeded compared with 15,639.7 hectares in Moreover, a total of 5,641 kilometrers of feeder roads and 5,586 kilometers of fire break roads were created In 2011, an average of 9,000 tonnes of honey worth Tshs 27 billion were produced compared with 9,380 tonnes worth Tshs billion produced in Similarly, a total of 600 tonnes of wax worth Tshs 3 billion were produced in 2011 compared with 625 tonnes valued at Tshs 4.5 billion produced in It is estimated that beekeeping resources have a potential to produce an average of 138,000 tonnes of honey and 9,200 tonnes of wax per year but the actual production is averaged at 6.5 per cent of the country s production capacity In general, an average of tonnes of honey is exported every year. This is only 4 percent of the total honey produced; and the remaining
172 percent is used locally as food, medicine and in the production of refreshments. The quantity of honey exported declined by 20.0 percent from tonnes in 2010 to tonnes in However, export earnings from honey increased from Tshs 1,271.1 million in 2010 to Tshs 2,181.3 million in 2011, equivalent to an increase of 71.6 percent. In addition, total wax exports declined by 6.4 percent from tonnes in 2010 to tonnes in However, export earnings from wax increased from Tshs 3,731.9 million in 2010 to Tshs 3,898.2 million in 2011, equivalent to an increase of 4.5 percent. TableNo.12.1: Exports of Bee Products (Honey and Wax), HONEY YEAR WEIGHT (KG) VALUE (TSHS) WAX WEIGHT (KGS) VALUE (TSHS) , ,348, ,660 1,909,188, ,960 1,199,283, ,154 3,653,036, ,842 1,097,642, ,000 3,525,245, ,825 1,271,121, ,260 3,731,939, ,181,319, ,898,239,826 TOTAL 1,683,982 5,967,713,928 2,025,608 16,717,650,700 Source: Ministry of Natural Resources and Tourism, Forestry and Beekeeping Department 265. In 2011, the Government continued to reinforce patrol groups to protect forest resources from unsustainable harvesting and arrest those who violate Forest Act No. 14 of A total of Tshs 799,276,370.0 were collected from fines and sales of impounded forestry products due to violation of the said Act. Generally, the impounded items declined in 2011 compared with impounded items in The impounded items included: 1,803 bags of charcoal in 2011 compared with 4,899 bags in 2010; a total of 15,034 pieces of timber compared with 26,399 pieces of timber in 2010; 7 bicycles in 2011 compared with 51 bicyles in 2010; 5,140 poles the same as it was in 2010; and 1,348 logs in 2011 compared with 1,052 logs in Wildlife 266. In 2011, the earnings from the wildlife sub sector were Tshs 518,756,355.7 compared with Tshs 313,993,696 in 2010, equivalent to an increase of 65.2 percent. This was attributed to surge in earnings from photographic tourism which grew by percent. However, there was a decrease in earnings from other areas such as hunting tourism, hunting permits, trophy property rights and other fees. This was caused by decline in number of hunting tourists due to security reasons following political 151
173 instability and terrorist threats in some African countries such as Libya, Algeria, Nigeria, Egypt, Somalia, and Kenya as well as the impact of the global economic crisis especially in European and American continents which are major clients in the wildlife subsector. Other reasons include: suspension of export of live animals; shortage of human resources and working tools at revenue collection centres; and increased in human activities in hunting areas such as porching, agriculture, lumbering and animal husbandry. Table No. 12.2: Trends in Earning fromwildlife Sub Sector Description Change( %) Hunting USD tourism 14,704,370 19,760,812 18,444,881 14,443,417 13,375, % USD 1,332,385 2,387,728 2,706,603 2,576,677 7,975, % Photographic TZS tourism 89,729, ,758, ,639, ,704, ,873, % Trophy TZS business licence 189,888, ,084, ,046,203 16,122,000 20,707, % Permits for TZS trophy exports 10,457,500 10,206,000 5,651,750 14,705,750 14,529, % Permits for TZS catching wild animals 74,478, ,476,566 87,559, ,055,190 65,665, % Trophy TZS property rights 2,885,400 2,353,400 1,462,000 2,231,840 1,752, % TZS Other fees 84,703, ,453,174 7,361,669 15,174,066 7,228, % USD 16,036,755 22,148,540 21,151,484 17,020,094 21,351, % Total TZS 452,142, ,332, ,720, ,993, ,756, % Source: Ministry of Natural Resources and Tourism, Wildlife Department 267. In 2011, wildlife subsector continued with its responsibility of ensuring that wildlife resources are protected against poaching and unsustainable harvesting. In 2011, a total of 71,497 patrols were conducted in reserve forests and non reserve areas compared with 77,446 patrols conducted in In addition, a total of 587 cases involving 1,011 suspects were filed in various courts in the country compared with 766 cases with 1,672 suspects filed in 2010, which is equivalent to a decrease of 23.4 percent. Out of those, 321 cases were concluded while 266 cases are ongoing In an effort to protect the lives and properties of the people, against wild and destructive animals, the wildlife sub-sector conducted 2,174 patrols 152
174 in 14 districts mostly affected by destructive wild animals compared with 2,111 patrols in 17 districts in The affected districts are Rombo, Siha, Ngorongoro, Serengeti, Karagwe, Bunda, Biharamulo, Monduli, Babati, Longido, Kondoa, Singida, Nanyumbu and Moshi rural. In addition, to ensure sustainable use of wildlife resources, the Government through Wildlife Department in collaboration with the Wildlifre Research Institute, Tanzania National Parks Authority, and Ngorongoro Crater Conservation Authority continued with the process of conducting wildlife census in the following ecosystem corridors; Selous Niassa, Tarangire Manyara, Ruaha Rungwa, Amboseli- West Kilimanjaro and Selous-Mikumi In 2011, the Government rehabilitated 178 kilometers of roads compared with 100 kilometers rehabilitated in The objective was to improve road infrastructure to ensure that the reserve areas are accessible for patrol purposes, hunting tourism, photographic tourism and so forth. In addition, to ensure community participation in wildlife conservation activities and its environment, the Government allocated Tshs 1,024,656,098 to 36 counsils which have hunting blocks to implement development projects. Moreover, a total of Tshs 200 million were disbursed to 12 wildlife conservation communities which have hunting blocks. Fisheries 270. In 2011, fishing economic activities grew by 1.2 percent compared with 1.5 percent in The slowdown in growth was a result of the use of poor fishing gears, destruction of fish hatcheries and low demand of fish in the world market. The share of fishing activities to GDP was 1.4 percent in 2011 as it was in In 2011, a total of 341,066 tonnes of fish products valued at an average of Tshs 1,198.8 million were harvested compared with 347,156.9 tonnes worth Tshs million harvested in Out of those, a total of 290,474 tonnes equivalent to 85.2 percent worth Tshs 1,031.9 million were harvested from fresh water while the remaining amount was harvested from sea water In 2011, the number of artisanal fishermen increased from 163,601 in 2010 to 177,527 artisanal fishermen. Moreover, fishing vessels increased from 50,001 in 2010 to 55,299 vessels in In addition, a total of 61,215.1 aquarium fish and 37,996.5 tonnes of fish altogether worth Tshs 233,714.6 million were exported and earned the Government a total of Tshs 6,153.3 million from sales levy compared with export earnings of Tshs 263,131.4 million which generated revenue worth Tshs 5,876.1 million in
175 Table No. 12.3: Fish Harvest in 2011 Number Tonnes and value Area Artisanal Vessels Fish (Tonnes) Value (Tshs) Fishermen Lake Victoria 95,303 26, , ,822, Lake Tanganyika 26,612 11,506 31, ,018, Lake Nyasa 5,550 2,632 11, ,044, Lake Rukwa 1,676 1,032 4, ,428, Mtera DAm 2,487 1, ,380, Nyumba ya Mungu 3,466 1, ,375, Dam Other minor water 6,112 2,729 1, ,812, Marine artisanal 36,321 7,664 50, ,954, Total 177,527 55, , ,198,838, Source: Ministry of Livestock Development and Fisheries Table No : Fish Resource Harvesting Fresh water Sea Water Total (Fresh anad Seawater) Year Fisher men Vessels Weight (tonnes) Fisher men Fishin g vessels Weight (tonnes) Fisherm en Fishin g vessels Weight (tonnes ) ,443 32, ,566 29,754 7,190 54, ,197 39, , ,790 44, ,519 29,754 7,190 48, ,544 51, , ,790 44, ,347 36,247 7,489 43, ,037 51, , ,791 44, ,691 36,247 7,489 43, ,038 52, , ,769 45, ,059 36,321 7,664 47, ,090 52, , ,280 42, ,474 36,321 7,664 52, ,601 50, , ,206 47, ,474 36,321 7,664 50, ,527 55, ,066 Source: Ministry of Livestock Development and Fisheries 273. In 2011, the Government continued to control illegal fishing by undertaking land, water and air patrols in the Indian Ocean zone, Lake Victoria, Lake Tanganyika and other lakes along the boarders. During the period under review, a total of 5,792 patrols were conducted countrywide including 2,621 patrols conducted in the coastal zone, 1,962 patrols in the Lake Victoria, and 681 patrols in Lake Tanganyika. The patrols facilitated apprehending of 607 suspects compared with 98 suspects arrested in
176 The suspects contravened various laws including fishing without licences, using various unregistered fishing equipment, doing fishing business without license, dynamite fishing and using prohibited nets. In addition, a total of 32 cases were filed in the court In 2011, the government apprehended and confiscated illegal fishing gears and tools used in illegal fishing including: 802 beach seines; 156,693 metres of synthetic ropes; 11,688 gills nets, 101 saardine nets (under 10 mm), 646 monofilament nets, 59 explosives, 97 diving equipment, 92 arrows, 169 mosquito nets, 77 paddles, 19 ringnets, 113 scoop nets, 25 pieces of detonetors, 119 hooks, 76, sprash, 64 castnets, 81 cars, 11 motorcycles, 343 boats, 12 boat engines and 11 bicycles. Also, 280 kilograms of sea shells, 687 kilograms of fish obtained through explosive fishing, 34,475 kilograms of dry saardines, 460 kilograms of poison fished nileperch, 2000 kilos of seashells, 41,077 kilograms of immature fish, and 3,592 of fresh fish and 1,700 kilograms of dry fish were apprehended In 2011, the Government continued to involve the general public in protecting, managing, and sustainable use of the fishery resources by establishing 729 Participatory Fishery Resource Management Groups. Out of those, 433 groups are in the Lake Victoria zone, 19 in Lake Tanganyika zone, 29 in Mtera dam, 20 in Nyumba ya Mungu dam, 11 in Ruhuhu river, 24 in Kyela district and 167 in the coastal zone. In addition, 24 fisheries resource management plans were prepared in Pwani and Mkinga districts, Mtwara Mikindani Municipal, Mtwara Rural, LindiMunicipal, Lindi Rural, Mkuranga, Bagamoyo and Temeke Municipals. Similarly, fishery resources management by-laws were prepared in 12 villages in Rufiji (6) and Mkinga (6) In 2011, the Government continued to control the quality and safety of fisheries products. During the period, a total of 5,335 inspections were conducted in fish fillet processing industries and storage facilities as well as cars and boats used for fish products transportion compared with 2,222 inspections held in Morever, a total of 1,145 samples of fish products, water and soil were tested in the National Fish Quality Control Laboratory at Nyegezi in Mwanza, Tanzania Bureau of Standards, South African Bureau of Standards and Chemiphar of Uganda to detect and identify harmful bacteria and mineral contents compared with 623 samples tested in Tourism 277. In 2011, the number of foreign tourists increased by 10.9 percent from 782,699 tourists to 867,994 in Those tourists visited various sites and earnings from their activities were USD 1,324.8 million compared to USD 155
177 1,254.5 million earned in 2010, equivalent to an increase of 5.6 percent. The increase in number of tourists and earnings was a result of Government efforts to promote tourist attractions in the country, increase in number of hotels, improved various services provided by tourism agencies and infrustructure in the tourist sector In promoting the available tourist attractions, the Government through the Tourist Board printed 3,000 copies of Tanzania Tourism Directory, 6,000 copies of Tantravel gazette, 30,000 copies of Selling Tanzania and 30,000 copies of CD ROM. In addition, the Government participated in 12 international tourist fairs and continued to gain from internal opportunities such as Sabasaba, Nanenane, and Karibu Fairs and World Tourism Day, to promote local tourism and reduce foreign market dependency In 2011, a total of 1,199,807 tourists visited tourist attractions available in Tanzania National Parks (TANAPA) compared with 671,886 tourists in 2010, equivalent to an increase of 78.5 percent. Out of those, 588,153 were local tourists and 610,729 were foreign tourists. A total of 76,793,343,862.0 shillings was earned in 2011 compared to shillings 69,670,107,884.0 in 2010, equivalent to an increase of 10.2 percent The number of tourists who visited Ngorongoro Conservation increased by 12.4 percent from 523,646 tourists in 2010 to 588,606 tourists in Out of those, 281,513 were foreign tourists and 307,086 were locals. Table No. 12.5: Number of Tourists who visited Ngorongoro conservations in Month Foreign tourists Locals Total January 29,290 26,392 55,682 February 10,451 18,717 29,168 March 18,512 25,871 44,383 April 13,981 19,694 33,675 May 12,387 17,461 29,848 June 22,146 21,602 43,748 July 44,519 29,159 73,678 August 45,462 29,314 74,776 September 29,454 25,319 54,773 October 33,345 25,199 58,544 November 21,045 18,809 39,854 December 26,494 23,983 50,477 Total 281, , ,606 Source: Ministry of Natural Resources and Tourism, Ngorongoro conservation Authority. 156
178 Archives and Antiquities 281. In 2011, a total of 174,953 people visited various archives and antiquities. Out of those, 90,348 were Tanzanians and 84,605 were foreigners. Earnings from archives and antiquities tourism activities were shillings 242,340,630, equivalent to an increase of 4.8 percent compared to shillings 231,825,095.0 in This was attributed to the increase in number of tourists. In addition, following the efforts to promote tourist activities the awareness for Tanzanians to visit historical sites increased. Table No. 12.6: Earnings from Archives and Antiquities in Centre Visitors Foreigners Locals Total Revenue Olduvai George 69,762 29,772 99, ,293,750 Kaole 6,388 28,960 35,348 18,499,800 Isimila ,655,100 Mji Mkongwe 3,182 6,782 9,964 7,276,200 Caravan Serai 973 3,181 4,154 1,496,200 Kalenga ,700 Engaruka* - - Kilwa 1,131 1,269 2,400 2,655,100 Mbozi 121 4,099 4,220 1,496,200 Amboni 1,852 7,893 9,745 7,056,1006, Tongoni ,000 Kunduchi* - - Ujiji 854 7,578 8,432 6,917,500 Kwihara ,700 Makao Makuu** - 6,811, Total 84,605 90, , ,340,630 Source: Ministry of Natural resources and Tourism, Antiquities Department. * Centres which have not started to collect non tax revenues. ** Revenue from research fees on culture and heritage. Table No. 12.7: Revenue from National Archives in 2011 Centre Visitors Foreigners Locals Total Revenue Cultural House 6,564 23,415 29, ,117, Makumbusho village 4,424 19,571 23, ,173, Azimio la Arusha 269 9,497 9,766 10,417, Makumbusho ya Elimu Viumbe 1,935 9,263 11,198 53,064, Mwalimu Nyerere 426 7,912 8,338 30,748, Majimaji wars 40 1,795 1,835 4,119, Total 13,658 71,453 85, ,642, Source: Ministry of Natural resources and Tourism National museum. 157
179 282. In 2011, the Government finalised the document intending to put the central slave trade route in the world heritage and submitted it to the World Heritage Committee.The aim of this process is to map the Route in the world heritage and therefore promote Tanzania in order to benefit from tourist activities. Moreover, in conserving cultural heritage sites, the Government in collaboration with the World Monument Fund continued to rehabilitate the old Kilwa jail and Malindi Mosque in Kilwa Kisiwani with the aim of strengthening and conserving the ruins for tourist attraction The Government developed a software program for records keeping of Archive heritage. Currently, 22 areas for freedom fighters and 9 areas for archives and antiquities in Lindi and Kigoma regions have been put in that program. This will facilitate improvement and conservation of archives and antiquities sites and ensure their proper evaluation The Government returned 7.5 tonnes of archive collections from Kenya National Museum which included stone weapons, human remains and animal bones. These collections are preserved at the National Museum in Dares Salaam, following the completion of the construction of Makumbusho House. The presence of these collections will improve the National Museum and attract more tourists. In 2011, the Government made a research on 3.6 million years old human foot print at Laetoli area in Ngorongoro, Arusha. In addition, in 2011, revenue collections from National Museum attractions amounted to Shillings 526,642,920 compared to shillings 228,953,416 in
180 Table No. 45 TREE PLANTED PER REGION Region 2005/ / / / / /2011 ARUSHA 1,591,934 4,141,250 4,312,043 6,968,417 5,163,971 3,768,491 MANYARA 1,784,543 3,606,308 4,154,855 4,614,004 4,499,801 4,717,730 DAR ES SALAAM 949,844 1,668,801 1,668,800 2,763,392 2,867,313 3,333,545 DODOMA 2,472,127 3,859,176 3,859,180 4,100,000 4,330,000 5,288,000 IRINGA 17,000,000 20,000,000 17,486,732 58,200,000 84,979,626 33,201,257 KAGERA 5,831,745 11,053,410 5,293,435 13,298,266 12,168,342 5,195,720 KIGOMA 1,819,307 2,013,451 2,013,452 1,971,790 1,346,643 2,157,320 KILIMANJARO 3,054,132 6,000,000 4,817,061 3,432,106 5,900,000 4,062,918 LINDI 2,927,204 6,000,000 3,773,313 2,010,000 5,157,600 5,203,325 MARA 6,030,801 5,094,200 5,297,968 6,443,842 5,626,994 5,759,402 MBEYA 4,681,448 11,953,129 5,950,835 10,902,351 11,268,387 11,609,727 MOROGORO 5,295,470 6,467,449 5,862,747 7,411,000 5,928,503 5,678,686 MTWARA 1,845,270 3,186,400 1,713,806 3,678,734 3,565,908 4,867,812 MWANZA 2,439,019 7,730,189 5,084,184 5,309,775 2,690,646 6,250,461 PWANI 2,672,490 4,006,275 5,423,241 8,374,066 2,981,630 11,681,036 RUKWA 3,166,911 3,261,918 3,392,395 6,427, ,855 4,099,613 RUVUMA 3,208,223 6,500,000 4,750,000 7,800,000 9,100,000 9,100,000 SHINYANGA 3,835,080 19,910,981 34,839,431 30,136,031 21,915,690 13,869,405 SINGIDA 357,163 2,128,150 1,830,458 1,498,289 2,033,533 1,953,074 TABORA 3,338,540 4,120,530 3,238,550 5,250,010 7,520,316 2,834,000 TANGA 66,869,301 5,596,002 11,314,395 13,228,156 6,152,785 16,598,429 Total 141,170, ,297, ,076, ,818, ,840, ,229,951 Source: Departments of Forestry and Beekeeping and Environmental Department * statistics not available 159
181 Table No.47 Volume/W Value Volume/ Value Volume/W Value Value Value Volume/W Volume/W eight Weight eight Product (US $ '000) (US $ '000) (US $ '000) eight (US $ '000) eight (US $ '000) Tree logs (teak) Timber (Rough sawn) Ebony Timber Floor Boards Vinyago na Sanaa Sandals Funitures Tannin Mimosa Bark Tree Seeds Tree Plants Tree's Glue Maganda ya miti Majani ya minazi Mikeka Medicine Leaves Mabaki ya mbao za mipingo (off cuts) Mbao za Pallets Nguzo Majani ya mtende Bee Wax Jatropha Oils Sandals Oils Handcrafts Rubber Sandalwood Dusts Nguzo za umeme Total Source: Forestry and Beekeeping Department - Not available EXPORTS OF FORESTRY PRODUCTS
182 Table No. 48 EXPORT OF GOVERNMENT TROPHIES Type of Trophy Unit Birds Number Reptiles Number Other mamals than primates Number Primates Number Amphibians Number Insects Number Source: Wildlife Department
183 EARNINGS FROM TOURIST HUNTING AND EXPORT OF LIVE ANIMALS Table No. 48A Activity Unit 2003/ / / / / / / /11 Tourist Hunting US $ 8,824,305 9,775,749 11,676,847 12,030,510 14,704,370 14,861,740 17,610,454 21,450,234 Export of live animals Shs. 162,103, ,028, ,465, ,686, ,671, ,897, ,790, ,376,980 Source: Wildlife Department NUMBER OF TOURIST HUNTERS Table No. 48B Year Number of Number of Hunters companies Foreign Tanzanians 1994/ / / / / / / / / / / / / / / / / Source: Wildlife Department 162
184 PRODUCTION IN THE FISHERIES SECTOR : Table No. 50 Number Number of Boats Fish catch and Revenues of Artisanal Fresh Sea Total Fresh Waters Marine Waters Total Year Fishermen waters waters Qty (Tons) Value (Shs.) Qty (Tons) Value (Shs.) Qty (Tons) Value (Shs.) ,943 17,744 3,232 20, , ,238, , ,206, , ,445, ,666 16,129 3,232 19, , ,949, , ,227, , ,177, ,516 18,696 3,768 22, , ,805, , ,579, , ,384, ,621 19,208 3,768 22, , ,200, , ,100, , ,300, ,621 19,208 3,768 22, , ,265, , ,350, , ,615, ,672 17,141 5,127 22, , ,486, , ,273, , ,759, ,572 17,141 5,127 22, , ,018, , ,500, , ,518, ,329 25,014 5,157 30, , ,500, , ,180, , ,680, ,266 25,014 4,927 29, , ,108, , ,113, , ,222, ,570 31,849 4,727 36, , ,771, , ,372, , ,143, ,570 31,849 4,927 36, , ,073, , ,489, , ,562, ,514 32,172 4,947 37, , ,743, , ,376, , ,119, ,197 32,172 7,190 39, , ,452, , ,452, , ,905, ,544 44,362 7,190 51, , ,640, , ,077, , ,718, ,037 44,362 7,342 51, , ,525, , ,210, , ,735, ,038 44,832 7,342 52, , ,725, , ,563, , ,289, ,540 48,221 7,943 56, , ,394, , ,633, , ,027, ,206 47,635 7,664 55, , ,844, , ,639, , ,483, ,206 47,635 7,664 55, , ,954, , ,031,883, , ,198,838, Source: Fisheries Department 163
185 EXPORT OF FISH PRODUCTS IN 2011 Table No.51 Products Quantity (KG) Value (FOB) US$ Tsh. ROYALITY - Tsh. Dried Fish Maws , ,804, ,823, Dried Dagaa/L.Vict. 6, ,279, ,485,876, ,973, Dried Fish Chests , , Dried Pelege/L.Vict , ,665, , Dried Dagaa/L.Tang , ,461,968, ,531, Dried Dagaa/ L. Nyasa , ,409, ,048, Dried Dagaa/Marine , ,426, ,059, Dried Fish Offcuts , ,423, ,561, Dried Fish /Kayabo , ,355, ,530, Dried Fish /L.Tang , ,275,725, ,566, Dried Fish belly flaps 18 3, ,530, ,880, Dried Fish Maws , ,480,121, ,321, Fresh Fish Fillets 11, ,909, ,352,314, ,079,448, Dried Furu/ L. Vict. 1, ,270, ,752,970, ,890, Dried Furu/L. Nyasa , ,630, , Dried Pelege/ Mtera dam 2 5, ,304, , Dried Pelege /L.Vict , , Dried Kambare/L.Rukwa ,200, , Dry salted Pelege/ L.Rukwa ,971, ,920,144, ,789, Frozen Fish Fillets 9, ,116, ,953,060, ,790,321, Frozen Fish Maws ,963, ,402,576, ,393, Fish Frames 2, , ,255, ,827, Fish Meal , ,307, ,006, Fish Tissues , , Fresh Fish steak/l.vict , , Fresh Fish Maws , ,035, , Fresh Fish/L. Tang , ,274,855, ,661, Fresh H&G Fish ,177, ,849,259, ,994, Frozen Prawns/ Farmed , ,762, ,735, Frozen Crabs , ,832, ,766, Frozen Cuttle Fish , ,924, ,548, Frozen Fish/whole 26 22, ,586, ,646, Frozen Fish Frames 89 26, ,302, ,179, Frozen Fish belly flaps , ,228, ,059, Frozen Fish Chests , ,023, ,951, Frozen Fish Offcuts , ,169, ,024, Frozen Fish/ marine , ,572, ,497, Frozen H&G Fish 1, ,485, ,935,319, ,051, Frozen Lobster /Tails , ,636, ,080, Frozen Lobster/whole , ,736, ,372, Frozen Octopus ,653, ,233,118, ,613, Frozen Prawns ,321, ,193,092, ,050, Frozen Prawns/ PUD , ,883, ,735, Frozen Squids , ,039, ,789, Live Crabs ,523, ,471,246, ,826, L ive Lobster ,463, ,345,546, ,734, Nile Perch Oil 2.6 5, ,800, , Sea Shells /Cowries , ,627, ,666, Sub Total 37, ,724, ,305,566, ,112,412, Live Fish - No of Pcs Live Aquarium Fish/ L. Nyasa 11, , ,983, ,938, Live Aquarium Fish/L. Tanganyi 49, , ,039, ,926, Grand Total 61, ,973, ,714,590, ,153,278, Source: Ministry of Livestock Development and Fisheries 164
186 SUMMARY OF FISH EXPORT PRODUCTS Table No. 51A Year Quantity Values Duties Kgs T.shs US $ T.shs ,544, ,837,660, ,782, ,513,450, ,098, ,879,810, ,165, ,512,741, ,660, ,836,980, ,523, ,290,218, ,928, ,712,630, ,789, ,687,065, ,725, ,173,638, ,535, ,071,388, ,640, ,999,691, ,451, ,244,333, ,953, ,940,963, ,244, ,981,373, ,352, ,862,401, ,606, ,789,955, ,026, ,922,686, ,761, ,190,356, ,310, ,619,492, ,597, ,142,768, ,495, ,184,661, ,120, ,236,615, ,795, ,211,258, ,272, ,589,576, ,426, ,054,092, ,409, ,629,846, ,148, ,136,908,534, ,730, ,322,405, ,771, ,131,442, ,427, ,876,103, ,723, ,007,537, ,797, ,866,464,635.4 TOTAL 667,602, ,020,283,481, ,671,213, ,944,665,798.2 Source : Fisheries Department TRENDS OF NILE PERCH EXPORTS Table No. 51B Year Quantity Values Duties Kgs T.shs US $ T.shs ,296, ,338,404, ,277, ,185,728, ,075, ,125,889, ,821, ,987,549, ,386, ,258,023, ,727, ,595,481, ,757, ,554,505, ,992, ,257,832, ,831, ,401,237, ,903, ,184,070, ,385, ,179,279, ,212, ,022,462, ,888, ,028,087, ,314, ,560, ,854,517, ,374, ,122,922, ,312, ,356,866, ,261, ,171,324, ,675, ,785,948, ,184, ,419,301, ,472, ,160,190, ,829, ,491,786, ,078, ,242,463, ,422, ,660,034, ,721, ,366,779, ,740, ,412,912, ,308, ,672,111, ,877, ,640,564, ,229, ,012,069, ,666, ,509,670, ,426, ,899,741, ,601, ,299,987,312.2 TOTAL 516,408, ,736,236,115, ,569,209, ,961,632,258.1 Source : Fisheries Department 165
187 NUMBER OF VISITORS, HOTEL BED-NIGHTS AND FOREIGN EXCHANGE EARNINGS Table No. 52 Description Total number of visitors Number of tourists in Hotels Total Earnings( US $ million) Averrage number of bednights per visit Average daily expenditures per tourist Source: Ministry of Natural Resources and Tourism, Tourism Department. 166
188 Table No. 53 Year NUMBER OF TOURISTS AND FOREIGN Number of Tourists EXCHANGE EARNINGS: % Change Foreign exchange earnings (US $ mil.) % Change Source: Ministry of Natural Resources and Tourism 167
189 NUMBER OF TOURISTS VISITED TOURISTS ATTRACTIONS Table No. 55 Name 2006/ / / / /2011 Revenues ARUSHA ,451,848,949 GOMBE ,368,293,648 KATAVI ,345,439,048 KILIMANJARO ,099,305,608 KITULO ,284,568,548 L/MANYARA ,059,330,875 MAHALE ,408,475,248 MIKUMI ,621,683,555 MKOMAZI ,288,300,148 RUAHA ,610,255,452 RUBONDO ,316,033,968 SAADANI ,527,855,052 SAANANE ,271,377,348 SERENGETI ,078,839,451 TARANGIRE ,726,502,122 UDZUNGWA ,335,234,842 Total ,793,343,862 Source: Ministry of Tourism and Natural Resources, TANAPA 168
190 CHAPTER 13 MINING Growth Rate 285. The growth rate of mining and quarrying sub-activity in 2011 was 2.2 percent compared to 2.7 percent in The slowdown in growth was caused by decrease in mineral production in some mines. The share of mining and quarrying sub-activity to GDP was 3.3 percent as it was in Mineral Prospecting 286. In 2011, a total of 6,146 mining and prospective licences were issued compared to 5,416 licences issued in 2010, equivalent to an increase of 12 percent. Mining and Mineral Sales Diamond 287. In 2011, diamond production was 28, carats compared to 80, carats produced in 2010, equivalent to a decrease of 64.1 percent. This was caused by a decrease in production following the continued closure of Wiliamson Diamonds Limited plant which was undergoing major repair. The value of diamond export was USD 7.5 million compared to USD 16.3 million recorded in 2010, equivalent to a decrease of 54.1 percent as a result of decrease in production. Gold 288. In 2011, gold production was 36, kilograms compared to 39, kilograms produced in 2010, equivalent to a decrease of 6.8 percent. This was a result of decrease in production in some major gold mines particularly Tulawaka and Golden Pride Mines due to decrease of ore grade. On the other hand, the value of gold exports increased from USD 1, million in 2010 to USD 1, million, equivalent to an increase of 30.9 percent. Consistent with the increase of the volume of gold exports, the increase in the average price of gold in the world market contributed to the increase of gold export earnings. The average price of gold in the world market increased to USD 1,571.3 per ounce in 2011 from USD 1,224.0 per ounce in Gemstones 289. In 2011, production of gemstones was 1,241, kilograms compared to 1,250,348.4 kilograms produced in 2010, equivalent to a decline of 0.7 percent. The export value of gemstones was USD million (of which USD million was Tanzanite) compared to USD million in 2010 (of which Tanzanite amounted to USD million), equivalent to a 169
191 decrease of 7.6 percent. This was due to significant decrease of the price of Tanzanite (more than 50%) and other gemstones in the world market. Such a fall in price resulted into worsening in gemstones production. Coal 290. In 2011, production of coal was 2, tonnes compared to tonnes in This huge increase was attributed to the resumption of production at Kiwira mine and commencement of coal production at Ngaka mine, which is jointly owned by National Development Agency and East Africa Pacific Corporation. Other Mining 291. In 2011, production of salt was 32, tonnes compared to 34, tonnes produced in 2010, equivalent to a decrease of 6.26 percent. This was due to decrease in production in some companies including Dawson Food Products following fall in demand of its products. In addition, the Kaolin production was 98 tonnes compared to 57.5 tonnes in 2010, equivalent to an increase of 70.4 percent In 2011, production of limestone was 1,082,920.3 tonnes compared to 1,436,594.0 tonnes produced in 2010, equivalent to a decrease of 24.6 percent. In addition, gypsum production was 12,742.1 tonnes compared to 26,918.0 tonnes produced in 2010, equivalent to a decrease of 52.7 percent. The production of tin ore was tonnes in 2011 compared to 2.76 tonnes produced in This was attributed to increase in the price of iron sheets which attracted many miners. The value of Mineral Exports 293. The value of mineral exports in 2011 was USD 1, million compared to USD 1, million in 2010, equivalent to an increase of 27.9 percent. This was a result of increase in the average price of gold in the world market. 170
192 MINERAL PRODUCTION Table No. 56 Mineral Unit * 2011 Diamonds Carats Gold Kgs Gemstones Kgs Salt Ton Phosphate Ton Limestone 000 Ton Tin Ore Ton Gypsum Ton Coal Ton Pozolana Ton Kaolin Ton Silver ore Kgs Copper Pound Bauxite Ton Source: Ministry of Energy and Mineral Resources * Provisional data - Not available Carat = gms 171
193 MINERAL EXPORTS: Table No. 57 Type of mineral Unit Quantity Exported Value ('000US$) ** ** Diamonds (Rough) '000 Carats Diamonds (Cut) '000 Carats Diamonds (Contract goods) '000 Carats Gold '000 Grams Gemstones '000 Grams Salt Ton Phosphate Ton Tin Ton Gypsum Ton Graphite Ton Silver 000grams Copper 0001b Indusrial mineral Ton Bauxite Ton Total ('000 US $) Source: Ministry of Energy and Minerals Resourses, Minerals Department - Not available * Revised Figures 172
194 CHAPTER 14 MANUFACTURING AND INTERNAL TRADE Growth Rate 294. In 2011, the rate of growth of manufacturing activities was 7.8 percent compared to 7.9 percent in The contribution of manufacturing activities to GDP continued to increase to 9.3 percent in 2011 from 9.0 percent in Small Enterprises 295. In 2011, the Government completed the exercise of collecting and analysing the 2011 SMEs Survey baseline. The results of this exercise showed that, there are over 2.7 million entrepreneurs groups compared to 2.0 million in 2010, equivalent to an increase of 35.0 percent. Among these groups, more than 98 percent are in the informal sector. Further, results of the survey indicated that the contribution of trade, and small and medium enterprises sector to the GDP increased from 30 percent in 2010 to 35 percent in The survey also indicated that this sector created employment for 5.1 million people. Production Costs 296. In 2011, cost of production in the industrial sector increased to shs. 2,914,708 million from shs. 2,081,934 million in 2010, equivalent to an increase of 40 percent. This was attributed to increased production costs of food, beverages, tobacco, steel, cigarettes and chemicals following high inflation and unreliable electricity. Production in Selected Industries 297. In 2011, production in selected industries such as konyagi, cigarettes, sisal ropes, clothings, chibuku, beers and steels increased. The increase was attributed to the increased demand for these products in the local market. Production of Konyagi increased by 11.2 percent from 11,186,000 litres in 2010 to 12,437,000 litres in Further, production of Chibuku increased by 15.9 percent from 21,037,000 litres in 2010 to 24,391,000 litres in Furthermore, production of iron sheets increased by 0.8 percent from 71,276 tonnes in 2010 to 71,881 tonnes in The production of wheat flour increased from 444,242 tonnes in 2010 to 445,227 tonnes in 2011, equivalent to an increase of 0.2 percent. Similarly, production in breweries increased from 243 million litres in 2010 to 305 million litres in 2011, equivalent to an increase of 25.7 percent. The production of cigarettes increased by 6.3 percent from 6,181 million cigarettes in 2010 to 6,569 million cigarettes in Production in hide processing industries increased from 39.7 million square feet in 2010 to 40.2 million square feet in 2011, equivalent to an increase of 1.3 percent. 173
195 299. The production in textiles increased from 103,177,000 square metres in 2010 to 111,243,000 square metres in 2011, equivalent to an increase of 7.8 percent. Moreover, production of iron increased from 33,384 tonnes in 2010 to 34,881 tonnes in 2011, equivalent to an increase of 4.5 percent. Further, the production of sisal ropes increased from 6,872 tonnes in 2010 to 7,091 tonnes in 2011, equivalent to an increase of 3.2 percent. Furthermore, production of other goods in 2011 was: 15,068 tonnes of maize, 201,766 tonnes of sugar, 158,956 tonnes of soap, and soft drinks 497,189,000 litres. Internal Trade 300. In 2011, the rate of growth of trade activities decreased slightly by 8.1 percent compared to 8.2 percent in 2010, whereas trade activities include wholesale trade, retail and repairs. Moreover, the contribution of trade activities to the GDP was 12.2 percent in 2011 compared to 12.1 percent in International Trade Fair 301. In 2011, countries that participated in the Dar es Salaam International Trade Fair at the Mwalimu J. K. Nyerere grounds were 17, which was the same as that of the year Further, foreign companies that participated were 141 compared to 350 companies in 2010, a decrease of 209 foreign companies. This decrease was attributed to the effects of the global economic slowdown and the emergence of political instability in the Arab countries In 2011, local exhibitors were 1,041 compared to 2,150 exhibitors in 2010, equivalent to a decrease of 759 local exhibitors. The decrease was attributed to countries or companies occupying large areas hence denying space for other participants. However, the number of people who visited the 2011 exhibition increased to 819,273 from 761,601 people in 2010, equivalent to an increase of 7.6 percent. Further, in 2011, the Dar es Salaam International Trade Fair at the Mwalimu J. K. Nyerere grounds reached the highest standards of international quality by being awarded a clean certificate from the Federation of the World Trade Fair (UFI) In 2011, the Ministry in collaboration with Tanzania Trade Development Authority (TanTrade) sensitized entrepreneurs to participate in the International Exhibition of Dar es Salaam and Sectoral Exhibition. In addition, the Ministry encouraged and facilitated entrepreneurs to participate in various international exhibitions such as the Nairobi International Trade Fair; African Commodity Exhibition Yiwu, China; International Exhibition of Mozambique; Malawi International Exhibition; and the EXPO 2010 Exhibition held in Shanghai, China. 174
196 PRODUCTION AND CONSUMPTION OF CEMENT Table No.58 Tons Year Imported Exported Production Consuption % change * Source: National Bureau of Statistics *Provisional 175
197 Table No.59 PRODUCTION IN SELECTED INDUSTRIES % Change Items Unit /11 Biscuits Ton Wheat flour Ton Konyagi 000 Ltr Beer 000 Ltr Chibuku 000 Ltr Cigarrettes Million Textiles 000m Sisal Ropes Ton Fish nets Ton Canvas 000 m Wood products 000 Ton Pyrethrum product 000 Ton Fertilizer 000 Ton Paints 000 Ltr Petroleum products 000 Ton Cement 000 Ton Iron sheets Ton Corrugated iron Ton Aluminium Ton Radio 000 Number Batteries Million Source: National Bureau of Statistics - No production 176
198 Table No. 60 ISIC (Rev 3) Employees Others Total * 2010** 2011** * 2010** 2011** * 2010** 2011** Food processing Beverages Tobacco and Cigarettes ,181 Textile Manufacturing Skins and Skins products Shoes Timber and timber products Manufac. of paper product, printing Manufacturing of chemical Rubber products Maufac. of plastic products Manufacturing of nonmetallic products Others Total Source: National Bureau of Statistics * Revised Figures ** Estimates Formal Industries are those with 10 employees and more Note Activities 1. The survey use "International Standard Industrial Classification Revision 3 (ISIC Rev3)" data are revised INDUSTRIES - ESTIMATED NUMBER OF EMPLOYEES data are estimates from 2008 and 2009 data and quarterly Survey 177
199 Table No. 61 ISIC (Rev 3) (Sh.million) Salaries Other Payments Total * 2010** 2011** * 2010** 2011** * 2010** 2011** Food Processing Beverages , Tobacco and Cigar ettes Textile Manufacturing Skins and skins products Shoes Timber and timber products Manuf. of paper products, printing Manufacturing of chemical Rubber products Manufacture of plastic products Manufacture of non-metallic products Others Total Source: National Bureau of Statistics * Revised Figures ** Estimates Formal Industries are those with 10 employees and more Note Activities 1. The survey use "International Standard Industrial Classification Revision 3 (ISIC Rev3)" data are revised data are estimates from 2008 and 2009 data and quarterly Survey INDUSTRIES - ESTIMATED LABOUR COSTS 178
200 Table No.62 (Tshs. Millions) Earnings Costs Value Added Depreciation ISIC (Rev 3) Activities * 2010** 2011** * 2010** 2011** * 2010** 2011** * 2010** 2011** Food processing Bevarages Tobacco and Cigarettes , 181 Textile Manufacturing Skins and Skins products Shoes Timber and timber products Manuf. of paper products, printing Manufacturing of chemical Rubber Products Manufacture of plastic products Others Manufacture of non-metallic products Total Source: National Bureau of Statistics * Revised Figures ** Estimates Formal Industries are those with 10 employees and more Note 1. The survey use "International Standard Industrial Classification Revision 3 (ISIC Rev3)" data are revised data are the estimates from 2008 and 2009 data and quarterly Industries Summary Statistics 179
201 Table No.63 Number of Workers Permanent Employees Salaries (TShs. Million) Gross Value Added (Tshs. Million) * 2010** 2011** * 2010** 2011** * 2010** 2011** * 2010** 2011** Dodoma Arusha, Manyara Kilimanjaro Tanga Morogoro Pwani, Dar es Salaam, Cost Lindi Mtwara Ruvuma Iringa Mbeya Singida Tabora Rukwa Kigoma Shinyanga Kagera Mwanza Mara Jumla Source: National Bureau of Statistics * Revised Figures ** Estimates Formal Industries are those with 10 employees and more Note Region 1. The survey use "International Standard Industrial Classification Revision 3 (ISIC Rev3)" data are revised INDUSTRIES: REGION SUMMARIES data are estimates from 2008 and 2009 data and quarterly Survey 180
202 PERFORMANCE INDICATORS IN THE MANUFACTURING ACTIVITIES Table No. 65 % Contribution Growth in % Contribution % Contribution % Change Year to GDP manufacturing Activites to Total Exports to Non-traditional in industrial (at 2001 prices) (at 2001 prices) Exports Exports % % % % % % % % % % % % % Source: Ministry of Finance 181
203 .CONSTRUCTION Growth Rates CHAPTER 15 CONSTRUCTION AND LAND DEVELOPMENT 304. In 2011, the growth rate of construction sub-activity was 9.0 percent compared to 10.2 percent in The slowdown in growth was mainly due to a decline in construction and rehabilitation activities of roads and bridges, as well as transport activities and land development. In addition, the share of construction sub-activity to GDP was 8.0 percent as it was in Road Network 305. Tanzania has a total of 86,472 kilometres of road network. Out of those, 12,786 kilometres are trunk roads which connect Tanzanian regions and neighbouring countries, including 5,478 kilometres equivalent to 43 percent of tarmac roads. In addition, 21,105 kilometres are regional roads which connect districts and major towns, of which 840 kilometre, equivalent to four percent, are tarmac road. Moreover, 52,581 kilometres are districts roads which connect districts and villages and feeder roads In 2011, a total of 29,369 kilometres of roads was assesed. Out of those, 5,727 kilometres of trunk roads, equivalent to 59.1 percent were in good condition compared to 8, kilometres, equivalent to 65 percent in This means that the quality of roads decreased by 5.9 percent in A total of 3,096 kilometres of trunk roads, equivalent to 32 percent were in fair condition compared to 3, kilometres, equivalent to 28 percent in In addition, a total of 862 kilometres, equivalent to 9 percent were in bad condition compared to kilometres, equivalent to 7 percent in In 2011, a total of 5,976 kilometres of regional roads, equivalent to 30.4 percent were in good condition compared to 11,012 kilometres in 2010 which was equivalent to 53.3 percent. In addition, a total of 10,284 kilometres of regional roads, equivalent to 52.2 percent were in fair condition compared to 7, kilometres in 2010, equivalent to 34.2 percent. Moreover, a total of 3,424 kilometres, equivalent to 17.4 percent were in poor condition compared to 2,592 kilometres in 2010, equivalent to 12.5 percent. Table 15.1 shows the condition of road network up to December
204 Table No. 15.1: Condition of Road Network as of end December, 2011 Road Type Good Fair Poor Total Km % Km % Km % Km Trunk Roads Tarmac 4, ,546 Gravel Roads 1, , ,139 Sub-total 5,727 3, ,685 Regional Roads Tarmac Gravel/Earth Roads 5, , , ,871 Sub-total ,284 3,424 19,684 Grand Total 11,703 13, ,369 Source: Ministry of Works Roads and Bridges Maintenance 308. In 2011, the Government through Tanzania Roads Agency (TANROADS) rehabilitated a total of 28,647 kilometres of regional and trunk roads and 2,480 bridges. A total of shilling billion, equivalent to 67 percent of the approved budget, was used for rehabilitation. Road Board Fund 309. In 2011, the Road Board Fund collected a total of shilling billion compared to shilling billion collected in 2010, equivalent to an increase of 44.5 percent. The increase was a result of measures taken to control fuel adulteration which would otherwise lead to reduction of fuel levy. Further, the Government continued to monitor Fund s expenditure by undertaking technical and financial auditing on road projects in order to ensure value for money. In doing so, the Board initiated a system of using local consultants in undertaking technical and value for money auditing during the implementation of development projects. Contractors Registration Board 310. In 2011, the Contractors Registration Board continued to register contractors who comply with stated standards and adhere to public safety. In addition, the Board continued to implement the five years Strategic Plan ( ) focusing on increasing efficiency in four major areas, namely: ethics in construction sector particularly contractors business; contractors capability and competence; safety to workers in working places and public at large; and efficiency of the Board. 183
205 311. In 2011, the Board registered 863 new contractors compared to 860 contractors registered in In addition, in 2011, the Board inspected 2,760 construction projects compared to 2,112 projects inspected in Out of the inspected projects in 2011, a total of 1,912 projects were free from defects while 848 projects were found to have various defects such as non adherence to health and work safety issues. Necessary legal measures were taken against contractors whose projects were found to have defects In 2011, the Board conducted contractors training in Shinyanga, Rukwa, Dar es Salaam, and Mtwara regions whereby a total 287 participants attended. Further, the Board conducted stakeholders consultative meetings in collaboration with Engineers Registration Board and Architects and Quantity Surveyors Registration Board which were held in Dar es Salaam. Furthermore, the Board conducted technological, equipment and construction services exhibition in Dar es Salaam and was attended by 2,500 participants compared to 1,231 participants who attended the same exhibition in Out of those, over 900 participants were contractors. Moreover, in 2011, the Government started preparation of a special strategy to enhance capacity of local contractors in order to increase their capability of undertaking large infrastructure projects. Engineers Registration Board 313. In 2011, Engineers Registration Board registered 1,017 engineers from various cadre and 41 consulting engineers firms, compared to 582 engineers and 14 consulting engineers firms registered in Likewise, the Board continued to establish more regional consulting engineers firms. Generally, the Board performed well in registration issues. Table No. 15.2: Registration of Engineers ( ) Types of Registration Registered Registered Registered Change in 2009 in 2010 in 2011 (%) Graduate Incorporated Engineers: (GIE) Incorporated Engineers (IE) Graduate Engineers: (GE) Professional Engineers (PE) Temporary Professional Engineers (TPE) Consulting Engineers: (CE) Temporary Consulting Engineers TCE Local Engineering Consulting Firms (LECF) Foreign Engineering Consulting Firms (FECF) TOTAL , Source: Ministry of Works 314. In 2011, the Board coordinated implementation of practical training program for 899 graduate engineers. Statistics for graduate engineers who 184
206 joined the practical training program in 2002/ /11 are shown in table No Table 15.3 Graduate Engineers from Practical Training Program (2002/ /11) Year Joined Engineers Financed by the Government Financed by their employers Engineers completed training Employed before completed Postponed Engineers 2002/ / / / / / / / / Total Source: Ministry of Works Architects and Quantity Surveyors Registration Board 315. In 2011, the Architects and Quantity Surveyors Registration Board registered 17 architects and 14 quantity surveyors compared to 20 architects and 13 quantity surveyors registered in This registration is equivalent to an increase of 31 professionals which makes a cumulative number of technicians registered by the Board to be 520. In addition, the Board registered 13 architect companies and 7 quantity surveyor companies in 2011 compared to 13 architect companies and 8 quantity surveyor companies registered in This is equivalent to an increase of 20 companies which make a cumulative number of 259 companies registered In 2011, the Board registered 39 quantity surveyors and architects who are in middle cadre compared to 8 technicians registered in This increase makes the total number of middle cadre technicians registered by the Board to be 105 in The increase in registration was a result of Government efforts to encourage graduate engineers with relevant qualifications to adhere to Act No. 4 of 2010 which requires them to be registered by the Board. In addition, implementation of Enhanced Articled Pupilage Programme which is financed by the Government for both cadres resulted in to an increase of qualified graduates registered by the Board In 2011, the Board deregistered one architecture, one quantity surveyor and one architect firm, all of which were foreign, following the completion of their registered projects. Likewise, inspection of buildings was carried out in 185
207 19 regions of Tanzania mainland. In that process, 1,196 building projects were inspected compared to 1,296 projects inspected in National Building Council 318. In 2011, the National Building Council conducted training to 250 stakeholders on tender issues; contract management and claims on road construction costs; repair and rehabilitation of buildings; and disputes resolutions. In addition, technical audit of 100 construction projects worth shilling 5.5 billion was conducted in 20 district councils. The shortcomings revealed from the audit include improper use of project s contracts during its implementation; non adherence to the PPRA Act No.21 of 2004 and poor project management. Tanzania Building Agency 319. In 2011, the Tanzania Building Agency continued to manage various projects of constructing residential houses for Honorable Judges in Ruvuma, Dar es Salaam, Tanga, Arusha, Tabora, Mwanza, Mbeya and Dodoma regions. Likewise, the Agency continued to build residential houses for District Commissioners in Bariadi, Urambo and Siha as well as construction of residential houses for other Government leaders in Kasulu district and Kagera, Kilimanjaro, Mtwara, and Iringa regions. Further, the Agency managed 94 projects in different regions whereby a total of shilling 917,148,903.0 were collected. However, the pace of constructing civil servants houses was not satisfactory due high cost of plots; lack of supportive infrastructures in respective plots; and high construction cost. Tanzania Electrical, Mechanical and Services Agency 320. In 2011, Tanzania Electrical, Mechanical and Services Agency maintained 5,137 cars, equivalent to 58 percent of the target of maintaining 8,822 cars per year. The under performance was due to higher cost of spare parts and machines. In addition, the Agency implemented 126 electrical projects, 4 electronics projects, 26 ices and air condition projects and 37 consulting projects in LAND DEVELOPMENTS Village Survey 321. In 2011, a total of 261 villages were surveyed compared to 1,207 villages surveyed in The decrease was due to the completion of surveying excercise for 11,000 villages that were registered up to Therefore, the surveyed villages in 2011 were due to the fact that villages were devided more than once, thus making the total number of surveyed villages to be 11,
208 Table No. 15.4: Number of Villages Surveyed Districts Number of Villages surveyed in 2010 Districts Number of Villages surveyed in 2011 Singida Rular 35 Bariadi 99 Bahi/Chamwino 54 Meatu 29 Tarime 39 Maswa 52 Rorya 63 Kishapu 46 Sengerema 23 Korogwe 35 Muleba Misenyi Karagwe Ngara Kigoma Rural 21 - Kahama Bariadi Tabora Rural Babati 5 - Kilosa/Mahenge Shinyanga Rular/Kishapu Total 1, Source: Ministry of Land, Housing and Human Settlement Development Inspection and Review of Title Deeds 322. In 2011, a total of 3,535 title deeds were reviewed compared to 4,317 title deeds reviewed in During the review process, a total of 58 land disputes were reported whereby 46 land disputes (79 percent) were resolved at administratively and 12 disputes were not resolved and the concerned people were advised to seek court resolution. In addition, a total of 950 title deeds were transferred after following legal procedures. Issuance of Village Land certificates and Customary Title Deeds 323. In 2011, out of the surveyed villages, 3,283 village land certificates were issued compared to 3,265 certificates in 2010, thus making cumulative registered certificates to be 7,510. In addition, a total of 46,063 customary title deeds were issued compared to 93,400 customary title deeds issued in 2010, making a total of 157,968 customary title deeds issued all over the country. The decreased in the number of customary title deeds issued was due to the fact that, significant work was done in 2010 in the pilot project areas. 187
209 Moreover, 23 land offices registrars were established and make a total of 408 registrar offices throughout the country in Table Na. 15.5: Village Land Certificate and Customary Title Deeds Issued in Regions Village Land Certificate Customary Title Deeds Coast 269 4,654 Morogoro Dodoma Singida 368 6,428 Mtwara Lindi Kagera Shinyanga ,668 Tabora Mwanza Mara Kigoma Kilimanjaro Arusha Tanga 361 2,057 Manyara ,526 Mbeya ,467 Iringa ,265 Rukwa Ruvuma 262 6,297 Total 7, ,692 Source: Ministry of Land, Housing and Human Settlement Development Title Deeds Issuance 324. In 2011, the Government registered a total of 26,880 title deeds compared to 21,170 title deeds registered in In addition, during the period, a total of 28,572 documents were registered under the Land Registration Act (No. 334); 7,449 documents were registered under the Registration of Documents Act (No.117); and 600 documents under the Registration Procedures for Movable Asset Act (No. 210). 188
210 Table Na. 15.6: Title Deeds Issuance in 2010 and 2011 Office Title Deeds 2010 Title Deeds 2011 Eastern Zone (Dar es Salaam) 15,561 7,948 Lake Zone (Mwanza) 1,961 6,300 Southern- North Zone (Mbeya) 1,223 4,544 Northern Zone (Moshi) 1,400 5,400 Central Zone (Dodoma) 600 1,551 Southern Zone (Mtwara) 425 1,137 Total 21,170 26,880 Source: Ministry of Land, Housing and Human Settlement Development Aquatic Land Survey 325. In 2011, the aquatic land mark and symbols in the coastal areas of Tanzania were inspected. The completion of this inspection will facilitate accurate surveys of marine areas which include shallow and deep water areas as well as Marine Economic Zone. Surveyed Farms and plots 326. In 2011, a total of 26,788 plots and 706 farms were surveyed compared to 37,820 plots and 600 farms in 2010, as it is shown in Table
211 Table No. 15.7: Total Number of Surveyed Plots and Farms Title Deeds issued 2010 Title Deeds issued 2011 Regions Plots Farms Plots Farms Arusha 1, , Coast 2, , Dar es salaam 8, ,425 0 Dodoma Iringa 3, , Kagera 1, Kigoma Kilimanjaro 2, , Lindi Manyara 1, ,075 2 Mara Mbeya 1, , Morogoro , Mtwara ,612 2 Mwanza 6, , Rukwa Ruvuma Shinyanga 1, Singida Tabora 1, Tanga 1, , Total 37, , Source: Ministry of Land, Housing and Human Settlement Development Land and House District Councils 327. In 2011, Land and House District Councils continued to resolve 13,203 land and house disputes that existed since 2010 and 12,643 other disputes reported In addition, in 2011 a total of 10,092 disputes were resolved and 15,754 disputes are pending resolution. 190
212 Table No. 15.8: Land and House Disputes Resolution Councils Reported Disputes up to June 2010 Reported Disputes from July 2010 to June 2011 Resolved Disputes From July 2010 to June 2011 Disputes Pending resolution up to June 2011 Arusha Babati Bukoba Dodoma Ilala ,038 Iringa Kigoma Kinondoni 1, ,234 Lindi Mbeya Morogoro Moshi Mtwara Musoma Mwanza 1, ,798 Pwani Rukwa Shinyanga Singida Songea Tabora Tanga Temeke 641 1,572 1,039 1,174 Chato Geita Ifakara Karatu Mbinga Njombe Rungwe Same Tarime Simanjiro Kondoa Korogwe Mkuranga Maswa Ukerewe Iramba TOTAL 13,203 12,643 10,092 15,754 Source: Ministry of Land, Housing and Human Settlement Development 191
213 Land Use Plan 328. In 2011, Government prepared land use plans in 158 villages compared to 128 villages in The plans were prepared for Kilosa, Kasulu, Songea, Nanyumbu, Mbarali, Mbozi, Ileje, Kisarawe, Mafia, Muleba, Njombe, Mufindi, Kilolo, Arusha, Kilindi, Handeni, Tanga, Kondoa, Babati, Rufiji, Kilwa, Bariadi and Maswa Councils. The Plans were prepared with the aim of facilitating land users to have sustainable plans that focus on current and future needs. Thus, in preparing those plans, which were participatory, social services areas as well as reserves for water sources, forestry, livestock keeping, wild animals, irrigation and plantations were demarcated. HUMAN SETTLEMENTS AND RURAL DEVELOPMENT National Housing Building Research Agency 329. In 2011, National Housing Building Research Agency continued to undertake research and invent technics of constructing low cost houses that uses local materials. In addition, the Agency continued to provide practical training for construction groups established in villages, wards and Districts. Land Bank 330. In 2011, a total of 106 areas were identified in 11 Councils for investments activities. The Councils and villages inspected were: Tanga, 8 villages; Kisarawe, 15 villages; Kilwa 16 villages; Lindi, 10 villages; Mkinga, 10 villages; Rufiji, 13 villages; Muheza, 3 villages; Morogoro, 9 villages; Chunya, 6 villages; Kilombero, 10 villages; and Iringa, 6 villages. This excercise is the initial stage towards the establishment of Land Bank that will eradicate land disputes in the country between investors and general public. Housing Development 331. Following the approval of Mortgage Finance Act 2008, the Government established Tanzania Mortgage Refinancing Company (TMRC) in 2011 to facilitate provision of low interest long term loans for housing mortgage. The Company extends loans to commercial banks for on-lending to general public at lower interest rates than the existing market rates. Up to April 2012, Banks which bought shares from TMRC were Tanzania Investment bank, Azania Bancorp, Exim Bank, National Microfinance Bank, CRDB Bank and Dar es salaam Community Bank. Those banks have already started to provide low interest housing mortgage In 2011, the Government through National Housing Cooperation (NHC) signed Memorandum of Understanding (MoU) with seven commercial banks which showed willingness to provide loans for buying houses that are built by NHC. Banks which signed the MoU with NHC were: NMB; NBC; Kenya Commercial Bank (Tanzania) Limited; Exim Bank (Tanzania) Limited; 192
214 Commercial Bank of Africa (Tanzania) Limited; Bank of Africa BOA (Tanzania) Limited and Azania Bank (Tanzania) Limited In 2011, NHC completed construction of 86 residential houses for sale. The houses were in: Mbweni JKT - Dar es Salaam (34 houses); Kibla - Arusha (48 houses); and Kiwanya 55 Haile Selasie Arusha (4 houses). In addition, NHC started implementation of projects which have a total of 278 houses and were at different stages of implementation. These projects together with their associated costs and revenue are shown in table In 2010, there were 75 large house construction projects with shop services, residential houses and offices and were at different stages of implementation. Out of those, 15 projects were completed in 2011 and 66 projects are still under implementation. Table No.15.9: Housing Projects for Sale in Costs (Tshs. miln.) Income (Tshs. miln.) Number Number Miradi Actual of of Estimates Expenditure Houses Houses Target Collected Medeli, Dodoma , , , Haile Selasie, Arusha , ,762.0 Ubungo, Dar es Salaam , , ,442.9 Kibla, Arusha , ,132.6 Mbweni JKT, Dar es Salaam , Mchikichini, Dar es Salaam , , Total , , , ,491 Source: Ministry of Land, Housing and Human Settlement Development 193
215 CHAPTER 16 TRANSPORT AND COMMUNICATION Growth Rates 335. In 2011, transport sub-activity grew by 6.7 percent compared to 7.0 percent in On the other hand, communication sub-activity grew by 19.0 percent compared to 22.1 percent in The slow down in growth in transport sub-activity was caused by a decrease in cargo transportation services at Tanga, Mtwara and Kigoma Ports. In addition, the decline in the growth rate of communication sub-activity was caused by a slow down in the pace of investment in communication sector. Transport sub-activity contributed 8.0 percent to GDP in 2011 as it was in 2010, whereby the contribution of communication sub-activity increased marginally to 2.2 percent in 2011 from 2.1 percent in TRANSPORT Road Transport 336. In 2011, Surface and Marine Transport Regulatory Authority (SUMATRA) issued 33,020 licences and 3,923 time tables for commuter buses compared to 31,606 licences and 3,420 time tables issued in 2010, equivalent to an increase of 4.5 and 14.7 percent respectively. In addition, a total of 49,057 licences were issued for cargo transportation compared to 43,363 licences issued in 2010, equivalent to an increase of 13.1 percent. The increase was a result of initiatives taken by the authority to bring license services close to the transporters, as well as the increase in transport facilities. Urban Commuter Services 337. In 2011, commuter buses in urban areas increased by 13.1 percent to 33,020 buses from 31,606 buses in Urbans centers with many commuter buses included Dar es Salaam, Arusha, Kilimanjaro, Mwanza and Mbeya. On the other hand, as of July 2011, Dar es salaam City had a total of 1,568 mini buses compared to 1,747 mini buses in 2010, equivalent to a decrease of 10.3 percent. The decrease of the number of mini buses in Dar es Salaam was a result of measures taken by SUMATRA to restrict renewal and issuance of new licences so as to reduce congestion in the city centre. In addition, during the same period, the number of buses increased to 4,574 from 4,182 buses in July 2010, equivalent to an increase of 9.4 percent. 194
216 Table No. 16.1: Number of Commuter Buses and Trucks in Urban Areas % Change REGIONS Buses Trucks Buses Trucks Buses Trucks Arusha 4,672 4,661 4,878 4, Dar Es Salaam + Pwani 12,644 21,099 11,469 24, Dodoma 1,430 1,265 1,582 1, Iringa 626 1, Kagera Kigoma Kilimanjaro 2,707 2,759 3,160 3, Lindi Manyara Mara Mbeya 1,433 1,748 1,303 1, Morogoro Mtwara Mwanza 2,380 2,946 2,491 3, Rukwa Ruvuma Shinyanga , Singida Tabora Tanga 1,170 2, Total 31,606 43,363 33,020 49, Source: SUMATRA 338. In 2011, there was a total of 23,986 road accidents were compared to 24,665 accidents recorded in 2010, equivalent to a decrease of 2.8 percent. Table No shows the trend of road accidents for the period between 2005 to Table No. 16.2: Road Accidents from 2005 to Number of Accidents Change (%) Source: Traffic Police 16,388 17,039 17,753 20,615 22,739 24,665 23, RAILWAY TRANSPORT 339. In 2011, Tanzania Railways Limited (TRL) and Tanzania and Zambia Railway Authority (TAZARA) recorded strong performance due to improvement in services delivery and increased cargo transportation to and from neighboring countries particularly Zambia and Democratic Republic of 195
217 Congo (DRC). This performance resulted into increase in railway transportation, whereby cargo transportation increased by 2.8 percent and passengers transportation increased by 31.4 percent in Tanzania Railways Limited 340. In 2011, TRL transported 267,008 tonnes of cargo compared to 256,190 tonnes transported in 2010, equivalent to an increase of 4.2 percent. In addition, a total of 519,036 passengers were served by TRL compared to 290,046 passengers in 2010, equivalent to an increase of 78.9 percent. The increase in both passengers and cargo transportation was attributed to the improvement of railway infrastructures compared to 2010 where the company was subjected to suspend its services for more than five months due to heavy rains which started in December 2009 and continued towards early These rains associated with floods which to a large extent affected the railway infrastructures between Kilosa and Msagali. Tanzania and Zambia Railway Authority 341. In 2011, TAZARA transported 533,964 tonnes of cargo compared to 522,966 tonnes transported in 2010, equivalent to an increase of 2.1 percent. On the other hand, passengers served by TAZARA in 2011 were 858,467 compared to 757,987 passengers in 2010, equivalent to an increase of 13.6 percent. The increase in passenger and cargo transportation was attributed to increase in passsengers and cargo transportation to and from Zambia. AIR TRANSPORT Tanzania Airport Authority 342. In 2011, Tanzania Airport Authority (TAA) continued to persue its responsibility of ensuring aviation safety by providing guidelines and undertaking regular inspections. Following such regular inspections undertaken by the Authority during the period under review, the number of incidences and accidents occured decreased to 12 compared to 13 incidences that occured in In 2011, the number of passengers served by airports regulated by TAA was 3,437,608 compared to 3,027,512 passengers in 2010, equivalent to an increase of 13.5 percent. Among them, 1,833,460 were international travellers while 1,604,148 were domestic travellers. In addition, cargo transportation increased from 28,861 tonnes in 2010 to 39,601 tonnes in 2011, equivalent to an increase of 37.2 percent. The increase in number of passengers and cargo transportation was largely contributed by the increase of tourism, investment and business activities, and the introduction of new airline services such as Turkish Airlines and Egypt Air. 196


218 Figure No. 16.1: Number of Passengers Arrived and Departed in the Country Figure No. 16.2: Cargo transported In 2011, SUMATRA inspected 598 small wáter transport vessels and 50 vessels weighing at least 50 tonnes along the coast of Indian Ocean compared to 452 small vessels and 34 vessels weighing at least 50 tonnes inspected in In addition, SUMATRA has been conducting inspections in Lake Tanganyika, Victoria, Rukwa, Nyasa and in dams. In 2011, SUMATRA inspected 3,305 small vessels and 83 vessels weighing at least 50 tonnes in 197
THE ECONOMIC SURVEY 2010
 THE UNITED REPUBLIC OF TANZANIA THE ECONOMIC SURVEY 2010 Produced by: The Ministry of Finance DAR ES SALAAM TANZANIA August, 2011 Printed by KIUTA Dar es Salaam - Tanzania Table of Contents LIST OF TABLES...
THE UNITED REPUBLIC OF TANZANIA MINISTRY OF FINANCE QUARTERLY ECONOMIC REVIEW AND BUDGET EXECUTION REPORT FOR FISCAL YEAR 2013/14 JANUARY MARCH 2014
 THE UNITED REPUBLIC OF TANZANIA MINISTRY OF FINANCE QUARTERLY ECONOMIC REVIEW AND BUDGET EXECUTION REPORT FOR FISCAL YEAR 2013/14 JANUARY MARCH 2014 MAY 2014 SUMMARY In 2013, real GDP grew by 7.0 percent
National Bureau of Statistics Ministry of Finance Dar-es-Salaam
 THE UNITED REPUBLIC OF TANZANIA National Bureau of Statistics Ministry of Finance Dar-es-Salaam October, 2013 PREFACE The publication National Accounts of Tanzania Mainland 2001-2012 is the fifth in the
THE UNITED REPUBLIC OF TANZANIA GUIDELINES FOR THE PREPARATION OF MEDIUM TERM PLAN AND BUDGET FRAMEWORK FOR 2010/ /13.
 THE UNITED REPUBLIC OF TANZANIA GUIDELINES FOR THE PREPARATION OF MEDIUM TERM PLAN AND BUDGET FRAMEWORK FOR 2010/11 2012/13 Part I & II Ministry of Finance and Economic Affairs, P. O. BOX 9111 DAR ES SALAAM.
MONETARY POLICY STATEMENT
 June 2016 a b ISSN 0856-6976 MONETARY POLICY STATEMENT 2016/17 GOVERNOR BANK OF TANZANIA June 2016 c d 7 th June 2016 Hon. Dr. Philip I. Mpango (MP), Minister for Finance and Planning, Dar es Salaam, TANZANIA.
THE UNITED REPUBLIC OF TANZANIA BUDGET FOR FISCAL YEAR 2009/10 APRIL JUNE 2010 AND FULL YEAR BUDGET PERFORMANCE
 THE UNITED REPUBLIC OF TANZANIA BUDGET FOR FISCAL YEAR 2009/10 APRIL JUNE 2010 AND FULL YEAR BUDGET PERFORMANCE MINISTRY OF FINANCE AND ECONOMIC AFFAIRS AUGUST, 2010 EXECUTIVE SUMMARY The preliminary results
MONTHLY ECONOMIC REVIEW
 October 218 a BANK OF TANZANIA MONTHLY ECONOMIC REVIEW October 218 b October 218 October 218 i Contents 1. Inflation and Food Stocks... 1 1.1 Inflation Developments... 1 1.2 Food Stocks... 1 1.3 Prices
MONTHLY ECONOMIC REVIEW
 April 218 a BANK OF TANZANIA MONTHLY ECONOMIC REVIEW April 218 b April 218 April 218 i Contents 1. Inflation and Food Stocks... 1 1.1 Inflation Developments... 1 1.2 Food Stocks... 2 1.3 Prices of Food
KGkh BANK OF TANZANIA MONTHLY ECONOMIC REVIEW
 KGkh BANK OF TANZANIA MONTHLY ECONOMIC REVIEW June 218 Contents 1. Inflation and Food Stocks... 1 1.1 Inflation Developments... 1 1.2 Food Stocks... 1 1.3 Prices of Food Crops... 2 2. Monetary and Financial
EC ONO MI C BU LLE TIN
 BANK OF TANZANIA EC ONO MI C BU LLE TIN FOR THE QUARTER ENDING ECONOMIC SEPTEMBER BULLETIN 2018 VOL. L NO. 3 FOR THE QUARTER ENDING SEPTEMBER 2018 VOL. L NO. 3 For any inquiry please contact: Director
MACROECONOMIC POLICY DEPARTMENT MINISTRY OF FINANCE, PLANNING AND ECONOMIC DEVELOPMENT
 PERFORMANCE OF THE ECONOMY REPORT OCTOBER 2018 MACROECONOMIC POLICY DEPARTMENT MINISTRY OF FINANCE, PLANNING AND ECONOMIC DEVELOPMENT www.finance.go.ug TABLE OF CONTENTS LIST OF TABLES... ii LIST OF FIGURES...
BANK OF TANZANIA. Monthly Economic Review
 BANK OF TANZANIA Monthly Economic Review February 2011 1 TABLE OF CONTENTS 1.0 Inflation Developments... 3 Food Supply Situation... 5 2.0 Monetary and Financial Markets Developments... 6 Money Supply and
PERFORMANCE OF THE ECONOMY REPORT NOVEMBER 2017
 PERFORMANCE OF THE ECONOMY REPORT NOVEMBER 2017 MACROECONOMIC POLICY DEPARTMENT MINISTRY OF FINANCE, PLANNING AND ECONOMIC DEVELOPMENT www.finance.go.ug Table of Contents SUMMARY... 2 REAL SECTOR DEVELOPMENTS...
EC ONO MI C BU LLE TIN FOR THE QUARTER ENDING DECEMBER 2017 VOL. XLIX NO. 4
 EC ONO MI C BU LLE TIN FOR THE QUARTER ENDING DECEMBER 2017 VOL. XLIX NO. 4 BANK OF TANZANIA ECONOMIC BULLETIN FOR THE QUARTER ENDING DECEMBER 2017 VOL. XLIX NO. 4 For any inquiry please contact: Director
QUARTERLY ECONOMIC REVIEW (QER)
") QUARTERLY ECONOMIC REVIEW (QER) Volume 2 No 4 January - March 2018 OBJECTIVES OF THE CENTRAL BANK OF KENYA The principal objectives of the Central Bank of Kenya (CBK) as established in the CBK Act are:
QUARTERLY ECONOMIC REVIEW (QER) Volume 2 No 4 January - March 2018 OBJECTIVES OF THE CENTRAL BANK OF KENYA The principal objectives of the Central Bank of Kenya (CBK) as established in the CBK Act are:
PERFORMANCE OF ECONOMY REPORT December 2017
 PERFORMANCE OF ECONOMY REPORT December 2017 MACROECONOMIC POLICY DEPARTMENT MINISTRY OF FINANCE PLANNING AND ECONOMIC DEVELOPMENT www.finance.go.ug TABLE OF CONTENTS LIST OF ACRONYMS... 3 HIGHLIGHTS...
EC ONO MI C BU LLE TIN
 BANK OF TANZANIA EC ONO MI C BU LLE TIN FOR THE QUARTER ENDING ECONOMIC JUNE 2018 BULLETIN VOL. L NO. 2 FOR THE QUARTER ENDING JUNE 2018 VOL. L NO. 2 For any inquiry please contact: Director of Economic
EC ONO MI C BU LLE TIN FOR THE QUARTER ENDING MARCH 2017 VOL. XLIX NO. 1
 EC ONO MI C BU LLE TIN FOR THE QUARTER ENDING MARCH 2017 VOL. XLIX NO. 1 86 BANK OF TANZANIA ECONOMIC BULLETIN FOR THE QUARTER ENDING MARCH 2017 VOL. XLIX NO. 1 For any inquiry please contact: Director
Monthly Report PERFORMANCE OF THE ECONOMY. May 2017 MACROECONOMIC POLICY DEPARTMENT MINISTRY OF FINANCE, PLANNING AND ECONOMIC DEVELOPMENT
 Monthly Report PERFORMANCE OF THE ECONOMY May 2017 MACROECONOMIC POLICY DEPARTMENT MINISTRY OF FINANCE, PLANNING AND ECONOMIC DEVELOPMENT www.finance.go.ug Table of Contents SUMMARY:... 1 REAL SECTOR DEVELOPMENTS:...
Monthly Report PERFORMANCE OF THE ECONOMY JUNE 2018 MACROECONOMIC POLICY DEPARTMENT MINISTRY OF FINANCE, PLANNING AND ECONOMIC DEVELOPMENT
 Monthly Report PERFORMANCE OF THE ECONOMY JUNE 2018 MACROECONOMIC POLICY DEPARTMENT MINISTRY OF FINANCE, PLANNING AND ECONOMIC DEVELOPMENT www.finance.go.ug Table of Contents SUMMARY... 1 REAL SECTOR DEVELOPMENTS...
MONTHLY ECONOMIC REVIEW
 March 218 a BANK OF TANZANIA MONTHLY ECONOMIC REVIEW March 218 b March 218 March 218 i Contents 1. Inflation and Food Stocks... 1 1.1 Inflation Developments... 1 1.2 Food Stocks... 1 1.3 Prices of Food
THE UNITED REPUBLIC OF TANZANIA QUARTERLY GROSS DOMESTIC PRODUCT OF TANZANIA MAINLAND
 THE UNITED REPUBLIC OF TANZANIA QUARTERLY GROSS DOMESTIC PRODUCT OF TANZANIA MAINLAND National Bureau of Statistics Ministry of Finance Economic Affairs Dar es Salaam May, 2010 Table of Contents 1.0 Introduction...
MONTHLY ECONOMIC INDICATORS
 MONTHLY ECONOMIC INDICATORS April 1 Monthly Economic Bulletin April Table of Contents 1. INFLATION...3 2. MONEY, CREDIT AND INTEREST RATES...7 3. REAL SECTOR INDICATORS...10 4. BALANCE OF PAYMENTS AND
MINISTRY OF NATIONAL PLANNING AND DEVELOPMENT REPUBLIC OF SOMALILAND Central Statistics Department OFFICIAL RELEASE
 MINISTRY OF NATIONAL PLANNING AND DEVELOPMENT REPUBLIC OF SOMALILAND Central Statistics Department OFFICIAL RELEASE Monthly Consumer Price Index September 20 Methodology This publication provides the monthly
To be a World Class Modern Central Bank
 1 Monthly Economic Bulletin June 2018 Table of Contents SYMBOLS... 3 DEFINITIONS... 4 1. INFLATION... 6 2. MONEY, CREDIT AND INTEREST RATES... 10 3. REAL SECTOR INDICATORS... 13 4. BALANCE OF PAYMENTS
ECONOMIC SURVEY 2013 HIGHLIGHTS. Anne Waiguru, OGW Cabinet Secretary Ministry of Devolution and Planning
 ECONOMIC SURVEY 2013 HIGHLIGHTS Anne Waiguru, OGW Cabinet Secretary Ministry of Devolution and Planning Presentation Outline 1. International scene 2. Highlights of the economic performance in 2012 3.
MONETARY POLICY STATEMENT
 ISSN 0856-6976 MONETARY POLICY STATEMENT The Mid-Year Review GOVERNOR BANK OF TANZANIA February 2012 ISSN 0856-6976 MONETARY POLICY STATEMENT The Mid-Year Review GOVERNOR BANK OF TANZANIA February 2012
Camarines Sur Consumer Price Index
 Inflation Rates (in Percent) Camarines Sur Consumer Price Index SR No. - 50 JULY Inflation rate in Camarines Sur increases to 6.4 percent in April The provincial headline inflation rate in Camarines Sur
REPUBLIC OF SOMALILAND MINISTRY OF PLANNING AND NATIONAL DEVELOPMENT Central Statistics Department OFFICIAL RELEASE
 REPUBLIC OF SOMALILAND MINISTRY OF PLANNING AND NATIONAL DEVELOPMENT Central Statistics Department OFFICIAL RELEASE Monthly Consumer Price Index April 2018 Methodology This publication provides the monthly
CALENDAR OF IMPORTANT MONETARY AND ECONOMIC POLICY EVENTS
 CALENDAR OF IMPORTANT MONETARY AND ECONOMIC POLICY EVENTS 1995 Jan: Effective January 2, the Statutory Minimum Reserve (SMR) Requirement was increased from 12.0 percent to 15.0 percent for all deposit
Nauru. Key Indicators for Asia and the Pacific Item
 Key Indicators for Asia and the Pacific 2018 1 POPULATION Total population a as of 1 July ( 000) 10.1 10.1 10.1 9.9 9.7 9.5 9.1 9.2 9.4 9.5 9.7 10.1 10.3 10.8 11.9 12.5 13.0 13.3 Population density (persons/km
MONTHLY ECONOMIC REVIEW
 February 218 a BANK OF TANZANIA MONTHLY ECONOMIC REVIEW February 218 b February 218 February 218 i Contents 1. Inflation and Food Stocks... 1 1.1 Inflation Developments... 1 1.2 Food Stocks... 1 1.3 Prices
QUARTERLY ECONOMIC REVIEW (QER)
") QUARTERLY ECONOMIC REVIEW (QER) Volume 2 No 5 April - June 2018 OBJECTIVES OF THE CENTRAL BANK OF KENYA The principal objectives of the Central Bank of Kenya (CBK) as established in the CBK Act are: 1)
QUARTERLY ECONOMIC REVIEW (QER) Volume 2 No 5 April - June 2018 OBJECTIVES OF THE CENTRAL BANK OF KENYA The principal objectives of the Central Bank of Kenya (CBK) as established in the CBK Act are: 1)
1.0 BANK OF TANZANIA MONTHLY ECONOMIC REVIEW
 1.0 BANK OF TANZANIA MONTHLY ECONOMIC REVIEW April 2016 Contents 1.0 Inflation and Food Supply Situation... 1 1.1 Inflation Developments... 1 1.2 Food Supply Situation... 1 1.3 Prices of Food Crops...
EC ONO MI C BU LLE TIN FOR THE QUARTER ENDING DECEMBER 2018 VOL. L NO. 4
 EC ONO MI C BU LLE TIN FOR THE QUARTER ENDING DECEMBER 2018 VOL. L NO. 4 80 BANK OF TANZANIA ECONOMIC BULLETIN FOR THE QUARTER ENDING DECEMBER 2018 VOL. L NO. 4 For any inquiry please contact: Director
1.0 BANK OF TANZANIA MONTHLY ECONOMIC REVIEW
 1.0 BANK OF TANZANIA MONTHLY ECONOMIC REVIEW October 2016 Contents 1.0 Inflation and Food Supply Situation... 1 1.1 Inflation Developments... 1 1.2 Food Supply Situation... 2 1.3 Prices of Food Crops...
Monthly Report PERFORMANCE OF THE ECONOMY SEPTEMBER 2017 MACROECONOMIC POLICY DEPARTMENT MINISTRY OF FINANCE, PLANNING AND ECONOMIC DEVELOPMENT
 Monthly Report PERFORMANCE OF THE ECONOMY SEPTEMBER 2017 MACROECONOMIC POLICY DEPARTMENT MINISTRY OF FINANCE, PLANNING AND ECONOMIC DEVELOPMENT www.finance.go.ug Table of Contents SUMMARY... 1 REAL SECTOR...
MONTHLY ECONOMIC INDICATORS
 To be a World Class Modern Central Bank MONTHLY ECONOMIC INDICATORS August 2018 1 Monthly Economic Bulletin August 2018 Table of Contents SYMBOLS... 3 DEFINITIONS... 4 1. INFLATION... 6 2. MONEY, CREDIT
SACU INFLATION REPORT. January 2017
 SACU INFLATION REPORT January 2017 The content of this publication is intended for general information only. While precaution is taken to ensure the accuracy of information, the SACU Secretariat shall
ECONOMIC SURVEY 2017 HIGHLIGHTS
 ECONOMIC SURVEY 2017 HIGHLIGHTS PRESENTED BY ZACHARY MWANGI DIRECTOR GENERAL KENYA NATIONAL BUREAU OF STATISTICS 19 TH APRIL 2017 ECONOMIC SURVEY 2017 Outline International scene Highlights of the country's
MONTHLY ECONOMIC INDICATORS
 MONTHLY ECONOMIC INDICATORS May 2018 1 Monthly Economic Bulletin May 2018 Table of Contents SYMBOLS... 3 DEFINITIONS... 4 1. INFLATION... 6 2. MONEY, CREDIT AND INTEREST RATES... 10 3. REAL SECTOR INDICATORS...
MONTHLY ECONOMIC REVIEW
 September 218 a BANK OF TANZANIA MONTHLY ECONOMIC REVIEW September 218 b September 218 September 218 i Contents 1. Inflation and Food Stocks... 1 1.1 Inflation Developments... 1 1.2 Food Stocks... 1 1.3
THE UNITED REPUBLIC OF TANZANIA
 THE UNITED REPUBLIC OF TANZANIA MINISTRY OF FINANCE AND ECONOMIC AFFAIRS BUDGET EXECUTION REPORT FISCAL YEAR 2009/10 JULY DECEMBER 2009 DAR ES SALAM FEBRUARY 2010 SUMMARY The economic performance during
[CAP 208 R.E. 2002] BUSINESS LICENCING ACT MISCELLANEOUS AMENDMENT 2013 FIRST SCHEDULE (Section 8) Kiambatisho I
![[CAP 208 R.E. 2002] BUSINESS LICENCING ACT MISCELLANEOUS AMENDMENT 2013 FIRST SCHEDULE (Section 8) Kiambatisho I](/thumbs/86/94169193.jpg "[CAP 208 R.E. 2002] BUSINESS LICENCING ACT MISCELLANEOUS AMENDMENT 2013 FIRST SCHEDULE (Section 8) Kiambatisho I") THE UNITED REPUBLIC OF TANZANIA [CAP 208 R.E. 2002] BUSINESS LICENCING ACT MISCELLANEOUS AMENDMENT 2013 FIRST SCHEDULE (Section 8) Kiambatisho I S/N COLLUMN I COLLUMN II PRINCIPAL SUBSIDIARY BUSINESS CATEGORY
THE UNITED REPUBLIC OF TANZANIA [CAP 208 R.E. 2002] BUSINESS LICENCING ACT MISCELLANEOUS AMENDMENT 2013 FIRST SCHEDULE (Section 8) Kiambatisho I S/N COLLUMN I COLLUMN II PRINCIPAL SUBSIDIARY BUSINESS CATEGORY
MINISTRY OF PLANNING, INVESTMENT AND ECONOMIC DEVELOPMENT (MOPIED)
") MINISTRY OF PLANNING, INVESTMENT AND ECONOMIC DEVELOPMENT (MOPIED) Directorate of National Statistics STATISTICAL RELEASE MONTHLY REPORT CONSUMER PRICE INDEX February 2018 Executive Summary The All Groups
MINISTRY OF PLANNING, INVESTMENT AND ECONOMIC DEVELOPMENT (MOPIED) Directorate of National Statistics STATISTICAL RELEASE MONTHLY REPORT CONSUMER PRICE INDEX February 2018 Executive Summary The All Groups
The Mid-Year Review 2017/18
 The Mid-Year Review 2017/18 February 2018 a b ISSN 0856-6976 MONETARY POLICY STATEMENT The Mid-Year Review 2017/18 GOVERNOR BANK OF TANZANIA February 2018 c d 6 th February 2018 Hon. Dr. Philip I. Mpango
REPUBLIC OF SOMALILAND
 REPUBLIC OF SOMALILAND Ministry of National Planning & Development Central Statistics Department OFFICIAL RELEASE Monthly Consumer Price Index October 2016 2016 Page 1 of 9 Consumer Price Index (CPI) October,
Inflation rate in Camarines Sur increases to 6.8 percent in September 2017
 Inflation Rate (in Percent) [ Inflation rate in Camarines Sur increases to 6.8 percent in September Date of Release: October 30, Reference No. -83 The provincial headline inflation rate in September increased
MONTHLY ECONOMIC INDICATORS
 MONTHLY ECONOMIC INDICATORS JULY Table of Contents 1. INFLATION... 2 2. MONEY, CREDIT AND INTEREST RATES... 6 3. REAL SECTOR INDICATORS... 9 4. BALANCE OF PAYMENT AND EXTERNAL SECTOR INDICATORS... 10 5.
PRELIMINARY ANNUAL NATIONAL ACCOUNTS 2014
 PRELIMINARY ANNUAL NATIONAL ACCOUNTS 2014 Est. by Statistics Act 9 of 2011 Preliminary Annual National Account 2014 Namibia Statistics Agency 1 MISSION STATEMENT In a coordinated manner we produce and
1 RED September/October 2018 SEPTEMBER/OCTOBER 2018
 1 RED September/October 20 SEPTEMBER/OCTOBER 20 2 RED September/October 20 MAJOR HIGHLIGHTS The country s annual consumer inflation grew by 0.2 percentage points to reach 5.1 per cent in September 20,
2015 ECONOMIC SURVEY REPORT HIGHLIGHTS
 2015 ECONOMIC SURVEY REPORT HIGHLIGHTS Presented by Ms. Anne, Waiguru, OGW CABINET SECRETARY MINISTRY OF DEVOLUTION AND PLANNING 29 TH APRIL 2015 ECONOMIC SURVEY 2015 Outline International scene Highlights
A REVIEW OF BUDGET EXECUTION FOR 2009/10 AND MEDIUM TERM EXPENDITURE FOCUS FOR 2010/11
 A REVIEW OF BUDGET EXECUTION FOR 2009/10 AND MEDIUM TERM EXPENDITURE FOCUS FOR 2010/11 PRESENTED BY MRS. MONICA L. MWAMUNYANGE COMMISSIONER FOR BUDGET 07 TH DEC. 2010 12/20/2010 1 PRESENTATION LAYOUT 1)
MONTHLY ECONOMIC INDICATORS
 MONTHLY ECONOMIC INDICATORS SEPTEMBER 0 Table of Contents 1. INFLATION... 2 2. MONEY, CREDIT AND INTEREST RATES... 6 3. REAL SECTOR INDICATORS... 9 4. BALANCE OF PAYMENTS AND EXTERNAL SECTOR INDICATORS...
MINISTRY OF NATIONAL PLANNING AND DEVELOPMENT REPUBLIC OF SOMALILAND Central Statistics Department OFFICIAL RELEASE
 MINISTRY OF NATIONAL PLANNING AND DEVELOPMENT REPUBLIC OF SOMALILAND Central Statistics Department OFFICIAL RELEASE Monthly Consumer Price Index il 2017 Page 1 of 8 SOMALILAND CONSUMER PRICE INDEX The
16 July BBG Budget Briefing 2015 PwC Insight and Analysis
 BBG Budget Briefing 2015 Insight and Analysis Presenters Rishit Shah Partner Tax rishit.shah@tz.pwc.com Joseph Lyimo Associate Diector Indirect Tax joseph.lyimo@tz.pwc.com Michael Quinton Senior Manager
Major Highlights. Recent Economic Developments April/May Central Bank of Swaziland 1
 Major Highlights Annual consumer inflation increased to 7.0 per cent in April 2017 from 6.0 per cent in March 2017. Inflation rate (% y/y) 7.0 (Apr) Discount and prime lending rates remained unchanged
SACU INFLATION REPORT. December 2017
 SACU INFLATION REPORT December 20 The content of this publication is intended for general information only. While precaution is taken to ensure the accuracy of information, the SACU Secretariat shall not
China, People s Republic of
 1 POPULATION Total population as of 31 December (million) 1,267.4 1,276.3 1,284.5 1,292.3 1,299.9 1,307.6 1,314.5 1,321.3 1,328.0 1,334.5 1,340.9 1,347.4 1,354.0 1,360.7 1,367.8 1,374.6 1,382.7 1,390.1
MONTHLY ECONOMIC REVIEW
 October 217 a BANK OF TANZANIA MONTHLY ECONOMIC REVIEW October 217 b October 217 October 217 i Contents 1. Inflation and Food Stocks... 1 1.1 Inflation Developments... 1 1.2 Food Stocks... 1 1.3 Prices
QUARTERLY ECONOMIC REVIEW (QER)
") QUARTERLY ECONOMIC REVIEW (QER) Volume 3 No 3 July - September 2018 OBJECTIVES OF THE CENTRAL BANK OF KENYA The principal objectives of the Central Bank of Kenya (CBK) as established in the CBK Act are:
QUARTERLY ECONOMIC REVIEW (QER) Volume 3 No 3 July - September 2018 OBJECTIVES OF THE CENTRAL BANK OF KENYA The principal objectives of the Central Bank of Kenya (CBK) as established in the CBK Act are:
Statistical Release Gross Domestic Product Third Quarter 2012
 Statistical Release Gross Domestic Product Third Quarter 01 1.0 Economic performance Kenya s economy exped by.7 per cent in the third quarter of 01 compared.0 per cent growth recorded in the same quarter
June Namibia Consumer Price Index. Tel: Fax:
 Namibia Consumer Price Index N C P I June 2017 Namibia Statistics Agency P.O. Box 2133, FGI House, Post Street Mall, Windhoek, Namibia Tel: +264 61 431 3200 Fax: +264 61 431 3253 Email: info@nsa.org.na
NCPI. March Namibia Consumer Price index. Namibia Consumer Price index - March
 NCPI Namibia Consumer Price index March 2018 Namibia Consumer Price index - March 2018 1 Mission Statement Leveraging on partnerships and innovative technologies, to produce and disseminate relevant, quality,
To be a World Class Modern Central Bank
 1 Monthly Economic Bulletin Table of Contents 1. INFLATION... 2 2. MONEY, CREDIT AND INTEREST RATES... 6 3. REAL SECTOR INDICATOR... 9 4. BALANCE OF PAYMENTS AND EXTERNAL SECTOR INDICATORS... 10 5. DEVELOPMENTS
SACU INFLATION REPORT. February 2018
 SACU INFLATION REPORT February 2018 The content of this publication is intended for general information only. While precaution is taken to ensure the accuracy of information, the SACU Secretariat shall
National Accounts Estimates ( ) March 2018 issue
 March 2018 issue") National Accounts Estimates (2015 2018) March 2018 issue 1. INTRODUCTION This issue of Economic and Social Indicators presents National Accounts estimates for the period 2015 to 2018. Concepts and definitions
National Accounts Estimates (2015 2018) March 2018 issue 1. INTRODUCTION This issue of Economic and Social Indicators presents National Accounts estimates for the period 2015 to 2018. Concepts and definitions
Outline of presentation. National Accounts Office September 2016 Chiba, Japan
 25-27 September 2016 Chiba, Japan National Accounts Office Office of the National Economic and Social Development Board (NESDB) Outline of presentation Short Term Indicator Quarterly Gross Domestic Product
SACU INFLATION REPORT. April 2018
 SACU INFLATION REPORT April 2018 The content of this publication is intended for general information only. While precaution is taken to ensure the accuracy of information, the SACU Secretariat shall not
Gross Domestic Product , preliminary figures for Aruba
 Gross Domestic Product 2000 2006, preliminary figures for Aruba Central Bureau of Statistics Aruba Oranjestad, December 2007 COPYRIGHT RESERVED Use of the contents of this publication is allowed, provided
BUDGET BACKGROUND AND MEDIUM TERM FRAMEWORK 2012/ /15
 BUDGET BACKGROUND AND MEDIUM TERM FRAMEWORK 2012/13 2014/15 Table of Contents List of Tables... iii List of Acronyms and Abbreviations... iv PREFACE... vii Chapter I... 1 BACKGROUND... 1 1.1 Introduction...
SUMMARY OF SELECTED ECONOMIC INDICATORS
 SUMMARY OF SELECTED ECONOMIC INDICATORS RECENT DATA GRAPHS HISTORICAL DATA GRAPHS P.E.I. CONSUMER PRICE INDEX P.E.I. LABOUR FORCE STATISTICS CANADA/P.E.I. GROSS DOMESTIC PRODUCT, INCOME-BASED CANADA /
SACU INFLATION REPORT. January 2018
 SACU INFLATION REPORT January 2018 The content of this publication is intended for general information only. While precaution is taken to ensure the accuracy of information, the SACU Secretariat shall
THE UNITED REPUBLIC OF TANZANIA MINISTRY OF FINANCE AND PLANNING THE BUDGET EXECUTION REPORT FOR THE FOURTH QUARTER AND FISCAL YEAR 2017/18
 THE UNITED REPUBLIC OF TANZANIA MINISTRY OF FINANCE AND PLANNING THE BUDGET EXECUTION REPORT FOR THE FOURTH QUARTER AND FISCAL YEAR 2017/18 Ministry of Finance and Planning, 18 Jakaya Kikwete Road, Treasury
BELIZE. 1. General trends
 Economic Survey of Latin America and the Caribbean 2017 1 BELIZE 1. General trends The Belizean economy experienced a reversal of fortunes in 2016, with growth dropping to -0.8% from 2.9% in 2015. A sharp
National Accounts Estimates ( ) September 2018 issue
 September 2018 issue") National Accounts Estimates (2015 2018) September 2018 issue 1. INTRODUCTION This issue of Economic and Social Indicators presents National Accounts estimates for the period 2015 to 2018. Concepts and
National Accounts Estimates (2015 2018) September 2018 issue 1. INTRODUCTION This issue of Economic and Social Indicators presents National Accounts estimates for the period 2015 to 2018. Concepts and
SACU INFLATION REPORT. February 2017
 SACU INFLATION REPORT February 2017 The content of this publication is intended for general information only. While precaution is taken to ensure the accuracy of information, the SACU Secretariat shall
MONETARY POLICY STATEMENT 2013/14
 ISSN 0856-6976 MONETARY POLICY STATEMENT 2013/14 GOVERNOR BANK OF TANZANIA June 2013 ISSN 0856-6976 MONETARY POLICY STATEMENT 2013/14 GOVERNOR BANK OF TANZANIA June 2013 11 th June, 2013 Hon. Dr. William
Annual National Accounts
 Annual National Accounts 2013 Est. by Statistics Act 9 of 2011 Namibia Statistics National Accounts : 2013 Agency 1 OUR MISSION In a coordinated manner we produce and disseminate relevant, quality and
REPUBLIC OF SOMALILAND
 REPUBLIC OF SOMALILAND Ministry Of National Planning &Development Central Statistics Department OFFICIAL RELEASE Monthly Consumer Price Index September 2016 2016 Page 1 of 9 Consumer Price Index (CPI)
The national monthly CPI (2008=100) increased from per cent in September, 2017 to per cent
 increased from per cent in September, 2017 to per cent") CONSUMER PRICE INDEX (CPI) October, 2017: PRESS RELEASE Released on Monday November 21, 2017 at 1:00 pm OCTOBER 2017 MONTHLY INFLATION RATE INCREASES SLIGHTLY The national monthly CPI (2008=100) increased
CONSUMER PRICE INDEX (CPI) October, 2017: PRESS RELEASE Released on Monday November 21, 2017 at 1:00 pm OCTOBER 2017 MONTHLY INFLATION RATE INCREASES SLIGHTLY The national monthly CPI (2008=100) increased
Viet Nam. Key Indicators for Asia and the Pacific Item
 Key Indicators for Asia and the Pacific 2018 1 POPULATION Total population as of 1 July (million) 77.11 78.12 79.08 80.00 80.95 81.91 82.85 84.22 85.12 86.03 86.93 87.84 88.81 89.76 90.73 91.71 92.69 93.67*
Namibia Consumer Price Index
 Namibia Consumer Price Index June, 2016 Namibia Statistics Namibia Consumer Price Index:June, 2016 Agency 1 OUR MISSION In a coordinated manner produce and disseminate relevant, quality and timely statistics
Republic of South Sudan Ministry of Finance and Economic Planning
 Republic of South Sudan Ministry of Finance and Economic Planning 2015/16 First Quarter Macro-Fiscal Report January 2016 1 Contents 2015/16 First Quarter Overview...3 Summary of Q1... 4 Section 1: Key
CURRENT ECONOMIC CONDITIONS
 Presentation to the FIA CURRENT ECONOMIC CONDITIONS 5 October 2017 Global economic outlook Has improved Global Economy Consolidating Healthy Growth Trajectory Global growth (%) Source: 2017 July IMF World
NCPI. August Namibia Consumer Price index. Namibia Consumer Price index - August
 NCPI Namibia Consumer Price index August 2018 Namibia Consumer Price index - August 2018 1 Mission Statement Leveraging on partnerships and innovative technologies, to produce and disseminate relevant,
SOMALILAND CONSUMER PRICE INDEX
 Methodology This publication provides monthly Consumer Price Indices Composite of Somaliland which is based on two main market baskets of Hargeisa urban households. The current Consumer Price Index was
HONDURAS. 1. General trends
 Economic Survey of Latin America and the Caribbean 2016 1 HONDURAS 1. General trends Economic growth in Honduras picked up in 2015, reaching 3.6%, compared with 3.1% in 2014. This performance was mainly
NCPI. Namibia Consumer Price index. January 2018
 NCPI Namibia Consumer Price index January 2018 Namibia Consumer Price index - January 2018 1 Mission Statement Leveraging on partnerships and innovative technologies, to produce and disseminate relevant,
State of Palestine Ministry of Finance. Fiscal Developments & Macroeconomic Performance: Fourth Quarter and Full year 2013 Report
 State of Palestine Ministry of Finance Fiscal Developments & Macroeconomic Performance: Fourth Quarter and Full year 2013 Report Macro Macro Fiscal Fiscal Unit Unit Oct February,, 2013 2014 Section 1:
Inflation rate in Camarines Sur decreases to 5.1 percent in December 2017
 Inflation Rate (in Percent) [ Inflation rate in Camarines Sur decreases to 5.1 percent in ember Date of Release: January 11, 2018 Reference No. 2018-4 The provincial headline inflation rate in ember decreased
BANK OF TANZANIA ANNUAL REPORT 2008/09
 BANK OF TANZANIA ANNUAL REPORT 2008/09 For inquiries contact: Director of Economic Policy Bank of Tanzania P.O. Box 2939, Dar es Salaam Telephone: (255-22), 223 3328/9, 223 3349/50 Fax: (255-22) 223 4060
THE CBK WEEKLY BULLETIN
 December 30, 20 THE CBK WEEKLY BULLETIN Highlights for the Week Overall 12-month inflation eased from 19.7 percent in November 20 to 18.9 percent in December 20, while annual average inflation rose from
MINISTRY OF FINANCE PLANNING AND ECONOMIC DEVELOPMENT
 MINISTRY OF FINANCE PLANNING AND ECONOMIC DEVELOPMENT QUARTERLY MACROECONOMIC REPORT JULY-SEPTEMBER 2017 MACROECONOMIC POLICY DEPARTMENT Q1 FY 2017/18 1 Table of Contents REAL SECTOR DEVELOPMENTS...7 Economic
Consumer Price Index, August 2012
 Consumer Price Index, August 2012 (Base year 2007) Detailed by: Expenditure groups Household welfare levels Household type September 5, 2012 Issue No. 8 SCAD. Consumer Price Index 2012 1 Table of Contents
Agriculture Marketing Cooperative Societies. Bukoba Water Supply and Sanitation Authority. Cooperative Rural Development Bank
 ACRONYMS: AMCOS BRN BUWASA CBG CBOs CCM CRDB CUF DADG DADPS ELCT HBC HBS HIPC KADETFU KCU KFCB LGTP MKUKUTA MTEF NGOs NHIF NMB NPES NSGRP PEDP PRSP RWSSP Agriculture Marketing Cooperative Societies Big
Federal Republic of Somalia Ministry of Planning, Investment and Economic Development Directorate of National Statistics CONSUMER PRICE INDEX
 Federal Republic of Somalia Ministry of Planning, Investment and Economic Development Directorate of National Statistics CONSUMER PRICE INDEX October 2018 Executive Summary The All Groups CPI was 111.62
The annual CPI increased in Juba by 107.9% and in Wau by 115% from December 2014 to December 2015.
 THE REPUBLIC OF SOUTH SUDAN NATIONAL BUREAU OF STATISTICS (NBS) Press release 8 th Jan 16 Consumer Price Index for South Sudan ember The South Sudan annual Consumer Price Index (CPI) increased by 19.9%
CONSUMER PRICE INDEX
 1. INTRODUCTION CONSUMER PRICE INDEX (Base period: July 2006 June 2007 = 100) Year This issue of Economic and Social Indicators presents the Consumer Price Index (CPI) for the year. The methodology used
CONTENTS COMMENTARY CHARTS TABLES GLOSSARY. Section 1: Headline Inflation Section 2: Core Inflation
 COMMENTARY CONTENTS Section 1: Headline Inflation Section 2: Core Inflation CHARTS 1. National Rates of Inflation, January 2010 April 2013 2. Monthly Changes in the Cost-of-Living Index, January 2010 April