BANK OF TANZANIA. Monthly Economic Review
|
|
|
- Mervin Ryan
- 5 years ago
- Views:
Transcription

1 BANK OF TANZANIA Monthly Economic Review February
2 TABLE OF CONTENTS 1.0 Inflation Developments... 3 Food Supply Situation Monetary and Financial Markets Developments... 6 Money Supply and Credit Developments... 6 Interest Rates Developments... 9 Financial Markets Developments Government Budgetary Operations External Sector Performance Balance of Payments World Commodity Prices National Debt Developments Economic Developments in Zanzibar Inflation Developments Fiscal Performance External Sector Performance STATISTICAL TABLES Glossary
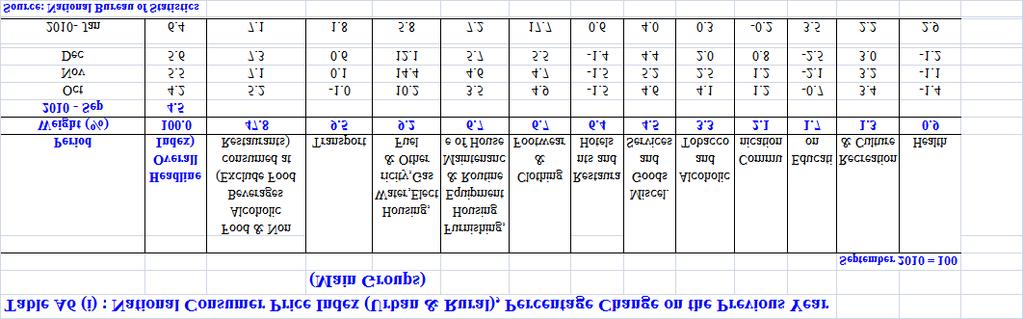
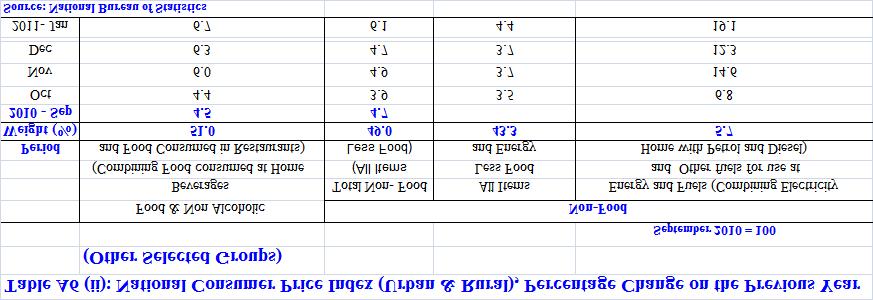
3 1.0 Inflation Developments Annual headline inflation rate increased to 6.4 percent in January 2011 from 5.6 percent in December 2010 mainly due to rise in food and non food inflation. Month-to-month headline inflation rate also, went up to 2.4 percent in January 2010 from 1.5 percent recorded in December Annual inflation for food and non-alcoholic beverages group (combining food consumed at home and in restaurants) increased to 6.7 percent in January 2011 from 6.3 percent in December Similarly, month-to-month food inflation rose to 2.9 percent in January 2011 from 0.5 percent recorded in the preceding month. Food items that contributed to the increase of the index include bread and cereals which rose by 3.0 percent, meat by 2.4 percent, fish by 4.3 percent, vegetables by 3.8 percent, sugar by 3.5 percent and food from restaurants by 3.2 percent. Annual non-food inflation rate increased to 6.1 percent in January 2011 from 4.7 percent recorded in the preceding month mainly due to rise in indices for Housing, Water, Electricity, Gas and Other Fuels that went up by 17.7 percent and Furnishing, Housing Equipment and House Maintenance by 7.2 percent. Likewise, month-to-month non-food inflation increased to 1.7 percent compared to 0.4 percent in December Non food items which contributed to the rise include rents which increased by 6.5 percent, electricity by 21.7 percent, charcoal by 13.5 percent, household textiles by 2.9 percent, private preprimary and primary fees by 5.9 percent and private secondary school fees by 12.6 percent. Annual inflation rate excluding food and energy, increased to 4.4 percent in January 2011 from 3.7 percent in December 2010, and higher than the average rate of 3.8 percent recorded in the past four months. Meanwhile, month-to-month inflation rose to 1.0 percent in January 2011 from 0.6 percent recorded in the preceding month (Table 1.1 and Chart 1.1). 3
4 Table 1.1: Annual Percentage Changes in the New National Consumer Price Index (Base: Sept 2010 = 100) Percentage Change Weight Dec-10 to Nov-09 to Dec-09 to Jan-10 to Main Groups (%) Jan-11 Nov-10 Dec-10 Jan-11 Headline/All items Food and Non Alcoholic Beverages Transport Housing, Water, Electricity, Gas and Other Fuel Clothing and Footwear Furnishing, Housing Equip. and House Maintenance Restaurants and hotels Alcoholic and Tobacco Communication Education Recreation and Culture Health Miscellaneous goods and services Other Selected Groups Food and Non-alcoholic Beverages - combining food consumed at home and food consumed in restaurants Energy and Fuels - combining electricity and other fuels for use at home with petrol and diesel All Items Less Food (Non-Food) All Items Less Food and Energy Source: National Bureau of Statistics Chart 1.1: Annual Headline, Food and Non-food Inflation Headline Food Non-Food Percent Old Methodology 2008 Dec 2009 Jan Feb Mar Apr May Jun Jul Aug Sep Oct Nov Dec 2010 Jan Feb Mar Apr May Jun Jul Aug Sep Oct Nov Dec Jan Note: Old Methodology, Dec 2001 = 100, New Methodology, Sep 2010 = 100 Source: Bank of Tanzania 4
5 Food Supply Situation Food supply situation in the country during January 2011 was generally satisfactory with few incidences of food shortages. During the month, government distributed 8,014 tons of grain at subsidized prices or freely to Arusha, Monduli, Longido,and Iringa districts. Wholesale annual average prices for major food crops decreased in January 2011 with the exception of beans and potatoes (Table 1.2). Nonetheless, on month-to-month basis, the prices increased, mainly due to failure of short rain crops in most parts of the country. Table 1.2: National Average Wholesale Prices for Selected Food Items Percentage change TZS per 100 kg Items Jan Nov Dec Jan Dec 2010 to Jan 2011 Jan 2010 to Jan 2011 Maize 46,790 31,803 34,247 35, Rice 107,476 91,664 99, , Beans 106, , , , Sorghum 51,069 47,566 48,353 50, Potatoes 60,244 53,962 55,660 61, Source: Ministry of Industry, Trade and Marketing National Food Reserves Stocks of maize and sorghum held by the National Food Reserve Agency (NFRA) continued to increase since July 2010, reaching the highest official stock ever recorded of 220,035 tons in January 2011(Table 1.3). The increase in the stocks was on account of increased budgetary allocations from the Treasury. From July 2010 to January 2011, NFRA purchased a total of 171, tons of maize, representing 85.6 percent of the 200,000 tons estimated to be purchased during 2010/11. 5
6 Table 1.3: National Food Reserve Agency (NFRA) Stock Tons Period % Change January 112, , ,919 66, , February 117, , ,430 64,461 March 121, , ,252 60,694 April 125,509 94, ,849 53,821 May 128,350 79, ,876 50,312 June 128,804 76,649 94,699 48,248 July 129,306 75,438 88,841 47,143 August 125,653 83,131 93,231 90,519 September 131, , , ,694 October 143, , , ,103 November 142, ,209 86, ,747 December 142, ,253 77, ,895 Source: National Food Reserve Agency. 2.0 Monetary and Financial Markets Developments Money Supply and Credit Developments During the year ending January 2011, extended broad money supply (M3) grew by 25.4 percent, same rate recorded in the preceding month, but higher than 20.1 percent recorded in the year ending January Meanwhile, broad money supply (M2) grew by 20.3 percent, lower than 21.8 percent recorded in December 2010 and 23.4 percent in January The growth in money supply was mainly attributed to growth in net foreign assets of the banking system and growth of credit to the private sector (Chart 2.1 and Table 2.1). The NFA of the banking system registered an annual growth of 26.3 percent in January 2011, compared with 23.0 percent in the preceding month and 24.2 percent recorded in January 2010, on account of strengthening of the US dollar against the Shilling. Meanwhile, credit to the private sector continued to grow at an annual rate of 21.5 percent, from 20.0 percent recorded in December 2010 and 9.8 percent in January This trend reflects the recovery of banks confidence in extending credit to various economic activities as global economy continues to recover from the financial crisis. 6
7 Chart 2.1: Annual Growth Rates of Monetary Aggregates Narrow money (M1) Broad money (M2) Extended broad money (M3) Percent Dec Jan Feb Mar Apr May Jun Jul Aug Sep Oct Nov Dec Jan Feb Mar Apr May Jun Jul Aug Sep Oct Nov Dec Jan Source: Bank of Tanzania Table 2.1: Selected Money Supply Components Outstanding Stock in Billions of TZS Monthly Change Annual Growth Rate (%) Item Jan-10 Dec-10 Jan-11 Dec-10 Jan-11 Jan-10 Dec-10 Jan-11 Net Foreign Assets of the Banking System 4, , , Bank of Tanzania 3, , , Net International Reserves (Millions of USD) 3, , , Banks 1, , , Net Domestic Assets of the Banking System 3, , , Domestic Claims 5, , , Claims on Central Government (net) Claims on Central Government 2, , , o/w Securities held by banks 1, , , Liabilities to Central Government 2, , , Claims on Other Sectors 4, , , Extended Broad Money Supply (M3) 8, , , Foreign Currency Deposits (FCD) in National Currency 2, , , FCD in Millions of USD 1, , , Broad Money Supply (M2) 6, , , Other Deposits in National Currency 3, , , Narrow Money Supply (M1) 3, , , Currency in Circulation 1, , , Transferable Deposits in National Currency 2, , , Source: Bank of Tanzania 7
8 Like in the preceding month, commercial banks outstanding credit to selected major economic activities sustained positive growth rates. Trade activities registered faster growth rate followed by personal loans, hotels and restaurants, building and construction. In terms of share to total private sector credit, personal loans continued to account for the largest part of the outstanding credit, followed by trade activities, manufacturing, agriculture and transport and communication. On the liability side, developments in money supply were dominated by foreign currency deposits and non-transferable deposits, which contributed about 65 percent of the changes in money supply (Chart 2.2). Foreign currency deposits recorded a substantial growth of 41.1 percent in January 2011 compared with 36.5 percent in recorded in December 2010 and 11.1 percent in January 2010, which is consistent with the nominal depreciation of the Shilling against US dollar. Despite of these developments, the share of foreign currency deposits to M3 increased by 0.6 percentage points to 27.6 percent in January 2011 compared with the share recorded in the preceding month. The shares of other components of money supply are as shown in Chart 2.3. Chart 2.2: Annual Contribution to Change in M3 In Percent Currency in Circulation Non- Transferable Deposits Transferable Deposits Foreign Currency Deposits Source: Bank of Tanzania Jan-10 Dec-10 Jan-11 8
9 Chart 2.3: Percentage Share to M3 Source: Bank of Tanzania Interest Rates Developments Interest rates on money market instruments continued to increase in January 2011, consistent with tight liquidity experienced by banks during the period. Treasury bills yields increased across the entire maturity spectrum, pushing the overall weighted average yield further up to 7.14 percent in January 2011 from 6.32 percent in December 2010 and 5.85 percent in November A similar pattern was observed in the Treasury bond market where average yields increased for the 7-year and 10-year Treasury bonds auctioned during the month under review. The overnight interbank cash market rate rose to 7.99 percent in January 2011 from 5.19 percent recorded in the preceding month and 2.87 percent recorded in November Likewise, repo rate almost doubled to 6.06 percent from 3.22 percent and 1.78 percent recorded in the same period (Table 2.2). 9
10 Table 2.2: Weighted Average Interest Rates Structure Percent Item Jan Feb Mar Apr May Jun Jul Aug Sep Oct Nov Dec Jan Overall Interbank cash market rate Overnight interbank cash market REPO Rate Discount Rate Overall Treasury bills rate days days days days Savings Deposit Rate Treasury Bonds Rates 2-years years years years Overall Time Deposits Rate month time deposit rate Negotiated Deposit Rate Overall Lending rate Short-term lending rate (up to 1year) Negotiated Lending Rate Margin between short-term lending and one-year time deposit rates Source: Bank of Tanzania Interest rates offered and charged by banks exhibited mixed developments. Overall time deposit rate stood at 5.92 percent in January 2011, down from 5.99 percent recorded in the preceding month and 6.12 percent posted in a similar period of Negotiated deposit rate went up to 8.87 percent from 8.45 percent recorded in the preceding month, and 7.44 percent recorded in the same period a year ago. Overall lending rate decreased to percent in January 2011 from percent in December 2010, but slightly higher than percent recorded in January On the other hand, negotiated lending rate increased to percent in January 2011, from percent registered in the preceding month. The spread between one year lending and deposit rates narrowed by 75 basis points to 6.52 percentage points in January 2011 compared with 7.27 percentage points recorded in the preceding month (Table 2.2). 10
11 Financial Markets Developments Treasury Bills and Bonds Market In January 2011, the Bank offered Treasury bills amounting to TZS billion same as the amount offered in December 2010, while demand was TZS billion, being higher than TZS billion recorded in the preceding month (Chart 2.4). The Bank intervened in the market and sold Treasury bills with face value of TZS billion or TZS billion at cost value, being relatively lower than the face value of TZS billion (or cost value of TZS billion) sold in December During January 2011, Treasury bills amounting to TZS billion matured. Chart 2.4: Treasury bills Market Developments Offer Tender Sucessful bids Overall WAY Jan-08 Jan-09 Jan-10 Feb-10 Mar-10 Apr-10 May-10 Jun-10 Jul-10 Aug-10 Sep-10 Oct-10 Nov-10 Dec-10 Jan-11 Billions of TZS Percent Source: Bank of Tanzania In the Treasury bonds market, the Bank conducted two auctions by issuing 7-year and 10- year bonds amounting to TZS 40.0 billion and TZS 20.0 billion, respectively. Demand for 7- year bond stood at TZS 27.5 billion, while that of 10-year bond was TZS 26.2 billion. The Bank accepted 10-year bond worth TZS 20.0 billion at face value (or TZS 17.5 billion at cost value) and intervened in the 7-year bond by accepting bids with the face value of TZS 25.0 billion (TZS 22.5 billion at cost value). Commercial banks continued to dominate the market followed by pension funds. 11
12 Repurchase Agreement and Inter-bank Cash Market Developments During January 2011, the Bank continued to conduct repurchase agreements (repos) with banks to supplement other monetary policy instruments in the management of liquidity in the economy. Volume of repos conducted was TZS 45.0 billion, significantly lower than TZS billion transacted in December 2010 and TZS billion sold in January 2010, consistent with tight liquidity in the banking system. In the same period, repo worth TZS 71.0 billion matured. In January 2011, the volume of transactions traded in the inter-bank cash market was TZS billion, slightly lower than TZS 1,045.6 billion transacted in December 2010, but higher than TZS billion traded in November Overnight placements were TZS billion, lower than TZS billion recorded in the preceding month but higher than TZS billion recorded November 2010 (Chart 2.5). Chart 2.5: Inter-bank Cash Market Developments Total Volume of Transactions Overnight Interbank cash market rate (%)-Right Scale Overnight Transactions Overall Interbank cash market rate (%)-Right Scale Billions of TZS Dec-08 Jan-09 Feb-09 Mar-09 Apr-09 May-09 Jun-09 Jul-09 Aug-09 Sep-09 Oct-09 Nov-09 Dec-09 Jan-10 Feb-10 Mar-10 Apr-10 May-10 Jun-10 Jul-10 Aug-10 Sep-10 Oct-10 Nov-10 Dec-10 Jan-11 Percent Source: Bank of Tanzania 12
13 Inter-Bank Foreign Exchange Market In January 2011, total volume of transactions in the inter-bank foreign exchange market amounted to USD million, being higher than USD million transacted in December 2010 and USD million in November It is worth noting that Bank s share in the IFEM has been declining from 49.4 percent in November 2010 to 45.5 percent in December 2010 and 43.1 percent in January Meanwhile, the Shilling appreciated against the US dollar from TZS 1, per USD in December 2010 to TZS 1, per USD in January On annual basis the Shilling depreciated against the US dollar by 6.3 percent, from TZS 1, per USD recorded in the corresponding period (Chart 2.6). Chart 2.6: Inter-bank Foreign Exchange Market Operations BOT Net Sale (+ve) Banks Sales Weighted Average Exchange Rate (TZS/USD) TZS/USD Millions of USD Dec-08 Jan-09 Feb-09 Mar-09 Apr-09 May-09 Jun-09 Jul-09 Aug-09 Sep-09 Oct-09 Nov-09 Dec-09 Jan-10 Feb-10 Mar-10 Apr-10 May-10 Jun-10 Jul-10 Aug-10 Sep-10 Oct-10 Nov-10 Dec-10 Jan-11 Source: Bank of Tanzania 3.0 Government Budgetary Operations In January 2011, revenue collections (excluding Local Government Authorities own sources) amounted to TZS billion or 91.7 percent of the budget estimate. In the corresponding period in 2009/10, revenue collections amounted to TZS billion or 94.0 percent of its estimates. Tax revenue collections in January 2011 amounted to TZS billion or 91.5 percent of the budget estimate, whereas non-tax revenue was TZS 26.4 billion or 94.7 percent of budget 13
14 estimate. On cumulative basis, tax revenue collections in the first seven months of 2010/11 amounted to TZS 2,956.9 billion or 91.4 percent of the budget estimate, non-tax revenue reached to TZS billion or 80.3 percent of budget estimate (Chart 3.1). Domestic revenue collection was 9.0 percent of GDP whereas in the corresponding period in 2009/10 it was 8.6 percent of GDP. Chart 3.1: Government Resources, July 2010 to January 2011 Billions of TZS 1, , Estimates Actuals , ,030.2 Taxes on Imports Sales/VAT & Excise Income Tax Other taxes Non- tax Revenue Grants Source: Bank of Tanzania During the month under review, total expenditure amounted to TZS billion, which was below the estimate of TZS billion by 26.9 percent. Out of the total, recurrent expenditure was TZS billion and development expenditure was TZS billion. On cumulative basis for the first seven months of 2010/11, government expenditure reached TZS 5,232.0 billion, against the estimate of TZS 5,920.4 billion. Recurrent expenditure amounted to TZS 3,851.1 billion in line with budget estimate whereas development expenditure amounted to TZS 1,380.9 billion or 71.4 percent of budget estimate. The underperformance in development expenditure was mainly a result of lower than projected disbursement of project grants which was only 14 percent of the projected TZS billion. In corresponding period in 2009/10, total government expenditure amounted to TZS 4,261.7 billion or 81.7 percent of the budget estimate (Chart 3.2). As a percentage of GDP, total 14
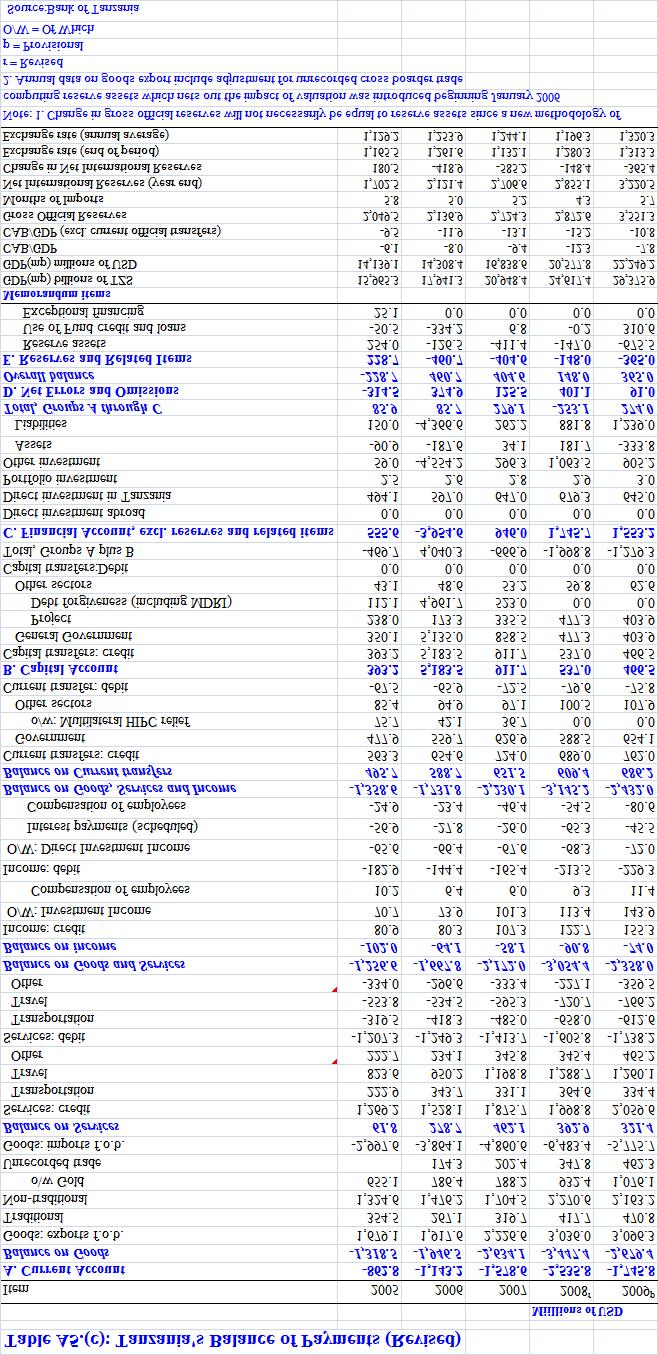
15 expenditure during the first seven months of 2010/11 was 15.1 percent, compared with 13.7 percent of GDP in the corresponding period in 2009/10. Chart 3.2: Government Expenditure, July 2010 to January 2011 Billions of TZS Estimates Actuals , , , , , ,380.9 Wages and Salaries Interest Costs Other goods & Services Development Source: Bank of Tanzania Financing Total financing of fiscal operations in first seven months of 2010/11, amounted to TZS 1,058.1 billion, of which TZS billion was foreign financing, while domestic financing was TZS billion on net basis. 4.0 External Sector Performance Balance of Payments During the year ending January 2011, overall balance of payments remained positive at a surplus of USD million, compared with a surplus of USD million recorded in the corresponding period a year earlier. This development was mainly on account of widening of current account deficit by 5.1 percent to USD 2,276.8 million, following a rise in goods import that outweighed the impact of the increase in official transfers and exports of goods and services (Table 4.1). 15
16 The gross official reserves closed at USD 3,925.7 million at the end of January 2011, sufficient to cover 5.2 months of import of goods and services, compared with USD 3,589.6 million recorded at the end of January Similarly, gross foreign assets of banks increased to USD 1,121.4 million from USD million in the same period. In total, gross foreign reserves of the banking system was USD 5,047.1 million at the end of January Table 4.1: Current Account Balance Item Millions of USD Jan Dec Jan Year Ending January % p p 2011 p Change Goods Account (net) , , Exports , , Imports , , Services Account (net) Receipts , , Payments , , Goods and services (net) , , Exports of goods and services , , Imports of goods and services , , Income Account (net) Receipts Payments Current Transfers (net) Inflows o/w General Government Outflows Current Account Balance , , Note: P = Provisional Source: Bank of Tanzania During the year ending January 2011, the value of export of goods and services amounted to USD 6,086.5 million which was 25.7 percent higher compared with the level recorded in the corresponding period a year earlier. The improvement was largely due to a significant increase in exports of gold, travel and manufactured goods (Chart 4.1 and Chart 4.2). 16
17 Chart 4.1: Performance of Selected Export of Goods and Services Year Ending January Millions of USD , , , , , , Source: Bank of Tanzania Gold Travel Manufactured Goods Traditional Exports Chart 4.2: Percentage Contribution of Selected Items to Total Exports of Goods Year Ending January Gold Manufactured Goods Other Non- Traditional Exports Traditional Exports Re-exports Other Minerals Source: Bank of Tanzania During the year to January 2011, the value of traditional exports was USD million, 22.4 percent higher than the value recorded in the corresponding period a year earlier, largely 17
18 due to a significant increase in both export volumes and unit prices of tobacco and cashew nuts. Chart 4.3 depicts the composition of traditional exports for the last three years Chart 4.3: Composition of Traditional Exports Percent Year Ending January Tobacco Coffee Cotton Cashewnuts Tea Cloves Source: Bank of Tanzania Non-traditional exports was USD 3,296.4 million in the year ending January 2011, compared with USD 2,471.5 million recorded during the preceding year. The improved performance is largely attributed to a substantial increase in the price of gold and the export value of manufactured goods. During the period under review, the price of gold increased to an average of USD 1,244.6 per troy ounce from USD per troy ounce, while the value of manufactured goods almost doubled to USD million. Much of the increase in manufactured goods was recorded in the vegetable oils, paper and plastic products. Chart 4.4 depicts the composition of non-traditional exports. 18


19 Chart 4.4: Composition to Total Non Traditional Exports in Year Ending January 2011 Other Minerals 1.3% Edible Vegetables 3.1% Horticultural 1.4% Manufactured Goods 30.2% Gold 47.9% Oil Seeds 2.3% Fish and Fish Products 4.4% Source: Bank of Tanzania Re-Exports 4.2% Other Exports 5.3% During the year to January 2011, services receipt continued to improve as the global economy recovers from the impact of the financial crisis. Total receipts were USD 2,180.1 million, compared with USD 1,872.5 million recorded in the similar period a year earlier. Chart 4.5 depicts the performance of the main services receipt for the past three years. 19
20 Chart 4.5: Service Receipts Year Ending January Millions of USD , , ,312.6 Transportation Travel (Tourism) Other services Note: Other Services include: Communication, Construction, Insurance, Financial, Computer Information, Government, Royalties and Personal and Other business services Source: Bank of Tanzania Import of goods and services amounted to USD 9,047.5 million compared with USD 7,643.3 million recorded in the corresponding period a year earlier, largely due to a notable increase in the price of imported oil and value of consumer goods. The average oil price (refined products) in the world market increased by 23.3 percent to USD per ton, while the value of consumer goods was 24.6 percent higher than the amount recorded in the preceding year (Table 4.2). 20
21 Table 4.2: Imports Millions of US Item Jan Dec Jan 2010 p 2010 p 2011 p Dec 10- Jan 11 % Change Jan 10 - Jan11 Year Ending January 2010 p 2011 p % Change Capital Goods , , Transport Equipment Building and Constructions Machinery , , Intermediate Goods , , Oil imports , , Fertilizers Industrial raw materials Consumer Goods , , Food and food stuffs All other consumer goods , , Grand Total (f.o.b) , , Grand Total (c.i.f) , , Note: P = Provisional Oil imports refers to refined petroleum products 1 It includes pharmaceutical products, paper products, plastic items, optical/photographic materials, textile apparels. Source: Bank of Tanzania and Tanzania Revenue Authority Chart 4.6 summarizes the contribution of import sub-categories to total imports for the last three years. Chart 4.6: Composition of Goods Imports Percent Year Ending January Oil Machinery Other Consumer Goods Transport Equipment Building and Construction Equipment Industrial Raw Materials Food and Foodstuff Fertilizers Source: Bank of Tanzania 21
22 Services payment at USD 1,857.5 million was 8.2 percent higher than the level recorded a year earlier, following an increase in payments of freight and travel services. Chart 4.7 shows the performance of major services payment categories in the past three years. Chart 4.7: Service Payments Millions of USD Year Ending January Transportation Travel Other services Note: Other Services include: Communication, Construction, Insurance, Financial, Computer Information, Government, Royalties, and Personal and Other business services. Source: Bank of Tanzania World Commodity Prices During January 2011, the world market prices of most of the agricultural and non agricultural commodities recorded increases save for the prices of cotton (Memphis) and gold (Table 4.3). The increase in the price of coffee was largely on account of unfavourable weather conditions in major coffee producing countries such as Colombia and Indonesia as well as in some Central American countries. Likewise, the price of tea (Mombasa Auction) rose largely on account of strong demand from Pakistan, Yemen and other Middle Eastern countries. The price of cloves went up largely due to unfavourable weather condition in Sri Lanka, India and Madagascar. The rise in the price of cotton (A Index) was largely on account of a decline in supply following unfavourable weather condition in Brazil and Australia, coupled with strong demand for cotton in China. During the period under review, the prices of crude oil (UK Brent, Dubai f.o.b) and white petroleum products recorded slight increases. 22
23 During the year ending January, 2011, the prices of most of the commodity increased except for tea (Mombasa Auction) and sisal. The rise in prices of cotton was largely attributable to strong demand for cotton in China. Likewise, the increase in the prices of coffee was mainly due to a decline in coffee production in Indonesia, Costa Rica, Thailand and Nicaragua following unfavourable weather condition. Meanwhile, the price of cloves recorded a notable increase as global supply declined following unfavourable weather condition in India, Madagascar and Sri Lanka coupled with strong demand for cloves. During the period under review, the prices of crude oil (UK Brent, Dubai f.o.b) and white petroleum products recorded modest increases following a decline in the oil inventories in the United States. Similarly, the price of gold went up mainly due to strong investment demand for gold. Table 4.3: World Commodity Prices Commodity Units Year Ending January % % Nov Dec Jan Change Change Robusta Coffee USD per kg Arabica Coffee USD per kg Tea (Average price) USD per kg Tea (Mombasa Auction) USD per kg Cotton, "A Index" USD per kg Cotton,"Memphis" USD per kg Sisal (UG) USD per metric ton 1, , , , , Cloves USD per metric ton 4, , , , , , Crude oil* USD per barrel Crude oil** USD per barrel White products*** USD per ton Jet/Kerosine USD per ton Premium Gasoline USD per ton Heat Oil USD per ton Gold USD per troy ounce 1, , , , Note: *Average of U.K Brent, Dubai and West Texas Intl ** f.o.b Dubai *** West Mediterranean Source: World Bank Public Ledger, Bloomberg, Tanzania Sisal Board 23
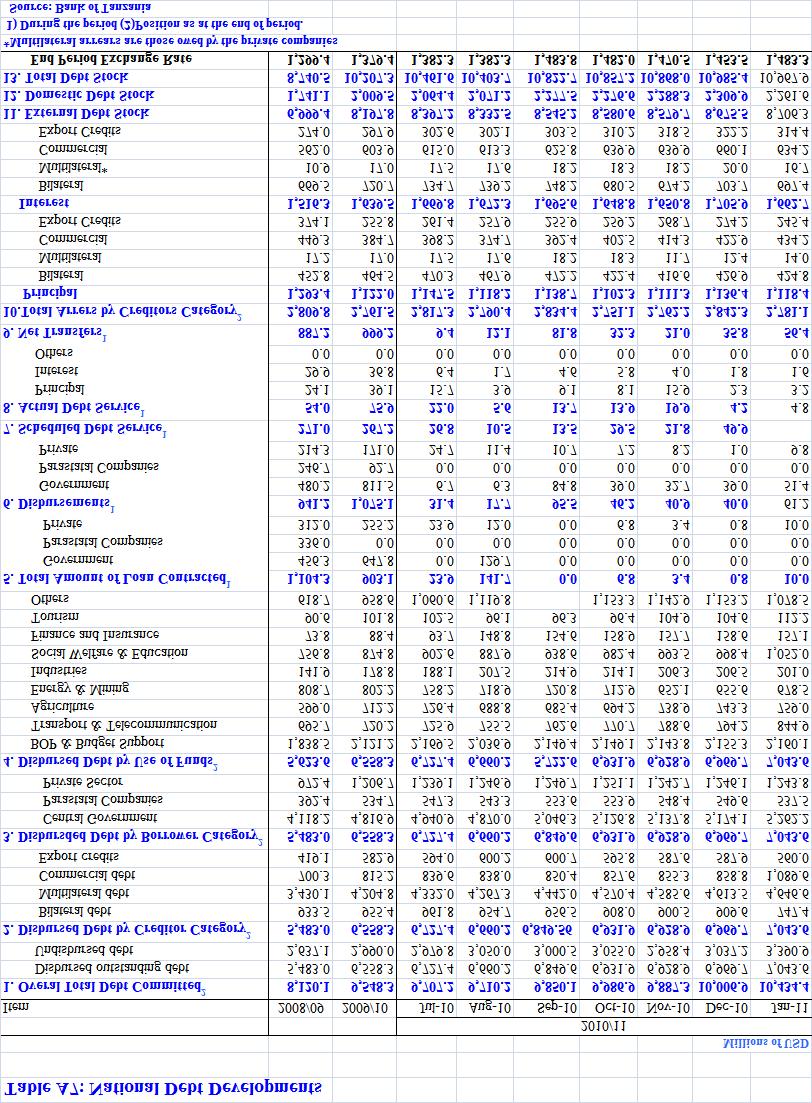
24 5.0 National Debt Developments National debt stock at the end of January 2011 stood at USD 10,967.9 million, representing a decrease of 2.1 percent when compared with USD 10,985.4 million recorded at the end of preceding month. The decrease was mainly explained by low issuance of Treasury Bills compared to maturing obligations. Out of the total debt stock, 82.0 percent was external debt and 18.0 percent was domestic debt. External debt stock increased by 0.4 percent to USD 8,706.3 million from the level recorded in December Out of the total external debt stock, 80.9 percent was disbursed outstanding debt and 19.1 percent interest arrears. The profile of disbursed outstanding debt by creditor category indicates that multilateral debt was USD 4,646.6 million, up from USD 4,613.5 million while bilateral debt decreased by 17.8 percent to USD million from the amount recorded at the end of previous month. Debt owed to commercial and export creditors stood at USD 1,089.6 million and USD million respectively. In terms of borrower category, Central Government was the largest borrower with disbursed outstanding debt amounting to USD 5,262.2 million followed by private sector and public corporation whose debt amounted to USD 1,243.8 million and USD million respectively. New loans contracted and recorded during the month amounted to USD 10.0 million, the whole amount being contracted by private companies. Loans received and recorded amounted to USD 61.2 million, out of which USD 51.4 million was received by the Government while USD 9.8 million was disbursed to private sector. External debt service during the month amounted to USD 4.8 million, of which, principal repayment was USD 3.2 million and interest payment was USD 1.6 million. The payment was 13.6 percent of USD 35.5 million scheduled for payment. Lower debt service payment was due to accumulation of arrears on non-serviced debts and inadequate information on debts serviced by private borrowers. The stock of domestic debt decreased from TZS 3,395.2 billion recorded at the end of preceding month to TZS 3,354.6 billion at the end of January 2011, mainly due to low 24
25 issuance of Treasury Bills. Out of domestic debt stock government securities accounted for 99.7 percent and the remaining portion was non-securitized debt (Table 5.1). Table 5.1: Government Domestic Debt by Instruments Billions of TZS Item Jan-10 Share (%) Dec-10 Share (%) Jan-11 Share (%) Government Securities 2, , , Treasury Bills Government Stocks Government Bonds 1, , , Tax Certificates Other Gov t Debt Mabibo Hostel Others Total Domestic Debt 2, , , Interest Arrears Total Domestic Debt Stock 2, , , Source: Ministry of Finance and Economic Affairs and Bank of Tanzania Domestic debt by holder category indicates that commercial banks are the leading investors in government debt holding 45.4 percent of domestic debt stock, up from 32.6 percent recorded in corresponding period in Bank of Tanzania holdings of Government debt declined from 39.4 percent in January 2010 to 29.3 percent at the end of January 2011, mainly due to redemption of matured government securities. New domestic debt issued during the month amounted to TZS 75.7 billion, out of which, TZS 30.8 billion was Treasury bills, and TZS 44.9 billion were Government bonds. Domestic debt service amounted to TZS billion. Out of domestic debt service, interest amounting to TZS 31.5 billion was paid while principal amounting to TZS billion was rolled over. 25
26 6.0 Economic Developments in Zanzibar Inflation Developments Annual Headline Inflation rate accelerated to 6.6 percent in January 2011 from 6.0 percent recorded in December 2010, due to a surge in food inflation. Similarly, month-to-month headline inflation rate rose to 2.9 percent from 0.2 percent recorded in December 2010, mainly due to increase in both food and non-food inflation (Table 6.1 and Chart 6.1). Table 6.1: Annual Percentage Change in Consumer Price Index (CPI) Base: Dec.2005= Weights Major Commodity Group (%) Nov Dec Jan Nov Dec Jan Nov Dec Jan Jan Headline/Overall Food Non-Food Alcoholic Beverages, Tobacco & Narcotics Clothing & Footwear Housing, Water, Electricity, Gas & Other Fuels Furnishing, Household Equipment & Routine Household Maintenance Health Transport Communication Recreation & Culture Education Restaurants & Hotels Miscellaneous Goods & Services Source: Office of Chief Government Statistician (OCGS) 26
27 Chart 6.1: Annual Headline, Food and Non-food Inflation 25.0 Headline Food Non-Food Percent Source: Office of Chief Government Statistician (OCGS) Annual food inflation rate increased to 7.3 percent in January 2011 from 4.8 percent in December 2010, mainly on account of increase in prices of rice, fish, wheat flour and sugar following soaring food prices in the world market (Chart 6.1). Similarly, month-to-month food inflation rate rose to 4.4 percent in January 2011 from 0.4 percent in December 2010, mainly on account of increase in prices of same commodities. Annual non-food inflation rate dropped to 6.2 percent in January 2011 from 8.3 percent registered in December 2010, mainly associated to decrease in prices of some items under furnishing, household equipment and routine household maintenance division. However, month -to-month non-food inflation rate increased to 0.8 percent after consumer price index remained unchanged in December 2010, mainly on account of increased school fees in nursery, primary and secondary schools. Fiscal Performance During January 2011, government budgetary operations on cheques issued basis registered a deficit of TZS 1.8 billion after grants and after adjustment to cash, the deficit widened to TZS 3.1 billion. Total resources during the month under review amounted to TZS 21.8 billion, below the target of TZS 25.5 billion of which domestic sources contributed
28 percent, and the balance was grants. Total expenditure amounted to TZS 23.6 billion, above the target by TZS 0.6 billion. The budget deficit was exclusively financed through foreign sources. Total revenue collections during January 2011, amounted to TZS 15.6 billion, same as the monthly target, of which tax revenue was TZS 14.5 billion and non-tax revenue amounted to TZS 1.1 billion. Performance of various tax categories is given in Chart 6.2 and Chart 6.3. Chart 6.2: Government Revenue by Sources January 2011 Billions of TZS Source: Ministry of Finance, Zanzibar Chart 6.3: Government Revenue by Sources, Percentage Share to Total Revenue January 2011 Non-Tax Revenue 7.3% Tax on Imports 27.6% Other Taxes 25.1% Source: Ministry of Finance, Zanzibar. Income Tax 13.1% VAT and Excise Duties (local) 26.9% 28
29 Cumulatively from July 2010 to January 2011, government revenue collections amounted to TZS 98.8 billion and accounted for 57.5 percent of the annual target of TZS billion Total government expenditure during January 2011, amounted to TZS 23.6 billion, above the target of TZS 23.0 billion, mainly due to increased donor inflows on development projects. Total recurrent expenditure amounted to TZS 15.7 billion, slightly below the target of TZS 15.8 billion, and accounted for 66.5 percent of total expenditure. Government expenditure by components is summarised in Chart 6.4. Chart 6.4: Government Expenditure by Components January 2011 Billions of TZS Source: Ministry of Finance, Zanzibar. Total development expenditure during January 2011, amounted to TZS 7.9 billion, of which government contribution was TZS 4.0 billion and foreign funded development expenditure was TZS 3.9 billion. Cumulatively from July 2010 to January 2011, total Government expenditure amounted to TZS billion, and accounted for 43.2 percent of the annual target. During the corresponding period in 2009/10, total government expenditure was TZS billion. 29
30 External Sector Performance Current Account Current account for the year ending January 2011, recorded a surplus of USD 6.2 million, compared to a surplus of USD 14.7 million, in the corresponding period in The decline in surplus was associated with a decrease in both current transfers and goods exports (Table 6.2). Table 6.2: Zanzibar Current Account Balance Millions of USD p Year Ending January % Change Item Jan Dec Jan p Monthly Annual Goods Account (net) Exports Imports (f.o.b) Services Account (net) Receipts Payments Goods and Services (net) Exports of Goods and Services Imports of Goods and Services Income Account (net) Receipts Payments Current Transfers (net) Inflows Outflows Current Account Balance Source: Bank of Tanzania (Zanzibar Branch), TRA Total exports of goods and services amounted to USD million in the year ending January 2011 compared to USD million recorded during the corresponding period of This outturn was mainly on account of a decline in exports of cloves and manufactured goods (Table 6.3). 30
31 Table 6.3: Zanzibar Exports by Major Categories p Year Ending January %Change Item Units Jan Dec Jan p Monthly Annual Traditional Cloves Value Millions Volume 000 Tons Unit Price USD/Ton 3, , , , , Non-Traditional Seaweeds Value Millions Volume 000 Tons Unit Price USD/Ton Manufactured Goods Millions Fish and Marine Products Millions Others Exports Millions Sub Total Millions Grand Total Millions Note: P = provisional Source: Bank of Tanzania (Zanzibar Branch), TRA Imports Performance During the year ending January 2011, total imports of goods and services amounted to USD million compared with USD million recorded in the corresponding period of 2010, mainly due to decrease in service payments which outweighed the increase in goods imports (Table 6.4). Table 6.4: Zanzibar Imports by Major Categories Millions of USD p Year Ending January %Change Import Category Jan Dec Jan p Monthly Annual Capital Goods Transport Equipment Building and Constructions Machinery Intermediate Goods Oil imports Industrial raw materials Consumer Goods Food and food stuffs All other consumer goods Grand Total (c.i.f) Grand Total (f.o.b) Note: P = provisional Source: Bank of Tanzania (Zanzibar Branch), TRA 31
32 STATISTICAL TABLES 32
33 33
34 Table A2: Central Government Operations (Cheques Issued) - Tanzania Mainland Millions of TZS 2010 BUDGET October November December January July to January January Item 2010/11 Actual Actual Actual Actual Estimates Actual Estimates Actual Total Revenue (including LGAs) /1 6,176, ,665, , , , ,565, ,212, , ,449.5 Total Revenue 6,003, ,665, , , , ,465, ,140, , ,449.5 Tax Revenue 5,638, ,581, , , , ,236, ,956, , ,030.4 Taxes on Imports 2,101, , , , , ,218, ,112, , ,099.3 Sales/VAT and Excise on Local Goods 1,266, , , , , , , , ,016.0 Drawings from EPA Income Taxes 1,649, , , , , , , , ,492.2 Other taxes 620, , , , , , , , ,422.9 Non- tax Revenue 364, , , , , , , , ,419.1 LGA Own Sources 172, , , , , Total Expenditure /2 10,769, ,756, , ,008, , ,920, ,232, , ,316.8 Recurrent expenditure 6,950, ,972, , , , ,986, ,851, , ,834.6 Roadtoll fund Retention fund 134, , , , , , , , ,299.4 Wages and salaries 2,205, , , , , ,324, ,355, , ,606.4 Interest payments 364, , , , , , , , ,091.8 Domestic 235, , , , , , , Foreign 129, , , , , , , , ,091.8 Other goods, services and transfers 4,246, ,084, , , , ,430, ,295, , ,837.1 Dev. Expenditure and net lending 3,819, , , , , ,933, ,380, , ,482.2 Local 1,366, , , , , , , , ,000.0 Foreign 2,452, , , , , ,430, , , ,482.2 Balance before Grants -4,593, ,090, , , , ,354, ,019, , ,867.4 Grants 2,020, , , , , ,442, ,030, , ,346.2 Program (CIS/OGL) 631, , , , , , , ,771.5 Project 898, , , , , , Basket funds 221, , , , , , , ,325.8 MDRI/MCA(T) 268, , , , Balance (cheq.issued) after Grants -2,572, , , , , , , , ,521.2 Expenditure float , , , , Adjustments to cash and other items (net) , , , , , ,192.8 Overall Balance (cheques cleared) -2,572, , , , , , ,058, , ,714.0 Financing: 2,572, , , , , , ,058, , ,714.0 Foreign Financing (net) 1,942, , , , , , , , ,458.1 Loans 1,728, , , , , , , , ,907.5 Program loans 189, , , , Development Project loans 1,538, , , , , , , , ,907.5 Basket Support 256, , , , , , , Amortization -42, , , , , , , , ,449.4 Domestic (net) /3 629, , , , , , , , ,255.9 Bank & Non Bank Financing (NDF) 599, , , , , , , , ,255.9 Bank borrowing 599, , , , , , , , ,217.3 Non-Bank (net of amortization) , , , , , ,038.7 Borrowing/Roll over 797, , , , , , , Domestic & Contingent debt Amortization -797, , , , , , , Privatization Proceeds 30, Memorandum Items Total Expenditure including Float GDP (In Million TZS) 34,749,781.0 Note: /1 Includes LGAs /2 Exclude amortization and Expenditure Float, includes Road fund and Retention expenditures /3 positive value means financing and a negative value means repayment Source: Ministry of Finance, Bank of Tanzania and National Bureau of Statistics 34
35 35
36 36
37 37
38 38
39 39
40 40
41 41
42 42
43 43
1.0 BANK OF TANZANIA MONTHLY ECONOMIC REVIEW
 1.0 BANK OF TANZANIA MONTHLY ECONOMIC REVIEW April 2016 Contents 1.0 Inflation and Food Supply Situation... 1 1.1 Inflation Developments... 1 1.2 Food Supply Situation... 1 1.3 Prices of Food Crops...
MONTHLY ECONOMIC REVIEW
 October 218 a BANK OF TANZANIA MONTHLY ECONOMIC REVIEW October 218 b October 218 October 218 i Contents 1. Inflation and Food Stocks... 1 1.1 Inflation Developments... 1 1.2 Food Stocks... 1 1.3 Prices
MONTHLY ECONOMIC REVIEW
 March 218 a BANK OF TANZANIA MONTHLY ECONOMIC REVIEW March 218 b March 218 March 218 i Contents 1. Inflation and Food Stocks... 1 1.1 Inflation Developments... 1 1.2 Food Stocks... 1 1.3 Prices of Food
1.0 BANK OF TANZANIA MONTHLY ECONOMIC REVIEW
 1.0 BANK OF TANZANIA MONTHLY ECONOMIC REVIEW October 2016 Contents 1.0 Inflation and Food Supply Situation... 1 1.1 Inflation Developments... 1 1.2 Food Supply Situation... 2 1.3 Prices of Food Crops...
MONTHLY ECONOMIC REVIEW
 February 218 a BANK OF TANZANIA MONTHLY ECONOMIC REVIEW February 218 b February 218 February 218 i Contents 1. Inflation and Food Stocks... 1 1.1 Inflation Developments... 1 1.2 Food Stocks... 1 1.3 Prices
KGkh BANK OF TANZANIA MONTHLY ECONOMIC REVIEW
 KGkh BANK OF TANZANIA MONTHLY ECONOMIC REVIEW June 218 Contents 1. Inflation and Food Stocks... 1 1.1 Inflation Developments... 1 1.2 Food Stocks... 1 1.3 Prices of Food Crops... 2 2. Monetary and Financial
1.0 INFLATION DEVELOPMENTS...
 BANK OF TANZANIA Monthly Economic Review November 2009 1 TABLE OF CONTENTS 1.0 INFLATION DEVELOPMENTS... 3 FOOD SUPPLY SITUATION... 5 2.0 MONETARY AND FINANCIAL DEVELOPMENTS... 6 MONEY SUPPLY AND CREDIT
MONTHLY ECONOMIC REVIEW
 October 217 a BANK OF TANZANIA MONTHLY ECONOMIC REVIEW October 217 b October 217 October 217 i Contents 1. Inflation and Food Stocks... 1 1.1 Inflation Developments... 1 1.2 Food Stocks... 1 1.3 Prices
MONTHLY ECONOMIC REVIEW
 September 218 a BANK OF TANZANIA MONTHLY ECONOMIC REVIEW September 218 b September 218 September 218 i Contents 1. Inflation and Food Stocks... 1 1.1 Inflation Developments... 1 1.2 Food Stocks... 1 1.3
MONTHLY ECONOMIC REVIEW
 April 218 a BANK OF TANZANIA MONTHLY ECONOMIC REVIEW April 218 b April 218 April 218 i Contents 1. Inflation and Food Stocks... 1 1.1 Inflation Developments... 1 1.2 Food Stocks... 2 1.3 Prices of Food
EC ONO MI C BU LLE TIN
 BANK OF TANZANIA EC ONO MI C BU LLE TIN FOR THE QUARTER ENDING ECONOMIC SEPTEMBER BULLETIN 2018 VOL. L NO. 3 FOR THE QUARTER ENDING SEPTEMBER 2018 VOL. L NO. 3 For any inquiry please contact: Director
EC ONO MI C BU LLE TIN FOR THE QUARTER ENDING MARCH 2017 VOL. XLIX NO. 1
 EC ONO MI C BU LLE TIN FOR THE QUARTER ENDING MARCH 2017 VOL. XLIX NO. 1 86 BANK OF TANZANIA ECONOMIC BULLETIN FOR THE QUARTER ENDING MARCH 2017 VOL. XLIX NO. 1 For any inquiry please contact: Director
EC ONO MI C BU LLE TIN
 BANK OF TANZANIA EC ONO MI C BU LLE TIN FOR THE QUARTER ENDING ECONOMIC JUNE 2018 BULLETIN VOL. L NO. 2 FOR THE QUARTER ENDING JUNE 2018 VOL. L NO. 2 For any inquiry please contact: Director of Economic
EC ONO MI C BU LLE TIN FOR THE QUARTER ENDING DECEMBER 2017 VOL. XLIX NO. 4
 EC ONO MI C BU LLE TIN FOR THE QUARTER ENDING DECEMBER 2017 VOL. XLIX NO. 4 BANK OF TANZANIA ECONOMIC BULLETIN FOR THE QUARTER ENDING DECEMBER 2017 VOL. XLIX NO. 4 For any inquiry please contact: Director
EC ONO MI C BU LLE TIN FOR THE QUARTER ENDING DECEMBER 2018 VOL. L NO. 4
 EC ONO MI C BU LLE TIN FOR THE QUARTER ENDING DECEMBER 2018 VOL. L NO. 4 80 BANK OF TANZANIA ECONOMIC BULLETIN FOR THE QUARTER ENDING DECEMBER 2018 VOL. L NO. 4 For any inquiry please contact: Director
EC ONO MI C BU LLE TIN FOR THE QUARTER ENDING SEPTEMBER, 2012 VOL. XLIV NO. 3
 EC ONO MI C BU LLE TIN FOR THE QUARTER ENDING SEPTEMBER, 2012 VOL. XLIV NO. 3 BANK OF TANZANIA ECONOMIC BULLETIN FOR THE QUARTER ENDING SEPTEMBER, 2012 VOL. XLIV NO. 3 For any enquiries contact: Director
PERFORMANCE OF THE ECONOMY REPORT NOVEMBER 2017
 PERFORMANCE OF THE ECONOMY REPORT NOVEMBER 2017 MACROECONOMIC POLICY DEPARTMENT MINISTRY OF FINANCE, PLANNING AND ECONOMIC DEVELOPMENT www.finance.go.ug Table of Contents SUMMARY... 2 REAL SECTOR DEVELOPMENTS...
PERFORMANCE OF ECONOMY REPORT December 2017
 PERFORMANCE OF ECONOMY REPORT December 2017 MACROECONOMIC POLICY DEPARTMENT MINISTRY OF FINANCE PLANNING AND ECONOMIC DEVELOPMENT www.finance.go.ug TABLE OF CONTENTS LIST OF ACRONYMS... 3 HIGHLIGHTS...
Monthly Report PERFORMANCE OF THE ECONOMY. May 2017 MACROECONOMIC POLICY DEPARTMENT MINISTRY OF FINANCE, PLANNING AND ECONOMIC DEVELOPMENT
 Monthly Report PERFORMANCE OF THE ECONOMY May 2017 MACROECONOMIC POLICY DEPARTMENT MINISTRY OF FINANCE, PLANNING AND ECONOMIC DEVELOPMENT www.finance.go.ug Table of Contents SUMMARY:... 1 REAL SECTOR DEVELOPMENTS:...
THE UNITED REPUBLIC OF TANZANIA BUDGET FOR FISCAL YEAR 2009/10 APRIL JUNE 2010 AND FULL YEAR BUDGET PERFORMANCE
 THE UNITED REPUBLIC OF TANZANIA BUDGET FOR FISCAL YEAR 2009/10 APRIL JUNE 2010 AND FULL YEAR BUDGET PERFORMANCE MINISTRY OF FINANCE AND ECONOMIC AFFAIRS AUGUST, 2010 EXECUTIVE SUMMARY The preliminary results
SACU INFLATION REPORT. February 2016
 SACU INFLATION REPORT February 2016 The content of this publication is intended for general information only. While precaution is taken to ensure the accuracy of information, the SACU Secretariat shall
SACU INFLATION REPORT. July 2018
 SACU INFLATION REPORT July 2018 The content of this publication is intended for general information only. While precaution is taken to ensure the accuracy of information, the SACU Secretariat shall not
SACU INFLATION REPORT. January 2017
 SACU INFLATION REPORT January 2017 The content of this publication is intended for general information only. While precaution is taken to ensure the accuracy of information, the SACU Secretariat shall
THE UNITED REPUBLIC OF TANZANIA MINISTRY OF FINANCE QUARTERLY ECONOMIC REVIEW AND BUDGET EXECUTION REPORT FOR FISCAL YEAR 2013/14 JANUARY MARCH 2014
 THE UNITED REPUBLIC OF TANZANIA MINISTRY OF FINANCE QUARTERLY ECONOMIC REVIEW AND BUDGET EXECUTION REPORT FOR FISCAL YEAR 2013/14 JANUARY MARCH 2014 MAY 2014 SUMMARY In 2013, real GDP grew by 7.0 percent
SACU INFLATION REPORT. December 2018
 SACU INFLATION REPORT December 201 The content of this publication is intended for general information only. While precaution is taken to ensure the accuracy of information, the SACU Secretariat shall
SACU INFLATION REPORT. October 2018
 SACU INFLATION REPORT October 2018 The content of this publication is intended for general information only. While precaution is taken to ensure the accuracy of information, the SACU Secretariat shall
SACU INFLATION REPORT. February 2017
 SACU INFLATION REPORT February 2017 The content of this publication is intended for general information only. While precaution is taken to ensure the accuracy of information, the SACU Secretariat shall
QUARTERLY ECONOMIC REVIEW (QER)
") QUARTERLY ECONOMIC REVIEW (QER) Volume 2 No 4 January - March 2018 OBJECTIVES OF THE CENTRAL BANK OF KENYA The principal objectives of the Central Bank of Kenya (CBK) as established in the CBK Act are:
QUARTERLY ECONOMIC REVIEW (QER) Volume 2 No 4 January - March 2018 OBJECTIVES OF THE CENTRAL BANK OF KENYA The principal objectives of the Central Bank of Kenya (CBK) as established in the CBK Act are:
CENTRAL BANK OF LIBERIA (CBL)
") CENTRAL BANK OF LIBERIA (CBL) MONTHLY ECONOMIC REVIEW JULY. 2017 VOLUME 3 No. 7 The Monthly Economic Review is produced by the Bank s Research, Policy & Planning Department. Inquiries concerning this publication
CENTRAL BANK OF LIBERIA (CBL) MONTHLY ECONOMIC REVIEW JULY. 2017 VOLUME 3 No. 7 The Monthly Economic Review is produced by the Bank s Research, Policy & Planning Department. Inquiries concerning this publication
SACU INFLATION REPORT. December 2017
 SACU INFLATION REPORT December 20 The content of this publication is intended for general information only. While precaution is taken to ensure the accuracy of information, the SACU Secretariat shall not
To be a World Class Modern Central Bank
 1 Monthly Economic Bulletin June 2018 Table of Contents SYMBOLS... 3 DEFINITIONS... 4 1. INFLATION... 6 2. MONEY, CREDIT AND INTEREST RATES... 10 3. REAL SECTOR INDICATORS... 13 4. BALANCE OF PAYMENTS
SACU INFLATION REPORT. April 2018
 SACU INFLATION REPORT April 2018 The content of this publication is intended for general information only. While precaution is taken to ensure the accuracy of information, the SACU Secretariat shall not
BANK OF TANZANIA FOR THE QUARTER ENDING DECEMBER,2005 VOL. XXXVII NO. 4
 ISSN 0856-101X BANK OF TANZANIA E C O N O M I C B U L L E T I N FOR THE QUARTER ENDING DECEMBER,2005 VOL. XXXVII NO. 4 For any enquiries contact: Directorate of Economic Policy Bank of Tanzania, P.O. Box
Monthly Report PERFORMANCE OF THE ECONOMY JUNE 2018 MACROECONOMIC POLICY DEPARTMENT MINISTRY OF FINANCE, PLANNING AND ECONOMIC DEVELOPMENT
 Monthly Report PERFORMANCE OF THE ECONOMY JUNE 2018 MACROECONOMIC POLICY DEPARTMENT MINISTRY OF FINANCE, PLANNING AND ECONOMIC DEVELOPMENT www.finance.go.ug Table of Contents SUMMARY... 1 REAL SECTOR DEVELOPMENTS...
Monthly Report PERFORMANCE OF THE ECONOMY SEPTEMBER 2017 MACROECONOMIC POLICY DEPARTMENT MINISTRY OF FINANCE, PLANNING AND ECONOMIC DEVELOPMENT
 Monthly Report PERFORMANCE OF THE ECONOMY SEPTEMBER 2017 MACROECONOMIC POLICY DEPARTMENT MINISTRY OF FINANCE, PLANNING AND ECONOMIC DEVELOPMENT www.finance.go.ug Table of Contents SUMMARY... 1 REAL SECTOR...
MONETARY POLICY STATEMENT
 June 2016 a b ISSN 0856-6976 MONETARY POLICY STATEMENT 2016/17 GOVERNOR BANK OF TANZANIA June 2016 c d 7 th June 2016 Hon. Dr. Philip I. Mpango (MP), Minister for Finance and Planning, Dar es Salaam, TANZANIA.
MONTHLY ECONOMIC INDICATORS
 MONTHLY ECONOMIC INDICATORS April 1 Monthly Economic Bulletin April Table of Contents 1. INFLATION...3 2. MONEY, CREDIT AND INTEREST RATES...7 3. REAL SECTOR INDICATORS...10 4. BALANCE OF PAYMENTS AND
SACU INFLATION REPORT. December 2014
 SACU INFLATION REPORT December 2014 The content of this publication is intended for general information only. While precaution is taken to ensure the accuracy of information, the SACU Secretariat shall
SACU INFLATION REPORT. January 2018
 SACU INFLATION REPORT January 2018 The content of this publication is intended for general information only. While precaution is taken to ensure the accuracy of information, the SACU Secretariat shall
SACU INFLATION REPORT. February 2018
 SACU INFLATION REPORT February 2018 The content of this publication is intended for general information only. While precaution is taken to ensure the accuracy of information, the SACU Secretariat shall
MONTHLY ECONOMIC INDICATORS
 MONTHLY ECONOMIC INDICATORS May 2018 1 Monthly Economic Bulletin May 2018 Table of Contents SYMBOLS... 3 DEFINITIONS... 4 1. INFLATION... 6 2. MONEY, CREDIT AND INTEREST RATES... 10 3. REAL SECTOR INDICATORS...
Price and Inflation. Chapter-3. Global Inflation Scenario. Chart 3.1 National CPI inflation (12-month average : base FY06=100)
") Global Inflation Scenario 3.1 Global inflation remained controlled in 1 while some commodity prices were still high. Decline in commodity prices, especially fuels and foods, has contributed to the decrease
Global Inflation Scenario 3.1 Global inflation remained controlled in 1 while some commodity prices were still high. Decline in commodity prices, especially fuels and foods, has contributed to the decrease
MONTHLY ECONOMIC INDICATORS
 To be a World Class Modern Central Bank MONTHLY ECONOMIC INDICATORS August 2018 1 Monthly Economic Bulletin August 2018 Table of Contents SYMBOLS... 3 DEFINITIONS... 4 1. INFLATION... 6 2. MONEY, CREDIT
BANK OF UGANDA MONTHLY ECONOMIC REVIEW
 BANK OF UGANDA MONTHLY ECONOMIC REVIEW JANUARY 2010 MONTHLY REPORT ON ECONOMIC AND MONETARY DEVELOPMENTS AS AT December 30, 2009 RESEARCH DEPARTMENT BANK OF UGANDA ii TABLE OF CONTENTS TABLE OF CONTENTS.i
BANK OF TANZANIA. Monthly Economic Review
 BANK OF TANZANIA Monthly Economic Review JULY 2011 1 TABLE OF CONTENTS 1.0 Inflation Developments... 3 Food Supply Situation... 5 The National Food Reserves... 5 2.0 Monetary and Financial Markets Developments...
MONTHLY ECONOMIC INDICATORS
 MONTHLY ECONOMIC INDICATORS JULY Table of Contents 1. INFLATION... 2 2. MONEY, CREDIT AND INTEREST RATES... 6 3. REAL SECTOR INDICATORS... 9 4. BALANCE OF PAYMENT AND EXTERNAL SECTOR INDICATORS... 10 5.
Monetary Policy Report
 CENTRAL BANK OF THE GAMBIA Monetary Policy Report November 20 The Central Bank of The Gambia Monetary Policy Report provides summary of reports presented at the Monetary Policy Committee Meeting. It entails
Nepal Rastra Bank Central Office. Current Macroeconomic Situation of Nepal
 Nepal Rastra Bank Central Office Current Macroeconomic Situation of Nepal (Based on the Annual Data of FY 2013/14) Real Sector Gross Domestic Product 1. According to the preliminary estimates of Central
SACU INFLATION REPORT. February 2015
 SACU INFLATION REPORT February 2015 The content of this publication is intended for general information only. While precaution is taken to ensure the accuracy of information, the SACU Secretariat shall
1 RED September/October 2018 SEPTEMBER/OCTOBER 2018
 1 RED September/October 20 SEPTEMBER/OCTOBER 20 2 RED September/October 20 MAJOR HIGHLIGHTS The country s annual consumer inflation grew by 0.2 percentage points to reach 5.1 per cent in September 20,
QUARTERLY ECONOMIC REVIEW (QER)
") QUARTERLY ECONOMIC REVIEW (QER) Volume 2 No 5 April - June 2018 OBJECTIVES OF THE CENTRAL BANK OF KENYA The principal objectives of the Central Bank of Kenya (CBK) as established in the CBK Act are: 1)
QUARTERLY ECONOMIC REVIEW (QER) Volume 2 No 5 April - June 2018 OBJECTIVES OF THE CENTRAL BANK OF KENYA The principal objectives of the Central Bank of Kenya (CBK) as established in the CBK Act are: 1)
SACU INFLATION REPORT. November 2018
 SACU INFLATION REPORT November 2018 The content of this publication is intended for general information only. While precaution is taken to ensure the accuracy of information, the SACU Secretariat shall
MACROECONOMIC POLICY DEPARTMENT MINISTRY OF FINANCE, PLANNING AND ECONOMIC DEVELOPMENT
 PERFORMANCE OF THE ECONOMY REPORT OCTOBER 2018 MACROECONOMIC POLICY DEPARTMENT MINISTRY OF FINANCE, PLANNING AND ECONOMIC DEVELOPMENT www.finance.go.ug TABLE OF CONTENTS LIST OF TABLES... ii LIST OF FIGURES...
CENTRAL BANK OF LIBERIA (CBL)
") CENTRAL BANK OF LIBERIA (CBL) MONTHLY ECONOMIC REVIEW SEP. 2017 VOLUME 3 No. 9 The Monthly Economic Review is produced by the Bank s Research, Policy & Planning Department. Inquiries concerning this publication
CENTRAL BANK OF LIBERIA (CBL) MONTHLY ECONOMIC REVIEW SEP. 2017 VOLUME 3 No. 9 The Monthly Economic Review is produced by the Bank s Research, Policy & Planning Department. Inquiries concerning this publication
Current Macroeconomic Situation (Based on the first eight months' data of 2007/08)
") Current Macroeconomic Situation (Based on the first eight months' data of 2007/08) Money Situation Overall Liquidity 1. In the first eight months of 2007/08, broad money (M 2 ) increased by 13.5 percent
Current Macroeconomic Situation (Based on the first eight months' data of 2007/08) Money Situation Overall Liquidity 1. In the first eight months of 2007/08, broad money (M 2 ) increased by 13.5 percent
To be a World Class Modern Central Bank
 1 Monthly Economic Bulletin Table of Contents 1. INFLATION... 2 2. MONEY, CREDIT AND INTEREST RATES... 6 3. REAL SECTOR INDICATOR... 9 4. BALANCE OF PAYMENTS AND EXTERNAL SECTOR INDICATORS... 10 5. DEVELOPMENTS
International Monetary Fund Washington, D.C.
 2005 International Monetary Fund August 2005 IMF Country Report No. 05/295 Iraq: Statistical Appendix This Statistical Appendix paper for Iraq was prepared by a staff team of the International Monetary
MONETARY POLICY STATEMENT
 ISSN 0856-6976 MONETARY POLICY STATEMENT The Mid-Year Review GOVERNOR BANK OF TANZANIA February 2012 ISSN 0856-6976 MONETARY POLICY STATEMENT The Mid-Year Review GOVERNOR BANK OF TANZANIA February 2012
MONTHLY ECONOMIC REPORT MARCH 2013 HIGHLIGHTS
 Ministry of Finance Department of Economic Affairs Economic Division 4(3)/Ec. Dn. /2012 MONTHLY ECONOMIC REPORT MARCH 2013 HIGHLIGHTS The overall growth of GDP at factor cost at constant prices, as per
CENTRAL BANK OF LIBERIA (CBL)
") CENTRAL BANK OF LIBERIA (CBL) MONTHLY ECONOMIC REVIEW OCT. 2017 VOLUME 3 No. 10 The Monthly Economic Review is produced by the Bank s Research, Policy & Planning Department. Inquiries concerning this publication
CENTRAL BANK OF LIBERIA (CBL) MONTHLY ECONOMIC REVIEW OCT. 2017 VOLUME 3 No. 10 The Monthly Economic Review is produced by the Bank s Research, Policy & Planning Department. Inquiries concerning this publication
SOMALILAND CONSUMER PRICE INDEX
 Methodology This publication provides monthly Consumer Price Indices Composite of Somaliland which is based on two main market baskets of Hargeisa urban households. The current Consumer Price Index was
CENTRAL BANK OF LIBERIA (CBL)
") CENTRAL BANK OF LIBERIA (CBL) MONTHLY ECONOMIC REVIEW JUNE 2016 VOLUME 2 No. 6 The Monthly Economic Review is produced by the Bank s Research, Policy & Planning Department. Inquiries concerning this publication
CENTRAL BANK OF LIBERIA (CBL) MONTHLY ECONOMIC REVIEW JUNE 2016 VOLUME 2 No. 6 The Monthly Economic Review is produced by the Bank s Research, Policy & Planning Department. Inquiries concerning this publication
Quarterly Economic Review
 Central Bank of Kenya Quarterly Economic Review April - June 2016 Volume 1 No. 2 OBJECTIVES OF THE CENTRAL BANK OF KENYA The principal objectives of the Central Bank of Kenya (CBK) as established in the
CENTRAL BANK OF LIBERIA (CBL)
") CENTRAL BANK OF LIBERIA (CBL) MONTHLY ECONOMIC REVIEW 138.00 134.00 130.00 126.00 122.00 118.00 114.00 110.00 106.00 102.00 98.00 94.00 90.00 86.00 Jan Feb Mar Apr May Jun Jul Aug Sep Oct Nov Dec Jan Feb
CENTRAL BANK OF LIBERIA (CBL) MONTHLY ECONOMIC REVIEW 138.00 134.00 130.00 126.00 122.00 118.00 114.00 110.00 106.00 102.00 98.00 94.00 90.00 86.00 Jan Feb Mar Apr May Jun Jul Aug Sep Oct Nov Dec Jan Feb
Major Highlights. Recent Economic Developments April/May Central Bank of Swaziland 1
 Major Highlights Annual consumer inflation increased to 7.0 per cent in April 2017 from 6.0 per cent in March 2017. Inflation rate (% y/y) 7.0 (Apr) Discount and prime lending rates remained unchanged
The Mid-Year Review 2017/18
 The Mid-Year Review 2017/18 February 2018 a b ISSN 0856-6976 MONETARY POLICY STATEMENT The Mid-Year Review 2017/18 GOVERNOR BANK OF TANZANIA February 2018 c d 6 th February 2018 Hon. Dr. Philip I. Mpango
Current Macroeconomic Situation of Nepal
 Current Macroeconomic Situation of Nepal (Based on the Four Months' Data of FY 2012/13) Monetary Situation Money Supply 1. Broad money supply (M2) increased by 4.0 percent during the four months of the
Short-term Inflation analysis and forecast. April 2018 RESEARCH SERVICES DEPARTMENT RESEARCH AND ECONOMIC PROGRAMMING DIVISION
 Short-term Inflation analysis and forecast April 2018 RESEARCH SERVICES DEPARTMENT RESEARCH AND ECONOMIC PROGRAMMING DIVISION c 2018 Bank of Jamaica Nethersole Place Kingston Jamaica Telephone: (876) 922
QUARTERLY ECONOMIC REVIEW (QER)
") QUARTERLY ECONOMIC REVIEW (QER) Volume 3 No 3 July - September 2018 OBJECTIVES OF THE CENTRAL BANK OF KENYA The principal objectives of the Central Bank of Kenya (CBK) as established in the CBK Act are:
QUARTERLY ECONOMIC REVIEW (QER) Volume 3 No 3 July - September 2018 OBJECTIVES OF THE CENTRAL BANK OF KENYA The principal objectives of the Central Bank of Kenya (CBK) as established in the CBK Act are:
Nepal Rastra Bank Research Department
 Nepal Rastra Bank Research Department Current Macroeconomic and Financial Situation of Nepal (Based on Two Months' Data of 2016/17) Economic Outlook 1. Summer crops are expected to improve on account ample
CONTENTS COMMENTARY CHARTS TABLES GLOSSARY. Section 1: Headline Inflation Section 2: Core Inflation
 COMMENTARY CONTENTS Section 1: Headline Inflation Section 2: Core Inflation CHARTS 1. National Rates of Inflation, January 2010 April 2013 2. Monthly Changes in the Cost-of-Living Index, January 2010 April
THE CBK WEEKLY BULLETIN
 December 30, 20 THE CBK WEEKLY BULLETIN Highlights for the Week Overall 12-month inflation eased from 19.7 percent in November 20 to 18.9 percent in December 20, while annual average inflation rose from
Current Macroeconomic Situation (Based on the First Six Months' Data of 2007/08)
") Current Macroeconomic Situation (Based on the First Six Months' Data of 2007/08) Monetary Situation Money Supply 1. Broad money (M2) registered a growth of 10.4 percent in the first six months of 2007/08
Current Macroeconomic Situation (Based on the First Six Months' Data of 2007/08) Monetary Situation Money Supply 1. Broad money (M2) registered a growth of 10.4 percent in the first six months of 2007/08
MONTHLY ECONOMIC INDICATORS
 MONTHLY ECONOMIC INDICATORS SEPTEMBER 0 Table of Contents 1. INFLATION... 2 2. MONEY, CREDIT AND INTEREST RATES... 6 3. REAL SECTOR INDICATORS... 9 4. BALANCE OF PAYMENTS AND EXTERNAL SECTOR INDICATORS...
INFLATION ANALYSIS AND PRICE SITUATION
 8.9.8 INFLATION ANALYSIS AND PRICE SITUATION Annual Inflation. / / / /5 5/ /7* NCPI * Projected for FY /7 Year.5 Y-O-Y CPI Inflation 8... Inflation Projection for / (/7) A major objective of Nepal Rastra
NOVEMBER 22, : MONTHLY INFLATION RATE INCREASES SIGNIFICANTLY
 CONSUMER PRICE INDEX (CPI) November, 2016: PRESS RELEASE Released on Thursday December 22, 2016 at 1:00 pm NOVEMBER 2016 MONTHLY INFLATION RATE INCREASES SIGNIFICANTLY The national monthly CPI (2008=100)
MONETARY POLICY STATEMENT 2013/14
 ISSN 0856-6976 MONETARY POLICY STATEMENT 2013/14 GOVERNOR BANK OF TANZANIA June 2013 ISSN 0856-6976 MONETARY POLICY STATEMENT 2013/14 GOVERNOR BANK OF TANZANIA June 2013 11 th June, 2013 Hon. Dr. William
Short-term Inflation analysis and forecast. May 2018 RESEARCH SERVICES DEPARTMENT RESEARCH AND ECONOMIC PROGRAMMING DIVISION
 Short-term Inflation analysis and forecast May 2018 RESEARCH SERVICES DEPARTMENT RESEARCH AND ECONOMIC PROGRAMMING DIVISION c 2018 Bank of Jamaica Nethersole Place Kingston Jamaica Telephone: (876) 922
MINISTRY OF NATIONAL PLANNING AND DEVELOPMENT REPUBLIC OF SOMALILAND Central Statistics Department OFFICIAL RELEASE
 MINISTRY OF NATIONAL PLANNING AND DEVELOPMENT REPUBLIC OF SOMALILAND Central Statistics Department OFFICIAL RELEASE Monthly Consumer Price Index September 20 Methodology This publication provides the monthly
OFFICIAL RELEASE. Monthly Consumer Price Index September 2018
 REPUBLIC OF SOMALILAND MINISTRY OFPLANNING AND NATIONALDEVELOPMENT Central Statistics Department OFFICIAL RELEASE Monthly Consumer Price Index September 2018 Methodology This publication provides the monthly
Pre-budget economic analysis Key facts and figures
 Pre-budget economic analysis Key facts and figures June 2008 Advisory Table of Contents Page 1 Macro-economic overview 1 2 External sector 10 3 Government finance 16 Appendix 1 - Glossary 21 Section 1
MONTHLY ECONOMIC REPORT MARCH 2014
 Ministry of Finance Department of Economic Affairs Economic Division 4(3)/Ec. Dn. /2012 MONTHLY ECONOMIC REPORT MARCH 2014 HIGHLIGHTS The growth of GDP at factor cost at constant (2004-05) prices (real
Current Macroeconomic Situation (Based on the annual Data of 2009/10)
") Current Macroeconomic Situation (Based on the annual Data of 2009/10) Real Sector Gross Domestic Product (GDP) 1. Based on the Preliminary estimate of the Central Bureau of Statistics, the gross domestic
Current Macroeconomic Situation (Based on the annual Data of 2009/10) Real Sector Gross Domestic Product (GDP) 1. Based on the Preliminary estimate of the Central Bureau of Statistics, the gross domestic
Nepal Rastra Bank. Research Department. Current Macroeconomic and Financial Situation of Nepal. (Based on Eleven Months' Data of 2016/17)
") Nepal Rastra Bank Research Department Current Macroeconomic and Financial Situation of Nepal Macrofinancial Outlook (Based on Eleven Months' Data of 2016/17) 1. Developments in four areas relating to weather,
Nepal Rastra Bank Research Department Current Macroeconomic and Financial Situation of Nepal Macrofinancial Outlook (Based on Eleven Months' Data of 2016/17) 1. Developments in four areas relating to weather,
MONETARY POLICY COMMITTEE STATEMENT FOR FIRST QUARTER Governor s Presentation to the Media. 16 th May, 2018
 1 MONETARY POLICY COMMITTEE STATEMENT FOR FIRST QUARTER 2018 Governor s Presentation to the Media 16 th May, 2018 INTRODUCTION 2 The presentation is structured as follows: 1. Decision of the Monetary Policy
Current Macroeconomic Situation (Based on the First Three Month's Data of 2009/10)
") Current Macroeconomic Situation (Based on the First Three Month's Data of 2009/10) Monetary Situation Money Supply 1. Broad money (M2) increased by 4.6 percent in the first three months of 2009/10. M2
Current Macroeconomic Situation (Based on the First Three Month's Data of 2009/10) Monetary Situation Money Supply 1. Broad money (M2) increased by 4.6 percent in the first three months of 2009/10. M2
Inflation Remains Tepid in November at 0.2% as Transport Cost Trending Downward
 19 December 2018 ECONOMIC REVIEW November 2018 Consumer Price Index Inflation Remains Tepid in November at 0.2% as Transport Cost Trending Downward Headline inflation back to near 4-year low. Consumer
1 RED June/July 2018 JUNE/JULY 2018
 1 RED June/July 20 JUNE/JULY 20 2 RED June/July 20 MAJOR HIGHLIGHTS Headline consumer inflation grew by 4.9 per cent in June 20 compared to 4.8 per cent recorded in May 20 Inflation rate (% y/y) 4.9 (June)
MONETARY POLICY COMMITTEE STATEMENT FOR THIRD QUARTER Governor s Presentation to the Media. 22 nd November, 2017
 1 MONETARY POLICY COMMITTEE STATEMENT FOR THIRD QUARTER 2017 Governor s Presentation to the Media 22 nd November, 2017 INTRODUCTION 2 The presentation is structured as follows: 1. Decision of the Monetary
Nepal Rastra Bank Research Department
 Nepal Rastra Bank Research Department Current Macroeconomic and Financial Situation of Nepal (Based on Six Months' Data of 2016/17) Macroeconomic Outlook 1. The current macroeconomic indicators show the
Short-term Inflation analysis and forecast. January 2018 RESEARCH SERVICES DEPARTMENT RESEARCH AND ECONOMIC PROGRAMMING DIVISION
 Short-term Inflation analysis and forecast January 2018 RESEARCH SERVICES DEPARTMENT RESEARCH AND ECONOMIC PROGRAMMING DIVISION c 2018 Bank of Jamaica Nethersole Place Kingston Jamaica Telephone: (876)
QUARTERY ECONOMIC REVIEW (QER)
") QUARTERY ECONOMIC REVIEW (QER) Volume 2 No 3 July September 2017 OBJECTIVES OF THE CENTRAL BANK OF KENYA The principal objectives of the Central Bank of Kenya (CBK) as established in the CBK Act are: 1)
QUARTERY ECONOMIC REVIEW (QER) Volume 2 No 3 July September 2017 OBJECTIVES OF THE CENTRAL BANK OF KENYA The principal objectives of the Central Bank of Kenya (CBK) as established in the CBK Act are: 1)
SACU Inflation Report July 2011
 SACU Inflation Report July 2011 The content of this publication is intended for general information only. While precaution is taken to ensure the accuracy of information, the SACU Secretariat shall not
CENTRAL BANK OF LIBERIA (CBL)
") CENTRAL BANK OF LIBERIA (CBL) MONTHLY ECONOMIC REVIEW DEC. 2017 VOLUME 3 No. 12 The Monthly Economic Review is produced by the Bank s Research, Policy & Planning Department. Inquiries concerning this publication
CENTRAL BANK OF LIBERIA (CBL) MONTHLY ECONOMIC REVIEW DEC. 2017 VOLUME 3 No. 12 The Monthly Economic Review is produced by the Bank s Research, Policy & Planning Department. Inquiries concerning this publication
Short-term Inflation analysis and forecasts. November 2017 RESEARCH SERVICES DEPARTMENT RESEARCH AND ECONOMIC PROGRAMMING DIVISION
 Short-term Inflation analysis and forecasts November 2017 RESEARCH SERVICES DEPARTMENT RESEARCH AND ECONOMIC PROGRAMMING DIVISION c 2017 Bank of Jamaica Nethersole Place Kingston Jamaica Telephone: (876)
Price and Inflation. Chapter-3. Global Inflation Scenario
 Global Inflation Scenario. Higher energy prices lifted headline inflation rates in advanced, emerging market and developing economies in the first six months of. Core inflation (excluding food and energy
Namibia Consumer Price Index
 Namibia Consumer Price Index OCTOBER, 2015 Namibia Statistics Namibia Consumer Price Index:October, 2015 Agency 1 OUR MISSION In a coordinated manner produce and disseminate relevant, quality and timely
State of Palestine Ministry of Finance. Fiscal Developments & Macroeconomic Performance: Fourth Quarter and Full year 2013 Report
 State of Palestine Ministry of Finance Fiscal Developments & Macroeconomic Performance: Fourth Quarter and Full year 2013 Report Macro Macro Fiscal Fiscal Unit Unit Oct February,, 2013 2014 Section 1:
MONTHLY ECONOMIC REVIEW
 MONTHLY ECONOMIC REVIEW MAY, 2017 VOLUME 3 No. 5 4 3 2 1 0 1 2 CENTRAL BANK OF LIBERIA (CBL) Exchange Rate (Change) The Monthly Economic Review is produced by the Bank s Research, Policy & Planning Department.
Major Highlights. Recent Economic Developments. September/October,2016. Central Bank of Swaziland 1
 September/October,20 Major Highlights The country s headline inflation increased to 8.3 per cent in Septmber 20 from 8.0 per cent in August 20. Inflation rate (% y/y) 8.3 (Sep) Discount and prime rates