Theatrical Season Report An Analysis of Employment, Earnings, Membership and Finance
|
|
|
- Marilyn Lane
- 6 years ago
- Views:
Transcription

1 Theatrical Season Report An Analysis of Employment, Earnings, Membership and Finance Steven DiPaola Assistant Executive Director for Finance and Administration
2
3 Theatrical Season Report An Analysis of Employment, Earnings, Membership and Finance The years since 2008 have been difficult economic times for the United States and much of the world. While the deep and broad decline that occurred in 2008 concluded several years ago, and the United States is considered to have recovered, this recovery still somehow feels different and more uneasy than those in the past. By all measures, U.S. markets have improved and set new highs, yet many Americans feel they possess less wealth. Unemployment has fallen to more familiar levels, but the job market feels altered and Americans are working harder, but with less to show for it. Several European countries continue to teeter on the brink of economic collapse, while others that had maintained strong economies are now showing signs of falling back. Given the global interdependence that now exists, the impact of that would not be restricted solely to Europe. So, here in the U.S. while economically speaking the patient is still standing, there is definitely some staggering, as well. In such times, stability may be the best goal achievable. This report, which will provide an overview of employment and earnings among members of Actors' Equity Association during the most recently concluded theatrical season (June 2013 through May 2014), will show that stability has largely been achieved. While some areas continue to struggle through this anxious recovery and are still attempting to find solid ground on which to return to growth, other areas have gained a hold and are showing signs of strength. Employment, which for many years showed steady advance, may not yet be progressing at the same rates, but it is not shrinking either, and the same is true of member earnings on Equity contracts. 1
4 Employment: Table 1 provides a high level look at member employment during the theatrical season, as well as the three seasons immediately preceding it. This year s work week total (a work week is defined as one week of work by one member) of 292,712 is just slightly higher than last year s total, and the second highest total since the global economic downturn now widely referred to as the Great Recession, which began during the season. Work weeks have remained fairly stable over the past four seasons, with the exception of a secondary decline that occurred in the season, likely a lagging impact of the downturn at that time. 2


5 In some ways, the past two seasons are copies of each other: The work week totals are nearly identical; the number of members who worked in each season is even more indistinguishable; and the average numbers of weeks worked per member in each of the two seasons were equal. From a regional perspective, 67.2% of the season s work weeks occurred in the Eastern Region. Over the past four seasons, the Eastern Region has fared considerably better than the other two regions, as the portion of work weeks occurring in the east increased by 2.5% during that time. The Central Region s share has remained almost the same, but the Western Region has lost 2.3% of its share over the four seasons. When comparing only this season to last season, the Eastern and Central Regions saw their employment increase by 1.5% and 1.9%, respectively. Employment in the Western region, however, decreased by 6.3%. Chart 2A, Eastern Region Work Weeks 198, , , , , , , , ,000 Chart 2B, Central Region Work Weeks 54,000 52,000 50,000 48,000 46,000 44,000 42,000 40,000 3

6 Chart 2C, Western Region Work Weeks 70,000 65,000 60,000 55,000 50,000 45,000 Charts 2A, 2B and 2C graphically represent regional work weeks over the past ten seasons, going back to the season. This season s work weeks in the east represent the second highest total in the decade, and are up 5% from the low for the period, established in the first complete season after the Great Recession began. Looking at Chart 2A, we can see that with the increases in work weeks over the past four seasons, employment in the Eastern Region has completed its climb back to where it was prior to the downturn, and hopefully that level can be sustained and built upon moving forward. The Central Region still appears to be working on that climb, as Chart 2B depicts; while its employment has increased 6.9% since the ten year low established in the season, it still remains 13.2% off of its high in that time period, which came just as the recession was beginning. In terms of employment, the Western Region seems to be having a more difficult time, as with its decline in work weeks this season, it created a new low for the ten year period. Work weeks in the Western Region are down 22.4% from the high point in the decade. 4

7 5

8 A more granular view of work weeks and the movements that have occurred since the downturn are shown in Table 3, which reports work weeks by contract type in each region for this season, as well as the prior three seasons and the season. Work weeks on the Production contract increased by 6.5% over last season. Since it accounts for more than one fifth of all Equity employment (and an even greater portion of Equity member earnings), this growth on Equity s flagship contract is very important to its members. Employment on the Production contract falls into two major categories: point of organization, which is work that originates and remains in New York, Chicago or Los Angeles; and touring, for employment occurring on the road. Point of organization work weeks in New York are colloquially referred to as Broadway. All point of organization work weeks occurred in New York this season, and they increased by 7% over the previous season, which was certainly good for Equity because of their high member earnings. Chart 4, Production Work Weeks Point of Organization vs. Production Touring 60,000 50,000 40,000 30,000 20,000 10,000 0 P of O Touring This year s combined 63,850 work weeks on both Production point of organization and touring is the highest level achieved in three seasons again great news for Equity members. Chart 4 illustrates work weeks on these two elements of the Production contract over the past 10 years. There is one final piece of good news on the touring front. Since the season, a third option has also existed for touring: the Short Engagement Touring Agreement (SETA) and Chart 5 depicts work weeks on the three touring elements back to the season. When the SETA work weeks for this season are added to those from Production touring, the resulting 30,601 work weeks represent the second highest number of touring work weeks in a decade, with 55% of those weeks occurring in the Full Production arena where member earnings are highest. The results from this season show that those three touring elements are working precisely as they should. 6

9 Chart 5, Touring Work Weeks Full Tour vs. Teired Touring vs. SETA 25,000 20,000 15,000 10,000 5,000 0 Full Tour Tiered Tour SETA Returning to this season, the LORT contract fared less well, having a 4.2% decline in work weeks since last year. Nevertheless, with 57,288 work weeks, LORT continues as the second largest source of employment for Equity s members after the Production contract, and unlike Production, which is generally focused in the Eastern Region, LORT is important to all regions. It is, in fact, the largest source of employment in the Central and Western regions. Chart 6A, Eastern Region LORT Work Weeks 32,000 30,000 28,000 26,000 24,000 22,000 20,000 7

10 Chart 6B, Central Region LORT Work Weeks 10,000 9,000 8,000 7,000 6,000 5,000 Chart 6C, Western Region LORT Work Weeks 22,000 21,000 20,000 19,000 18,000 17,000 16,000 Therefore, breaking down LORT weeks regionally over the past ten seasons, it can be observed in Charts 6A, 6B and 6C that all three areas had dramatic employment losses in the first complete season following the beginning of the downturn, when its economic impact fully hit the cities around the United States where LORT theatres operate. In the Eastern Region, much of those LORT work week losses have been recovered, despite small declines in the past two seasons. On the other hand, Central Region LORT work weeks were down 10% this season and are still down 11% from their ten year high. In the Western Region, LORT work weeks decreased by 5% this season, and are down almost 12.5% from their ten year high. As previously mentioned, the LORT and Production contracts are the two largest sources of employment for Equity members, and together they accounted for nearly 42% of all work weeks this past season. 8

11 Chart 7, Total Production Work Weeks 80,000 70,000 60,000 50,000 40,000 30,000 Chart 8, Total Resident Theatre (LORT) Work Weeks 62,000 60,000 58,000 56,000 54,000 52,000 50,000 48,000 Chart 7 and Chart 8 illustrate the performance of the Production and LORT contracts over the past 10 seasons. Both have generally put up strong numbers, and together they have generated well over 1 million weeks of employment over the last decade. Yet, for both, the impact following the downturn cannot be missed. Following Production and LORT, the highest work week generators are the Small Professional Theatre (SPT) contract and Letters of Agreement (LOAs) two developing theatre contracts. Combined, these accounted for nearly 48,000 work weeks this season, remaining fairly stable from the previous season. Looking to contracts that are important and unique to specific regions, in the east the Off Broadway contract continues a resurgence that ironically began during the difficult economic times of the past few seasons. In addition to the emerging work normally associated with this contract, the Off Broadway arena has also provided continued life to shows that have successfully concluded runs on Broadway. 9

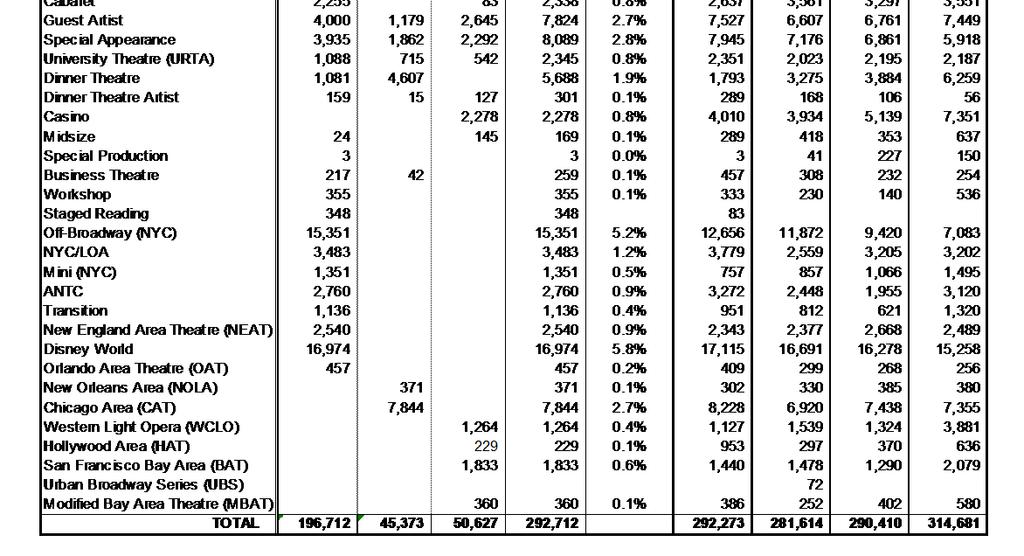
12 Consequently, work weeks on this contract increased by 21.3% this season and by an astonishing 116% since the season. In addition, employment on the Disney World contract in Orlando remained the stable force it has been for several seasons and accounted for nearly 17,000 work weeks. In the Central Region, work weeks on the Chicago Area Theatre (CAT) contract declined by 4.7%, but it accounted for 17% of the total work and remains an important source of employment to Actors in the Chicago area. In the Western Region, work on the Western Civic Light Opera (WCLO) contract and Bay Area Theatre (BAT) contracts increased by 12.2% and 27.3%, respectively. Overall, work weeks have remained fairly stable over the past four seasons, hovering between the 290,000 and 292,000 marks in all but one season when they declined slightly. They are, however, off their high of 314,681 established in the season, and after fairly consistent growth during the first part of the past decade (and prior), a recalibration perhaps temporary may have occurred as a response to the changes in the global and national economies. TYA 3% SETA 4% Disney World 6% Stock 3% LOA 7% Chart 9, Annual Work Weeks by selected Contract Types Casino All Other 1% 26% SPT 9% LORT 19% Production 22% Prior to moving on to a study of earnings this season, a final look at employment is offered in Chart 9, which shows the portion of overall work weeks held by the largest of the employment generators. It is interesting to note that about 67% of the work weeks occur on just six contracts: Production, LORT, SPT, LOA, Disney World and the SETA. 10
 $350,000 $340,000 $330,000 $320,000 $310,000 $300,000 $290,000 $280,000 $270,000 $260,000 Looking to earnings over the past ten seasons in Chart")

13 Earnings: Total member earnings on Equity contracts this season were just under $338.7 million the second highest total in Equity s history. Chart 10, Total Seasonal Earnings (in Thousands of $) $350,000 $340,000 $330,000 $320,000 $310,000 $300,000 $290,000 $280,000 $270,000 $260,000 Looking to earnings over the past ten seasons in Chart 10, after two seasons of decline, earnings recovered this year and increased by 2.4% over last season. Over the entire decade, they have increased by just under 16%. Turning to a much narrower period, Table 11 depicts earnings for this season and the three seasons immediately preceding it along with some other useful data. First, despite the increase this season, we can see that overall earnings have moved within a very narrow range over the four seasons and have remained relatively consistent. Regionally speaking, the Central Region has displayed that same consistency, and its share of the overall earnings has changed by only 0.06% over the four year period. 11
14 Conversely, eastern earnings have increased by 7.1% over the period and its regional share has increased significantly. Counter to that, western earnings have decreased by 23%, consequently leading to a much lower regional share. Finally, the median salary the statistical middle point between the highest and lowest salaries increased by about 5% since last season, and by about 1% over the fouryear period. Earlier, it was mentioned that the Production contract accounts for more than one fifth of all employment. Its portion of earnings is even larger; in fact, just about one half of all earnings by Equity members occur on this contract, so its importance cannot be overestimated. Chart 12, Total Production Earnings (in thousands of $) $200,000 $150,000 $100,000 $50,000 $0 Chart 12 shows earnings under the Production contract over the past decade. While it can be observed that the steady growth that characterized these earnings prior to the Great Recession seems to have halted, at least temporarily, Production earnings did increase by almost $14 million or 8.9% this season. Chart 13, Touring Earnings Full Tour vs. Tiered Touring vs. SETA $60,000,000 $50,000,000 $40,000,000 $30,000,000 $20,000,000 $10,000,000 $0 National Tour Tiered Tour SETA 12
15 Chart 13 graphically depicts earnings on Production tours both Full and Tiered along with the SETA over the last seven seasons (two years prior to the inception of the SETA). This season s nearly $60 million in member earnings in these three areas represent about 17.6% of the total earnings that occurred, and Full Production earnings increased for the second consecutive season. Chart 14, LORT Earnings $60,000,000 $55,000,000 $50,000,000 $45,000,000 $40,000,000 $35,000,000 Earnings under the LORT contract show a great deal of volatility over the past decade as illustrated in Chart 14. This season, they dropped for the second year in a row, and since the season, when they hit their high for the decade, they have declined by about 11%. 13

16 14
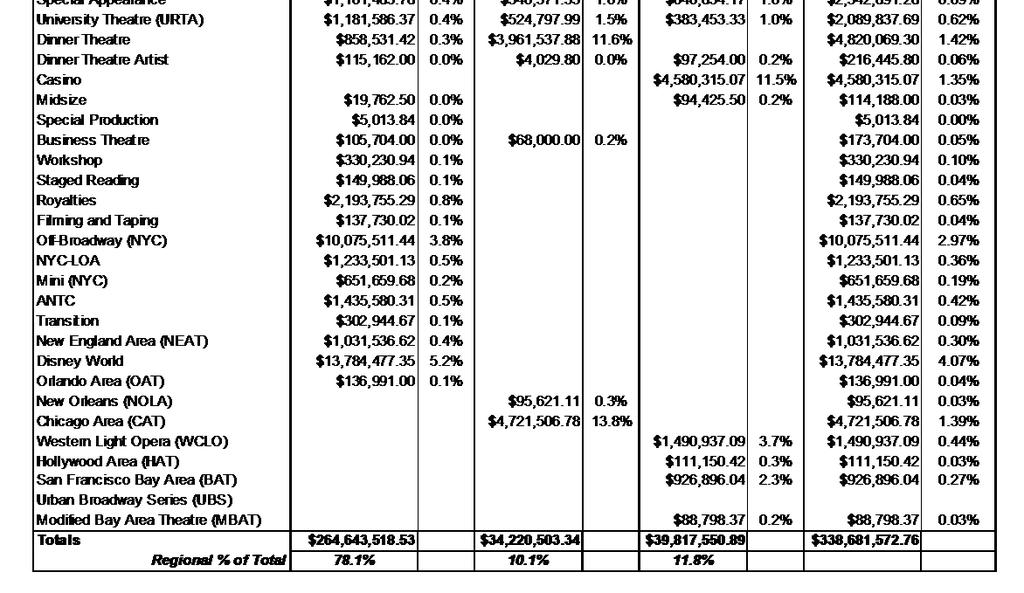
17 Table 15 provides the broadest view of member earnings, outlining the totals for each contract type in each region. Earnings under the Production and LORT contracts have already been highlighted for their importance, since just about two thirds of all member earnings nationally in the season occurred on these two contracts. Further, when the Small Professional Theatre contract, Letters of Agreement, the SETA, Off Broadway and Disney World, are added to Production and LORT, those seven contract areas are the source of 85% of the member earnings. Studying Table 15 from a regional perspective, the Production contract is by far the largest earnings generator in the Eastern Region because of Broadway. However, in addition to LORT, the Off Broadway and Disney World contracts (two large earnings sources mentioned above) are also unique to this region. In the Central Region, LORT is the largest source of earnings for members, but the regionspecific CAT contract is also quite important. The Dinner Theatre contract is also a large source of Central Region earnings since most of the theatres actively producing under this contract are located in that region. In fact, LORT, CAT and Dinner Theatre provide just under 48% of the total earnings in the region. In the Western Region, the LORT contract is far and away the largest source of member earnings with 47% of the total income for members in the region. Even with its diminished work weeks, the Casino contract contributes the next largest segment of member earnings in the west, followed by the Letters of Agreement and Small Professional Theatre contracts. Together, these four areas generate 77% of the regional earnings. 15
18 16

19 Table 16 provides a relative view of earnings, showing not only the totals by contract, but also placing those earnings side by side with work weeks for each area. Finally, this data is used to provide the average member earnings per work week for each contract type. It is interesting to note the relationships between the percentage of overall work weeks a contract type generates and the earnings it produces. For example, while the Production contract accounts for just over 22% of the total work weeks, it creates more than 49% of the total earnings. Additionally, its average earnings per work week of $2,588 are the highest. In contrast, the SPT contract accounts for 9.3% of the work weeks, but only 3.8% of the earnings. Consequently, while generating a good deal of work the third highest amount of any contract the $470 average earnings per work week on the SPT contract are in the lower range. Studying the last column of Table 16 helps create an understanding of how millions of dollars of earnings on various contract types translate to and impact the lives of the members working in each area. That brings us to Chart 17, which illustrates how many members have earnings under Equity contracts that fall into nine different dollar ranges. This season, 81 members earned more than $200,000 for their work in Equity s jurisdiction, and 1,626 or about 9% of all the members working earned more than $50,000. Yet, more than four times that number earned $5,000 or less. Chart 17, Members with Earnings by Selected Dollar Ranges $1 - $5,000 38% $5,000 - $15,000 31% $125,000 - $200,000 1% $200,000 1% $100,000 - $125,000 2% $50,000 - $75,000-75,000 $100,000 3% 2% $15,000 - $25,000 11% $25, $50, % 17
 at three points in time: this season, and the seasons five and 10 years ago.")
20 Membership: The drill down on member earnings at the conclusion of the last section provides a good segue into a brief look at member demographics. Table 18 provides a snapshot of members in good standing (those paid up in initiation fee and basic dues) at three points in time: this season, and the seasons five and 10 years ago. There has been an increase of 7.7% in members in good standing during the 10 year period, synonymous with the membership growth that occurred in the ensuing years. The number of members living in the Eastern Region grew by 10% over the past decade, but because of the growth in overall membership during the same time period, the portion of the membership living in the Eastern Region remains little changed. The Central Region saw a 21% increase during the same time in the number of members living there, while the Western Region saw a modest 4% decline; both regions, as a result, had changes in their regional apportionments of the membership. Fewer members began the process of joining the Association this year than did five and 10 years ago, but the number of new members remains strong. 18
21 Table 19 provides gender and ethnicity counts of the members in good standing. This information is provided voluntarily and some members choose not to do so. Table 20, Membership by Major Cities New York 18,795 Los Angeles 8,481 Chicago 1,829 San Francisco 1,143 Philadelphia 1,057 Washington D.C./Baltimore 1,055 Boston 970 Orlando 713 Minneapolis/St. Paul 510 Seattle 470 Table 20 lists the 10 cities with the largest populations of Equity members. The cities and their standings have remained the same over the past ten years, and all have seen growth in population of no less than 12%. The city with the largest increase in Equity members growth of nearly 44% is Orlando, followed closely by the Washington D.C./Baltimore area and Philadelphia. 19


22 Finances: Charts 21A and 21B illustrate income and expenses for the Association in its last fiscal year, which concluded on March 31, The union has a two tiered dues structure that has remained constant since 2002, the last time a dues increase was asked of the members. All members in good standing pay basic dues of $118 per year. In addition, members working under an Equity contract pay 2.25% on their first $300,000 of gross earnings per year as working dues. Basic dues account for approximately 30% of the union s income while working dues account for approximately 42%. The next largest source of income derives from initiation fees paid by new members joining the Association each year. The current initiation fee also in effect since 2002 is $1,100. A fourth source of income that has grown significantly over the years is the rent that Equity collects on the land which it owns in Times Square, New York City. Equity s National and Eastern Region offices are in the building sitting on that land and, as the value of real estate in New York City has increased, so too has the value of that land. The land rent collected in the fiscal year was $1.24 million, and as a result of an additional deal created between Equity, the building owner and a neighboring building owner several years ago, the value of this land will grow even more significantly in future years. In addition, this deal enabled Equity to build a new state of the art audition center in its New York building at no cost to its members. 20


23 Chart 22 depicts basic dues income over the past 10 years. Despite two small dips during the period, basic dues income has largely maintained an upward trend due to the Association s growing membership. Working dues income over the past 10 years is depicted in Chart 23. This form of income is a function of member earnings on Equity contracts. While these dues grew steadily prior to the recession, they have now largely remained stable in the years since. 21

24 Initiation fee income over the past ten years is illustrated in Chart 24. This form of income is a function of new members joining each year. As noted earlier, membership grew at an accelerated rate for several years during the period leading to higher initiation fee income in those years and now is growing at a more typical rate reflected in the more steady initiation fee income of the past several years. On the expense side, the greatest segment is represented by payroll and fringes to the staff in all four of Equity s offices that enable the union to provide extensive services to its members. Office expenses account for the next largest segment. The real estate holdings in New York discussed above have certainly enabled Equity to control these costs while maintaining over 50,000 square feet of space in the center of the theatre district in Manhattan. In addition, Equity s purchase of an office building in Chicago s vibrant West Loop area in 2009, and another in the NoHo Arts District in Los Angeles in 2012, will enable the Association to further control office costs for years to come as well as provide audition centers in both these locations. Finally, Chart 25 shows the value of the Association s investment portfolio over the past ten years. Several points are worth noting. First, despite the horrible market losses in 2008, the value of the investments fully recovered during the following year. Second, the value of these investments increased by approximately $2.7 million over the 10 year period even while Equity was taking more than $12 million from this portfolio to invest in the purchase and rehabilitation of a building in Chicago and another in Los Angeles. So, at the conclusion of the fiscal year, in addition to a nearly $25 million investment portfolio, Equity owned three valuable real estate assets. These assets and investments help make Equity s financial position very secure. 22
25 While the past several years have not been easy ones, the results of this past season show the remarkable resilience of Actors' Equity Association and the industry in which its members work. Though buffeted by many factors over the past six years, employment and earnings have retained stability and have shown strong results in some areas. While these are uneasy times economically speaking, one thing remains certain: Actors' Equity Association will continue to adapt as necessary to ensure the wellbeing of its members who exemplify professionalism as actors and stage managers in the theatrical industry. Many thanks to Joey Stamp, who worked on this report for the first time, for organizing data from varying sources and for providing valuable editing. Thanks are also due to Chris Williams, who worked on this report for many years, for his continuing assistance and advice. Appreciation is also extended to Doug Beebe for his work collecting the raw employment and earnings data and to John Fasulo and Joe DeMichele for their work on the Membership and Financial data. 23
26 Index Workweeks by Region, Charts 2, A - C Chart 2A Chart 2B Chart 2C Season Eastern Central Western Totals ,206 44,754 59, , ,723 49,041 61, , ,261 52,303 58, , ,185 52,238 65, , ,720 51,071 61, , ,216 44,410 56, , ,962 45,567 56, , ,503 42,438 50, , ,729 44,515 54, , ,712 45,373 50, ,712 Chart 5 Full Tour Tiered Tour SETA ,013 5, ,563 6, ,760 12,572 2, ,055 8,207 5, ,592 5,550 12, ,242 5,904 14, ,759 2,342 11,500 LORT Workweeks by Region, Charts 6, A - C Chart 5A Chart 5B Chart 5C Season Eastern Central Western Totals ,146 8,781 19,037 58, ,252 8,357 19,641 59, ,049 8,650 20,404 60, ,580 8,883 20,940 60, ,099 9,511 21,378 61, ,650 7,238 17,939 53, ,079 8,622 20,281 59, ,226 8,514 18,158 57, ,674 9,398 19,713 59, ,105 8,464 18,719 57,288 Chart Season Work Weeks % Production 63, % LORT 57, % SPT 27, % LOA 20, % Disney World 16, % SETA 11, % TYA 8, % Stock 7, % Casino 2, % All Other 77, % Grand Total 215, Chart 4 P of O Touring ,572 26, ,364 27, ,882 28, ,314 26, ,465 28, ,775 31, ,243 23, ,131 17, ,841 18, ,749 19,101 Chart 7 Total , , , , , , , , , ,850 Chart 10 Total Seasonal All Earnings (in thous.) $292, $297, $322, $338, $341, $334, $334, $333, $330, $338,681 Chart 8 Work Weeks LORT , , , , , , , , , ,288 Chart 12 Total Production Earnings (in thous.) $147, $154, $166, $178, $186, $193, $183, $157, $153, $167,458
27 Chart 13 Full Tour Tiered Tour SETA $56,255,155 $8,610, $52,183,423 $19,402, $53,339,968 $22,705,072 $4,682, $33,402,148 $16,394,387 $7,922, $28,434,669 $9,063,532 $19,987, $30,238,739 $11,076,416 $23,946, $38,230,751 $4,314,265 $17,059,811 Chart 14 LORT $48,396, $49,902, $54,972, $50,494, $53,969, $46,584, $52,583, $59,602, $55,674, $53,187,302 Fiscal Year, Chart 21B Expenses % of Total Payroll & Fringes: $11,247 $11, % Office Expenses: $3,389 $3, % Member Services: $712 $ % Information Technology: $478 $ % All Other: $2,083 $2, % Total Expenses $17,909 Chart 23 Working Dues Income Fiscal Year Total (in thous.) % change $5, % $6, % $7, % $7, % $7, % $7, % $7, % $7, % $7, % $7, % Chart 24 Chart 17 DOLLAR RANGE $1 - $5,000 6,679 $5,000 - $15,000 5,390 $15,000 - $25,000 1,856 $25,000 - $50,000 1,971 $50,000-75, $75,000-$100, $100,000 - $125, $125,000 - $200, $200, TOTALS 17,522 Chart 22 Basic Dues Income Fiscal Year Total (in thous.) $5, $5, $5, $5, $5, $5, $5, $5, $5, $5,561 Initiation Fee Revenue Fiscal Year Total (in thous.) % difference $2, % $2, % $2, % $2, % $2, % $2, % $2, % $2, % $2, % $2, % 25
Theatrical Season Report
 2016-2017 Theatrical Season Report An Analysis of Employment, Earnings, Membership and Finance Steven DiPaola Assistant Executive Director for Finance and Administration Actors' Equity Association spent
SEPTEMBER 2017 EMPLOYMENT HOUSING REAL ESTATE TRANSIT & TOURISM
 EMPLOYMENT FINANCE HOUSING COMMERCIAL REAL ESTATE TRANSIT & TOURISM HIGHLIGHTS The private sector experienced job losses after three record-setting months of growth Economic expansion accelerated to the
VOLUME FINANCE HOUSING COMMERCIAL REAL ESTATE EMPLOYMENT TRANSIT & TOURISM
 VOLUME 4 2018 EMPLOYMENT FINANCE HOUSING COMMERCIAL REAL ESTATE TRANSIT & TOURISM Published April 2018 VOLUME 4 2018 HIGHLIGHTS Unemployment in New York City remained at a record low in March 2018 Median
VOLUME FINANCE HOUSING COMMERCIAL REAL ESTATE EMPLOYMENT TRANSIT & TOURISM
 VOLUME 3 2018 EMPLOYMENT FINANCE HOUSING COMMERCIAL REAL ESTATE TRANSIT & TOURISM Published March 2018 VOLUME 3 2018 HIGHLIGHTS Unemployment in New York City fell to a record low in February 2018 NYC-based
VOLUME FINANCE HOUSING COMMERCIAL REAL ESTATE EMPLOYMENT TRANSIT & TOURISM
 VOLUME 11 2018 EMPLOYMENT FINANCE HOUSING COMMERCIAL REAL ESTATE TRANSIT & TOURISM Published November 2018 VOLUME 11 2018 HIGHLIGHTS Total employment in NYC reached a record high in October 2018 Seven
VIEW FROM A. VIEW FROM A MILE HIGH: Tapering the Era of Cap Rate Compression. NOVEMBER 2013 July 2013
 THE QUESTION OF HOW RISING TREASURY YIELDS WILL IMPACT CAP RATES has been a major topic of discussion over the past six months. Although many investors are concerned by the increase in Treasury yields,
INLAND EMPIRE REGIONAL INTELLIGENCE REPORT. School of Business. Fourth Quarter 2018 CENTER FOR ECONOMIC FORECASTING & DE VELOPMENT
 INLAND EMPIRE REGIONAL INTELLIGENCE REPORT Fourth Quarter 2018 School of Business CENTER FOR ECONOMIC FORECASTING & DE VELOPMENT INTRODUCTION 2018 was another strong year for the Inland Empire. The region
Banks at a Glance: Economic and Banking Highlights by State 4Q 2017
 Economic and Banking Highlights by State 4Q 2017 These semi-annual reports highlight key indicators of economic and banking conditions within each of the nine states comprising the 12th Federal Reserve
THEATRE FACTS 2000 A Report on Practices and Performance in the American Nonprofit Theatre Based on TCG s Annual Fiscal Survey
 THEATRE FACTS 2000 A Report on Practices and Performance in the American Nonprofit Theatre Based on TCG s Annual Fiscal Survey By Zannie Giraud Voss and Glenn B. Voss, with Christopher Shuff and Dan Melia
Provided to you by Lee McLain
 Provided to you by Lee McLain Lee McLain First Federal Bank of Kansas City 816.728.7700 lee.mclain@ffbkc.com NMLS:680316 Contents Weekly Review: week of November 26, 2018 Economic Calendar - week of December
Florida Economic Outlook State Gross Domestic Product
 Florida Economic Outlook The Florida Economic Estimating Conference met in July 2017 to revise the forecast for the state s economy. As further updated by the Legislative Office of Economic and Demographic
Growth in Personal Income for Maryland Falls Slightly in Last Quarter of 2015 But state catches up to U.S. rates
 Growth in Personal Income for Maryland Falls Slightly in Last Quarter of 2015 But state catches up to U.S. rates Growth in Maryland s personal income fell slightly in the fourth quarter of 2015, according
FEBRUARY 2017 EMPLOYMENT CONSTRUCTION TRANSIT & TOURISM
 FINANCE REAL ESTATE TRANSIT & TOURISM HIGHLIGHTS January 2017 saw a sharp rise in private sector employment The value of venture capital financings in New York City grew 18% in the final quarter of Citywide
District Economic. Structurally Deficient Bridges, 2001 (Percent)
") District Economic BY ROBERT LACY Apprehension about terrorism and political developments regarding Iraq cast a pall over the Fifth District economy in the last three months of. Many businesses continued
District Economic BY ROBERT LACY Apprehension about terrorism and political developments regarding Iraq cast a pall over the Fifth District economy in the last three months of. Many businesses continued
PRESS RELEASE. Home Prices Continue Climbing in June 2013 According to the S&P/Case-Shiller Home Price Indices
 Home Prices Continue Climbing in June 2013 According to the S&P/Case-Shiller Home Price Indices New York, August 27, 2013 Data through June 2013, released today by for its S&P/Case-Shiller 1 Home Price
AIA / COMPENSATION REPORT Compensation Report 2015 SAMPLE CHAPTER
 NATIONAL REPORT Compensation Report 2015 4 Like employers in the broader construction industry, U.S. architecture firms are still recovering from the economic effects of the Great Recession. In recent
Giving. Individual. Model By John J. Havens and Paul G. Schervish. Center on Wealth and Philanthropy
 Center on Wealth and Philanthropy Individual Giving Model By John J. Havens and Paul G. Schervish Indeed/Getty Images Charitable Giving in and the First Half of The Center on Wealth and Philanthropy at
National Center for Arts Research: 2015 Earned Revenue, Marketing and Engagement Report. December 2015
 National Center for Arts Research: 2015 Earned Revenue, Marketing and Engagement Report December 2015 TABLE OF CONTENTS Summary of Findings Page 1 Program Revenue per Attendee Index Page 8 Total Earned
Socio-economic Series Changes in Household Net Worth in Canada:
 research highlight October 2010 Socio-economic Series 10-018 Changes in Household Net Worth in Canada: 1990-2009 introduction For many households, buying a home is the largest single purchase they will
2017 FIRST QUARTER RESULTS
 2017 FIRST QUARTER RESULTS Dr. Steven N. Weisbart, CLU June 28, 2017 Highlights For the property/casualty (P/C) insurance industry in the first quarter of 2017, the financial weather report (compared with
The State of Working Florida 2011
 The State of Working Florida 2011 Labor Day, September 5, 2011 By Emily Eisenhauer and Carlos A. Sanchez Contact: Emily Eisenhauer Center for Labor Research and Studies Florida International University
COMPOSITE PRICE INDICES FOR COMMERCIAL REAL ESTATE SOARED IN 2015
 CCRSI RELEASE JANUARY 216 (With data through December 215) COMPOSITE PRICE INDICES FOR COMMERCIAL REAL ESTATE SOARED IN 215 DOUBLE-DIGIT PRICE GROWTH ACROSS ALL REGIONAL AND PROPERTY-TYPE INDICES IN 215
Health Insurance Coverage in 2013: Gains in Public Coverage Continue to Offset Loss of Private Insurance
 Health Insurance Coverage in 2013: Gains in Public Coverage Continue to Offset Loss of Private Insurance Laura Skopec, John Holahan, and Megan McGrath Since the Great Recession peaked in 2010, the economic
INTRODUCTION AND SUMMARY
 1 INTRODUCTION AND SUMMARY Rising house prices and incomes, an aging housing stock, and a pickup in household growth are all contributing to today s strong home improvement market. Demand is robust in
A Look at the Regional and National Economies
 28 th Annual Northern California Financial Planning Conference Sheraton Palace Hotel, San Francisco, California For delivery May 9, 2000, at approximately 8:45 am Pacific Daylight Time (11:45 am Eastern)
LIA Monthly Economic Report
 This publication is made possible through the support of: LIA Monthly Economic Report A Research Report for Directors and Members of the Long Island Association, Inc. June, 2017 Prepared by Dr. John A.
Florida: An Economic Overview
 Florida: An Economic Overview December 26, 2018 Presented by: The Florida Legislature Office of Economic and Demographic Research 850.487.1402 http://edr.state.fl.us Shifting in Key Economic Variables
Don t Raise the Federal Debt Ceiling, Torpedo the U.S. Housing Market
 Don t Raise the Federal Debt Ceiling, Torpedo the U.S. Housing Market Failure to Act Would Have Serious Consequences for Housing Just as the Market Is Showing Signs of Recovery Christian E. Weller May
Poverty in Our Time. The Challenges and Opportunities of Fighting Poverty in Virginia. Executive Summary. By Michael Cassidy and Sara Okos
 May 2009 Poverty in Our Time The Challenges and Opportunities of Fighting Poverty in Virginia By Michael Cassidy and Sara Okos Executive Summary Even in times of economic expansion, the number of Virginians
Moody s/real Commercial Property Price Indices, May 2010
 MAY 19, 20 STRUCTURED FINANCE SPECIAL REPORT Moody s/real Commercial Property Price Indices, May 20 Table of Contents: OVERVIEW 1 NATIONAL ALL PROPERTY TYPE AGGREGATE INDEX 4 OUT-OF-BOUNDS PHENOMENON 6
2013 ECONOMY REPORT. Produced by the Research Division, January Alvaro Lima, Director of Research Mark Melnik John Avault Gregory Perkins
 2013 ECONOMY REPORT Produced by the Research Division, January 2013 Alvaro Lima, Director of Research Mark Melnik John Avault Gregory Perkins PETER MEADE, DIRECTOR AS WE ENTER 2013, Boston s population
CBRE CAP RATE SURVEY. A CBRE Publication. First Half Click to Enter
 CBRE CAP RATE SURVEY A CBRE Publication In This Issue: pg 2 pg 8 pg 17 pg 26 pg 36 pg 41 pg 44 Click to Enter United States The 10-year Treasury (UST) was measurably lower than 2% from April 2012 through
Banks at a Glance: Alaska
 Banks at a Glance: Financial Institution Supervision and Credit sf.fisc.publications@sf.frb.org Economic and Banking Highlights Data as of 12/31/216 's economy continued to struggle, driven by weaknesses
The U.S. Current Account Balance and the Business Cycle
 The U.S. Current Account Balance and the Business Cycle Prepared for: Macroeconomic Theory American University Prof. R. Blecker Author: Brian Dew brianwdew@gmail.com November 19, 2015 November 19, 2015
APRIL 2017 EMPLOYMENT TRANSIT & TOURISM
 EMPLOYMENT FINANCE REAL ESTATE TRANSIT & TOURISM HIGHLIGHTS In addition to moderate job growth, unemployment reached a record low in March The value of venture capital financings fell in the first quarter
U.S. Property Markets Shake Off Slowdown and Power On
 U.S. Research Report CAPITAL FLOWS 2017 Midyear Update U.S. Property Markets Shake Off Slowdown and Power On Andrew J Nelson, Chief Economist USA The slowdown in U.S. commercial property markets that began
Outlook for the Hawai'i Economy
 Outlook for the Hawai'i Economy May 3, 2001 Dr. Carl Bonham University of Hawai'i Economic Research Organization Summary The Hawaii economy entered 2001 in its best shape in more than a decade. While the
In this report we discuss three important areas of the economy that have received a great deal of attention recently, namely:
 March 26, 218 Executive Summary George Mokrzan, PH.D., Director of Economics In this report we discuss three important areas of the economy that have received a great deal of attention recently, namely:
Polk County Labor Market Review
 Polk County Labor Market Review Polk County has a labor force of approximately 281,000 with 265,000 of them employed as of June 2016. The labor force reversed the 2014 2015 trend by growing 0.22% between
A Look at the Regional and National Economies
 Seattle Society of Financial Analysts (SSFA) The Ranier Club, Seattle, Washington For delivery May 4, 2000, at approximately 1:30 pm Pacific Daylight Time (4:30 pm Eastern) by Robert T. Parry, President,
Q State Government Finances: Regions Footprint
 January 1 This Economic Update may include opinions, forecasts, projections, estimates, assumptions and speculations (the Contents ) based on currently available information which is believed to be reliable
Jobs Held by Former Welfare Recipients Hit Hard by Economic Downturn
 cepr CENTER FOR ECONOMIC AND POLICY RESEARCH Briefing Paper Jobs Held by Former Welfare Recipients Hit Hard by Economic Downturn by Heather Boushey and David Rosnick 1 September 5, 2003 CENTER FOR ECONOMIC
POLICY PAGE. 900 Lydia Street Austin, Texas PH: / FAX:
 POLICY PAGE Center for Public Policy Priorities 9 Lydia Street Austin, Texas 7872 PH: 512.32.222 / FAX: 512.32.227 www.cppp.org September 26 For More Information: Don Baylor, baylor@cppp.org No. 269 THE
Challenges For the Future of Chinese Economic Growth. Jane Haltmaier* Board of Governors of the Federal Reserve System. August 2011.
 Challenges For the Future of Chinese Economic Growth Jane Haltmaier* Board of Governors of the Federal Reserve System August 2011 Preliminary *Senior Advisor in the Division of International Finance. Mailing
Patterns of Unemployment
 Patterns of Unemployment By: OpenStaxCollege Let s look at how unemployment rates have changed over time and how various groups of people are affected by unemployment differently. The Historical U.S. Unemployment
California Policy Review
 California Policy Review W I N T E R 2 0 0 5 Forecast Highlights The six county Sacramento region (including Sacramento, Placer, El Dorado, Yolo, Sutter, and Yuba Counties) continued to add jobs through
Adults in Their Late 30s Most Concerned More Americans Worry about Financing Retirement
 1 PEW SOCIAL & DEMOGRAPHIC TRENDS Adults in Their Late 30s Most Concerned By Rich Morin and Richard Fry Despite a slowly improving economy and a three-year-old stock market rebound, Americans today are
Fifth Annual Fisher Real Estate Conference St. Francis Hotel San Francisco For delivery June 6, 2000, approximately 8:15 AM P.D.T.
 Fifth Annual Fisher Real Estate Conference St. Francis Hotel San Francisco For delivery June 6, 2000, approximately 8:15 AM P.D.T. A Look at the Regional and National Economies I. Good morning. It's a
Exploring the Economy s Progress and Outlook
 EMBARGOED UNTIL Friday, September 9, 2016 at 8:15 A.M. U.S. Eastern Time OR UPON DELIVERY Exploring the Economy s Progress and Outlook Eric S. Rosengren President & Chief Executive Officer Federal Reserve
First Quarter 2016 Quarterly narrative REGIONAL SUMMARIES Fort Smith region Northwest Arkansas Central Arkansas Jonesboro
 First Quarter 2016 Quarterly narrative An independent economic analysis of four Arkansas metro areas: Central Arkansas Northwest Arkansas The Fort Smith region Jonesboro metro REGIONAL SUMMARIES Fort Smith
Tracking Report. Trends in U.S. Health Insurance Coverage, PUBLIC INSURANCE COVERAGE GAIN OFFSETS SIGNIFICANT EMPLOYER COVERAGE DECLINE
 I N S U R A N C E C O V E R A G E & C O S T S Tracking Report RESULTS FROM THE COMMUNITY TRACKING STUDY NO. AUGUST Trends in U.S. Health Insurance Coverage, 1- By Bradley C. Strunk and James D. Reschovsky
COMMERCIAL PRICING SURGE
 CCRSI RELEASE MARCH 2013 (With data through JANUARY 2013) COMMERCIAL REAL ESTATE PRICING LEVELS OFF FOLLOWING YEAR-END SURGE IN JANUARY INCREASING LIQUIDITY AND DECLINING DISTRESSED IMPROVING INVESTOR
PNC Investment Perspective
 March/April 2014 PNC Investment Perspective Decoupling of Developed and Emerging Markets? Jim Dunigan Mr. Dunigan is Executive Vice President and Managing Executive, Investments for PNC Asset Management
Indiana Lags United States in Per Capita Income
 July 2011, Number 11-C21 University Public Policy Institute The IU Public Policy Institute (PPI) is a collaborative, multidisciplinary research institute within the University School of Public and Environmental
How America Saves Vanguard 2016 defined contribution plan data
 How America Saves 2017 Vanguard 2016 defined contribution plan data 1 June 2017 Defined contribution (DC) retirement plans are the centerpiece of the privatesector retirement system in the United States.
IBO. Despite Recession,Welfare Reform and Labor Market Changes Limit Public Assistance Growth. An Analysis of the Hudson Yards Financing Plan
 IBO Also Available... An Analysis of the Hudson Yards Financing Plan...at www.ibo.nyc.ny.us New York City Independent Budget Office Fiscal Brief August 2004 Despite Recession,Welfare Reform and Labor Market
OPERA AMERICA ANNUAL FIELD REPORT
 OPERA AMERICA ANNUAL FIELD REPORT OPERA AMERICA ANNUAL FIELD REPORT OPERA America s Annual Field Report is designed to provide leaders in the field with a comprehensive overview of the financial positions
The Impact of the Economic Crisis on Nonprofits in the Bronx
 The Impact of the Economic Crisis on Nonprofits in the Bronx FISCAL POLICY INSTITUTE James Parrott, Deputy Director and Chief Economist parrott@fiscalpolicy.org www.fiscalpolicy.org The Bronx Forum Navigating
Almost everyone is familiar with the
 Prosperity: Just How Good Has It Been for the Labor Market? Investing Public Funds in the 21st Century Seminar Co-sponsored by the Missouri State Treasurer, the Missouri Municipal League, GFOA of Missouri,
Current Economic Conditions and Selected Forecasts
 Order Code RL30329 Current Economic Conditions and Selected Forecasts Updated May 20, 2008 Gail E. Makinen Economic Policy Consultant Government and Finance Division Current Economic Conditions and Selected
All Three Home Price Composites End 2011 at New Lows According to the S&P/Case-Shiller Home Price Indices
 PRESS RELEASE All Three Home Price Composites End 2011 at New Lows According to the S&P/Case-Shiller Home Price Indices New York, February 28, 2012 Data through December 2011, released today by S&P Indices
New Hampshire Economic Outlook 2018 New England Economic Partnership November 28, 2017
 New Hampshire Economic Outlook 2018 New England Economic Partnership November 28, 2017 By Greg Bird, Economist Executive Summary The New Hampshire economy is in great shape. Businesses are adding workers
2018 Q3. Brookfield Residential Properties Inc. September 30, 2018 Chief Executive Officer s Report
 Brookfield Residential Properties Inc. 2018 Q3, 2018 Chief Executive Officer s Report Brookfield Residential saw good results for the third quarter of 2018, despite continued challenges in the Canadian
2018 Independence Day Holiday Travel Forecast Review
 (Million) (Percent Change) Independence Day holiday travel will increase by nearly 2.4 million to 46.9 million, the most on record AAA and IHS Markit forecast 46.9 million travelers for the 2018 Independence
Metropolitan Area Statistics (4Q 2012)
") Metropolitan Area Statistics (4Q 2012) Apartment Completions 4Q 2011 4Q 2012 % Chg. Atlanta 490 288-41% Boston 678 995 47% Chicago 506 711 41% Cleveland 4 13 225% Columbus 255 322 26% Dallas-Ft. Worth
Metropolitan Area Statistics (4Q 2012) Apartment Completions 4Q 2011 4Q 2012 % Chg. Atlanta 490 288-41% Boston 678 995 47% Chicago 506 711 41% Cleveland 4 13 225% Columbus 255 322 26% Dallas-Ft. Worth
The Real Estate Report Volume 41, Number 2 Fall 2017 GENERAL SUMMARY
 OVERVIEW GENERAL SUMMARY What are the demographic patterns of the market? What does the inventory look like? What are the characteristics of the labor market and the income patterns? In the long history
4 th Quarter Revenue and Expenditures
 4 th Quarter Revenue and Expenditures REPORTFY 2017 Published 8/15/2017 Revenues Section 2.09 of the Principles of Sound Financial Management requires quarterly updates to the Board of County Supervisors
MISSISSIPPI S BUSINESS Monitoring the state s economy
 MISSISSIPPI S BUSINESS Monitoring the state s economy A Publication of the University Research Center, Mississippi Institutions of Higher Learning MARCH 2015 VOLUME 73, NUMBER 3 ECONOMY AT A GLANCE he
The Index Leading Indicators
 Our Sponsors: Housing Sales Up, Wide Growth Professor Erick Eschker, Director Jonathan Ashbach, Assistant Editor Catherine Carter, Assistant Analyst While no especially dramatic records were broken in
Banks at a Glance: Economic and Banking Highlights by State 2Q 2018
 Economic and Banking Highlights by State 2Q 2018 These semi-annual reports highlight key indicators of economic and banking conditions within each of the nine states comprising the 12th Federal Reserve
Western Economic. evelopments IN THIS ISSUE. District economies gain momentum in early Job growth intensifies and spreads
 IN THIS ISSUE F E D E R A L R E S E R V E B A N K O F S A N F R A N C I S C O Western Economic Developments District economies gain momentum in early Figure : Nonagricultural payroll growth by state (annualized
VICTORIAN BUILDING & CONSTRUCTION INDUSTRY OUTLOOK
 VICTORIAN BUILDING & CONSTRUCTION INDUSTRY OUTLOOK MARCH 2017 QUARTERLY UPDATE 15 JUNE 2017 PREPARED FOR THE MASTER BUILDERS ASSOCIATION OF VICTORIA STAFF RESPONSIBLE FOR THIS REPORT WERE: Director Senior
Implications of Fiscal Austerity for U.S. Monetary Policy
 Implications of Fiscal Austerity for U.S. Monetary Policy Eric S. Rosengren President & Chief Executive Officer Federal Reserve Bank of Boston The Global Interdependence Center Central Banking Conference
Striking it Richer: The Evolution of Top Incomes in the United States (Updated with 2009 and 2010 estimates)
") Striking it Richer: The Evolution of Top Incomes in the United States (Updated with 2009 and 2010 estimates) Emmanuel Saez March 2, 2012 What s new for recent years? Great Recession 2007-2009 During the
Striking it Richer: The Evolution of Top Incomes in the United States (Updated with 2009 and 2010 estimates) Emmanuel Saez March 2, 2012 What s new for recent years? Great Recession 2007-2009 During the
IV. EXPECTATIONS FOR THE FUTURE
 IV. EXPECTATIONS FOR THE FUTURE Young adults in Massachusetts widely view their future in positive terms. Those who are doing well financially now generally see that continuing. Those doing less well express
California Economic Overview Fall 2013
 California Economic Overview Fall 2013 Presented by Jon Haveman, Ph.D. Marin Economic Forum Contents Key Findings 3 California Outperforms Nation Normally 4 California Returns 5 Real Estate is Hot in California
ECONOMY: DESPITE SLOW APRIL, FUNDAMENTALS ARE IMPROVING
 May 2009 ECONOMY: DESPITE SLOW APRIL, FUNDAMENTALS ARE IMPROVING page 1 RETAIL AND WHOLESALE VEHICLE MARKETS page 3 Q&A WITH TOM WEBB page 5 The Auto Industry Brief is published monthly by Manheim Consulting.
Revising the Texas Index of Leading Indicators By Keith R. Phillips and José Joaquín López
 Revising the Texas Index of Leading Indicators By Keith R. Phillips and José Joaquín López We suggest changes to the that generally reflect the growing importance of services and globalization. Chart 1
COMMERCIAL. first look
 CCRSI RELEASE AUGUST 213 (With data through June 213) COMMERCIAL REAL ESTATE PRICES SEE MIDYEAR SURGE WITH STRONGEST QUARTER RLY INCREASE SINCE 211 RECOVERY BROADENS AS GENERAL COMMERCIAL SEGMENT EDGES
CEPR CENTER FOR ECONOMIC AND POLICY RESEARCH
 CEPR CENTER FOR ECONOMIC AND POLICY RESEARCH The Wealth of Households: An Analysis of the 2016 Survey of Consumer Finance By David Rosnick and Dean Baker* November 2017 Center for Economic and Policy Research
Additional Slack in the Economy: The Poor Recovery in Labor Force Participation During This Business Cycle
 No. 5 Additional Slack in the Economy: The Poor Recovery in Labor Force Participation During This Business Cycle Katharine Bradbury This public policy brief examines labor force participation rates in
Pace of Decline in Home Prices Moderates as the First Quarter of 2012 Ends, According to the S&P/Case-Shiller Home Price Indices
 PRESS RELEASE Pace of Decline in Home Prices Moderates as the First Quarter of 2012 Ends, According to the S&P/Case-Shiller Home Price Indices New York, May 29, 2012 Data through March 2012, released today
The Financial Engines National 401(k) Evaluation. Who benefits from today s 401(k)?
 Evaluation. Who benefits from today s 401(k)?") 2010 The Financial Engines National 401(k) Evaluation Who benefits from today s 401(k)? Foreword Welcome to the 2010 edition of The Financial Engines National 401(k) Evaluation. When we first evaluated
2010 The Financial Engines National 401(k) Evaluation Who benefits from today s 401(k)? Foreword Welcome to the 2010 edition of The Financial Engines National 401(k) Evaluation. When we first evaluated
Lake Tahoe Basin Census Trends Report
 Lake Tahoe Basin Census Trends Report 1990-2000-2010 Prepared August 2013 Contents Page Executive Summary 1 Findings 1 Definitions 3 Section 1. Demographics 4 Population 4 Age 6 Race 6 Housing 10 Tenancy
Foreclosure Trends Q Joe Speer Research Analyst. March 2018 RESEARCH AND PLANNING DIVISION
 March 2018 Foreclosure Trends Q4 2017 Joe Speer Research Analyst RESEARCH AND PLANNING DIVISION Tennessee Housing Development Agency Andrew Jackson Building 502 Deaderick St., Third Floor Nashville, TN
Chart Book: TANF at 20
 820 First Street NE, Suite 510 Washington, DC 20002 Tel: 202-408-1080 Fax: 202-408-1056 center@cbpp.org www.cbpp.org Updated August 5, 2016 Chart Book: TANF at 20 The Temporary Assistance for Needy Families
Smith Leonard PLLC Kenneth D. Smith, CPA Mark S. Laferriere, CPA
 Smith Leonard PLLC s Industry Newsletter January 2018 HIGHLIGHTS - EXECUTIVE SUMMARY A ccording to our latest survey of residential furniture manufacturers and distributors, new orders in November 2017
U.S. Economic and Real Estate Overview INSIDE:
 INSIDE: MEPT s Operating Portfolio Surpasses 93 Percent Leased Urban Multi-family and CBD Office Assets Drive Fund Appreciation FIRST QUARTER OCTOBER 2005 VOLUME 20, NUMBER 3 FIRST QUARTER APRIL 2013 VOLUME
2007 Minnesota Tax Incidence Study
 2007 Minnesota Tax Incidence Study (Using November 2006 Forecast) An analysis of Minnesota s household and business taxes. March 2007 2007 Minnesota Tax Incidence Study Analysis of Minnesota s household
GENERAL FUND REVENUE REPORT & ECONOMIC OUTLOOK. February 2012 Barry Boardman, Ph.D. Fiscal Research Division North Carolina General Assembly
 GENERAL FUND REVENUE REPORT & ECONOMIC OUTLOOK February 2012 Barry Boardman, Ph.D. Fiscal Research Division North Carolina General Assembly Highlights General Fund revenues through February are $145 million
Nationally, Home Prices Went Up in the Second Quarter of 2011 According to the S&P/Case-Shiller Home Price Indices
 Nationally, Home Prices Went Up in the Second Quarter of 2011 According to the S&P/Case-Shiller Home Price Indices New York, August 30, 2011 Data through June 2011, released today by S&P Indices for its
The Future of Transit in a Fiscally Constrained Political Environment (Draft) By Wendell Cox Principal, Demographia St.
 By Wendell Cox Principal, Demographia St.") The Future of Transit in a Fiscally Constrained Political Environment (Draft) By Wendell Cox Principal, Demographia St. Louis, MO-IL Paper Prepared for the Florida State University Transit Symposium May
The Future of Transit in a Fiscally Constrained Political Environment (Draft) By Wendell Cox Principal, Demographia St. Louis, MO-IL Paper Prepared for the Florida State University Transit Symposium May
Executive Compensation Trends
 Executive Compensation Trends December 2016 About This Report ERI s Executive Compensation Trends is a quarterly report that measures trends in executive compensation using analysis of the companies included
U.S. Economic Outlook: recent developments
 U.S. Economic Outlook Recent developments Washington, D.C., 6 February 2018 This document was prepared by Helvia Velloso, Economic Affairs Officer, under the supervision of Inés Bustillo, Director, ECLAC
Bay Area Employment Changes
 Employment Changes Trouble in the Tech World? February 2017 Update Produced for Produced by Marin Economic Consulting April 17, 2017 Jon Haveman, Principal 415-336-5705 or Jon@MarinEconomicConsulting.com
SEPTEMBER S&P CORELOGIC CASE-SHILLER NATIONAL HOME PRICE NSA INDEX UP 6.2% IN LAST 12 MONTHS
 SEPTEMBER S&P CORELOGIC CASE-SHILLER NATIONAL HOME PRICE NSA INDEX UP 6.2% IN LAST 12 MONTHS NEW YORK, NOVEMBER 28, 2017 S&P Dow Jones Indices today released the latest results for the S&P CoreLogic Case-Shiller
ZipRealty, Inc. Supplemental Data Reclassification of Consolidated Statement of Operations
 Reclassification of Consolidated Statement of Operations Effective January 1, 2007, for income statement presentation purposes, we have reclassified sales support and marketing expenses from general and
The Economy: Growth Has Been Weak But Long-Lasting
 The Economy: Growth Has Been Weak But Long-Lasting October 19, 2016 by Gary Halbert of Halbert Wealth Management 1. Why This Economic Recovery Has Been So Disappointing 2. The Fourth Longest Economic Expansion
Prince William County ECONOMIC INDICATORS NEWSLETTER Volume 7, Issue 4 October - December 2007
 Prince William County ECONOMIC INDICATORS NEWSLETTER Volume 7, Issue 4 October - December 2007 Highlights Fourth quarter GDP: 0.6% compared to 4.9% in previous quarter. National unemployment rate: 5.0%
The Purple Book DB PENSIONS UNIVERSE RISK PROFILE
 The Purple Book DB PENSIONS UNIVERSE RISK PROFILE 2017 2 the purple book 2017 The Purple Books give the most comprehensive picture of the risks faced by the PPF-eligible defined benefit pension schemes.