Understanding the Margin of Errors and the Coefficient of Variance in the American Community Survey U.S. Census Bureau Workshop at SACOG
|
|
|
- Virgil Wilkinson
- 6 years ago
- Views:
Transcription
1 Understanding the Margin of Errors and the Coefficient of Variance in the American Community Survey U.S. Census Bureau Workshop at SACOG Michael Burns Deputy Regional Director


2 American Community Survey Four Main Types of Characteristics of the Population Social Economic Housing Demographic 2 2
3 Expected improvements Five Year Coefficients of Variation (CVs) for typical tracts, by size where red > yellow > green Tract Size Category Average Tract Size CVs before realloca>on and sample expansion CVs aaer realloca>on, before sample expansion (2.9M) CVs aaer realloca>on and sample expansion (3.54M) % 41% 35% 401 1, % 30% 25% 1,001 2,000 1,485 29% 29% 25% 2,000 4,000 2,636 26% 29% 25% 4,000 6,000 4,684 19% 29% 25% 6, ,337 15% 28% 25% 3
4 SAMPLING ERROR AND DEALING WITH MARGINS OF ERROR


5 Probability Theory and Statistics All statistics are based on probability theory So if you do not like mathematical statistics, there are two French guys to blame: Pierre de Fermat and Blaise Pascal
6 Sample Design When designing a national survey, the Census Bureau has an advantage over all other research companies, even the large ones like NORC and RTI. We do the Census, so we not only have nationwide coverage of all population groups with their associated socio-economic characteristics, but also can draw a sample of housing units for a survey that is totally inclusive of all housing in the U.S. 6
7 How Can a Sample Represent the Whole Country?
8 Sample Design When designing a survey all you need to think about is chicken soup. How do you make chicken soup? Do you put 5 chickens in the soup or one chicken; a bunch of carrots or one carrot; and 2-3 stalks of celery or one stalk of celery?
9 Sample Design Chicken Soup Water Chicken Celery Carrots Onion Garlic Salt Pepper Noodles Wine Sample Design White African American Asian American Indian/Alaska Natives Hispanic Urban Rural Owner Renter Group Quarters
10 Proper Proportions Schichtung der Probenhilfen, die Veränderlichkeit in der Probenauswahl zu kontrollieren, nehmend dadurch die mathematische Veränderlichkeit im geschätzten Fehler ab (Fehlerspielraum (MOE)). Stratification of the sample helps to control the variability in the sample selection, thereby decreasing the mathematical variability in the estimated error (Margin of Error (MOE)). Doesn t the above sound like a bunch of gibberish? Let s get back to Chicken Soup!
11 Sample Design Chicken Soup Water Chicken Celery Carrots Onion Garlic Salt Pepper Noodles Wine Sample Design White African American Asian American Indian/Alaska Natives Hispanic Urban Rural Owner Renter Group Quarters
12 Stratification of the Sample Think of stratification as a fancy word that means groupings. The groupings are many since the grouping are cross tabulated when drawing the sample for all of our surveys, except for ACS. White x rural x low income x homeowner White x urban x medium income x renter Afr Am x rural x high income x renter Hispanic x urban x medium income x homeowner
13 ACS Sample Stratification ACS has sixteen Strata The strata are not cross tab on demographic characteristics, but on geographic size. The strata are sorted by the size of addresses in each county by stratum and geographic order including tract, block, street name, and house number. The stratum assignment for a block is based on information about the set of geographic entities referred to as sampling entities which contain the block, or on information about the size of the census tract in which the block is located. Sampling entities are defined as: Counties. Places with active and functioning governments. School districts. American Indian Areas/Alaska Native Areas/Hawaiian Home Lands (AIANHH). American Indian Tribal Subdivisions with active and functioning governments. Minor civil divisions (MCDs) with active and functioning governments in 12 states
14 Sampling Stratum 2012 Sampling Summary Statistics (U.S.) Sampling Rate Definition M12 Valid Addresses S12 Valid Addresses M12 Sampling Rate S12 Sampling Rate Final 2012 Sample Totals N/A 134,043, ,064 N/A N/A 3,539, % 1,211,251 3, % 15.00% 181, % 2,041,999 5, % 10.00% 204, % 3,982,496 12, % 7.00% 279, BR 3,291,024 9, % 2.74% 144, BR 152, % 3.43% 8, BR 82, % 3.16% 4, BR 5,058,766 10, % 2.74% 222, BR 4,625,451 8, % 2.52% 187, BR 21,774,868 40, % 1.67% 581, BR 38,907,391 63, % 1.53% 956, BR 14,229, , % 0.98% 225, BR 36,066,250 73, % 0.90% 521, BR 489,081 1, % 0.59% 4, BR 1,593,339 5, % 0.54% 13, BR 83, % 0.34% BR 453,768 1, % 0.32% 2,296 14
15 What are the Correct Proportions? The Census Bureau does the stratification based on: Urban /Rural Designations Sampling entities Stratifying the sample decreases the sample variability and thus decreases the Margin of Error.
16 One More Concept before We Discuss the Margin of Error: Standard Error The Standard Error measures the variability in the sample mean. We have to do a little more math to gain insight into how the Margin of Error works. We need to calculate the Standard Error, the formula is: The size of your sample effects the standard error and thus the Margin of Error (MOE). The larger your sample is, the smaller will be the Standard Error and therefore, the Margin of Error.
17 So what happens to the Standard Error when the # of addresses gets smaller in a sample? Let s take an example: We are looking at household income in a U.S. State. The median household income is $56,384 and the standard deviation is $15,000. Let also say that the number of household in the State sample is 2,800,000 Hus. The standard error would be 8.9. So let see what happens if we go down to the county level with 500,000 HUs. The standard error is 21.1 And if we go down to a city with 100,000 HUs? The Standard Error is 47.7 And if we go to a tract with 8000 HUs? The Standard Error is 168.1
18 Challenges of ACS Sampling Error The uncertainty associated with an estimate that is based on data gathered from a sample of the population rather than the full population Margin of error (MOE) measures the precision of an estimate at a given level of confidence MOEs at the 90% confidence level for all published ACS estimates 18
19 Making Sense of The Margin of Error So the number of housing units in the sample has a direct effect on the Standard Error and the Margin of Error when choosing the confidence level of 90% on ACS.
20 Finally We can talk about the Margin of Error What is the Margin of Error: Provides you with best estimation A confidence level is used for the purpose of estimating a population parameter by using statistics (a single number that describes the population). For example, the monthly unemployment rate for the country. The Margin of Error is the amount of plus or minus that is attached to your sample results when you move from discussing the sample itself (the bowl of soup) to discussing the whole population (the large pot of soup) that the sample represents.
21 The Margin of Error The Margin of Error is not the chance a mistake was made. The Margin of Error measures the variation in the random samples due to chance. Because you did not interview all the housing units in the U.S., like you do in a census, you expect that your sample results will be off by a certain expect amount, just by chance. You acknowledge that your results could change with subsequent samples and that they are only accurate to within a certain range which is your Margin of Error (MOE).
22 Relating Margin of Error to Confidence Level ACS is at the 90% Confidence Level, which means? I can draw 100 different ladles of soup (samples) from my big pot of soup (Total U.S. Population) and 90 ladles of soup will be within the parameter being studiedà Unemployment Rate Unemployment rate is 8.4% 0.2 The range to account for the chance error which can be determined mathematically is 8.2% %. That means I can take 90 ladles of soup from the big pot of soup and the unemployment rate will all fall with 8.2% to 8.6% Only 10 ladles of soup(samples) would produce numbers outside of the 8.2% to 8.6% for the unemployment rate.
23 Margin of Error (MOE) Adjusting your Confidence Level It is possible to construct margins of error with higher levels of confidence, such as 95 % or 99%. This is done by adjusting the published margin of error. Formula - MOE = +/ x SE (90% level) Values for other confidence levels - 95% = % =
24 Three Factors Effect the Size of the Margin of Error Three Factors: The Confidence Level The Sample Size The Amount of Variability in the Population The ultimate goal when making an estimate using a confidence interval is to have a small margin of error. The narrower the interval, the more precise the results are.
25 So why does ACS have such large MOEs at lower levels of Geography? Let s go back to chicken Soup and let s look at sample size: State Level ACS Data County Level ACS Data City Level ACS Data Tract Level ACS Data
26 Interpreting the Data
27 What is Reliability? Sampling Error is the uncertainty associated with an estimate that is based on data gathered from a sample of the population rather than the full population. Measures of sampling error give users an idea of how reliable, or precise, estimates are and speak to their fitness-for-use. Reliability is maximizing the inherent repeatability or consistency in an experiment. Think of reliability in this vein. If your doctor checks your weight once and you get right back on the scale, you do not expect to see a difference or just a miniscule difference. The closer the percent difference is to zero, the more reliable the measure. But if you do see a large difference, then there is a reliability issue. 27
28 Reliability Note: Fic+onal data 28
29 Measures of Sampling Error Standard Error (SE) foundational measure of the variability of an estimate due to sampling Margin of Error (MOE) precision of an estimate at a given level of confidence Confidence Interval (CI) - a range (based on a fixed level of confidence) that is expected to contain the population value of the characteristic Coefficient of Variation (CV) - The relative amount of sampling error associated with a sample estimate 29
30 Calculating Measures of Sampling Error At a 90 percent confidence level Margin of Error MOE = SE x Standard Error SE = MOE / Confidence Interval CI = Estimate +/- MOE Coefficient of Variance CV = SE / Estimate * 100% 30
31 Challenges of ACS Margins of Error and Data Filtering We do not perform any data quality filtering for the 5-year ACS estimates. Check margins of error to ensure estimates have sufficient reliability for their intended use. You can improve the reliability of estimates by aggregating geographies or subpopulations. 31
32 Example 1 Assessing Utility Officials in Sacramento, CA are considering an outreach program to the non citizen population of the city. Officials need to know how many non-citizens are living in Sacramento, CA, but are concerned about how reliable the figure is. If there is high reliability, the city wants to institute an outreach program to teach new arrivals English at a reduced tuition. What do the ACS 5-year estimates show? 32

33 Citizenship Status for Sacramento,CA 33
34 Is the Reliability of the Data Good? City of Sacramento Not a Citizen 54,302 ± 2290 (90% Confidence Level) Which means ( 52,012 ß 54,302 à 56,592 ) Find the Standard Error (Standard Error SE = MOE / 1.645) SE = 2290/ ,392 Coefficient of Variance CV = SE / Estimate * 100% 1,392/54,302 x 100 = 2.5%
35 Expected improvements Five Year Coefficients of Variation (CVs) for typical tracts, by size where red > yellow > green Tract Size Category Average Tract Size CVs before realloca>on and sample expansion CVs aaer realloca>on, before sample expansion (2.9M) CVs aaer realloca>on and sample expansion (3.54M) % 41% 35% 401 1, % 30% 25% 1,001 2,000 1,485 29% 29% 25% 2,000 4,000 2,636 26% 29% 25% 4,000 6,000 4,684 19% 29% 25% 6, ,337 15% 28% 25% 35
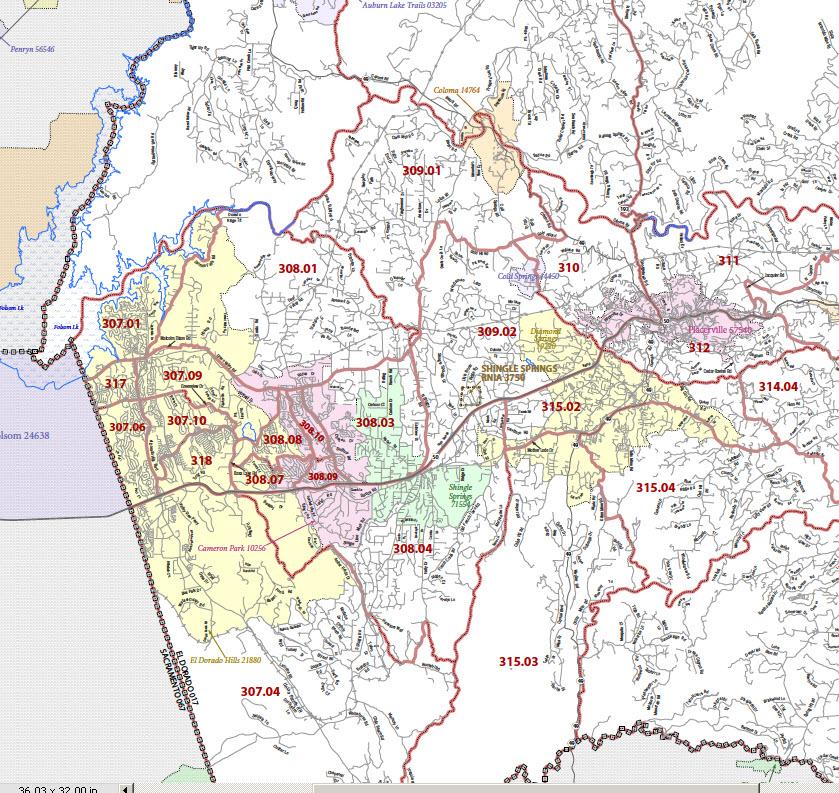
36 Example 2 Consider combining geographic areas In the next example, we want a more reliable Coefficient of Variance for the receipt of Supplemental Security Income (SSI), Cash Public Assistance Income, or Food Stamps/SNAP in the past 12 months by Household Type for Children under 18 years in Households We are interested in Tracts , , , , , , 317 and 318. El Dorado County is applying for a grant in order to provide additional services for the county s children who live in households receiving some form of assistance. The grant writer first wants to see if they can use the data at the tract level or do they need to collapse cells to obtain a datum with improved reliability. 36

37 Example 2
38 Example 2 B RECEIPT OF SUPPLEMENTAL SECURITY INCOME (SSI), CASH PUBLIC ASSISTANCE INCOME, OR FOOD STAMPS/SNAP IN THE PAST 12 MONTHS BY HOUSEHOLD TYPE FOR CHILDREN UNDER 18 YEARS IN HOUSEHOLDS Living in a HH w/ SSI, SNAP, etc ESTIMATE MOE SE CV Tract ± % Tract ± % Tract ± % Tract ± % Tract ± % Tract ± % Tract ± % Tract ± %
39 Example 2 - Calculations B RECEIPT OF SUPPLEMENTAL SECURITY INCOME (SSI), CASH PUBLIC ASSISTANCE INCOME, OR FOOD STAMPS/SNAP IN THE PAST 12 MONTHS BY HOUSEHOLD TYPE FOR CHILDREN UNDER 18 YEARS IN HOUSEHOLDS Living in a HH w/ SSI, SNAP, etc Estimate MOE MOE 2 Square root of sum Tract ±35 1,225 Tract ±69 4,761 Tract ±37 1,369 Tract ±49 2,401 Tract ±55 3,025 Tract ±119 14,161 Tract ±107 11,449 Tract ±71 5,041 Combined 498 ±208 43, Source: ACS 5-Year Estimates 39
40 Example 2- Results B RECEIPT OF SUPPLEMENTAL SECURITY INCOME (SSI), CASH PUBLIC ASSISTANCE INCOME, OR FOOD STAMPS/SNAP IN THE PAST 12 MONTHS BY HOUSEHOLD TYPE FOR CHILDREN UNDER 18 YEARS IN HOUSEHOLDS Living in a HH w/ SSI, SNAP, etc HH ESTIMATE MOE SE CV Tract ± % Tract ± % Tract ± % Tract ± % Tract ± % Tract ± % Tract ± % Tract ± % Combined 498 ± % Standard Error (SE) = MOE / 90% Confidence Interval. So 208 / = 126 (SE) Coefficient of Variance (CV) = Standard Error (SE) / HH Es+mate. So 126 / 498 = 25.3% 40
41 Example 2 Summary Combining data for 8 neighboring tracts improved the reliability of the detailed data; collapsing this detail improved the estimate even more. Users need to consider the most important dimensions geography or characteristic detail when considering collapsing. 41

42 ACS Calculator Oklahoma Department of Commerce h[p:// And- Research/Demographic- And- Popula+on- Data 42
43 Summary Extrapolation to Large Data Sets Four Methods of Improving Reliability 1. Find a pre-existing table at a higher degree of aggregation 2. Collapse data cells to a higher degree of aggregation 3. Add geographies together (Example 2) 4. Collapse data cells and add geographies together 43
44 Questions?
Poverty in the United Way Service Area
 Poverty in the United Way Service Area Year 4 Update - 2014 The Institute for Urban Policy Research At The University of Texas at Dallas Poverty in the United Way Service Area Year 4 Update - 2014 Introduction
Appendix C-5 Environmental Justice and Title VI Analysis Methodology
 Appendix C-5 Environmental Justice and Title VI Analysis Methodology Environmental Justice Analysis SACOG is required by law to conduct an Environmental Justice (EJ) analysis as part of the MTP/SCS, to
Commission District 4 Census Data Aggregation
 Commission District 4 Census Data Aggregation 2011-2015 American Community Survey Data, U.S. Census Bureau Table 1 (page 2) Table 2 (page 2) Table 3 (page 3) Table 4 (page 4) Table 5 (page 4) Table 6 (page
Northwest Census Data Aggregation
 Northwest Census Data Aggregation 2011-2015 American Community Survey Data, U.S. Census Bureau Table 1 (page 2) Table 2 (page 2) Table 3 (page 3) Table 4 (page 4) Table 5 (page 4) Table 6 (page 5) Table
Riverview Census Data Aggregation
 Riverview Census Data Aggregation 2011-2015 American Community Survey Data, U.S. Census Bureau Table 1 (page 2) Table 2 (page 2) Table 3 (page 3) Table 4 (page 4) Table 5 (page 4) Table 6 (page 5) Table
Zipe Code Census Data Aggregation
 Zipe Code 66101 Census Data Aggregation 2011-2015 American Community Survey Data, U.S. Census Bureau Table 1 (page 2) Table 2 (page 2) Table 3 (page 3) Table 4 (page 4) Table 5 (page 4) Table 6 (page 5)
Zipe Code Census Data Aggregation
 Zipe Code 66103 Census Data Aggregation 2011-2015 American Community Survey Data, U.S. Census Bureau Table 1 (page 2) Table 2 (page 2) Table 3 (page 3) Table 4 (page 4) Table 5 (page 4) Table 6 (page 5)
PART B Details of ICT collections
 PART B Details of ICT collections Name of collection: Household Use of Information and Communication Technology 2006 Survey Nature of collection If possible, use the classification of collection types
It Don t Come Easy, Ringo Starr
 It Don t Come Easy, Ringo Starr Period Estimates not point in time, not easy for people to understand or explain Different residence rules not usual place of residence as with decennial; ACS is current
Towards Standards in Mapping ACS Data. Joel A. Alvarez & Joseph J. Salvo NYC Department of City Planning Population Division
 Towards Standards in Mapping ACS Data March 8, 2018 Joel A. Alvarez & Joseph J. Salvo NYC Department of City Planning Population Division Dec. 30 th 2010 Important Note: The values for counties shown in
Lapkoff & Gobalet Demographic Research, Inc.
 Lapkoff & Gobalet Demographic Research, Inc. 22361 Rolling Hills Road, Saratoga, CA 95070-6560 (408) 725-8164 Fax (408) 725-1479 2120 6 th Street #9, Berkeley, CA 94710-2204 (510) 540-6424 Fax (510) 540-6425
2018:IIIQ Nevada Unemployment Rate Demographics Report*
 2018:IIIQ Nevada Unemployment Rate Demographics Report* Department of Employment, Training & Rehabilitation Research and Analysis Bureau Dr. Tiffany Tyler-Garner, Director Dennis Perea, Deputy Director
In Baltimore City today, 20% of households live in poverty, but more than half of the
 Building Economic Opportunity in Baltimore: A Data Profile Baltimore Highlights In Baltimore City today, 20% of households live in poverty, but more than half of the city s population 55% is financially
Tyler Area Economic Overview
 Tyler Area Economic Overview Demographic Profile. 2 Unemployment Rate. 4 Wage Trends. 4 Cost of Living Index...... 5 Industry Clusters. 5 Occupation Snapshot. 6 Education Levels 7 Gross Domestic Product
Independence, MO Data Profile 2015
 , MO Data Profile 2015 5 year American Community Survey (ACS) Jackson County, Missouri Data sources: U.S. Census Bureau, American Community Survey (ACS), 2011 2015 (released December 8, 2016), compared
What does your Community look like and how is it changing?
 What does your Community look like and how is it changing? Trends in the State population related to health and health determinants and where you can find this data to support your local work Who is Likely
Local Business Profile All Sectors - Fairfield city, Ohio. Contents. What will I find in this report? My Customers
 Local Business Profile All Sectors -, Contents What will I find in this report? My Customers The My Customers section provides summarized demographic information for,. This information provides a snapshot
Prepared for 2013 Federal Committee on Statistical Methodology Research Conference November 5, 2013
 Using Reimputation Methods to Estimate the Variances of Estimates of the American Community Survey Group Quarters Population with the New Group Quarters Imputation Prepared for 2013 Federal Committee on
ACS DEMOGRAPHIC AND HOUSING ESTIMATES American Community Survey 1-Year Estimates
 DP05 ACS DEMOGRAPHIC AND HOUSING ESTIMATES 2010 American Community Survey 1-Year s Supporting documentation on code lists, subject definitions, data accuracy, and statistical testing can be found on the
American Community Survey 5-Year Estimates
 DP05 ACS DEMOGRAPHIC AND HOUSING ESTIMATES 2011-2015 American Community Survey 5-Year Estimates Supporting documentation on code lists, subject definitions, data accuracy, and statistical testing can be
American Community Survey 5-Year Estimates
 DP05 ACS DEMOGRAPHIC AND HOUSING ESTIMATES 2011-2015 American Community Survey 5-Year Estimates Supporting documentation on code lists, subject definitions, data accuracy, and statistical testing can be
Risk and Technology Review - Analysis of Socio-Economic Factors for Populations Living Near Hard Chromium Electroplating Facilities
 Risk and Technology Review - Analysis of Socio-Economic Factors for Populations Living Near Hard Chromium Electroplating Facilities Prepared by: EC/R Incorporated 501 Eastowne Drive, Suite 250 Chapel Hill,
Tell us what you think. Provide feedback to help make American Community Survey data more useful for you.
 DP05 ACS DEMOGRAPHIC AND HOUSING ESTIMATES 2016 American Community Survey 1-Year Estimates Supporting documentation on code lists, subject definitions, data accuracy, and statistical testing can be found
Community Survey on ICT usage in households and by individuals 2010 Metadata / Quality report
 HH -p1 EU T H I S P L A C E C A N B E U S E D T O P L A C E T H E N S I N A M E A N D L O G O Community Survey on ICT usage in households and by 2010 Metadata / Quality report Please read this first!!!
ACS DEMOGRAPHIC AND HOUSING ESTIMATES American Community Survey 1-Year Estimates
 DP05 ACS DEMOGRAPHIC AND HOUSING ESTIMATES 2012 American Community Survey 1-Year Estimates Supporting documentation on code lists, subject definitions, data accuracy, and statistical testing can be found
American Community Survey 5-Year Estimates
 DP02 SELECTED SOCIAL CHARACTERISTICS IN THE UNITED STATES 2007-2011 American Community Survey 5-Year Estimates Supporting documentation on code lists, subject definitions, data accuracy, and statistical
APPENDIX 6: CENSUS DATA BURLINGTON, VERMONT
 APPENDIX 6: CENSUS DATA BURLINGTON, VERMONT 2000 CENSUS DATA 2005-2007 AMERICAN COMMUNITY SURVEY Burlington city, Vermont - Fact Sheet - American FactFinder Page 1 of 2 FACT SHEET Burlington
Congressional District Report For the 115th Congress
 Congressional District Report For the 115th Congress Arizona District 6 Honorable David Schweikert (R) May 2017 Report National Association of REALTORS Congressional District Report For the 115th Congress
Congressional District Report For the 115th Congress
 Congressional District Report For the 115th Congress Washington District 5 Honorable Cathy McMorris Rodgers (R) February 2017 Report National Association of REALTORS Congressional District Report For the
Confidence Intervals for Large Sample Proportions
 Confidence Intervals for Large Sample Proportions Dr Tom Ilvento Department of Food and Resource Economics Overview Confidence Intervals C.I. We will start with large sample C.I. for proportions, using
Small Area Health Insurance Estimates from the Census Bureau: 2008 and 2009
 October 2011 Small Area Health Insurance Estimates from the Census Bureau: 2008 and 2009 Introduction The U.S. Census Bureau s Small Area Health Insurance Estimates (SAHIE) program produces model based
ECONOMIC OVERVIEW DuPage County, Illinois
 ECONOMIC OVERVIEW DuPage County, Illinois DEMOGRAPHIC PROFILE... 3 EMPLOYMENT TRENDS... 5 UNEMPLOYMENT RATE... 5 WAGE TRENDS... 6 COST OF LIVING INDEX... 7 INDUSTRY SNAPSHOT... 8 OCCUPATION SNAPSHOT...
Audit Sampling: Steering in the Right Direction
 Audit Sampling: Steering in the Right Direction Jason McGlamery Director Audit Sampling Ryan, LLC Dallas, TX Jason.McGlamery@ryan.com Brad Tomlinson Senior Manager (non-attorney professional) Zaino Hall
Economic Overview. Lawrence, KS MSA
 Economic Overview Lawrence, KS MSA March 5, 2019 DEMOGRAPHIC PROFILE... 3 EMPLOYMENT TRENDS... 5 UNEMPLOYMENT RATE... 5 WAGE TRENDS... 6 COST OF LIVING INDEX... 7 INDUSTRY SNAPSHOT... 8 OCCUPATION SNAPSHOT...
Economic Overview Capital District
 August 29, 2017 Economic Overview Capital District Contact: Lisa.Montiel@suny.edu DEMOGRAPHIC PROFILE... 3 EMPLOYMENT TRENDS... 5 UNEMPLOYMENT RATE... 5 WAGE TRENDS... 6 COST OF LIVING INDEX... 6 INDUSTRY
Economic Overview City of Tyler, TX. January 8, 2018
 Economic Overview City of Tyler, TX January 8, 2018 DEMOGRAPHIC PROFILE...3 EMPLOYMENT TRENDS...5 WAGE TRENDS...5 COST OF LIVING INDEX...6 INDUSTRY SNAPSHOT...7 OCCUPATION SNAPSHOT...9 INDUSTRY CLUSTERS...
Shifting our focus. We were studying statistics (data, displays, sampling...) The next few lectures focus on probability (randomness) Why?
 The next few lectures focus on probability (randomness) Why?") Probability Introduction Shifting our focus We were studying statistics (data, displays, sampling...) The next few lectures focus on probability (randomness) Why? What is Probability? Probability is used
Probability Introduction Shifting our focus We were studying statistics (data, displays, sampling...) The next few lectures focus on probability (randomness) Why? What is Probability? Probability is used
Economic Overview York County, South Carolina. February 14, 2018
 Economic Overview York County, February 14, 2018 DEMOGRAPHIC PROFILE... 3 EMPLOYMENT TRENDS... 5 UNEMPLOYMENT RATE... 5 WAGE TRENDS... 6 COST OF LIVING INDEX... 6 INDUSTRY SNAPSHOT... 7 OCCUPATION SNAPSHOT...
Introduction to Survey Weights for National Adult Tobacco Survey. Sean Hu, MD., MS., DrPH. Office on Smoking and Health
 Introduction to Survey Weights for 2009-2010 National Adult Tobacco Survey Sean Hu, MD., MS., DrPH Office on Smoking and Health Presented to Webinar January 18, 2012 National Center for Chronic Disease
Economic Overview New York
 Report created on October 20, 2015 Economic Overview Created using: Contact: Lisa.Montiel@suny.edu DEMOGRAPHIC PROFILE...3 EMPLOYMENT TRENDS...5 UNEMPLOYMENT RATE...5 WAGE TRENDS...6 COST OF LIVING INDEX...6
Random Group Variance Adjustments When Hot Deck Imputation Is Used to Compensate for Nonresponse 1
 Random Group Variance Adjustments When Hot Deck Imputation Is Used to Compensate for Nonresponse 1 Richard A Moore, Jr., U.S. Census Bureau, Washington, DC 20233 Abstract The 2002 Survey of Business Owners
Economic Overview 45-Minute Commute From Airport Park. June 6, 2017
 Economic Overview 45-Minute Commute From Airport Park June 6, 2017 DEMOGRAPHIC PROFILE... 3 EMPLOYMENT TRENDS... 5 WAGE TRENDS... 5 COST OF LIVING INDEX... 6 INDUSTRY SNAPSHOT... 7 OCCUPATION SNAPSHOT...
Economic Overview Loudoun County, Virginia. October 23, 2017
 Economic Overview October 23, 2017 DEMOGRAPHIC PROFILE... 3 EMPLOYMENT TRENDS... 5 UNEMPLOYMENT RATE... 5 WAGE TRENDS... 6 COST OF LIVING INDEX... 6 INDUSTRY SNAPSHOT... 7 OCCUPATION SNAPSHOT... 9 INDUSTRY
Economic Overview Long Island
 Report created on August 29, 2017 Economic Overview Long Island Contact: Lisa.Montiel@suny.edu DEMOGRAPHIC PROFILE... 3 EMPLOYMENT TRENDS... 5 UNEMPLOYMENT RATE... 5 WAGE TRENDS... 6 COST OF LIVING INDEX...
Economic Overview Long Island
 Report created on October 20, 2015 Economic Overview Long Island Created using: Contact: Lisa.Montiel@suny.edu DEMOGRAPHIC PROFILE...3 EMPLOYMENT TRENDS...5 UNEMPLOYMENT RATE...5 WAGE TRENDS...6 COST OF
Economic Overview Monterey County, California. July 22, 2016
 Economic Overview Monterey July 22, 2016 DEMOGRAPHIC PROFILE... 3 EMPLOYMENT TRENDS... 5 UNEMPLOYMENT RATE... 5 WAGE TRENDS... 6 COST OF LIVING INDEX... 6 INDUSTRY SNAPSHOT... 7 OCCUPATION SNAPSHOT...
Yellow cells contain formulas. No data entry is required in these cells. Green cells require data entry. 1. Staff Demographics Summary
 Yellow cells contain formulas. No data entry is required in these cells. Green cells require data entry. 1. Staff Demographics Summary Staff Demographics Summary (as of December 2016) Total Minority White
DEMOGRAPHIC PROFILE...3 EMPLOYMENT TRENDS...5 UNEMPLOYMENT RATE...5 WAGE TRENDS...6 COST OF LIVING INDEX...6 INDUSTRY SNAPSHOT...7
 March 14, 2017 DEMOGRAPHIC PROFILE...3 EMPLOYMENT TRENDS...5 UNEMPLOYMENT RATE...5 WAGE TRENDS...6 COST OF LIVING INDEX...6 INDUSTRY SNAPSHOT...7 OCCUPATION SNAPSHOT...9 INDUSTRY CLUSTERS... 12 EDUCATION
Economic Overview Fairfax / Falls Church. October 23, 2017
 Economic Overview Fairfax / Falls Church October 23, 2017 DEMOGRAPHIC PROFILE... 3 EMPLOYMENT TRENDS... 5 UNEMPLOYMENT RATE... 5 WAGE TRENDS... 6 COST OF LIVING INDEX... 6 INDUSTRY SNAPSHOT... 7 OCCUPATION
Economic Overview Plant City Region. April 5, 2017
 Economic Overview Plant City Region April 5, 2017 DEMOGRAPHIC PROFILE... 3 EMPLOYMENT TRENDS... 5 WAGE TRENDS... 5 COST OF LIVING INDEX... 6 INDUSTRY SNAPSHOT... 7 OCCUPATION SNAPSHOT... 9 INDUSTRY CLUSTERS...
Economic Overview Western New York
 Report created on August 29, 2017 Economic Overview Western New Contact: Lisa.Montiel@suny.edu DEMOGRAPHIC PROFILE... 3 EMPLOYMENT TRENDS... 5 UNEMPLOYMENT RATE... 5 WAGE TRENDS... 6 COST OF LIVING INDEX...
October 28, Economic Overview Yellowstone County, Montana
 October 28, 2016 Economic Overview Yellowstone DEMOGRAPHIC PROFILE...3 EMPLOYMENT TRENDS...5 UNEMPLOYMENT RATE...5 WAGE TRENDS...6 COST OF LIVING INDEX...6 INDUSTRY SNAPSHOT...7 OCCUPATION SNAPSHOT...9
Rifle city Demographic and Economic Profile
 Rifle city Demographic and Economic Profile Community Quick Facts Population (2014) 9,289 Population Change 2010 to 2014 156 Place Median HH Income (ACS 10-14) $52,539 State Median HH Income (ACS 10-14)
PRIME COMMERCIAL LAND FOR SALE
 PRIME COMMERCIAL LAND AVENUE P-4 & 5 TH STREET WEST OUTSTANDING HWY. 14 EXPOSURE COMING SOON TRADE & COMMERCE CENTER HEART OF S RETAIL & BUSINESS CORRIDOR The depiction in the included photograph of any
LOCALLY ADMINISTERED SALES AND USE TAXES A REPORT PREPARED FOR THE INSTITUTE FOR PROFESSIONALS IN TAXATION
 LOCALLY ADMINISTERED SALES AND USE TAXES A REPORT PREPARED FOR THE INSTITUTE FOR PROFESSIONALS IN TAXATION PART II: ESTIMATED COSTS OF ADMINISTERING AND COMPLYING WITH LOCALLY ADMINISTERED SALES AND USE
Economic Overview Mohawk Valley
 Report created on August 29, 2017 Economic Overview Mohawk Valley Contact: Lisa.Montiel@suny.edu DEMOGRAPHIC PROFILE... 3 EMPLOYMENT TRENDS... 5 UNEMPLOYMENT RATE... 5 WAGE TRENDS... 6 COST OF LIVING INDEX...
June 9, Economic Overview Billings, MT MSA
 June 9, 2016 Economic Overview Billings, MT MSA DEMOGRAPHIC PROFILE... 3 EMPLOYMENT TRENDS... 5 UNEMPLOYMENT RATE... 5 WAGE TRENDS... 6 COST OF LIVING INDEX... 6 INDUSTRY SNAPSHOT... 7 OCCUPATION SNAPSHOT...
MEMORANDUM. Gloria Macdonald, Jennifer Benedict Nevada Division of Health Care Financing and Policy (DHCFP)
") MEMORANDUM To: From: Re: Gloria Macdonald, Jennifer Benedict Nevada Division of Health Care Financing and Policy (DHCFP) Bob Carey, Public Consulting Group (PCG) An Overview of the in the State of Nevada
MEMORANDUM To: From: Re: Gloria Macdonald, Jennifer Benedict Nevada Division of Health Care Financing and Policy (DHCFP) Bob Carey, Public Consulting Group (PCG) An Overview of the in the State of Nevada
Key Objectives. Module 2: The Logic of Statistical Inference. Z-scores. SGSB Workshop: Using Statistical Data to Make Decisions
 SGSB Workshop: Using Statistical Data to Make Decisions Module 2: The Logic of Statistical Inference Dr. Tom Ilvento January 2006 Dr. Mugdim Pašić Key Objectives Understand the logic of statistical inference
Economic Overview Prince William/Manassas. October 23, 2017
 Economic Overview Prince William/Manassas October 23, 2017 DEMOGRAPHIC PROFILE... 3 EMPLOYMENT TRENDS... 5 UNEMPLOYMENT RATE... 5 WAGE TRENDS... 6 COST OF LIVING INDEX... 6 INDUSTRY SNAPSHOT... 7 OCCUPATION
10% 21% 37% 24% 71% 10% PROFILE ASSETS & OPPORTUNITY KEY HIGHLIGHTS ABOUT THE PROFILE ASSETS & OPPORTUNITY PROFILE: NEW ORLEANS
 ASSETS & OPPORTUNITY PROFILE: NEW ORLEANS ASSETS & OPPORTUNITY PROFILE KEY HIGHLIGHTS of New Orleans working households don t have access to a vehicle Cities have long been thought of as places of opportunity
Descriptive Statistics: Measures of Central Tendency and Crosstabulation. 789mct_dispersion_asmp.pdf
 789mct_dispersion_asmp.pdf Michael Hallstone, Ph.D. hallston@hawaii.edu Lectures 7-9: Measures of Central Tendency, Dispersion, and Assumptions Lecture 7: Descriptive Statistics: Measures of Central Tendency
How the Census Bureau Measures Poverty With Selected Sources of Poverty Data
 How the Census Bureau Measures Poverty With Selected Sources of Poverty Data Alemayehu Bishaw Poverty Statistics Branch Social, Economic and Housing Statistics Division U. S. Census Bureau November 15-16,
2017:IVQ Nevada Unemployment Rate Demographics Report*
 2017:IVQ Nevada Unemployment Rate Demographics Report* Department of Employment, Training & Rehabilitation Research and Analysis Bureau Don Soderberg, Director Dennis Perea, Deputy Director David Schmidt,
ONE HUNDRED SEVENTH STREET ELEMENTARY
 ONE HUNDRED SEVENTH STREET ELEMENTARY UPDATED - 03/28/16 Public school 912 students CDS code: 19647336018535 SD: 88% AA: 22% FI: 0% LAUSD-S EL: 51% AI/AN : PI: 147 East 107th Street SWD: 9% AS: WH: 1%
An Integrated U.S. National Mortality Database by Immigration status - Promises and Issues
 An Integrated U.S. National Mortality Database by Immigration status - Promises and Issues Mandi Yu 1, Joe Zou 2, Benmei Liu 1, and Eric (Rocky) Feuer 1 1 : National Cancer Institute; 2 : Information Management
2016 Labor Market Profile
 2016 Labor Market Profile Prepared by The Tyler Economic Development Council Tyler Area Sponsor June 2016 The ability to demonstrate a regions availability of talented workers has become a vital tool
Discussion paper 1 Comparative labour statistics Labour force survey: first round pilot February 2000
 Discussion paper 1 Comparative labour statistics Labour force survey: first round pilot February 2000 Statistics South Africa 27 March 2001 DISCUSSION PAPER 1: COMPARATIVE LABOUR STATISTICS LABOUR FORCE
Survey Project & Profile
 Survey Project & Profile Title: Survey Organization: Sponsor: Indiana K-12 & School Choice Survey Braun Research Incorporated (BRI) The Foundation for Educational Choice Interview Dates: November 12-17,
PERCEPTIONS OF EXTREME WEATHER AND CLIMATE CHANGE IN VIRGINIA
 PERCEPTIONS OF EXTREME WEATHER AND CLIMATE CHANGE IN VIRGINIA A STATEWIDE SURVEY OF ADULTS Edward Maibach, Brittany Bloodhart, and Xiaoquan Zhao July 2013 This research was funded, in part, by the National
The following content is provided under a Creative Commons license. Your support
 MITOCW Recitation 6 The following content is provided under a Creative Commons license. Your support will help MIT OpenCourseWare continue to offer high quality educational resources for free. To make
Toronto s City #3: A Profile of Four Groups of Neighbourhoods
 Toronto s City #3: A Profile of Four Groups of Neighbourhoods A supplement to the Three Cities in Toronto analysis of trends, focused on City #3, the 40% of the City s neighbourhoods with the lowest incomes
Exploring the Geography of College Opportunity
 E D U C A T I O N P O L I C Y P R O G R A M Exploring the Geography of College Opportunity Data and Methodology Kristin Blagg and Victoria Rosenboom April 2018 Data Our analysis builds on the work we completed
Anomalies under Jackknife Variance Estimation Incorporating Rao-Shao Adjustment in the Medical Expenditure Panel Survey - Insurance Component 1
 Anomalies under Jackknife Variance Estimation Incorporating Rao-Shao Adjustment in the Medical Expenditure Panel Survey - Insurance Component 1 Robert M. Baskin 1, Matthew S. Thompson 2 1 Agency for Healthcare
Economic Overview Marlboro County Labor Shed. June 29, 2016
 Economic Overview Marlboro County Labor June 29, 2016 DEMOGRAPHIC PROFILE...3 EMPLOYMENT TRENDS...5 UNEMPLOYMENT RATE...5 WAGE TRENDS...6 COST OF LIVING INDEX...6 INDUSTRY SNAPSHOT...7 OCCUPATION SNAPSHOT...9
The coverage of young children in demographic surveys
 Statistical Journal of the IAOS 33 (2017) 321 333 321 DOI 10.3233/SJI-170376 IOS Press The coverage of young children in demographic surveys Eric B. Jensen and Howard R. Hogan U.S. Census Bureau, Washington,
Populations at Risk. Selected Geographies: Ellsworth County, KS. Benchmark Geography: U.S. Report Date: April 4, 2018
 Selected Geographies: Benchmark Geography: Report Date: April 4, 2018 Find more reports like this at headwaterseconomics.org/par Cover Headwaters Economics Headwaters Economics is an independent, nonprofit
Introduction to Alternative Statistical Methods. Or Stuff They Didn t Teach You in STAT 101
 Introduction to Alternative Statistical Methods Or Stuff They Didn t Teach You in STAT 101 Classical Statistics For the most part, classical statistics assumes normality, i.e., if all experimental units
DR. MAYA ANGELOU COMMUNITY HIGH
 DR. MAYA ANGELOU COMMUNITY HIGH UPDATED - 03/28/16 Public school 1248 students CDS code: 19647330124479 SD: 65% AA: 11% FI: LAUSD-C EL: 41% AI/AN :0% PI: 0% 300 East 53rd Street SWD: 14% AS: WH: 0% Los
2018:IIQ Nevada Unemployment Rate Demographics Report*
 2018:IIQ Nevada Unemployment Rate Demographics Report* Department of Employment, Training & Rehabilitation Research and Analysis Bureau Don Soderberg, Director Dennis Perea, Deputy Director David Schmidt,
Application for Benefits Medicaid Buy-In for Children
 Texas Health and Human Services Commission Form H1200-MBIC Cover Letter January 2011 Application for Benefits Medicaid Buy-In for Children About this program: Medicaid Buy-In for Children can help pay
Design of a Multi-Stage Stratified Sample for Poverty and Welfare Monitoring with Multiple Objectives
 Policy Research Working Paper 7989 WPS7989 Design of a Multi-Stage Stratified Sample for Poverty and Welfare Monitoring with Multiple Objectives A Bangladesh Case Study Faizuddin Ahmed Dipankar Roy Monica
Chapter 5 Basic Probability
 Chapter 5 Basic Probability Probability is determining the probability that a particular event will occur. Probability of occurrence = / T where = the number of ways in which a particular event occurs
JOHN C. FREMONT SENIOR HIGH
 JOHN C. FREMONT SENIOR HIGH UPDATED - 03/28/16 Public school 2143 students CDS code: 19647331933118 SD: 88% AA: 8% FI: LAUSD-S EL: 38% AI/AN :0% PI: 7676 South San Pedro Street SWD: 13% AS: 0% WH: 1% Los
Are Affordability Perceptions Reducing Household Mobility and Exacerbating the Housing Shortage?
 Are Affordability Perceptions Reducing Household Mobility and Exacerbating the Housing Shortage? National Housing Survey Topic Analysis Q4 2017 Published on June 27, 2018 2018 Fannie Mae. Trademarks of
Population, Housing, and Employment Methodology
 Appendix O Population, Housing, and Employment Methodology Final EIR APPENDIX O Methodology Population, Housing, and Employment Methodology This appendix describes the data sources and methodologies employed
Demographic Survey of Texas Lottery Players 2011
 Demographic Survey of Texas Lottery Players 2011 December 2011 i TABLE OF CONTENTS List of Figures... ii List of Tables... iii Executive Summary... 1 I. Introduction and Method of Analysis... 5 II. Sample
LIHEAP Targeting Performance Measurement Statistics:
 LIHEAP Targeting Performance Measurement Statistics: GPRA Validation of Estimation Procedures Final Report Prepared for: Division of Energy Assistance Office of Community Services Administration for Children
Planning Sample Size for Randomized Evaluations
 Planning Sample Size for Randomized Evaluations Jed Friedman, World Bank SIEF Regional Impact Evaluation Workshop Beijing, China July 2009 Adapted from slides by Esther Duflo, J-PAL Planning Sample Size
LEADERSHIP IN ENTERTAINMENT AND MEDIA ARTS (LEMA)
") LEADERSHIP IN ENTERTAINMENT AND MEDIA ARTS (LEMA) UPDATED - 03/28/16 Public school 228 students CDS code: 19647330125963 SD: 68% AA: 2% FI: LAUSD-E EL: 34% AI/AN : PI: 3501 North Broadway SWD: 27% AS:
LEADERSHIP IN ENTERTAINMENT AND MEDIA ARTS (LEMA) UPDATED - 03/28/16 Public school 228 students CDS code: 19647330125963 SD: 68% AA: 2% FI: LAUSD-E EL: 34% AI/AN : PI: 3501 North Broadway SWD: 27% AS:
Discussion paper 1 Comparative labour statistics Labour force survey: first round pilot February 2000
 Discussion paper 1 Comparative labour statistics Labour force survey: first round pilot February 2000 Statistics South Africa 27 March 2001 DISCUSSION PAPER 1: COMPARATIVE LABOUR STATISTICS LABOUR FORCE
February 5, Re: CAC Program Regulations. Dear Ms. Soto-Taylor:
 February 5, 2014 Sarah Soto-Taylor, Deputy Director, Stakeholder Engagement Covered California 560 J St., Suite 290 Sacramento, CA 95814 Submitted electronically to gil.duran@covered.ca.gov Re: CAC Program
Click to edit Master text styles
 For those dialing in: All phones are muted Second Submit questions level using the chat window at any time during Third the level webinar Troubleshooting: Call Readytalk s help line: (800) 843-9166 Ask
Methods and Data for Developing Coordinated Population Forecasts
 Methods and Data for Developing Coordinated Population Forecasts Prepared by Population Research Center College of Urban and Public Affairs Portland State University March 2017 Table of Contents Introduction...
Exploring the Geography of College Opportunity
 E D U C A T I O N P O L I C Y P R O G R A M Exploring the Geography of College Opportunity Data and Methodology Kristin Blagg and Victoria Rosenboom April 2018 (updated May 2018) Data Our analysis builds
U.S. Microenterprise Census Highlights, FY2013
 U.S. Microenterprise Census Highlights, FY2013 Size of the field Based on extrapolations from the U.S. Microenterprise Census data, FIELD estimates that the U.S. microenterprise industry assisted 357,958
Copyright 2011 Pearson Education, Inc. Publishing as Addison-Wesley.
 Appendix: Statistics in Action Part I Financial Time Series 1. These data show the effects of stock splits. If you investigate further, you ll find that most of these splits (such as in May 1970) are 3-for-1
MA 1125 Lecture 05 - Measures of Spread. Wednesday, September 6, Objectives: Introduce variance, standard deviation, range.
 MA 115 Lecture 05 - Measures of Spread Wednesday, September 6, 017 Objectives: Introduce variance, standard deviation, range. 1. Measures of Spread In Lecture 04, we looked at several measures of central
THE VALUE OF AN INVESTMENT & INSURANCE CUSTOMER TO A BANK
 THE VALUE OF AN INVESTMENT & INSURANCE CUSTOMER TO A BANK 2012 by Strategic Business Insights and K&C Partners. Unauthorized use or reproduction prohibited. TABLE OF CONTENTS THE VALUE OF AN INVESTMENT
Basic Procedure for Histograms
 Basic Procedure for Histograms 1. Compute the range of observations (min. & max. value) 2. Choose an initial # of classes (most likely based on the range of values, try and find a number of classes that