What does your Community look like and how is it changing?
|
|
|
- Nancy Waters
- 5 years ago
- Views:
Transcription


1 What does your Community look like and how is it changing? Trends in the State population related to health and health determinants and where you can find this data to support your local work Who is Likely to be in your Health Community? People living in your community What is happening to your population base? People who have poorer health What does that make your community look like? Other trends in the country or state that can impact your Health Community? Population Changes from 2000 to


2 Current Population by County Who in Community is likely to be in Poorer Health? Health is determined by a bundle of factors We are going to look at these determinants separately to build the Health community profile Determinants of Health VARIABLES Tobacco use Diet & Exercise Alcohol use Sexual Behavior Access to / Quality of Care Education / Employment Physical Environment 2


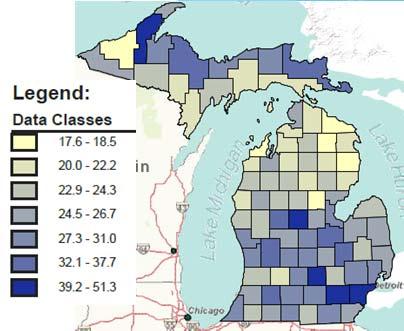
3 Insurance Coverage in Michigan 100.0% 90.0% Michigan Health Insurance Status Over Time 89.0% 87.8% 87.6% 88.2% 80.0% 70.0% 60.0% 73.1% 69.9% 68.6% 68.4% 50.0% 40.0% 30.0% 29.6% 31.6% 33.2% 33.9% 20.0% 10.0% 0.0% 11.0% 12.2% 12.4% 11.8% Have Health Insurance No Health Insurance Private Health Insurance Public Health Insurance 20.0% Demographics of Michigan s Uninsured Age & Gender 18.0% 17.5% 16.0% 14.0% 13.7% 12.0% 10.0% 10.3% 8.0% 6.0% 4.0% 4.2% 2.0% 0.0% 0.4% Under years 65 years and older Male Female Median Age by County 3


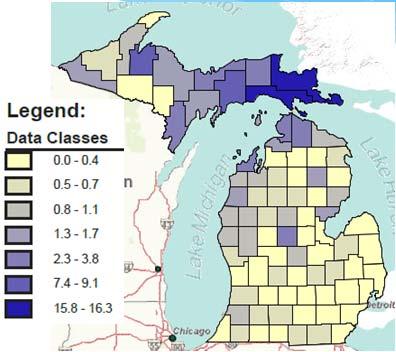
4 Impact of Median Age by County Number of Uninsured Year olds in County Health Status: Gender & Marital Status How are these linked? What are the state trends & County Demographics? 4


5 Trends on Marital Status Now Married by County Never Married by County 5


6 Fertility of Unmarried Demographics of Michigan s Uninsured Race/Ethnicity 35.0% 30.0% 29.1% 27.7% 25.0% 22.2% 20.0% 19.4% 15.8% 15.0% 10.7% 11.5% 11.5% 10.0% 5.0% 0.0% White Afr. American American Asian Native Other Race Two or More Hispanic Indian Hawaiian Race/Ethnicity Changes from 2000 to


7 Percentage of African Americans by County Percentage of Hispanics by County Percentage of Native Americans by County 7


 by County Number of Less than HS")
8 Demographics of Michigan s Uninsured Education Level 25.0% 20.0% 19.5% 16.0% 15.0% 13.7% 10.0% 5.6% 5.0% 0.0% Less than HS HS/GED Some College Bachelor's Degree+ Education Less than HS (9 12 th Completed) by County Number of Less than HS Completed with No Insurance by County 8
")


9 Education Levels High School Diploma (2011) Number of High School with No Insurance by County Education Level Some College (2011) 9


10 Number of Some College with No Insurance by County Education Level BA+ Number College Degree with No Insurance by County 10


11 45.0% 40.0% Demographics of Michigan s Uninsured Work Status 40.8% 35.0% 30.0% 25.0% 23.1% 20.0% 17.7% 15.0% 10.0% 14.0% 8.6% 10.1% 11.9% 5.0% 0.0% In Labor Force Employed Unemployed Not in Labor ForceWorking Full TimeWorking Part time Did not Work Unemployment Rates 2012 Change in Unemployment from 5 years 11


12 Change in Unemployment Rate over 3 Years Percent Not In Labor Force by County Percentage Self Employed in Labor Force by County 12


13 Working Part Time and in Poverty by County Number Working Full Time and Receiving Public Insurance Household Income Trends 13

14 Household Median Income by County Percentage receiving SNAP benefits by County 25.0% Demographics of Michigan s Uninsured Depth of Poverty 21.9% 20.0% 18.4% 15.0% 12.1% 10.0% 7.3% 5.0% 0.0% All Uninsured with Pov. calculated Under 1.38 Poverty Poverty 2.00 Poverty and over 14


 % Change in")
15 Poverty Rates for State Over Time Poverty Rate for State of Michigan Percentage of All persons in Poverty (2011) % Change in Poverty from
 in")


16 Percentage of Older Persons (65+) in Poverty (2011) Percentage of Children in Poverty (2011) Trends of Children in Poverty 16


17 Uninsured Percentage of those who are who are uninsured & below 200% of Poverty Number of Uninsured below 200% of poverty 35.0% Demographics of Michigan s Uninsured Nativity 30.0% 30.0% 25.0% 20.0% 15.0% 13.9% 11.3% 10.0% 5.0% 0.0% Native Born Foreign Born Naturalized Foreign Born Not a Citizen 17


18 Percent of Foreign Born by County Percent Who Lived Abroad 1 Year Ago by County Percent with Language Other than English Spoken at Home by County 18


 19")
19 Housing Living in Old Housing by County Housing Percentage Renters Housing Median Rent (2011) 19


20 Housing Percentage of Renters paying 35% or more of income to Housing Costs Housing Percentage of Homeowners paying 35% or more of income to Housing Costs Housing Overcrowding in Housing Percent of housing where are 1.01 to 1.5 occupants per room Percent of housing where are 1.5 or more occupants per room 20


21 Housing Conditions Lack of Telephone by County Housing Moving Moving & in Poverty by County 21


22 Finding this Public Data for Your County American FactFinder Search ts.xhtml?refresh=t PolicyMap. Good Data. Smart Decisions. Michigan Labor Market Information, Mi Fast Facts, HOME Rankings County Health Rankings & Roadmaps Using American Fact Finder Getting a Report 22


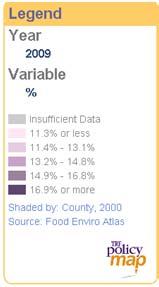
23 Using Policy Map Adult Obesity Rate 2009 Low Income Child Obesity


24 Using County Health Rankings The RWJ Scorecard RWJ Additional Measures 24
25 Questions? 25
TABLE 1. PROFILE OF GENERAL DEMOGRAPHIC CHARACTERISTICS
 Waterloo city, Iowa TABLE 1. PROFILE OF GENERAL DEMOGRAPHIC CHARACTERISTICS Estimate Lower Bound Upper Bound Total population 66,659 64,093 69,225 SEX AND AGE Male 32,096 30,415 33,777 Female 34,563 33,025
SDs from Regional Peer Group Mean. SDs from Size Peer Group Mean
 Family: Population Demographics Population Entire MSA 602894 Central Cities (CC) 227,818 Outside Central Cities 375,076 Percent of Entire MSA 37.79% Population in CC Percent Change in Population from 1999
SDs from Regional Peer Group Mean. SDs from Size Peer Group Mean
 Family: Population Demographics Population Entire MSA 1187941 Central Cities (CC) 511,843 Outside Central Cities 676,098 Percent of Entire MSA 43.09% Population in CC Percent Change in Population from
SDs from Regional Peer Group Mean. SDs from Size Peer Group Mean
 Family: Population Demographics Population Entire MSA 661645 Central Cities (CC) 247,057 Outside Central Cities 414,588 Percent of Entire MSA 37.34% Population in CC Percent Change in Population from 1999
SDs from Regional Peer Group Mean. SDs from Size Peer Group Mean
 Family: Population Demographics Population Entire MSA 583845 Central Cities (CC) 316,649 Outside Central Cities 267,196 Percent of Entire MSA 54.24% Population in CC Percent Change in Population from 1999
SDs from Regional Peer Group Mean. SDs from Size Peer Group Mean
 Family: Population Demographics Population Entire MSA 1251509 Central Cities (CC) 540,423 Outside Central Cities 711,086 Percent of Entire MSA 43.18% Population in CC Percent Change in Population from
SDs from Regional Peer Group Mean. SDs from Size Peer Group Mean
 Family: Population Demographics Population Entire MSA 1135614 Central Cities (CC) 677,766 Outside Central Cities 457,848 Percent of Entire MSA 59.68% Population in CC Percent Change in Population from
SDs from Regional Peer Group Mean. SDs from Size Peer Group Mean
 Family: Population Demographics Population Entire MSA 591932 Central Cities (CC) 260,970 Outside Central Cities 330,962 Percent of Entire MSA 44.09% Population in CC Percent Change in Population from 1999
SDs from Regional Peer Group Mean. SDs from Size Peer Group Mean
 Family: Population Demographics Population Entire MSA 1100491 Central Cities (CC) 735,617 Outside Central Cities 364,874 Percent of Entire MSA 66.84% Population in CC Percent Change in Population from
SDs from Regional Peer Group Mean. SDs from Size Peer Group Mean
 Family: Population Demographics Population Entire MSA 540258 Central Cities (CC) 198,915 Outside Central Cities 341,343 Percent of Entire MSA 36.82% Population in CC Percent Change in Population from 1999
SDs from Regional Peer Group Mean. SDs from Size Peer Group Mean
 Family: Population Demographics Population Entire MSA 1249763 Central Cities (CC) 691,295 Outside Central Cities 558,468 Percent of Entire MSA 55.31% Population in CC Percent Change in Population from
SDs from Regional Peer Group Mean. SDs from Size Peer Group Mean
 Family: Population Demographics Population Entire MSA 1088514 Central Cities (CC) 272,953 Outside Central Cities 815,561 Percent of Entire MSA 25.08% Population in CC Percent Change in Population from
SDs from Regional Peer Group Mean. SDs from Size Peer Group Mean
 Family: Population Demographics Population Entire MSA 922516 Central Cities (CC) 470,859 Outside Central Cities 451,657 Percent of Entire MSA 51.04% Population in CC Percent Change in Population from 1999
SDs from Regional Peer Group Mean. SDs from Size Peer Group Mean
 Family: Population Demographics Population Entire MSA 687249 Central Cities (CC) 198,500 Outside Central Cities 488,749 Percent of Entire MSA 28.88% Population in CC Percent Change in Population from 1999
SDs from Regional Peer Group Mean. SDs from Size Peer Group Mean
 Family: Population Demographics Population Entire MSA 542149 Central Cities (CC) 181870 Outside Central Cities 360279 Percent of Entire MSA 33.55% Population in CC Percent Change in Population from 1999
SDs from Regional Peer Group Mean. SDs from Size Peer Group Mean
 Family: Population Demographics Population Entire MSA 1025598 Central Cities (CC) 293,834 Outside Central Cities 731,764 Percent of Entire MSA 28.65% Population in CC Percent Change in Population from
SDs from Regional Peer Group Mean. SDs from Size Peer Group Mean
 Family: Population Demographics Population Entire MSA 875583 Central Cities (CC) 232,835 Outside Central Cities 642,748 Percent of Entire MSA 26.59% Population in CC Percent Change in Population from 1999
SDs from Regional Peer Group Mean. SDs from Size Peer Group Mean
 Family: Population Demographics Population Entire MSA 716998 Central Cities (CC) 448,275 Outside Central Cities 268,723 Percent of Entire MSA 62.52% Population in CC Percent Change in Population from 1999
SDs from Regional Peer Group Mean. SDs from Size Peer Group Mean
 Family: Population Demographics Population Entire MSA 1333914 Central Cities (CC) 284,943 Outside Central Cities 1,048,971 Percent of Entire MSA 21.36% Population in CC Percent Change in Population from
SDs from Regional Peer Group Mean. SDs from Size Peer Group Mean
 Family: Population Demographics Population Entire MSA 712738 Central Cities (CC) 448,607 Outside Central Cities 264,131 Percent of Entire MSA 62.94% Population in CC Percent Change in Population from 1999
SDs from Regional Peer Group Mean. SDs from Size Peer Group Mean. Population Entire MSA
 Family: Population Demographics Population Entire MSA 1169641 Central Cities (CC) 0 Outside Central Cities 1,169,641 Percent of Entire MSA 0% Population in CC Percent Change in Population from 1999 to
SDs from Regional Peer Group Mean. SDs from Size Peer Group Mean
 Family: Population Demographics Population Entire MSA 3251876 Central Cities (CC) 2,078,750 Outside Central Cities 1,173,126 Percent of Entire MSA 63.92% Population in CC Percent Change in Population from
SDs from Regional Peer Group Mean. SDs from Size Peer Group Mean
 Family: Population Demographics Population Entire MSA 1592383 Central Cities (CC) 1,181,140 Outside Central Cities 411,243 Percent of Entire MSA 74.17% Population in CC Percent Change in Population from
SDs from Regional Peer Group Mean. SDs from Size Peer Group Mean
 Family: Population Demographics Population Entire MSA 1776062 Central Cities (CC) 716,793 Outside Central Cities 1,059,269 Percent of Entire MSA 40.36% Population in CC Percent Change in Population from
SDs from Regional Peer Group Mean. SDs from Size Peer Group Mean
 Family: Population Demographics Population Entire MSA 4112198 Central Cities (CC) 416,474 Outside Central Cities 3,695,724 Percent of Entire MSA 10.13% Population in CC Percent Change in Population from
SDs from Regional Peer Group Mean. SDs from Size Peer Group Mean
 Family: Population Demographics Population Entire MSA 9519338 Central Cities (CC) 4408996 Outside Central Cities 5110342 Percent of Entire MSA 46.32% Population in CC Percent Change in Population from
SDs from Regional Peer Group Mean. SDs from Size Peer Group Mean
 Family: Population Demographics Population Entire MSA 1623018 Central Cities (CC) 152397 Outside Central Cities 1470621 Percent of Entire MSA 9.39% Population in CC Percent Change in Population from 1999
SDs from Regional Peer Group Mean. SDs from Size Peer Group Mean
 Family: Population Demographics Population Entire MSA 1731183 Central Cities (CC) 776733 Outside Central Cities 954450 Percent of Entire MSA 44.87% Population in CC Percent Change in Population from 1999
SDs from Regional Peer Group Mean. SDs from Size Peer Group Mean
 Family: Population Demographics Population Entire MSA 2968806 Central Cities (CC) 669,769 Outside Central Cities 2,299,037 Percent of Entire MSA 22.56% Population in CC Percent Change in Population from
SDs from Regional Peer Group Mean. SDs from Size Peer Group Mean
 Family: Population Demographics Population Entire MSA 2846289 Central Cities (CC) 809063 Outside Central Cities 2037226 Percent of Entire MSA 28.43% Population in CC Percent Change in Population from 1999
SDs from Regional Peer Group Mean. SDs from Size Peer Group Mean
 Family: Population Demographics Population Entire MSA 4441551 Central Cities (CC) 1147720 Outside Central Cities 3293831 Percent of Entire MSA 25.84% Population in CC Percent Change in Population from
SDs from Regional Peer Group Mean. SDs from Size Peer Group Mean
 Family: Population Demographics Population Entire MSA 1500741 Central Cities (CC) 661799 Outside Central Cities 838942 Percent of Entire MSA 44.1% Population in CC Percent Change in Population from 1999
SDs from Regional Peer Group Mean. SDs from Size Peer Group Mean
 Family: Population Demographics Population Entire MSA 2552994 Central Cities (CC) 686992 Outside Central Cities 1866002 Percent of Entire MSA 26.91% Population in CC Percent Change in Population from 1999
SDs from Regional Peer Group Mean. SDs from Size Peer Group Mean
 Family: Population Demographics Population Entire MSA 2414616 Central Cities (CC) 764431 Outside Central Cities 1650185 Percent of Entire MSA 31.66% Population in CC Percent Change in Population from 1999
Town Profiles: Demographic, Economic, and Housing Statistics for De Smet City and Wall Town, SOuth Dakota
 South Dakota State University Open PRAIRIE: Open Public Research Access Institutional Repository and Information Exchange Census Data Center News Releases SDSU Census Data Center 12-7-2017 Town Profiles:
Commission District 4 Census Data Aggregation
 Commission District 4 Census Data Aggregation 2011-2015 American Community Survey Data, U.S. Census Bureau Table 1 (page 2) Table 2 (page 2) Table 3 (page 3) Table 4 (page 4) Table 5 (page 4) Table 6 (page
Northwest Census Data Aggregation
 Northwest Census Data Aggregation 2011-2015 American Community Survey Data, U.S. Census Bureau Table 1 (page 2) Table 2 (page 2) Table 3 (page 3) Table 4 (page 4) Table 5 (page 4) Table 6 (page 5) Table
Riverview Census Data Aggregation
 Riverview Census Data Aggregation 2011-2015 American Community Survey Data, U.S. Census Bureau Table 1 (page 2) Table 2 (page 2) Table 3 (page 3) Table 4 (page 4) Table 5 (page 4) Table 6 (page 5) Table
Zipe Code Census Data Aggregation
 Zipe Code 66101 Census Data Aggregation 2011-2015 American Community Survey Data, U.S. Census Bureau Table 1 (page 2) Table 2 (page 2) Table 3 (page 3) Table 4 (page 4) Table 5 (page 4) Table 6 (page 5)
Zipe Code Census Data Aggregation
 Zipe Code 66103 Census Data Aggregation 2011-2015 American Community Survey Data, U.S. Census Bureau Table 1 (page 2) Table 2 (page 2) Table 3 (page 3) Table 4 (page 4) Table 5 (page 4) Table 6 (page 5)
Mid - City Industrial
 Minneapolis neighborhood profile October 2011 Mid - City Industrial About this area The Mid-City Industrial neighborhood is bordered by I- 35W, Highway 280, East Hennepin Avenue, and Winter Street Northeast.
APPENDIX 6: CENSUS DATA BURLINGTON, VERMONT
 APPENDIX 6: CENSUS DATA BURLINGTON, VERMONT 2000 CENSUS DATA 2005-2007 AMERICAN COMMUNITY SURVEY Burlington city, Vermont - Fact Sheet - American FactFinder Page 1 of 2 FACT SHEET Burlington
ACS DEMOGRAPHIC AND HOUSING ESTIMATES American Community Survey 1-Year Estimates
 DP05 ACS DEMOGRAPHIC AND HOUSING ESTIMATES 2012 American Community Survey 1-Year Estimates Supporting documentation on code lists, subject definitions, data accuracy, and statistical testing can be found
University of Minnesota
 neighborhood profile October 2011 About this area The University neighborhood is bordered by 11th Avenue Southeast, University Avenue, 15th Avenue Southeast, the railroad tracks, Oak Street, and the Mississippi
PROPOSED SHOPPING CENTER
 PROPOSED SHOPPING CENTER Southeast Corner I-95 & Highway 192 Melbourne, Florida In a 5 Mile Radius 80,862 Population 32,408 Households $61K Avg HH Income SOONER INVESTMENT Commercial & Investment Real
Camden Industrial. Minneapolis neighborhood profile. About this area. Trends in the area. Neighborhood in Minneapolis.
 Minneapolis neighborhood profile October 2011 Camden Industrial About this area The Camden Industrial neighborhood is bordered by 48th Avenue North, the Mississippi River, Dowling Avenue North, Washington
Shingle Creek. Minneapolis neighborhood profile. About this area. Trends in the area. Neighborhood in Minneapolis. October 2011
 neighborhood profile October 2011 About this area The neighborhood is bordered by 53rd Avenue North, Humboldt Avenue North, 49th Avenue North, and Xerxes Avenue North. It is home to Olson Middle School.
ACS DEMOGRAPHIC AND HOUSING ESTIMATES American Community Survey 1-Year Estimates
 DP05 ACS DEMOGRAPHIC AND HOUSING ESTIMATES 2010 American Community Survey 1-Year s Supporting documentation on code lists, subject definitions, data accuracy, and statistical testing can be found on the
American Community Survey 5-Year Estimates
 DP05 ACS DEMOGRAPHIC AND HOUSING ESTIMATES 2011-2015 American Community Survey 5-Year Estimates Supporting documentation on code lists, subject definitions, data accuracy, and statistical testing can be
American Community Survey 5-Year Estimates
 DP05 ACS DEMOGRAPHIC AND HOUSING ESTIMATES 2011-2015 American Community Survey 5-Year Estimates Supporting documentation on code lists, subject definitions, data accuracy, and statistical testing can be
Tell us what you think. Provide feedback to help make American Community Survey data more useful for you.
 DP05 ACS DEMOGRAPHIC AND HOUSING ESTIMATES 2016 American Community Survey 1-Year Estimates Supporting documentation on code lists, subject definitions, data accuracy, and statistical testing can be found
American Community Survey 5-Year Estimates
 DP02 SELECTED SOCIAL CHARACTERISTICS IN THE UNITED STATES 2007-2011 American Community Survey 5-Year Estimates Supporting documentation on code lists, subject definitions, data accuracy, and statistical
FAMILY ASSETS FOR INDEPENDENCE IN MINNESOTA (FAIM) FAIM New Participant Application Form AGENCY USE ONLY : Agency Name:
 FAIM New Participant Application Form AGENCY USE ONLY : Agency Name:") FAMILY ASSETS FOR INDEPENDENCE IN MINNESOTA (FAIM) AGENCY USE ONLY : FAIM New Participant Application Form Revised 05/23/14 Agency Name: Bank Account Number of 1 st Deposit Asset Grant First Name MI Last
FAMILY ASSETS FOR INDEPENDENCE IN MINNESOTA (FAIM) AGENCY USE ONLY : FAIM New Participant Application Form Revised 05/23/14 Agency Name: Bank Account Number of 1 st Deposit Asset Grant First Name MI Last
MEMORANDUM. Gloria Macdonald, Jennifer Benedict Nevada Division of Health Care Financing and Policy (DHCFP)
") MEMORANDUM To: From: Re: Gloria Macdonald, Jennifer Benedict Nevada Division of Health Care Financing and Policy (DHCFP) Bob Carey, Public Consulting Group (PCG) An Overview of the in the State of Nevada
MEMORANDUM To: From: Re: Gloria Macdonald, Jennifer Benedict Nevada Division of Health Care Financing and Policy (DHCFP) Bob Carey, Public Consulting Group (PCG) An Overview of the in the State of Nevada
Appendix Table 1: Rate of Uninsurance by Select Demographics (2015 to 2017)
") Appendix Table 1: Rate of Uninsurance by Select Demographics (2015 to 2017) Appendix Table 1: Rate of Uninsurance by Uninsurance Rate Select Demographics (2015 to 2017) 2015 2017 Statewide 4.3% 6.3% *
Appendix Table 1: Rate of Uninsurance by Select Demographics (2015 to 2017) Appendix Table 1: Rate of Uninsurance by Uninsurance Rate Select Demographics (2015 to 2017) 2015 2017 Statewide 4.3% 6.3% *
Independence, MO Data Profile 2015
 , MO Data Profile 2015 5 year American Community Survey (ACS) Jackson County, Missouri Data sources: U.S. Census Bureau, American Community Survey (ACS), 2011 2015 (released December 8, 2016), compared
Demographic and Other Statistics for Women and Men Aged 50 and Older,
 Demographic and Other Statistics for Women and Men Aged 50 and Older, 1999-2001 Population in 2001 Proportion of Population Over Age 50 30.0 % 28.6 % 28.6 % 25.2 % Age Distribution: 50-61 41.9 49.6 45.5
1. APPLICANT INFORMATION. Co-Applicant (spouse must be Co-Applicant) Name Male Female Name Male Female
 Name Male Female Name Male Female") Return by on to: Habitat for Humanity of Greater Plainfield & Middlesex County 2 Randolph Road Plainfield, NJ 07060 Include 25 processing fee in check or money order only. Questions? Call Plainfield Habitat
Return by on to: Habitat for Humanity of Greater Plainfield & Middlesex County 2 Randolph Road Plainfield, NJ 07060 Include 25 processing fee in check or money order only. Questions? Call Plainfield Habitat
Tyler Area Economic Overview
 Tyler Area Economic Overview Demographic Profile. 2 Unemployment Rate. 4 Wage Trends. 4 Cost of Living Index...... 5 Industry Clusters. 5 Occupation Snapshot. 6 Education Levels 7 Gross Domestic Product
Women in the Labor Force: A Databook
 Cornell University ILR School DigitalCommons@ILR Federal Publications Key Workplace Documents 9-2007 Women in the Labor Force: A Databook Bureau of Labor Statistics Follow this and additional works at:
Population Age, Sex, and Race Language Employment Households, Income, and Poverty. Date last updated: Refresh cycle:
 Demographics Section Demographics Date last updated: Refresh cycle: Demographics are the statistical data of a population. Age, income, education, sex and race are all examples of demographic characteristics.
In Baltimore City today, 20% of households live in poverty, but more than half of the
 Building Economic Opportunity in Baltimore: A Data Profile Baltimore Highlights In Baltimore City today, 20% of households live in poverty, but more than half of the city s population 55% is financially
The Trails. 1,500 sf Space Available. In a 3 Mile Radius 69,985 Population 25,450 Households $78,216 Avg HH Inc. 1,500 sf Corner Space
 1,500 sf Space Available The Trails Edmond Rd (2nd St) & Santa Fe Ave ~ Edmond, Oklahoma Current Tenancy: Edmond YMCA Spinal Wellness Clinic Lemongrass Thai Cuisine Kumon Learning Center Katie s Family
Women in the Labor Force: A Databook
 Cornell University ILR School DigitalCommons@ILR Federal Publications Key Workplace Documents 2-2013 Women in the Labor Force: A Databook Bureau of Labor Statistics Follow this and additional works at:
Assets of Low Income Households by SNAP Eligibility and Participation in Final Report. October 19, Carole Trippe Bruce Schechter
 Assets of Low Income Households by SNAP Eligibility and Participation in 2010 Final Report October 19, 2010 Carole Trippe Bruce Schechter This page has been left blank for double-sided copying. Contract
Women in the Labor Force: A Databook
 Cornell University ILR School DigitalCommons@ILR Federal Publications Key Workplace Documents 12-2011 Women in the Labor Force: A Databook Bureau of Labor Statistics Follow this and additional works at:
Homebuyer Application
 Homebuyer Application Follow these steps to submit an application to purchase Montana Street Homes As part of this application you will need to: Provide copies of pay stubs and bank statements for the
Women in the Labor Force: A Databook
 Cornell University ILR School DigitalCommons@ILR Federal Publications Key Workplace Documents 12-2010 Women in the Labor Force: A Databook Bureau of Labor Statistics Follow this and additional works at:
Gallatin County. Montana Poverty Report Card
 1 County Poverty Report Card June 216 Summary The poverty rate for County increased from 13.% in 21 to 14.% in 213. For the month of December in 211 and 214, the county s unemployment rate decreased from
Missoula County. Montana Poverty Report Card
 1 County Poverty Report Card June 216 Summary The poverty rate for County decreased from 17.3% in 21 to 16.% in 213. For the month of December in 211 and 214, the county s unemployment rate decreased from
Economic Overview City of Tyler, TX. January 8, 2018
 Economic Overview City of Tyler, TX January 8, 2018 DEMOGRAPHIC PROFILE...3 EMPLOYMENT TRENDS...5 WAGE TRENDS...5 COST OF LIVING INDEX...6 INDUSTRY SNAPSHOT...7 OCCUPATION SNAPSHOT...9 INDUSTRY CLUSTERS...
1. Who is entering the data into this survey? Note: This should be the name of the Navigator, NOT the name of the client.
 Survey Instructions Please complete this survey within 60 days of a client beginning Navigator services. In order to complete this survey you will need to interview the client. To conduct the interview
2018:IIIQ Nevada Unemployment Rate Demographics Report*
 2018:IIIQ Nevada Unemployment Rate Demographics Report* Department of Employment, Training & Rehabilitation Research and Analysis Bureau Dr. Tiffany Tyler-Garner, Director Dennis Perea, Deputy Director
Ravalli County. Montana Poverty Report Card
 1 County Poverty Report Card June 216 Summary The poverty rate for County increased from 15.% in 21 to 16.8% in 213. For the month of December in 211 and 214, the county s unemployment rate decreased from
Granite County. Montana Poverty Report Card
 1 County Poverty Report Card June 216 Summary The poverty rate for County increased from 12.1% in 21 to 15.1% in 213. For the month of December in 211 and 214, the county s unemployment rate decreased
Trend Analysis of Changes to Population and Income in Philadelphia, using American Community Survey (ACS) Data
 Data") OFFICE OF THE PRESIDENT FINANCE AND BUDGET TEAM City Council of Philadelphia 9.22.17 Trend Analysis of Changes to Population and Income in Philadelphia, using 2010-2016 American Community Survey (ACS)
OFFICE OF THE PRESIDENT FINANCE AND BUDGET TEAM City Council of Philadelphia 9.22.17 Trend Analysis of Changes to Population and Income in Philadelphia, using 2010-2016 American Community Survey (ACS)
Dawson County. Montana Poverty Report Card
 1 County Poverty Report Card June 216 Summary The poverty rate for County increased from 9.3% in 21 to 16.% in 213. For the month of December in 211 and 214, the county s unemployment rate decreased from
Economic Overview York County, South Carolina. February 14, 2018
 Economic Overview York County, February 14, 2018 DEMOGRAPHIC PROFILE... 3 EMPLOYMENT TRENDS... 5 UNEMPLOYMENT RATE... 5 WAGE TRENDS... 6 COST OF LIVING INDEX... 6 INDUSTRY SNAPSHOT... 7 OCCUPATION SNAPSHOT...
Community Survey Results
 The Guilford Strategic Alliance: Building Tomorrow, Today Pursuing and Maximizing Our Potential Developing Our Road Map Community Survey Results Introduction Why a Survey? In 2007, a survey was conducted
Silver Bow County. Montana Poverty Report Card
 1 County Poverty Report Card June 16 Summary The poverty rate for County increased from 17.8% in to 19.1% in 13. For the month of December in 11 and 14, the county s unemployment rate decreased from 6.6%
Flathead County. Montana Poverty Report Card
 1 County Poverty Report Card June 216 Summary The poverty rate for County increased from 11.7% in 21 to 14.2% in 213. For the month of December in 211 and 214, the county s unemployment rate decreased
California Dreaming or California Struggling?
 California Dreaming or California Struggling? 2017 Findings from the AARP study of California Adults Ages 36-70 in the Workforce #CADreamingOrStruggling https://doi.org/10.26419/res.00163.001 SURVEY METHODOLOGY
PATIENT REGISTRATION FORM
 Patient Information PATIENT REGISTRATION FORM (Name) First: M.I. Last: Address: City: State: Zip: D.O.B. Email: (Phones) Home: Cell: Work: Fill out both above and below section with patient information,
Massachusetts Household Survey on Health Insurance Status, 2007
 Massachusetts Household Survey on Health Insurance Status, 2007 Division of Health Care Finance and Policy Executive Office of Health and Human Services Massachusetts Household Survey Methodology Administered
Unemployment in Boston
 Unemployment in Boston Boston Redevelopment Authority Research Division September 2014 This report uses a variety of data sources from the U.S. Census Bureau, including the 2008-2012 and 2012 American
Urban Action Agenda Community Profiles COVER TO GO HERE. City of Beacon
 Urban Action Agenda Community Profiles COVER TO GO HERE City of Beacon COMMUNITY OVERVIEW MAP POPULATION & DEMOGRAPHICS Population Basics 27,828 Population (2015) Population Change 9.6% since 2000 5.1
Lewis and Clark. Montana Poverty Report Card
 1 County Poverty Report Card June 216 Summary he poverty rate for County increased from 9.7% in 21 to 1.4% in 213. For the month of December in 211 and 214, the county s unemployment rate decreased from.3%
THDA Homebuyer Education Initiative Customer Intake Form
 Sample 3 Date Case# (Trainer completes) Trainer Organization County (Trainer completes) THDA Homebuyer Education Initiative Customer Intake Form Please provide information about yourself for customer tracking
ESPRI Hempstead- needs assessment survey
 ESPRI Hempstead- needs assessment survey February 14, 2018 ESPRI HEMPSTEAD- NEEDS ASSESSMENT SURVEY - FEBRUARY 14, 2018 1 Contents I. Introduction.....2 II. Executive Summary... 3 III. Methodology... 4
ARIZONA BALANCE OF STATE
 ARIZONA BALANCE OF STATE County Community Data Profile Vantage Point 2015: 12 th District Community Indicators Project Federal Reserve Bank of San Francisco Project Contact: Gabriella Chiarenza gabriella.chiarenza@sf.frb.org
Homebuyer Application
 Homebuyer Application Follow these steps to submit an application for Lee Gordon Place Submit no later than: February 1, 2018 Lottery drawing: February 15 th, 2018 As part of this application you will
Dakota County CDA Homebuyer Counseling Program Application
 Dakota County CDA Homebuyer Counseling Program Application Appointment Information: Date: Time: Application Checklist: To better serve you, please provide all required documents 24 hours in advance of
Urban Action Agenda Community Profiles COVER TO GO HERE. City of Beacon
 Urban Action Agenda Community Profiles COVER TO GO HERE City of Beacon COMMUNITY OVERVIEW MAP POPULATION & DEMOGRAPHICS Population Basics 2,212 Population (2015) Population Change 2. since 2000 0.5 Square
ECONOMIC OVERVIEW DuPage County, Illinois
 ECONOMIC OVERVIEW DuPage County, Illinois DEMOGRAPHIC PROFILE... 3 EMPLOYMENT TRENDS... 5 UNEMPLOYMENT RATE... 5 WAGE TRENDS... 6 COST OF LIVING INDEX... 7 INDUSTRY SNAPSHOT... 8 OCCUPATION SNAPSHOT...
Rifle city Demographic and Economic Profile
 Rifle city Demographic and Economic Profile Community Quick Facts Population (2014) 9,289 Population Change 2010 to 2014 156 Place Median HH Income (ACS 10-14) $52,539 State Median HH Income (ACS 10-14)
Fact Sheet. Health Insurance Coverage in Minnesota, Early Results from the 2009 Minnesota Health Access Survey. February, 2010
 Fact Sheet February, 2010 Health Insurance Coverage in Minnesota, Early Results from the 2009 Minnesota Health Access Survey The Minnesota Department of Health and the University of Minnesota School of
California Dreaming or California Struggling?
 California Dreaming or California Struggling? 2017 LA County Latino/a Findings from the AARP study of California Adults Ages 36-70 in the Workforce #CADreamingOrStruggling https://doi.org/10.26419/res.00163.012
Hunger Factors Hunger and Poverty in Oregon and Clark County, WA Executive Summary
 Hunger Factors 2015 Hunger and Poverty in Oregon and Clark County, WA Executive Summary Introduction At Oregon Food Bank we care deeply about people facing hunger and hold them in the center of all we
Occupational Therapy Assistant Occupation Overview
 Occupational Therapy Assistant Occupation Overview Emsi Q1 2018 Data Set March 2018 Western Technical College 400 Seventh Street La Crosse, Wisconsin 54601 608.785.9200 Emsi Q1 2018 Data Set www.economicmodeling.com
Economic Overview. Lawrence, KS MSA
 Economic Overview Lawrence, KS MSA March 5, 2019 DEMOGRAPHIC PROFILE... 3 EMPLOYMENT TRENDS... 5 UNEMPLOYMENT RATE... 5 WAGE TRENDS... 6 COST OF LIVING INDEX... 7 INDUSTRY SNAPSHOT... 8 OCCUPATION SNAPSHOT...