Market Overview. Sector Overview
|
|
|
- Julius Wood
- 5 years ago
- Views:
Transcription
.")
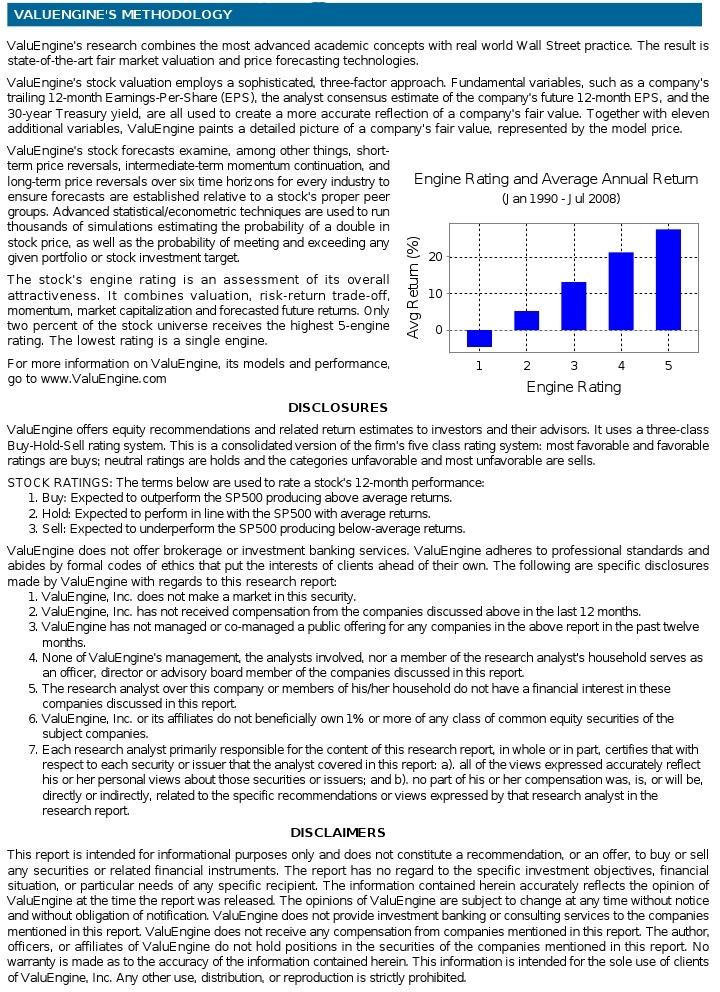
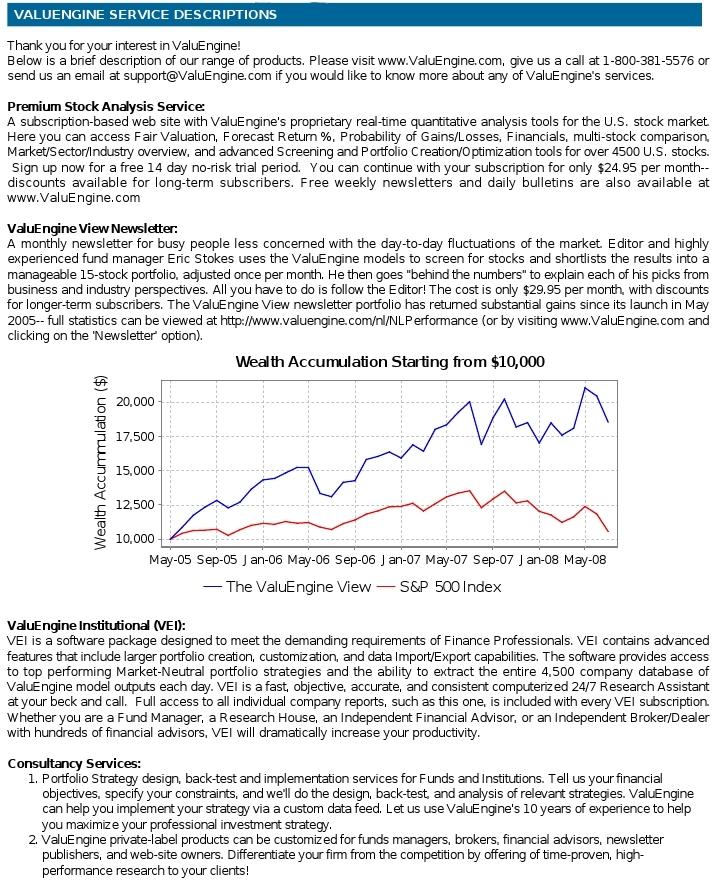
1 September 20, 2010 The Weekly ETF Report is based on ValuEngine Chief Market Strategist Richard Suttmeier's proprietary market analytics. Suttmeier combines his technical analysis expertise with ValuEngine's proprietary quantitative model data to cover the market's most popular Exchange Traded Funds (ETFs). ETFs are a popular and easy way for investors to track the performance of key indices, commodities, sectors, currencies, and other asset classes without the transaction and management fees associated with individual stock tickers or mutual funds. Suttmeier is famous for correctly calling the tech-stock bottom in , predicting the current housing/credit crisis back in 2005, and calling the most recent market bottom on March 6, 2009! He is a frequent guest on CNBC, FOX Business Channel, and other financial media. Market Overview Summary of VE Stock Universe Stocks Undervalued 65.18% Stocks Overvalued 34.82% Stocks Undervalued by 20% 33.56% Stocks Overvalued by 20% 11.81% The ValuEngine Universe consists of over 4500 US, foreign, and ADR tickers traded on US markets. Normal ranges for universe over and undervaluation typically run between 35-65%. Sector Overview Sector Change MTD YTD Valuation Last 12- MReturn P/E Ratio Basic Industries 0.26% 3.96% 19.30% 0.62% overvalued 28.27% Capital Goods -0.29% 2.77% 11.21% 9.50% undervalued 6.89% Consumer Durables 0.15% 3.66% 7.99% 14.35% undervalued 17.59% Consumer Non-Durables -0.04% 2.56% 3.72% 7.15% undervalued 16.24% Consumer Services 0.16% 4.55% 5.78% 8.85% undervalued 9.35% Energy -0.35% 2.76% -2.29% 1.06% overvalued 20.75% Finance 0.14% 2.53% 8.54% 6.70% undervalued 0.48% Health Care 0.05% 4.38% 16.07% 14.31% undervalued 0.05% Public Utilities 0.06% 0.57% -2.65% 2.56% undervalued 9.46% Technology 0.36% 5.55% 10.65% 12.34% undervalued 15.48% Transportation 0.19% 4.43% 8.10% 2.81% undervalued 10.12% 18.62
2 Ticker Exchange Traded Fund INDEX ETFs ETF Overview INDEX Current Price Suttmeier Says Value Levels Pivot Risky Levels DIA DIAMONDS TRUST SERIES I DJIA Buy at Value W S A DDM PROSHARES ULTRA DOW 30 DJIA W S DXD PROSHARES ULTRSHRT DOW30 DJIA Q M S SPY SPDR TRUST SERIES 1 SP Buy at Value W S SSO PROSHARES ULTRA S&P 500 SP W S SDS PROSHARES ULTRSRT S&P500 SP None W Q QQQQ POWERSHARES QQQ TRUST NASDAQ Buy at Value W S None QLD PROSHARES ULTRA QQQ NASDAQ S A A PSQ PROSHARES SHORT QQQ NASDAQ None S M QID PROSHARES ULTRASHORT QQQ NASDAQ None W S MYY PROSHARES SHRT MIDCP None M S TWM PROSHARES ULTRA SHRT RUSS 2000 RUSSELL None M S SECTOR ETFs SECTOR XLB MATERIALS SELECT SECTOR SPDR FUN BASIC INDUSTRIES Buy at Value M W S XLI INDUSTRIAL SELECT SECTOR SPDR FU CAPITAL GOODS Buy at Value S A S XLY CONSUMER DISCRETIONARY SELECT SE CONSUMER DURABLES W A W XLP IYC CONSUMER STAPLES SELECT SECTOR S ishares Dow Jones U.S. Consumer Services Sector Index Fund CONSUMER NON- DURABLES M W S CONSUMER SERVICES W M None XLE ENERGY SELECT SECTOR SPDR FUND ENERGY Buy at Value M W A XLF FINANCIAL SELECT SECTOR SPDR FUN FINANCE Buy at Value W S M SKF PROSHARES ULTRA SHRT FINANCIALS FINANCE M W S XLV HEALTH CARE SELECT SECTOR SPDR F HEALTH CARE M S S XLU UTILITIES SELECT SECTOR SPDR FUN PUBLIC UTILTIES M W XLK TECHNOLOGY SELECT SECTOR SPDR FU TECHNOLOGY Buy at Value W S S IYT ishares Dow Jones Transportation Average Index Fund TRANSPORTATION Buy at Value W S A EMERGING MARKET ETFs NATION EEM ISHARES MSCI EMERGING MKTS IDX F VARIOUS Buy at Value A W A FXI XINHUA CHINA 25 INDEX FUND CHINA Buy at Value M A A FIXED INCOME ETFs TLT ishares Lehman 20+ Year Treasury Bond Fund A W COMMODITIES ETFs COMMODITY GLD SPDR GOLD TRUST GOLD Buy at Value S S W GSG ISHARES GSCI COMMOD INDX VARIOUS M W A DUG PROSHARES ULTRA SHRT OIL&GAS OIL/GAS S W Q
3 Index ETFs ETF DIA DDM DXD SPY SSO SDS QQQQ QLD PSQ QID MYY TWM 09/17/ /10/ Weekly Change December YTD Change Week High Week Low Value Levels W W Q W W none W S none none none none A M S M M W Pivots S M W S A S W M M M M W M W W Risky Levels A S S S S Q none A M S S S S A A A A S S Q S S 5- Week MMA Month MMA Weekly MOJO 6.0 / / / / / / / / / / / / 3.6 Monthly MOJO 7.5 / / / / / / / / / / / / 1.1
4 Analysis and Scenarios: Index ETFs ETF Intermediate Long Term Technical Parameters DIA Positive Neutral DDM Positive Neutral DXD Negative Oversold SPY Positive Neutral SSO Positive Neutral SDS Negative Oversold QQQQ Positive Neutral QLD Positive Neutral PSQ Negative Oversold QID Negative Neutral MYY Negative Oversold TWM Negative Oversold DIA is above its 5-week MMA with rising MOJO, after ending August with declining monthly MOJO and above 5-month MMA. DDM is above its 5-week MMA with rising weekly MOJO, after ending August with declining monthly MOJO and above 5-month MMA. DXD is below its 5-week MMA with declining weekly MOJO, after ending August with oversold monthly MOJO and below 5-month MMA. SPY tested my weekly risky level at $ last week.* SPY is above its 5-week MMA with rising weekly MOJO, after ending August with declining monthly MOJO and above 5-month MMA. SSO is above its 5-week MMA with rising weekly MOJO, after ending August with declining monthly MOJO and above 5-month MMA. SDS tested my weekly value level at $30.22 last week.* SDS is below its 5-week MMA with declining weekly MOJO, after ending August with oversold monthly MOJO and below 5-month MMA. QQQQ tested my weekly risky level at $47.12 last week.* QQQQ is above its 5-week MMA with rising weekly MOJO, after ending August with declining monthly MOJO and above 5-month MMA. QLD is above its 5-week MMA with rising weekly MOJO, after ending August with declining monthly MOJO and above 5-month MMA. PSQ tested my weekly value level at $40.39 last week.* PSQ is below its 5-week MMA with declining weekly MOJO, after ending August with oversold monthly MOJO and below 5-month MMA. QID tested my weekly value level at $15.91 last week.* QID is below its 5-week MMA with declining weekly MOJO, after ending August with rising monthly MOJO but below 5-month MMA. MYY is below its 5-week MMA with declining weekly MOJO, after ending August with oversold monthly MOJO and below 5-month MMA. TWM tested my monthly value level at $18.94 last week.* TWM is below its 5-week MMA with declining weekly MOJO, after ending August with oversold monthly MOJO and below 5-month MMA. *For more on trading with GTC Orders as well as the definitions for various technical trading terms, see the How to Trade discussion in the Terms and Conditions at the end of this document.
5 Sector ETFs ETF XLB XLI XLY XLP IYC XLE XLF SKF XLV XLU XLK IYT 09/17/ /10/ Weekly Change December YTD Change Week High Week Low Value Levels M S W M W M W M M M W W S A A 9.57 S Q M S Pivots W A A W M W S W S S S M M S M W A Risky Levels S S W S none A M S S W S A W A S A A A 5- Week MMA Month MMA Weekly MOJO 7.3 / / / / / / / / / / / / 6.5 Monthly MOJO 6.8 / / / / / / / / / / / / 7.4
6 Analysis and Scenarios: Sector ETFs ETF Intermediate Long Term Technical Parameters XLB Positive Neutral XLI Positive Neutral XLY Positive Neutral XLP Positive Neutral IYC Positive Neutral XLE Positive Neutral XLF Positive Neutral SKF Negative Oversold XLB is above its 5-week MMA with rising weekly MOJO, after ending August with declining monthly MOJO and above 5-month MMA. XLI is above its 5-week MMA with rising weekly MOJO, after ending August with declining monthly MOJO and above 5-month MMA. XLY is above its 5-week MMA with rising weekly MOJO, after ending August with declining monthly MOJO and above 5-month MMA. XLP is above its 5-week MMA with rising weekly MOJO, after ending August with declining monthly MOJO and above 5-month MMA. IYC tested my monthly risky level at $59.10 last week.* IYC is above its 5-week MMA with rising weekly MOJO, after ending August with declining monthly MOJO but above 5-month MMA. XLE is above its 5-week MMA with rising weekly MOJO, after ending August with declining monthly MOJO and above 5-month MMA. XLF tested my monthly risky level at $14.77 last week.* XLF is above its 5-week MMA with rising weekly MOJO, after ending August with declining monthly MOJO and above the 5-month MMA. SKF tested my weekly value level at $19.57 last week.* SKF is below its 5-week MMA with declining weekly MOJO, after ending August with oversold monthly MOJO and below 5-month MMA. XLV Positive Neutral XLU Overbought Positive XLK Positive Neutral IYT Positive Neutral XLV is above its 5-week MMA with rising weekly MOJO, after ending August with declining monthly MOJO and above 5-month MMA. XLU is above its 5-week MMA with rising weekly MOJO, after ending August with rising monthly MOJO and above 5-month MMA. XLK is above its 5-week MMA with rising weekly MOJO, after ending August with declining monthly MOJO and above 5-month MMA. IYT tested my annual risky level at $80.74 last week.* IYT is above its 5-week MMA with rising weekly MOJO, after ending August with declining monthly MOJO and above 5-month MMA. *For more on trading with GTC Orders as well as the definitions for various technical trading terms, see the How to Trade discussion in the Terms and Conditions at the end of this document.
7 Other ETFs ETF EEM FXI TLT GLD GSG DUG 09/17/ /10/ Weekly Change December YTD Change Week High Week Low Value Levels A M A S M S M Q A Q Pivots W A S W W S M Risky Levels A A W W A Q S S M S S 5- Week MMA Month MMA Weekly MOJO 7.7 / / / / / / 2.9 Monthly MOJO 7.4 / / / / / / 2.3
8 Analysis and Scenarios: Other ETFs ETF Intermediate Long Term Technical Parameters EEM Overbought Neutral FXI Positive Neutral TLT Negative Positive GLD Positive Overbought GSG Positive Negative DUG Negative Neutral EEM is above its 5-week MMA with overbought weekly MOJO, after ending August with declining monthly MOJO and above 5-month MMA. FXI is above its 5-week MMA with rising weekly MOJO, after ending August with declining monthly MOJO and above 5-month MMA. TLT is below its 5-week MMA with declining weekly MOJO, after ending August with rising monthly MOJO and above 5-month MMA. GLD tested my monthly risky level at $ last week.* GLD is above its 5-week MMA with rising weekly MOJO, after ending August with overbought monthly MOJO and above 5-month MMA. GSG is above its 5-week MMA with rising weekly MOJO, after ending August with declining monthly MOJO and below 5-month MMA. DUG is below its 5-week MMA with declining weekly MOJO, after ending August with rising monthly MOJO and below 5-month MMA. *For more on trading with GTC Orders as well as the definitions for various technical trading terms, see the How to Trade discussion in the Terms and Conditions at the end of this document.
9 Terms and Definitions My methodology combines technical analysis with ValuEngine fundamental screens to develop opinions, predictions, and strategy suggestions. My objective is to help investors from novice to professional make better strategy decisions using the best available fundamental and technical data. A Value Level is a price at which investors should add to positions on share price weakness A Risky Level is a price at which investors should reduce holdings on share price strength. A Pivot is a price that should be a magnet during the time frame specified. This is a level at which to consider more aggressive positions adjustments. These levels are calculated in weekly (W), monthly (M), quarterly (Q), semiannual (S) and annual (A) time horizons, based on the past nine closes in each time horizon. My theory is that the closes over a nine-year period are the summation of all bullish and bearish events for that market or specific stock. These levels are the most important element of my Buy and Trade Strategy. How to Trade - If you want to buy an ETF at its value level or sell at a risky level, I suggest using good until canceled (GTC) orders to buy or sell at the levels shown in the ETF Overview. If the ETF opens below the GTC value level, you will trigger a buy at the open price. If the ETF opens above the risky level, you will trigger a sell at the open price. Technical Indicators: Positive Technicals - If an ETF has a weekly close above its five-week modified moving average (MMA) and its momentum is rising-- as indicated by a 12x3 weekly slow stochastic, then the ETF looks good-- positive --from a technical perspective. Negative Technicals - If an ETF has a weekly close below its five-week modified moving average (MMA) and its momentum is declining-- as indicated by a 12x3 weekly slow stochastic, then the ETF looks poor-- negative --from a technical perspective. MOJO - A term for Technical Momentum. We discuss MOJO for both weekly and monthly time frames. In the tables, MOJO represents the readings from the 12x3 slow stochastic. You read MOJO from left-to-right (last measure/current measure) and can determine the momentum for an ETF using the following guidelines: Overbought (OB): 12x3 weekly slow stochastic above 80 on a scale of zero to 100 Rising (RM): 12x3 weekly slow stochastic rising above 20, but is below 80 Flat (F): 12x3 weekly slow stochastic between 20 and 80, but not rising or declining Declining (DM): 12x3 weekly slow stochastic is declining below 80, but is above 20 Oversold (OS): 12x3 weekly slow stochastic is below 20 on a scale of zero to 100 Changes in status are noted in Italicized Bold, Red is Negative, Green is Positive. If a level was tested during the week, it is highlighted in Red in the tables of levels.
10
11
Four Components Of A Successful Income Portfolio
 Four Components Of A Successful Income Portfolio Presented by: David Fabian Michael Fabian FMD Capital Management One Park Plaza, Suite 600 Irvine, CA 92614 Ph: 888-823-8111 F: 949-266-5788 www.fmdcapital.com
S&P Day A/D Line
 Stocks Above 5-Day The S&P 5 experienced its first 1%+ move in either direction today for the first time in 58 trading days. The 1.4% drop left the index below its 5-day moving average as well. Market
January 24, Michael Rechenthin, PhD Frank Kaberna
 January 24, 2017 This week we provide a list of ETFs that are currently exhibiting some of the most liquid options all with a tastytrade liquidity rating of 3 or 4 stars. To dive deeper into the ETFs and
Commentary. Our greatest weakness lies in giving up. The most certain way to succeed is always to try just one more time.
 LongRun Monthly Strategy Review May 2018 AR +0.2% AG +1.0% TMG +3.0% SP500 +2.4% GDP +0.7% Commentary Last month s commentary led off with our Absolute Return strategy moving to 100% cash for the month
Real-time Analytics Methodology
 New High/Low New High/Low alerts are generated once daily when a stock hits a new 13 Week, 26 Week or 52 Week High/Low. Each second of the trading day, the stock price is compared to its previous 13 Week,
Commentary. Things turn out best for the people who make the best of the way things turn out. - John Wooden
 LongRun Monthly Strategy Review Dec 2018 AR +0.1% AG -0.3% TMG -9.8% SP500-8.8% GDP -4.9% Commentary As noted last month, December got off to a bad start wiping out November s equity market gains in the
Commentary. If you are the smartest person in the room, then you are in the wrong room. Attributed to Confucius
 LongRun Monthly Strategy Review Jun 2018 AR +0.9% AG +1.0% TMG -0.5% SP500 +0.6% GDP -0.8% Commentary June brought mixed messages from the markets. Worries about the Trump/Kim summit and Federal Reserve
Commentary. "How ridiculous and how strange to be surprised at anything which happens in life." -Marcus Aurelius
 LongRun Monthly Strategy Review Aug 2017 AR +0.72% AG +1.64% TMG +0.36% SP500 +0.29% R2000-1.54% GDP +0.67% Commentary After posting new all-time highs the first week of August, US equity markets had a
Commentary. Without deviation from the norm, progress is not possible. Frank Zappa
 LongRun Monthly Strategy Review Aug 2016 AR -0.71% AG -5.21% TMG -2.67% SP500 +0.12% R2000 +1.78% GDP -0.57% Commentary August was a quiet month in most markets with the major US equity indices making
Commentary. CBOE Volatility Index (VIX) Brexit Election VIX
 Brexit Election VIX") LongRun Monthly Strategy Review Mar 2018 AR -0.7% AG -2.9% TMG -2.3% SP500-2.7% GDP 0.0% Commentary I finished last month s commentary with a caution that equity markets might retest the lows of February
LongRun Monthly Strategy Review Mar 2018 AR -0.7% AG -2.9% TMG -2.3% SP500-2.7% GDP 0.0% Commentary I finished last month s commentary with a caution that equity markets might retest the lows of February
Exchange Traded Funds, more commonly known as ETFs, have been
 Trading by Numbers: Scoring Strategies for Every Market By Rick Swope and W. Shawn Howell Copyright 2012 by Rick Swope and W. Shawn Howell APPENDIX B Exchange Traded Funds (ETFs) Exchange Traded Funds,
Commentary. Just because the river is quiet doesn't mean the crocodiles have left. Malay proverb
 LongRun Monthly Strategy Review Mar 2016 AR -0.11% AG +8.52% TMG +1.91% SP500 +6.72% R2000 +8.02% GDP +9.17% Commentary Equity markets around the world registered impressive gains in March as follow-through
Commentary. Patience and perseverance have a magical effect before which difficulties disappear and obstacles vanish. - John Quincy Adams
 LongRun Monthly Strategy Review Sep 2018 AR -2.0% AG-2.5% TMG -0.3% SP500 +0.6% GDP -0.04% Commentary Last month I pointed out that the S&P 500 large cap stock index had closed higher five months in a
Top Down Analysis Success Demands Singleness of Purpose
 Chapter 9 Top Down Analysis Success Demands Singleness of Purpose Armed with a little knowledge about the stock and options market as well as a desire to trade, many new traders are faced with the daunting
High Probability ETF Trading For All
 High Probability ETF Trading For All Version 2.10 Strategy Report Chris White, March 2014 Includes full year results 01/01/2009 to 12/31/13 And Last 3 months results (01/12/13 to 02/28/14) Contents Disclaimer...
Commentary. "How ridiculous and how strange to be surprised at anything which happens in life." - Marcus Aurelius, Stoic philosopher
 LongRun Monthly Strategy Review Jan 2018 AR +5.2% AG +5.3% TMG +5.1% SP500 +5.6% R2000+2.6% GDP +2.8% Commentary January took global markets to new heights after a better than expected 2017. Last month
A sampling of research & data on exchange traded funds from AltaVista Research
 A sampling of research & data on exchange traded funds from AltaVista Research In this week's issue: Chart of the week: Nuclear vs. Clean Energy ETFs Fund Focus: ishares S&P Global Nuclear Energy (NUCL)...
Commentary. "The inevitable may be certain, but it is not always punctual." - Jim Grant - Grant's Interest Rate Observer
 LongRun Monthly Strategy Review Nov 2017 AR +2.2% AG +2.1% TMG +2.7% SP500 +3.1% R2000 +2.9% GDP +0.9% Commentary November saw global markets focused on the prospects for US tax reform and Washington managed
Commentary. You can t overlook volatility, but you don t let it push you around in the market - Boone Pickens
 LongRun Monthly Strategy Review Nov 2018 AR +0.2% AG -0.9% TMG +2.4% SP500 +1.9% GDP +0.8% Commentary By way of a recap, US equity markets spent most of October going down before a scramble to recover
LongRun Monthly Strategy Review. Commentary. Oct 2017
 LongRun Monthly Strategy Review Oct 2017 AR 1.78% AG -0.61% TMG +1.50% SP500 +2.36% R2000 +0.73% GDP +0.35% Commentary Market history says that October can be a dangerous month and 2017 marked the 40 th
Commentary. Forecasts usually tell us more about the forecaster than about the future. - Warren Buffett
 LongRun Monthly Strategy Review Nov 2016 AR +1.70% AG +2.07% TMG +1.16% SP500 +3.68% R2000 +11.08% GDP +1.35% Commentary Forecasters and pollsters are having a rough year. First Brexit and now the US presidential
High Probability ETF Trading For All
 High Probability ETF Trading For All Version 2.7 Strategy Report Chris White, August 2012 Includes results to end of July 2012 Contents Disclaimer... 2 Summary... 3 The High Probability ETF Trading book
Selecting Portfolios for SectorSurfer Strategies
 Selecting Portfolios for SectorSurfer Strategies Don Kinell September 16 th, 2013 1 Review How SectorSurfer is Useful to an Investor 1. Demonstrates the effects of : Rotation to best trending Mutual Fund,
Prepared By: David Advisor Prepared for: Joe Investor
 Prepared By: David Advisor Prepared for: Joe Investor Content Investment philosophy Risk preference Asset mix History performance Portfolio constitution Disclaimer Date: 2009 10 2 RiskFile Porfolio Composer:
Practical Personal Investing: Diversification and Assets Allocation
 Practical Personal Investing: Diversification and Assets Allocation Diversification and assets allocation are essential elements of Investment Risk management. investment returns are really the by-product
Interactive Brokers Webcast. Options on ETFs. February 13, 2013 Presented by Russell Rhoads, CFA
 Interactive Brokers Webcast Options on ETFs February 13, 2013 Presented by Russell Rhoads, CFA Disclosure CBOE Disclosure Statement Options involve risks and are not suitable for all investors. Prior to
With Rates Retreating, Bonds Back in Fashion
 Defensive ETFs: December U.S. ETF 2011 Flows: Performance May 2014 FINANCIAL PRODUCTS RESEARCH ETF RESEARCH January & STRATEGY 9, 2011 U.S. ETF flows were $12.7 billion in May representing 0.7% of assets
Walter Murphy s Insights Short Term Review
 Walter Murphy s Insights Short Term Review Strategic Analysis for the Serious Investor Walter G. Murphy, Jr., CFA WMinsights.com February 17, 2014 Plain English US Equities: It is entirely possible that
Planning for Trading Stocks and Stock Indexes: Considerations for Serious Traders
 Planning for Trading Stocks and Stock Indexes: Considerations for Serious Traders David B. Center, PhD Copyright 2009 (Contact through: www.davidcenter.com) 1 Planning for Trading Stocks and Stock Indexes
Rollercoaster Ride Ahead
 1 11 21 31 41 51 61 71 81 91 101 111 121 131 141 151 161 171 181 191 201 211 221 231 241 251 Rollercoaster Ride Ahead The Dow Jones Industrial Average reached a new high of 21,115.55 on March 1 st. With
Asbury Research s US Investment Analysis: A Review of Q Prepared for Interactive Brokers
 Asbury Research s US Investment Analysis: A Review of Q1 2016 Prepared for Interactive Brokers April 14 th. 2016 About Asbury Research Research, Methodology & Clientele Our Research: Asbury Research, established
MACRO CHART BOOK Q2, 2016
 Adaptive Investing MACRO CHART BOOK Q2, 2016 Upside Participation Downside Management For Investment Advisors and Institutions Only Content Summary US Economy Market Snapshot Asset Class Performance Equity
TACTICAL ASSET CLASS ROTATION MODEL DARIUS DALE: MACRO TEAM
 TACTICAL ASSET CLASS ROTATION MODEL DARIUS DALE: MACRO TEAM MARCH 12, 2015 LEGAL DISCLAIMER Hedgeye Risk Management is a registered investment advisor, registered with the State of Connecticut. Hedgeye
A Guide to J.P. Morgan U.S. Sector Rotator 5 Index (Annuity Series)
") A Guide to J.P. Morgan U.S. Sector Rotator 5 Index (Annuity Series) A Dynamic Investment Strategy That Targets Stable Growth While Managing Market Risk Standard Insurance Company J.P. Morgan U.S. Sector
A Guide to J.P. Morgan U.S. Sector Rotator 5 Index (Annuity Series) A Dynamic Investment Strategy That Targets Stable Growth While Managing Market Risk Standard Insurance Company J.P. Morgan U.S. Sector
Market Observations - as of Jul 20, 2018
 Market Observations - as of Jul 20, 2018 By Carl Jorgensen - For Objective Traders - For educational purposes only. Not Financial Advice. This week we saw mostly consolidation and little change from the
Thank you For Reading
 Thank you For Reading Welcome to the FIFTH issue of the TradingFibz, LLC weekly supplemental newsletter. It is my hope that the newsletter will take on a new look and add in additional features to make
Exchange-traded funds ETF Flows - 2Q15 2 July 2015
 ETF Flows - 2Q15 2 July 2015 CIO WM Research David Perlman, ETF Strategist, david.perlman@ubs.com This report highlights quarterly ETF flows by issuer and market segment. Flow estimates are obtained through
Market Recap. TTG Market View. US ETF Index performance (5d): SPY +1.0%, DIA +1.4%, IWM +1.3%, QQQ +2.0%, TLT -0.3%, GLD -1.4%
: SPY +1.0%, DIA +1.4%, IWM +1.3%, QQQ +2.0%, TLT -0.3%, GLD -1.4%") US ETF Index performance (5d): SPY +1.0%, DIA +1.4%, IWM +1.3%, QQQ +2.0%, TLT -0.3%, GLD -1.4% Market Recap US Equities broke out of their +1mo sideways pattern last week. QQQs led the SPX for the 4 th
US ETF Index performance (5d): SPY +1.0%, DIA +1.4%, IWM +1.3%, QQQ +2.0%, TLT -0.3%, GLD -1.4% Market Recap US Equities broke out of their +1mo sideways pattern last week. QQQs led the SPX for the 4 th
Eric D. Wish, Ph.D. (Sir Silent Knight)
") Stock Market "Wishdom:" Insights from 50 years as a Part-time Trader/ Investor AAII Washington DC Metro Chapter February 20, 2016 Eric D. Wish, Ph.D. (Sir Silent Knight) silentknight@wishingwealthblog.com
Stock Market "Wishdom:" Insights from 50 years as a Part-time Trader/ Investor AAII Washington DC Metro Chapter February 20, 2016 Eric D. Wish, Ph.D. (Sir Silent Knight) silentknight@wishingwealthblog.com
Market Recap. TTG Market View. US ETF Index performance (5d): SPY -0.8%, DIA -0.7%, IWM -0.3%, QQQ -1.4%, TLT +1.2%, GLD +1.9%
: SPY -0.8%, DIA -0.7%, IWM -0.3%, QQQ -1.4%, TLT +1.2%, GLD +1.9%") US ETF Index performance (5d): SPY -0.8%, DIA -0.7%, IWM -0.3%, QQQ -1.4%, TLT +1.2%, GLD +1.9% Market Recap Last week Santa was a no show as equities continue to consolidate and move a bit lower. The
US ETF Index performance (5d): SPY -0.8%, DIA -0.7%, IWM -0.3%, QQQ -1.4%, TLT +1.2%, GLD +1.9% Market Recap Last week Santa was a no show as equities continue to consolidate and move a bit lower. The
Market Observations - as of Sep 7, 2018
 Market Observations - as of Sep 7, 2018 By Carl Jorgensen - For Objective Traders - For educational purposes only. Not Financial Advice. Last week we saw a strong and broad rally to new all time highs
The Defined Risk Strategy
 The Defined Risk Strategy Marc Odo, CFA, CAIA, CIPM, CFP Swan at a Glance FOR ADVISOR USE ONLY Swan is an independent advisory firm based in Durango, CO Founded in 1997 by Randy Swan An SEC-registered
Copyright 2018 ETF Dynamics, LLC
 Copyright 2018 ETF Dynamics, LLC The US Securities and Exchange Commission (SEC) Requires the following legal notices: ETF Dynamics, LLC does not advise its clients or any other person whether or not to
Market Line Weekly Newsletter
 Market Line Weekly Newsletter December 17, 2017 Stock Watch: The trend is up and the bulls have the momentum. A close below the 12/1 low in any of the major indices (the Dow, the S&P, the QQQ, IWM, and
Pursuant to Section 19(b)(1) of the Securities Exchange Act of 1934 ( Act ), 1 and Rule
(1) of the Securities Exchange Act of 1934 ( Act ), 1 and Rule") This document is scheduled to be published in the Federal Register on 08/03/2016 and available online at http://federalregister.gov/a/2016-18313, and on FDsys.gov 8011-01p SECURITIES AND EXCHANGE COMMISSION
This document is scheduled to be published in the Federal Register on 08/03/2016 and available online at http://federalregister.gov/a/2016-18313, and on FDsys.gov 8011-01p SECURITIES AND EXCHANGE COMMISSION
Copyright 2018 ETF Dynamics, LLC
 Copyright 2018 ETF Dynamics, LLC The US Securities and Exchange Commission (SEC) Requires the following legal notices: ETF Dynamics, LLC does not advise its clients or any other person whether or not to
Investing During The Trump Administration: Opportunity & Danger
 Investing During The Trump Administration: Opportunity & Danger Prepared for the Los Angeles Chapter of the American Association of Individual Investors (AAII ) June 17 th, 2017 About Asbury Research John
Pursuant to Section 19(b)(1) of the Securities Exchange Act of 1934 ( Act ) 1, and Rule
(1) of the Securities Exchange Act of 1934 ( Act ) 1, and Rule") This document is scheduled to be published in the Federal Register on 03/16/2016 and available online at http://federalregister.gov/a/2016-05854, and on FDsys.gov 8011-01p SECURITIES AND EXCHANGE COMMISSION
This document is scheduled to be published in the Federal Register on 03/16/2016 and available online at http://federalregister.gov/a/2016-05854, and on FDsys.gov 8011-01p SECURITIES AND EXCHANGE COMMISSION
Big Data Analytics of Financial Strategies
 2015 IEEE Symposium Series on Computational Intelligence Big Data Analytics of Financial Strategies Kabaji Egara Department of Computing University of Bradford West Yorkshire, United Kingdom kabajiegara@live.com
Thank you For Reading
 Thank you For Reading Welcome to the 7th issue of the TradingFibz, LLC weekly supplemental newsletter. Templates now available for purchase and added video each week. At some point in the near future,
US Financial Market Update for March Prepared for the Market Technicians Association
 US Financial Market Update for March 2016 Prepared for the Market Technicians Association March 16 th, 2016 About Asbury Research Research, Methodology & Clientele Our Research: Asbury Research, established
ORF 307 Lecture 3. Chapter 13, Section 1 Portfolio Optimization
 ORF 307 Lecture 3 Chapter 13, Section 1 Portfolio Optimization Robert Vanderbei February 14, 2012 Operations Research and Financial Engineering, Princeton University http://www.princeton.edu/ rvdb Portfolio
Head Traders, Technical Contacts, Compliance Officers, Heads of ETF Trading, Structured Products Traders. Exchange-Traded Fund Symbol CUSIP #
 Information Circular: PowerShares ETF Trust II To: From: Head Traders, Technical Contacts, Compliance Officers, Heads of ETF Trading, Structured Products Traders PHLX Listing Qualifications Department
Vantage Aggressive 2.0
 WITHDRAWAL RATES CAN YOU SUSTAIN A 4% RETIREMENT INCOME DISTRIBUTION IN TODAY S ECONOMY? For more than twenty years 1, financial advisors have quoted the 4% rule as the gold standard for how much income
ORF 307: Lecture 12. Linear Programming: Chapter 11: Game Theory
 ORF 307: Lecture 12 Linear Programming: Chapter 11: Game Theory Robert J. Vanderbei April 3, 2018 Slides last edited on April 3, 2018 http://www.princeton.edu/ rvdb Game Theory John Nash = A Beautiful
Relative Strength + Systematic Trend Identification = Market Beating, Absolute Returns
 Robert W. Colby Asset Management The Relentless Pursuit of Higher Returns Relative Strength + Systematic Trend Identification = Market Beating, Absolute Returns Robert W. Colby, CMT Chief Investment Strategist
LongRun Monthly Strategy Summary (4/30/2014) Commentary
 Commentary") Commentary As I mentioned in last month s commentary, April was set up to be a dog fight with ARv2 fully invested in US equities and Aggressive Growth and original AR positioned defensively with 67% bonds
Commentary As I mentioned in last month s commentary, April was set up to be a dog fight with ARv2 fully invested in US equities and Aggressive Growth and original AR positioned defensively with 67% bonds
Copyright 2018 ETF Dynamics, LLC
 Copyright 2018 ETF Dynamics, LLC The US Securities and Exchange Commission (SEC) Requires the following legal notices: ETF Dynamics, LLC does not advise its clients or any other person whether or not to
Are We There Yet? # Days. Quantitative Investment Decisions 999 Vanderbilt Beach Road Suite 200 Naples, Florida
 1 11 21 31 41 51 61 71 81 91 101 111 121 131 141 151 161 171 181 191 201 211 221 231 241 251 Are We There Yet? March lived up to expectations with a slightly negative Market return, -0.04%. The post-election
See USA
 The physical gold collateral inventory held by SPDR for the GLD ETF: 864.65 65 tonnes worth $35,657,895,592.03 as of 1:58 PM PST, October 1, 2017. See http://www.spdrgoldshares.com USA ETPs: Exchange Traded
FLOW AND SHORT INTEREST ANALYSIS 27/04/2015 < Last closing date US Broad Indices 28/04/2015 1:23 AM CET < Report creation date & time
 27/4/ < Last closing date US Broad Indices 28/4/ 1:23 AM CET < Report creation date & time ETF Tracking (SI / Daily D_MAV D MAV MSCI World URTH 7. -.1% 2.8%.4% 6.4% Bullish Bullish MSCI Emerging EEM 44..4%
SELECT YOUR SECTORS. Respond to Market Cycles with Agility and Precision
 SELECT YOUR SECTORS Respond to Market Cycles with Agility and Precision ECONOMIC CYCLES & SECTORS The economy moves in cycles. Specific sectors may outperform or underperform during different phases, driven
J.P. Morgan Structured Investments
 Free Writing Prospectus Filed Pursuant to Rule 433 Registration Statement No. 333-177923 Dated October 25, 2013 J.P. Morgan Structured Investments V The J.P. Morgan U.S. Sector Rotator 8 Index Strategy
Vantage 2.0 Portfolio Summary as of 01/31/2016
 2.0 Portfolio Summary as of 0/3/206 Quick Facts Beacon's 2.0 Portfolios utilize 's newest sector-based product innovations that, when combined with Beacon's stoploss strategy, provides investors with a
Martin Pring s. Weekly InfoMovie Report. December 27, Happy New Year to Our Wonderful Subcriber Family! May 2013 be Prosperous and Productive!
 Martin Pring s Weekly InfoMovie Report December 27, 2012 Issue 1028 Happy New Year to Our Wonderful Subcriber Family! May 2013 be Prosperous and Productive! The Pring Family ~ 2012 Weekly InfoMovie Report
HEIKIN-ASHI NEWSLETTER
 HEIKIN-ASHI NEWSLETTER A WEEKLY SUMMARY FOR HEIKIN-ASHI AFICIONADOS Issue 96 January 12, 2014 Site: www.educofin.com Blog: http://heikinashi.wordpress.com Heikin-Ashi Book: http://www.educofin.com/heikinashi-book.htm
Market Observations - as of Oct 5, 2018
 Market Observations - as of Oct 5, 2018 By Carl Jorgensen - For Objective Traders - For educational purposes only. Not Financial Advice. The new month and quarter began with a continuation of the trends
Market Price Considerations Week Beginning January 9, 2016
 Market Price Considerations Week Beginning January 9, 2016 DISCLAIMER-FOR-EDUCATIONAL-PURPOSES-ONLY Bobby Coats, Ph.D. Professor Economics Department of Agricultural Economics and Agribusiness Division
Selective Opportunistic Portfolios December 20, 2016
 Selective Opportunistic Portfolios December 20, 2016 Prepared by Morningstar Investment Management LLC on behalf of TD Ameritrade Investment Management, LLC. Economic & Investment Outlook As the S&P 500
KEY POINTS DISCUSSION
 Regulatory Circular RG09-97 To: From: Members, Member Organizations Division of Member and Regulatory Services Date: August 31, 2009 Subject: Margin Requirements for Leveraged ETFs and Uncovered Options
Market Observations as of Mar 2, 2018
 Market Observations as of Mar 2, 2018 By Carl Jorgensen - For Objective Traders - For educational purposes only. Not Financial Advice. The markets were mixed this week as volatility raised its head back
Market Observations - as of Jul 27, 2018
 Market Observations - as of Jul 27, 2018 By Carl Jorgensen - For Objective Traders - For educational purposes only. Not Financial Advice. This week began with most markets continuing their bullish trends
Tactical Investing Basics: Absolute Return Strategies, Over a Full Market Cycle
 Tactical Investing Basics: Absolute Return Strategies, Over a Full Market Cycle Presented by: Laif E. Meidell, CMT President American Wealth Management laif@financialhealth.com 775-332-7000 Disclaimers
Monthly Issue: February 2013
 Monthly Issue: February - US INDEXES - INTERNATIONAL INDEXES - COMMODITIES 6 CURRENCIES 7 BONDS 8 SUMMARY EURO SIGNALS By only a razor-thin margin the SPY managed to settle the month of January above a
Martin Pring s. Weekly InfoMovie Report. April 8, 2014
 Martin Pring s Weekly InfoMovie Report April 8, 2014 Issue 1093 Weekly InfoMovie Report 1 Key level remains $184 on the SPY. US Equity Market - Last time I pointed out that the $184 level on the S&P ETF
Matt Hougan Graduate Seminar: Paul Britt, CFA
 Graduate Seminar: ETF Options Matt Hougan President ETF.com Strategies: Hedging Risk, Building Income Paul Britt, CFA Senior ETF Specialist ETF.com ETF Options Strategies - Agenda Landscape Refresher Income
Market Price Considerations Week Beginning December 26, 2016
 Market Price Considerations Week Beginning December 26, 2016 DISCLAIMER-FOR-EDUCATIONAL-PURPOSES-ONLY Bobby Coats, Ph.D. Professor Economics Department of Agricultural Economics and Agribusiness Division
Exchange-Traded Funds
 Exchange-Traded Funds US ETF Weekly Update - Weekly Flows: $272 Million Net Inflows - Seventh Consecutive Week of Net Inflows - ETF Assets Stand at $1.5 Trillion, up 14% YTD - Two ETF Launches Last Week
Copyright 2018 ETF Dynamics, LLC
 Copyright 2018 ETF Dynamics, LLC The US Securities and Exchange Commission (SEC) Requires the following legal notices: ETF Dynamics, LLC does not advise its clients or any other person whether or not to
Weekly outlook for May 1 May
 Weekly outlook for May 1 May. 5 2017 TREND DIRECTION S&P 500 Oil Gold Short Term Intermediate-Term Long Term strong weak strong strong neutral Strong weak weak weak Summary The S&P500 index is expected
Prepared by Jaime Johnson and Robert Miner Tuesday, Sept. 1, 2015
 Prepared by Jaime Johnson and Robert Miner Tuesday, Sept. 1, 2015 Today s Video Update provides more detail of the current position and probable future trends and trade strategies. Weekly / Daily Charts
KEY ETF REPORT BY ASSET CLASS (US LISTED)
") 04/03/2015 < Last closing Date TOP/BOTTOM PERFORMERS 1 D (in $bn) 05/03/2015 < Current Date 3:45 AM CET (For US Listed ETF's, "today's" prices reflect last closing prices. For futures and spot FX, "today's"
04/03/2015 < Last closing Date TOP/BOTTOM PERFORMERS 1 D (in $bn) 05/03/2015 < Current Date 3:45 AM CET (For US Listed ETF's, "today's" prices reflect last closing prices. For futures and spot FX, "today's"
Monthly Investment Compass Charting The Course Of The Markets
 Monthly Investment Compass Charting The Course Of The Markets November 11 th, 2017 Monthly Investment Compass 1) Executive Summary: November 11 th, 2017 U.S. Stock Market: Unmet upside targets in several
Dynamic. Momentum Trading. Monty Pelerin. Developed by
 Dynamic Momentum Trading Developed by Monty Pelerin P a g e 1 Visit Monty Pelerin s World Or Email: montypelerin@gmail.com P a g e 2 TABLE OF CONTENTS SUMMARY AND DISCLAIMER... 4 EXECUTIVE SUMMARY... 4
Case Study : Portfolio Theory
 Case Study : Portfolio Theory Dr. Kempthorne October 24, 2013 Contents 1 Simulation: Two-Asset Portfolios 2 2 US Sector ETFs: 2009-2013 4 2.1 Mean, Variance, Correlation Statistics............... 4 2.2
How to trade ETFs with EV
 How to trade ETFs with EV This document was written in January 2010, by Pascal Willain as part of a training program on the use of the Effective Volume tools. The author can be contacted at: pascal@willain.com
KEY ETF REPORT BY ASSET CLASS (US LISTED)
") 08/05/2015 < Last closing Date TOP/BOTTOM PERFORMERS 1 D (in $bn) 11/05/2015 < Current Date 10:49 PM CET (For US Listed ETF's, "today's" prices reflect last closing prices. For futures and spot FX, "today's"
08/05/2015 < Last closing Date TOP/BOTTOM PERFORMERS 1 D (in $bn) 11/05/2015 < Current Date 10:49 PM CET (For US Listed ETF's, "today's" prices reflect last closing prices. For futures and spot FX, "today's"
FLOW AND SHORT INTEREST ANALYSIS 04/03/2015 < Last closing date US Broad Indices 05/03/2015 3:52 AM CET < Report creation date & time
 4/3/ < Last closing date US Broad Indices /3/ 3:2 AM CET < Report creation date & time ETF Tracking (SI / Daily D_MAV D MAV MSCI World URTH 74.1 -.3% -.6% 3.4% 4.1% Bullish Bullish MSCI Emerging EEM 39.9-1.1%
MACRO PLAYBOOK DARIUS DALE: MACRO TEAM
 MACRO PLAYBOOK DARIUS DALE: MACRO TEAM APRIL 22, 2015 UPDATE LEGAL DISCLAIMER Hedgeye Risk Management is a registered investment advisor, registered with the State of Connecticut. Hedgeye Risk Management
January 31, 2015 (as amended October 8, 2015)
") Prospectus The Consumer Discretionary Select Sector SPDR Fund (XLY) The Consumer Staples Select Sector SPDR Fund (XLP) The Energy Select Sector SPDR Fund (XLE) The Financial Select Sector SPDR Fund (XLF)
Prospectus The Consumer Discretionary Select Sector SPDR Fund (XLY) The Consumer Staples Select Sector SPDR Fund (XLP) The Energy Select Sector SPDR Fund (XLE) The Financial Select Sector SPDR Fund (XLF)
Investment Insights, Pattern Recognition, & Market Outlook
 Investment Insights, Pattern Recognition, & Market Outlook NCKU Alumni Financial Night Daniel H. Chen, PhD, PE, CFP (in Progress) www.cheninvest.com dh_chen_us@yahoo.com September 8, 2007 09/08/07 www.cheninvest.com
Copyright 2017 ETF Dynamics, LLC
 Copyright 2017 ETF Dynamics, LLC The US Securities and Exchange Commission (SEC) Requires the following legal notices: ETF Dynamics, LLC does not advise its clients or any other person whether or not to
COPYRIGHTED MATERIAL. Index
 Index Accounting issues, 173 175 ETF taxation, 174 175 ETFs vs. ETNs, 173 175 Accumulation-distribution (A-D), 4, 59 60, 133, 144 calculation by price/volume, 60 61 overview of, 59 60 RSI and, 62 67 Accumulation
Exchange Traded Funds ETFs
 Exchange Traded Funds ETFs Table of Content: Topic Page Exchange Traded Funds Definition 3 Exchange Traded Funds Creation and Redemption 3 Exchange Traded Funds benefits 4 Exchange Traded Funds Types 6
Market Observations - as of Sep 28, 2018
 Market Observations - as of Sep 28, 2018 By Carl Jorgensen - For Objective Traders - For educational purposes only. Not Financial Advice. The month week, month and quarter ended with not much change in
US ETF Index performance (5d): SPY -0.9%, DIA -0.5%, IWM -2.0%, QQQ -1.1%, TLT -1.7% GLD -0.3%
: SPY -0.9%, DIA -0.5%, IWM -2.0%, QQQ -1.1%, TLT -1.7% GLD -0.3%") US ETF Index performance (5d): SPY -0.9%, DIA -0.5%, IWM -2.0%, QQQ -1.1%, TLT -1.7% GLD -0.3% TTG Market View: Next week earnings will be in the spotlight along with the third presidential debate, and
US ETF Index performance (5d): SPY -0.9%, DIA -0.5%, IWM -2.0%, QQQ -1.1%, TLT -1.7% GLD -0.3% TTG Market View: Next week earnings will be in the spotlight along with the third presidential debate, and
Relative Rotation Graphs (RRG Charts)
") Relative Rotation Graphs (RRG Charts) Introduction Relative Rotation Graphs or RRGs, as they are commonly called, are a unique visualization tool for relative strength analysis. Chartists can use RRGs
Relative Rotation Graphs (RRG Charts) Introduction Relative Rotation Graphs or RRGs, as they are commonly called, are a unique visualization tool for relative strength analysis. Chartists can use RRGs
Welcome to OneChicago Using the Single Stock Futures Calculator
 Welcome to OneChicago Using the Single Stock Futures Calculator Copyright 2008 OneChicago, LLC. All rights reserved. Single Stock Futures Security futures is the term used to collectively describe futures
November U.S. ETP Monthly Flash
 November 2016 U.S. ETP Monthly Flash NYSE Arca U.S. Exchange Traded Products (ETP) Highlights from November 2016 In November, 9 new ETPs listed on NYSE Arca At the end of November, 1,543 ETPs were listed
20,000 - Check, What s next?
 1 11 21 31 41 51 61 71 81 91 101 111 121 131 141 151 161 171 181 191 201 211 221 231 241 251 20,000 - Check, What s next? The Dow Jones Industrial Average crossed the psychological 20,000 barrier on January