FY Alliance Aviation Services Limited Results Presentation. August 2018
|
|
|
- Toby Shelton
- 5 years ago
- Views:
Transcription

1 FY 2018 Alliance Aviation Services Limited Results Presentation August 2018

2 Key Messages Alliance Aviation Services Limited announces a full year result which includes: $ 26.1m A strong financial performance with increased revenues from a record number of flight hours; Profit before tax, up 33% Record full year dividend of 8.8 cents, up 193% Revenue and flying hours An increase in operating cash flows and continued debt reduction; The introduction of four additional aircraft; and A record full year dividend. Aircraft into the fleet up by 4 Net debt down by $18.3m (26%) Operating cash flow of $38.3m, up 76%

3 Five Revenue Streams 3 Contract Revenue Wet Lease RPT Revenue Charter Revenue Aviation Services Long term contract flying Operating Alliance aircraft for other carriers Regular public transport (RPT) services to regional ports Short term income from adhoc requests Complementary services including leases, aerodrome management and part and aircraft sales. Revenue Analysis Alliance continues to see revenue growth across all flying categories with aviation services continuing to make a significant contribution to profit. Contract revenue has continued to benefit from growth in schedules across a number of clients and sectors; Wet lease hours increased in the year by 105%. These increased hours were from contracted wet lease clients and other operators who had short to medium term wet lease requirements; Charter income experienced growth in the year from a broad client base - in particular tourism operators and charter brokers requesting more capacity than the prior year; RPT revenues performed in line with expectations; and Aviation Services continues to develop and grow as a business. There is a steady increasing revenue stream from spare parts sales, engine and component sales, aerodrome management services and engineering services.

4 4 Financial Summary For the year ended 30 June 2018
5 5 Financial Statements Detail 30 June June 2017 Aircraft in service* Alliance has delivered strong results for the year ended 30 June 2018 Flight Hours contracted 18,828 17,872 Flight Hours wet lease 9,447 4,600 Flight Hours RPT 4,814 2,038 Flight Hours charter 1, Flight Hours maintenance Total Flight Hours 34,612 25,689 Average Staff Numbers Revenue per employee ($k) Contract % of Total Revenue 62% 72% * Includes all operational aircraft whether flying or in heavy maintenance.
6 Alliance Aviation Services - Income Statement % FY18 FY17 pcp ($ in millions) Actual Actual Change Revenue Contract Revenue % Charter Revenue % Wet lease Revenue % RPT Revenue % Aviation Services (41%) Other (Incl FX) (25%) Total revenue % Operating expenses (187.8) (151.0) 24% EBITDA % Depreciation & Amortisation (30.6) (26.4) 16% EBIT % Finance costs (3.4) (4.0) (15%) PBT % Income tax expense (8.0) (1.1) NPAT (2%) Basic EPS (4%) Observations: Wet lease revenue increased significantly throughout the year as a result of flying performed for a number of operators both domestically and internationally; Contract revenue increased as a result of schedule increases from new and existing clients; Charter revenue exceeded expectations in the year, with the market strengthening particularly in the tourism sector; Alliance invested in additional aircraft, crew, engineering and operational staff throughout the year; Depreciation has increased in line with aircraft utilisation and increased fleet units; and Income tax expense recognised in the period as a result of accounting profit; however no cash tax payable.
7 Alliance Aviation Services - Statement of Financial Position ($ in millions) 30-Jun Jun-17 Cash Receivables Inventory Total current assets PP&E Intangibles 0.4 Total non-current assets Total assets Trade & other payables Borrowings Current tax liabilities Provisions / other Total current liabilities Borrowings Deferred tax liability Provisions / other Total non-current liabilities Total liabilities Observations: Cash has increased over the year as a result of increased profitability and enhanced cash flow management; Inventory includes all remaining stored aircraft and ex-austrian Fokker spare parts acquired during the year; PP&E has increased due to the addition of additional fleet units; Payables include the balance of ex- Austrian Fokker spare parts payable by 3 September 2018; Total borrowings reduced by $10M; and Net asset position has increased 9% on prior year comparative. 7 Net assets Leverage ratio (D/EBITDA)
8 Alliance Aviation Services - Cash Flow Statement FY18 FY17 ($ in millions) Receipts from customers (inclusive of GST) Payments to suppliers (inclusive of GST) (227.5) (192.9) Net interest paid (3.4) (3.8) Income tax paid (0.1) (0.1) Net cash inflow (outflow) from operating activities Net payments for aircraft, property, plant & equipment (14.9) (13.5) Free Cash Flow Proceeds from borrowings Repayment of borrowings (14.1) (7.5) Dividends paid (4.8) (1.9) Observations: Increased cash flow due to improved operational and financial performance; Increased contribution from aviation services (excl. aircraft trading); Increase in PPE payments as Alliance brings additional aircraft into the fleet; Borrowings reduced in the year by double that of the previous year; and Record dividend payments. Net cash inflow (outflow) from financing activities (14.8) (6.9) Net increase (decrease) in cash & cash equivalents Cash & cash equivalents at the beginning of period Effects of currency translation on cash and cash equivalents (0.3) 0.0 Cash & cash equivalents at the end of the half year

9 Stable Contract Client Base

10 Major Commodity Exposure by 15 Major Contracts FY19 Commodity / Sector Exposure
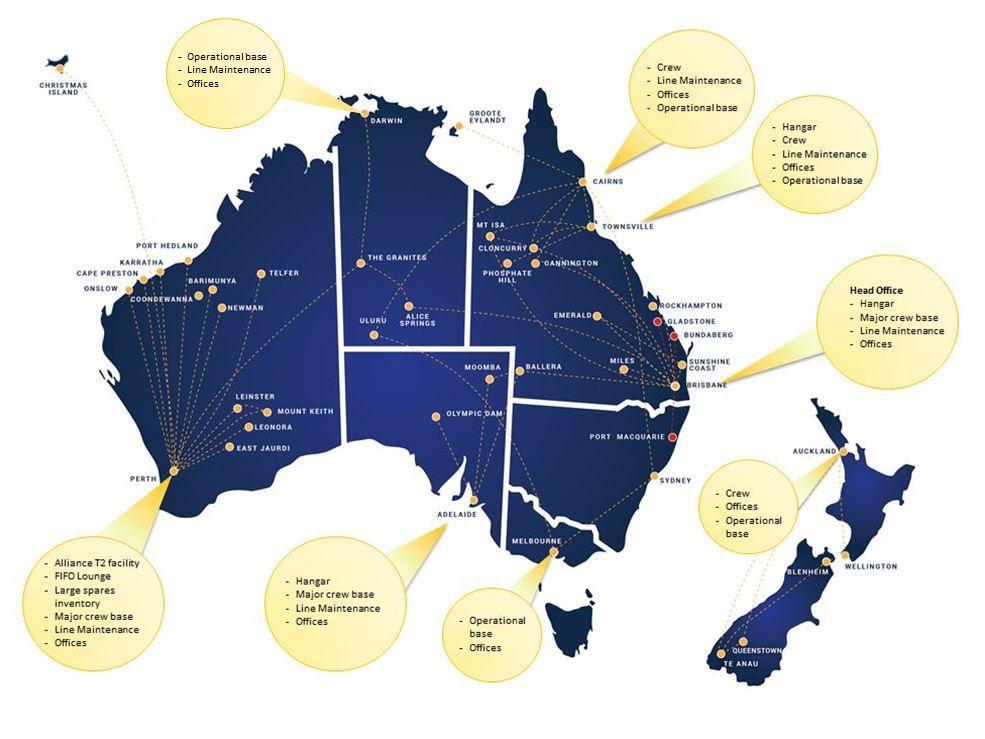
11 Footprint


12 F50-50 SEAT TOURBO-PROP AIRCRAFT F70-80 SEAT JET AIRCRAFT F SEAT JET AIRCRAFT Fleet Scenario 19 Number in service 30 June 18 5 Enter into service FY Storage 25 Total Aircraft 9 Number in service 30 June 18 4 Enter into service FY Storage 15 Total Aircraft 5 Number in service 30 June 18 - Enter into service FY Storage 5 Total Aircraft


13 Operational Excellence Long-term heavy maintenance provider Wyvern Wingman certification Extension to Rolls Royce total care program 95% OTP Renewed IOSA certification in FY18 BARS Gold standard achieved Long-term heavy maintenance provider
14 Alliance maintains a positive outlook for its financial performance for FY19 Contract flying expected to increase as extra demand for services are requested from the resources sector. Long term tourism contracts will also increase in FY19; Long term contracted wet lease hours to continue to increase through the year. Short to mid term wet lease contracts also expected to continue on current trends; Outlook The charter sector has strengthened and it is expected to add increased contribution in FY19. Both inbound and domestic tourism sectors are seeing increased activity. Aviation services will continue to increase its contribution from spare parts sales, engine and component leasing, aerodrome management services and engineering services. The Directors recognise the need to reward shareholders. The Board of Alliance is very aware of the need for good capital management in these times of significant operating cash flows. With significant franking credits, a dividend is an efficient distribution mechanism and the Board is monitoring future dividend payouts along with the needs of the business into the future.
15 Disclaimer Reliance on third party information This presentation was prepared by Alliance Aviation Services Limited (ACN ) ( Alliance ). This presentation may contain information that has been derived from publicly available sources that have not been independently verified. No representation or warranty is made as to the accuracy, completeness or reliability of the information. Presentation is summary only The information contained in this presentation is in summary form only and does not purport to be complete. It should be read in conjunction with Alliance s full year June 2018 annual report. Any information or opinions expressed in this presentation are subject to change without notice and Alliance is under no obligation to update or keep current the information contained within this presentation. Not investment advice This presentation is not intended to be, and should not be considered to be, the giving of investment advice by Alliance or any of its shareholders, directors, officers, agents, employees or advisers. The information provided in this presentation has been prepared without taking into account the recipient s investment objectives, financial circumstances or particular needs. Each party to whom this presentation is made available must make its own independent assessment of Alliance after making such investigations and taking such advice as may be deemed necessary. No offer of securities Nothing in this presentation should be construed as either an offer to sell or a solicitation of an offer to buy or sell Alliance securities in any jurisdiction. Forward looking statements This presentation may include forward looking statements. Although Alliance believes the expectations expressed in such forward looking statements are based on reasonable assumptions, these statements are not guarantees or predictions of future performance, and involve both known and unknown risks, uncertainties and other factors, many of which are beyond Alliance s control. As a result, actual results or developments may differ materially from those expressed in the statements contained in this presentation. Investors are cautioned that statements contained in this presentation are not guarantees or projections of future performance and actual results or developments may differ materially from those projected in forward looking statements. Past performance is not a reliable indication of future performance. No Liability To the maximum extent permitted by law, neither Alliance or any of its shareholders, directors, officers, agents, employees or advisers accepts, and each expressly disclaims, any liability, including without limitation any liability arising from fault or negligence, for any errors or misstatements in, or omissions from, this presentation or any direct, indirect or consequential loss arising from the use of this presentation or its contents or otherwise arising in connection with it.
Interim Results Presentation
 Interim Results Presentation Half Year 31 December 2015 Released 15 February 2016 Scott McMillan, Managing Director Lee Schofield, Chief Executive Officer Matt Dyer, Chief Financial Officer Key Messages
2011 Interim Results. Keith Gordon, Managing Director & Chief Executive Officer Stephen Gobby, Chief Financial Officer
 2011 Interim Results Keith Gordon, Managing Director & Chief Executive Officer Stephen Gobby, Chief Financial Officer Emeco 2011 Interim Results Overview Financials Strategy & Outlook Questions Appendices
For personal use only
 Investor Presentation Half Year Results to 31 December 2016 24 February 2017 PETER CAUGHEY, CEO & MANAGING DIRECTOR 1 Agenda Overview Financials Business conditions, strategy and outlook 2 Overview 1H17
OVERVIEW. Operating cash flow $447.8 million, EBITDA conversion 92.8% Total revenue 1 $7,394 million, down 0.5%
 OVERVIEW Total revenue 1 $7,394 million, down 0.5% Earnings Before Interest and Tax (EBIT) $276.9 million, down 10.6%. Down 1.5% adjusting for $13 million Capital Metro bid costs and $15 million reduction
For personal use only
 ALLIANCE AVIATION SERVICES LIMITED ACN 153 361 525 ASX Code : AQZ INTERIM FINANCIAL REPORT For the half-year ended TABLE OF CONTENTS Corporate Directory 2 Directors Report 3 Summary of Financial Results
2017 half year results investor presentation
 2017 half year results investor presentation 27 February 2017 contents section presenting slide CEO presentation Julian Ogrin 3 broadband 10 CFO presentation Leanne Wolski 14 summary Julian Ogrin 21 appendix
COVENTRY GROUP LTD AGM CHAIRMAN S AND CEO S ADDRESSES 22 NOVEMBER 2017
 COVENTRY GROUP LTD AGM CHAIRMAN S AND CEO S ADDRESSES 22 NOVEMBER 2017 Good morning ladies and gentlemen and welcome to the 81st Annual General Meeting of Coventry Group Ltd. My name is Neil Cathie and
Engenco Limited Investor Presentation FY17. Presented by: Vince De Santis (Chairman) Kevin Pallas (Managing Director & CEO)
 Kevin Pallas (Managing Director & CEO)") Engenco Limited Investor Presentation Presented by: Vince De Santis (Chairman) Kevin Pallas (Managing Director & CEO) Company $8,269,000 Highlights Total profit for the period Revenue (from continuing
Engenco Limited Investor Presentation Presented by: Vince De Santis (Chairman) Kevin Pallas (Managing Director & CEO) Company $8,269,000 Highlights Total profit for the period Revenue (from continuing
FY2018 Half Year Results Presentation 1 March 2018
 FY2018 Half Year Results Presentation Brands AMA Group Overview Vehicle Panel Repair Vehicle Protection Products & Accessories Automotive Electrical & Cable Accessories Automotive Component Remanufacturing
Full Year Result August 2015 Page 2
 Freightways Full Year Result Presentation 17 August 2015 This presentation relates to the Freightways Limited NZX announcement and media release of 17 August 2015. As such, it should be read in conjunction
ALLIANCE AVIATION SERVICES LIMITED. ANNUAL REPORT For the year ended 30 June 2018
 ALLIANCE AVIATION SERVICES LIMITED ACN 153 361 525 ASX Code : AQZ ANNUAL REPORT For the year ended 30 June 2018 TABLE OF CONTENTS Company Directory... 2 Directors Report... 3 Principal Activities... 3
Acquisition of European herbicide product portfolio from FMC
 Acquisition of European herbicide product portfolio from FMC 8 November 2017 Important notice and disclaimer This presentation has been prepared by Nufarm Limited ACN 091 2 12 ( Nufarm" or the "Company").
Sigma Pharmaceuticals Limited
 Sigma Pharmaceuticals Limited Results Presentation for the Full Year ended 31 January 2013 Mark Hooper CEO& Managing Director Jeff Sells Chief Financial Officer 14 March 2013 Important notice The material
INVESTOR PRESENTATION SG FLEET GROUP LIMITED - FY2016 RESULTS
 INVESTOR PRESENTATION SG FLEET GROUP LIMITED - FY2016 RESULTS 16 August 2016 Important Notice and Disclaimer IMPORTANT INFORMATION The information in this presentation is general in nature and does not
1H 19 Investor Presentation February 2019
 1H 19 Investor Presentation February 2019 1 About Raiz Raiz (formerly Acorns) is a mobile first micro-investing platform via mobile phone or web app, which allows customers to invest in a portfolio of
2. Managing Director s Review 3. Ordinary Resolutions 4. Question & Answer Time
 23 May 2013 0 This document has been prepared by Vita Life Sciences Limited (Vita Life) and comprises written material/slides for a presentation concerning Vita Life. The presentation is for information
For personal use only
 2015 Full Year Results Presentation MATRIX COMPOSITES AND ENGINEERING 19 August 2015 Agenda Overview Financial results Operational review Strategy & outlook 2 Overview Financial Revenue: $144.1 million
FY15 RESULTS 27 AUGUST 2015 PETER CAUGHEY, CEO & MANAGING DIRECTOR
 FY15 RESULTS 27 AUGUST 2015 PETER CAUGHEY, CEO & MANAGING DIRECTOR 1 FY15 Overview Refreshed governance structure Executive Chair retired and role split into Non-Executive Chair and CEO New Non-Executive
For personal use only
 Macquarie Conference Presentation 8 May 2015 Geoff Horth, CEO Presentation Content Organic Growth Driving Results Acquisition of Call Plus Group Outlook 2 Organic Growth! Driving Results! The Numbers Financial
FY18 Results Presentation Bravura Solutions Limited. 28 August 2018
 FY18 Results Presentation Bravura Solutions Limited 28 August 2018 Important notice and disclaimer The information contained in this document (including this notice) and discussed at this presentation
Ainsworth Game Technology Limited
 FY18 Annual Results Announcement Ainsworth Game Technology Limited www.agtslots.com Disclaimer IMPORTANT NOTICE This presentation has been prepared by Ainsworth Game Technology Limited ACN 068 516 665
OneVue Holdings Limited (OVH)
") OneVue Holdings Limited (OVH) H1 FY 2018 results presentation 26 February 2018 1 HIGHLIGHTS 2 FINANCIALS 3 OUTLOOK 4 APPENDICES Page 2 1 HIGHLIGHTS . BENEFITTING FROM SECTORAL GROWTH AND STRUCTURAL DISRUPTION
OneVue Holdings Limited (OVH) H1 FY 2018 results presentation 26 February 2018 1 HIGHLIGHTS 2 FINANCIALS 3 OUTLOOK 4 APPENDICES Page 2 1 HIGHLIGHTS . BENEFITTING FROM SECTORAL GROWTH AND STRUCTURAL DISRUPTION
BROKER PRESENTATION JUNE 2017
 PACIFIC ENERGY LIMITED ASX : PEA BROKER PRESENTATION JUNE 2017 Important Notice and Disclaimer This presentation has been prepared by (PEA) for information purposes only. This presentation is not a product
2018 Full Year Results Presentation
 2018 Full Year Results Presentation MATRIX COMPOSITES & ENGINEERING Aaron Begley Chief Executive Officer Brendan Cocks Chief Financial Officer 23 August 2018 Disclaimer Reliance on third party information
For personal use only
 DWS Limited 2017 Half Year Results Presentation Contents Introduction Danny Wallis (CEO) / Stuart Whipp (CFO) Results Highlights Half Year Results Summary Review Capital Management Operations Update Summary
Investor Presentation Full Year CY 2017 Results
 Investor Presentation Full Year CY 2017 Results Deven Billimoria Managing Director and CEO Tim Looi Chief Financial Officer 22 February 2018 PAGE 0 Smartgroup has had another successful year... 1 2 3 4
FY16 Financial Results Investor Presentation. August 2016
 FY16 Financial Results Investor Presentation August 2016 FY16 Results Summary Improvement on FY15 across all key earnings metrics EPS growth and improved shareholder returns Revenue EBITDA PBT EPS Dividend
Half Year Result 2016
 Half Year Result 2016 MATRIX COMPOSITES & ENGINEERING Aaron Begley Chief Executive Officer Peter Tazewell Chief Financial Officer 24 February 2016 Agenda Overview Financial results Performance, strategies
PRICE $1.30 Regional Express Holdings Ltd REX
 16 November 2006 PRICE $1.30 Regional Express Holdings Ltd REX Analyst Ken Fleming (03) 6224 8511 ken.fleming@tricom.com.au Max Wheeler (03) 6224 9899 Fully diluted shares on issue 115M Market cap A$133M
For personal use only
 2016 Financial Year Results Presentation August 5, 2016 Key highlights FY16 FY15 Change Underlying Profit / (Loss) Before Tax 1,2 $41.0m ($49.1m) $90.1m Statutory (loss) after tax 2 ($224.7m) ($93.8m)
For personal use only. F Y R e s u l t s P r e s e n t a t i o n
 F Y 2 0 1 6 R e s u l t s P r e s e n t a t i o n Our Brands 2 Disclaimer The material in this presentation has been prepared by Bapcor Limited ( Bapcor ) ABN 80 153 199 912 and is general background information
FINANCIAL RESULTS PRESENTATION H1FY18
 Virtus Health (ASX:VRT) FINANCIAL RESULTS PRESENTATION H1FY18 Tuesday 20 th February, 2018 9.15am AEDT DISCLAIMER The material in this presentation has been prepared by Virtus Health Limited ABN 80 129
2018 Half Year Results Presentation
 2018 Half Year Results Presentation MATRIX COMPOSITES & ENGINEERING Aaron Begley Chief Executive Officer Brendan Cocks Chief Financial Officer 22 February 2018 Disclaimer Reliance on third party information
Financial Results for the Full Year Ended 30 June 2012
 Financial Results for the Full Year Ended 30 June 2012 Sims Metal Management Limited ASX Code: SGM NYSE Code: SMS Supplemental Information 23 August 2012 Disclaimer This presentation may contain forward-looking
YEAR END RESULTS 31 MARCH Russell Down, Chief Executive Chris Morgan, Group Finance Director
 YEAR END RESULTS 31 MARCH 2018 Russell Down, Chief Executive Chris Morgan, Group Finance Director Customer service strategy improving performance Revenue (excluding disposals) 371.6m 6.4% FY17: 349.1m
Q3 FY2010 Financial Highlights
 Disclaimer The information in this document has not been independently verified and no representation or warranty, express or implied, is made as to, and no reliance should be placed on, the fairness,
For personal use only
 Appendix 4D Results for announcement to the market (ACN 104 113 760) This half-year report is provided to the Australian Securities Exchange (ASX) under ASX listing Rule 4.2A.3. Current reporting period:
For personal use only
 SUMMARY OF 1H19 GROUP OUTCOMES Strong first half performance UNDERLYING PROFIT BEFORE TAX (UPBT) 1H19 $112.3m up $30.4m on 1H18 Highest 1H underlying result in 11 years Delivered despite $88.2m fuel and
Beacon Lighting Group Limited RESULTS PRESENTATION HI F Y 20 15
 Beacon Lighting Group Limited RESULTS PRESENTATION HI F Y 20 15 DISCLAIMER The purpose of this presentation is to provide background material in relation to the H1 FY2015 results of Beacon Lighting Group
ASX Media Release WORLEYPARSONS LIMITED (ASX: WOR) FULL YEAR 2017 RESULT
 FULL YEAR 2017 RESULT") 23 August 2017 ASX Media Release WORLEYPARSONS LIMITED (ASX: WOR) FULL YEAR 2017 RESULT Professional services company WorleyParsons Limited today announced a statutory net profit after tax (NPAT) of $33.5
23 August 2017 ASX Media Release WORLEYPARSONS LIMITED (ASX: WOR) FULL YEAR 2017 RESULT Professional services company WorleyParsons Limited today announced a statutory net profit after tax (NPAT) of $33.5
Business Update. USPP Conference Miami. Luis Damasceno Group CFO Michael Williams Group Finance Director & Treasurer January 2019
 Business Update USPP Conference Miami Luis Damasceno Group CFO Michael Williams Group Finance Director & Treasurer 23-25 January 2019 www.alsglobal.com IMPORTANT NOTICE AND DISCLAIMER This presentation
ALLIANCE AVIATION SERVICES LIMITED
 ALLIANCE AVIATION SERVICES LIMITED ACN 153 361 525 ASX Code : AQZ ANNUAL REPORT For the year ended 30 June 2017 TABLE OF CONTENTS Company Directory... 2 Directors Report... 3 Summary of Financial Results...
Full Year 2017 Results Presentation Bravura Solutions Limited
 Full Year 2017 Results Presentation Bravura Solutions Limited 23 rd August 2017 Important notice and disclaimer The information contained in this document (including this notice) or discussed at this presentation
Sigma Pharmaceuticals Limited. Annual General Meeting, 4 May 2016
 Sigma Pharmaceuticals Limited Annual General Meeting, 4 May 2016 Important notice The material provided is a presentation of general information about Sigma's activities current at the date of the presentation.
MOTORCYCLE HOLDINGS LIMITED
 MOTORCYCLE HOLDINGS LIMITED FY2018 Full Year Results Disclaimer Disclaimer and Important Information This presentation may contain certain unaudited financial information in relation to Limited (MTO).
Q Results presentation
 Q1 2018 Results presentation 12 May 2016 1 15 May, 2018 Disclaimer This presentation (the "Presentation") has been prepared and is issued by, and is the sole responsibility of Telepizza Group, S.A. ( Telepizza"
Results Q1 2017
 www.heliostowersafrica.com Results Q1 2017 19 May 2017 www.heliostowersafrica.com Agenda 1 Executive Summary 2 Financial Results 3 Q&A 3 Today s Team Team from Helios Towers Africa ( HTA ) Kash Pandya
Q Results presentation
 Q1 2016 Results presentation 12 May 2016 1 Disclaimer This presentation (the "Presentation") has been prepared and is issued by, and is the sole responsibility of Telepizza Group, S.A. ( Telepizza" or
Interim FY 2015 results 6 months ended 31 December February 2015
 Interim FY 2015 results 31 December 2014 18 February 2015 Highlights Solid trading result for 1H FY2015; change in accounting policy for acquisition of healthcare practices First half result highlights
OneVue Holdings Limited (OVH)
") OneVue Holdings Limited (OVH) FY 2017 results presentation 28 August 2017 Regulators, fund managers and investors are calling for greater transparency of platform costs and revenue drivers Platform differentiation
OneVue Holdings Limited (OVH) FY 2017 results presentation 28 August 2017 Regulators, fund managers and investors are calling for greater transparency of platform costs and revenue drivers Platform differentiation
Bell Potter Emerging Leaders Conference
 Bell Potter Emerging Leaders Conference Sydney, 24 October 2017 Leon Allen, Managing Director and CEO Disclaimer This presentation has been prepared by QANTM Intellectual Property Limited ACN 612 441 326
For personal use only
 2016 Full Year Results Presentation MATRIX COMPOSITES & ENGINEERING Aaron Begley Chief Executive Officer Peter Tazewell Chief Financial Officer 24 August 2016 Agenda Overview Financial results Strategy
For personal use only. 30 June 2016 Full Year Results Presentation
 30 June 2016 Full Year Results Presentation 30 August 2016 FY16 Financial Results Highlights Group Revenue A$143.4m Underlying 1 EBITDA A$87.6m Underlying 1 NPAT A$54.4m Operating Cashflow A$48.7m Maiden
For personal use only
 ASX ANNOUNCEMENT 10 August 2016 Results for year ended 30 June 2016 (ASX: EGG) today announced its results for the year ended 30 June 2016. Summary: Net Revenue up 3% and Operating EBITDA up 44% on prior
1H15 GROUP SUMMARY. Any discrepancies between totals and sums of components in this publication are due to rounding
 2 1H15 GROUP SUMMARY Group premium revenue up 9.1% to $802.3m (1H14: $735.4m). Group operating profit up 1.7% to $42.1m (1H14: $41.4m) 1. Australian residents health insurance (arhi) operating profit up
For personal use only
 DWS Limited 2016 Half Year Results Presentation Contents Introduction Danny Wallis (CEO) / Stuart Whipp (CFO) Results Highlights Half Year Results Capital Management Operations Update DWS Growth Strategy
For personal use only
 Mantra St Kilda Road, Melbourne DOMESTIC TRAVEL BY AUSTRALIANS INTERNATIONAL VISITORS TO AUSTRALIA Source: Tourism Research Australia, NVS and IVS June 2016 Source: Tourism Research Australia, Tourism
TOURISM HOLDINGS LTD FY16 INTERIM RESULTS PRESENTATION. 23 February 2016
 TOURISM HOLDINGS LTD FY16 INTERIM RESULTS PRESENTATION 23 February 2016 $M H1 FY16 Highlights Revenue $134M up 20% Earnings before interest and tax* $15.0M up 42% Net profit after tax $8.2M up 45% H1 EBIT
2009 FULL YEAR FINANCIAL RESULTS
 OZ MINERALS 2009 FULL YEAR FINANCIAL RESULTS TERRY BURGESS MANAGING DIRECTOR & CEO ANDREW COLES CHIEF FINANCIAL OFFICER 25 February 2010 WWW.OZMINERALS.COM OZ MINERALS NOVEMBER 2009 PAGE 1 IMPORTANT NOTICE
FY 2017 Results Presentation
 FY 2017 Results Presentation Wednesday 23 August 2017 Presented by: Mr. Alf Moufarrige, Chief Executive Officer 1 Disclaimer Important Information Servcorp Limited (ABN 97 089 222 506) ( Servcorp ) is
Chief Executive Officer : John Croll Chief Financial Officer : James Orlando
 23 AUGUST 2017 FY17 RESULTS Chief Executive Officer : John Croll Chief Financial Officer : James Orlando isentia.com AGENDA Overview of FY17 Results Strategic Focus FY17 Financial Performance Q&A John
FY2014 Full year results
 FY2014 Full year results Peter Watson CEO I Managing Director Ian Poole Chief Financial Officer 28 August 2014 FY2014 year in review Resources capital expenditure conditions subdued Strong underlying result
Results Q3 2017
 www.heliostowersafrica.com Results Q3 2017 27 November 2017 www.heliostowersafrica.com Agenda 1 Executive Summary 2 Financial Results 3 Q&A 3 Today s Team Team from Helios Towers ( HT ) Kash Pandya Chief
For personal use only
 FINANCIAL PERFORMANCE HIGHLIGHTS DELIVERING ON FY2020 STRATEGY Estia Health (EHE) 7 December 2015 1 HIGHLIGHTS Acquisition of medium-sized group, Kennedy Health Care - 959 places 5,690 places by the end
Financial Highlights (1)
") Disclaimer The information in this document has not been independently verified and no representation or warranty, expressed or implied, is made as to, and no reliance should be placed on, the fairness,
Disclaimer The information in this document has not been independently verified and no representation or warranty, expressed or implied, is made as to, and no reliance should be placed on, the fairness,
For personal use only
 DWS Limited 2018 Full Year Results Presentation Contents Introduction Danny Wallis (CEO) / Stuart Whipp (CFO) Results Highlights Full Year Results Capital Management Operations Update Summary and Outlook
H RESULTS PRESENTATION
 H1 2018 RESULTS PRESENTATION 03.09.2018 H1 2018 RESULTS PRESENTATION DISCLAIMER This presentation (the "Presentation") has been prepared and is issued by, and is the sole responsibility of Telepizza Group,
Miclyn Express Offshore
 Miclyn Express Offshore FY13 Results Presentation 26 August, 2013 Live Webcast Details Presenter: Diederik de Boer, CEO Date: 26 August, 2013 Time: 11:00am AEST Access: http://www.brrmedia.com/event/114725
OneVue Holdings Limited (OVH)
") OneVue Holdings Limited (OVH) Morgan Stanley Emerging Companies Conference Thursday 7 June 2018 A FINTECH COMPANY THAT PARTNERS TO DISRUPT ALONG THE SUPERANNUATION VALUE CHAIN Market leading businesses,
OneVue Holdings Limited (OVH) Morgan Stanley Emerging Companies Conference Thursday 7 June 2018 A FINTECH COMPANY THAT PARTNERS TO DISRUPT ALONG THE SUPERANNUATION VALUE CHAIN Market leading businesses,
FY18 1 ST HALF RESULTS
 26 FEBRUARY 2018 FY18 1 ST HALF RESULTS Chief Executive Officer : Chief Financial Officer : John Croll James Orlando isentia.com AGENDA Overview of H1 FY18 Results Strategic Focus H1 FY18 Financial Performance
For personal use only. FY2017 Results Presentation
 FY2017 Results Presentation Disclaimer The material in this presentation has been prepared by Bapcor Limited ( Bapcor ) ABN 80 153 199 912 and is general background information about Bapcor s activities
ALLIANCE AVIATION SERVICES LIMITED. ANNUAL REPORT For the year ended 30 June 2016
 ALLIANCE AVIATION SERVICES LIMITED ACN 153 361 525 ASX Code : AQZ ANNUAL REPORT For the year ended 30 June 2016 TABLE OF CONTENTS Company Directory... 2 Directors Report... 3 Summary of Financial Results...
FY18 $109.6m up $113.3m on FY17 GROUP UNDERLYING Delivered despite $45.0m fuel (net of FX) headwind
 headwind") FY18 GROUP OUTCOMES FY18 $109.6m up $113.3m on FY17 GROUP UNDERLYING PROFIT BEFORE TAX (PBT) 1 Highest underlying result since FY08 Delivered despite $45.0m fuel (net of FX) headwind X VA DOMESTIC RECORD
FY18 GROUP OUTCOMES FY18 $109.6m up $113.3m on FY17 GROUP UNDERLYING PROFIT BEFORE TAX (PBT) 1 Highest underlying result since FY08 Delivered despite $45.0m fuel (net of FX) headwind X VA DOMESTIC RECORD
Photo by James Ball - Coffey International Limited FY2013 Half Year Results Presentation. 11 February 2013
 Photo by James Ball - www.dlscape.com Coffey International Limited FY2013 Half Year Results Presentation 11 February 2013 Agenda Financial Performance Business Performance Outlook Presenters John Douglas
H 1 F Y 1 8 R E S U LT S P R E S E N TAT I O N 28 FEBRUARY 2018
 H 1 F Y 1 8 R E S U LT S P R E S E N TAT I O N 28 FEBRUARY 2018 2 H1 FY18 results presentation G R O U P H I G H L I G H T S DELIVERS STRONGEST H1 UNDERLYING PROFIT RESULT IN 10 YEARS 1 Underlying Profit
QANTM. Half Year Results Presentation. Leon Allen, Managing Director and CEO Martin Cleaver, Chief Financial Officer. Six months to 31 December 2017
 Half Year Results Presentation Six months to 31 December 2017 QANTM 22 FEBRUARY 2018 Leon Allen, Managing Director and CEO Martin Cleaver, Chief Financial Officer Disclaimer This presentation has been
QANTM. Full Year Results Presentation. Leon Allen, Managing Director and CEO Martin Cleaver, Chief Financial Officer. 12 months to 30 June 2018
 Full Year Results Presentation 12 months to 30 June 2018 QANTM 29 AUGUST 2018 Leon Allen, Managing Director and CEO Martin Cleaver, Chief Financial Officer Structure 1. 2018 Summary Features 2. Market
Transpacific FY15 Half Year Results Presentation
 Transpacific FY15 Half Year Results Presentation Robert Boucher CEO Brendan Gill CFO 20 February 2015 - Disclaimer Forward looking statements - This presentation contains certain forward-looking statements,
Regional Express Holdings Ltd REX
 20 February 2006 REX $1.15 Analyst Ken Fleming (613) 6224 8511 ken.fleming@tricom.com.au Max Wheeler (613) 6224 9899 Fully diluted shares on issue 115.0M Market cap A$132.3M Performance & Valuation Last
PRICE $1.16 Regional Express Holdings Ltd REX
 13 September 2006 PRICE $1.16 Regional Express Holdings Ltd REX Analyst Ken Fleming (03) 6224 8511 ken.fleming@tricom.com.au Max Wheeler (03) 6224 9899 Fully diluted shares on issue 115.0M Market cap A$121.9M
QANTM. Full Year Results Presentation. Leon Allen, Managing Director and CEO Martin Cleaver, Chief Financial Officer. 12 months to 30 June 2017
 Full Year Results Presentation 12 months to 30 June 2017 QANTM 30 AUGUST 2017 Leon Allen, Managing Director and CEO Martin Cleaver, Chief Financial Officer Disclaimer This presentation has been prepared
BUY SHARE PRICE CASH EARNINGS ($M) COMPANY DATA & RATIOS
 COMPANY DATA & RATIOS") BUY 0.11 0.39 0.69 SHARE PRICE CASH EARNINGS ($M) COMPANY DATA & RATIOS CONTENTS Competitors Products Sales channels Pricing Model INVESTMENT THESIS COMPANY OVERVIEW INDUSTRY OVERVIEW COMPETITORS BOARD
BUY 0.11 0.39 0.69 SHARE PRICE CASH EARNINGS ($M) COMPANY DATA & RATIOS CONTENTS Competitors Products Sales channels Pricing Model INVESTMENT THESIS COMPANY OVERVIEW INDUSTRY OVERVIEW COMPETITORS BOARD
FINANCIAL RESULTS PRESENTATION FY2018
 Virtus Health (ASX:VRT) FINANCIAL RESULTS PRESENTATION FY2018 Tuesday 21 August, 2018 AEST DISCLAIMER The material in this presentation has been prepared by Virtus Health Limited ABN 80 129 643 492 ( Virtus
Full year results 30 June 2018.
 CORPORATE TRAVEL MANAGEMENT Full year results 30 June 2018. Presented by: Jamie Pherous, Founder & Managing Director Date: 22 nd August, 2018 PAGE 2 Disclaimer The information in this presentation does
For personal use only ACQUISITION OF BEST TRACTOR PARTS INVESTOR PRESENTATION
 ACQUISITION OF BEST TRACTOR PARTS INVESTOR PRESENTATION 27 August 2012 CLICK TO EDIT MASTER TITLE 2 2 2 IMPORTANT NOTICE AND DISCLAIMER This presentation and these materials (together the Presentation
Financial Year 2015 Results Presentation. August 7, 2015
 Financial Year 2015 Results Presentation August 7, 2015 Key highlights FY15 vs. FY14 1 Underlying Loss Before Tax 2 ($49m) $163m Statutory Loss After Tax ($94m) $260m Return on Invested Capital 2 6.1%
ASX: DDR FY16 Results Presentation. March 2017
 ASX: DDR FY16 Results Presentation March 2017 Corporate Headlines Capital Structure Share Price (24 Mar 2017) $2.17 Fully paid ordinary shares 160.0m Options 0.0m Market Capitalisation $347.2m Shareholders
FY2017 RESULTS PRESENTATION FULL YEAR RESULTS TO 30 JUNE 2017
 FY2017 RESULTS PRESENTATION FULL RESULTS TO 30 JUNE 2017 This presentation has been prepared by rhipe Limited ACN 112 452 436 (RHP). Each Recipient of this presentation is deemed to have agreed to accept
Investor Presentation
 Investor Presentation Full Year Results FY2018 Raj Naran, Managing Director and CEO, ALS Limited 28 May 2018 www.alsglobal.com IMPORTANT NOTICE AND DISCLAIMER This presentation has been prepared by ALS
Monash IVF Group. FY16 Results Presentation 26 August 2016
 Monash IVF Group FY16 Results Presentation 26 August 2016 Disclaimer The presentation has been prepared by Monash IVF Group Limited (ACN 169 302 309) ( MVF ) (including its subsidiaries, affiliates and
Q1 FY 14 IMS Analyst & Investor presentation. 3 months to 31 December 2013
 Q1 FY 14 IMS Analyst & Investor presentation 3 months to 31 December 2013 23 January 2014 1 1 Strategy continues to deliver 1. Drive demand, conversion and yields across Europe Passenger numbers up by
Tabcorp Holdings Limited. 2014/15 Full Year Results Presentation 13 August 2015
 Tabcorp Holdings Limited ABN 66 063 780 709 2014/15 Full Year Results Presentation 13 August 2015 Draft version 15 (01-08-13) FY15 overview Statutory NPAT $334.5m, up 157.5%, comprising of: NPAT from continuing
Prime Financial Group Ltd (ASX: PFG) Full Year 2018 Results Presentation
 Full Year 2018 Results Presentation") Prime Financial Group Ltd (ASX: PFG) Full Year 2018 Results Presentation 29 August 2018 Click here to access accompanying Full Year 2018 Results Presentation podcast Key Points 1. Exposure to favourable
Prime Financial Group Ltd (ASX: PFG) Full Year 2018 Results Presentation 29 August 2018 Click here to access accompanying Full Year 2018 Results Presentation podcast Key Points 1. Exposure to favourable
Half Year to 31 December Financial Results Roadshow March 2018
 Half Year to 31 December 2017 Financial Results Roadshow 12-16 March 2018 COMPANY HIGHLIGHTS H1 FY18 FOVIO driver monitoring technology launched in General Motors Cadillac CT6 Super Cruise Premium German
Class Limited. FY17 Results Presentation. Kevin Bungard, CEO 15 August 2017
 Class Limited FY17 Results Presentation Kevin Bungard, CEO 15 August 2017 Important information This presentation is provided for information purposes only. The information in this presentation is in a
For personal use only. Mantra Group. FY2015 Results Presentation 27 August 2015
 Mantra Group FY2015 Results Presentation 27 August 2015 IMPORTANT NOTICE AND DISCLAIMER Important notice and disclaimer This document is a presentation of general background information about the activities
FY12 Results 22 May 2012
 FY12 Results 22 May 2012 DISCLAIMER --- Important Notice This presentation has been prepared by Thorn Group Limited (Thorn). This presentation is not a financial product or investment advice or recommendation,
FY2016 H1 Results Presentation. September 2016
 FY2016 H1 Results Presentation September 2016 Corporate Headlines Capital Structure Share Price (1 Sep 2016) $1.97 Fully paid ordinary shares 159.4m Options 0.0m Shareholders Founder -David Dicker 60.6m
Half Year Results to 31 July 2018 Announced 6 September 2018
 Sigma Healthcare Limited Half Year Results to 31 July 2018 Announced 6 September 2018 ASX Ticker: SIG Important Notice The material provided is a presentation of general information about Sigma s activities,
Imdex Limited. FY09 Half Year Results 16 February Bernie Ridgeway Managing Director Paul Evans Chief Financial Officer
 Imdex Limited FY09 Half Year Results 16 February 2009 Bernie Ridgeway Managing Director Paul Evans Chief Financial Officer Presentation overview Overview FY09 Half Year Results Operational review Outlook