FY2014 Full year results
|
|
|
- Morgan Stokes
- 5 years ago
- Views:
Transcription

1 FY2014 Full year results Peter Watson CEO I Managing Director Ian Poole Chief Financial Officer 28 August 2014


2 FY2014 year in review Resources capital expenditure conditions subdued Strong underlying result Balance sheet remains strong SDM has responded to re-align cost base to market conditions Significant contract wins reflect strong market position Delivering diversification strategy to position Sedgman for market upturn Order book improved from June
3 Business unit performance FY FY ($million) Combined Revenue 1 Projects Operations Total EBITA (underlying) 2 Projects (7.2) 11.3 Operations Total EBITA % Margins (underlying) 2 Projects (3.3%) 4.6% Operations 8.3% 8.4% Total 1.1% 6.3% Underlying business remains strong Projects Revenue decreased as a number of significant projects undertaken in FY2013 were not replaced in FY2014 reflecting continued weak conditions in the Australian coal sector EBITA % margins lower than expected reflecting lower utilisation of project staff and provision for a number of long term debtors Operations Lower revenue as five operating sites managed in 2013 on behalf of clients have been either shut down or transitioned back to owner operation EBITA % margins are in line with expectations Existing contracts currently in renewal discussions - Agnew, Mount Isa, Sonoma Notes 1. This represents revenue of Sedgman together with Sedgman s share of revenues from Joint Ventures 2. Excludes onerous contract rental lease cost, amortisation of intangible assets resulting from prior acquisitions (non-operational) and redundancy costs, however includes IT amortisation. 3
 (7.7) 9.4 EPS (underlying) 2 (cps) (0.0) 8.6 EPS (reported) (cps) (3.4) 4.3 DPS (cps) 4.0 5.0 Net cash 76.5 76.")
4 Financial summary Summary KPI's FY FY ($million) Combined Revenue EBITA (underlying) EBITA % Margin (underlying) 2 1.1% 6.3% NPAT (underlying) 2 (0.0) 18.6 NPAT (reported) (7.7) 9.4 EPS (underlying) 2 (cps) (0.0) 8.6 EPS (reported) (cps) (3.4) 4.3 DPS (cps) Net cash Maintained strong cash position Strong second half result: EBITA (underlying) 1HY ($8.6m) vs 2HY $12.5m Commitment to shareholders with a final dividend of 2 cps Notes 1. This represents revenue of Sedgman together with Sedgman s share of revenues from Joint Ventures. 2. Excludes onerous contract rental lease cost $3.7m pre-tax, amortisation of intangible assets resulting from prior acquisitions (non-operational) $1.1m pre-tax, redundancy costs $1.7m pre-tax, and also for NPAT & EPS (underlying), the write off of tax assets in foreign jurisdictions $3.1m. Includes IT amortisation. 4


5 Safety performance FY2014 safety performance below standard Safety system audited SAI audit review has resulted in the following certifications: OHSAS Occupational Health and Safety Management AS/NZS 4801 Occupational Health and Safety Management ISO Environmental Management ISO 9001 Quality Management This certification demonstrates commitment to: Reduced waste and an increase in efficiency Consistent management of risk, resulting in a reduction of unplanned events Improved monitoring, review and reporting performance Renewed focus on organisational culture to drive improved safety performance 5

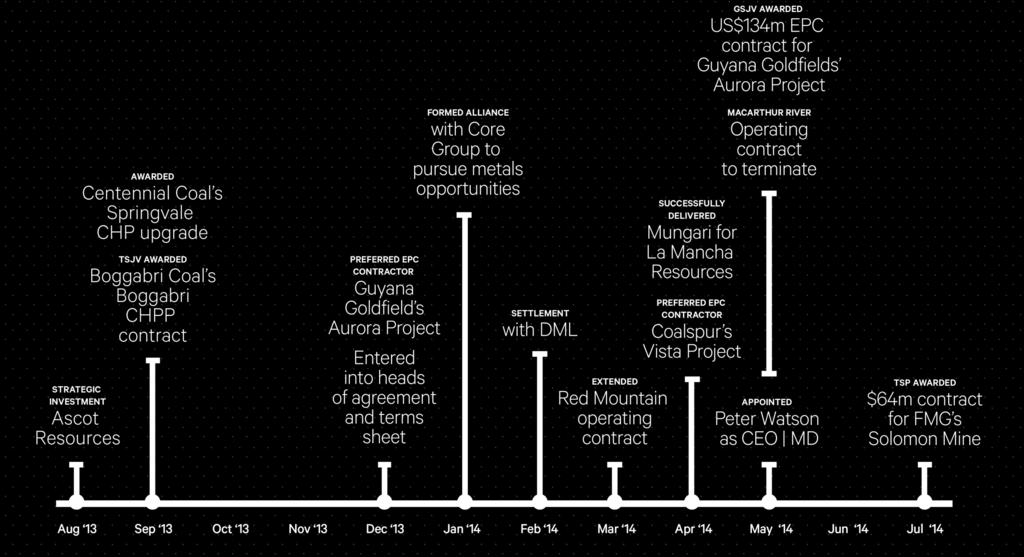
6 Key events 6

7 Strategy 7


8 Responding to market conditions Strength of Create, Build, Operate business model Sector / Services delivery model horizontally across the business well established work share platforms to maximise usability Creating opportunities aligned to Sedgman s strengths in EPC Focused on optimising technical commercialisation Leveraging market leading engineering IP Operations Consulting opportunities Low cost sourcing advantages 8


9 Order book and pipeline Order book at June 2014 totals $385m Up from $350m at June 2013 Projects $104m executable over 12 months Operations $281m contract terms vary between 1 to 9 years Order book replenishment 1 year pipeline as at June 2014 contains projects totalling $1.5 billion. Commodity and geographic splits are shown below: 51% 49% Coal Other Commodities 32% 68% Domestic International Delivering on diversification 9

10 Financial performance
 Amortisation of intangibles 1 (3.1) (5.6) EBIT before equity JV profits (3.5) 14.4 Sedgman share of investments 1.0 (0.0) EBIT after JV profits (2.5) 14.3 Net finance gains / (costs) 0.1 (0.")

11 Income statement Income Statement Summary (Equity Method) FY FY ($million) Revenue EBITDA before equity JV profits Depreciation (13.2) (14.5) Amortisation of intangibles 1 (3.1) (5.6) EBIT before equity JV profits (3.5) 14.4 Sedgman share of investments 1.0 (0.0) EBIT after JV profits (2.5) 14.3 Net finance gains / (costs) 0.1 (0.9) Profit (loss) before tax (2.4) 13.4 Income tax expense (5.3) (4.0) Reported profit (loss) after tax (7.7) 9.4 Notes 1. Represents amortisation of intangible assets resulting from prior acquisitions $1.1m; and amortisation of IT assets $2.0m. 2. Includes write off of tax assets in foreign jurisdictions $3.1m and under provision in prior year $2.0m including non-deductible foreign tax credits and derecognition of deferred tax assets. 11
12 Balance sheet Consolidated Balance Sheet June June ($million) Working Capital Trade & other receivables Net construction work in progress (3.3) (30.7) Inventories Trade & other payables (45.0) (32.6) Net working capital Non-monetary balances Intangibles Property, plant & equipment Deferred taxes (net) Other non-current assets Investments accounted for using the equity method Other liabilities (0.2) (0.3) Net Non-monetary balances Net cash and debt-like items Cash and cash equivalents Debt (21.3) (27.0) Provisions (14.1) (10.9) Current tax refundable (0.0) 3.4 Net cash and debt-like items Net Assets Decrease in net work in progress reflects reduction in Project claims in advance at year-end (Mungari) Increase in payables due to increase in Project progress accruals at year-end (Boggabri) Decrease in property, plant and equipment reflects annual depreciation charges Net Cash $76.5m Decrease in debt due to principal loan repayments and finance lease payments 12
13 Cashflow Summary Cash Flows FY FY ($million) EBITDA Movement in working capital (0.1) 21.0 Net interest 0.2 (0.3) Income tax paid (net) (2.0) (19.0) Net operating cash flow Investment in Joint Venture (1.1) - Acquisition of subsidiary, net of cash acquired - (2.6) Acquisition of other investments (1.3) (0.6) Net repayments of borrowings (5.7) (3.0) Net financing costs - (0.8) Net capital expenditure (2.0) (5.3) Free cash flow Opening cash at 1 July Effect of exchange rates on cash held (1.3) 2.0 Dividend payments (4.9) (15.6) Closing cash Net operating cashflow declined in the period due to lower EBITDA and negative working capital movement partly offset by lower tax payments Lower dividends reflects the lower FY2014 dividends paid of 4.0 cps vs FY cps 13

14 Strength through diversification 14

15 15

16 16
17 Disclaimer The following disclaimer applies to this presentation and any information provided regarding the information contained in this presentation (the Information). You are advised to read this disclaimer carefully before reading or making any other use of this presentation or any information contained in this presentation. Except as required by law, no representation or warranty, express or implied, is made as the fairness, accuracy, completeness, reliability or correctness of the Information, opinions and conclusions, or as to the reasonableness of any assumption contained in this document. By receiving this document and to the extent permitted by law, you release Sedgman, and its officers, employees, agents and associates from any liability (including in respect of direct, indirect or consequential loss or damage or loss or damage arising by negligence) arising as a result of the reliance by you or any other person on anything contained in or omitted from this document. Statements contained in this material, particularly those regarding the possible or assumed future performance, costs, dividends, returns, production levels or rates, prices, reserves, potential growth of Sedgman, industry growth or other trend projections and any estimated company earnings are or may be forward looking statements. Such statements relate to future events and expectations and as such involve known and unknown risks and uncertainties, many of which are outside the control of, and are unknown to, Sedgman and its officers, employees, agents or associates. In particular, factors such as variable climatic conditions and regulatory decisions and processes may cause or may affect the future operating and financial performance of Sedgman. Actual results, performance or achievement may vary materially from any forward looking statements and the assumptions on which those statements are based. The Information also assumes the success of Sedgman s business strategies. The success of the strategies is subject to uncertainties and contingencies beyond Sedgman s control, and no assurance can be given that the anticipated benefits from the strategies will be realized in the periods for which forecasts have been prepared or otherwise. Given these uncertainties, you are cautioned to not place undue reliance on any such forward looking statements. Sedgman undertakes no obligation to revise the forward looking statements included in this presentation to reflect any future events or circumstances. In addition, Sedgman s results are reported under Australian International Financial Reporting Standards, or AIFRS. This presentation includes references to EBITA and NPAT. These references to EBITA and NPAT should not be viewed in isolation or considered as an indication of, or as an alternative to, measures reported in accordance with AIFRS or as an indicator of operating performance or as an alternative to cash flow as a measure of liquidity. The distribution of this Information in jurisdictions outside Australia may be restricted by law and you should observe any such restrictions. This Information does not constitute investment, legal, accounting, regulatory, taxation or other advice and the Information does not take into account your investment objectives or legal, accounting, regulatory, taxation or financial situation or particular needs. You are solely responsible for forming your own opinions and conclusions on such matters and the market and for making your own independent assessment of the Information. You are solely responsible for seeking independent professional advice in relation to the Information and any action taken on the basis of the Information. No responsibility or liability is accepted by Sedgman or any of its officers, employees, agents or associates, nor any other person, for any of the Information or for any action taken by you or any of your officers, employees, agents or associates on the basis of the Information. 17
FY2015. For personal use only. Full Year Results
 2015 For personal use only Full Year Results Create Build Operate Global Minerals Message from the Board & Executive GROUP Group PERFORMANCE Performance Our NPAT for 2015 is a solid performance and testament
For personal use only
 2012 Wilson HTM Rapid Insights Conference Nick Jukes Chief Executive Officer Ian Poole Chief Financial Officer 12 November 2012 Disclaimer 2 The following disclaimer applies to this presentation and any
Half Year Results Presentation March 2011 Tony Caruso CEO & Managing Director Chris Kneipp Financial Controller
 Mastermyne Group Limited FY2011 Half Year Results Presentation March 2011 Tony Caruso CEO & Managing Director Chris Kneipp Financial Controller Disclaimer The following disclaimer applies to this presentation
Capital raising. May Doug Rathbone Managing Director and Chief Executive Officer. Kevin Martin Chief Financial Officer
 May 15 2009 Capital raising Doug Rathbone Managing Director and Chief Executive Officer Kevin Martin Chief Financial Officer Robert Reis Group GM - Corporate Strategy & External Affairs Important information
Vita Group (VTG)! Results Presentation!
! Results Presentation!") Vita Group (VTG) Results Presentation First half FY14 Group highlights Sustained trend of strong profit, dividend growth Underlying EBITDA 1 +18%, underlying NPAT 2 +56%, dividend +66% Areas of strategic
Vita Group (VTG) Results Presentation First half FY14 Group highlights Sustained trend of strong profit, dividend growth Underlying EBITDA 1 +18%, underlying NPAT 2 +56%, dividend +66% Areas of strategic
For personal use only. 30 June 2016 Full Year Results Presentation
 30 June 2016 Full Year Results Presentation 30 August 2016 FY16 Financial Results Highlights Group Revenue A$143.4m Underlying 1 EBITDA A$87.6m Underlying 1 NPAT A$54.4m Operating Cashflow A$48.7m Maiden
Acquisition of European herbicide product portfolio from FMC
 Acquisition of European herbicide product portfolio from FMC 8 November 2017 Important notice and disclaimer This presentation has been prepared by Nufarm Limited ACN 091 2 12 ( Nufarm" or the "Company").
FY17 Results Presentation. Chris Sutherland, Managing Director 24 May 2017
 FY17 Results Presentation Chris Sutherland, Managing Director 24 May 2017 Important notice and disclaimer The information contained in this presentation is for information purposes only and does not constitute
A S X A N N O U N C E M E N T
 A S X A N N O U N C E M E N T DATE: 24 February 2016 Attached is the Presentation regarding Pact s Half year Financial Results for the half year ended 31 December 2015. The Presentation will occur at 10am
Bega Cheese Annual General Meeting. Barry Irvin Executive Chairman Paul van Heerwaarden CEO
 Bega Cheese Annual General Meeting Barry Irvin Executive Chairman Paul van Heerwaarden CEO Agenda 2017 Annual Report Executive Chairman s Report Chief Executive Officer s Report Questions Approval of Remuneration
ASX Media Release WORLEYPARSONS LIMITED (ASX: WOR) FULL YEAR 2017 RESULT
 FULL YEAR 2017 RESULT") 23 August 2017 ASX Media Release WORLEYPARSONS LIMITED (ASX: WOR) FULL YEAR 2017 RESULT Professional services company WorleyParsons Limited today announced a statutory net profit after tax (NPAT) of $33.5
23 August 2017 ASX Media Release WORLEYPARSONS LIMITED (ASX: WOR) FULL YEAR 2017 RESULT Professional services company WorleyParsons Limited today announced a statutory net profit after tax (NPAT) of $33.5
Tabcorp Holdings Limited 2015/16
 Tabcorp Holdings Limited ABN 66 063 780 709 2015/16 Full Year Results Presentation 4 August 2016 Draft version 15 (01-08-13) FY16 overview Statutory results NPAT $169.7m, down 49.3% EPS 20.4 cents per
FINANCIAL RESULTS PRESENTATION H1FY18
 Virtus Health (ASX:VRT) FINANCIAL RESULTS PRESENTATION H1FY18 Tuesday 20 th February, 2018 9.15am AEDT DISCLAIMER The material in this presentation has been prepared by Virtus Health Limited ABN 80 129
For personal use only
 Affinity Education Group Full Year 2014 Results 27 February 2015 2014 Highlights FY 2014 Earnings Growth Underlying EBITDA of $17.9m (1) and underlying NPAT of $11.4m (1) Underlying EPS of 8.1 cents (1)
TOURISM HOLDINGS LTD FY16 INTERIM RESULTS PRESENTATION. 23 February 2016
 TOURISM HOLDINGS LTD FY16 INTERIM RESULTS PRESENTATION 23 February 2016 $M H1 FY16 Highlights Revenue $134M up 20% Earnings before interest and tax* $15.0M up 42% Net profit after tax $8.2M up 45% H1 EBIT
Financial Results for the Full Year Ended 30 June 2012
 Financial Results for the Full Year Ended 30 June 2012 Sims Metal Management Limited ASX Code: SGM NYSE Code: SMS Supplemental Information 23 August 2012 Disclaimer This presentation may contain forward-looking
For personal use only
 DWS Limited 2018 Full Year Results Presentation Contents Introduction Danny Wallis (CEO) / Stuart Whipp (CFO) Results Highlights Full Year Results Capital Management Operations Update Summary and Outlook
Financial Year 1H19 Results
 Financial Year 1H19 Results Investor presentation 20 November 2018 1 Agenda 1. 1H19 Summary 2. 1H19 Financial results 3. FY19 Outlook 4. Q&A 5. Appendix 2 1H19 Summary Skander Malcolm Chief Executive Officer
FY14. Vita Group (VTG) RESULTS PRESENTATION
 RESULTS PRESENTATION") FY14 Vita Group (VTG) RESULTS PRESENTATION GROUP HIGHLIGHTS Strong sustained performance in competitive markets Execution against strategic objectives Continued earnings growth from optimisation program
FY14 Vita Group (VTG) RESULTS PRESENTATION GROUP HIGHLIGHTS Strong sustained performance in competitive markets Execution against strategic objectives Continued earnings growth from optimisation program
Prime Financial Group Ltd (ASX: PFG) Full Year 2018 Results Presentation
 Full Year 2018 Results Presentation") Prime Financial Group Ltd (ASX: PFG) Full Year 2018 Results Presentation 29 August 2018 Click here to access accompanying Full Year 2018 Results Presentation podcast Key Points 1. Exposure to favourable
Prime Financial Group Ltd (ASX: PFG) Full Year 2018 Results Presentation 29 August 2018 Click here to access accompanying Full Year 2018 Results Presentation podcast Key Points 1. Exposure to favourable
STEEL & TUBE HOLDINGS LIMITED. HY18 Interim Results Presentation. For the Six Months to 31 December February 2018
 STEEL & TUBE HOLDINGS LIMITED HY18 Interim Results Presentation For the Six Months to 31 December 2017 23 February 2018 BECOMING A MODERN AND INNOVATIVE COMPANY Providing Strength to New Zealand Steel
FY18 Results Presentation Bravura Solutions Limited. 28 August 2018
 FY18 Results Presentation Bravura Solutions Limited 28 August 2018 Important notice and disclaimer The information contained in this document (including this notice) and discussed at this presentation
Investor Presentation
 Investor Presentation 1 Disclaimer This document has been prepared by Energy One Limited (EOL) and comprises written materials and slides for a presentation concerning EOL. This presentation is for information
ANNUAL GENER AL MEETING 2016
 ANNUAL GENER AL MEETING 2016 16 November 2016 Pact Group Holdings Ltd ABN: 55 145 989 644 R APHAEL GEMINDER CHAIRMAN FINANCIAL HIGHLIGHTS 2016 Sales revenue $1,381.3M NPAT (before sigificant items) 1 Total
For personal use only
 ACN 072 507 147 ASX & MEDIA RELEASE 25 May 2017 THORN FY17 KEY NUMBERS UP, ISSUES BEING ADDRESSED Consumer leasing and business finance company, Thorn Group Limited (ASX: TGA), has lifted revenue, EBIT
Affinity Education Group. Market Update presentation
 Affinity Education Group Market Update presentation 7 July 2015 FY15 Highlights Earnings Guidance Underlying EBITDA forecast for H1 of $7.5m to $8.5m Underlying EBITDA forecast for FY15 of $27m to $32m
For personal use only
 Investor Presentation Half Year Results to 31 December 2016 24 February 2017 PETER CAUGHEY, CEO & MANAGING DIRECTOR 1 Agenda Overview Financials Business conditions, strategy and outlook 2 Overview 1H17
For personal use only
 A S X A N N O U N C E M E N T DATE: 24 August 2016 FY2016 RESULTS PRESENTATION Attached is the Presentation regarding Pact s Financial Results for the year ended 30 June 2016. The Presentation will occur
2011 Interim Results. Keith Gordon, Managing Director & Chief Executive Officer Stephen Gobby, Chief Financial Officer
 2011 Interim Results Keith Gordon, Managing Director & Chief Executive Officer Stephen Gobby, Chief Financial Officer Emeco 2011 Interim Results Overview Financials Strategy & Outlook Questions Appendices
YEAR END RESULTS 31 MARCH Russell Down, Chief Executive Chris Morgan, Group Finance Director
 YEAR END RESULTS 31 MARCH 2018 Russell Down, Chief Executive Chris Morgan, Group Finance Director Customer service strategy improving performance Revenue (excluding disposals) 371.6m 6.4% FY17: 349.1m
QANTM. Full Year Results Presentation. Leon Allen, Managing Director and CEO Martin Cleaver, Chief Financial Officer. 12 months to 30 June 2018
 Full Year Results Presentation 12 months to 30 June 2018 QANTM 29 AUGUST 2018 Leon Allen, Managing Director and CEO Martin Cleaver, Chief Financial Officer Structure 1. 2018 Summary Features 2. Market
Investor Presentation Full Year CY 2017 Results
 Investor Presentation Full Year CY 2017 Results Deven Billimoria Managing Director and CEO Tim Looi Chief Financial Officer 22 February 2018 PAGE 0 Smartgroup has had another successful year... 1 2 3 4
QANTM. Half Year Results Presentation. Leon Allen, Managing Director and CEO Martin Cleaver, Chief Financial Officer. Six months to 31 December 2017
 Half Year Results Presentation Six months to 31 December 2017 QANTM 22 FEBRUARY 2018 Leon Allen, Managing Director and CEO Martin Cleaver, Chief Financial Officer Disclaimer This presentation has been
Full Year 2017 Results Presentation Bravura Solutions Limited
 Full Year 2017 Results Presentation Bravura Solutions Limited 23 rd August 2017 Important notice and disclaimer The information contained in this document (including this notice) or discussed at this presentation
30 June 2015 Full Year Results Presentation August 2015
 30 June 2015 Full Year Results Presentation August 2015 FY15 Results Significant restructuring and capital management to support profit recovery in FY16. Statutory EBIT loss of $33.2m Statutory NPAT loss
Interim FY 2015 results 6 months ended 31 December February 2015
 Interim FY 2015 results 31 December 2014 18 February 2015 Highlights Solid trading result for 1H FY2015; change in accounting policy for acquisition of healthcare practices First half result highlights
Interim Results Half year ended 31 December 2013
 Interim Results Half year ended 31 December 2013 Galdino Claro, Group Chief Executive Officer Rob Larry, Group Chief Financial Officer 14 February 2014 Disclaimer Cautionary Statements Regarding Forward-Looking
BROKER PRESENTATION JUNE 2017
 PACIFIC ENERGY LIMITED ASX : PEA BROKER PRESENTATION JUNE 2017 Important Notice and Disclaimer This presentation has been prepared by (PEA) for information purposes only. This presentation is not a product
2017 FULL YEAR RESULTS
 2017 FULL YEAR RESULTS ESTABLISHING LEADING POSITIONS IN NEW GROWTH SECTORS Malcolm Bundey Managing Director and CEO Richard Betts Chief Financial Officer 16 August 2017 Pact Group Holdings Ltd ABN: 55
HALF YEAR RESULTS 19 FEBRUARY 2016
 HALF YEAR RESULTS 19 FEBRUARY 2016 Overview Market conditions remain challenging - operating environment likely to remain subdued over the near term due to ongoing pressure on commodity prices Continued
First full 12 months EBITDA contribution from PIPE Networks of $57.2m. Strong organic EBITDA growth across all core continuing business operations
 FY11 Financial Highlights FY11 EBITDA of $234.0m; 37% growth on prior year First full 12 months EBITDA contribution from PIPE Networks of $57.2m Strong organic EBITDA growth across all core continuing
Prime Financial Group Ltd (ASX: PFG) Half Year 2018 Results Presentation. 28 February 2018
 Half Year 2018 Results Presentation. 28 February 2018") Prime Financial Group Ltd (ASX: PFG) Half Year 2018 Results Presentation 28 February 2018 2 Overview H1 2018 Key Highlights 1. Strong revenue growth revenue increased 25% compared to H1 2017 driven by
Prime Financial Group Ltd (ASX: PFG) Half Year 2018 Results Presentation 28 February 2018 2 Overview H1 2018 Key Highlights 1. Strong revenue growth revenue increased 25% compared to H1 2017 driven by
 ASX ANNOUNCEMENT DATE: 22 February 2017 Attached is the Presentation regarding Pact s Half year Financial Results for the half year ended 31 December 2016. The Presentation will occur at 10am (Melbourne
Boom Logistics Limited. Half Year Results Presentation. 25 February Boom Logistics Limited. Half Year Results Presentation.
 Boom Logistics Limited Half Year Results Presentation 25 February 2011 Boom Logistics Limited Half Year Results Presentation 25 February 2011 Summary $5.1m trading NPAT for 1H11, up $4.6m from prior corresponding
2015 Annual General Meeting. October2015
 2015 Annual General Meeting October2015 FY15 Results Significant restructuring and capital management to support profit recovery in FY16. Statutory EBIT loss of $33.2m Statutory NPAT loss of $36.9m Trading
INVESTOR PRESENTATION SG FLEET GROUP LIMITED - FY2016 RESULTS
 INVESTOR PRESENTATION SG FLEET GROUP LIMITED - FY2016 RESULTS 16 August 2016 Important Notice and Disclaimer IMPORTANT INFORMATION The information in this presentation is general in nature and does not
AUB GROUP LTD FULL YEAR RESULTS FOR THE PERIOD ENDED 30 JUNE 2018 (FY18) 27 AUGUST 2018
 27 AUGUST 2018") AUB GROUP LTD FULL YEAR RESULTS FOR THE PERIOD ENDED 30 JUNE 2018 (FY18) 27 AUGUST 2018 NOTICE SUMMARY INFORMATION This document has been prepared by AUB Group Limited(ABN 60 000 000 715)(AUB). It is a
AUB GROUP LTD FULL YEAR RESULTS FOR THE PERIOD ENDED 30 JUNE 2018 (FY18) 27 AUGUST 2018 NOTICE SUMMARY INFORMATION This document has been prepared by AUB Group Limited(ABN 60 000 000 715)(AUB). It is a
FY Alliance Aviation Services Limited Results Presentation. August 2018
 FY 2018 Alliance Aviation Services Limited Results Presentation August 2018 Key Messages Alliance Aviation Services Limited announces a full year result which includes: $ 26.1m A strong financial performance
For personal use only. FY17 H1 Results. John Croll - Chief Executive Officer Nimesh Shah - Chief Financial Officer 22 February 2017
 FY17 H1 Results John Croll - Chief Executive Officer Nimesh Shah - Chief Financial Officer 22 February 2017 Agenda Overview of FY17 H1 Results and Business Performance Strategy Update FY17 H1 Financial
Transpacific FY15 Half Year Results Presentation
 Transpacific FY15 Half Year Results Presentation Robert Boucher CEO Brendan Gill CFO 20 February 2015 - Disclaimer Forward looking statements - This presentation contains certain forward-looking statements,
FY18 1 ST HALF RESULTS
 26 FEBRUARY 2018 FY18 1 ST HALF RESULTS Chief Executive Officer : Chief Financial Officer : John Croll James Orlando isentia.com AGENDA Overview of H1 FY18 Results Strategic Focus H1 FY18 Financial Performance
AUB GROUP LTD FULL YEAR RESULTS
 AUB GROUP LTD FULL YEAR RESULTS FOR THE PERIOD ENDED 30 JUNE 207 (FY7) 28 TH AUGUST 207 Page - AUB Group Ltd FY7 Results NOTICE SUMMARY INFORMATION This document has been prepared by AUB Group Limited
PMP LIMITED. For personal use only INVESTOR PRESENTATION. Results for the 12 months ended 30 June th August 2015
 PMP LIMITED ABN 39 050 148 644 Results for the 12 months ended 30 June 2015 25 th August 2015 Peter George, CEO Geoff Stephenson, CFO INVESTOR PRESENTATION 2015 FULL YEAR RESULTS Contents Pages FY15 Highlights
CY2017 RESULTS PRESENTATION 19 FEBRUARY 2018
 CY2017 RESULTS PRESENTATION 19 FEBRUARY 2018 HIGHLIGHTS REVENUE GROWING FASTER THAN MARKET WITH MARGIN EXPANSION REVENUE UNDERLYING 1 NPATA 2 13.1% 13.1% 22.5% 22.5% Revenue $380.3m 13.1% NPAT 2 $33.1m
PMP LIMITED. For personal use only INVESTOR PRESENTATION. Results for the 6 months ended 31 December February 2016
 PMP LIMITED ABN 39 050 148 644 Results for the 6 months ended 31 December 2015 22 February 2016 Peter George, CEO Geoff Stephenson, CFO INVESTOR PRESENTATION 2016 HALF YEAR RESULTS Contents Pages H1 FY16
For personal use only
 DWS Limited 2017 Half Year Results Presentation Contents Introduction Danny Wallis (CEO) / Stuart Whipp (CFO) Results Highlights Half Year Results Summary Review Capital Management Operations Update Summary
For personal use only
 Preliminary Final Report Appendix 4E Results for announcement to the market Pulse Health Limited (ACN 104 113 760) This Preliminary Final Report is provided to the Australian Securities Exchange (ASX)
Photo by James Ball - Coffey International Limited FY2013 Half Year Results Presentation. 11 February 2013
 Photo by James Ball - www.dlscape.com Coffey International Limited FY2013 Half Year Results Presentation 11 February 2013 Agenda Financial Performance Business Performance Outlook Presenters John Douglas
OneVue Holdings Limited (OVH)
") OneVue Holdings Limited (OVH) FY 2017 results presentation 28 August 2017 Regulators, fund managers and investors are calling for greater transparency of platform costs and revenue drivers Platform differentiation
OneVue Holdings Limited (OVH) FY 2017 results presentation 28 August 2017 Regulators, fund managers and investors are calling for greater transparency of platform costs and revenue drivers Platform differentiation
Bega Cheese Annual General Meeting
 Bega Cheese Annual General Meeting Barry Irvin Executive Chairman Aidan Coleman CEO Agenda 2016 Annual Report Executive Chairman s Report Chief Executive Officer s Report Questions Approval of Remuneration
For personal use only
 Macquarie Conference Presentation 8 May 2015 Geoff Horth, CEO Presentation Content Organic Growth Driving Results Acquisition of Call Plus Group Outlook 2 Organic Growth! Driving Results! The Numbers Financial
OneVue Holdings Limited (OVH)
") OneVue Holdings Limited (OVH) H1 FY 2018 results presentation 26 February 2018 1 HIGHLIGHTS 2 FINANCIALS 3 OUTLOOK 4 APPENDICES Page 2 1 HIGHLIGHTS . BENEFITTING FROM SECTORAL GROWTH AND STRUCTURAL DISRUPTION
OneVue Holdings Limited (OVH) H1 FY 2018 results presentation 26 February 2018 1 HIGHLIGHTS 2 FINANCIALS 3 OUTLOOK 4 APPENDICES Page 2 1 HIGHLIGHTS . BENEFITTING FROM SECTORAL GROWTH AND STRUCTURAL DISRUPTION
For personal use only
 Financial Results Half year ended 31 December 2016 15 February 2017 Agenda Results Overview Galdino Claro, Group CEO Financial Results Fred Knechtel, Group CFO Strategic Progress & Outlook Galdino Claro,
For personal use only Security without compromise
 Security without compromise Investor Presentation M o n i t o r e d S e c u r i t y S y s t e m s C C T V a n d A c c e s s C o n t r o l C o r p o r a t e R i s k C o n s u l t a n c y S e c u r i t y
QANTM. Full Year Results Presentation. Leon Allen, Managing Director and CEO Martin Cleaver, Chief Financial Officer. 12 months to 30 June 2017
 Full Year Results Presentation 12 months to 30 June 2017 QANTM 30 AUGUST 2017 Leon Allen, Managing Director and CEO Martin Cleaver, Chief Financial Officer Disclaimer This presentation has been prepared
PMP LIMITED INVESTOR PRESENTATION. Results for the 12 months ended 30 June August Peter George, CEO Geoff Stephenson, CFO
 PMP LIMITED ABN 39 050 148 644 Results for the 12 months ended 30 June 2016 29 August 2016 Peter George, CEO Geoff Stephenson, CFO INVESTOR PRESENTATION 2016 FULL YEAR RESULTS Contents Pages FY16 Highlights
For personal use only
 Communities Group Investment in Manufactured Home Estates 15 February 2013 Executive summary > Communities announces its acquisition of The Grange Village, a seniors lifestyle community in Morisset, NSW.
For personal use only. Appen Limited. Global Leader in Language Technology Solutions. FY2014 Results Presentation
 Appen Limited Global Leader in Language Technology Solutions FY2014 Results Presentation Agenda Topic: Introduction to Appen Financial Performance Growth and Outlook People and Leadership Speaker: Chris
For personal use only. JB Hi-Fi Limited. HY18 Results Presentation
 JB Hi-Fi Limited HY8 Results Presentation 5 FEBRUARY AUGUST 06 08 PAGE Agenda. Group Performance Overview. JB HI-FI 3. The Good Guys 4. Group Balance Sheet and Cash Flow 5. Outlook Richard Murray Group
FY17 RESULTS. Tuesday 20 February 2018
 FY17 RESULTS Tuesday 20 February 2018 Agenda 2017 Highlights Results 2018 Observations Out-of-Home industry APN Outdoor Contract renewals Focus and objectives Trading update 2 2017 Highlights 3 2017 highlights
FY18 RESULTS PRESENTATION Vita Group Limited (VTG)
") FY18 RESULTS PRESENTATION Vita Group Limited (VTG) FY18 Headlines ICT Vita Group s Own Brands Capital Management Solid result, despite challenging industry conditions Comfortably within previous guidance
FY18 RESULTS PRESENTATION Vita Group Limited (VTG) FY18 Headlines ICT Vita Group s Own Brands Capital Management Solid result, despite challenging industry conditions Comfortably within previous guidance
FINANCIAL RESULTS PRESENTATION FY2018
 Virtus Health (ASX:VRT) FINANCIAL RESULTS PRESENTATION FY2018 Tuesday 21 August, 2018 AEST DISCLAIMER The material in this presentation has been prepared by Virtus Health Limited ABN 80 129 643 492 ( Virtus
For personal use only
 INGENIA COMMUNITIES GROUP 2018 Annual General Meeting 13 NOVEMBER 2018 Meeting outline 2 Chairman s welcome NON-EXECUTIVE DIRECTORS CHAIRMAN Jim Hazel DEPUTY CHAIRMAN Rob Morrison DIRECTOR Amanda Heyworth
Investor Presentation Full Year 2017 Results Presentation August 2017
 Investor Presentation Full Year 2017 Results Presentation August 2017 Leading Managed Telco, IT and Cloud provider to SMEs, corporates and consumer brands across Australia. We invest in our people, products
Financial Results Full year ended 30 June Geoffrey N. Brunsdon, Chairman Rob Larry, Group Chief Financial Officer 23 August 2013
 Financial Results Full year ended 30 June 2013 Geoffrey N. Brunsdon, Chairman Rob Larry, Group Chief Financial Officer 23 August 2013 Disclaimer Cautionary Statements Regarding Forward-Looking Information
Acquisition of NewSat s Teleport & Satellite Services business 10 July 2015
 Acquisition of NewSat s Teleport & Satellite Services business 10 July 2015 Disclaimer This presentation has been prepared by SpeedCast International Limited ("SpeedCast"). By accessing or attending this
For personal use only
 FY14 RESULTS John Croll Chief Executive Officer Nimesh Shah Chief Financial Officer AGENDA OVERVIEW OF FY14 RESULT FINANCIAL PERFORMANCE FY15 OUTLOOK GROWTH STRATEGY Q&A JOHN CROLL NIMESH SHAH JOHN CROLL
2018 Full Year Results 20 November 2018
 2018 Full Year Results 20 November 2018 Disclaimer Certain information included in the following presentation is forward looking and involves risks, assumptions and uncertainties that could cause actual
FY2013 Results Presentation By Chris Sutherland, Managing Director 29 May 2013
 FY2013 Results Presentation By Chris Sutherland, Managing Director 29 May 2013 Important notice and disclaimer The information contained in this presentation is for information purposes p only and does
2014 Full Year Results Presentation
 2014 Full Year Results Presentation Mark Dixon, Chief Executive Officer Dominique Yates, Chief Financial Officer 3 March 2015 1 Caution statement No representations or warranties, express or implied are
HALF YEAR RESULTS. For the half year ended 31 December 2016
 HALF YEAR RESULTS For the half year ended 31 December 2016 Company profile Navitas (ASX: NVT) is a leading global education provider with over 120 colleges and campuses across 31 countries offering an
Investor Presentation
 Investor Presentation Full Year Results FY2018 Raj Naran, Managing Director and CEO, ALS Limited 28 May 2018 www.alsglobal.com IMPORTANT NOTICE AND DISCLAIMER This presentation has been prepared by ALS
Litigation Capital Management Limited 2018 Half Year Results Presentation Investor Roadshow
 Litigation Capital Management Limited 2018 Half Year Results Presentation Investor Roadshow 19 March 2018 Patrick Moloney Chief Executive Officer Important information No recommendation, offer, invitation
Q3 FY2010 Financial Highlights
 Disclaimer The information in this document has not been independently verified and no representation or warranty, express or implied, is made as to, and no reliance should be placed on, the fairness,
METCASH. FY16 Half Year Results - 30 November 2015
 METCASH FY16 Half Year Results - 30 November 2015 GROUP UPDATE IAN MORRICE GROUP CHIEF EXECUTIVE OFFICER Group update positive momentum continues Group revenue up 1.4% to $6.6b MF&G revenue up 0.7%, continued
Investor Briefing RIGHT S O L U T I O N S RIGHT PARTNER. Singapore & United Kingdom April Greg Kilmister - CEO
 Investor Briefing Singapore & United Kingdom April 2013 Greg Kilmister - CEO RIGHT S O L U T I O N S RIGHT PARTNER IMPORTANT NOTICE AND DISCLAIMER This presentation has been prepared by ALS Limited, (ALS
INTERIM RESULTS PRESENTATION SIX MONTHS TO 30 JUNE 2018
 INTERIM RESULTS PRESENTATION SIX MONTHS TO 30 JUNE 2018 DISCLAIMER The information contained in this presentation has not been independently verified and this presentation contains various forward-looking
LYNAS CORPORATION H Results 5 March 2018
 LYNAS CORPORATION H1 218 Results 5 March 218 1 Disclaimer This Presentation has been prepared by Lynas Corporation Limited (ABN 27 9 66 648) (Lynas or the Company) This Presentation contains summary information
RESULTS FOR THE 12 MONTHS ENDED 30 JUNE AUGUST Runge - A global leader in mining information technology
 RESULTS FOR THE 12 MONTHS ENDED 30 JUNE 2008 22 AUGUST 2008 Runge - A global leader in mining information technology Contents Section 1 Description Overview Tony Kinnane 2 Financial Results Julia Sloman
FY12 Results 22 May 2012
 FY12 Results 22 May 2012 DISCLAIMER --- Important Notice This presentation has been prepared by Thorn Group Limited (Thorn). This presentation is not a financial product or investment advice or recommendation,
Macquarie Australia Conference. Tarun Gupta, Group Chief Financial Officer Lendlease
 Macquarie Australia Conference Tarun Gupta, Group Chief Financial Officer Lendlease 2 Indigenous engagement and reconciliation Lendlease s vision for Reconciliation is one in which all our employees acknowledge
Middlemount Coal Contract and Capital Raising Presentation 14 April 2011
 Middlemount Coal Contract and Capital Raising Presentation 14 April 2011 **Not for distribution or release in the United States or to US Persons** Disclaimer and important notice This investor presentation
COLLINS FOODS LIMITED
 COLLINS FOODS LIMITED FULL YEAR RESULTS 26 June 2017 ACN 151 420 781 : strong growth across key financial metrics $m FY16 Underlying [1] Statutory Significant Items [2] Underlying Change vs FY16 Underlying
INVESTOR PRESENTATION
 INVESTOR PRESENTATION Results for the 6 months ended 31 December 2017 Kevin Slaven CEO Geoff Stephenson CFO www.pmplimited.com.au ABN 39 050 148 644 27 February 2018 TABLE OF CONTENTS Financial Highlights
For personal use only
 Affinity Education Group (ASX:AFJ) Morgans Conference 10 October 2014 Disclaimer This presentation contains general information in summary form which is current as at 10 October 2014. It presents financial
Boom Logistics Limited ASX:BOL
 Brenden Mitchell Managing Director and Chief Executive Officer Tim Rogers Chief Financial Officer Tony Spassopoulos Chief Operating Officer Boom Logistics Limited ASX:BOL August 2018 Disclaimer This presentation
Affinity Education Group. Half Year Results
 Affinity Education Group Half Year Results 29 August 2014 Disclaimer This presentation contains general information in summary form which is current as at 29 August 2014. It presents financial information
For personal use only
 23 August 2013 Full Year Results June 2013 We attach an Investor Presentation for the FY13 Full Year Results. As previously announced, a results briefing for analysts will be held at 10:30am Sydney time
Miclyn Express Offshore
 Miclyn Express Offshore FY13 Results Presentation 26 August, 2013 Live Webcast Details Presenter: Diederik de Boer, CEO Date: 26 August, 2013 Time: 11:00am AEST Access: http://www.brrmedia.com/event/114725
Investor & Analyst Presentation Ful YearResults 30 June2016 For personal use only 25th August 2016 Rebekah O Flaherty - CEO I Jonathan Kenny - CFO
 Investor & Analyst Presentation Full YearResults 30 June2016 25th August 2016 Rebekah O Flaherty - CEO I Jonathan Kenny - CFO Agenda 1 Overview 2 Strategic Priorities 3 FY16 Financial Results 4 FY17 Outlook