For personal use only. Mantra Group. FY2015 Results Presentation 27 August 2015
|
|
|
- Henry Lucas
- 5 years ago
- Views:
Transcription

1 Mantra Group FY2015 Results Presentation 27 August 2015
2 IMPORTANT NOTICE AND DISCLAIMER Important notice and disclaimer This document is a presentation of general background information about the activities of Mantra Group Limited (Mantra Group) current at the date of the presentation, (27 August 2015). The information contained in this presentation is of general background and does not purport to be complete. It is not intended to be relied upon as advice to investors or potential investors and does not take into account the investment objectives, financial situation or needs of any particular investor. These should be considered, with or without professional advice, when deciding if an investment is appropriate. Mantra, its related bodies corporate and any of their respective officers, directors and employees (Mantra Parties), do not warrant the accuracy or reliability of this information, and disclaim any responsibility and liability flowing from the use of this information by any party. To the maximum extent permitted by law, the Mantra Parties do not accept any liability to any person, organisation or entity for any loss or damage suffered as a result of reliance on this document. Forward looking statements This document contains certain forward looking statements and comments about future events, including Mantra s expectations about the performance of its businesses. Forward looking statements can generally be identified by the use of forward looking words such as, expect, anticipate, likely, intend, should, could, may, predict, plan, propose, will, believe, forecast, estimate, target and other similar expressions within the meaning of securities laws of applicable jurisdictions. Indications of, and guidance on, future earnings or financial position or performance are also forward looking statements. Forward looking statements involve inherent risks and uncertainties, both general and specific, and there is a risk that such predictions, forecasts, projections and other forward looking statements will not be achieved. Forward looking statements are provided as a general guide only, and should not be relied on as an indication or guarantee of future performance. Forward looking statements involve known and unknown risks, uncertainty and other factors which can cause Mantra s actual results to differ materially from the plans, objectives, expectations, estimates and intentions expressed in such forward looking statements and many of these factors are outside the control of Mantra. As such, undue reliance should not be placed on any forward looking statement. Past performance is not necessarily a guide to future performance and no representation or warranty is made by any person as to the likelihood of achievement or reasonableness of any forward looking statements, forecast financial information or other forecast. Nothing contained in this presentation nor any information made available to you is, or shall be relied upon as, a promise, representation, warranty or guarantee as to the past, present or the future performance of Mantra. Non-IFRS financial information Mantra uses certain measures to manage and report on its business that are not recognised under Australian Accounting Standards. These measures are referred to as non- IFRS financial information. Mantra considers that this non-ifrs financial information is important to assist in evaluating Mantra s performance. The information is presented to assist in making appropriate comparisons with current periods and to assess the operating performance of the business. All non-ifrs financial information is reconciled to IFRS financial information. All dollar values are in Australian dollars (A$) unless otherwise stated. 2


3 CONTENTS 1 HIGHLIGHTS 4 2 MANTRA GROUP S BUSINESS 8 3 FINANCIAL PERFORMANCE 12 4 GROWTH AND OUTLOOK 22 5 APPENDIX 39 3

4 Highlights Soul Surfers Paradise, Gold Coast
5 HIGHLIGHTS 5
6 HIGHLIGHTS 6

 cents per share for FY2014. NPATA basic EPS of 15.3 cents per share, compared to NPATA basic EPS of 1.9 cents per share for FY2014.")
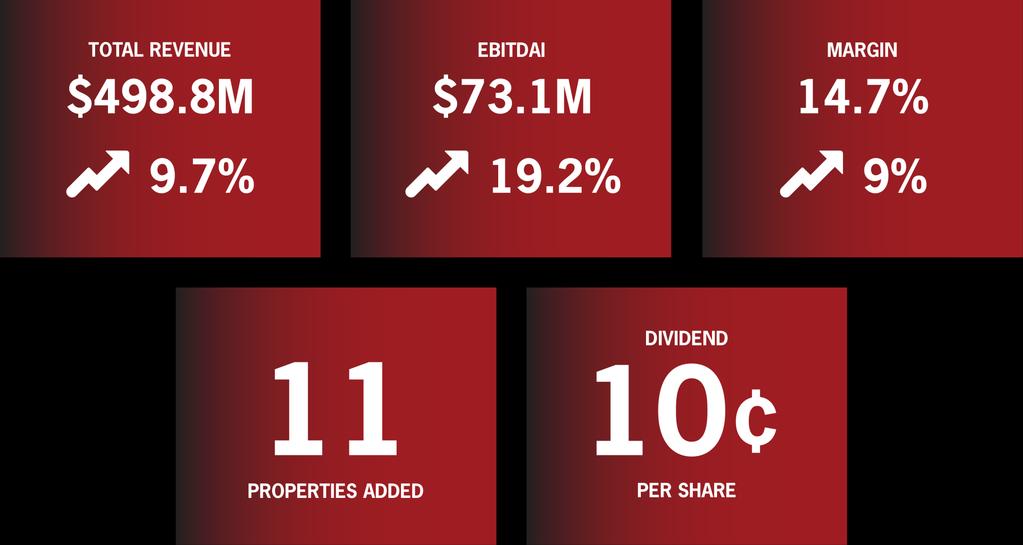
7 HIGHLIGHTS FY2015 results exceeded 2015 full year Prospectus forecast and are at the top end of May 2015 market guidance statement Total revenue of $498.8m, up 9.7% on FY2014. NPAT was $36.2m, up $36.5m on FY2014. NPATA was $38.9m, up $36.5m on FY2014. EBITDAI of $73.1m, up 19.2% on FY2014. EBITDAI margin also up from 13.5% to 14.7% for FY2015. Total revenue, NPAT, NPATA and EBITDAI were all ahead of 2015 prospectus forecasts of $490.9m, $32.6m, $35.3m and $69.5m respectively. Basic EPS of 14.2 cents per share, compared to basic EPS of (0.3) cents per share for FY2014. NPATA basic EPS of 15.3 cents per share, compared to NPATA basic EPS of 1.9 cents per share for FY2014. Final dividend of 5 cents per share fully franked to be paid on 6 October 2015, bringing total dividend for the year to 10 cents per share. Record date for final dividend is 3 September Eleven properties added in FY15 and five further properties added in July 2015 including the four ex-outrigger properties. Soul successfully transitioned to an MLR property on 1 July


8 Section Mantra Group s Heading business Here Mantra Circle on Cavill, Gold Coast


9 OVERVIEW Mantra Group is a leading accommodation operator in Australia, attracting approximately 2 million guests per annum Statement Second largest accommodation operator in Australia. Diversified exposure to both business and leisure markets. Establishments range from luxury retreats and coastal 29 properties resorts to serviced apartments in CBD and key leisure destinations. Well established platform for future growth. 65 properties Notes: 1. Properties and rooms data includes existing properties and rooms as at 30 June Total number of guests per annum is determined by multiplying the consolidated number of rooms sold by the total number of guests per room on an annual basis, divided by the average length of stay, which is a standard industry measure of total guests per annum 25 properties 9

10 MANTRA GROUP LOCATIONS Mantra Group benefits from widespread geographic presence in the Australian accommodation market Statement Notes: 1 Map is not to scale 10
11 BUSINESS SEGMENTS Mantra Group generates revenues across three strategic business segments Statement CBD Resorts Central Revenue and Distribution (CRD) Segment description Operates accommodation properties in capital cities throughout Australia targeted towards corporate travellers Operates leisure retreats and resorts throughout Australia and New Zealand, predominantly in attractive Queensland and regional locations Focused on expanding further into key leisure markets Manages Mantra Group's inhouse customer management, online booking services and digital marketing platforms Includes Management Agreements and Marketing Service Agreements Also includes refurbishment revenue Key features Generally experiences relatively stable occupancy throughout economic cycles Benefits from cyclical upside in certain industry sectors Higher margin Benefits from cyclical upside in the tourism sector as economic activity increases Operating structures Primarily leases Primarily Management Letting Rights Management Agreements and Marketing Services Agreements $272m 55% $182m 37% $42m 8% Segment FY2015 revenue 1 1. Corporate segment revenue amounted to $2.7m of revenue for the period 11

12 Financial Performance Mantra on Russell, Melbourne
13 YEAR ON YEAR RESULTS OVERVIEW FY2015 ($m) FY2014 ($m) Change ($m) Change (%) Operating Revenue Other income n/c Total operating expenses (425.7) (393.4) EBITDAI Impairment (net reversal) (1.1) (100) Depreciation (8.6) (8.2) Amortisation (excluding amortisation of lease rights) (5.9) (5.5) EBITA Amortisation of lease rights (3.8) (3.8) - - EBIT Net finance costs (3.9) (45.3) (41.4) (91.4) Profit before tax 50.9 (0.4) 51.3 n/c Tax (expense) / credit (14.7) n/c NPAT 36.2 (0.3) 36.5 n/c COMMENTS Business has performed strongly in FY2015. Revenue, EBITDAI, NPAT and NPATA all performing ahead of the same period last year and ahead of prospectus forecast Operating revenue increased by 9.7% to $498.6m in FY2015 from $454.7m in FY2014 EBITDAI increased by $11.8m or 19.2% in FY2015 from $61.3m in FY2014. EBITDAI margin increased from 13.5% to 14.7% for the year. Strong revenue growth driven principally by property acquisitions in the CBD segment as well as strong performance by CRD. Strong growth in EBITDAI driven principally from organic growth and margin expansion in the portfolio. Eleven new properties were added in FY2015. Like for like increase in revenue and EBITDAI was $15.5m and $8.2m respectively. NPATA n/c 1. EBITDAI Earnings Before Interest, Taxation, Depreciation, Amortisation and Impairment 13
14 REVENUE AND EBITDAI BY SEGMENT Operating Revenue FY2015 ($m) FY2014 ($m) Change ($m) Change (%) CBD Resorts Central Revenue and Distribution Corporate (1.6) (37.2) Total EBITDAI 1. FY2015 ($m) FY2014 ($m) Change ($m) Change (%) CBD Resorts Central Revenue and Distribution COMMENTS Strong CBD revenue growth of $36.1m or 15.3% to $272.3m compared to FY2014 revenue Like for like revenue growth of $8.4m (3.6%), with new properties contributing $27.7m to revenue in the period. Solid Resorts revenue growth of 2.5% to $181.8m compared to FY2014 revenue. Resorts EBITDAI of $23.5m is 4.0% or $0.9m ahead of FY2014 EBITDAI. CRD segment results were driven by an increase in revenue from higher booking volumes through central channels and increased management fees from new properties under management. A saving in costs associated with last year s IPO benefited the results of the Corporate segment. Corporate (27.6) (29.5) Total EBITDAI Earnings Before Interest, Taxation, Depreciation, Amortisation and Impairment 14
15 CBD SEGMENT - HIGHLIGHTS CBD revenue increased by $36.1m, from $236.2m FY14 result to $272.3m, an increase of 15.3% Statement Total rooms available increased by 12.7%. Increase predominately came from new properties. New properties include Peppers Gallery Hotel, Canberra, Mantra Midtown and Mantra on Edward in Brisbane and Mantra Collins and Mantra Charles, Tasmania. Occupancy increased by 0.4% as business sentiment improved and events such as the Cricket World Cup, Asian Champions League and city wide conferences increased demand in Melbourne, Adelaide, Darwin and Brisbane. Average room rate increased by 1.0%. Constrained demand in Darwin and city wide conferences in Melbourne and Brisbane were the key drivers. FY2015 Actual FY2014 Actual FY Change FY Change (%) Total rooms available ( 000) 1,629 1, Paid rooms sold ( 000) 1,376 1, Occupancy (%) Average room rate ($) RevPAR ($)
16 RESORT SEGMENT - HIGHLIGHTS Resorts revenue increased by $4.5m, from $177.3m to $181.8m, an increase of 2.5% Statement Occupancy increased by 3.9% from 65.6% to 69.5% as a result of consistent leisure demand across all key regions during the year as a result of: Increased capacity from low cost carriers into Queensland Increased demand for Australian holidays from domestic travellers Strong profitable group/events business RevPAR was higher by 5.9% as a result of strong demand in key leisure destinations despite no change to the average room rates compared to FY2014. FY2015 Actual FY2014 Actual FY Change FY Change (%) Total rooms available ( 000) 1,906 1,922 (16) (0.8) Paid rooms sold ( 000) 1,325 1, Occupancy (%) Average room rate ($) (0.07) - RevPAR ($)


17 CRD SEGMENT CRD revenue increased by $4.9m, from $36.9m to $41.8m, an increase of 13.3% Statement CRD EBITDAI of $29.9m exceeded last year by $4.6m. Management fees grew from new properties under management. There were six managed properties added during the year; namely Mantra Terrace Hotel, Brisbane, BreakFree on Clarence, Sydney, Mantra and BreakFree Bell City, Melbourne, BreakFree on Cashel, Christchurch and Mantra Sakala, Bali. Other growth resulted from the continued consumer trend to book through centralised channels. 17


18 FY2015 NEW PROPERTIES Eleven new properties added in FY2015 Statement Mantra Midtown, Brisbane Mantra Terrace, Brisbane Peppers Gallery, Canberra BreakFree on Clarence, Sydney Mantra on Edward, Brisbane BreakFree on Cashel, Christchurch 18


19 FY2015 NEW PROPERTIES Eleven new properties added in FY2015 Statement Mantra Bell City, Melbourne BreakFree Bell City, Melbourne Mantra Sakala, Nusa Dua Mantra Charles Hotel, Launceston Mantra Collins Hotel, Hobart 19
20 STATUTORY CASH FLOW Cash flows from operating activities FY2015 Actual ($m) FY2014 Actual ($m) Change ($m) Receipts from customers Payments to suppliers (469.7) (426.4) (43.3) Net interest and tax payments (12.5) (44.0) 31.5 Net cash inflow from operating activities Net cash (outflow) from investing activities Net cash inflow from financing activities (44.7) (29.2) (15.5) COMMENTS Cashflow for the Group for FY15 continued to be strong. Operating cash inflows increased by $33.7m to $59.1m in FY15 as a result of both a reduction in interest payments under the new loan agreements entered into in June 2014 and strong trading results. Net cash outflow from investing activities has increased from $29.2m to $44.7m, an increase of $15.5m. This has resulted from the acquisition of eleven properties in FY15 (FY14: eight). Net cash inflow from financing activities has increased by $31.7m to $38.9m. This increase was principally as a result of the issue of securities completed in March and April The funds have been used to purchase further properties. Net increase in cash and cash equivalents
21 BALANCE SHEET AND CREDIT METRICS Statutory balance sheet 30 Jun-15 Actual ($m) Cash and cash equivalents 85.1 Other current assets 49.1 Current assets PPE Intangible assets Other non-current assets 2.7 Total non-current assets Total assets Trade and other payables 44.3 Other 45.1 Total current liabilities 89.4 Borrowings Other non-current liabilities 69.2 Total non-current liabilities Total liabilities Net assets COMMENTS Very strong balance sheet and cash position. Cash position high at 30 June in anticipation of the settlement of the acquisition of the Outrigger and Soul transactions on 1 July Excluding the cash required to fund these transactions, the cash balance would have been approximately $30.9m. Well within debt covenants under banking facilities. Strong balance sheet leaves the Group in a good position to take advantage of growth opportunities, which may include hotel acquisitions. Credit metrics Adjusted* Borrowings ($m) Cash and cash equivalents ($m) Net total indebtedness ($m) Net debt /FY2015 LTM EBITDA 0.3x 1.0x FY2015 LTM EBITDA/LTM Net finance cost 18.7x 18.7x Cash balance adjusted for cash draw downs completed for post balance date acquisitions 21

22 Growth and outlook Peppers Cradle Mountain Lodge, Cradle Mountain


23 FY16 OUTLOOK Mantra Group expects FY16 EBITDA, NPAT and NPATA to be between $84m - $87m, $40m - $42m and $42.5m - $45m respectively: Growth expected across the CBD, Resorts and CRD segments. Expectations for 2016 excludes: Impact of any additional conditional or uncontracted properties as at reporting date Any transaction costs associated with FY2016 acquisitions Transaction costs associated with Outrigger and Soul, which completed on 1 July

24 NEW PROPERTIES FY16 Property: BreakFree on Collins Location: Melbourne, VIC Model: HMR Rooms: 95 Opened: July


25 NEW PROPERTIES FY16 Property: Mantra on View Location: Surfers Paradise, QLD Model: MLR Rooms: 411 Opened: July


26 NEW PROPERTIES FY16 Property: Mantra Twin Towns Location: Coolangatta, QLD Model: MLR Rooms: 464 Opened: July


27 NEW PROPERTIES FY16 Property: Peppers Noosa Location: Noosa, QLD Model: MLR Rooms: 198 Opened: July


28 NEW PROPERTIES FY16 Property: Peppers Airlie Beach Location: Airlie Beach, QLD Model: MA Rooms: 56 Opened: July


29 NEW PROPERTIES FY16 Property: Peppers Soul Location: Surfers Paradise, QLD Model: MLR Rooms: 288 Opened: July 2015 Previously managed by Mantra Group under a Management Agreement 29


30 PROPERTIES SCHEDULED TO ENTER PORTFOLIO Property: Peppers Suarga Location: Padang Padang, Bali Model: MA Rooms: 48 Opening: H1FY


31 PROPERTIES SCHEDULED TO ENTER PORTFOLIO Property: Peppers Waymouth Hotel Location: Adelaide, SA Model: Lease Rooms: 202 Opening: H1FY


32 PROPERTIES SCHEDULED TO ENTER PORTFOLIO Property: Mantra Hideaway Villas Location: Pecatu, Bali Model: MA Rooms: 30 Opening: H1FY


33 PROPERTIES SCHEDULED TO ENTER PORTFOLIO Property: Chevron Renaissance Location: Surfers Paradise, QLD Model: MLR Rooms: 711 Opening: H1FY2016 * This property is contracted but is yet to go unconditional 33


34 PROPERTIES SCHEDULED TO ENTER PORTFOLIO Property: Mantra on Mary Location: Brisbane, QLD Model: MLR Rooms: 374 Opening: H1FY2016 * This property is contracted but is yet to go unconditional 34


35 PROPERTIES SCHEDULED TO ENTER PORTFOLIO Property: Hotel Richmont by Mantra Location: Brisbane, QLD Model: MA Rooms: 110 Opening: H2FY


36 PROPERTIES SCHEDULED TO ENTER PORTFOLIO Property: Peppers Docklands Location: Melbourne, VIC Model: Lease Rooms: 87 Opening: H2FY


37 PROPERTIES SCHEDULED TO ENTER PORTFOLIO Property: Peppers King Square Location: Perth, WA Model: HMR Rooms: 120 Opening: H2FY

38 PROPERTIES SCHEDULED TO ENTER PORTFOLIO Property: Tribe Location: West Perth, WA Model: HMR Rooms: 120 Opening: H1FY

39 Appendix: Additional information Mantra on Kent, Sydney
40 IMPORTANT NOTICE Mantra Group s Financial Statements for the year ended 30 June 2015 are presented in accordance with Australian Accounting Standards. These measures are used by management and the Board to assess performance and make decisions on the allocation of resources. Further information regarding the non-ifrs financial measures and other key terms used in this presentation is included in the Glossary below. Non-IFRS measures have not been subject to audit or review. Glossary Average room rate CAGR EBIT EBITA EBITDA EBITDAI FY HMR MLR MSA NPAT NPATA Occupancy Paid rooms sold RevPAR Total rooms available ARR measures the total average room revenue received per occupied room per day throughout the period. It is used as a metric to compare relative profitability of the accommodation industry and is one of the inputs used to calculate RevPAR along with Occupancy Compound annual growth rate Earnings before interest and tax Earnings before interest, tax and amortisation Earnings before interest, tax, depreciation and amortisation Earnings before interest, taxation, depreciation, amortisation and impairment Year to 30 June Hotel Management Right Management Letting Rights Marketing Services Agreement Net profit after tax Net profit after tax adjusted to add back expense relating to amortisation of lease rights Measures the average number of rooms that have been utilised compared to the total average available rooms throughout the period. It is used as a metric to compare relative profitability of the accommodation industry and is one of the inputs used to calculate RevPAR along with Average Room Rate Number of rooms sold throughout the period Measures the total average room revenue received per room available throughout the period. It can also be calculated by taking the average occupied room rate and multiplying by the occupancy rate. It is used as a metric to compare relative profitability of the accommodation industry Number of rooms managed multiplied by the days in the period 40

41 Peppers Broadbeach, Gold Coast
For personal use only
 Mantra Group H1FY2015 Results Presentation 26 February 2015 Important notice and disclaimer Important notice and disclaimer This document is a presentation of general background information about the activities
For personal use only
 Mantra St Kilda Road, Melbourne DOMESTIC TRAVEL BY AUSTRALIANS INTERNATIONAL VISITORS TO AUSTRALIA Source: Tourism Research Australia, NVS and IVS June 2016 Source: Tourism Research Australia, Tourism
For personal use only
 IMPORTANT NOTICE AND DISCLAIMER Important notice and disclaimer This document is a presentation of general background information about the activities of Mantra Group Limited (Mantra Group) current at
Mantra Group Limited (ASX Code: MTR) ABN Annual General Meeting 22 November 2017
 ABN Annual General Meeting 22 November 2017") Mantra Group Limited (ASX Code: MTR) ABN 69 137 639 395 2017 Annual General Meeting 22 November 2017 Chairman s Address Peter Bush Good Morning, and welcome to the 2017 Mantra Group Annual General Meeting.
Mantra Group Limited (ASX Code: MTR) ABN 69 137 639 395 2017 Annual General Meeting 22 November 2017 Chairman s Address Peter Bush Good Morning, and welcome to the 2017 Mantra Group Annual General Meeting.
For personal use only
 Mantra Group Limited (ASX Code: MTR) ABN 69 137 639 395 2014 Annual General Meeting 26 November 2014 Chairman s Address by Peter Bush Good Morning, I m Peter Bush, Chairman of the Mantra Group and I welcome
For personal use only
 Mantra Group Limited and its controlled entities Appendix 4D Financial statements for the half year ended 31 December 2016 Company details Name of entity Mantra Group Limited ABN 69 137 639 395 Reporting
ABN Reporting period For the half year ended 31 December 2017 Comparative reporting period For the half year ended 31 December 2016
 Mantra Group Limited and its controlled entities Appendix 4D Financial statements for the half year ended 31 December 2017 Company details Name of entity Mantra Group Limited ABN 69 137 639 395 Reporting
For personal use only
 MANTRA GROUP LIMITED ANNUAL REPORT YEAR ENDED 30 JUNE ABN: 69 137 639 395 ASX CODE: MTR PEPPERS DOCKLANDS, MELBOURNE Remember when Room for everyone Give me a break Annual report - 30 June MANTRA GROUP
Peppers Soul, Surfers Paradise. Mantra Group April 2017
 Peppers Soul, Surfers Paradise Mantra Group April 2017 IMPORTANT NOTICE AND DISCLAIMER Important notice and disclaimer This document is a presentation of general background information about the activities
The following information should be read in conjunction with the attached financial report for the year ended 30 June 2017.
 Mantra Group Limited and its controlled entities Appendix 4E for the year ended 30 June Preliminary final report The following information should be read in conjunction with the attached financial report
Morgans Conference 13 October 2017
 Morgans Conference 13 October 2017 IMPORTANT NOTICE AND DISCLAIMER Important notice and disclaimer This document is a presentation of general background information about the activities of Mantra Group
FY17 RESULTS. Tuesday 20 February 2018
 FY17 RESULTS Tuesday 20 February 2018 Agenda 2017 Highlights Results 2018 Observations Out-of-Home industry APN Outdoor Contract renewals Focus and objectives Trading update 2 2017 Highlights 3 2017 highlights
CY2017 RESULTS PRESENTATION 19 FEBRUARY 2018
 CY2017 RESULTS PRESENTATION 19 FEBRUARY 2018 HIGHLIGHTS REVENUE GROWING FASTER THAN MARKET WITH MARGIN EXPANSION REVENUE UNDERLYING 1 NPATA 2 13.1% 13.1% 22.5% 22.5% Revenue $380.3m 13.1% NPAT 2 $33.1m
Full Year Results Briefing 27 August 2015
 Full Year Results Briefing 27 August 2015 David Gyngell CEO Simon Kelly COO/CFO Amanda Laing Commercial Director and Group General Counsel Alex Parsons MD, Nine Digital Peter Wiltshire Group Sales Director
HALF YEAR RESULTS PRESENTATION
 ASX Announcement 16 February 2016 HALF YEAR RESULTS PRESENTATION Attached is the presentation regarding the financial results of The Star Entertainment Group Limited (The Star Entertainment Group) for
FY19 half year results
 FY19 half year results For the six months ended 31 December 2018 14 February 2019 Gordon Ballantyne Managing Director & Chief Executive Officer Michael Sammells Chief Financial Officer 1 1HFY19 returned
Prime Financial Group Ltd (ASX: PFG) Full Year 2018 Results Presentation
 Full Year 2018 Results Presentation") Prime Financial Group Ltd (ASX: PFG) Full Year 2018 Results Presentation 29 August 2018 Click here to access accompanying Full Year 2018 Results Presentation podcast Key Points 1. Exposure to favourable
Prime Financial Group Ltd (ASX: PFG) Full Year 2018 Results Presentation 29 August 2018 Click here to access accompanying Full Year 2018 Results Presentation podcast Key Points 1. Exposure to favourable
FY18 RESULTS PRESENTATION
 FY18 RESULTS PRESENTATION KEY PERFORMANCE METRICS FOR FY18 OPERATIONAL FINANCIAL CAPITAL MANAGEMENT STRATEGIC GROWTH 2,257 lots under contract with a value of $616m $49.1m FY18 operating profit after tax
2013 Full Year Results
 2013 Full Year Results Rob Gurney CEO 1 2013 Full Year Review Profit before tax increased by 88% to $27.1 million Adjusted EBITDAI (1) up 8% to $54.6m Announced launch of new consumer brand, helloworld
For personal use only. 30 June 2016 Full Year Results Presentation
 30 June 2016 Full Year Results Presentation 30 August 2016 FY16 Financial Results Highlights Group Revenue A$143.4m Underlying 1 EBITDA A$87.6m Underlying 1 NPAT A$54.4m Operating Cashflow A$48.7m Maiden
Cover-More Group. UBS Australasia Conference. November 2015
 Cover-More Group UBS Australasia Conference November 2015 Executive summary: FY15 overview Cover-More delivered another year of double digit earnings growth, with offshore business growing substantially.
Mantra Group. Coasting through 1H15. Earnings and target price revision. Price catalyst. Catalyst: 1H15 result on 27 February.
 AUSTRALIA MTR AU Price (at 07:30, 12 Feb 2015 GMT) Outperform A$2.90 Valuation A$ 3.06 - DCF (WACC 8.7%, beta 1.3, ERP 5.0%, RFR 3.8%, TGR 3.0%) 12-month target A$ 3.26 12-month TSR % +16.3 Volatility
FULL YEAR RESULTS PRESENTATION
 ASX Announcement 26 August 2016 FULL YEAR RESULTS PRESENTATION Attached is the presentation regarding the financial results of The Star Entertainment Group Limited (The Star Entertainment Group) for the
For personal use only
 FY16 RESULTS BRIEFING H U G H M A R K S C H I E F E X E C U T I V E O F F I C E R G R E G B A R N E S C H I E F F I N A N C I A L O F F I C E R M I C H A E L S T E P H E N S O N C H I E F S A L E S O F
For personal use only 1H17 RESULTS PRESENTATION
 For personal use only 1H17 RESULTS PRESENTATION KEY PERFORMANCE METRICS FOR 1H17 OPERATIONAL FINANCIAL CAPITAL MANAGEMENT 1,408 settlements Up 10% $19.8m 1H17 operating profit after tax Up 7% 24.8% gearing
For personal use only
 Annual General Meeting Managing Director Presentation Jamie Pherous 31 October 2011 Disclaimer While every care has been taken in the preparation of this presentation, Corporate Travel Management (CTM)
FY 10 Results presentation 17 th August Denis Mackenzie, Managing Director Kevin McLaine, CFO
 FY 10 Results presentation 17 th August 2010 Denis Mackenzie, Managing Director Kevin McLaine, CFO Agenda + FY10 Results + Industry trends + Business outlook 2 Executive Summary Revenue growth has been
For personal use only
 FINANCIAL PERFORMANCE HIGHLIGHTS DELIVERING ON FY2020 STRATEGY Estia Health (EHE) 7 December 2015 1 HIGHLIGHTS Acquisition of medium-sized group, Kennedy Health Care - 959 places 5,690 places by the end
AGM PRESENTATION ǀ NOVEMBER 2017 ǀ PAGE 1 ANNUAL GENERAL MEETING
 AGM PRESENTATION ǀ NOVEMBER 2017 ǀ PAGE 1 ANNUAL GENERAL MEETING NOVEMBER 2017 KEY PERFORMANCE METRICS FOR FY17 OPERATIONAL FINANCIAL CAPITAL MANAGEMENT STRATEGIC GROWTH 3,077 settlements Up 7% $44.8m
For personal use only
 Affinity Education Group (ASX:AFJ) Morgans Conference 10 October 2014 Disclaimer This presentation contains general information in summary form which is current as at 10 October 2014. It presents financial
Shine Corporate Ltd 2018 Full Year Results
 Shine Corporate Ltd 2018 Full Year Results Results Presentation August 2018 Simon Morrison MANAGING DIRECTOR Ravin Raj CHIEF FINANCIAL OFFICER Disclaimer This presentation contains certain forward-looking
Interim Results Presentation
 Interim Results Presentation Half Year 31 December 2015 Released 15 February 2016 Scott McMillan, Managing Director Lee Schofield, Chief Executive Officer Matt Dyer, Chief Financial Officer Key Messages
SeaLink Travel Group (SLK)
") 29 June 2018 INTERNAL ONLY RECOMMENDATIONS Rating BUY Risk Medium Price Target $5.10 Share Price $4.45 SNAPSHOT Monthly Turnover $9.3mn Market Cap $446mn Shares Issued 101.2mn 52-Week High $4.46 52-Week
29 June 2018 INTERNAL ONLY RECOMMENDATIONS Rating BUY Risk Medium Price Target $5.10 Share Price $4.45 SNAPSHOT Monthly Turnover $9.3mn Market Cap $446mn Shares Issued 101.2mn 52-Week High $4.46 52-Week
Annual General Meeting 2018 HT&E Limited ABN
 Annual General Meeting 2018 HT&E Limited ABN 95 008 637 643 1 Creating shareholder value ARN is performing well; growth in core business Adshel pioneering digital out-of-home; innovative opportunities
FY Alliance Aviation Services Limited Results Presentation. August 2018
 FY 2018 Alliance Aviation Services Limited Results Presentation August 2018 Key Messages Alliance Aviation Services Limited announces a full year result which includes: $ 26.1m A strong financial performance
2017 half year results investor presentation
 2017 half year results investor presentation 27 February 2017 contents section presenting slide CEO presentation Julian Ogrin 3 broadband 10 CFO presentation Leanne Wolski 14 summary Julian Ogrin 21 appendix
Appendix 4D PARAGON CARE LIMITED. Reporting Period: Financial Half Year ended 31 Dec 2014
 Appendix 4D Name of Entity: PARAGON CARE LIMITED Reporting Period: Financial Half Year ended 31 Dec 2014 Previous corresponding Period: Financial Half Year ended 31 Dec 2013 Results for Announcement to
Mantra Group. The sun is shining. Earnings and target price revision. No change. Price catalyst. Catalyst: FY15 result on 27 August.
 AUSTRALIA MTR AU Price (at 09:24, 06 Aug 2015 GMT) Outperform A$3.57 Valuation A$ 3.80 - DCF (WACC 8.7%, beta 1.3, ERP 5.0%, RFR 3.8%, TGR 3.0%) 12-month target A$ 4.08 12-month TSR % +17.5 Volatility
For personal use only
 Affinity Education Group Full Year 2014 Results 27 February 2015 2014 Highlights FY 2014 Earnings Growth Underlying EBITDA of $17.9m (1) and underlying NPAT of $11.4m (1) Underlying EPS of 8.1 cents (1)
Monash IVF Group. FY16 Results Presentation 26 August 2016
 Monash IVF Group FY16 Results Presentation 26 August 2016 Disclaimer The presentation has been prepared by Monash IVF Group Limited (ACN 169 302 309) ( MVF ) (including its subsidiaries, affiliates and
FY2015 Annual Results August Brett McKeon - CEO David Bailey - CFO
 FY2015 Annual Results August 27 2015 Brett McKeon - CEO David Bailey - CFO FY2015 Financial Results Highlights Delivery on FY15 Prospectus forecasts Pro forma NPAT $19.3 million up 8.4% against IPO forecast
For personal use only
 FY14 RESULTS John Croll Chief Executive Officer Nimesh Shah Chief Financial Officer AGENDA OVERVIEW OF FY14 RESULT FINANCIAL PERFORMANCE FY15 OUTLOOK GROWTH STRATEGY Q&A JOHN CROLL NIMESH SHAH JOHN CROLL
For personal use only
 23 August 2013 Full Year Results June 2013 We attach an Investor Presentation for the FY13 Full Year Results. As previously announced, a results briefing for analysts will be held at 10:30am Sydney time
FY2017 Result Presentation. 21 August 2017
 FY2017 Result Presentation 21 August 2017 The Hansen journey growing and diversifying by geography, industry, propriety products and customer Early 1990 s Today Revenue by geography Industry verticals
Bell Potter Emerging Leaders Conference
 Bell Potter Emerging Leaders Conference Sydney, 24 October 2017 Leon Allen, Managing Director and CEO Disclaimer This presentation has been prepared by QANTM Intellectual Property Limited ACN 612 441 326
Ainsworth Game Technology Limited
 FY18 Annual Results Announcement Ainsworth Game Technology Limited www.agtslots.com Disclaimer IMPORTANT NOTICE This presentation has been prepared by Ainsworth Game Technology Limited ACN 068 516 665
INVESTOR PRESENTATION SG FLEET GROUP LIMITED - FY2016 RESULTS
 INVESTOR PRESENTATION SG FLEET GROUP LIMITED - FY2016 RESULTS 16 August 2016 Important Notice and Disclaimer IMPORTANT INFORMATION The information in this presentation is general in nature and does not
Tabcorp Holdings Limited. 2014/15 Full Year Results Presentation 13 August 2015
 Tabcorp Holdings Limited ABN 66 063 780 709 2014/15 Full Year Results Presentation 13 August 2015 Draft version 15 (01-08-13) FY15 overview Statutory NPAT $334.5m, up 157.5%, comprising of: NPAT from continuing
EBOS Group Ltd. For personal use only. Results presentation Financial Year ended 30 June August 2016
 EBOS Group Ltd Results presentation Financial Year ended 30 June 2016 Patrick Davies John Cullity Chief Executive Officer Chief Financial Officer 25 August 2016 Disclaimer The information in this presentation
Terrorism Insurance Act 2003 Update
 Terrorism Insurance Act 2003 Update September October 2003 2003 W As you would be aware, following the events of September 11, most commercial insurers in Australia excluded terrorism-related claims, leaving
For personal use only
 ALE Property Group Annual General Meeting 25 October 2016 Crows Nest Hotel, Sydney, NSW 1 Contents Highlights ALE s 13 Years of Equity Performance FY16 Results Properties and Development Case Studies Capital
For personal use only
 Click to edit Master text styles IDP Education FY16 Results Presentation Twelve months to 30 June 2016 11 February 2016 Important notice and disclaimer Click Disclaimer to edit Master text styles The material
Half-Year Report. Empired Limited and its Controlled Entities Interim Financial report for the Half Year ended 31st December 2013 ABN
 CRM Information Management Big Data Managed Services Mobility Cloud Business Intelligence Collaboration Security Sharepoint Half-Year Report Empired Limited and its Controlled Entities Interim Financial
For personal use only
 NATIONAL STORAGE REIT JP MORGAN AUSTRALIAN REIT FORUM ASIA MARCH 2017 IMPORTANT NOTE & DISCLAIMER This presentation has been prepared by National Storage REIT ( NSR ) comprising National and may involve
For personal use only
 Preliminary Final Report Appendix 4E Results for announcement to the market Pulse Health Limited (ACN 104 113 760) This Preliminary Final Report is provided to the Australian Securities Exchange (ASX)
FIRST HALF FINANCIAL YEAR 2018 RESULTS PRESENTATION
 FIRST HALF FINANCIAL YEAR 2018 RESULTS PRESENTATION 15 February 2018 Steve Gostlow, Managing Director 2 Our corporate ideals are based on safety, reliability and sustainability. 1H18 - Highlights Safety
Affinity Education Group. Half Year Results
 Affinity Education Group Half Year Results 29 August 2014 Disclaimer This presentation contains general information in summary form which is current as at 29 August 2014. It presents financial information
Investor Presentation Full Year CY 2017 Results
 Investor Presentation Full Year CY 2017 Results Deven Billimoria Managing Director and CEO Tim Looi Chief Financial Officer 22 February 2018 PAGE 0 Smartgroup has had another successful year... 1 2 3 4
FY2018 Half Year Results Investor Presentation
 FY2018 Half Year Results Investor Presentation February 2018 DISCLAIMER The material in this presentation has been prepared by IMF Bentham Limited (IMF) and is general background information about IMF's
25 February The Manager Market Announcements Australian Securities Exchange Limited 20 Bridge Street SYDNEY NSW 2000.
 Level 1 157 Grenfell Street Adelaide SA 5000 GPO Box 2155 Adelaide SA 5001 Adelaide Brighton Ltd ACN 007 596 018 Telephone (08) 8223 8000 International +618 8223 8000 Facsimile (08) 8215 0030 www.adbri.com.au
Credit Suisse Annual Asian Investment Conference
 Adelaide Brighton Limited Credit Suisse Annual Asian Investment Conference Hong Kong, 27 30 March 2017 Martin Brydon Chief Executive Officer and Managing Director Adelaide Brighton Limited Overview of
For personal use only
 Appendix 4D Half-year report 1. Company details Name of entity: ABN: 37 167 522 901 Reporting period: For the half-year ended Previous period: For the half-year December 2015 2. Results for announcement
Tabcorp Holdings Limited 2015/16
 Tabcorp Holdings Limited ABN 66 063 780 709 2015/16 Full Year Results Presentation 4 August 2016 Draft version 15 (01-08-13) FY16 overview Statutory results NPAT $169.7m, down 49.3% EPS 20.4 cents per
For personal use only
 FY15 FULL YEAR RESULTS REVIEW Progressing to plan Agenda GROUP RESULTS OVERVIEW BUSINESS UNIT REVIEW OUTLOOK 150 Collins Street, Westpac Building. Mechanical work was completed by Allstaff Airconditioning
Financial Results for the Full Year Ended 30 June 2012
 Financial Results for the Full Year Ended 30 June 2012 Sims Metal Management Limited ASX Code: SGM NYSE Code: SMS Supplemental Information 23 August 2012 Disclaimer This presentation may contain forward-looking
ASX Media Release WORLEYPARSONS LIMITED (ASX: WOR) FULL YEAR 2017 RESULT
 FULL YEAR 2017 RESULT") 23 August 2017 ASX Media Release WORLEYPARSONS LIMITED (ASX: WOR) FULL YEAR 2017 RESULT Professional services company WorleyParsons Limited today announced a statutory net profit after tax (NPAT) of $33.5
23 August 2017 ASX Media Release WORLEYPARSONS LIMITED (ASX: WOR) FULL YEAR 2017 RESULT Professional services company WorleyParsons Limited today announced a statutory net profit after tax (NPAT) of $33.5
MOTORCYCLE HOLDINGS LIMITED
 MOTORCYCLE HOLDINGS LIMITED FY2018 Full Year Results Disclaimer Disclaimer and Important Information This presentation may contain certain unaudited financial information in relation to Limited (MTO).
For personal use only
 DWS Limited 2018 Full Year Results Presentation Contents Introduction Danny Wallis (CEO) / Stuart Whipp (CFO) Results Highlights Full Year Results Capital Management Operations Update Summary and Outlook
For personal use only
 SUMMARY OF 1H19 GROUP OUTCOMES Strong first half performance UNDERLYING PROFIT BEFORE TAX (UPBT) 1H19 $112.3m up $30.4m on 1H18 Highest 1H underlying result in 11 years Delivered despite $88.2m fuel and
FY18 1 ST HALF RESULTS
 26 FEBRUARY 2018 FY18 1 ST HALF RESULTS Chief Executive Officer : Chief Financial Officer : John Croll James Orlando isentia.com AGENDA Overview of H1 FY18 Results Strategic Focus H1 FY18 Financial Performance
2017 FULL YEAR RESULTS
 2017 FULL YEAR RESULTS ESTABLISHING LEADING POSITIONS IN NEW GROWTH SECTORS Malcolm Bundey Managing Director and CEO Richard Betts Chief Financial Officer 16 August 2017 Pact Group Holdings Ltd ABN: 55
Cameron Judson, CEO Glynn Wright, CFO. McGrath Limited (ASX: MEA) Results for the 6 months ended 31 December February 2018
 Results for the 6 months ended 31 December February 2018") Cameron Judson, CEO Glynn Wright, CFO McGrath Limited (ASX: MEA) Results for the 6 months ended 31 December 2017 15 February 2018 1H18 A SNAPSHOT REVENUE DOWN 23% TO $51.6M GOODWILL IMPAIRMENT ($21.8)
Cameron Judson, CEO Glynn Wright, CFO McGrath Limited (ASX: MEA) Results for the 6 months ended 31 December 2017 15 February 2018 1H18 A SNAPSHOT REVENUE DOWN 23% TO $51.6M GOODWILL IMPAIRMENT ($21.8)
For personal use only
 ASX ANNOUNCEMENT Abacus Property Group 2015 Full Year Results Results highlights The Group s consolidated AIFRS statutory profit is $133.5 million up 23.3% from $108.3 million in FY14 Abacus underlying
(RBD) INVESTOR PRESENTATION
 INVESTOR PRESENTATION") RESTAURANT BRANDS NEW ZEALAND LIMITED (RBD) INVESTOR PRESENTATION MAY 2018 RUSSEL CREEDY GROUP CHIEF EXECUTIVE OFFICER GRANT ELLIS GROUP CHIEF FINANCIAL OFFICER 1 OUTLINE Restaurant Brands 101 FY18 Results
RESTAURANT BRANDS NEW ZEALAND LIMITED (RBD) INVESTOR PRESENTATION MAY 2018 RUSSEL CREEDY GROUP CHIEF EXECUTIVE OFFICER GRANT ELLIS GROUP CHIEF FINANCIAL OFFICER 1 OUTLINE Restaurant Brands 101 FY18 Results
INVESTOR PRESENTATION
 INVESTOR PRESENTATION FULL YEAR FY2018 17 August 2018 AGENDA FY18 INVESTOR PRESENTATION 1. Highlights & strategy Melos Sulicich Managing Director & CEO 2. Financial results David Harradine Chief Financial
FY16 Financial Results Investor Presentation. August 2016
 FY16 Financial Results Investor Presentation August 2016 FY16 Results Summary Improvement on FY15 across all key earnings metrics EPS growth and improved shareholder returns Revenue EBITDA PBT EPS Dividend
For personal use only
 Appendix 4D Results for announcement to the market (ACN 104 113 760) This half-year report is provided to the Australian Securities Exchange (ASX) under ASX listing Rule 4.2A.3. Current reporting period:
FINANCIAL RESULTS PRESENTATION FY2018
 Virtus Health (ASX:VRT) FINANCIAL RESULTS PRESENTATION FY2018 Tuesday 21 August, 2018 AEST DISCLAIMER The material in this presentation has been prepared by Virtus Health Limited ABN 80 129 643 492 ( Virtus
Transpacific FY15 Half Year Results Presentation
 Transpacific FY15 Half Year Results Presentation Robert Boucher CEO Brendan Gill CFO 20 February 2015 - Disclaimer Forward looking statements - This presentation contains certain forward-looking statements,
25 February 2019 The PAS Group Limited H1 FY2019 Results Briefing
 25 February 2019 The PAS Group Limited H1 FY2019 Results Briefing ABN 25 169 477 463 H1 FY2019 Results Summary Sales up 9.9% to $143.0 million Online sales up 11.0% Wholesale sales up 32.1% Retail sales
A S X A N N O U N C E M E N T
 A S X A N N O U N C E M E N T DATE: 24 February 2016 Attached is the Presentation regarding Pact s Half year Financial Results for the half year ended 31 December 2015. The Presentation will occur at 10am
For personal use only
 INGENIA COMMUNITIES GROUP 2018 Annual General Meeting 13 NOVEMBER 2018 Meeting outline 2 Chairman s welcome NON-EXECUTIVE DIRECTORS CHAIRMAN Jim Hazel DEPUTY CHAIRMAN Rob Morrison DIRECTOR Amanda Heyworth
Sigma Pharmaceuticals Limited
 Investor Relations Contact: Gary Woodford Corporate Affairs Manager Gary.Woodford@signet.com.au Phone: 03 9215 9632 Mobile: 0417 399 204 Mark Hooper CEO and Managing Director Gary Woodford Corporate Affairs
FINANCIAL RESULTS PRESENTATION H1FY18
 Virtus Health (ASX:VRT) FINANCIAL RESULTS PRESENTATION H1FY18 Tuesday 20 th February, 2018 9.15am AEDT DISCLAIMER The material in this presentation has been prepared by Virtus Health Limited ABN 80 129
Big River Industries Limited (ASX:BRI)
") Big River Industries Limited (ASX:BRI) FY2018 Half Year Results Briefing 27 February 2018 Optus Stadium - Perth H1 FY2018 - Contents 1. Highlights 2. Business Diversity Strengthening 3. Sales Highlights
Big River Industries Limited (ASX:BRI) FY2018 Half Year Results Briefing 27 February 2018 Optus Stadium - Perth H1 FY2018 - Contents 1. Highlights 2. Business Diversity Strengthening 3. Sales Highlights
16.1c c c
 1 2016 Interim Result Highlights Successful delivery, ahead of PDS 2 Exceeded revised earnings guidance Six months to 31 Dec 15 Solid capital management 7.97c 7.65c $2.15 28.3% Earnings per unit Distribution
Insurance Brokers SECTOR REPORT. Solid Hold. -4% Jun-12. Dec-12. Mar-13. Sep-13. Sep-12. Jun-13. Source: APRA, Baillieu Holst estimates
 11 May 2018 RECOMMENDATIONS AUB Group (AUB) Rating HOLD Risk Low Price Target $14.50 Share Price $14.17 Steadfast Group (SDF) Rating HOLD Risk Low Price Target $2.80 Share Price $2.88 RESEARCH ANALYST
Freedom Insurance (FIG)
") 03 November 2017 INTERNAL ONLY RECOMMENDATIONS Rating BUY Risk Medium Price Target $0.85 Share Price $0.50 SNAPSHOT Monthly Turnover $13.0mn Market Cap $169mn Shares Issued 239.7mn 52-Week High $0.97 52-Week
03 November 2017 INTERNAL ONLY RECOMMENDATIONS Rating BUY Risk Medium Price Target $0.85 Share Price $0.50 SNAPSHOT Monthly Turnover $13.0mn Market Cap $169mn Shares Issued 239.7mn 52-Week High $0.97 52-Week
FOR THE HALF-YEAR ENDED 28 FEBRUARY Bank of Queensland Limited ABN AFSL No
 FOR THE HALF-YEAR ENDED 28 FEBRUARY 2017 Bank of Queensland Limited ABN 32 009 656 740. AFSL No 244616. JON SUTTON Managing Director & CEO ANTHONY ROSE Chief Financial Officer JON SUTTON Managing Director
FY18 Results Presentation Bravura Solutions Limited. 28 August 2018
 FY18 Results Presentation Bravura Solutions Limited 28 August 2018 Important notice and disclaimer The information contained in this document (including this notice) and discussed at this presentation
Praemium (PPS) COMPANY REPORT. Quartermaster
 COMPANY REPORT. Quartermaster") 10 October 2017 INTERNAL ONLY RECOMMENDATIONS Rating BUY Risk High Price Target $0.58 Share Price $0.45 SNAPSHOT Monthly Turnover $9.2mn Market Cap $162mn Shares Issued 399.6mn 52-Week High $0.54 52-Week
10 October 2017 INTERNAL ONLY RECOMMENDATIONS Rating BUY Risk High Price Target $0.58 Share Price $0.45 SNAPSHOT Monthly Turnover $9.2mn Market Cap $162mn Shares Issued 399.6mn 52-Week High $0.54 52-Week
Ingenia Communities Group
 INGENIA COMMUNITIES GROUP Morgan s Investor Queensland Conference Conference Ingenia Communities Group 23 October 2015 October 2015 Lakeside Lara, Lara, VIC OUR BUSINESS Ingenia is a leading owner, operator
For personal use only
 FY16 Full Year Results 23 August 2016 Matt Muscio Chief Executive Officer Dean Taylor Chief Financial Officer Kristine James General Manager Corporate Development Agenda 1. Highlights 2. Financial Performance
For personal use only
 ASX ANNOUNCEMENT 10 August 2016 Results for year ended 30 June 2016 (ASX: EGG) today announced its results for the year ended 30 June 2016. Summary: Net Revenue up 3% and Operating EBITDA up 44% on prior
For personal use only
 G8 Education Full Year Results Presentation Year Ended 31 December 2016 G8 Education Limited (ASX:GEM) 20 February 2017 Key Messages 2016 Revenue up 10.2% from prior year driven by fee increases and acquisitions
1 FY2014 Financial Highlights. 2 Operational Overview. 3 Market Conditions. 4 Company Outlook
 1 FY2014 Financial Highlights 2 Operational Overview 3 Market Conditions 4 Company Outlook Record full year profit of $40.3m, up 10.9% on pcp Final fully franked dividend of 15.5 cents declared; record
AUSTRALIAN PHARMACEUTICAL INDUSTRIES LIMITED FULL YEAR FY12 RESULTS PRESENTATION THURSDAY 25 OCTOBER 2012
 AUSTRALIAN PHARMACEUTICAL INDUSTRIES LIMITED FULL YEAR FY12 RESULTS PRESENTATION THURSDAY 25 OCTOBER 2012 1 Important notice The material in this presentation is of general information about API s activities
OneVue Holdings Limited (OVH)
") OneVue Holdings Limited (OVH) FY 2017 results presentation 28 August 2017 Regulators, fund managers and investors are calling for greater transparency of platform costs and revenue drivers Platform differentiation
OneVue Holdings Limited (OVH) FY 2017 results presentation 28 August 2017 Regulators, fund managers and investors are calling for greater transparency of platform costs and revenue drivers Platform differentiation
Interim FY 2015 results 6 months ended 31 December February 2015
 Interim FY 2015 results 31 December 2014 18 February 2015 Highlights Solid trading result for 1H FY2015; change in accounting policy for acquisition of healthcare practices First half result highlights
FY2018 Half Year Results Presentation 1 March 2018
 FY2018 Half Year Results Presentation Brands AMA Group Overview Vehicle Panel Repair Vehicle Protection Products & Accessories Automotive Electrical & Cable Accessories Automotive Component Remanufacturing