FY2017 Supplemental IR information
|
|
|
- Wilfred Rose
- 5 years ago
- Views:
Transcription
1 FY217 Supplemental IR information (FYE March 218) May 8, 218 FUJI OIL HOLDINGS INC.
2 Table Of Contents 1 Consolidated profit and loss summary 3 2 Key points of financial accounting 3 3 Operating profit analysis 4 4 FY217 Consolidated balance sheets 5 5 FY217 Consolidated cash flow 5 6 Consolidated benchmarks 5 7 Revenues, Operating profit (By segment) 6 8 Revenue, operating profit (by region, division) Group administrative expenses are indicated externally 7 Reference Revenue, operating profit (by region, division) Group administrative expenses are included in each segment 8 9 Fuji Oil (Japan) BY major product; Domestic sales volume, revenue (YoY) 9 1 Medium-term strategic products Sales volume (YoY) 9 11 Market prices for major related raw materials (Market prices for major related raw materials / Major currency ra 1 12(1) Japan (By area) 11 12(2) Asia (By area) 11 12(3) Americas (By area) 12 12(4) Europe (By area) Capital expenditures, depreciation expenses history Dividends history Medium-Term Management Plan Progress Topics 14 2
3 1. Consolidated profit and loss summary Revenue Operating profit Ordinary profit FY216 FY217 YoY FY218 Rate of Rate of Cumulative Cumulative Change forecast Change increase increase 1,94 1, % 1, % 1,44 1, % 1, % (12) (3.1)% % 2,925 3, % 3, % % 73 () (.6)% % % (1) (4.5)% % ーーーー (37) (4) +12.4% % % 6.7% 6.7% (.1)pt - 6.6% (.1)pt % % % % EBITDA % % ROE 8.3% 8.8% +.5pt - 8.8% (.1)pt ー Cash flows from operating activities % % Cash flows from investing activities (138) (145) (8) (5.5)% (196) (51) (35.1)% Free cash flow % 16 (31) (22.6)% Net interest-bearubg loans (93) (17.6)% % Net operating capital % 637 (12) (1.8)% Net interest-bearing loans/ebitda 1.8x 1.5x (.3)x ー 1.3x (.2)x ー CCC (Cash conversion cycle) 11 days 13 days 7 days shortening ー 1 days 3 days Shortening From FY218, Fuji Oil (THAILAND)'s segment was changed from Oils and Fats to Confectionery and Bakery Ingredients. Up to FY217, we distributed corporate expenses between segments but from expenses FY218 corporate expenses are recorded as corporate. The values for FY218 adjusted value and rate of change exclude FY217 corporate expenses. Reference (external recording of group administrative expenses) FY216 FY217 Rate of Change Cumulative Cumulative increase Oils and Fats % Operating profit % (1) (1.4)% (26) (33) (7) (26.4)% 2. Key points of financial accounting FY217 All incomes represent record high earnings Oils and Fats : Despite the impact of rising raw material costs in Japan and Europe, overall income increased thanks to favorable sales of low trans fat oils in North America Confectionery and Bakery Ingredients Oils and Fats Confectionery and Bakery Ingredients Oils and Fats Confectionery and Bakery Ingredients FY218 Oils and Fats : In Japan, income decreased due to increased energy costs and increased operating expenses but overall income is largely unchanged year on year thanks to improved profitability in Europe. Confectionery and Bakery Ingredients Total Consolidated adjustment / group administrative epenses Total Operating margin Net income attributabnle to Owners of parent Confectionery and Bakery Ingredients Consolidated adjustment / group administrative epenses (Unit: JPY 1 million) Despite decreased income from the emulsified and fermented products division, overall income increased thanks to improved profitability for chocolate in Japan and South America Despite favorable sales of high value-added products (protein ingredients, Water-soluble soy polysaccharides), income decreased due to the partial suspension of operations in some plants for facilities investments and lower sales in China Cash flow from operating activities increased YoY by 11.7 billion yen to 28.2 billion yen, exceeding the progress outlined for our medium-term goal of 1 billion yen in 4 years CCC was shortened by approximately 7 days YoY to 13 days mainly thanks to a shorter turnaround on inventory assets. Planning for increased income on income recovery for the emulsified and fermented products division and increases sales of chocolate South America ing increased income in Japan thanks to continued efforts to expand sales of high valueadded products and increased income in China thanks to expanded sales of functional agents YoY ー ing cash flow from operating activities to increase YoY by 2 billion yen to 3.2 billion yen, due to increased pre-tax income and increased depreciation expenses. CCC was shortened by approximately 3 days to 1 days mainly thanks to improved turnaround for accounts receivable, inventory assets, and trade payables. 3


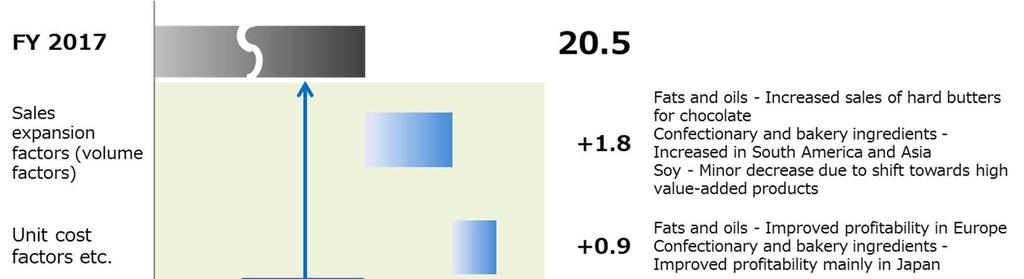
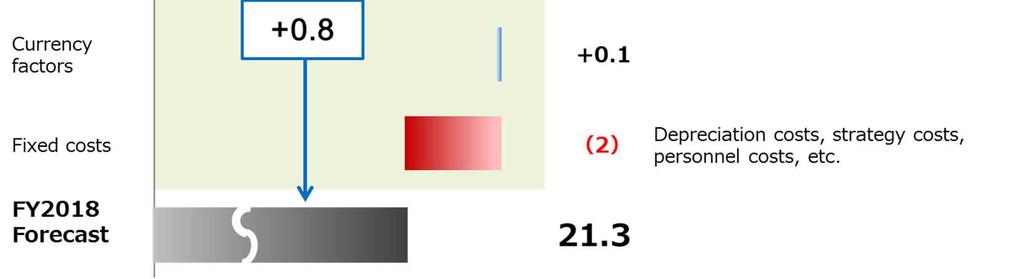
4 3. Operating profit analysis 4
5 4. FY217 Consolidated balance sheets FY216 -end FY217 -end Current assets 1,325 1,324 Accounts receivable increased, () inventory assets decreased Fixed tangible assets increasaed, Fixed assets 1,397 1,396 () goodwill decreased, other fixed assets decreased Total assets 2,721 2,72 (1) intrest-bearing loans (91) Other liabilities (4) Total liabilities 1,166 1,71 (95) Total net assets 1,555 1, FY217 Consolidated cash flow FY216 FY217 YOY Income before income taxes Depreciation and amortization other changes (12) (15) +15 Cash frows from operating activities Cash frows from investing activities (138) (145) (8) Free cash flow Loan procurements/ repayments 38 (29) (129) Dividend payments, acquisition of treasury stock, etc. (94) (43) +51 Cash frows from financing activities (57) (135) (78) Net increase in cash and cash equivalents (35) Changes incidental to new consolidations and eliminations vs.end of previous FY (5) 2 +7 (Unit: JPY 1 million) Major factors of change Accounts payable increased, other current liabilities increased, other fixed liabilities decreased. Income surplus increased, foreign currency translation adjustments decrease (Unit: JPY 1 million) Major factors of change Cash and cash equivalents at end of period (Note)Depreciation expenses includes depreciation expenses for both tangible fixed assets and intangible fixed assets. Change in cash and cash equivalents inckudes conversion differences rekated to cash and cash equivalents. 6. Consolidated benchmarks FY214 FY215 FY216 FY217 FY218 Full-year Full-year Full-year Full-year (Unit: JPY 1 million) Capital Expenditures Depreciation expenses Interest-bearing loans Net assets (excluding holdings by non-controlling 1,456 1,423 1,57 1,62 1,6 Net assets per share (JPY) 1,694 1,656 1,754 1,864 1,861 Total assets 2,236 2,669 2,721 2,72 2,723 Equity ratio 65.1% 53.3% 55.4% 58.9% 58.8% D/E ratio ROE 6.8% 6.4% 8.3% 8.8% 8.8% ROA 6.3% 5.7% 7.3% 7.3% 7.6% Operating profit margin 5.2% 5.9% 6.7% 6.7% 6.6% (Note) Depreciation expenses indicates depreciation expenses for tangible fixed assets. Net assets indicates net assets related to common stock excluding holdings by non-controlling interests. D/E Ratio = interest-bearing debt / net assets (holdings by non-controlling interests) ROE = net income / net assets ROA = ordinary income / total assets 5
6 7. Revenue, Operrating profit (By segment) Oils and Fats (Unit:JPY 1 million) FY216 FY217 FY218 Cumulative Cumulative Revenue 1,61 1,132 1,171 YoY ー 6.7% 3.4% Operating profit Operating margin 6.5% 6.5% 6.2% YoY ー 5.9% (.6)% (JPY 1M) Oil and Fats Operating profit FY216 FY217 FY218 Confectionery and Bakery Ingredients (Unit:JPY 1 million) FY216 FY217 FY218 Cumulative Cumulative Revenue 1,473 1,564 1,668 YoY ー 6.2% 6.6% Operating profit Operating margin 8.% 8.3% 8.2% YoY ー 9.5% 5.6% (JPY 1M) Cofectionery and Bakery Ingredients Operaitng profit FY216 FY217 FY218 (Unit:JPY 1 million) FY216 FY217 FY218 Cumulative Cumulative Revenue YoY ー (3.1)%.3% Operating profit Operating margin 9.1% 9.3% 1.7% YoY ー (1.4)% 15.6% (JPY 1M) Operating profit FY216 FY217 FY218 Total (Unit:JPY 1 million) FY216 FY217 FY218 Cumulative Cumulative Plan Revenue 2,925 3,76 3,22 YoY 1.7% 5.2% 4.7% Operating profit Operating margin 6.7% 6.7% 6.6% YoY 16.9% 4.% 4.% Due to the realignment of Fuji Oil Thailand (Oils and Fats Confectionery and Bakery Ingredients), results are presented after retroactive adjustments. Group administrative expenses are not recorded within operating income of each segment. (JPY 1M) 25 Group administrative expenses: 2,617 million (FY216), 3,39 million (FY217), 3,711 million (FY218 ) Total Operating profit FY216 FY217 FY218 6
7 8. Revenue, operating profit (by region, division) Group administrative expenses are indicated externally (1).Revenue Consolidated revenue Oil and Fats Confectionery and Bakery Ingredients Revenue total FY ,617 (667) 24,985 4,28 32,5 1,326 23, (974) 117,1 3, ,284 (1,379) 2,777 1,472 31,174 3,92 23,974 3, ,211 7, ,663 19,35 27,254 2,842 16, ,184 4,694 36,615 3,298 22, 2, ,8 1, , ,317 6,259 19,621 2,62 156,429 9, ,636 27,58 17, , ,699 (291) 3, , ,99 (1,116) 3,14 (15) 38,4 (1,222) ,16 3,119 39, ,5 3,736 65, 7,89 54,5 3,75 23, (974) 322, 14, ,764 (1,642) 57,11 7,626 5,795 5,982 23,974 3,132 37,645 15, ,46 49,484 44,813 2, ,547 (Note) The Above revenue are revenue to outside customers (revenue after eliminating inside sales). (2).Operating profit Consolidated operating profit (Unit: JPY 1 million) Group administrative Consolidated FY Japan Asia Americans Europe Eliminated expenses Total Oil and Fats Confectionery and Bakery Ingredients Consolidated adjustment Group administrative expenses Operaing profit total Japan Asia Americas Europe (Unit: JPY 1 million) 218 2,31 (54) 1, ,61 (218) ,28 (47) 217 2,841 (189) 1, , (427) 7 3 7, ,3 1,411 1, , , ,665 (53) 1, (1) 13, , , , ,944 1, ,655 2, (27) 11, , , , (21) 7 (98) 3,518 (5) 216 2, , (36) 7 (7) (196) (71) (7) (3) 7 14 (232) (4) (7) (292) Consolidated total 218 (3,711) (43) (3,711) (43) 217 (3,39) (692) (3,39) (692) 216 (2,617) (2,617) , , , (3,711) (43) 21, , , ,69 1, (427) (24) 6 (3,39) (692) 2, ,875 4,385 2, (84) (2,617) 19,694 Key points From FY218, we have changed format so that corporate expenses recorded for the Group main office and certain area management company are indicated separately. Due to the realignment of Fuji Oil Thailand (Oils and Fats Confectionery and Bakery Ingredients), results are presented after retroactive adjustments.group administrative expenses are not recorded within operating income of each segment. Japan : We are planning for decreased income from fats and oils due to higher energy costs and increased operating expenses. We expect a recovery in profitability for the emulsified and fermented products division of the confectionary and bakery ingredients business. Furthermore, we forecast increased income on sales growth for Asia: In Southeast Asia and China, we will conduct marketing to expand sales of hard butters for chocolate, chocolate, cream, margarine, and filings (new China plant scheduled to launch operations in 2H), and we will increase soy income by expanding sales of high value-added soy products. Americans: North America - We worked to maintain profitability amid full capacity production for oils and fats but income decreased. South America - ing increased income on a recovery in volume thanks to sales growth for new chocolate products Europe: ing increased income on chocolate sales growth and on no longer being impacted by the high raw materials prices seen during the previous fiscal year 7
8 (Reference) Revenue, operating profit (by region, division) Group administrative expenses are included in each segment (1).Revenue Consolidated revenue Oil and Fats Confectionery and Bakery Ingredients Revenue total FY ,284 (1,379) 24,596 1,996 31,174 3,92 23,974 3, ,3 7, ,663 22,6 27,254 2,842 19, , ,498 5,735 19,621 2,62 152,61 8, ,636 23,763 17, , ,99 (1,116) 3,14 (15) 38,4 (1,222) ,16 3,119 39, ,764 (1,642) 57,11 7,626 5,795 5,982 23,974 3,132 37,645 15, ,46 49,484 44,813 2, ,547 (Note) The Above revenue are revenue to outside customers (revenue after eliminating inside sales). (2).Operating profit Consolidated operating profit (Unit: JPY 1 million) Consolidated FY Japan Asia Americans Europe Eliminated Total Oil and Fats Confectionery and Bakery Ingredients Consolidated adjustment Operaing profit total Key points Japan Asia Americas Europe 217 2,253 (261) 1, , (433) 7 3 6, ,514 1,492 1, , ,183 (298) 2, , , ,481 2, (27) 1, , (263) 7 (97) 2,569 (121) 216 1, , (55) (7) (4) 7 14 (248) (3) (7) (293) ,923 (376) 4, ,629 1, (433) (4) 44 2, ,299 4,419 2, (84) 19,694 The actual business results before the realignment of Fuji Oil Thailand. Group administrative expenses are distributed to each segment. (Unit: JPY 1 million) Consolidated total 8
9 9. Fuji Oil (Japan) By major product; Domestic sales volume, revenue Oils for food processing Hard butters for chocolate Oils and Fats Chocolate Cream Margarine / shortening Food ingredients Confectionery and Bakery Ingredients protein materials protein foods Functional agents Raw milk protein Total (YOY %) FY FY 217 FY 218 1Q 2Q 1st half 3Q 4Q 2nd half Volume 14% 99% 91% 95% 84% 9% 87% 91% 97% Sales 11% 17% 97% 12% 91% 93% 92% 97% 97% Volume 19% 15% 9% 97% 12% 1% 11% 99% 99% Sales 16% 11% 89% 94% 99% 99% 99% 97% 98% Volume 15% 99% 91% 95% 86% 91% 88% 92% 98% Sales 12% 15% 94% 99% 93% 94% 93% 96% 98% Volume 14% 99% 11% 1% 99% 17% 13% 12% 99% Sales 15% 99% 1% 99% 99% 13% 11% 1% 1% Volume 97% 93% 15% 98% 11% 11% 11% 14% 12% Sales 96% 89% 15% 96% 17% 111% 19% 13% 15% Volume 99% 1% 94% 97% 98% 1% 99% 98% 11% Sales 96% 1% 96% 98% 99% 99% 99% 99% 17% Volume 75% 63% 1% 8% 11% 94% 12% 9% 18% Sales 73% 69% 14% 86% 124% 112% 118% 11% 15% Volume 97% 95% 1% 97% 12% 13% 13% 1% 11% Sales 98% 97% 11% 99% 12% 12% 12% 11% 13% Volume 1% 15% 16% 15% 1% 1% 1% 13% 16% Sales 97% 11% 12% 11% 97% 99% 98% 1% 18% Volume 97% 94% 99% 97% 84% 81% 83% 89% 13% Sales 98% 94% 11% 98% 84% 84% 84% 91% 14% Volume 18% 16% 111% 18% 96% 99% 98% 13% 112% Sales 18% 18% 114% 111% 97% 12% 1% 15% 116% Volume 97% 92% 13% 98% 16% 93% 99% 98% 11% Sales 94% 93% 13% 98% 18% 94% 11% 99% 14% Volume 11% 95% 99% 97% 97% 96% 96% 97% 14% Sales 99% 1% 14% 12% 93% 94% 93% 97% 19% Volume 11% 97% 96% 96% 93% 96% 95% 95% 1% Sales 99% 1% 1% 1% 98% 98% 98% 99% 13% Note) Due to an internal change in reporting categories, certain values may differ from materials distributed in the past. 1.Medium-term strategic products Sales volume (YOY %) FY FY 217 Fy 218 1Q 2Q 1st half 3Q 4Q 2nd half Asia 114% 93% 98% 95% 133% 111% 122% 19% 13% Hard butters for chocolate Americas 17% 89% 89% 89% 76% 88% 82% 85% 117% Europe 12% 113% 91% 12% 1% 15% 12% 12% 93% Total 19% 95% 93% 94% 16% 12% 14% 99% 118% Asia 116% 12% 118% 119% 135% 12% 116% 117% 119% Chocolate Americas 12% 1% 72% 89% 91% 89% 9% 89% 111% Europe 113% 114% 16% 11% 14% 11% 12% 15% 112% Total 17% 16% 84% 99% 16% 95% 1% 1% 114% Cream Asia 12% 93% 112% 15% 131% 136% 134% 119% 131% Margarine / shortening Asia 112% 112% 114% 113% 116% 14% 11% 11% 113% Filling Asia 152% 16% 159% 16% 178% 145% 159% 16% 117% Water-soluble soy polysaccharide USS Volume 18% 16% 111% 18% 99% 13% 11% 15% 113% Volume 129% 129% 117% 123% 123% 86% 14% 114% 125% 9

10 11. Market prices for major related raw materials market prices for major related raw materials for international markets of major raw materials that could influence our Groups business, this is a list of benchmarks for yen-converted prices and thus may differ from actual market prices for raw materials used. usage periods and allowance assignment periods differ by half a year to reflect our Groups raw material allowance timing. Transitions in Major relevant raw material markets (after yen conversion) Market prices from Oct. 1, 215 set to 1. major currency rates P/L:FY average rate,b/s:year-ebd rate FY216 FY217 vs. FY218 -end -end Difference Change forecast $ BRL 元 P/L P/L P/L P/L % 12.4% 5.3% 1.6% B/S B/S B/S B/S (3.49) (1.59) (3.)% (4.4)% 1.% 3.2% Our group uses exchange contracts for purchasing 1
11 12(1). Japan (By area) (JPY 1M) 2, Revenue (JPY 1M) 2 Operating profit 1,5 15 1, FY16 FY17 FY18 (Unit: JPY 1 million) FY216 FY217 FY218 Revenue 1,774 1,758 1,795 YoY (1.4)% (.9)% +2.1% Operating profit Operating margin +8.4% +8.5% +8.5% YoY ー +.7% +2.3% FY16 FY17 FY18 12(2). ASIA (By area) (JPY 1M) In FY217, income decreased for emulsified and fermented products mainly due to high raw material prices but overall income increased thanks to firm chocolate sales and sales growth for high value-added soy products. In FY218, income from fats and oils will decline due to higher energy costs and increased operating expenses but we forecast overall income to increase thanks to improved profitability for confectionary and bakery ingredients as well as increased income on sales growth for high valueadded soy products. Revenue (JPY 1M) 6 FY16 FY17 FY18 FY16 FY17 FY18 (Unit: JPY 1 million) FY216 FY217 FY218 Revenue YoY (6.6)% +15.4% +13.8% Operating profit Operating margin +8.9% +8.3% +7.7% YoY ー +7.6% +5.6% Operating profit In FY217, income decreased in China despite higher sales volume for filings due to high raw materials prices. Lower sales volume for soy protein ingredients also resulted in decreased income but overall income increased thanks to higher profits in Southeast Asia due to food ingredients, which benefitted from market price factors. In FY218, we forecast China will record increased income thanks to sales growth for high valueadded soy products and stronger sales for filings, etc. In Southeast Asia, we forecast higher income thanks to increased sales of hard butters for chocolate despite decreased income from confectionary and bakery ingredients due to market price factors. 11
12 12(3).Americas (By area) (JPY 1M) Revenue FY16 FY17 FY18 (JPY 1M) 4 (Unit: JPY 1 million) FY216 FY217 FY218 Revenue YoY +32.8% +13.3% +7.3% Operating profit Operating margin +5.1% +7.3% +6.8% YoY ー +62.% +.% Operaitng profit FY16 FY17 FY18 In FY217, income increased thanks to sales growth for low trans fat palm oil in North America and improved profitability for chocolate in South America. In FY218, we worked to maintain profitability in North America but are forecasting lower income. In South America, income will increase on the recovery of sales volume for chocolate. Overall, we forecast income will be largely unchanged. 12(4).Europe (By area) (JPY 1M) 3 Revenue (JPY 1M) 12 Operaitng profit FY16 FY17 FY18 FY16 FY17 FY18 (Unit: JPY 1 million) FY216 FY217 FY218 Revenue YoY +.1% +15.% (4.1)% Operating profit Operating margin +4.1% +1.8% +4.2% YoY ー (49.8)% % In FY217, sales of hard butters for chocolate and oils and fats for filings were favorable but income decreased due to the impact of high raw materials prices. For FY218, we forecast increased income on improved profitability thanks to no longer being impacted by the high raw materials prices seen during the previous fiscal year. 12
13 13.Capital expenditures, depreciation expenses history (Unit:JPY 1 million) 25, 2, Capital expenditures (consolidated) Depreciation expenses (consolidated) 2, 15, 1, 11,156 9,397 9,239 8,799 8,432 8,58 8,319 8,232 15,347 13,611 14,698 9,26 9,593 9,995 11,36 5, 9,37 7,793 7,599 6,185 6,5 6, FY 217 Capital expenditures JPY 14.7 billion Major expenditures New production plant for Chinese Filling and Margarine JPY 1.3 billion Increase production capacity for Chinese filling etc. JPY.8 billion Increase production capacity for cream in Southeast Asia etc. JPY.8 billion Total depreciation expenses JPY 1 billion FY 218 Capital expenditures JPY 2 billion Major expenditures New production plant for Chinese Filling and Margarine JPY 3.7 billion new production plant for USA fats and oils JPY 3.2 billion Increase production capacity for Chinese water soluble soy polysaccharide JPY.9 billion Total depreciation expenses JPY Dividend history (Unit :JPY) 2nd half(left axis) (Unit :%) 6 1st half(left axis) Payout ratio(right axis) Unit:JPY FY8 FY9 FY1 FY11 FY12 FY13 FY14 FY15 FY16 FY17 FY18 1st half nd half Payout 19.% 19.2% 21.1% 24.9% 25.8% 27.4% 27.6% 32.6% 31.2% 3.% 3.7% ratio Total FY8 FY9 FY1 FY11 FY12 FY13 FY14 FY15 FY16 FY17 FY

14 15. Medium-Term Business Plan Progress Basic Strategy Basic policy 1Core competence enhancement 2Growth of soy business 3Functional high-value added products business development 4Cost reductions and alignment with global standards FY216 FY217 FY218 FY22 target ROE 8.3% 8.8% 8.8% ー 1.% Net sales margin ratio 4.1% 4.5% 4.3% ー Approx. 5.% Total return on asset 17.5% 113.1% 118.3% ー Approx. 115% financial leverage 1.8x 1.7x 1.7x ー Approx. 1.8x EPS EPS 14.8 yen yen 163. yen EPS growth rate 31.2% 13.5% 1.9% Operating profit 19,694 2,481 21,3 Operating profit growth rate 16.9% 4.% 4.% Payout ratio 31.2% 3.% 3.7% ー Operating cash flow year total billion billion billion 58.4 billion CCC 11 days 13 days 1 days ー Account receivable 74 days 76 days 73 days ー Wholsesale assets 65 days 57 days 56 days ー Trade payable 29 days 3 days 29 days ー Capital expenditure M&A 16. Topics April 217 May 217 July 217 August 217 September 217 November 217 december 217 February 218 March billion 14.7 billion 2. billion 2 year total Drafted the Fuji Oil Group Human Rights Policy Acquired UTZ Certification cacao program Listed to MSCI Japan Empowering Women Index (WIN) Listed to MSCI Japan ESG Select Leaders Index Provided support for July 217 Northern Kyushu Rain Damage Concluded Comprehensive Partnership Agreement with Osaka Prefectural Government Acquired Platinum Kurumin Mark Shokuiku Project awarded 11th Kid's Design Award Transferred Ishikawa Sunny Foods Co., Ltd. shares to Sagamiya Foods Co, Ltd. Received IR Special Award from the JIRA Agreed to establish UNITED PLANTATIONS BHD Received Osaka Stop Global Warming Award Special Prize Opened office in Dubai 2 year CAGR 7.6% 2 year CAGR 4.% Listed to Health and Productivity Management 5 for Major Corporations Category (White 5) Passed resolution to establish Fuji Oil New Orleans, LLC CAGR 8% Operating profit CAGR 6% Payout ratio 3-4% 4year cumulative CF 1billion 1 day contraction 4 year total of about 6-7billion yen assurances of 5 billion yen infunding 14
Q1/FY2017 Supplemental IR information
 Q1/FY2017 Supplemental IR information (FYE March 2018) August 7, 2017 FUJI OIL HOLDINGS INC. Table of Contents 1 Q1/FY2017 profit and loss summary 3 2 Q1/FY2017 Key points of financial accounting 3 3 Q1/FY2017
Bando Chemical Industries, Ltd.
 Consolidated Business Results for the First Half of Fiscal 2011 November 4, 2011 Bando Chemical Industries, Ltd. 0 First Half Financial Summary for the Fiscal Year Ending March 31, 2012 1 (1)Settlement
Consolidated Financial Results for the Third Quarter of the Fiscal Year Ending March 31, 2019 [Based on Japanese GAAP] February 7, 2019
![Consolidated Financial Results for the Third Quarter of the Fiscal Year Ending March 31, 2019 [Based on Japanese GAAP] February 7, 2019](/thumbs/95/123620564.jpg "Consolidated Financial Results for the Third Quarter of the Fiscal Year Ending March 31, 2019 [Based on Japanese GAAP] February 7, 2019") Consolidated Financial Results for the Third Quarter of the Fiscal Year Ending March 31, 2019 [Based on Japanese GAAP] February 7, 2019 Name of Listed Company: Meiji Holdings Co., Ltd. Listed exchange:
Consolidated Financial Results for the Third Quarter of the Fiscal Year Ending March 31, 2019 [Based on Japanese GAAP] February 7, 2019 Name of Listed Company: Meiji Holdings Co., Ltd. Listed exchange:
Consolidated Financial Results for FY3/2017 (Japanese GAAP)
") Translation Consolidated Financial Results for (Japanese GAAP) May 10, 2017 Company name: The Nisshin OilliO Group, Ltd. Stock exchange listing: Tokyo (First Section) Stock code: 2602 URL: http://www.nisshin-oillio.com/english/index.shtml
Translation Consolidated Financial Results for (Japanese GAAP) May 10, 2017 Company name: The Nisshin OilliO Group, Ltd. Stock exchange listing: Tokyo (First Section) Stock code: 2602 URL: http://www.nisshin-oillio.com/english/index.shtml
Consolidated Financial Report for FY2000 Half-Year (April 1, 2000 September 30, 2000)
") Consolidated Financial Report for FY2000 Half-Year (April 1, 2000 September 30, 2000) October 26, 2000 Fuji Electric Co., Ltd. Summary of Consolidated Financial Results 1. Summary of consolidated statements
Consolidated Financial Report for FY2000 Half-Year (April 1, 2000 September 30, 2000) October 26, 2000 Fuji Electric Co., Ltd. Summary of Consolidated Financial Results 1. Summary of consolidated statements
Annual Review President s Message. Takahisa Kuno President and Representative Director. The Nisshin OilliO Group, Ltd.
 President s Message The Nisshin OilliO Group, Ltd. Annual Review 217 1 Annual Review 217 The Nisshin OilliO Group, Ltd. I m Takahisa Kuno, the newly appointed President and Representative Director of The
Consolidated Business Results For the Fiscal Year Ending March 31, 2012 Bando Chemical Industries, Ltd.
 Consolidated Business Results For the Fiscal Year Ending March 31, 2012 Bando Chemical Industries, Ltd. Financial Summary Fiscal Year Ending March 31, 2012 (1)Settlement of Accounts The production rates
FY4/14 Results Briefing
 Results Briefing June 5,2014 Result Overview 1 Consolidated P/L The Group reported net sales of 170,225 million, an increase of 10.1% year on year, reflecting the opening of new dispensing pharmacies and
Summary of Consolidated Financial Results (Japanese Accounting Standards) for the Fiscal Year Ended March 31, 2018
 for the Fiscal Year Ended March 31, 2018") [Notes of caution] This document is an English translation of the Japanese original. In the event of any differences or inconsistencies between the Japanese and English versions, the Japanese language
[Notes of caution] This document is an English translation of the Japanese original. In the event of any differences or inconsistencies between the Japanese and English versions, the Japanese language
Consolidated Financial Results for the Second Quarter of the Fiscal Year Ending March 31, 2019 [Based on Japanese GAAP] November 7, 2018
![Consolidated Financial Results for the Second Quarter of the Fiscal Year Ending March 31, 2019 [Based on Japanese GAAP] November 7, 2018](/thumbs/89/100988498.jpg "Consolidated Financial Results for the Second Quarter of the Fiscal Year Ending March 31, 2019 [Based on Japanese GAAP] November 7, 2018") Consolidated Financial Results for the Second Quarter of the Fiscal Year Ending March 31, 2019 [Based on Japanese GAAP] November 7, 2018 Name of Listed Company: Meiji Holdings Co., Ltd. Listed exchange:
Consolidated Financial Results for the Second Quarter of the Fiscal Year Ending March 31, 2019 [Based on Japanese GAAP] November 7, 2018 Name of Listed Company: Meiji Holdings Co., Ltd. Listed exchange:
FY3/2018 Financial Results Presentation. May 21, 2018 The Nisshin OilliO Group, Ltd.
 1 Financial Results Presentation May 21, 2018 The Nisshin OilliO Group, Ltd. 2 Summary of Financial Results for Kenji Matsuura General Manager, Financial Department 3 Summary of Consolidated Financial
Financial Highlights
 Financial Highlights 1. INFORMATION OF EPS Corporation & CONSOLIDATED SUBSIDIARIES 2014.09 (2013.10.1-2014.9.30) (1) CONSOLIDATED OPERATING RESULTS Net sales Operating Income Ordinary Income Net Income
Financial Highlights
 Financial Highlights 1. INFORMATION OF EPS Co,Ltd & CONSOLIDATED SUBSIDIARIES 2013.09 (2012.10.1-2013.9.30) (1) CONSOLIDATED OPERATING RESULTS Net sales Operating Income Ordinary Income Net Income 37,584
IR PRESENTATION June 2015
 IR PRESENTATION June 2015 Results Overview 1 Consolidated P/L For the fiscal year under the review, the Group reported net sales of 187,904 million, an increase of 10.4% year on year, reflecting the opening
FY nd QTR Consolidated Financial Result Overview. Oct. 30 th, 2017 Nobuhiko Komeya President
 2 nd QTR Consolidated Financial Result Overview The earnings projections and other forward-looking statements herein are based on certain assumptions made in light of the information currently available
SUMMARY OF CONSOLIDATED FINANCIAL STATEMENTS FOR THE SECOND QUARTER OF THE FISCAL YEAR ENDING NOVEMBER 30, 2015 [JAPAN GAAP]
![SUMMARY OF CONSOLIDATED FINANCIAL STATEMENTS FOR THE SECOND QUARTER OF THE FISCAL YEAR ENDING NOVEMBER 30, 2015 [JAPAN GAAP]](/thumbs/93/114398783.jpg "SUMMARY OF CONSOLIDATED FINANCIAL STATEMENTS FOR THE SECOND QUARTER OF THE FISCAL YEAR ENDING NOVEMBER 30, 2015 [JAPAN GAAP]") SUMMARY OF CONSOLIDATED FINANCIAL STATEMENTS FOR THE SECOND QUARTER OF THE FISCAL YEAR ENDING NOVEMBER 30, [JAPAN GAAP] July 1, Listed company name: Kewpie Corporation Listed exchange: Tokyo Stock Exchange
SUMMARY OF CONSOLIDATED FINANCIAL STATEMENTS FOR THE SECOND QUARTER OF THE FISCAL YEAR ENDING NOVEMBER 30, [JAPAN GAAP] July 1, Listed company name: Kewpie Corporation Listed exchange: Tokyo Stock Exchange
3Q FY2016 Financial Results
 3Q Financial Results Fujikura Ltd. February 2, 2017 1 Contents 1. Review of 3Q Financial Results and Forecasts 2. By Segment 3. Shareholder Return 1. Review of 3Q Financial Results and Forecasts 2 3Q Financial
Summary of Consolidated Financial Statements for the Third Quarter of the Fiscal Year Ending November 30, 2017 [JAPAN GAAP]
![Summary of Consolidated Financial Statements for the Third Quarter of the Fiscal Year Ending November 30, 2017 [JAPAN GAAP]](/thumbs/84/89328856.jpg "Summary of Consolidated Financial Statements for the Third Quarter of the Fiscal Year Ending November 30, 2017 [JAPAN GAAP]") Summary of Consolidated Financial Statements for the Third Quarter of the Fiscal Year Ending November 30, [JAPAN GAAP] October 2, Listed company name: Kewpie Corporation Listed exchange: Tokyo Stock Exchange
Summary of Consolidated Financial Statements for the Third Quarter of the Fiscal Year Ending November 30, [JAPAN GAAP] October 2, Listed company name: Kewpie Corporation Listed exchange: Tokyo Stock Exchange
For the Fiscal Year Ending March 31, Bando Chemical Industries, Ltd.
 Consolidated Business Results For the Fiscal Year Ending March 31, 2011 Bando Chemical Industries, Ltd. Financial Summary Fiscal Year Ending March 31, 2011 (1)Settlement of Accounts There was an overall
FY4/13 Results Briefing
 Results Briefing June 5,2013 Results Overview 1 Consolidated P/L The Group reported net sales of 154,560 million, an increase of 8.2% year on year due to the opening of 83 stores including M&A. However,
Financial Results FY2014 2Q. Benefit One Inc. Listed on second section of TSE (2412) November 6,
 November 6,") FY2014 2Q Financial Results Benefit One Inc. Listed on second section of TSE (2412) November 6, 2014 http://www.benefit-one.co.jp Financial Highlights for FY2014 2Q (year-to-date) Sales 9.93 billion yen
FY2014 2Q Financial Results Benefit One Inc. Listed on second section of TSE (2412) November 6, 2014 http://www.benefit-one.co.jp Financial Highlights for FY2014 2Q (year-to-date) Sales 9.93 billion yen
Junichi Anabuki. Yokogawa Electric Corporation Financial Results for 3rd Quarter of Fiscal Year February 7, 2017
 Yokogawa Electric Corporation Financial Results for 3rd Quarter of Fiscal Year 2016 February 7, 2017 Junichi Anabuki Director, Senior Vice President Accounting & Treasury Headquarters - 0 - Contents 1.
Summary of Consolidated Financial Results of Taiheiyo Cement Corporation for the Fiscal 2016 Ended March 31, 2016 May 12, 2016
 Summary of Consolidated Financial Results of Taiheiyo Cement Corporation for the Fiscal 2016 Ended March 31, 2016 May 12, 2016 Company: Taiheiyo Cement Corporation Fiscal 2015: April 1, 2014-March 31,
Consolidated Results Presentation for FY2018 Ended December 31, 2018 EBARA (6361) February 14, 2019
 February 14, 2019") Consolidated Presentation for Ended December 31, 2018 EBARA (6361) February 14, 2019 1. Summary of Executive Officer Responsible for Finance & Accounting Akihiko Nagamine 2.Projection for 3.Progress of
Consolidated Presentation for Ended December 31, 2018 EBARA (6361) February 14, 2019 1. Summary of Executive Officer Responsible for Finance & Accounting Akihiko Nagamine 2.Projection for 3.Progress of
Summary of Consolidated Financial Results of Sumitomo Osaka Cement Co., Ltd. for the Fiscal 2012, Ending March 31, 2012(Japan GAAP) May 11, 2012
 May 11, 2012") Company: Sumitomo Osaka Cement Co., Ltd. Fiscal 2011 : April 1, 2010-March 31, 2011 Stock code: 5232 Fiscal 2012 : April 1, 2011-March 31, 2012 URL: http://www.soc.co.jp/ *Figures are rounded down to the
Company: Sumitomo Osaka Cement Co., Ltd. Fiscal 2011 : April 1, 2010-March 31, 2011 Stock code: 5232 Fiscal 2012 : April 1, 2011-March 31, 2012 URL: http://www.soc.co.jp/ *Figures are rounded down to the
Taiyo Holdings / 4626
 COVERAGE INITIATED ON: 2017.12.08 Shared Research Inc. has produced this report by request from the company discussed in the report. The aim is to provide an owner s manual to investors. We at Shared Research
Consolidated Financial Results for 1H FY2017
 Consolidated Financial Results for 1H FY2017 October 27, 2017 Fuji Electric Co., Ltd. 2017Fuji Electric Co., Ltd. All rights reserved. 1 Summary of Consolidated Financial Results for 1H FY2017 (YoY Comparison)
Quarterly consolidated financial statements
 Quarterly consolidated financial statements (First Quarter of Fiscal Year 2011) Takasago International Corporation Accounting Period Period 1. (Changes in Principle Financial Data) 85 th Year (2011) 1
Summary of Consolidated Financial Results of Taiheiyo Cement Corporation for the Fiscal 2018 Ended March 31, 2018 May 10, 2018
 Summary of Consolidated Financial Results of Taiheiyo Cement Corporation for the Fiscal 2018 Ended March 31, 2018 May 10, 2018 Company: Taiheiyo Cement Corporation Fiscal 2017: April 1, 2016-March 31,
Full Year Results 2014/15. Analysts Conference November 4, 2015
 Full Year Results 2014/15 Cautionary note Certain statements in this presentation regarding the business of Barry Callebaut are of a forwardlooking nature and are therefore based on management s current
- supplement 1 - FY2017 Consolidated Financial Results Highlight. Summary of Statement of Profit or Loss. Reference data
 FY2017 Consolidated Financial Results Highlight Summary of Statement of Profit or Loss Revenue 2,084.9 1,706.9 378.0 22.1% Domestic Business 1,072.2 1,058.2 14.0 1.3% Overseas Business 517.2 222.9 294.3
Business Report for Q1 FY ending March 31, 2019 (April-June 2018)
") Business Report for Q1 FY ending March 31, 2019 (April-June 2018) Wacom Chapter 2 Wacom Co., Ltd. (TSE 1st Sec. Code: 6727) Q1 FY 03/19 Results Overview Consolidated net sales of JPY 17.9 bn (YOY +12%)
Business Report for Q1 FY ending March 31, 2019 (April-June 2018) Wacom Chapter 2 Wacom Co., Ltd. (TSE 1st Sec. Code: 6727) Q1 FY 03/19 Results Overview Consolidated net sales of JPY 17.9 bn (YOY +12%)
2: The supplied housing business contributed to earnings. The Company s sound supplied stocks bolstered its performance.
 Sekisui House, Ltd. Third Quarter of (February 1, through October 31, ) Summary of Consolidated Financial Results 1. Topics in the Third Quarter 2. Overview 3. Segment Information 1. Sales and Orders 2.
FY2011 Consolidated Financial Results (Japan GAAP)
") Consolidated Financial Results (Japan GAAP) (April 1, 2010 through March 31, 2011) English Translation of the Original Japanese-Language Document May 11, 2011 Company name : ISUZU MOTORS LIMITED Stock
Consolidated Financial Results (Japan GAAP) (April 1, 2010 through March 31, 2011) English Translation of the Original Japanese-Language Document May 11, 2011 Company name : ISUZU MOTORS LIMITED Stock
Earning Presentation
 Earning Presentation for the Year ended March 31, 2018 May 11, 2018 This presentation contains forward looking statements that are based on current expectations and assumptions. Actual results could differ
1st Quarter Financial Results for FYE June, 2015
 1st Quarter Financial Results for FYE June, 2015 November 14, 2014 (Securities code : 7747 2nd section of the Tokyo Stock Exchange, 2nd section of the Nagoya Stock Exchange) All Rights Reserved.Copyright
Overview of Earnings for Q2 FY2018
 Overview of Earnings for Q2 FY218 Your Exchange of Choice Japan Exchange Group, Inc. October 3, 218 Contents 1 Business Developments 2 Overview of Earnings for Q2 FY218 IFRS 3 Reference Materials I. Business
11-Year Consolidated Financial Highlights
 11-Year Consolidated Financial Highlights As of March 31, 2017 2007.3 2008.3 2009.3 2010.3 Net Sales ( million) 1,376,958 1,487,496 1,660,162 1,415,718 Operating Profit ( million) 162,315 70,048 65,204
Calbee Group Financial Results
 Calbee Group Financial Results First half of fiscal year ending March 31, 2018 April 1, 2017 September 30, 2017 TSE code : 2229 2017.10.30 One win, one draw... one loss Akira Matsumoto Chairman of the
FYE March 2019 First Quarter Financial Highlights
 FYE March 2019 First Quarter Financial Highlights NAGASE & CO., LTD. August 3, 2018 Agenda Consolidated Statements of Income 3 Net Sales by Region (Domestic, Overseas) 4 Net Sales: Two Year Comparison
Consolidated Financial Results for the Year Ended March 31, 2018
 Consolidated Financial Results for the Year Ended March 31, 2018 (All financial information has been prepared in accordance with Generally Accepted Accounting Principles in Japan) May 10, 2018 Company
Results for the Nine Months of Fiscal 2011: Supplementary Materials POLA ORBIS HOLDINGS INC. DIRECTOR OF FINANCE/MANAGEMENT PLANNING DIV.
 Results for the Nine Months of Fiscal 2011: Supplementary Materials POLA ORBIS HOLDINGS INC. DIRECTOR OF FINANCE/MANAGEMENT PLANNING DIV. Naoki Kume This report contains projections of performance and
Consolidated Financial Statements for the Fiscal Year Ended March 31, 2018
 Consolidated Financial Statements for the Fiscal Year Ended April 1, 2017 to This document has been translated from the original Japanese as a guide for non-japanese investors. It contains forward-looking
for FYE June, 2010 February 17, 2010 (Securities code : 7747
 2nd Quarter Financial Results for FYE June, 21 February 17, 21 (Securities code : 7747 2nd section of the Tokyo Stock Exchange, 2nd section of the Nagoya Stock Exchange, JASDAQ) All Rights Reserved.Copyright
of dividends payment:
 Financial Results Summary for the Second Quarter of the Fiscal Year Ended March 31, 2017 [Japan GAAP] (Consolidated) October 28, 2016 Company Name Tabuchi Electric Co., Ltd. Exchange listed on: Tokyo Stock
PUNCH INDUSTRY (6165)
") URL: www.walden.co.jp Written by Yoshiyuki Muroya / Yusuke Maeda E-mail: info@walden.co.jp Phone +81 3 3553 3769 PUNCH INDUSTRY (6165) Consolidated Fiscal Year Operating Recurring Profit Attributable to
URL: www.walden.co.jp Written by Yoshiyuki Muroya / Yusuke Maeda E-mail: info@walden.co.jp Phone +81 3 3553 3769 PUNCH INDUSTRY (6165) Consolidated Fiscal Year Operating Recurring Profit Attributable to
Financial Results of the 2nd Quarter for Fiscal Year ending June 2018
 Financial Results of the 2nd Quarter for Fiscal Year ending June 2018 February 14, 2018 (Securities code: 7747 Second Section of the Tokyo Stock Exchange, Second Section of the Nagoya Stock Exchange) All
Financial Results for the Quarter ended June 30, 2017
 Financial Results for the Quarter ended June 30, 2017 KITO CORPORATION TSE 1st Section: 6409 August 9, 2017 1 FY2017 Q1 Summary 1. Market Environment There remains uncertainty due to current political
Financial Results Presentation for Fiscal 2012 Year Ended March 31, May 16, 2013 The Nisshin OilliO Group, Ltd.
 Financial Results Presentation for Fiscal 2012 Year Ended March 31, 2013 May 16, 2013 The Nisshin OilliO Group, Ltd. 1 Summary of Financial Results for Fiscal 2012 and Financial Forecasts for Fiscal 2013
Performance Summary. Copyright 2018 Harmonic Drive Systems Inc.
 Performance Summary 2 1st-half consolidated results (versus original forecasts for the period) Original forecasts (announced May 11) 1st-half FY ending Mar.31,2019 Vs. original forecasts for the period
Consolidated Financial Results for the 2nd Quarter of Fiscal Year Ending March 31, 2019 (J-GAAP)
") Consolidated Financial Results for the 2nd Quarter of Fiscal Year Ending March 31, 2019 (J-GAAP) November 5, 2018 Company name: T.RAD Co., Ltd. Listing: Tokyo Stock Exchange, First Section Code No.: 7236
Consolidated Financial Results for the 2nd Quarter of Fiscal Year Ending March 31, 2019 (J-GAAP) November 5, 2018 Company name: T.RAD Co., Ltd. Listing: Tokyo Stock Exchange, First Section Code No.: 7236
Bando Chemical Industries, Ltd.
 Consolidated Business Results for the Fiscal Year Ending March 31, 217 Bando Chemical Industries, Ltd. May 12, 217 Ⅰ. Financial summary for the fiscal year ending March 31, 217 Ⅱ. Business forecast for
Financial Results for FY May 12, 2011
 Energy and Environment in Harmony Courtesy of Qatargas Operating Company Limited Financial Results for FY 2010 The Fiscal Year Ended March 31, 2011 May 12, 2011 1. Financial Data 11/3 10/3 Difference Difference
Consolidated Financial Results for the 3rd Quarter of Fiscal 2017 and Full-Year Forecasts
 Consolidated Financial Results for the 3rd Quarter of Fiscal 2017 and Full-Year Forecasts Yasuo Takeuchi Director, Vice President and CFO Olympus Corporation February 2, 2017 Highlights Consolidated: Performance
Honda Motor Co., Ltd.
 2014 2nd 年度 Quarter 第 2 四半期 Financial 決算説明会 Results Honda Motor Co., Ltd. October 28, 2014 CR-V (North America) 1 Topics - 2nd Quarter Financial Results - Financial - Dividend Tetsuo Iwamura Executive
Consolidated Financial Results for the Second Quarter of the Fiscal Year Ending March 31, 2018 [Based on Japanese GAAP] November 8, 2017
![Consolidated Financial Results for the Second Quarter of the Fiscal Year Ending March 31, 2018 [Based on Japanese GAAP] November 8, 2017](/thumbs/75/72665245.jpg "Consolidated Financial Results for the Second Quarter of the Fiscal Year Ending March 31, 2018 [Based on Japanese GAAP] November 8, 2017") Consolidated Financial Results for the Second Quarter of the Fiscal Year Ending March 31, 2018 [Based on Japanese GAAP] November 8, 2017 Name of Listed Company: Meiji Holdings Co., Ltd. Listed exchange:
Consolidated Financial Results for the Second Quarter of the Fiscal Year Ending March 31, 2018 [Based on Japanese GAAP] November 8, 2017 Name of Listed Company: Meiji Holdings Co., Ltd. Listed exchange:
JFE Holdings Financial Results for Fiscal Year 2017 ended March 31, 2018
 JFE Holdings Financial Results for Fiscal Year 2017 ended March 31, 2018 All financial information has been prepared in accordance with generally accepted accounting principles in Japan. (Note: The following
Asahi Group Holdings, Ltd.
 Asahi Group Holdings, Ltd. FY2015 Financial Results NOTE: All information has been prepared in accordance with generally accepted accounting principles in Japan. Amounts shown in this accounting report
OKADA AIYON (6294) Growth by Maturity
 Growth by Maturity") URL: www.walden.co.jp Written by Yoshiyuki Muroya / Yusuke Maeda E-mail: info@walden.co.jp Phone +81 3 3553 3769 OKADA AIYON (6294) Consolidated Fiscal Year Operating Recurring Profit Attributable to EPS
URL: www.walden.co.jp Written by Yoshiyuki Muroya / Yusuke Maeda E-mail: info@walden.co.jp Phone +81 3 3553 3769 OKADA AIYON (6294) Consolidated Fiscal Year Operating Recurring Profit Attributable to EPS
Summary of Consolidated Financial Statements for Second Quarter of Fiscal Year Ending March 31, 2018(Japan GAAP)
") Summary of Consolidated Financial Statements for Second Quarter of Fiscal Year Ending March 31, 2018(Japan GAAP) November 10, 2017 Listed Exchanges: TSE Name of Listed Company: Ishihara Sangyo Kaisha,
Summary of Consolidated Financial Statements for Second Quarter of Fiscal Year Ending March 31, 2018(Japan GAAP) November 10, 2017 Listed Exchanges: TSE Name of Listed Company: Ishihara Sangyo Kaisha,
Sumitomo Heavy Industries, Ltd.
 Sumitomo Heavy Industries, Ltd. CONSOLIDATED FINANCIAL REPORT For the ended March 31, 2008 All financial information has been prepared in accordance with generally accepted accounting principles in Japan.
Summary of Consolidated Financial Statements for the Fiscal Year Ended December 31, 2018 (IFRS)
") Summary of Consolidated Financial Statements for the Fiscal Year Ended December 31, 2018 (IFRS) February 8, 2019 Name of listed company: Nabtesco Corporation Stock listed on: First Section of the Tokyo
Summary of Consolidated Financial Statements for the Fiscal Year Ended December 31, 2018 (IFRS) February 8, 2019 Name of listed company: Nabtesco Corporation Stock listed on: First Section of the Tokyo
:
 Financial Results for (April 1, 2008 through March 31, 2009) English Translation of the Original Japanese-Language Document May 11, 2009 Company name : ISUZU MOTORS LIMITED Stock exchange on which the
Olympus Group Financial Results for the 2nd Quarter of the Fiscal Year Ending March 31, 2015
 Olympus Group Financial Results for the 2nd Quarter of the Fiscal Year Ending March 31, 2015 Hiroyuki Sasa President and Representative Director Olympus Corporation November 7, 2014 2Q of Fiscal 2015 Consolidated
Consolidated Financial Results of Fiscal Year 2017
 Consolidated Financial Results of Fiscal Year 2017 Company name: DISCO Corporation Stock code number: 6146 (Tokyo Stock Exchange 1st Section) URL: http://www.disco.co.jp Telephone number: 81-3-4590-1099
August 11, 2014 Consolidated Cumulative 2nd quarter Financial Results for the Fiscal Year Ended December 31, 2014 (January 1, 2014 to June 30, 2014)
") August 11, 2014 Consolidated Cumulative 2nd quarter Financial Results for the Fiscal Year Ended December 31, 2014 (January 1, 2014 to June 30, 2014) Company name: SIIX Corporation Stock code: 7613 Stock
August 11, 2014 Consolidated Cumulative 2nd quarter Financial Results for the Fiscal Year Ended December 31, 2014 (January 1, 2014 to June 30, 2014) Company name: SIIX Corporation Stock code: 7613 Stock
Thai Union Group Public Company Limited
 2Q17: Strict cost control aided operation Revenue 2Q17 sales grew by 1.2 YoY to THB 34,818mn. Soft sales growth was driven by weak market demand amid product repricing and the European currency depreciation.
Consolidated Financial Results for 3Q FY2018
 Consolidated Financial Results for 3Q FY2018 February 1, 2019 Fuji Electric Co., Ltd. 2019 Fuji Electric Co., Ltd. All rights reserved. 1 Summary of Consolidated Financial Results for (Apr. - Dec.) FY2018
Outline of Consolidated Results for the Nine Months ended December 31, 2016 (April 1, 2016 to December 31, 2016)
") Outline of Consolidated Results for the ended December 31, 2016 (April 1, 2016 to December 31, 2016) 1. Operating Results ended December 31, 2016 Consolidated ended December 31, 2015 Year-on-year change
Outline of Consolidated Results for the ended December 31, 2016 (April 1, 2016 to December 31, 2016) 1. Operating Results ended December 31, 2016 Consolidated ended December 31, 2015 Year-on-year change
Financial Results for the year Ended March, 2015
 Financial Results for the year Ended March, 2015 FANUC CORPORATION The forecasts described in this report are subject to uncertain factors such as supply and demand trends, industry competition, economic
Summary of Consolidated Financial Statements for the Six Months (1 st Half) Ended September 30, 2018
 Ended September 30, 2018") Summary of Consolidated Financial Statements for the Six Months (1 st Half) Ended September 30, 2018 [Prepared under, UNAUDITED] November 7, 2018 NISSIN FOODS HOLDINGS CO., LTD. Stock code: 2897 Stock
Summary of Consolidated Financial Statements for the Six Months (1 st Half) Ended September 30, 2018 [Prepared under, UNAUDITED] November 7, 2018 NISSIN FOODS HOLDINGS CO., LTD. Stock code: 2897 Stock
Corporate Presentation
 Corporate Presentation 1Q14 Financial Results & Corporate Updates 28 May 214 Presented by: Mr. Brandon Tay, Managing Director IR Adviser AQUILAS CORPORATE UPDATE Industry Overview Cocoa ingredients prices
FY14 Financial Results
 Financial Results Honda Motor Co., Ltd. April 25, 2014 FIT (North America) 1 Topics - Financial Results - FY15 Financial Forecasts - Dividend Tetsuo Iwamura Executive Vice President 2 Outline of Results
(Note) Comprehensive income FYE3/14 2nd Qrtr 1,312 million yen (45.3%) FYE 3/13 2nd Qrtr 903 million yen (-%) Fully Diluted EPS
 Comprehensive income FYE3/14 2nd Qrtr 1,312 million yen (45.3%) FYE 3/13 2nd Qrtr 903 million yen (-%) Fully Diluted EPS") en-japan inc. 2nd Quarter FY March 2014 Earnings Announcement [Japan GAAP] (Consolidated) November 12, 2013 Company Name en-japan inc. Listing Exchanges Tokyo Stock Exchange (Jasdaq Market) Stock Code
en-japan inc. 2nd Quarter FY March 2014 Earnings Announcement [Japan GAAP] (Consolidated) November 12, 2013 Company Name en-japan inc. Listing Exchanges Tokyo Stock Exchange (Jasdaq Market) Stock Code
en-japan inc. 4th Quarter FY March 2012 Earnings Announcement [Japan GAAP] (Consolidated) February 9, 2012
![en-japan inc. 4th Quarter FY March 2012 Earnings Announcement [Japan GAAP] (Consolidated) February 9, 2012](/thumbs/89/98220506.jpg "en-japan inc. 4th Quarter FY March 2012 Earnings Announcement [Japan GAAP] (Consolidated) February 9, 2012") en-japan inc. 4th Quarter FY March 2012 Earnings Announcement [Japan GAAP] (Consolidated) February 9, 2012 Company Name en-japan inc. Listing Exchanges Osaka Securities Exchange (Jasdaq Market) Stock Code
en-japan inc. 4th Quarter FY March 2012 Earnings Announcement [Japan GAAP] (Consolidated) February 9, 2012 Company Name en-japan inc. Listing Exchanges Osaka Securities Exchange (Jasdaq Market) Stock Code
Net sales Operating profit Ordinary profit
 Consolidated Financial Statements Summary May 8, 2018 (For the year ended March 31, 2018) English translation from the original Japanese-language document (All financial information has been prepared in
Enhancing cash flow management and capital efficiency toward increased corporate value over the medium-to-long term
 FINANCIAL STRATEGY Message from the CFO Enhancing cash flow management and capital efficiency toward increased corporate value over the medium-to-long term Norio Tadakawa Corporate Executive Officer Chief
FUJI YAKUHIN CO., Ltd. Consolidated Financial Statements For the Year ended March 31,2017
 FUJI YAKUHIN CO., Ltd. Consolidated Financial Statements For the Year ended March 31,2017 CONSOLIDATED BALANCE SHEET As of March 31,2017 ASSETS Current assets: Cash and deposits 7,156 $ 63,792 Notes and
Consolidated Financial Results for the Second Quarter of Fiscal Year 2018
 October 30, 2018 Consolidated Financial Results for the Second Quarter of Fiscal Year 2018 Company name: DISCO Corporation Stock code number: 6146 (Tokyo Stock Exchange 1st Section) URL: http://www.disco.co.jp
Net income per Diluted net income. per share Millions of yen % Yen Yen 1Q Fiscal , Q Fiscal ,
 Disclaimer: This is a Japanese-English translation of the summary of financial statements of the company produced for your convenience. Since no auditor audited this report, officially only the Japanese
3Q FY2018 Financial Results. February 4, 2019
 3Q Financial February 4, 2019 1 Contents 1. Review of 3Q Financial and Forecast 2. By Segment 3. Shareholder Return 1. Review of 3Q Financial and Forecast 2 3Q Financial and Forecast (Unit : Yen in billion)
242, , , , , , , ,
 Summary of Consolidated Financial Results For the Third Quarter of the Fiscal Year Ending March 31, 2012 (Nine Months Ended December 31, 2011) February 3, 2012 Company name: Nippon Shokubai Co., Ltd. Listing:
Accounting Report for the Third Quarter of Fiscal Year Ending March 2018 (April 1, 2017 December 31, 2017)
") January 31, 2018 Company: Representative: Contact: JVCKENWOOD Corporation Takao Tsuji, Representative Director of the Board, President and CEO (Code: 6632; First Section of the Tokyo Stock Exchange) Masatoshi
January 31, 2018 Company: Representative: Contact: JVCKENWOOD Corporation Takao Tsuji, Representative Director of the Board, President and CEO (Code: 6632; First Section of the Tokyo Stock Exchange) Masatoshi
2005 full year results conference call
 2005 full year results conference call - February 2006 2005 full year results conference call 2 2005 full year results conference call - February 2006 2005: Delivering The Nestle Model: Improvement in
AAK s Interim Report Third quarter 2013
 Arne Frank CEO Peter Korsholm CFO Fredrik Nilsson Director Investor Relations AAK s Interim Report Third quarter 2 Agenda 2 Business area information AAK Acceleration Q & A 2 2 Volume MT 416 (385) + 8
Arne Frank, CEO Fredrik Nilsson, CFO. Interim report Third quarter 2015
 Arne Frank, CEO Fredrik Nilsson, CFO Interim report Third quarter 2015 Third quarter 2015 Business area information Agenda AAKtion Q & A 2 The Co-Development Company Third quarter 2015 Volume 000 MT 453
April 1, 2011 Barry Callebaut H1 2010/11 results presentation
 Half-Year Results 2010/11 Media presentation April 1, 2011 April 1, 2011 Barry Callebaut H1 2010/11 results presentation Cautionary note Certain statements in this presentation regarding the business of
Fredrik Nilsson, Chief Financial Officer. CFO update. The Co-Development Company
 Fredrik Nilsson, Chief Financial Officer CFO update Good progress in most of the focus areas 2018 Organic volume growth Higher than market Organic growth Higher growth than underlying markets Operating
Caution concerning Forward-Looking Statements Purpose of This Material and Cautionary Notes This material is prepared for the purpose of understanding
 (Reference Material) Voluntary Adoption of International Financial Reporting Standards(IFRS)from the fiscal year ended March 31,2012 Japan Tobacco Inc. Caution concerning Forward-Looking Statements Forward-Looking
Financial Overview. Leslie Varon
 Financial Overview Leslie Varon Xerox Investment Proposition Global Market Leader Attractive Market Opportunities Disciplined Operator Strong Annuity- Driven Cash Flow Sustainable Shareholder Returns Strong
Consolidated Financial Statements and Primary Notes
 Consolidated Financial Statements and Primary Notes (1) Consolidated Balance Sheet (As of March 31, 2017) Second Quarter of (As of Assets Current assets Cash and deposits 344,093 401,566 Notes and accounts
2Q Fiscal Year Ended March 31, 2019 Financial Results
 2Q Fiscal Year Ended March 1, 2019 Financial Results November 8, 2018 contents 1 Consolidated earnings results ( first six months of FYE March 2019) 2 Consolidated earnings forecast ( FYE March 2019 full
Interim Report Third Quarter 2018
 Johan Westman, CEO Fredrik Nilsson, CFO Interim Report Third Quarter 2018 Agenda 1 Third quarter 2018 2 Business area information 3 The AAK Way 4 Q&A 2 Highlights Q3 2018 HIGHLIGHTS GROWTH & RETURNS 2018
Yokogawa Electric Corporation Financial Results for 3rd Quarter of Fiscal Year 2017
 Yokogawa Electric Corporation Financial Results for 3rd Quarter of Fiscal Year 2017 February 6, 2018-0 - Contents 1. Financial Results for 3rd Quarter of Fiscal Year 2017 Junichi Anabuki Director, Senior
mil. Yen % mil. Yen % mil. Yen % mil. Yen %
 FY2012 Financial Results Outline (Consolidated Base) (Based on Generally Accepted Accounting Principles in Japan) (Translated from the Original Japanese Document) May 11, 2012 Company Name: Uniden Corporation
Accounting Report for the First Half of Fiscal Year Ending March 2018 (April 1, 2017 September 30, 2017)
") October 31, 2017 Company: Representative: Contact: JVCKENWOOD Corporation Takao Tsuji, Representative Director of the Board, President and CEO (Code: 6632; First Section of the Tokyo Stock Exchange) Masatoshi
October 31, 2017 Company: Representative: Contact: JVCKENWOOD Corporation Takao Tsuji, Representative Director of the Board, President and CEO (Code: 6632; First Section of the Tokyo Stock Exchange) Masatoshi
Consolidated Financial Summary Second Quarter of FY2015
 Consolidated Financial Summary Second Quarter of FY2015 (April 1, 2014 September 30, 2014) This document is an English translation of the Japanese language version of the consolidated financial summary
Summary of Consolidated Financial Statements for the Fiscal Year Ended March 31, 2018
 May 10, 2018 Summary of Consolidated Financial Statements for the Fiscal Year Ended March 31, 2018 [Prepared under Japanese GAAP, UNAUDITED] NISSIN FOODS HOLDINGS CO., LTD. Stock code: 2897 Stock exchange
Managing Director, Administrative Office
 en-japan inc. 3rd Quarter FY December 2010 Earnings Announcement [Japan GAAP] (Consolidated) November 10, 2010 Company Name en-japan inc. Listing Exchanges Osaka Securities Exchange (Hercules Market) Stock
Financial Results for FY2010 (April 1, 2009 through March 31, 2010) English Translation of the Original Japanese-Language Document May 11, 2010
 English Translation of the Original Japanese-Language Document May 11, 2010") Financial Results for (April 1, 2009 through March 31, 2010) English Translation of the Original Japanese-Language Document May 11, 2010 Company name : ISUZU MOTORS LIMITED Stock exchange on which the
Financial Results for (April 1, 2009 through March 31, 2010) English Translation of the Original Japanese-Language Document May 11, 2010 Company name : ISUZU MOTORS LIMITED Stock exchange on which the