INDEX QUANTUM DYNAMIC BOND FUND - QDBF QUANTUM NIFTY ETF - Q NIFTY HOW TO READ THE FACTSHEET. November 2017
|
|
|
- Tobias Summers
- 5 years ago
- Views:
Transcription


1
2 INDEX CONTENTS PAGE NO QUANTUM DYNAMIC BOND FUND - QDBF QUANTUM NIFTY ETF - Q NIFTY HOW TO READ THE FACTSHEET

3 QUANTUM VIEW FOR NOVEMBER 2017 Equity Outlook Atul Kumar- Head - Equity Funds I n the month of, S&P BSE Sensex declined marginally by 0.15% on a total return basis. For the eleven months of 2017 so far, the index has gained 26.11%. S&P BSE Midcap index and S&P BSE Smallcap indices performed better than S&P BSE Sensex during the month with returns of 2.03% and 3.61% respectively. So far in calendar 2017, S&P BSE Midcap and S&P BSE Smallcap had fantastic run with 42.28% and 52.42% appreciation respectively. of BSE Sensex companies for fiscal 2018 is unlikely to be met. So far the investment cycle has not taken off, contrary to long held expectations. It is likely that capex cycle picks up in coming months supported by higher demand. Among other notable events for the past month was on GST (goods and services tax). GST rate was cut for 178 items which were attracting a higher slab earlier. Many of daily use products which were classified at luxury and hence attracted highest tax slab of 28% saw a decline. This is likely to benefit a number of companies, including FMCG ones. Government also simplified aspects of GST compliance, which was earlier quite Consumer durables, real estate and IT were among sectors onerous for many small enterprises. which performed well during the month. Metal, oil & gas and Moody's, a global rating agency, upgraded the rating of healthcare were among the sectors that underperformed during India from Baa3 to Baa2. This came at a time when the the month. Healthcare firms faced scrutiny from US regulators macroeconomic environment was going through some stress which could impact their future business. as compared to good times witnessed earlier. Inflation has FIIs turned big buyers of equity in November to the tune of USD 2.95 Bn. This boosted their tally for calendar 2017; FIIs have invested USD 8.75 Bn in Indian equities during 11 months. Domestic institutions continued to pour money in equities given higher retail money coming in their corpus. DIIs invested USD 1.4 Bn for the month and USD 12.8 Bn for 2017 so far. Of the monthly purchase by DIIs, USD 1.6 Bn came from mutual funds while insurers were net sellers for USD 220 Mn. Market Performance at a Glance Market Returns % * January-November S&P BSE SENSEX ** S&P BSE MIDCAP ** S&P BSE SMALL CAP ** BEST PERFORMER SECTORS Consumer durables, real estate and IT LAGGARD SECTORS Metal, oil & gas and healthcare * On Total Return Basis ** Source-Bloomberg been on rise, fiscal slippage looks possible as well as there can be higher trade deficit given strength in crude oil prices. Moody's cited progress on GST, recent measures to handle banking sector NPAs, and Aadhaar's potential to reduce government subsidies as reasons for upgrade. Barring a few sectors, valuation of stocks seems to be at high levels. While share prices have run up, earning of companies haven't caught up. High level of liquidity globally has driven up stock prices. Over the long term, we remain optimistic on Indian equities. India is likely to grow faster than many nations. Investors can expect decent return from equities over a long period in future. Valuations, however, leave moderate upside in the near term. Cash level in our schemes remain higher than historic average, as there are very few buy ideas. Investors at this point should continue SIPs but refrain from taking large fresh position in equities. Data Source: Bloomberg Global economic growth has picked up in recent times. US has been in the process of increasing interest rates given better Debt Outlook growth and low unemployment. Growth has been picking up in Pankaj Pathak - Fund Manager - Fixed Income Europe as well. However, Euro zone as well as Japan continue to follow loose monetary policy. Any sharp rise in interest rates in he negative sentiment which had clouded the bond developed markets is likely to affect asset prices in India market since August worsened in this month. The value of negatively. FIIs are likely to withdraw from emerging markets bonds continued to fall as yields (market interest rates) such as India and put that money in home markets where risk is rose for the fourth consecutive month, amid concerns over fiscal lower. deficit widening and inflation gaining pace. The bond market All the Indian listed companies completed announcement witnessed high volatility in the month with the yield (10 year of quarterly results for first half of fiscal Companies' benchmark bond) oscillating between 6.9% and 7.1%. Bonds profitability is on uptrend and growth witnessed is likely to rallied sharply (yields fell, prices rose) on India's rating upgrade continue. This comes after few years of stagnant corporate by Moody's and cancellation of OMO sale by RBI, but it could not profits. However, stock market participants continue to remain sustain the momentum and by the month end yields moved up overly optimistic. Their estimate of aprox 20% earnings growth by bps (100 basis points=1%) across the curve. The 10 year T QUANTUM VIEW 3

4 benchmark bond yield closed the month at 7.06% vs 6.86% in of increasing debt and maintained the India's rating at BBB-. October. The retail inflation continued the upward path as CPI rose to One of the major worries on investors mind is that 3.58% in October driven by higher food and fuel prices and government may miss its fiscal deficit target amid shortfall in adjustment of HRA hike on housing inflation. We expect that CPI revenue from RBI dividend, telecom auction sales and indirect inflation will move towards 4.5% by March 2018 and in base case tax collections. The fiscal deficit for the first seven months of likely to average around 4.2%-4.7% in FY2019. Rising crude oil FY2018 totaled INR 5.25 trillion which has already reached to prices have now added another risk to future inflation trajectory. 96.1% of the budgeted target. As per media reports government However considering the changing market dynamics in the is seeking additional dividend from RBI and also looking to raise sector, we do not expect any sustained rise in crude oil prices more than budgeted capital from disinvestments to fill the from here. On the positive side, government has reduced the revenue gap. We expect that Government may cut expenditures GST rates for few consumption items which will have some to meet the deficit target for this fiscal; however it may deviate sobering effect on inflation over the period. The liquidity surplus in banking system reduced significantly from the fiscal consolidation path next year to boost public in the month forcing the RBI to stop Open Market Operations spending before 2019 general elections. (selling government bonds in the market to suck out liquidity) The RBI continues to remain on hold and expects growth to and even to cancel one of the scheduled OMO sale. The liquidity recover in remaining of FY18. We found the RBI's statement to be surplus averaged around INR 720 billion in November as bit more balanced than the one in October where they appeared compared to average of INR 1.5 trillion in the previous month unduly concerned on inflation. Although, they increased the and INR 2.8 trillion average since April-October We expect inflation projection but have also highlighted factors which can the liquidity situation will become neutral by Q which will soften prices. We expect RBI to remain on long pause unless lead to some upward shift in short term rates. inflation trajectory changes materially. Outlook India's economic growth revived in the July-September In last four months the sovereign yield curve (yield for quarter as the negative effects of demonetization and GST various maturities of government bonds) has seen a sharp implementation started to fade. The GDP growth rebounded to steepening bias. The spread (difference in yields) of 10 year bond 6.3% in Q2FY18 defying the five consecutive quarters of slowing over 1 year bond has widened from 25 bps (0.25%) to 70 bps growth which saw it bottoming at 5.7% in Q1FY18. The disrupted (0.7%) and the spread over the current Repo rate of 6% has base could lead to higher growth numbers in second half but it widened above 100 bps (1.0%). At the current levels with most of may not be sufficient to meet the initial FY18 growth the bond yield curve above the 7% level and term spreads expectations. Government has implemented various structural (difference in yields of different maturities) at historical high reforms in last few years which have helped in improving India's levels, we believe that most of the adverse news is priced in the Ease of Doing Business rankings. We expect all these reform market. On the fiscal front, we would actually worry more about measures will add to economic growth over the medium term. the government's commitment to next year (FY 19) fiscal target Moodys Ratings upgraded India's sovereign bond rating and if the government increases the fiscal deficit target next year from Baa3 to Baa2. The rating change is a testament to a few then we would expect further increase in bond yields; however it things which have played out since 2012/13. The first is the may not materially alter the macroeconomic landscape. We government's commitment to fiscal consolidation. The Centre's expect that RBI will remain on a long pause on the Repo Rates but Fiscal Deficit has been reduced from 6% of GDP in 2012 to 3.5% of will remain cautious over risks to inflation over the next 3-4 GDP in They also credited the other reforms like Monetary quarters. Policy framework, direct benefit transfer, demonetization, GST and bank recapitalization for the upgrade. RBI's reforms on monetary policy by moving to inflation targeting, keeping positive real rates and boosting Forex Reserves has increased investor confidence and boosted macro stability. They do caution though on India's high Debt/GDP ratio which is actually likely to increase in the next 2 years on account of slower growth but also problem areas which have been fixed by bond issuances like Uday Bonds (Power distribution), Farm Loan waivers (potentially to be funded by issuance of bonds); Bank Re-cap (to be funded by bank recap bonds). So the actual Fiscal deficit in India is larger than it seems in reported numbers. The other rating agency Standard & Poor assigned higher weight to the risk 4 Source: Bloomberg,RBI Gold Outlook Chirag Mehta - Senior Fund Manager Alternative Investments G gold markets have evidently slipped into an extremely narrow trading range over the last two months. Some reports suggest that it's been the narrowest trading range over the last 12 years. This is usually a defining characteristic of markets near inflections points. Fundamentally, a weaker dollar, absence of wage and inflation growth in the U.S and mixed economic data provided bids under gold. Whereas, prospects for U.S. tax cuts and interest- rate hikes took some of QUANTUM VIEW
5 the luster off gold. Although gold came under increased selling pressure with the passage of the tax bill through Senate, gold ended the month with marginal gains of 0.3% for the month, closing at $1,275 an ounce. This takes the year to date gains to 10.6%. Equity markets are accelerating higher on optimism on Trumps Tax plan. The Senate passed the Tax Cuts and Jobs Act, brings Republicans even closer to delivering President Trump a tax bill by the end of the year. So the question of essence is whether this optimism translates into any meaningful gains for the economy? It doesn't look like. The tax reform makes no sense. It increases the deficit, it is regressive, and it will further widen income inequality. Trumps tax plan permanently cuts the corporate tax rate from 35 percent to 20 percent, repeals Obamacare's individual mandate, estimated to leave 13 million fewer insured over the next decade, and lowers tax rates for most Americans until 2026, overwhelmingly advantaging the country's wealthiest. Every socalled dynamic analysis that scrutinizes the full details of the bills and factors in economic growth finds that those plans would add at least $500 billion and as much as $1.7 trillion to the deficit. Republicans are rallying around their hope that economic growth will increase and that their tax plan will pay for itself. At the other hand, it would definitely make America's income inequality worse. The bill is lopsided towards the wealthy by boosting the value of their stock portfolios, creating new loopholes for them to avoid tax on their labor income, and cutting taxes on massive inheritances. At the same time, it leaves low- and middle-income workers with no meaningful tax benefit, and increases the number of Americans without health insurance. In 2019, a person in the bottom 10 percent gets a $50 tax cut and a person in the top 1 percent gets a $34,000 tax cut. Other provisions, like rolling back the estate tax, are unambiguous giveaways to the richest Americans. It exacerbates preexisting and longstanding trends, rather than aiming to partially compensate for them. This in a way is a missed opportunity to overhaul a skewed tax system. It should be lowering taxes for individuals so that they consume more and give businesses incentive to expand. Instead, it's structured completely upside down where it further tilts in favor of the wealthy by lowering taxes for corporations, assuming they will invest, and the benefits will trickle down to individuals. As QE failed to trickle down to reach the average Joe on the street, similarly this tax plan will miserably fail in creating any wealth effect for the masses. Outlook Any attempt by gold to rally faltered in the past two months as the dollar strengthened and global equities set new records, while concerns over North Korea, Brexit and Catalonia's push for independence failed to drum up notable haven demand. Now, bitcoin's surge is attracting investor interest toward the cryptocurrency and it is clear that money that might otherwise have gone into gold plays of late has been attracted to the crypto phenomenon. As the name suggests, it's a pseudo currency i.e. without any backing or intrinsic value. Bernanke ex US central bank chief recently said that it would never replace fiat currency because governments would take whatever action necessary to ensure that never happens. Tax cuts are great, but they must be at least partially offset by spending cuts. Otherwise, interest rates will spike, which will do more harm to the economy than the tax cuts would provide. This is especially the case when debt is more than a nation's total annual GDP. The tax bill will surely benefit the rich but will not lead to any uplifting of the real economy. This means the current ebullience on Wall Street is about as far offside as possible. As the Fed starts to contract its balance sheet, other central banks are moving the same way. The ECB announced last month its bond buying will continue through September, although at 30 billion euros a month from January, half the current pace, while the Bank of England raised rates for the first time in more than a decade in November, and the People's Bank of China will probably intensify efforts to pare back a record buildup of debt in the financial system. This follow through from other central banks will keep a lid on any further run away appreciation in the dollar. The Fed continues to remain data dependent and there is no certainty that U.S. economic growth can sustain further aggressive tightening from the Fed. Higher interest rates also represent the biggest risk to the current stretched valuations on Wall Street. As the Fed tightens, the more likely it will trigger a renewed deflationary reality check. This could lead, again, to some form of unconventional monetary policy. It is the Feds and other central banks inability to exit from unconventional monetary policies that would serve as the real trigger for gold prices to break out of the current consolidation. The world is in great disequilibrium, both with respect to the global economy and geopolitics as well. The fallout of the geopolitics globally seems to now cap the downsides in gold. Given the macroeconomic picture, gold will be a useful portfolio diversification tool and thereby helping you to reduce overall portfolio risk. Source:Bloomberg Disclaimer: The views expressed above are for general information and reading purpose only and do not constitute any guidelines and recommendations on any course of action to be followed by the reader. Quantum AMC / Quantum Mutual Fund is not guaranteeing / offering / communicating any indicative yield on investments made in the scheme(s). The views are not meant to serve as a professional guide / investment advice / intended to be an offer or solicitation for the purchase or sale of any financial product or instrument or mutual fund units for the reader. The article has been prepared on the basis of publicly available information, internally developed data and other sources believed to be reliable. Whilst no action has been solicited based upon the information provided herein, due care has been taken to ensure that the facts are accurate and views given are fair and reasonable as on date. Readers of this article should rely on information/data arising out of their own investigations and advised to seek independent professional advice and arrive at an informed decision before making any investments. Mutual fund investments are subject to market risks read all scheme related documents carefully. QUANTUM VIEW 5
6 QUANTUM LONG TERM EQUITY FUND An Open ended Equity Features Nature of Investment Objective An Open-ended Open-ended Equity Equity The investment objective of the is to achieve long-term capital appreciation by investing in shares companies that will The investment objective primarily of the is toofachieve long-term capital typically be included in the primarily S&P BSE 200 Index and are in a position to appreciation by investing in shares of companies that will typicallyfrom be included in the S&P BSE and 200 development Index and areofinthe a position benefit the anticipated growth Indian to benefit from anticipated growth and development of the Indian economy and the its markets. economy and its markets. Benchmark Index S&P BSE 30 Total Return Index Ÿ Long term capital appreciation. S&P BSE 30 Total Return Index Mr. Investments Atul Kumar (insince November 15,related 2006) securities of companies in Ÿ equity and equity Fund Manager Fund Manager s Total Experience Mr. Atul Kumar ~ ( Since November 15, 2006) S&P BSE 200 index yrs. yrs. Ÿ High Risk (BROWN) Mr. Mr. Nilesh NileshShetty Shetty(Since (SinceMarch March28, 28,2011) 2011) Associate Fund Manager yrs. yrs. Total Experience Inception Date (Date of Allotment) March 13, Mar % - (1.09% Management Fees % GST (18% GST on 1.09% Management Fees) 1.46% - (1.24% Management Fees % GST (18% GST on 1.24% Management Fees) Current Expense Ratio Direct Plan Current Expense Ratio Regular Plan Total Expense Ratio (Weighted Average for the Month) Direct Plan Total Expense Ratio (Weighted Average for the Month) Regular Plan Investment Options 1.29% (Inclusive of Statutory Levies and Taxes) Minimum Application Amount (Under each Option) Purchase : ` 500/- and in multiples of ` 1/- thereafter. Additional Purchase : ` 500/- and in multiples of ` 1/- thereafter/ Rs. 50 units. Every Business Day Every Business Day Processed through RTGS/NEFT mode on T +3 basis from the date of transaction where the investor s Bank details are available. Processed through cheque on T+3 basis from the date of transaction where the required Bank details of investor are not available. Declaration of Net Asset Value (NAV) Redemption Proceeds Growth & Dividend (Dividend Option will in turn have two Facilities, Dividend Payout Facility and Dividend Re-investment Facility) Not Applicable Upfront commission to distributors will be paid by the investor directly to the distributor, based on his assessment of various factors including the service rendered by the distributor. Repurchase/ Redemption/Switch Out On or before 180 days from the date of allotment 4.00%, after 180 days but on or before 365 days from the date of allotment 3.00%, after 365 days but on or before 545 days from the date of allotment 2.00%, after 545 days but on or before 730 days from the date of allotment 1.00%, after 730 days from the date of allotment Nil Tax on Long Term Capital Gains - Nil Tax on Short Term Capital Gains - 15% Entry/ Sales Load Exit Load # Taxation Product Labeling Name of the 1.46% (Inclusive of Statutory Levies and Taxes) This product is suitable for investors who are seeking* Riskometer Moderate Mo d Hi era gh te LOW High Low ly Quantum Long Term Long term capital appreciation Equity Fund Invests Primarily in equity and equity related (An Open-ended Equity securities of companies in S&P BSE 200 index ) HIGH Investors understand that their principal will be at Moderately High Risk *Investors should consult their financial advisers if in doubt about whether the product is suitable for them. #The mentioned Tax Rates shall be increased by applicable surcharge, if any Education 2% and Secondary higher education 1% where ever as applicable. Equity oriented schemes will also attract Securities Transaction Tax 0.001% at the time of redemption and switch to other schemes. TRANSACTION CHARGES: No Transaction Charges shall be deducted from the investment amount for applications received in the Regular Plan. 6 QUANTUM LONG TERM EQUITY FUND
7 Quantum Long Term Equity Fund Performance as on November 30, 2017 The is co-managed by Mr. Atul Kumar and Mr. Nilesh Shetty. For other s Managed by Mr. Atul Kumar and Mr. Nilesh Shetty please see page no.32 Mr. Atul Kumar is the Fund Manager effective from November 15,2006 Mr. Nilesh Shetty is the Associate Fund Manager effective from March 28,2011. Performance of the Current Value ` 10,000 Invested at the beginning of a given period S&P BSE 30 TRI S&P BSE Sensex Returns (%) Returns (%) Returns (%) Quantum Long Term Equity Fund - Direct Plan - Growth Option S&P BSE 30 TRI S&P BSE Sensex November 30, 2016 to November 30, 2017 (1 year) ,840 12,599 12,437 November 28, 2014 to November 30, 2017 (3 years) ,557 12,050 11,553 November 30, 2012 to November 30, 2017 (5 years) ,351 18,442 17,140 November 30, 2010 to November 30, 2017 (7 years) ,511 18,855 16, ,522 19,790 17,120 November 30, 2007 to November 30, 2017 (10 years) ,630 36,356 Since Inception (13th March 2006) Past performance may or may not be sustained in the future. Load is not taken into consideration in Return Calculation. Returns are calculated on the basis of Compounded Annualized Growth Rate (CAGR). Different Plans shall have different expense structure. 30,683 SIP Performance of Quantum Long Term Equity Fund as on November 30, Direct Plan - Growth Option Since Inception SIP 10 Years SIP Total Amount Invested (` 000) 1, , Mkt Value as on November 30, 2017 (` 000) 3, , , Returns (XIRR*) (%) Benchmark (XIRR*) (%) S&P BSE 30 TRI Additional Benchmark (XIRR*) (%) S&P BSE Sensex 7 Years SIP 5 Years SIP 3 Years SIP 1 Year SIP ^^Standard Deviation: 12.77% Beta: 0.87 Sharpe Ratio: 0.39 Past performance may or may not be sustained in the future. Load is not taken into consideration using applicable NAV on the SIP day (5th of every month). Return on SIP and Benchmark are annualized and compounded investment return for cash flows resulting out of uniform and regular monthly subscriptions as on 5th day of every month (in case 5th is a non-business Day, then the next Business Day) and have been worked out using the Excel spreadsheet function known as XIRR. XIRR calculates the internal rate of return for series of cash flow. Assuming ` 10,000 invested every month on 5th day of every month (in case 5th is a non-business Day, then the next Business Day), the 1 year, 3 years, 5 years, 7 years, 10 years and since inception returns from SIP are annualized and compounded investment return computed on the assumption that SIP installments were received across the time periods from the start date of SIP from the end of the relevant period viz. 1 year, 3 years, 5 years, 7 years, 10 years and since Inception. *XIRR - XIRR calculates the internal rate of return to measure and compare the profitability of series of investments. Brokerages & Commissions Details ` 2,29, ` 13, Brokerages on Investments for Distributor Commissions paid during NAV (as on November 30, 2017) AUM (as on November 30, 2017) Direct Plan (`/Unit) Regular Plan (`/Unit) Dividend Option Average AUM* Growth Option Absolute AUM `(In Crores) *Cumulative Daily AuM /No of days in the month QUANTUM LONG TERM EQUITY FUND 7
8 Portfolio as on November 30, 2017 Industry / Rating Name of Instrument Quantity Market % to Net Value In Assets Lakhs EQUITY & EQUITY RELATED A) Listed /Awaiting listing on the Stock Exchanges 1. Bajaj Auto Limited Auto 2. Hero MotoCorp Limited Auto 3. Infosys Limited Software 4. Tata Consultancy Services Limited Software 5. Housing Development Finance Corporation Limited Finance 6. ICICI Bank Limited Banks 7. State Bank of India Banks 8. NTPC Limited Power 9. The Indian Hotels Company Limited Hotels, Resorts And Other Recreational Activities 10. GAIL (India) Limited Gas 11. Tata Motors Limited Auto 12. Wipro Limited Software 13. Cipla Limited Pharmaceuticals 14. Exide Industries Limited Auto Ancillaries 15. Power Grid Corporation of India Limited Power 16. Oil & Natural Gas Corporation Limited Oil 17. PTC India Limited Power 18. Lupin Limited Pharmaceuticals 19. Tata Steel Limited Ferrous Metals 20. Larsen & Toubro Limited Construction Project 21. Tata Chemicals Limited Chemicals 22. Bharti Airtel Limited Telecom - Services B) Unlisted Total of all Equity MONEY MARKET INSTRUMENTS A) Treasury Bills (T-Bill) Days Tbill (MD 21/06/2018) Sovereign Total of T-Bill B) Collateralised Borrowing & Lending Obligation (CBLO)* Total of Money Market Instruments Net Receivable/(payable) Grand Total 1,93,758 1,41,185 4,89,201 1,66,392 2,55,519 11,78,319 11,26,266 19,20,869 25,79,998 6,57,874 7,22,989 9,94,630 4,78,493 13,41,638 12,92,994 14,72,457 22,13,468 2,91,807 3,01,012 86,632 1,35,585 87,936 6, , , , , , , , , , , , , , , , , , , , , , , , , * Cash & Cash Equivalents Portfolio Turnover Ratio (Last one year): 18.46% Industry Allocation (% of Net Assets) as on November 30, 2017 Auto 17.08% Software 14.25% Power 10. Banks 8.54% Pharmaceuticals 6.22% Finance 5.06% Hotels, Resorts And Other Recreational Activities 3.77% Gas 3.64% Auto Ancillaries 3.25% Oil 3.14% Ferrous Metals 2.47% Construction Project 1.25% Chemicals Telecom - Services 0% 1.16% 0.52% 2% 4% 6% 8% 10% 12% 14% 16% 18% ^^ Note: Risk Free Rate assumed to be 6.00% (FBIL Overnight MIBOR for 30th ) for calculating Sharpe Ratio. Standard Deviation, Sharpe Ratio & Beta are calculated on Annualised basis using 3 years history of monthly returns. Definitions Standard deviation measures historical volatility. A high standard deviation suggests high volatility, while lower standard deviation would refer to more stability. Beta is the tendency of a fund's returns to respond to market swings. A beta of 1 indicates that the fund price will move with the market. A beta of less than 1 means that the security will be less volatile than the market. A beta of greater than 1 indicates that the security's price will be more volatile than the market. Sharpe Ratio is used to characterise how well the return of an asset compensates the investor for the risk taken. The greater a portfolio's Sharpe ratio, the better its risk-adjusted performance has been. Portfolio Turnover Ratio is the percentage of a funds assets that have changed over the course of a year. 8 QUANTUM LONG TERM EQUITY FUND
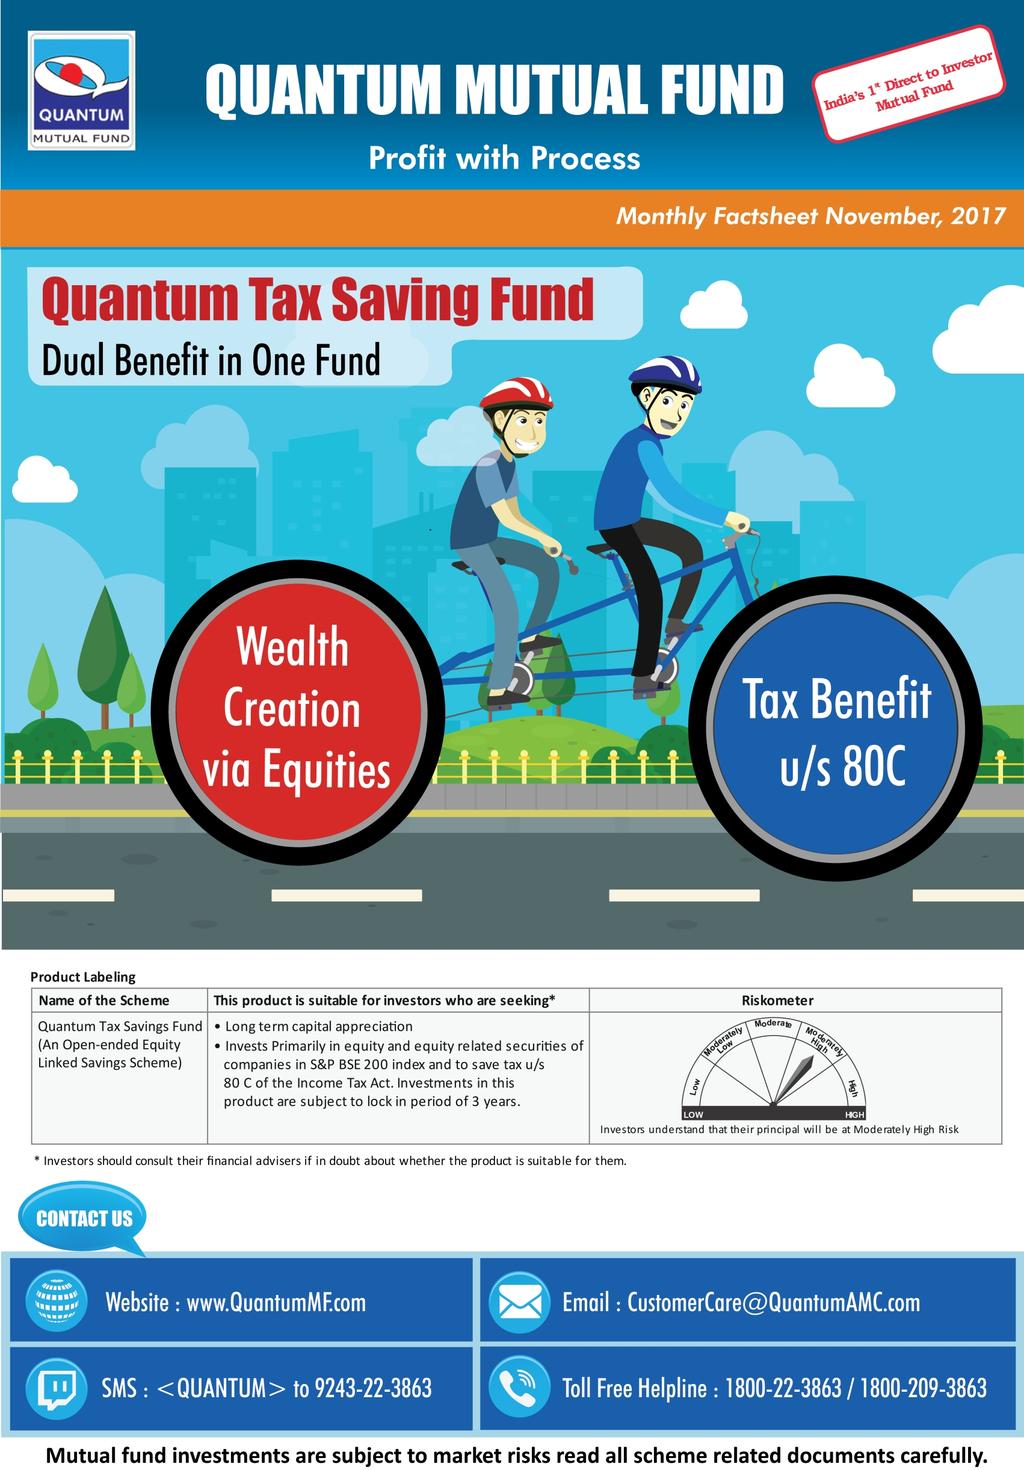
9 QUANTUM TAX SAVING FUND An open ended Equity Linked Saving with a lock-in period of three years Features Benchmark Index Fund Manager Fund Manager s Total Experience An Open-ended Equity Linked Savings with a lock-in period of 3 years The investment objective of the is to achieve long-term capital appreciation by investing primarily in shares of companies that will typically be included in the S&P BSE 200 Index and are in a position to benefit from the anticipated growth and development of the Indian economy and its markets. S&P BSE 30 Total Return Index Mr. Atul Kumar ( Since December 23, 2008) 16 yrs. Associate Fund Manager Total Experience Mr. Sorbh Gupta ( Since October 1, 2016) 11 yrs. Inception Date (Date of Allotment) December 23, 2008 Current Expense Ratio Direct Plan 1.29% - (1.09% Management Fees % GST (18% GST on 1.09% Management Fees) 1.46% - (1.24% Management Fees % GST (18% GST on 1.24% Management Fees) Nature of Investment Objective Current Expense Ratio Regular Plan Total Expense Ratio (Weighted Average for the Month) Direct Plan 1.28% (Inclusive of Statutory Levies and Taxes) Total Expense Ratio (Weighted Average for the Month) Regular Plan 1.46% (Inclusive of Statutory Levies and Taxes) Investment Options Growth & Dividend Minimum Application Amount (Under each Option) Purchase: ` 500/- and in multiples of ` 500/- thereafter. Additional Purchase: ` 500/- and in multiples of ` 500/- thereafter. Lock-in 3 years from the date of allotment of the respective Units Declaration of Net Asset Value (NAV) Redemption Proceeds Redemption Proceeds Every Business Day Processed through RTGS/NEFT mode on T +3 basis from the date of transaction where the investor s Bank details are available. Processed through cheque on T+3 basis from the date of transaction where the required Bank details of investor are not available. Not Applicable Upfront commission to distributors will be paid by the investor directly to the distributor, based on his assessment of various factors including the service rendered by the distributor. Nil Entry/ Sales Load Exit Load # Taxation Tax on Long Term Capital Gains - Nil Tax on Short Term Capital Gains - 15% Product Labeling Name of the This product is suitable for investors who are seeking* Riskometer Quantum Tax Saving Fund Long term capital appreciation (An Open-ended Equity Invests Primarily in equity and equity related securities of companies in S&P BSE 200 index and to Linked Savings ) save tax u/s 80 C of the Income Tax Act. Investments in this product are subject to lock in period of 3 years. Moderate Mo d Hi era gh te High Low ly LOW HIGH Investors understand that their principal will be at Moderately High Risk *Investors should consult their financial advisers if in doubt about whether the product is suitable for them. #The mentioned Tax Rates shall be increased by applicable surcharge, if any Education 2% and Secondary higher education 1% where ever as applicable. Equity oriented schemes will also attract Securities Transaction Tax 0.001% at the time of redemption and switch to other schemes. TRANSACTION CHARGES: No Transaction Charges shall be deducted from the investment amount for applications received in the Regular Plan. QUANTUM TAX SAVING FUND 9
10 Quantum Tax Saving Fund Performance as on November 30, 2017 The is Co-Managed by Mr. Atul Kumar and Mr. Sorbh Gupta. For other s Managed by Mr. Atul Kumar and Mr. Sorbh Gupta please see page no. 32 Mr. Atul Kumar is the Fund Manager effective from December 23, 2008 Mr. Sorbh Gupta is the Associate Fund Manager effective from October 1,2016 Performance of the Returns (%) S&P BSE 30 TRI S&P BSE Sensex Returns (%) Returns (%) Current Value ` 10,000 Invested at the beginning of a given period Quantum Tax Saving Fund - Direct Plan - Growth Option S&P BSE 30 TRI S&P BSE Sensex November 30, 2016 to November 30, 2017 (1 year) ,870 12,599 12,437 November 28, 2014 to November 30, 2017 (3 years) ,418 12,050 11,553 November 30, 2012 to November 30, 2017 (5 years) ,386 18,442 17,140 November 30, 2010 to November 30, 2017 (7 years) ,329 18,855 16,981 Since Inception (23rd Dec 2008) ,170 39,001 34,221 Past performance may or may not be sustained in the future. Returns are calculated on the basis of Compounded Annualized Growth Rate (CAGR). Different Plans shall have different expense structure. SIP Performance of Quantum Tax Saving Fund as on November 30, Direct Plan - Growth Option Since Inception SIP 7 Years SIP 5 Years SIP 3 Years SIP 1 Year SIP Total Amount Invested (` 000) 1, Mkt Value as on November 30, 2017 (` 000) 2, , Returns (XIRR*) (%) Benchmark (XIRR*) (%) S&P BSE 30 TRI Additional Benchmark (XIRR*) (%) S&P BSE Sensex ^^Standard Deviation: 13.00% Beta: 0.89 Sharpe Ratio: 0.36 Past performance may or may not be sustained in the future. performance has been calculated using applicable NAV on the SIP day (5th of every month). Return on SIP and Benchmark are annualized and compounded investment return for cash flows resulting out of uniform and regular monthly subscriptions as on 5th day of every month (in case 5th is a non-business Day, then the next Business Day) and have been worked out using the Excel spreadsheet function known as XIRR. XIRR calculates the internal rate of return for series of cash flow. Assuming ` 10,000 invested every month on 5th day of every month (in case 5th is a non-business Day, then the next Business Day), the 1 year, 3 years, 5 years, 7 years, and since inception returns from SIP are annualized and compounded investment return computed on the assumption that SIP installments were received across the time periods from the start date of SIP from the end of the relevant period viz. 1 year, 3 years, 5 years, 7 years and since Inception. *XIRR - XIRR calculates the internal rate of return to measure and compare the profitability of series of investments. Brokerages & Commissions Details. ` 14, ` Brokerages on Investments for Distributor Commissions paid during NAV (` in crores) (as on November 30, 2017) Direct Plan (`/Unit) Regular Plan (`/Unit) AUM (as on November 30, 2017) `(In Crores) Dividend Option Average AUM* Growth Option Absolute AUM *Cumulative Daily AuM /No of days in the month 10 QUANTUM TAX SAVING FUND
11 Portfolio as on November 30, 2017 Industry Name of Instrument Quantity Market % to Net Value In Assets Lakhs EQUITY & EQUITY RELATED A) Listed /Awaiting listing on the Stock Exchanges 1. Bajaj Auto Limited Auto 2. Hero MotoCorp Limited Auto 3. Housing Development Finance Corporation Limited Finance 4. Infosys Limited Software 5. Tata Consultancy Services Limited Software 6. ICICI Bank Limited Banks 7. State Bank of India Banks 8. NTPC Limited Power 9. The Indian Hotels Company Limited Hotels, Resorts And Other Recreational Activities 10. Tata Motors Limited Auto 11. Cipla Limited Pharmaceuticals 12. GAIL (India) Limited Gas 13. Oil & Natural Gas Corporation Limited Oil 14. Exide Industries Limited Auto Ancillaries 15. Wipro Limited Software 16. Power Grid Corporation of India Limited Power 17. PTC India Limited Power 18. Lupin Limited Pharmaceuticals 19. Tata Steel Limited Ferrous Metals 20. Larsen & Toubro Limited Construction Project 21. Tata Chemicals Limited Chemicals 22. Bharti Airtel Limited Telecom - Services B) Unlisted Total of all Equity MONEY MARKET INSTRUMENTS A) Collateralised Borrowing & Lending Obligation (CBLO)* Net Receivable/(payable) Grand Total 15,560 11,395 24,527 40,608 13,780 1,02,904 96,079 1,64,298 2,23,663 65,339 43,345 52,924 1,34,089 1,16,963 80,252 1,04,263 1,83,655 25,183 21,473 11,383 11,511 6, , , * Cash & Cash Equivalents Portfolio Turnover Ratio (Last one year): 16.77% Industry Allocation (% of Net Assets) as on November 30, 2017 Auto 17.80% Software 14.85% Power 10.84% Banks 9.33% Pharmaceuticals 6.97% Finance 6.14% Hotels, Resorts And Other Recreational Activities 4.13% Gas 3.70% Oil 3.62% Auto Ancillaries 3.58% Ferrous Metals 2.23% Construction Project 2.07% Chemicals 1.25% Telecom - Services 0.50% 0% 5% 10% 15% 20% ^^ Note: Risk Free Rate assumed to be 6.00% (FBIL Overnight MIBOR for 30th ) for calculating Sharpe Ratio. Standard Deviation, Sharpe Ratio & Beta are calculated on Annualised basis using 3 years history of monthly returns. Definitions Standard deviation measures historical volatility. A high standard deviation suggests high volatility, while lower standard deviation would refer to more stability. Beta is the tendency of a fund's returns to respond to market swings. A beta of 1 indicates that the fund price will move with the market. A beta of less than 1 means that thesecurity will be less volatile than the market. A beta of greater than 1 indicates that the security's price will be more volatile than the market. Sharpe Ratio is used to characterise how well the return of an asset compensates the investor for the risk taken. The greater a portfolio's Sharpe ratio, the better its risk-adjusted performance has been. Portfolio Turnover Ratio is the percentage of a funds assets that have changed over the course of a year. QUANTUM TAX SAVING FUND 11
12 QUANTUM EQUITY FUND OF FUNDS An Open ended Equity Fund of Funds Features Nature of Investment Objective An Open-ended Equity Fund of Funds The investment objective of the scheme is to generate long-term capital appreciation by investing in a portfolio of open-ended diversified equity schemes of mutual funds registered with SEBI. There can be no assurance of positive returns from following the stated investment strategy. Benchmark Index Fund Manager S&P BSE 200 Index Mr. Chirag Mehta (Since November 1, 2013) Fund Manager s Total Experience Inception Date (Date of Allotment) 13 yrs. July 20, % - (0.43% Management Fees % GST (18% GST on 0.43% Management Fees) 0.63% - (0.53% Management Fees % GST (18% GST on 0.53% Management Fees) Current Expense Ratio Direct Plan Current Expense Ratio Regular Plan Total Expense Ratio (Weighted Average for the Month) Direct Plan 0.51% (Inclusive of Statutory Levies and Taxes) Total Expense Ratio (Weighted Average for the Month) Regular Plan Investment Options 0.62% (Inclusive of Statutory Levies and Taxes) Growth & Dividend (Dividend Option will in turn have two Facilities, Dividend Payout Facility and Dividend Re-investment Facility) Purchase: ` 500/- and in multiples of ` 1/- thereafter. Additional Purchase: ` 500/- and in multiples of ` 1/- thereafter/ 50 units Minimum Application Amount ( Under each Option) Minimum Application Amount (Under each Option) Declaration of Net Asset Value (NAV) Every Business Day Redemption Proceeds Declaration of Net Asset Value (NAV) Processed through RTGS/NEFT mode on T +3 basis from the date of transaction where the investor s Bank details are available. Processed through cheque on T+3 basis from the date of transaction where the required Bank details of investor are not available. Not Applicable Upfront commission to distributors will be paid by the investor directly to the distributor, based on his assessment of various factors including the service rendered by the distributor. Entry/ Sales Load Repurchase/ Redemption/ Switch Out On or before 365 days from the date of allotment 1.5 %. Quantum Information Services Private Limited (QIS) which owns the website the designated agency to provide a recommended list of diversified equity schemes to Quantum Equity Fund of Funds. The investments in diversified equity schemes is made by Quantum Equity Fund of Funds based on / from that recommended list of diversified equity schemes provide by QIS. Exit Load Research Services Product Labeling Name of the This product is suitable for investors who are seeking* Riskometer Moderate Mo d Hi era gh te High Low ly Quantum Equity Fund Long term capital appreciation of Funds Investments in portfolio of open-ended diversified (An Open-ended Equity equity schemes of mutual funds registered with SEBI Fund of Funds ) whose underlying investments are in equity and equity related securities of diversified companies HIGH LOW Investors understand that their principal will be at Moderately High Risk *Investors should consult their financial advisers if in doubt about whether the product is suitable for them. Tax on Capital Gains * Resident Individuals & HUF Long Term Short Term 20% with Indexation Maximum FII s / Overseas Financial Organisations 10% without Indexation Partnership Firm 20% with Indexation Non Resident Indians 10% without Indexation (on transfer of long term capital assets being unlisted securities) Maximum Indian Companies 20% with Indexation Foreign Companies 10% without Indexation (on transfer of long term capital assets being unlisted securities) 40% #The mentioned Tax Rates shall be increased by applicable surcharge, if any Education 2% and Secondary higher education 1% where ever as applicable. Equity oriented schemes will also attract Securities Transaction Tax 0.001% at the time of redemption and switch to other schemes. The s which are selected for investments in QEFOF based on QIS / PFN Research. TRANSACTION CHARGES: No Transaction Charges shall be deducted from the investment amount for applications received in the Regular Plan. 12 QUANTUM EQUITY FUND OF FUNDS
13 Quantum Equity Fund of Funds Performance as on November 30, 2017 For other s Managed by Mr. Chirag Mehta please see page no.32, 33 Mr. Chirag Mehta is the Fund Manager effective from November 01,2013. Performance of the Returns (%) S&P BSE 200 Index Returns (%) S&P BSE Sensex Returns (%) Current Value ` 10,000 Invested at the beginning of a given period Quantum Equity Fund of Funds - Direct Plan - Growth Option S&P BSE 200 Index S&P BSE Sensex November 30, 2016 to November 30, 2017 (1 year) ,894 12,724 12,437 November 28, 2014 to November 30, 2017 (3 years) ,386 12,898 11,553 November 30, 2012 to November 30, 2017 (5 years) ,305 18,947 17,140 November 30, 2010 to November 30, 2017 (7 years) ,593 18,468 16,981 Since Inception (20th July 2009) ,774 24,492 21,822 Past performance may or may not be sustained in the future. Load is not taken into consideration in Return Calculation. Returns are calculated on the basis of Compounded Annualized Growth Rate (CAGR). Different Plans shall have different expense structure. SIP Performance of Quantum Equity Fund of Funds as on November 30, Direct Plan - Growth Option Since Inception SIP 7 Years SIP 5 Years SIP 3 Years SIP 1 Year SIP Total Amount Invested (` 000) 1, Mkt Value as on November 30, 2017 (` 000) 2, , Returns (XIRR*) (%) Benchmark (XIRR*) (%) S&P BSE 200 Index Additional Benchmark (XIRR*) (%) S&P BSE Sensex ^^Standard Deviation: 13.14% Beta: 0.96 Sharpe Ratio: 0.53 Past performance may or may not be sustained in the future. Load is not taken into consideration using applicable NAV on the SIP day (5th of every month). Return on SIP and Benchmark are annualized and compounded investment return for cash flows resulting out of uniform and regular monthly subscriptions as on 5th day of every month (in case 5th is a non-business Day, then the next Business Day) and have been worked out using the Excel spreadsheet function known as XIRR. XIRR calculates the internal rate of return for series of cash flow. Assuming ` 10,000 invested every month on 5th day of every month (in case 5th is a non-business Day, then the next Business Day), the 1 year, 3 years, 5 years, 7 years and since inception returns from SIP are annualized and compounded investment return computed on the assumption that SIP installments were received across the time periods from the start date of SIP from the end of the relevant period viz. 1 year, 3 years, 5 years, 7 years and since Inception. *XIRR - XIRR calculates the internal rate of return to measure and compare the profitability of series of investments. Brokerages & Commissions Details. Brokerages on Investments for Distributor Commissions paid during NAV (as on November 30, 2017) ` AUM (as on November 30, 2017) Direct Plan (`/Unit) Regular Plan (`/Unit) Dividend Option Average AUM* Growth Option Absolute AUM ` (In Crores) *Cumulative Daily AuM /No of days in the month QUANTUM EQUITY FUND OF FUNDS 13
14 Portfolio as on November 30, 2017 Quantity Name of Instrument MUTUAL FUND UNITS 1. HDFC Mid Cap Opportunities Fund - Direct Plan - Growth Option 2. Mirae Asset India Opportunities Fund - Direct Plan - Growth Option 3. SBI Magnum Multiplier Fund -Direct Plan - Growth Option 4. Franklin India High Growth Companies Fund - Direct - Growth Option 5. Aditya Birla Sun Life Frontline Equity Fund - Direct Plan - Growth Option 6. ICICI Prudential Focused Bluechip Equity Fund - Direct Plan - Growth Option 7. Franklin India Prima Plus - Direct Plan - Growth Option Total of Mutual Fund Units MONEY MARKET INSTRUMENTS A) Collateralised Borrowing & Lending Obligation (CBLO)* Net Receivable/(payable) Grand Total 4,16,773 4,86,923 1,04,379 5,33,659 97,489 5,29,590 36,061 Market Value In Lakhs % to Net Assets , , * Cash & Cash Equivalents ^^ Note: Risk Free Rate assumed to be 6.00% (FBIL Overnight MIBOR for 30th ) for calculating Sharpe Ratio. Standard Deviation, Sharpe Ratio & Beta are calculated on Annualised basis using 3 years history of monthly returns. Definitions Standard deviation measures historical volatility. A high standard deviation suggests high volatility, while lower standard deviation would refer to more stability. Beta is the tendency of a fund's returns to respond to market swings. A beta of 1 indicates that the fund price will move with the market. A beta of less than 1 means that thesecurity will be less volatile than the market. A beta of greater than 1 indicates that the security's price will be more volatile than the market. Sharpe Ratio is used to characterise how well the return of an asset compensates the investor for the risk taken. The greater a portfolio's Sharpe ratio, the better its risk-adjusted performance has been. 14 QUANTUM EQUITY FUND OF FUNDS
15 QUANTUM DYNAMIC BOND FUND An Open-ended Debt with Defined Credit Exposure and Dynamic Maturity Profile Features An Open-ended Debt with Defined Credit Exposure and Dynamic Maturity Profile Nature of Investment Objective Benchmark Index Fund Manager To generate income and capital appreciation through active management of portfolio consisting of short term, long term debt and money market instruments. CRISIL Composite Bond Fund Index Mr. Pankaj Pathak (Since March 01, 2017) Fund Manager s Total Experience 8 yrs. Inception Date (Date of Allotment) May 19, 2015 Current Expense Ratio Direct Plan 0.67% - (0.57% Management Fees % GST (18% GST on 0.57% Management Fees) 0.79% - (0.67% Management Fees % GST (18% GST on 0.67% Management Fees) Current Expense Ratio Regular Plan Total Expense Ratio (Weighted Average for the Month) Direct Plan Total Expense Ratio (Weighted Average for the Month) Regular Plan 0.60% (Inclusive of Statutory Levies and Taxes) 0.70% (Inclusive of Statutory Levies and Taxes) Investment Options Growth Option, Monthly Dividend Payout Option and Monthly Dividend Reinvestment Option Minimum Application Amount (Under each Option) Purchase: ` 500/- and in multiples of ` 1/- thereafter. Additional Purchase: ` 500/- and in multiples of ` 1/- thereafter/ 50 units Declaration of Net Asset Value (NAV) Every Business Day Redemption Proceeds Processed through RTGS/NEFT mode on T +1 basis from the date of transaction where the investor s Bank details are available. Processed through cheque on T+1 basis from the date of transaction where the required Bank details of investor are not available. Entry/ Sales Load Not Applicable Upfront commission to distributors will be paid by the investor directly to the distributor, based on his assessment of various factors including the service rendered by the distributor. Exit Load Nil Product Labeling This product is suitable for investors who are seeking* Regular income over short to medium term and capital appreciation Riskometer Moderate Mo d Hi era gh te ly Low Investment in Debt / Money Market Instruments / Government Securities. High Name of the Quantum Dynamic Bond Fund (An Open-ended Debt with Defined Credit Exposure and Dynamic Maturity Profile) HIGH LOW Investors understand that their principal will be at Moderate Risk *Investors should consult their financial advisers if in doubt about whether the product is suitable for them. Tax on Capital Gains * Resident Individuals & HUF Long Term Short Term 20% with Indexation Maximum FII s / Overseas Financial Organisations 10% without Indexation Partnership Firm 20% with Indexation Non Resident Indians 10% without Indexation (on transfer of long term capital assets being unlisted securities) Maximum Indian Companies 20% with Indexation Foreign Companies 10% without Indexation (on transfer of long term capital assets being unlisted securities) 40% #The mentioned Tax Rates shall be increased by applicable surcharge, if any Education 2% and Secondary higher education 1% where ever as applicable. Equity oriented schemes will also attract Securities Transaction Tax 0.001% at the time of redemption and switch to other schemes. TRANSACTION CHARGES: No Transaction Charges shall be deducted from the investment amount for applications received in the Regular Plan. QUANTUM DYNAMIC BOND FUND 15
16 Quantum Dynamic Bond Fund Performance as on November 30, 2017 For other s Managed by Mr. Pankaj Pathak please see page no.34 Mr. Pankaj Pathak is the Fund Manager effective from March 01,2017. Performance of the Returns (%) CRISIL Composite CRISIL 10 Year Bond Fund Index Gilt Index Returns (%) Returns (%) Quantum Dynamic Bond Fund - Direct Plan - Growth Option November 30, 2016 to November 30, 2017 (1 year) Since Inception (19th May 2015) Current Value ` 10,000 Invested at the beginning of a given period CRISIL Composite CRISIL 10 Year Bond Fund Index Gilt Index ,446 10,385 9, ,935 12,501 12,136 Past performance may or may not be sustained in the future. Returns are calculated on the basis of Compounded Annualized Growth Rate (CAGR). Different Plans shall have different expense structure. The scheme has been in existence for more than 1 year but has not yet completed 3 years period from inception. Weighted Average Maturity as on November 30, 2017 At the end of the month Modified Duration Portfolio Yield (In Yrs.) % Dividend History - Monthly Dividend option Brokerages & Commissions Details. Brokerages on Investments for Distributor Commissions paid during ` 2, Regular Plan Direct Plan Net Dividend per unit(`) (Post Dividend Distribution Tax) Individual Non Individual Record Date Net Dividend per unit(`) (Post Dividend Distribution Tax) Individual Non Individual 25-Sep Oct Nov NAV (as on November 30, 2017) Direct Plan (`/Unit) Regular Plan (`/Unit) Growth Option Monthly Dividend Option AUM (as on November 30, 2017) `(In Crores) Average AUM* Absolute AUM *Cumulative Daily AuM /No of days in the month 16 QUANTUM DYNAMIC BOND FUND
17 Portfolio as on November 30, 2017 Rating Name of Instrument DEBT INSTRUMENTS A) Listed /Awaiting listing on Stock Exchanges RECL Ltd NCD (MD 21/10/2021) I) Government Securities GOI (MD 17/09/2031) GOI (MD 14/11/2024) GOI (MD 19/12/2034) GOI (MD 15/05/2027) GOI (M/D 21/09/2027) GOI (MD 25/05/2025) GOI (MD 22/06/2024) Total of Government Securities B) Privately Placed/Unlisted C) Securitized Debt Instruments Total of Debt Instruments MONEY MARKET INSTRUMENTS A) Treasury Bills (T-Bill) Days Tbill (MD 21/12/2017) Total of T-Bills B) Collateralised Borrowing & Lending Obligation (CBLO)* Total of Money Market Instruments Net Receivable / (Payables) Grand Total Market Value In Lakhs % to Net Assets ICRA AAA Sovereign Sovereign Sovereign Sovereign Sovereign Sovereign Sovereign 1, , , , , Sovereign , , , * Cash & Cash Equivalents Asset Allocation (% of Net Assets) as on November 30, 2017 Rating Profile (% of Net Asset) as on November 30, 2017 CBLO & Net Receivable / (Payable) 18.96% CBLO & Net Receivable / (Payable) 18.96% Public Financial Institution AAA 5.66% 5.66% Govt. Securities & Treasury Bills, Sovereign 75.38% 75.38% Govt. Securities & Treasury Bills Sovereign Public Financial Institution AAA CBLO & Net Receivable / (Payable) CBLO & Net Receivable / (Payable) QUANTUM DYNAMIC BOND FUND 17
18 QUANTUM LIQUID FUND An Open ended Liquid Features Nature of An Open-ended Liquid Investment Objective The primary investment objective of the is to provide optimal returns with low to moderate levels of risk and high liquidity through judicious investments in money market and debt instruments. Benchmark Index Crisil Liquid Fund Index Fund Manager Mr. Pankaj Pathak (Since March 01, 2017) Fund Manager s Total Experience 8 yrs. Inception Date (Date of Allotment) April 7, % - (0.22% Management Fees % GST (18% GST on 0.22% Management Fees) 0.32% - (0.27% Management Fees % GST (18% GST on 0.27% Management Fees) Current Expense Ratio Direct Plan Current Expense Ratio Regular Plan Total Expense Ratio (Weighted Average for the Month) Direct Plan Total Expense Ratio (Weighted Average for the Month) Regular Plan 0.23% (Inclusive of Statutory Levies and Taxes) 0.28% (Inclusive of Statutory Levies and Taxes) Investment Options Growth, Daily Dividend Reinvestment & Monthly Dividend Option Two facilities (i) Dividend Re- Investment Facility, (ii) Dividend Payout Facility Minimum Application Amount (Under each Option) Growth Option: ` 5,000/-and in multiples of ` 1/-thereafter. Monthly Dividend Option: ` 10,000/-and in multiples of ` 1/thereafter. Daily Dividend Reinvestment Option: ` 1,00,000/- and in multiples of ` 1/- thereafter. Additional Investment: ` 500/- and in multiples of `1/- thereafter /50 units (For all options) Declaration of Net Asset Value (NAV) Every Business Day Redemption Proceeds Processed through RTGS/NEFT mode on T +1 basis from the date of transaction where the investor s Bank details are available. Processed through cheque on T+1 basis from the date of transaction where the required Bank details of investor are not available. Not Applicable Upfront commission to distributors will be paid by the investor directly to the distributor, based on his assessment of various factors including the service rendered by the distributor. Nil Entry/ Sales Load Exit Load Product Labeling Name of the This product is suitable for investors who are seeking* Quantum Liquid Fund (An Open- ended Liquid ) Income over the short term Investments in debt / money market instruments Riskometer Moderate Mo d Hi era gh te High Low ly HIGH LOW Investors understand that their principal will be at Low risk *Investors should consult their financial advisers if in doubt about whether the product is suitable for them. Tax on Capital Gains * Resident Individuals & HUF Long Term Short Term 20% with Indexation Maximum FII s / Overseas Financial Organisations 10% without Indexation Partnership Firm 20% with Indexation Non Resident Indians 10% without Indexation (on transfer of long term capital assets being unlisted securities) Maximum Indian Companies 20% with Indexation Foreign Companies 10% without Indexation (on transfer of long term capital assets being unlisted securities) 40% #The mentioned Tax Rates shall be increased by applicable surcharge, if any Education 2% and Secondary higher education 1% where ever as applicable. Equity oriented schemes will also attract Securities Transaction Tax 0.001% at the time of redemption and switch to other schemes. TRANSACTION CHARGES: No Transaction Charges shall be deducted from the investment amount for applications received in the Regular Plan. 18 QUANTUM LIQUID FUND
19 Quantum Liquid Fund Performance as on November 30, 2017 For other s Managed by Mr. Pankaj Pathak please see page no.34 Mr. Pankaj Pathak is the Fund Manager effective from March 01,2017. Performance of the Benchmark Crisil LiquidAdditional Crisil 1 year Returns (%) ReturnsReturns (%) T-bill Index Fund (%) #Index Benchmark Returns (%) Returns (%)Returns (%) ## Current Value ` 10,000 Invested at the beginning of a given period (`) Crisil Liquid Fund Index Quantum QuantumLiquid Tax Saving Fund Fund - Direct Plan - Growth Option November 23, 2017 to November 30, 2017 (7 Days)* ,011 Crisil 1 year T-bill Index 10,012 10,017 November 15, 2017 to November 30, 2017 (15 Days)* ,024 10,025 10,032 October 31, 2017 to November 30, 2017 (1 Month)* ,047 10,052 10,055 November 30, 2016 to November 30, 2017 (1 year)** ,602 10,662 10,567 November 30, 2014 to November 30, 2017 (3 years)** ,249 12,435 12,336 November 30, 2012 to November 30, 2017 (5 years)** ,497 14,794 14,168 November 30, 2010 to November 30, 2017 (7 years)** ,199 17,363 16,258 November 30, 2007 to November 30, 2017 (10 years)** ,864 20,755 18,719 Since Inception (07th April 2006)** ,409 23,115 20,376 Past performance may or may not be sustained in the future. * Simple Annualized. ** Returns for 1 year and above period are Compounded Annualized Growth Rate (CAGR). Different Plans shall have different expense structure. Weighted Average Maturity as on November 30, 2017 At the end of the month Average during the month Modified Duration (Days) Brokerages & Commissions Details Dividend History - Monthly Dividend option Brokerages on Investments for Distributor Commissions paid during Portfolio Yield Regular Plan Direct Plan Record Date Net Dividend per unit(`) (Post Dividend Distribution Tax) Individual Non Individual Net Dividend per unit(`) (Post Dividend Distribution Tax) Individual Non Individual 25-Sep Oct Nov NAV (as on November 30, 2017) Direct Plan (`/Unit) Daily Dividend Option Growth Option Monthly Dividend Option Regular Plan (`/Unit) ` % AUM (as on November 30, 2017) `(In Crores) Average AUM* Absolute AUM *Cumulative Daily AuM /No of days in the month QUANTUM LIQUID FUND 19

20 Portfolio as on November 30, 2017 Rating Residual Maturity (in days) Market Value In Lakhs % to Net Assets CRISIL A1+ CRISIL A1+ CARE A , Sovereign Sovereign Sovereign Sovereign , , , , , , , , Name of Instrument DEBT INSTRUMENTS A) Listed /Awaiting listing on Stock Exchanges B) Privately Placed/Unlisted C) Securitized Debt Instruments Total of Debt Instruments MONEY MARKET INSTRUMENTS A) Commerical Papers (CP) 1. National Bank For Agri & Rural CP (MD 08/12/2017) 2. Export Import Bank of India CP (MD 22/01/2018) 3. Rural Electrification Corp Ltd CP (MD 20/12/2017) Total of CPs B) Treasury Bills (T-Bill) Days Tbill (MD 14/12/2017) Days Tbill (MD 08/02/2018) Days Tbill (MD 07/12/2017) Days Tbill (MD 21/12/2017) Total of T-Bills C) Collateralised Borrowing & Lending Obligation (CBLO)* Total of Money Market Instruments Net Receivable / (Payables) Grand Total * Cash & Cash Equivalents Asset Allocation (% of Net Assets) as on November 30, 2017 Public Financial Institution 20.28% CBLO & Net Receivable /(Payable) 22.92% CBLO & Net Receivable / (Payable) Govt. Securities Public Financial Institution Govt. Securities 56.80% Rating Profile (% of Net Asset) as on November 30, 2017 CBLO & Net Receivable /(Payable) 22.92% CBLO & Net Receivable / (Payable) A1+ Sovereign Sovereign 56.80% 20 A % QUANTUM LIQUID FUND
21 QUANTUM GOLD SAVINGS FUND An Open ended Fund of Fund Features Nature of An Open ended Fund of Fund Investment Objective The investment objective of the is to provide capital appreciation by predominantly investing in units of Quantum Gold Fund Exchange Traded Fund (QGF). The performance of the may differ from that of Quantum Gold Fund and the domestic prices of gold due to expenses and certain other factors. There can be no assurance or guarantee that the investment objective of the will be achieved. Benchmark Index Fund Manager Domestic Price of Gold Mr. Chirag Mehta (Since May 19, 2011) Fund Manager s Total Experience 13 yrs. Inception Date (Date of Allotment) May 19, 2011 Current Expense Ratio Direct Plan 0.11% - (0.09% Other Expenses % GST (18% GST on 0.09% Other Expenses ) 0.22% - (0.19% Other Expenses % GST (18% GST on 0.19% Other Expenses ) Current Expense Ratio Regular Plan Total Expense Ratio (Weighted Average for the Month) Direct Plan Total Expense Ratio (Weighted Average for the Month) Regular Plan Investment Options 0.11% (Inclusive of Statutory Levies and Taxes) 0.22% (Inclusive of Statutory Levies and Taxes) Growth Minimum Application Amount (Under each Option) Purchase : ` 500/- and in multiples of ` 1/- thereafter. Additional Purchase: ` 500/- and in multiples of ` 1/- thereafter / 50 units Declaration of Net Asset Value (NAV) Every Business Day Redemption Proceeds Processed through RTGS/NEFT mode on T +3 basis from the date of transaction where the investor s Bank details are available. Processed through cheque on T+3 basis from the date of transaction where the required Bank details of investor are not available. Entry/ Sales Load Not Applicable Upfront commission to distributors will be paid by the investor directly to the distributor, based on his assessment of various factors including the service rendered by the distributor. Exit Load - with effect from December 11, Product Labeling Name of the This product is suitable for investors who are seeking* Riskometer Moderate Mo d Hi era gh te High Low ly Quantum Gold Savings Long term returns Fund Investments in units of Quantum Gold Fund Exchange (An Open-ended Fund Traded Fund whose underlying investments are in of Funds ) physical gold. HIGH LOW Investors understand that their principal will be at Moderately High Risk *Investors should consult their financial advisers if in doubt about whether the product is suitable for them. Tax on Capital Gains * Resident Individuals & HUF Long Term Short Term 20% with Indexation Maximum FII s / Overseas Financial Organisations 10% without Indexation Partnership Firm 20% with Indexation Non Resident Indians 10% without Indexation (on transfer of long term capital assets being unlisted securities) Maximum Indian Companies 20% with Indexation Foreign Companies 10% without Indexation (on transfer of long term capital assets being unlisted securities) 40% #The mentioned Tax Rates shall be increased by applicable surcharge, if any Education 2% and Secondary higher education 1% where ever as applicable. Equity oriented schemes will also attract Securities Transaction Tax 0.001% at the time of redemption and switch to other schemes. TRANSACTION CHARGES: No Transaction Charges shall be deducted from the investment amount for applications received in the Regular Plan. QUANTUM GOLD SAVINGS FUND 21
22 Quantum Gold Savings Fund Performance as on November 30, 2017 For other s Managed by Mr. Chirag Mehta please see page no.32, 33 Mr. Chirag Mehta is the Fund Manager effective from May 19,2011. Performance of the Returns (%) Returns (%) Domestic Price of Gold Returns (%) Current Value ` 10,000 Invested at the beginning of a given period Domestic Price of Gold Returns (%) (`) Quantum QuantumGold Tax Saving SavingsFund Fund - Direct Plan November 30, 2016 to November 30, 2017 (1 year) ,998 10,036 November 28, 2014 to November 30, 2017 (3 years) ,587 11,157 November 30, 2012 to November 30, 2017 (5 years) ,682 9,206 Since Inception (19th May 2011) ,221 13,310 Past performance may or may not be sustained in the future. Load is not taken into consideration in Return Calculation. Returns are calculated on the basis of Compounded Annualized Growth Rate (CAGR). Different Plans shall have different expense structure. SIP Performance of Quantum Gold Savings Funds as on November 30, Direct Plan Since Inception SIP 5 Years SIP 3 Years SIP 1 Year SIP Total Amount Invested (` 000) Mkt Value as on November 30, 2017 (` 000) Returns (XIRR*) (%) Benchmark (XIRR*) (%)Domestic Price of Gold Past performance may or may not be sustained in the future. Load is not taken into consideration using applicable NAV on the SIP day (5th of every month). Return on SIP and Benchmark are annualized and compounded investment return for cash flows resulting out of uniform and regular monthly subscriptions as on 5th day of every month (in case 5th is a non-business Day, then the next Business Day) and have been worked out using the Excel spreadsheet function known as XIRR. XIRR calculates the internal rate of return for series of cash flow. Assuming ` 10,000 invested every month on 5th day of every month (in case 5th is a non-business Day, then the next Business Day), the 1 year, 3 years, 5 years and since inception returns from SIP are annualized and compounded investment return computed on the assumption that SIP installments were received across the time periods from the start date of SIP from the end of the relevant period viz. 1 year, 3 years, 5 years and since Inception. *XIRR - XIRR calculates the internal rate of return to measure and compare the profitability of series of investments. Brokerages & Commissions Details. ` 1, ` Brokerages on Investments for Distributor Commissions paid during NAV (as on November 30, 2017) Direct Plan (`/Unit) Regular Plan (`/Unit) Growth Option AUM (as on November 30, 2017) ` (In Crores) Average AUM* Absolute AUM *Cumulative Daily AuM /No of days in the month 22 QUANTUM GOLD SAVINGS FUND
* Net Receivable/(payable) Grand Total Quantity Market Value In Lakhs % to Net Assets 1,05,920 1,386.44 1,386.44 99.87 99.87 1.89 (0.05) 1,388.28 0.")
23 Portfolio as on November 30, 2017 Name of Instrument A) EXCHANGE TRADED FUND UNITS 1. Quantum Gold Fund Total of Exchange Traded Funds B) MONEY MARKET INSTRUMENTS 1. Collateralised Borrowing & Lending Obligation (CBLO)* Net Receivable/(payable) Grand Total Quantity Market Value In Lakhs % to Net Assets 1,05,920 1, , (0.05) 1, * Cash & Cash Equivalents Portfolio Turnover Ratio (Last one year): 9.53% Asset Allocation (% of Net Assets) as on November 30, 2017 CBLO & Net Receivable / (Payable) 0.13% Units of Quantum Gold Fund Units of Quantum Gold Fund 99.87% CBLO & Net Receivable / (Payable) ^^ Definitions Portfolio Turnover Ratio is the percentage of a funds assets that have changed over the course of a year. QUANTUM GOLD SAVINGS FUND 23
24 QUANTUM MULTI ASSET FUND An Open-ended Fund of Funds Features An Open-ended Fund of Funds The investment objective of the is to generate modest capital appreciation while trying to reduce risk (by diversifying risks across asset classes) from a combined portfolio of equity, debt / money markets and Gold schemes of Quantum Mutual Fund. The may invest in the units of debt / money market schemes of other mutual funds to gain exposure to debt as an asset class to manage any investment and regulatory constraints that arise/ that prevent the from increasing investments in the schemes of Quantum Mutual Fund. There can be no assurance that the investment objective of the will be realized. Crisil Composite Bond Fund Index (40%)+S&P BSE Sensex Total return Index (40%)+Domestic price of gold (20%) Mr. Chirag Mehta (Since July 11, 2012) 13 yrs Mr. Nilesh Shetty (Since July 11, 2012) 13 yrs July 11, 2012 Nature of Investment Objective Benchmark Index Fund Manager Fund Manager s Total Experience Fund Manager Total Experience Inception Date (Date of Allotment) 0.26% - (0.22% Other Fees % GST (18% GST on 0.22% Other Expenses ) 0.38% - (0.32% Other Fees % GST (18% GST on 0.32% Other Expenses ) Current Expense Ratio Direct Plan Current Expense Ratio Regular Plan Total Expense Ratio (Weighted Average for the Month) Direct Plan Total Expense Ratio (Weighted Average for the Month) Regular Plan Investment Options Minimum Application Amount (Under each Option) 0.26% (Inclusive of Statutory Levies and Taxes) 0.38% (Inclusive of Statutory Levies and Taxes) Growth Purchase: ` 500/- and in multiples of ` 1/- thereafter. Additional Purchase: ` 500/- and in multiples of ` 1/- thereafter/ 50 units Every Business Day Declaration of Net Asset Value (NAV) Processed through RTGS/NEFT mode on T +3 basis from the date of transaction where the investor s Bank details are available. Processed through cheque on T+3 basis from the date of transaction where the required Bank details of investor are not available. Not Applicable Upfront commission to distributors will be paid by the investor directly to the distributor, based on his assessment of various factors including the service rendered by the distributor. Repurchase/ Redemption/ Switch Out a) On or before 90 days from the date of allotment 1.00%. b) After 90 days from the date of allotment Nil Redemption Proceeds Entry/ Sales Load Exit Load Riskometer Long term capital appreciation & Current income Investments in portfolio of schemes of Quantum Mutual Fund whose underlying investments are in equity and equity related securities of companies, debt and money market instruments and physical gold. Moderate Mo d Hi era gh te ly High Quantum Multi Asset Fund (An Open-ended Fund of Funds ) This product is suitable for investors who are seeking* Low Product Labeling Name of the HIGH LOW Investors understand that their principal will be at Moderately High Risk *Investors should consult their financial advisers if in doubt about whether the product is suitable for them. Tax on Capital Gains * Resident Individuals & HUF Long Term Short Term 20% with Indexation Maximum FII s / Overseas Financial Organisations 10% without Indexation Partnership Firm 20% with Indexation Non Resident Indians 10% without Indexation (on transfer of long term capital assets being unlisted securities) Maximum Indian Companies 20% with Indexation Foreign Companies 10% without Indexation (on transfer of long term capital assets being unlisted securities) 40% #The mentioned Tax Rates shall be increased by applicable surcharge, if any Education 2% and Secondary higher education 1% where ever as applicable. Equity oriented schemes will also attract Securities Transaction Tax 0.001% at the time of redemption and switch to other schemes. TRANSACTION CHARGES: No Transaction Charges shall be deducted from the investment amount for applications received in the Regular Plan. 24 QUANTUM MULTI ASSET FUND
25 Quantum Multi Asset Fund Performance as on November 30, 2017 The is Co-Managed by Chirag Mehta and Nilesh Shetty. For other s Managed by Chirag Mehta and Nilesh Shetty. please see page no.32, 33 Mr. Chirag Mehta & Mr. Nilesh Shetty are Fund Managers effective from July 11, 2012 Performance of the Benchmark Returns (%) Returns (%) (%) # Returns Benchmark Additional Returns Benchmark (%) # Returns (%) ## Current Value ` 10,000 Invested at the beginning of a given period (`) Quantum QuantumMulti Tax Saving Asset Fund - Direct Plan S&P BSE S&P BSE- Benchmark 30 Sensex TRI (RS.)Returns # (`) # (RS.) ## November 30, 2016 to November 30, 2017 (1 year) ,021 11,321 November 28, 2014 to November 30, 2017 (3 years) ,588 12,298 November 30, 2012 to November 30, 2017 (5 years) ,839 15, ,926 16,591 Since Inception (11th July 2012) Past performance may or may not be sustained in the future. Load is not taken into consideration in Return Calculation. # Indicates CRISIL Composite Bond Fund Index (40%) + S&P BSE Total Return Index (40%) + Domestic price of Gold (20%) Returns are calculated on the basis of Compounded Annualized Growth Rate (CAGR). Different Plans shall have different expense structure. SIP Performance of Quantum Multi Asset Fund as on November 30, Direct Plan Since Inception SIP 5 Years SIP 3 Years SIP 1 Year SIP Total Amount Invested (` 000) Mkt Value as on November 30, 2017 (` 000) Returns (XIRR*) (%) Benchmark (XIRR*) (%) # ^^Standard Deviation: 4.85% Beta: 0.75 Sharpe Ratio: 0.37 Past performance may or may not be sustained in the future. # Crisil Composite Bond Fund Index (40%)+ S&P BSE Sensex Total return Index (40%)+ Domestic price of gold (20%) Load is not taken into consideration using applicable NAV on the SIP day (5th of every month). Return on SIP and Benchmark are annualized and compounded investment return for cash flows resulting out of uniform and regular monthly subscriptions as on 5th day of every month (in case 5th is a non-business Day, then the next Business Day) and have been worked out using the Excel spreadsheet function known as XIRR. XIRR calculates the internal rate of return for series of cash flow. Assuming ` 10,000 invested every month on 5th day of every month (in case 5th is a non-business Day, then the next Business Day), the 1 year, 3 years, 5 years and since inception returns from SIP are annualized and compounded investment return computed on the assumption that SIP installments were received across the time periods from the start date of SIP from the end of the relevant period viz. 1 year, 3 years, 5 years and since Inception. *XIRR - XIRR calculates the internal rate of return to measure and compare the profitability of series of investments. Brokerages & Commissions Details. Brokerages on Investments for Distributor commissions paid during NAV (as on November 30, 2017) Direct Plan (`/Unit) Growth Option ` 3, ` 7.96 AUM (as on November 30, 2017) Regular Plan (`/Unit) `(In Crores) Average AUM* Absolute AUM *Cumulative Daily AuM /No of days in the month QUANTUM MULTI ASSET FUND 25
26 Portfolio as on November 30, 2017 Name of Instrument Quantity Market Value In Lakhs % to Net Assets 20,83,336 6,62,597 9,03, ,541 7, , , A) MUTUAL FUND UNITS 1. Quantum Liquid Fund - Direct Plan Growth Option 2. Quantum Long Term Equity Fund - Direct Plan Growth Option 3. Quantum Dynamic Bond Fund - Direct Plan Growth Option Total of Mutual Fund Units B) EXCHANGE TRADED FUND UNITS 1. Quantum Gold Fund (an ETF) 2. Quantum Nifty ETF Total of Exchange Traded Fund Units Total (A+B) MONEY MARKET INSTRUMENTS A) Collateralised Borrowing & Lending Obligation (CBLO)* Net Receivable/(payable) Grand Total * Cash & Cash Equivalents ^^ Note: Risk Free Rate assumed to be 6.00% (FBIL Overnight MIBOR for 30th ) for calculating Sharpe Ratio. Standard Deviation, Sharpe Ratio & Beta are calculated on Annualised basis using 3 years history of monthly returns. Definitions Standard deviation measures historical volatility. A high standard deviation suggests high volatility, while lower standard deviation would refer to more stability. Beta is the tendency of a fund's returns to respond to market swings. A beta of 1 indicates that the fund price will move with the market. A beta of less than 1 means that thesecurity will be less volatile than the market. A beta of greater than 1 indicates that the security's price will be more volatile than the market. Sharpe Ratio is used to characterise how well the return of an asset compensates the investor for the risk taken. The greater a portfolio's Sharpe ratio, the better its risk-adjusted performance has been. 26 QUANTUM MULTI ASSET FUND
27 QUANTUM GOLD FUND An Open ended Exchange Traded Fund - Gold Features Nature of An Open ended Exchange Traded Fund - Gold Investment Objective The Investment Objective of the is to generate returns that are in line with the performance of gold and gold related instruments subject to tracking errors. However, investment in gold related instruments will be made if and when SEBI permits mutual funds to invest, in gold related instruments. The is designed to provide returns that before expenses, closely correspond to the returns provided by gold. Benchmark Index Fund Manager Domestic Price of Physical Gold Mr. Chirag Mehta (Since May 01, 2009) Fund Manager s Total Experience 13 yrs Inception Date (Date of Allotment) February 22, 2008 Current Expense Ratio 1.03% - (0.87% Management Fees % GST (18% GST on 0.87% Management Fees) Total Expense Ratio (Weighted Average for the Month) 1.02% (Inclusive of Statutory Levies and Taxes) Investment Options Growth Directly with Fund: The investors can create / redeem in exchange of Portfolio Deposit and Cash Component in creation unit size at NAV based Price. On the Exchange: Approx equal to price of 1/2 gram of Gold quoted on the NSE. On NSE, the units can be purchased / sold in minimum lot of 1 units and in multiples therefore. Every Business Day Minimum Application Amount (Under each Option) Declaration of Net Asset Value (NAV) Redemption Proceeds Processed through RTGS/NEFT mode on T +3 basis from the date of transaction where the investor s Bank details are available. Processed through cheque on T+3 basis from the date of transaction where the required Bank details of investor are not available. Entry/ Sales Load Not Applicable Upfront commission to distributors will be paid by the investor directly to the distributor, based on his assessment of various factors including the service rendered by the distributor. Exit Load (retail investor can exit the scheme only through secondary market) Product Labeling Name of the This product is suitable for investors who are seeking* Quantum Gold Fund (An Open-ended Exchange Traded Fund- Gold) Long term returns Investments in physical gold. Riskometer Moderate Mo d Hi era gh te High Low ly HIGH LOW Investors understand that their principal will be at Moderately High Risk *Investors should consult their financial advisers if in doubt about whether the product is suitable for them. Tax on Capital Gains * Resident Individuals & HUF Long Term Short Term 20% with Indexation Maximum FII s / Overseas Financial Organisations 10% without Indexation Partnership Firm 20% with Indexation Non Resident Indians Indian Companies 20% with Indexation (on transfer of long term capital assets being listed securities) 20% with Indexation Maximum Foreign Companies 20% with Indexation (on transfer of long term capital assets being listed securities) 40% #The mentioned Tax Rates shall be increased by applicable surcharge, if any Education 2% and Secondary higher education 1% where ever as applicable. Equity oriented schemes will also attract Securities Transaction Tax 0.001% at the time of redemption and switch to other schemes. TRANSACTION CHARGES: No Transaction Charges shall be deducted from the investment amount for applications received. QUANTUM GOLD FUND 27
28 Quantum Gold Fund Performance as on November 30, 2017 For other s Managed by Mr Chirag Mehta please see page no.32, 33 Mr. Chirag Mehta is the Fund Manager effective from May 01,2009. Performance of the Benchmark (%) (%) # Returns (%) Returns Returns Domestic Additional price of Gold Benchmark Returns (%)(%) ## Returns Current Value ` 10,000 Invested at the beginning of a given period (`) Quantum QuantumGold Tax Saving Fund Fund November 30, 2016 to November 30, 2017 (1 year) November 28, 2014 to November 30, 2017 (3 years) November 30, 2012 to November 30, 2017 (5 years) November 30, 2010 to November 30, 2017 (7 years) Since Inception (22nd Feb 2008) S&P BSE- 30Domestic TRI (RS.) #price of Gold ,936 10, ,809 11, ,746 9, ,103 14, ,134 23,710 Past performance may or may not be sustained in the future. Returns are calculated on the basis of Compounded Annualized Growth Rate (CAGR). ^^Tracking Error :0.098% The being Exchange Traded Fund has one plan to invest through stock exchange and having a single expense structure. Portfolio as on November 30, 2017 Name of Instrument Quantity Market Value In Lakhs % to Net Asset , , , GOLD 1. 1 KG Bar (995 fineness) Gms Bar (999 fineness) Total of Gold MONEY MARKET INSTRUMENTS A) Collateralised Borrowing & Lending Obligation (CBLO)* Net Receivable/(payable) Grand Total * Cash & Cash Equivalents Brokerages & Commissions Details Brokerages on Investments for Distributor Commissions paid during NAV (as on November 30, 2017) Growth Option AUM (as of November 30, 2017) ` (In Crores) Average AUM* Absolute AUM *Cumulative Daily AuM /No of days in the month (`/Unit) Portfolio Turnover Ratio (Last one year): 1.53% Asset Allocation (% of Net Assets) as on November 30, 2017 CBLO Net Receivables / (Payable) -0.34% 0.04% Note: Tracking Error is calculated on Annualised basis using 3 years history of daily returns. ^^ Definitions Tracking Error is a measure of how closely a fund follows the index to which it is benchmarked. The more passively the fund is managed, the smaller the tracking error. In the case of Exchange Traded Funds, the lower the Tracking Error, the better. GOLD CBLO Net Receivables / (Payable) 28 QUANTUM GOLD FUND GOLD 100.
29 QUANTUM NIFTY ETF An Open ended Exchange Traded Fund Features Nature of An Open-ended Exchange Traded Fund Investment Objective The investment objective of the scheme is to invest in stocks of companies comprising Nifty 50 Index and endeavour to achieve return equivalent to Nifty by Passive investment. The will be managed by replicating the index in the same weightage as in the Nifty 50 Index with the intention of minimizing the performance differences between the scheme and the Nifty 50 Index in capital terms, subject to market liquidity, costs of trading, managing expenses and other factors which may cause tracking error. Benchmark Index Fund Manager Nifty 50 TRI Index Mr. Hitendra Parekh (Since July 10,2008) Fund Manager s Total Experience 22 yrs. July 10, % - (0.22% Management Fees % GST (18% GST on 0.22% Management Fees) Inception Date (Date of Allotment) Current Expense Ratio Total Expense Ratio (Weighted Average for the Month) 0.26% (Inclusive of Statutory Levies and Taxes) Investment Options Growth Minimum Application Amount (Under each Option) Declaration of Net Asset Value (NAV) Redemption Proceeds Entry/ Sales Load Exit Load Taxation# Directly with Fund: The investors can create / redeem in exchange of Portfolio Deposit and Cash Component in creation unit size at NAV based Price. On the Exchange: At prices which may be close to the NAV of QNIFTY Units. On NSE, the units can be purchased / sold in minimum lot of 1 unit and in multiples thereof. The units of QNIFTY issued under the scheme will be approximately equal to the price of 1/10 (one-tenth) of the Nifty 50 Index. Every Business Day Processed through RTGS/NEFT mode on T +3 basis from the date of transaction where the investor s Bank details are available. Processed through cheque on T+3 basis from the date of transaction where the required Bank details of investor are not available. Not Applicable Upfront commission to distributors will be paid by the investor directly to the distributor, based on his assessment of various factors including the service rendered by the distributor. (retail Investor can exit the scheme only through secondary market) Tax on Long Term Capital Gains - Nil Tax on Short Term Capital Gains - 15% Product Labeling Name of the This product is suitable for investors who are seeking* Riskometer Moderate Mo d Hi era gh te LOW High Low ly Quantum Nifty ETF Long term capital appreciation (An Open- ended Investments in equity and equity related securities of Exchange Traded Fund) companies in Nifty 50 Index. HIGH Investors understand that their principal will be at Moderately High Risk *Investors should consult their financial advisers if in doubt about whether the product is suitable for them. #The mentioned Tax Rates shall be increased by applicable surcharge, if any Education 2% and Secondary higher education 1% where ever as applicable. Equity oriented schemes will also attract Securities Transaction Tax 0.001% at the time of redemption and switch to other schemes. TRANSACTION CHARGES: No Transaction Charges shall be deducted from the investment amount for applications received. QUANTUM NIFTY ETF 29
30 Quantum Nifty ETF Performance as on November 30, 2017 Mr. Hitendra Parekh is the Fund Manager effective from July 10, Performance of the Benchmark Nifty 50 Total Additional S&P BSE Sensex Returns Returns (%) (%) Returns Returns (%)Index # (%) Benchmark Returns (%) Current Value ` 10,000 Invested at the beginning of a given period Returns (%) ## S&PSensex BSE Total S&P BSE Nifty (`) 50S&P BSE- 30 Returns Index Sensex TRI (RS.) (`) Returns # (`) (RS.) ## Quantum QuantumNifty Tax Saving ETF Fund November 30, 2016 to November 30, 2017 (1 year) ,555 12,591 12,437 November 28, 2014 to November 30, 2017 (3 years) ,271 12,356 11,553 November 30, 2012 to November 30, 2017 (5 years) ,287 18,482 17,140 November 30, 2010 to November 30, 2017 (7 years) ,726 18,993 16, ,549 27,486 23,804 Since Inception (10th July 2008) Past performance may or may not be sustained in the future. Returns are calculated on the basis of Compounded Annualized Growth Rate (CAGR). ^^Tracking Error :0.069% The being Exchange Traded Fund has one plan to invest through stock exchange and having a single expense structure. Portfolio as on November 30, 2017 Name of Instrument Industry+ Quantity Market % to Net Value In Assets Lakhs EQUITY & EQUITY RELATED A) Listed /Awaiting listing on the Stock Exchanges 1. HDFC Bank Limited 2. Reliance Industries Limited 3. Housing Development Finance Corporation Limited 4. ITC Limited 5. ICICI Bank Limited 6. Infosys Limited 7. Larsen & Toubro Limited 8. Kotak Mahindra Bank Limited 9. Tata Consultancy Services Limited 10. State Bank of India 11. Maruti Suzuki India Limited 12. Axis Bank Limited 13. Hindustan Unilever Limited 14. IndusInd Bank Limited 15. Tata Motors Limited 16. Bharti Airtel Limited 17. Mahindra & Mahindra Limited 18. Sun Pharmaceutical Industries Limited 19. Yes Bank Limited 20. NTPC Limited 21. Vedanta Limited 22. Asian Paints Limited 23. Oil & Natural Gas Corporation Limited 24. HCL Technologies Limited 25. Hero MotoCorp Limited 26. Tata Steel Limited 27. Power Grid Corporation of India Limited 28. Bajaj Auto Limited 29. UltraTech Cement Limited 30. Indian Oil Corporation Limited 31. Bajaj Finance Limited 32. Eicher Motors Limited 33. Bharat Petroleum Corporation Limited 34. Indiabulls Housing Finance Limited 35. Wipro Limited 30 Banks Petroleum Products Finance Consumer Non Durables Banks Software Construction Project Banks Software Banks Auto Banks Consumer Non Durables Banks Auto Telecom - Services Auto Pharmaceuticals Banks Power Non - Ferrous Metals Consumer Non Durables Oil Software Auto Ferrous Metals Power Auto Cement Petroleum Products Finance Auto Petroleum Products Finance Software QUANTUM NIFTY ETF 2,471 4,018 1,932 10,329 7,773 2,421 1,493 1, , , ,273 1, ,337 2,220 3,687 2, , , , ,
31 36. Coal India Limited Minerals/Mining 37. Hindalco Industries Limited Non - Ferrous Metals 38. Adani Ports and Special Economic Zone Limited Transportation 39. Hindustan Petroleum Corporation Limited Petroleum Products 40. Zee Entertainment Enterprises Limited Media & Entertainment 41. Tech Mahindra Limited Software 42. Cipla Limited Pharmaceuticals 43. GAIL (India) Limited Gas 44. Dr. Reddy's Laboratories Limited Pharmaceuticals 45. Bharti Infratel Limited Telecom - Equipment & Accessories 46. UPL Limited Pesticides 47. Lupin Limited Pharmaceuticals 48 Aurobindo Pharma Limited Pharmaceuticals 49. Ambuja Cements Limited Cement 50. Bosch Limited Auto Ancillaries B) Unlisted Total of all Equity MONEY MARKET INSTRUMENTS A) Collateralised Borrowing & Lending Obligation (CBLO)* Net Receivable/(payable) Grand Total 1,579 1, * Cash & Cash Equivalents Portfolio Turnover Ratio (Last one year): 26.87% Industry Allocation (% of Net Assets) as on November 30, 2017 Banks Software Petroleum Products Auto Consumer Non Durables Finance Pharmaceuticals Construction Project Power Non - Ferrous Metals Telecom - Services Cement Oil Ferrous Metals Minerals/Mining Transportation Media & Entertainment Gas Telecom - Equipment & Accessories Pesticides Auto Ancillaries 26.90% 11.20% 10.57% 9.82% 9.16% 8.78% 3.97% 3.80% 2.55% 2.28% 1.66% 1.61% 1.29% 1.18% 0.91% 0.79% 0.79% 0.76% 0.68% 0.67% 0.47% 0% Brokerages & Commissions Details. Brokerages on Investments for Distributor Commissions paid during NAV (as on November 30, 2017) Growth Option (`/Unit) % 10% 15% 20% 25% ` AUM (as on November 30, 2017) ` (In Crores) Average AUM* 4.82 Absolute AUM 4.77 *Cumulative Daily AuM /No of days in the month ^^ Note: Tracking Error is calculated on Annualised basis using 3 years history of daily returns. Definitions Tracking Error is a measure of how closely a fund follows the index to which it is benchmarked. The more passively the fund is managed, the smaller the tracking error. In the case of Exchange Traded Funds, the lower the Tracking Error, the better. Portfolio Turnover Ratio is the percentage of a funds assets that have changed over the course of a year. QUANTUM NIFTY ETF 31
32 SCHEME PERFORMANCE - FUND MANAGER-WISE ATUL KUMAR / ESH SHETTY QUANTUM LONG TERM EQUITY FUND Mr. Atul Kumar effective from November 15, 2006 Name of Name of Instrument Instrument Mr. Nilesh Shetty effective from March 28, 2011 Market Value In November Lakhs 30, 2012 to November 30, 2016 to November 28, 2014 to November 30, 2017 (1 year) November 30, 2017 (3 years) November 30, 2017 (5 years) S&P BSE 30 TRI S&P BSE 30 TRI S&P BSE 30 TRI Return % Return % Return % Quantum Long Term Equity Fund - Direct Plan - Growth Option Past performance may or may not be sustained in the future. Load is not taken into consideration in Return Calculation. Returns are calculated on the basis of Compounded Annualized Growth Rate (CAGR). Different Plans shall have different expense structure. Mr. Atul Kumar & Mr. Nilesh Shetty co-manages 2 schemes of Quantum Mutual Fund. ATUL KUMAR / SORBH GUPTA QUANTUM TAX SAVING FUND Name of Instrument Mr. Atul Kumar effective from December 23, 2008 Mr. Sorbh Gupta effective from October 1, 2016 Market30, 2012 to November 30, 2016 to November November 28, 2014 to Value November 30, 2017 (1 year) November 30, 2017 (3 years) November 30,In 2017 (5 years) Lakhs S&P BSE 30 TRI S&P BSE 30 TRI S&P BSE 30 TRI Return % Return % Return % Quantum Tax Saving Fund - Direct Plan - Growth Option Past performance may or may not be sustained in the future. Returns are calculated on the basis of Compounded Annualized Growth Rate (CAGR). Different Plans shall have different expense structure. Mr. Atul Kumar manages 2 schemes, Mr. Sorbh Gupta co-manages 1 scheme of the Quantum Mutual Fund. CHIRAG MEHTA / ESH SHETTY QUANTUM MULTI ASSET FUND Name ofmehta, Instrument Mr. Chirag Mr Nilesh Shetty effective from July 11,2012 Market30, 2012 to November 30, 2016 to November November 28, 2014 to Value30,In2017 (5 years) November 30, 2017 (1 year) November 30, 2017 (3 years) November Lakhs Benchmark Benchmark Benchmark Benchmark Benchmark Return % Return % (%)# ReturnsReturn (%) # %Return % Return Returns Returns (%) # Return (%)#(%) # Quantum Multi Asset Fund - Direct Plan Past performance may or may not be sustained in the future. Load is not taken into consideration in Return Calculation. # Indicates CRISIL Composite Bond Fund Index (40%) + S&P BSE Total Return Index (40%) + Domestic price of Gold (20%) Returns are calculated on the basis of Compounded Annualized Growth Rate (CAGR). Different Plans shall have different expense structure. Mr. Chirag Mehta manages 4 schemes of the Quantum Mutual Fund. Mr. Nilesh Shetty manages 2 schemes of the Quantum Mutual Fund. 32 SCHEME PERFORMANCE - FUND MANAGER - WISE
33 CHIRAG MEHTA QUANTUM GOLD SAVINGS FUND Mr. Chirag Mehta effective from May 19, Name Name of of Instrument Instrument November 30, 2016 to November 30, 2012 to November 28, 2014 to November 30, 2017 (1 year) November 30, 2017 (3 years) November 30, 2017 (5 years) Domestic price Domestic price Domestic price of Gold of Gold of Gold Return % Return % Return % Quantum Gold Savings Funds - Direct Plan Past performance may or may not be sustained in the future. Load is not taken into consideration in Return Calculation. Returns are calculated on the basis of Compounded Annualized Growth Rate (CAGR). Different Plans shall have different expense structure. Mr. Chirag Mehta manages 4 schemes of the Quantum Mutual Fund. CHIRAG MEHTA QUANTUM GOLD FUND Name of Instrument Name ofmehta Instrument Mr. Chirag effective from May 01, November 30, 2016 to November 30, 2012 to November 28, 2014 to November 30, 2017 (1 year) November 30, 2017 (3 years) November 30, 2017 (5 years) Domestic price Domestic price Domestic price of Gold of Gold of Gold Return % Return % Return % Quantum Gold Fund (ETF) Past performance may or may not be sustained in the future. Returns are calculated on the basis of Compounded Annualized Growth Rate (CAGR). Mr. Chirag Mehta manages 4 schemes of the Quantum Mutual Fund. The being Exchange Traded Fund has one plan to invest through stock exchange and having a single expense structure. CHIRAG MEHTA QUANTUM EQUITY FUND OF FUNDS Mr. ChiragofMehta effective from November 1, 2013 Name Instrument Quantum Equity Fund of Funds - Direct Plan - Growth Option November 30, 2016 to November 30, 2012 to November 28, 2014 to November 30, 2017 (1 year) November 30, 2017 (3 years) November 30, 2017 (5 years) S&P BSE S&P BSE S&P BSE 200 Index 200 Index 200 Index Return % Return Return % Return % (%) Past performance may or may not be sustained in the future. Load is not taken into consideration in Return Calculation. Returns are calculated on the basis of Compounded Annualized Growth Rate (CAGR). Different Plans shall have different expense structure. Mr. Chirag Mehta manages 4 schemes of the Quantum Mutual Fund. SCHEME PERFORMANCE - FUND MANAGER - WISE 33
34 PANKAJ PATHAK QUANTUM LIQUID FUND Mr. Pankaj effective from March 1, 2017 Name ofpathak Instrument Name of Instrument Quantum Liquid Fund - Direct Plan - Growth Option Market Market30, 2012 to November 30, 2016 to November November 28, 2014 to Value Value30,In In2017 (5 years) November 30, 2017 (1 year) November 30, 2017 (3 years) November Lakhs Crisil Liquid Crisil Liquid Lakhs Crisil Liquid Fund Index Return % Fund Index Fund Index Return % Return % Past performance may or may not be sustained in the future. Returns are calculated on the basis of Compounded Annualized Growth Rate (CAGR). Different Plans shall have different expense structure. Mr. Pankaj Pathak manages 2 schemes of the Quantum Mutual Fund. PANKAJ PATHAK QUANTUM DYNAMIC BOND FUND Mr. Pankaj effective from March 01, 2017 Name ofpathak Instrument Quantum Dynamic Bond Fund - Direct Plan - Growth Option Market30, 2012 to November 30, 2016 to November November 28, 2014 to Value30,In2017 (5 years) November 30, 2017 (1 year) November 30, 2017 (3 years) November CRISIL Composite CRISIL Composite CRISIL Composite LakhsBenchmark Fund Index Return % Bond Fund Index Return % Bond Fund Index Return % Bond Return % Return (%)#(%) Return Past performance may or may not be sustained in the future. Returns are calculated on the basis of Compounded Annualized Growth Rate (CAGR). Different Plans shall have different expense structure. Mr. Pankaj Pathak manages 2 schemes of the Quantum Mutual Fund. The scheme has been in existence for more than 1 year but less than 3 years from inception. 34 SCHEME PERFORMANCE - FUND MANAGER - WISE
35 DetailsTHE & Risk Factors HOW TOStatutory READ FACTSHEET Fund Manager : An employee of the asset management company such as a mutual fund or life insurer, who manages investments of the scheme. He is usually part of a larger team of fund managers and research analysts. Application Amount for Fresh Subscription : This is the minimum investment amount for a new investor in a mutual fund scheme. Minimum Additional Amount : This is the minimum investment amount for an existing investor in a mutual fund scheme. Yield to Maturity : The Yield to Maturity or the YTM is the rate of return anticipated on a bond if held until maturity. YTM is expressed as an annual rate. The YTM factors in the bond's current market price, par value, coupon interest rate and time to maturity. SIP : SIP or systematic investment plan works on the principle of making periodic investments of a fixed sum. It works similar to a recurring bank deposit. For instance, an investor may opt for an SIP that invests ` 500 every 15th of the month in an equity fund for a period of three years. NAV : The NAV or the net asset value is the total asset value per unit of the mutual fund after deducting all related and permissible expenses. The NAV is calculated at the end of every business day. It is the value at which the investor enters or exits the mutual fund. Benchmark : A group of securities, usually a market index, whose performance is used as a standard or benchmark to measure investment performance of mutual funds, among other investments. Some typical benchmarks include the Nifty, Sensex, BSE200, BSE500, 10-Year Gsec. Entry Load : A mutual fund may have a sales charge or load at the time of entry and/or exit to compensate the distributor/agent. Entry load is charged at the time an investor purchases the units of a mutual fund. The entry load is added to the prevailing NAV at the time of investment. For instance, if the NAV is ` 100 and the entry load is 1%, the investor will enter the fund at Rs 101. Note: SEBI, vide circular dated June 30, 2009 has abolished entry load and mandated that the upfront commission to distributors will be paid by the investor directly to the distributor, based on his assessment of various factors including the service rendered by the distributor Exit Load : Exit load is charged at the time an investor redeems the units of a mutual fund. The exit load is deducted from the prevailing NAV at the time of redemption. For instance, if the NAV is ` 100 and the exit load is 1%, the redemption price would be Rs 99 Per Unit. Modified Duration : Modified duration is the price sensitivity and the percentage change in price for a unit change in yield Standard Deviation : Standard deviation is a statistical measure of the range of an investment's performance. When a mutual fund has a high standard deviation, its means its range of performance is wide, implying greater volatility. Sharpe Ratio : The Sharpe Ratio, named after its founder, the Nobel Laureate William Sharpe, is a measure of risk-adjusted returns. It is calculated using standard deviation and excess return to determine reward per unit of risk. Beta : Beta is a measure of an investment's volatility vis-à-vis the market. Beta of less than 1 means that the security will be less volatile than the market. A beta of greater than 1 implies that the security's price will be more volatile than the market. AUM : AUM or assets under management refers to the recent / updated cumulative market value of investments managed by a mutual fund or any investment firm. Holdings : The holdings or the portfolio is a mutual fund's latest or updated reported statement of investments/securities. These are usually displayed in terms of percentage to net assets or the rupee value or both. The objective is to give investors an idea of where their money is being invested by the fund manager. Nature of : The investment objective and underlying investments determine the nature of the mutual fund scheme. For instance, a mutual fund that aims at generating capital appreciation by investing in stock markets is an equity fund or growth fund. Likewise, a mutual fund that aims at capital preservation by investing in debt markets is a debt fund or income fund. Each of these categories may have sub-categories. Rating Profile : Mutual funds invest in securities after evaluating their creditworthiness as disclosed by the ratings. A depiction of the mutual fund in various investments based on their ratings becomes the rating profile of the fund. Typically, this is a feature of debt funds. SCHEME PERFORMANCE - FUND MANAGER - WISE 35

36 Details & Risk STATUTORYStatutory DETAILS & Factors RISK FACTORS Disclaimer, Statutory Details & Risk Factors: Mutual fund investments are subject to market risks read all scheme related documents carefully. Please visit to read scheme specific risk factors. Investors in the (s) are not being offered a guaranteed or assured rate of return and there can be no assurance that the schemes objective will be achieved and the NAV of the scheme(s) may go up and down depending upon the factors and forces affecting securities market. Investment in mutual fund units involves investment risk such as trading volumes, settlement risk, liquidity risk, default risk including possible loss of capital. Past performance of the sponsor / AMC / Mutual Fund does not indicate the future performance of the (s). Statutory Details:Quantum Mutual Fund (the Fund) has been constituted as a Trust under the Indian Trusts Act, Sponsor : Quantum Advisors Private Limited. (liability of Sponsor limited to ` 1,00,000/-) Trustee : Quantum Trustee Company Private Limited Investment Manager : Quantum Asset Management Company Private Limited. The Sponsor, Trustee and Investment Manager are incorporated under the Companies Act, Specific Risk Factors : The investors of Quantum Equity Fund of Funds, Quantum Gold Savings Fund and Quantum Multi Asset Fund will bear the recurring expenses, transaction charges and loads if any of the s in addition to the expenses, transaction charges and loads of the underlying s. Disclaimer of IISL: Quantum Nifty ETF (Q NIFTY) is benchmarked to Nifty 50 TRI Index are not sponsored, endorsed, sold or promoted by India Index Services & Products Limited (IISL). IISL is not responsible for any errors or omissions or the results obtained from the use of such index and in no event shall IISL have any liability to any party for any damages of whatsoever nature (including lost profits) resulted to such party due to purchase or sale or otherwise of such product benchmarked to such index. Please refer SID of the Q NIFTY for full Disclaimer clause in relation to the Nifty 50 TRI Index". Disclaimer of NSE: It is to be distinctly understood that the permission given by National Stock Exchange of India Limited (NSE) should not in any way be deemed or construed that the Information Document (SID) of Quantum Gold Fund (QGF) and Quantum Nifty ETF (Q NIFTY) has been cleared or approved by NSE nor does it certify the correctness or completeness of any of the contents of the SIDs. The investors are advised to refer to the SID of Q NIFTY for the full text of the Disclaimer clause of NSE. Want To Have The Latest Information About Us? Registered Office: Quantum Asset Management Company Pvt Ltd. 505, Regent Chambers, 5th floor, Nariman Point, Mumbai Corporate Identity Number (CIN): U65990MH2005PTC The Factsheet Published as on 11 December SCHEME PERFORMANCE - FUND MANAGER - WISE
Scheme Features yrs. 13-Mar % Growth Dividend (Dividend Option will in turn have two Investment Options
 QUANTUM LONG TERM EQUITY FUND An Open ended Equity Nature of Features An Open-ended Equity Equity Investment Objective The investment objective of the is to achieve long-term capital appreciation by investing
QUANTUM LONG TERM EQUITY VALUE FUND
 QUANTUM LONG TERM EQUITY VALUE FUND An Open Ended Equity following a Value Investment Strategy Investment Objective : The investment objective of the is to achieve long-term capital appreciation by investing
Scheme Features. 10 yrs. 13-Mar Mar % 1.25% 1.25% Facility) Purchase : ` 500/- and in multiples of ` 1/- thereafter.
 Purchase : ` 500/- and in multiples of ` 1/- thereafter.") An Open ended Equity Features Nature of Investment Objective An Open-ended Open-ended Equity Equity The investment objective of the is to achieve long-term capital by investing investingprimarily primarilyinin
An Open ended Equity Features Nature of Investment Objective An Open-ended Open-ended Equity Equity The investment objective of the is to achieve long-term capital by investing investingprimarily primarilyinin
QUANTUM LONG TERM EQUITY VALUE FUND
 QUANTUM LONG TERM EQUITY VALUE FUND An Open Ended Equity following a Value Investment Strategy Investment Objective : The investment objective of the is to achieve long-term capital appreciation by investing
QUANTUM TAX SAVING FUND
 QUANTUM TAX SAVING FUND An Open Ended Equity Linked Saving with a Statutory Lock in of 3 years and Tax Benefit Investment Objective : The investment objective of the is to achieve long-term capital appreciation
QUANTUM TAX SAVING FUND
 QUANTUM TAX SAVING FUND An Open Ended Equity Linked Saving with a Statutory Lock in of 3 years and Tax Benefit Investment Objective : The investment objective of the is to achieve long-term capital appreciation
QUANTUM LONG TERM EQUITY VALUE FUND
 QUANTUM LONG TERM EQUITY VALUE FUND An Open Ended Equity following a Value Investment Strategy Investment Objective : The investment objective of the is to achieve long-term capital appreciation by investing
QUANTUM EQUITY FUND OF FUNDS
 QUANTUM EQUITY FUND OF FUNDS An Open Ended Fund of Funds scheme Investing in Open Ended Diversified Equity s of Mutual Fund Investment Objective : The investment objective of the scheme is to generate
QUANTUM EQUITY FUND OF FUNDS
 QUANTUM EQUITY FUND OF FUNDS An Open Ended Fund of Funds scheme Investing in Open Ended Diversified Equity s of Mutual Fund Investment Objective : The investment objective of the scheme is to generate
QUANTUM TAX SAVING FUND
 QUANTUM TAX SAVING FUND An Open Ended Equity Linked Saving with a Statutory Lock in of 3 years and Tax Benefit Investment Objective : The investment objective of the is to achieve long-term capital appreciation
QUANTUM EQUITY FUND OF FUNDS
 QUANTUM EQUITY FUND OF FUNDS An Open Ended Fund of Funds scheme Investing in Open Ended Diversified Equity s of Mutual Fund Investment Objective : The investment objective of the scheme is to generate
INDEX QUANTUM DYNAMIC BOND FUND - QDBF QUANTUM NIFTY ETF - Q NIFTY HOW TO READ THE FACTSHEET. May 2018
 INDEX CONTENTS PAGE NO. 03 06 09 12 QUANTUM DYMIC BOND FUND - QDBF 15 18 21 24 27 QUANTUM NIFTY ETF - Q NIFTY 29 32 HOW TO READ THE FACTSHEET 35 36 36 QUANTUM VIEW FOR MAY 2018 Equity Outlook Atul Kumar-
Scheme Features. Purchase : ` 500/- and in multiples of ` 1/- thereafter. Additional Purchase: ` 500/- and in multiples of ` 1/- thereafter / 50 units
 An Open ended Fund of Fund Features Nature of An Open ended Fund of Fund Investment Objective The investment objective of the is to provide capital appreciation by predominantly investing in units of Quantum
INDEX QUANTUM DYNAMIC BOND FUND - QDBF QUANTUM NIFTY ETF - Q NIFTY HOW TO READ THE FACTSHEET. September 2017
 INDEX CONTENTS PAGE NO. 03 06 09 12 QUANTUM DYNAMIC BOND FUND - QDBF 15 18 21 24 27 QUANTUM NIFTY ETF - Q NIFTY 29 32 HOW TO READ THE FACTSHEET 35 36 36 QUANTUM VIEW FOR SEPTEMBER 2017 Equity Outlook Atul
INDEX QUANTUM DYNAMIC BOND FUND - QDBF QUANTUM NIFTY ETF - Q NIFTY HOW TO READ THE FACTSHEET. July 2017
 INDEX CONTENTS PAGE NO. 03 06 09 12 QUANTUM DYNAMIC BOND FUND - QDBF 15 18 21 24 27 QUANTUM NIFTY ETF - Q NIFTY 29 32 HOW TO READ THE FACTSHEET 35 36 36 QUANTUM VIEW FOR JULY 2017 Equity Outlook Atul Kumar-
QUANTUM EQUITY FUND OF FUNDS
 QUANTUM EQUITY FUND OF FUNDS An Open Ended Fund of Funds scheme Investing in Open Ended Diversified Equity s of Mutual Fund Investment Objective : The investment objective of the scheme is to generate
INDEX QUANTUM DYNAMIC BOND FUND - QDBF HOW TO READ THE FACTSHEET. April 2016
 INDEX CONTENTS PAGE NO. 03 06 09 12 QUANTUM DYNAMIC BOND FUND - QDBF 15 17 20 23 26 28 31 HOW TO READ THE FACTSHEET 35 36 36 QUANTUM VIEW FOR APRIL 2016 Equity Outlook Atul Kumar- Head - Equity Funds n
QUANTUM GOLD SAVINGS FUND
 QUANTUM GOLD SAVINGS FUND An Open Ended Fund of Fund Investing in Quantum Gold Fund Investment Objective : The investment objective of the is to provide capital appreciation by predominantly investing
INDEX QUANTUM DYNAMIC BOND FUND - QDBF 14. June 2015
 INDEX CONTENTS PAGE NO. 03 05 08 11 QUANTUM DYNAMIC BOND FUND - QDBF 14 16 19 22 25 27 30 33 33 QUANTUM VIEW FOR JUNE 2015 Equity Outlook Atul Kumar- Head - Equity Funds Debt Outlook Mr. Murthy Nagarajan
INDEX QUANTUM DYNAMIC BOND FUND - QDBF HOW TO READ THE FACTSHEET. October 2016
 INDEX CONTENTS PAGE NO. 03 06 09 12 QUANTUM DYNAMIC BOND FUND - QDBF 15 17 20 23 26 28 31 HOW TO READ THE FACTSHEET 35 36 36 QUANTUM VIEW FOR NOVEMBER 2016 I Equity Outlook scheme at end of the month stood
INDEX QUANTUM VIEW 03 QUANTUM LONG TERM EQUITY VALUE FUND - QLTEVF 06 QUANTUM TAX SAVING FUND - QTSF 10 QUANTUM EQUITY FUND OF FUNDS - QEFOF 14
 INDEX CONTENTS PAGE NO. QUANTUM VIEW 03 QUANTUM LONG TERM EQUITY VALUE FUND - QLTEVF 06 QUANTUM TAX SAVING FUND - QTSF 10 QUANTUM EQUITY FUND OF FUNDS - QEFOF 14 QUANTUM DYNAMIC BOND FUND - QDBF 18 QUANTUM
INDEX CONTENTS PAGE NO.
 INDEX CONTENTS PAGE NO. 03 05 08 11 14 17 20 23 25 28 31 31 QUANTUM VIEW FOR APRIL 2015 Equity Outlook Atul Kumar- Head - Equity Funds he S&P BSE Sensex fell by 3.38% during the month of on a total return
INDEX QUANTUM DYNAMIC BOND FUND - QDBF HOW TO READ THE FACTSHEET. September 2016
 INDEX CONTENTS PAGE NO. 03 06 09 12 QUANTUM DYNAMIC BOND FUND - QDBF 15 17 20 23 26 28 31 HOW TO READ THE FACTSHEET 35 36 36 QUANTUM VIEW FOR OCTOBER 2016 Equity Outlook Atul Kumar- Head - Equity Funds
Quantum Index Fund. Factsheet for the month of August, 2010
 Quantum Index Fund Factsheet for the month of August, 2010 Quantum Index Fund An Open ended Exchange Traded Fund Fact Sheet as on 31st August 2010 Net Asset Value as on August 31, 2010 (Rs./Unit) Growth
INDEX QUANTUM VIEW 03 QUANTUM LONG TERM EQUITY VALUE FUND - QLTEVF 08 QUANTUM TAX SAVING FUND - QTSF 12 QUANTUM EQUITY FUND OF FUNDS - QEFOF 16
 INDEX CONTENTS PAGE NO. QUANTUM VIEW 03 QUANTUM LONG TERM EQUITY VALUE FUND - QLTEVF 08 QUANTUM TAX SAVING FUND - QTSF 12 QUANTUM EQUITY FUND OF FUNDS - QEFOF 16 QUANTUM DYNAMIC BOND FUND - QDBF 20 QUANTUM
CONTENTS. page no. MARKET REVIEW HDFC Equity Fund... 5 HDFC Top 200 Fund... 6
 February 2017 CONTENTS page no. MARKET REVIEW... 3 HDFC Growth Fund... 4 HDFC Equity Fund... 5 HDFC Top 200 Fund... 6 HDFC Capital Builder Fund... 7 HDFC Core & Satellite Fund... 8 HDFC Premier Multi-Cap
CONTENTS. page no. MARKET REVIEW HDFC Equity Fund... 5 HDFC Top 200 Fund... 6
 March 2017 CONTENTS page no. MARKET REVIEW... 3 HDFC Growth Fund... 4 HDFC Equity Fund... 5 HDFC Top 200 Fund... 6 HDFC Capital Builder Fund... 7 HDFC Core & Satellite Fund... 8 HDFC Premier Multi-Cap
Published on 22 May 2017
 Published on 22 May 2017 QUANTUM LIQUID FUND (An open ended Liquid Scheme) Fact Sheet as on 19-May-17 Fund Size as on (Rs. in crores) 19-May-17 Absolute AUM DIRECT PLAN GROWTH OPTION 96.8866 DIRECT PLAN
A subsidiary of TVS Wealth Pvt Ltd
 A subsidiary of TVS Wealth Pvt Ltd IMMPL Annual Outlook 2019 2018 A CHALLENGING YEAR, BETTER STARTING POINT IN 2019 The year gone by The year 2018 was a challenging year for investors. Almost all asset
MONTHLY UPDATE NOVEMBER 2018
 MONTHLY UPDATE NOVEMBER 2018 November 2018 A champion is defined not by their wins but by how they can recover when they fall. Equity markets - Serena Williams Indices 31 st Oct 2018 30 th Nov 2018 1 Month
Quantum Mutual Fund. Factsheets for the month of July, 2010
 Quantum Mutual Fund Factsheets for the month of July, 2010 Quantum Long Term Equity Fund An Open ended Equity Scheme 5 Star Rated by Value Research~ Fact Sheet as on 31st July 2010 Net Asset Value as on
M O N T H L Y F A C T S H E E T M A Y Schemes - Product Labeling
 TIMES M O N T H L Y F A C T S H E E T M A Y 2 0 1 7 Schemes - Product Labeling Name of the Scheme This product is suitable for Investors who are seeking* Riskometer Taurus Starshare An open - ended equity
CONTENTS. page no. MARKET REVIEW HDFC Equity Fund... 5 HDFC Top 200 Fund HDFC Premier Multi-Cap Fund... 9 HDFC Large Cap Fund...
 October 2016 CONTENTS page no. MARKET REVIEW... 3 HDFC Growth Fund... 4 HDFC Equity Fund... 5 HDFC Top 200 Fund... 6 HDFC Capital Builder Fund... 7 HDFC Core & Satellite Fund... 8 HDFC Premier Multi-Cap
STRIVE FOR BALANCE BETWEEN GROWTH AND STABILITY.
 MAGNUM BALANCED FUND An Open-ended Balanced Scheme STRIVE FOR BALANCE BETWEEN GROWTH AND STABILITY. Invest in a mix of equity and debt with SBI Magnum Balanced. BALANCED FUNDS A Balanced aims to balance
Market Outlook. Nifty % Sensex %
 Market Outlook 22000 BSE NSE 6500 Key Indices 30-Apr-13 31-Mar-13 % Change 21000 20000 19000 18000 17000 16000 15000 6000 5500 5000 4500 4000 3500 Nifty 5930.20 5682.55 4.36% Sensex 19504.18 18835.77 3.55%
Presenting. (An Open-Ended Balanced Scheme) August 2012
 August 2012") Presenting HDFC Balanced Fund (An Open-Ended Balanced ) August 2012 1 Table of Contents Balanced Fund- Basics Product Rationale and Asset Allocation Pattern Investment Strategy Portfolio Composition Performance
Presenting HDFC Balanced Fund (An Open-Ended Balanced ) August 2012 1 Table of Contents Balanced Fund- Basics Product Rationale and Asset Allocation Pattern Investment Strategy Portfolio Composition Performance
CONTENTS. page no. MARKET REVIEW HDFC Equity Fund... 5 HDFC Top 200 Fund... 6
 April 2017 CONTENTS page no. MARKET REVIEW... 3 HDFC Growth Fund... 4 HDFC Equity Fund... 5 HDFC Top 200 Fund... 6 HDFC Capital Builder Fund... 7 HDFC Core & Satellite Fund... 8 HDFC Premier Multi-Cap
How much will your current lifestyle cost at 60?
 (MODERATE PLAN) How much will your current lifestyle cost at 60? DATE OF ALLOTMENT November 01,2011 BENCHMARK CRISIL Hybrid 25+75 - Aggressive Index (WEF From 1st February 2018) FUND SIZE: Rs.772.12 (Rs.
Franklin India Prima Plus*
 Franklin India Prima Plus* Add Scale & Scope to your portfolio November 2017 *Please refer Slide 9 for Product Label 0 What do Multi-caps offer? Diversification across SECTORS Relatively lower volatility
Product Labeling This product is suitable for investors who are seeking*: Riskometer
 Product Labeling This product is suitable for investors who are seeking*: Riskometer Long term capital appreciation. Investments in high growth companies along with the liquidity of an open-ended scheme
HSBC Mid-month Equity Investment Strategy. Release Date: 20 May 2011 For distributor / broker use only
 HSBC Mid-month Equity Investment Strategy Release Date: 20 May 2011 For distributor / broker use only 2 Index April 29,2011 May 13,2011 Returns (%) Sensex 19135 18531-3.1 Nifty 5749 5544-3.5 BSE 200 2363
How much will your current lifestyle cost at 60?
 (MODERATE PLAN) How much will your current lifestyle cost at 60? DATE OF ALLOTMENT November 01,2011 BENCHMARK CRISIL Hybrid 25+75 - Aggressive Index (WEF From 1st February 2018) FUND SIZE: Rs.856.45 (Rs.
How much will your current lifestyle cost at 60?
 (PROGRESSIVE PLAN) How much will your current lifestyle cost at 60? DATE OF ALLOTMENT November 01, 2011 BENCHMARK S&P BSE Sensex TRI (WEF From 1st February 2018) FUND SIZE Rs.474.87 (Rs. in Cr.) MONTHLY
Why Small and Midcap Companies
 August 2012 1 Why Small and Midcap Companies Superior Growth Growth Presence in generally new & faster growing segments MATURITY Ability to gain share due to DECLINE new technology, better products / services
MONTHLY UPDATE SEPTEMBER 2017
 MONTHLY UPDATE SEPTEMBER 2017 September 2017 "I am a better investor because I am a businessman and a better businessman because I am an investor. - Warren Buffett Equity Markets Indices 31 st Aug 2017
Equity Update May 2018
 Market Overview (as on April 30, 2018) Flows Apr-18 Mar-18 Feb-18 FIIs (Net Purchases / Sales) (Rs cr) MFs (Net Purchases / Sales) (Rs cr) Domestic Markets Macro Indicators GDP (YoY%) IIP (YoY%) Crude
Quantum Long Term Equity Fund
 Scheme Feature Quantum Long Term Equity Fund An Open ended Equity Scheme Fund Manager Fund Manager Total Experience Inception Date (Date of Allotment) Expense Ratio (Under each Oprion) Lock-in Period Net
How much will your current lifestyle cost at 60?
 (MODERATE PLAN) How much will your current lifestyle cost at 60? DATE OF ALLOTMENT November 01,2011 BENCHMARK CRISIL Hybrid 25+75 - Aggressive Index (WEF From 1st February 2018) FUND SIZE: Rs.733.18 (Rs.
Reliance Focused Large Cap Fund
 Reliance Focused Large Cap Fund Formerly, Reliance Equity Fund (An open ended Diversified Equity Scheme) To know more call us at 1800 300 11111 visit www.reliancemutual.com Download Free App Download with
M O N T H L Y F A C T S H E E T A U G U S T Schemes - Product Labeling
 TIMES M O N T H L Y F A C T S H E E T A U G U S T 2 0 1 7 Schemes - Product Labeling Name of the Scheme This product is suitable for Investors who are seeking* Riskometer Taurus Starshare An open - ended
Equity Update August 2018
 Market Overview (as on July 31, 2018) Flows July-18 June-18 May-18 FIIs (Net Purchases / Sales) (Rs cr) MFs (Net Purchases / Sales) (Rs cr) Domestic Markets Macro Indicators GDP (YoY%) IIP (YoY%) Crude
M O N T H L Y R E P O R T F E B R U A R Y Schemes - Product Labeling THIS PRODUCT IS SUITABLE FOR INVESTORS WHO ARE SEEKING*
 TIMES M O N T H L Y R E P O R T F E B R U A R Y 2 0 1 4 Schemes - Product Labeling Name of the Scheme Taurus Starshare An open end equity growth scheme Taurus Ethical Fund An open end equity oriented scheme
How much will your current lifestyle cost at 60?
 (PROGRESSIVE PLAN) How much will your current lifestyle cost at 60? DATE OF ALLOTMENT November 01, 2011 BENCHMARK S&P BSE Sensex TRI (WEF From 1st February 2018) FUND SIZE Rs.547.64 (Rs. in Cr.) MONTHLY
How much will your current lifestyle cost at 60?
 (MODERATE PLAN) How much will your current lifestyle cost at 60? DATE OF ALLOTMENT November 01,2011 BENCHMARK CRISIL Balanced Fund - Aggressive Index FUND SIZE Rs.370.53 (Rs. in Cr.) MONTHLY AVERAGE AUM
Mutual Fund Screener For the quarter ended Dec-17
 Mutual Fund Screener For the quarter ended Dec-17 Mutual Fund Screener What s Inside 01 Industry Size 02 Investor Trends 03 Inflow Outflow Analysis 04 Sector Update 05 Category Performance 06 Industry
Weekly Review June 29, 2018
 Weekly Review June 29, 2018 Key Economic News International Domestic According to the Commerce Department report, real Gross Domestic Product (GDP) of U.S. rose 2.0% YoY in the Mar quarter of 2018, slower
Mirae Asset Emerging Bluechip Fund (MAEBF)
") Mirae Asset Emerging Bluechip Fund (MAEBF) (An Open Ended Equity Fund) Product Literature December 2014 MAEBF Our Goal Our endeavour has been to Spot the Potential of Emerging Companies and consistently
Mirae Asset Emerging Bluechip Fund (MAEBF) (An Open Ended Equity Fund) Product Literature December 2014 MAEBF Our Goal Our endeavour has been to Spot the Potential of Emerging Companies and consistently
Equity Update October 2018
 Market Overview (as on September 28, 2018) Flows Sept-18 Aug-18 July-18 FIIs (Net Purchases / Sales) (Rs cr) MFs (Net Purchases / Sales) (Rs cr) Domestic Markets Macro Indicators GDP (YoY%) IIP (YoY%)
RBI Monetary Policy Update - RBI maintains the neutral stance with cautious outlook on inflation and growth
 RBI Monetary Policy Update - RBI maintains the neutral stance with cautious outlook on inflation and growth In the latest policy meeting, the RBI kept the key policy rate unchanged at 6% and maintained
How much will your current lifestyle cost at 60?
 (PROGRESSIVE PLAN) How much will your current lifestyle cost at 60? DATE OF ALLOTMENT November 01, 2011 BENCHMARK S&P BSE Sensex TRI (WEF From 1st February 2018) FUND SIZE Rs.467.54 (Rs. in Cr.) MONTHLY
Invesco India Dynamic Equity Fund (An open-ended equity scheme)
") Invesco India Dynamic Equity Fund (An open-ended equity scheme) September 2016 Suitable for investors who are seeking*: Capital appreciation over long-term Investment in focused portfolio of equity and
Invesco India Dynamic Equity Fund (An open-ended equity scheme) September 2016 Suitable for investors who are seeking*: Capital appreciation over long-term Investment in focused portfolio of equity and
CANARA ROBECO LARGE CAP+ FUND FEBRUARY 2018
 CANARA ROBECO LARGE CAP+ FUND FEBRUARY 2018 Canara Robeco Large Cap+ Fund The sign (+) in the name of the fund has been used in terms of asset allocation and not in return/yield An Open Ended Equity Scheme
Riskometer. *Investors should consult their financial advisers if in doubt about whether the product is suitable for them.
 1 Product Labeling This product is suitable for investors who are seeking*: Regular income and capital appreciation. To generate income by investing in arbitrage opportunities in the cash and derivatives
Reliance ETF Sensex An Open Ended Index Exchange Traded Fund [Rajiv Gandhi Equity Savings Scheme (RGESS) Qualified Scheme]
![Reliance ETF Sensex An Open Ended Index Exchange Traded Fund [Rajiv Gandhi Equity Savings Scheme (RGESS) Qualified Scheme]](/thumbs/75/72534747.jpg "Reliance ETF Sensex An Open Ended Index Exchange Traded Fund [Rajiv Gandhi Equity Savings Scheme (RGESS) Qualified Scheme]") Reliance ETF Sensex An Open Ended Index Exchange Traded Fund [Rajiv Gandhi Equity Savings Scheme (RGESS) Qualified Scheme] This product is suitable for investors who are seeking*: Product labels Long-term
Reliance ETF Sensex An Open Ended Index Exchange Traded Fund [Rajiv Gandhi Equity Savings Scheme (RGESS) Qualified Scheme] This product is suitable for investors who are seeking*: Product labels Long-term
Mutual Fund Screener For the quarter ended Jun -18
 Mutual Fund Screener For the quarter ended Jun -18 Mutual Fund Screener What s Inside 01 Industry Size 02 Investor Trends 03 Inflow Outflow Analysis 04 Sector Update 05 Category Performance 06 Industry
*Investors should consult their financial advisers if in doubt about whether the product is suitable for them.
 Product Labelling This product is suitable for investors who are seeking*: Long term capital appreciation Investment in diversified basket of equity stocks spanning the entire market capitalization spectrum
M O N T H L Y F A C T S H E E T N O V E M B E R Schemes - Product Labeling
 TIMES M O N T H L Y F A C T S H E E T N O V E M B E R 2 0 1 8 Schemes - Product Labeling Name of the Scheme This product is suitable for Investors who are seeking* Riskometer Taurus Starshare (Multi Cap)
KEY INFORMATION MEMORANDUM AND APPLICATION FORM FOR
 Axis Asset Management Company Limited (Investment Manager) KEY INFORMATION MEMORANDUM AND APPLICATION FORM FOR AXIS EQUITY FUND (An open-ended growth scheme) AXIS TRIPLE ADVANTAGE FUND (An open-ended hybrid
Reliance ETF Sensex An Open Ended Index Exchange Traded Fund [Rajiv Gandhi Equity Savings Scheme (RGESS) Qualified Scheme]
![Reliance ETF Sensex An Open Ended Index Exchange Traded Fund [Rajiv Gandhi Equity Savings Scheme (RGESS) Qualified Scheme]](/thumbs/74/70975708.jpg "Reliance ETF Sensex An Open Ended Index Exchange Traded Fund [Rajiv Gandhi Equity Savings Scheme (RGESS) Qualified Scheme]") Reliance ETF Sensex An Open Ended Index Exchange Traded Fund [Rajiv Gandhi Equity Savings Scheme (RGESS) Qualified Scheme] This product is suitable for investors who are seeking*: Product labels Long-term
Reliance ETF Sensex An Open Ended Index Exchange Traded Fund [Rajiv Gandhi Equity Savings Scheme (RGESS) Qualified Scheme] This product is suitable for investors who are seeking*: Product labels Long-term
Gratuity Fund Performance
 Gratuity Fund Performance Monthly Fund Update, December 11 IN THIS POLICY, THE INVESTMENT RISK IN INVESTMENT PORTFOLIO IS BORNE BY THE POLICYHOLDER ECONOMY ECONOMY Indicators Nov 2011 Dec 2011 M-o-M Variation
Invesco India Dynamic Equity Fund (An open-ended equity scheme)
") Invesco India Dynamic Equity Fund (An open-ended equity scheme) June 2017 Suitable for investors who are seeking*: Capital appreciation over long-term Investment in focused portfolio of equity and equity
Invesco India Dynamic Equity Fund (An open-ended equity scheme) June 2017 Suitable for investors who are seeking*: Capital appreciation over long-term Investment in focused portfolio of equity and equity
FIXED INCOME UPDATE 1
 1 FIXED INCOME UPDATE Abstract Rates are headed down on lower inflation Inflation is likely to hit the RBI s disinflationary path Bond yields may further fall on continuation of rate cuts Macro conditions
Equity Update December 2018
 Market Overview (as on November 30, 2018) Flows Nov-18 Oct-18 Sep-18 FIIs (Net Purchases / Sales) (Rs cr) MFs (Net Purchases / Sales) (Rs cr) Domestic Markets Macro Indicators GDP (YoY%) IIP (YoY%) Crude
Mirae Asset Emerging Bluechip Fund (MAEBF)
") Mirae Asset Emerging Bluechip Fund (MAEBF) (An Open Ended Equity Fund) Product Literature April 2015 MAEBF Our Goal Our endeavour has been to Spot the Potential of Emerging Companies and consistently outperform
Mirae Asset Emerging Bluechip Fund (MAEBF) (An Open Ended Equity Fund) Product Literature April 2015 MAEBF Our Goal Our endeavour has been to Spot the Potential of Emerging Companies and consistently outperform
CANARA ROBECO EMERGING EQUITIES. August 2018
 CANARA ROBECO EMERGING EQUITIES August 2018 Canara Robeco Emerging Equities Large & Mid Cap Fund - An open ended equity scheme investing in both large cap and mid cap stocks This product is suitable for
Motilal Oswal MidCap 100 ETF
 Motilal Oswal MidCap 100 ETF Product labeling This product is suitable for investors who are seeking* Return that corresponds generally to the performance of the NIFTY Midcap 100 index, subject to tracking
MONTHLY UPDATE FEBRUARY 2018
 MONTHLY UPDATE FEBRUARY 2018 February 2018 One of the reasons so many people get burned in the market is because they start buying as they see prices going up. Equity Markets - Robert Kiyosaki Indices
M O N T H L Y F A C T S H E E T F E B R U A R Y Schemes - Product Labeling
 TIMES M O N T H L Y F A C T S H E E T F E B R U A R Y 2 0 1 8 Schemes - Product Labeling Name of the Scheme This product is suitable for Investors who are seeking* Riskometer Taurus Starshare An open -
Think Of Us Before You Invest
 Think Of Us Before You Invest DATE OF ALLOTMENT March 31,1996 BENCHMARK S&P BSE Sensex FUND SIZE Rs.679.21 (Rs. in Cr.) MONTHLY AVERAGE AUM Rs.668.51 (Rs. in Cr.) EXIT LOAD Nil (Compulsory lock-in period
Axis Corporate Debt Fund. (An open ended debt scheme predominantly investing in AA+ and above rated corporate bonds)
") Axis Corporate Debt Fund (An open ended debt scheme predominantly investing in AA+ and above rated corporate bonds) Macro economic indicators are showing signs of stability Indicator Current* Outlook Inflation
Axis Corporate Debt Fund (An open ended debt scheme predominantly investing in AA+ and above rated corporate bonds) Macro economic indicators are showing signs of stability Indicator Current* Outlook Inflation
KEY INFORMATION MEMORANDUM AND APPLICATION FORM FOR
 Axis Asset Management Company Limited (Investment Manager) KEY INFORMATION MEMORANDUM AND APPLICATION FORM FOR AXIS EQUITY FUND (An open-ended growth scheme) AXIS ENHANCED ARBITRAGE FUND (An open-ended
Gratuity Fund Performance
 Gratuity Fund Performance Monthly Fund Update, May 13 IN THIS POLICY, THE INVESTMENT RISK IN INVESTMENT PORTFOLIO IS BORNE BY THE POLICYHOLDER ECONOMY ECONOMY S.No. Indicators Mar-13 Apr-13 M-o-M Variation
Mutual Fund Screener For the quarter ended Mar-18
 Mutual Fund Screener For the quarter ended Mar-18 Mutual Fund Screener What s Inside 01 Industry 02 Investor 03 Inflow Outflow 04 Sector Size Trends Analysis Update 05 Category Performance 06 Industry
Key Information Memorandum Cum Application Forms
 Key Information Memorandum Cum Application Forms Scheme Name This product is suitable for investors who are seeking* Scheme Name This product is suitable for investors who are seeking* AXIS EQUITY FUND
UTI Dual Advantage Fixed Term Fund Series IV I (1279 days)
") UTI Dual Advantage Fixed Term Fund Series IV I (1279 days) (A Close-ended Hybrid Scheme) NFO Opens: November 22, 2016 NFO Closes: December 06, 2016 RISKOMETER The product is suitable for investors who
UTI Dual Advantage Fixed Term Fund Series IV I (1279 days) (A Close-ended Hybrid Scheme) NFO Opens: November 22, 2016 NFO Closes: December 06, 2016 RISKOMETER The product is suitable for investors who
fun Equity Diversified Large Cap Index Diversified Mid Cap & Small Cap Diversified Multi Cap Balanced Diversified Theme Based Sector Tax Saver
 fun e ge Equity Diversified Large Cap Vision Fund... 02 Top 200 Fund... 03 Quant Plus Fund... 04 NRI Equity Fund... 05 Equity Fund... 06 Index Index Fund - Nifty Plan... 06 Index Fund - Sensex Plan...
Quantum Asset Management Company Private Limited Registered Office: 505, Regent Chambers, 5th Floor, Nariman Point, Mumbai
 Quantum Asset Management Company Private Limited Registered Office: 505, Regent Chambers, 5th Floor, Nariman Point, Mumbai-400 021. Quantum Long Term Equity Fund (An Open ended growth scheme with no assured
Reliance Capital Builder Fund II Series B (A Close Ended Equity Oriented Scheme)
") Reliance Capital Builder Fund II Series B (A Close Ended Equity Oriented Scheme) Offer for Sale of Units at Rs.10/- per unit during the new fund offer period Tenure 3 years from the date of allotment of
Reliance Capital Builder Fund II Series B (A Close Ended Equity Oriented Scheme) Offer for Sale of Units at Rs.10/- per unit during the new fund offer period Tenure 3 years from the date of allotment of
Franklin India Flexi Cap Fund*
 Franklin India Flexi Cap Fund* A flexible approach to allocate between Scale & Scope November 2017 *Please refer Slide 8 for Product Label 0 What do Multi-caps offer? Diversification across SECTORS Relatively
Aims to achieve the right blend of Growth and Tax Saving
 Aims to achieve the right blend of Growth and Tax Saving DATE OF ALLOTMENT March 31,1996 BENCHMARK S&P BSE Sensex FUND SIZE Rs.981.23 (Rs. in Cr.) MONTHLY AVERAGE AUM Rs.939.37 (Rs. in Cr.) EXIT LOAD Nil
Product Labeling. Investment in equity securities of NIFTY Midcap 100 index
 Title slide Product Labeling This product is suitable for investors who are seeking* Return that corresponds generally to the performance of the NIFTY Midcap 100 index, subject to tracking error. Investment
Managing your money using
 FACT SHEET - SEPTEMBER 2018 Managing your money using Value Investing principles! OF VALUING VALUE INVESTING! 2013-18 About the Fund Parag Parikh Long Term Equity Fund (PLTEF) is an open ended equity oriented
Reliance Capital Builder Fund II Series C (A Close Ended Equity Oriented Scheme)
") Reliance Capital Builder Fund II Series C (A Close Ended Equity Oriented Scheme) Offer for Sale of Units at Rs.10/- per unit during the new fund offer period Tenure 3 years from the date of allotment of
Reliance Capital Builder Fund II Series C (A Close Ended Equity Oriented Scheme) Offer for Sale of Units at Rs.10/- per unit during the new fund offer period Tenure 3 years from the date of allotment of
Prepaid SIP. new age thinking! Time to move with. Factsheet May A New Age Investment Plan
 Scan QR Code with your mobile and learn more. If you don t have the QR reader, simply download one of the many free applications available for your handset!!! Factsheet May 2013 Time to move with new age
Mutual Funds. Fortune Equity Brokers (India) Ltd.
 Ltd.") Mutual Funds A simple tool to achieve financial i goals.. What is Mutual Funds? Passed back to Generates Returns = Investor Pools money with Fund House Fund Managers invest in Capital Market Types of Mutual
Mutual Funds A simple tool to achieve financial i goals.. What is Mutual Funds? Passed back to Generates Returns = Investor Pools money with Fund House Fund Managers invest in Capital Market Types of Mutual
CANARA ROBECO BLUE CHIP EQUITY FUND
 CANARA ROBECO BLUE CHIP EQUITY FUND JULY 2018 CONTENTS Blue Chip Equity Funds Risk-Reward Matrix An Introduction Canara Robeco Blue Chip Equity Fund Investment Process Portfolio Performance Why Canara
Managing your money using
 FACT SHEET - AUGUST 2018 Managing your money using Value Investing principles! OF VALUING VALUE INVESTING! 2013-18 About the Fund Parag Parikh Long Term Equity Fund (PLTEF) is an open ended equity oriented
Reliance ETF NV20 (Formerly R*Shares NV20 ETF) An Open Ended Index Exchange Traded Fund [Rajiv Gandhi Equity Savings Scheme (RGESS) Qualified Scheme]
![Reliance ETF NV20 (Formerly R*Shares NV20 ETF) An Open Ended Index Exchange Traded Fund [Rajiv Gandhi Equity Savings Scheme (RGESS) Qualified Scheme]](/thumbs/80/82428439.jpg "Reliance ETF NV20 (Formerly R*Shares NV20 ETF) An Open Ended Index Exchange Traded Fund [Rajiv Gandhi Equity Savings Scheme (RGESS) Qualified Scheme]") Reliance ETF NV20 (Formerly R*Shares NV20 ETF) An Open Ended Index Exchange Traded Fund [Rajiv Gandhi Equity Savings Scheme (RGESS) Qualified Scheme] This product is suitable for investors who are seeking*:
Reliance ETF NV20 (Formerly R*Shares NV20 ETF) An Open Ended Index Exchange Traded Fund [Rajiv Gandhi Equity Savings Scheme (RGESS) Qualified Scheme] This product is suitable for investors who are seeking*:
Reliance Index Fund - Sensex Plan (An Open Ended Index Linked Scheme)
") ssssssssss Reliance Index Fund - Sensex Plan (An Open Ended Index Linked Scheme) Contents What does Index Fund mean? Page 2 Reasons to Invest in Index Fund Page 2 Reliance Index Fund Sensex Plan Page 2
ssssssssss Reliance Index Fund - Sensex Plan (An Open Ended Index Linked Scheme) Contents What does Index Fund mean? Page 2 Reasons to Invest in Index Fund Page 2 Reliance Index Fund Sensex Plan Page 2