INDEX QUANTUM DYNAMIC BOND FUND - QDBF HOW TO READ THE FACTSHEET. October 2016
|
|
|
- Felicia Cross
- 5 years ago
- Views:
Transcription
1
2 INDEX CONTENTS PAGE NO QUANTUM DYNAMIC BOND FUND - QDBF HOW TO READ THE FACTSHEET


3 QUANTUM VIEW FOR NOVEMBER 2016 I Equity Outlook scheme at end of the month stood at 13.5% Atul Kumar- Head - Equity Cash level in the QTSF was 13.5% at month end. The trimmed weight in two stocks during the month, both in the oil & gas space. n the month of, the BSE Sensex appreciated by 0.37% on total return basis. In the same month, the BSE Mid Cap Index rose 1.86% whereas BSE Small Cap Index saw a massive 5.28% increase. For the first ten months of this calendar year, Sensex has increased by 8.52%. In comparison, mid cap index has done quite well with 21.63% increase, taking the sheen off the 14.65% returns recorded by the small cap index. Reliance Industries stock declined 2.65% during the month. The sectors that performed well during the month were oil & gas (8.25% rise), metals and capital goods. IT and auto didn t perform as well during the month. We remain optimistic about Indian equities in the long run. Indian economy is unlikely to be significantly impacted by unfavourable situations in other parts of the globe. In fact, India has been a beneficiary of fall in commodity and energy prices. The country is a bright spot in world equities, given the high GDP growth which can continue. Investors can look to add moderately to their portfolios weight in equity, although equities have run up since the lows of February Earnings of companies are also bottoming out. Possibility of a sharp jump in listed companies profits seems to be around the corner. This will result in better fundamentals for equities, which have been FIIs sold stocks worth USD 746 million in. So lacking so far. Better monsoon and Pay Commission are shortfar in the calendar year, they have invested USD 6.76 billion in term triggers for the markets. Indian stocks. Domestic institutional investors (DIIs) Data Source: Bloomberg, RBI, Indiabudget.nic.in counterweighed the FII selling with purchases worth USD 1.2 billion during the month. The Indian Rupee depreciated 0.25% against the US Dollar during the month. Debt Outlook World economic growth has remained subdued for quite Murthy Nagarajan - Head - Fixed Income some time and is unlikely to change in the coming times. Trade amongst countries has slumped to a new low since the financial he debt market was range-bound in the month of crisis, as pointed by recent studies. A large part of the developed. However, the long end of the market world is in the process of monetary easing. This has kept interest was sold as the RBI auctioned Rs.3,000 crore instead rates in the zero to negative territory. Low interest rates have also played a part in keeping asset prices high throughout the of Rs.2,000 crore at the long end of the yield curve. This world. Equity, fixed income and real estate most asset classes additional supply reduced the artificial shortage of long-dated papers for insurance companies. The spread between 10-year have benefited from easy liquidity. and 30-year bonds widened to 32 basis points from 22 basis Global equity markets are likely to remain on tenterhooks. points. The long end of the yield curve saw selling from mutual Impending outcome of the US elections and probability of funds and banks. In the monetary policy review, the RBI interest rate hike in the USA are a few uncertainties looming in the financial markets. An increase in interest rates in the USA can Governor stated that achieving CPI target of 5% by March 2017 lead to withdrawal of FII money from emerging markets has upside risk. T The global markets also saw a sharp upward movement in including India. This can impact stock prices negatively in the short term. Similarly, there is a possibility of protectionist yields as macro-economic data continued to remain strong. measures impacting industries such as IT in case one of the Economic Confidence Index in the Eurozone area came at vs The 10-year German bond yield, which was trading at candidates comes to power in the US presidential elections. On the domestic side, the RBI had a monetary policy negative 0.02%, moved up to 0.165% levels. US economic data meeting. This was the first meeting where the interest rate was was positive with the minutes of the Fed meeting reflecting it decided by the Monetary Policy Committee (MPC) comprising was a close call not to hike rates in the September meeting. U.S members from within and outside the RBI. The committee unemployment rate continued to be around 4.9% levels and unanimously decided to cut rates by 25 bps. This was in contrast non-farm payroll quarterly average additions stood at 1,92,000 per month. The benefit of lower CPI inflation due to lower oil to markets polls which were split for rate cut. prices and strong Dollar which has made imports cheaper is Several companies declared their second quarter financial dissipating. results during the month. A few companies results did manage In its first monetary policy review, the Monetary Policy to surprise the markets on the positive side. That aside, most Committee (which consists of three members from the RBI and results pointed to tepid recovery of demand as reflected in their top line. There isn t much revival in the investment cycle too. three independent members) cut the repo rate and reverse repo However, this can change in the coming months. Effects of rates by 25 basis points. Accordingly, the repo rate and reverse Seventh Pay Commission, better monsoon (thus higher farm repo rate now stand at 6.25% and 5.75% respectively. However, what surprised the Debt Market was that there was no explicit income) are likely to be felt in the times to come. guidance on sticking to the self-imposed path of moving towards In QLTEF, three stocks were trimmed during the month 4% inflation target in the next year. The RBI Governor stated that owing to higher valuations. Two of them were in the oil & gas CPI inflation will remain in the band of 4% + /2%, as decided and space while one is a chemical company. The also added agreed with the government. As per the monetary policy report, to weights in an existing capital goods stock. Cash level in the QUANTUM VIEW 3

4 excluding the effect of Goods and Services Tax and House Rent Allowance on CPI, the CPI inflation in 2017 should be around 4.5% levels. The governor also stated that the risk of 42% increase in minimum wages, higher oil prices and the effect of the Seventh Pay Commission would be inflationary. The GST rates announced by the government are as per market expectation and are not likely to lead to inflationary pressures in the economy. The liquidity position, which reflected a surplus of Rs.81,116 crore as on September 30, 2016, turned negative during the month due to currency outflow of Rs.48,900 crore owing to festive demand. The Government s surplus with the RBI has increased from Rs.32,100 crore to Rs.1,02,190 crore due to receipt of the first installment of telecom auction spectrum sales proceeds and shares buyback by PSU companies. The Government is also not spending aggressively as the fiscal deficit for the first half of the current year (April-September 2016) is 84% vs. 68% in April-September This is evidenced by the government s surplus balance with the RBI, which increased from Rs.38,284 crore as on September 30, 2016 to Rs.1,02,435 crore as on October 28, Liquidity deficit has reduced due to month-end spending of Rs.25,000 crore by the government on salaries and pensions. The liquidity deficit, which had peaked at Rs.50,000 crore, is now at a marginal deficit of Rs.1,889 crore as on November 01, % levels in September 2016, the case for federal fund rate hike is strong. The Fed Fund probability for December hike has moved to 80% versus 68% in the beginning of. The Indian currency has been remarkably stable and is trading in the range of to 67 Rupee to a Dollar despite the outflow on account of FCNR (B) redemptions of USD 20 billion in the month of October and November Indian debt markets face the uncertainties of U.S. elections and expectation of U.S yields rising in the coming months as the Fed starts hiking rates. However, the Indian markets would be guided by the trajectory of CPI inflation numbers. There is expectation of repo rate cut if CPI inflation sustains below 5% in the coming months due to good Rabi harvest and better supply management by the government. We expect debt markets to be range-bound with yields gradually moving down marginally. Liquidity is expected to improve due to forex purchases of USD 13 billion by the RBI in the forward markets. This should keep the money market rates well supported. Data Source: Bloomberg, RBI, Indiabudget.nic.in Gold Outlook Chirag Mehta - Senior Fund Manager Alternative Investments G old prices were under significant pressure as Fed prepares markets for a rate hike this December. Fed officials aren t missing a chance to talk up a rate hike with hawkish comments while putting forward their intention of a 0.25% hike in rates. However, there seems a clear lack of economic resilience as suggested by the latest data. Still, the Fed will have to raise rates by December in order to save face. The lackluster data suggests rate hikes beyond that will be gradual at best. The only thing capable of derailing the Fed s plan to hike rates is the prospect of a Donald Trump victory which got a boost from the FBI s probe against Hillary thereby narrowing the race for presidential elections. Trump win brings in the uncertainty factor and is therefore seen as aiding gold prices that managed to recover some of the earlier losses. All in all, Gold closed at $1,277.3 an ounce, a loss of -2.9% for the month, taking the YTD gains to 20.3%. CPI inflation reading for the month of September 2016 came at 4.31%. The market expectation on September CPI Inflation was 4.5%. Food inflation declined to 4.12% from 5.83% due to fall in prices of vegetables, fruits, eggs, meat and fish. Month-on-month CPI inflation index fell by 0.27% on an absolute basis. Food inflation had a steep fall of 0.94% on a month-to-month basis. However, core inflation increased to 4.88% in the month of September 2016 vs. 4.72% for the month of August CPI inflation is expected to decline further as the fall in wholesale prices of pulses is yet to reflect in CPI. We expect CPI inflation to fall to 4% levels by December 2016 due to good harvest. We believe the next reading of CPI inflation may come at 4.10% as the percolation of fall in wholesale prices of pulses is still not getting reflected in the retail prices. The government has been purchasing pulses from farmers as they are quoting below the minimum support prices (announced by the government for ) in the wholesale market. WPI inflation for the month A series of uneven economic data is enough evidence of of September 2016 was at 3.7% vs. market expectation of 3.9%. the economy running at stall speed. There have been a few This was due to fall in food inflation by 5.8% for the month of bright spots every now and then like the ISM rebound and September the jobless claims declining to the lowest since FIIs have sold debt holdings worth Rs.7,257 crore in the However, these bright spots aren t developing into month of, mainly in corporate bonds (Rs.4,740 sustainable strengths to put the economy on a robust growth crore). This may be partly due to the unattractive spread of 40- path. Many point to the higher-than-expected 2.9% 50 basis points between G-Secs and corporate bonds. However, annualized gain in the third-quarter GDP, the highest in two the main reason for FII selling is the expectation of hike in federal years, as signs of pick up in the economy. Digging in a little fund rates in the month of December The U.S. Fed deeper, one can make a reasonable case that it was actually a committee members, in their meeting on November 02, have disappointing GDP report than what appears in the headline indicated that the case for hiking federal fund rates has data. 0.9% of the gains were on account of increase in trade, strengthened. The reason why the Fed has not acted yet may be mainly contributed by surge in soybean exports which is a attributed to the closeness of the presidential election on one-time phenomenon. After being a sizeable drag on growth November 08. The Fed may want to look at the financial fallout for the preceding five quarters, inventories added a further of the elections before hiking rates. However, given the strong 0.6% points. Furthermore, apart from exports and non-farm payroll data and core CPI inflation moving towards 4 QUANTUM VIEW
5 inventories, the other news was not nearly as encouraging. Given the rebound in oil prices this year, there has been some revival in drilling activity. On the flip side, consumer spending growth slowed to 2.1%, residential investment contracted by 6.2% and equipment investment fell by 2.7%. This warrants more caution on the growth outlook for Q4 and beyond, given that Q3 GDP was supported by a transitory boost in net exports and strong inventory growth. More importantly, private final domestic sales slowed significantly, which is likely to lead to a more muted Q4 GDP print. Although that may not affect the policymakers decision to hike rates in December, it may change their longer term growth outlooks. Many argue that increase in inflation is proof that the current monetary policy is working. US headline and core CPI rose by 1.5%YoY and 2.2%YoY respectively in September. However, beyond the headline number, it seems there s not a significant increase in inflation. The shelter component of US CPI, which accounts for 33% of headline CPI and 42% of core CPI, rose by 3.4%YoY. Excluding shelter costs, US headline CPI and core CPI were up only 0.5%YoY and 1.3%YoY in September. Other measures, such as decline in durable goods orders by most in seven months and decline in consumer confidence, point towards the inherent weakness in the economy which does not bode well for the prospects of growth or inflation. wait to see how things pan out before moving on rates. While the impending interest rate increase will be a headwind in the short-term, the current weakness in prices will be relatively short-lived. Prices may rebound after the December Fed meeting (just like they did last year) when policy makers will decide whether to raise rates. The Fed is likely to increase rates once by the yearend and hold off from further tightening at least till the first half of the next year. The fact remains that even if the Fed raises rates in the future, it will stay behind the curve, leaving real interest rates negative. That s the biggest positive for gold in the medium to long term. There are several financial and geopolitical uncertainties in the world which would put a bid to gold prices. There are many doubts surrounding Brexit, U.S. election, Europe s banking system and further unconventional policies as a response to such issues. Gold will benefit as the market realizes that unconventional methods aren t working when it comes to monetary policy. Given the macroeconomic picture, gold will be a useful portfolio diversification tool which will help investors reduce the overall portfolio risk. Data Source: Bloomberg, World Gold Council Years of ultra-loose monetary policies with near-zero rates and billions of dollars of infusion through quantitative easing measures hasn t led growth to reach anywhere closer to post recessionary rebounds. US nominal GDP has risen by an annualized 3.7% since bottoming in 2009 and has now receded to 2.5%YoY. This compares with an annualized 6.5% growth since Furthermore, the trends in business investments and employment haven t been encouraging. There has been a marked slowdown in capex and hiring as well. Non-farm payrolls have slowed from 2,51,000 in 2014 to an average of 1,78,000 this year. Outlook The rally that took gold prices to the best first half in almost four decades is losing steam as traders price in increasing odds that interest rates will increase. It feels like Déjà vu as speculation surrounding the rate hikes drives gold lower. The December rate hike seems to be a given and markets are pricing in 78% probability of the same. To avoid a final blow of confidence, we believe that the Fed needs to hike rates in the next meeting. The only thing capable of derailing a rate hike can be a Trump victory in the presidential elections next week. The FBI's much-reprised surprise, the reopening of the case investigating Hillary Clinton s issues, has put the market on guard as the race for president has narrowed. If Hillary wins, then we see a rate hike in December. Else, if Trump wins, which in turn begets uncertainty, the Fed will Disclaimer: The views expressed above are for general information and reading purpose only and do not constitute any guidelines and recommendations on any course of action to be followed by the reader. The views are not meant to serve as a professional guide / investment advice / intended to be an offer or solicitation for the purchase or sale of any financial product or instrument or mutual fund units for the reader. The article has been prepared on the basis of publicly available information, internally developed data and other sources believed to be reliable. Whilst no action has been solicited based upon the information provided herein, due care has been taken to ensure that the facts are accurate and views given are fair and reasonable as on date. Readers of this article should rely on information/data arising out of their own investigations and advised to seek independent professional advice and arrive at an informed decision before making any investments. Mutual fund investments are subject to market risks read all scheme related documents carefully. QUANTUM VIEW 5
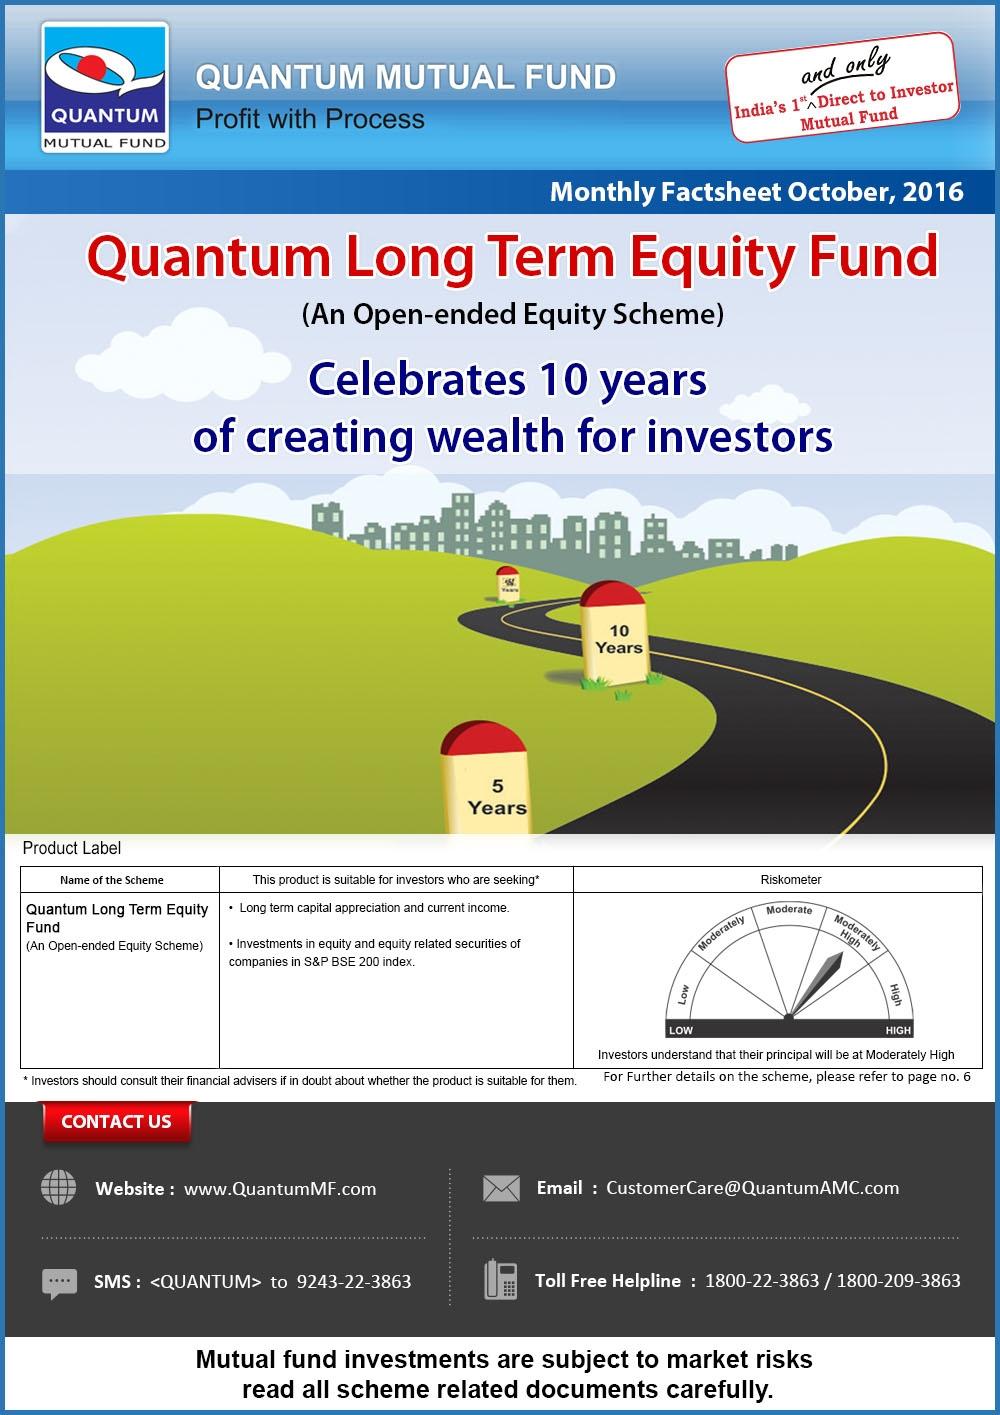
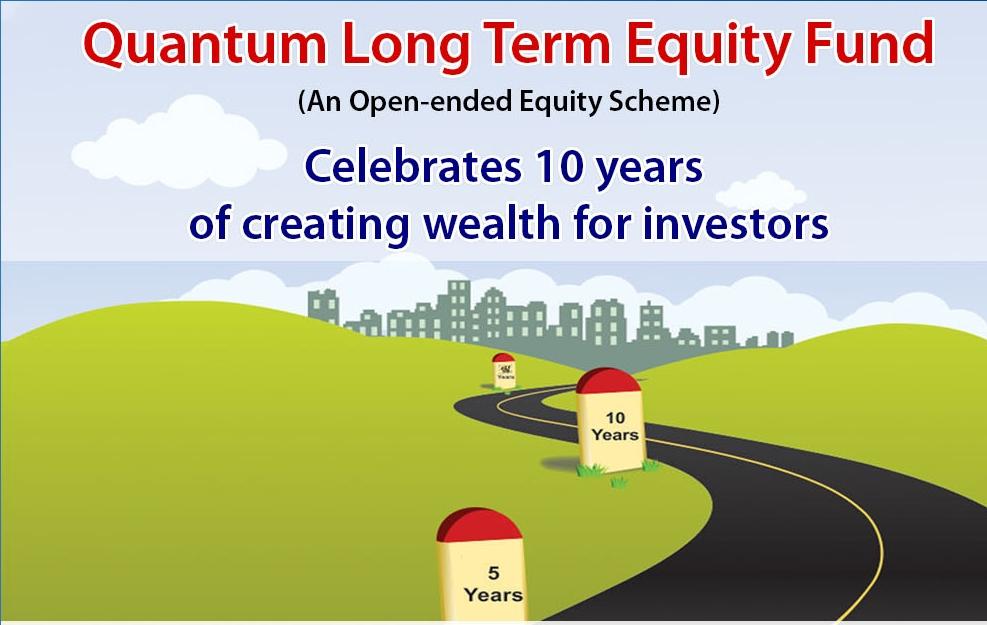
6 QUANTUM LONG TERM EQUITY FUND An Open ended Equity Features An Open-ended Equity Open-ended Equity The investment objective of the is to achieve long-term capital by investing investingprimarily primarilyinin shares of companies appreciation by shares of companies thatthat will will typically be be included included in in the the S&P S&P BSE BSE Index Indexand andare areininaaposition positiontoto typically benefit from from the theanticipated anticipatedgrowth growthand anddevelopment development Indian benefit of of thethe Indian economy and economy and its itsmarkets. markets. S&PLong BSE 30 Total Return Index Ÿ term capital appreciation. S&P BSE 30 Total Return Index Ÿ Investments in equity and equity related securities of companies in Mr. Atul Kumar ~ (( Since Mr.S&P AtulBSE Kumar Since November November 15, 15, 2006) 2006) 200 ~index yrs. yrs. Ÿ High Risk (BROWN) Mr. Nilesh Shetty Mr. Nilesh Shetty(Since (SinceMarch March28, 28,2011) 2011) Nature of Investment Objective Index Fund Manager Fund Manager s Total Experience Associate Fund Manager Total Experience Inception Date (Date of Allotment) Current Expense Ratio Total Expense Ratio (Weighted Average for the Month) Investment Options yrs. yrs. Minimum Application Amount (Under each Option) Purchase : ` 500/- and in multiples of ` 1/- thereafter. Purchase : ` 500/- and in multiples of ` 1/- thereafter. Purchase : ` 500/- and in multiples of ` 1/- thereafter/ 50 Purchase : ` 500/- and inrs. multiples of ` 1/- thereafter/ units. 13-Mar % 1.25% 1.25% Growth & Dividend (Dividend Option will in turn have two Growth & Dividend (Dividend Option will in turn have two Facilities, Facilities,Payout Dividend Payout and Dividend Re-investment Dividend Facility and Facility Dividend Re-investment Facility) Facility) 50 units. Every Business Day Normally despatched within 3-4 Business Days. Every Business Day Declaration of Net Asset Value (NAV) Redemption Proceeds Not Applicable Upfront commission to distributors will be paid by the investor directly to the distributor, based on his assessment of various factors including the service rendered by the distributor. Repurchase/ Redemption/Switch Out On or before 180 days from the date of allotment 4.00%, after 180 days but on or before 365 days from the date of allotment 3.00%, after 365 days but on or before 545 days from the date of allotment 2.00%, after 545 days but on or before 730 days from the date of allotment 1.00%, after 730 days from the date of allotment Nil Tax on Long Term Capital Gains - Nil Tax on Short Term Capital Gains - 15% Entry/ Sales Load Exit Load Taxation# Product Labeling Name of the 13-Mar-06 This product is suitable for investors who are seeking* Riskometer Moderate Mo d Hi era gh te High Low ly Quantum Long Term Long term capital appreciation and current income Equity Fund Investments in equity and equity related securities of (An Open-ended Equity companies in S&P BSE 200 index. ) HIGH LOW Investors understand that their principal will be at Moderately High Risk *Investors should consult their financial advisers if in doubt about whether the product is suitable for them. #The mentioned Tax Rates shall be increased by applicable surcharge, if any Education 2% and Secondary higher education 1% where ever as applicable. Equity oriented schemes will also attract Securities Transaction Tax 0.001% at the time of redemption and switch to other schemes. TRANSACTION CHARGES: In accordance with the SEBI Circular No.Cir / IMD / DF/13/2011 dated August 22, 2011, the AMC is allowed to deduct transaction charges of ` 100 for existing investors and ` 150 for a first time investor per subscription of ` 10,000 /- and above for the transaction / application received through distributors. The transaction charges shall be deducted by the AMC from the subscription amount received from the investor and paid to the distributor and the balance will be invested in the. Investors are requested to note that Quantum Mutual Fund is a direct to investor s Mutual Fund and no transaction charges shall be deducted from the investment amount for transactions / applications received from the distributor and full subscription amount will be invested in the. NAV (as of October 28, 2016) NAV per Unit Fund Size as on Growth Option Growth Option Dividend Option Dividend Option Total *Cumulative Daily AuM /No of days in the month 6 QUANTUM LONG TERM EQUITY FUND *Average AUM (` in crores) #Absolute AUM (` in crores) #AuM as on October 31, 2016
7 Quantum Long Term Equity Fund Performance as on September 30, 2016 The is co-managed by Atul Kumar and Nilesh Shetty. For other s Managed by Mr. Atul Kumar & Mr. Nilesh Shetty please refer SCHEME PERFORMANCE (FUND MANAGER-WISE) at end of the Factsheet. A. Cumulative performance Start Date 30-Sep-15 NAV per Unit Last 1 Year # 8.16 # 12,332 10,816 10, Sep-14 Last 2 Years ,295 10,769 10, Sep-13 Last 3 Years ,531 15,026 14,379 Returns up to 1 year period are Absolute Returns. Returns greater than 1 year period are compounded annualized (CAGR). # S&P BSE 30 TRI ## S&P BSE Sensex B. Discrete 12 month performance # # September 30, 2015 to September 30, ,332 10,816 10,654 September 30, 2014 to September 30, ,970 9,957 9,821 September 30, 2013 to September 30, ,072 13,953 13,741 Since Inception ** ,050 30,124 25,793 Returns up to 1 year period are Absolute Returns. Returns greater than 1 year period are compounded annualized (CAGR). # S&P BSE 30 TRI ## S&P BSE Sensex ** Inception Date: March 13, Since inception returns are calculated on NAV of ` 10 invested at inception. SIP Performance of Quantum Long Term Equity Fund as on September 30, 2016 Since Inception SIP Total Amount Invested (Rs. 000) 10 Years SIP 7 Years SIP 5 Years SIP 3 Years SIP 1 Year SIP 1, , , , , Returns (XIRR*) (%) Returns (XIRR*) (%) # Mkt Value as on September 30, 16 (Rs. 000) Returns (XIRR*) (%) ## ^^Standard Deviation: 15.42% Beta: 0.98 Sharpe Ratio: 1.00 Past performance may or may not be sustained in the future. # S&P BSE 30 TRI ## S&P BSE Sensex. Load is not taken into consideration and Returns are for Growth Option using applicable NAV on the SIP day (5th of every month). Return on SIP and are annualized and compounded investment return for cash flows resulting out of uniform and regular monthly subscriptions as on 5th day of every month (in case 5th is a non-business Day, then the next Business Day) and have been worked out using the Excel spreadsheet function known as XIRR. XIRR calculates the internal rate of return for series of cash flow. Assuming `. 10,000 invested every month on 5th day of every month (in case 5th is a non-business Day, then the next Business Day), the 1 year, 3 years, 5 years, 7 years, 10 years and since inception returns from SIP are annualized and compounded investment return computed on the assumption that SIP installments were received across the time periods from the start date of SIP from the end of the relevant period viz. 1 year, 3 years, 5 years, 7 years, 10 years and since Inception. *XIRR - XIRR calculates the internal rate of return to measure and compare the profitability of series of investments. Brokerage & Commissions Paid Brokerages Paid for investments for Distributor Commissions Paid till date ` 3,14, QUANTUM LONG TERM EQUITY FUND 7
8 Portfolio as on October 31, 2016 Industry / Rating Name of Instrument Quantity Market % to Net Value In Assets Lakhs EQUITY & EQUITY RELATED A) Listed /Awaiting listing on the Stock Exchange 1. Bajaj Auto Limited Auto 2. Housing Development Finance Corporation Limited Finance 3. Hero MotoCorp Limited Auto 4. Infosys Limited Software 5. Tata Consultancy Services Limited Software 6. Tata Motors Limited Auto 7. NTPC Limited Power 8. State Bank of India 9. ICICI Bank Limited 10. Oil & Natural Gas Corporation Limited Oil 11. Indian Oil Corporation Limited Petroleum Products 12. Exide Industries Limited Auto Ancillaries 13. Tata Chemicals Limited Chemicals 14. Cipla Limited Pharmaceuticals 15. GAIL (India) Limited Gas 16. The Indian Hotels Company Limited Hotels, Resorts And Other Recreational Activities 17. Wipro Limited Software 18. Power Grid Corporation of India Limited Power 19. Larsen & Toubro Limited Construction Project 20. PTC India Limited Power 21. Bharti Airtel Limited Telecom - Services 22. Petronet LNG Limited Gas 23. Tata Steel Limited Ferrous Metals 24. Kotak Mahindra Bank Limited B) Unlisted Total of all Equity MONEY MARKET INSTRUMENTS A) Treasury Bills (T-Bill) Days Tbill (MD 24/11/2016) Sovereign Total of T-Bill B) Collateralised Borrowing & Lending Obligation (CBLO)* Total of Money Market Instruments Net Receivable/(payable) Grand Total 1,54,584 3,02,660 1,13,355 3,43,867 1,17,275 5,22,181 16,09,289 8,96,884 8,31,878 7,90,026 6,51,922 10,22,865 3,73,961 3,08,989 3,94,638 13,84,725 3,45,781 9,13,744 1,03,593 19,23,659 4,30,317 3,39,720 2,99,024 1,33,648 4, , , , , , , , , , , , , , , , , , , , , , , , , , , , , * Cash & Cash Equivalents ^^Portfolio Turnover Ratio (Last one year): 17.24% Industry Allocation (% of Net Assets) as on October 31, 2016 Auto 17.80% Software 12.77% 9.29% Power 8.87% Finance 6.78% Gas 4.91% Oil 3.71% Petroleum Products 3.43% Auto Ancillaries Chemicals Pharmaceuticals Hotels, Resorts And Other Recreational Activities Construction Project Telecom - Services Ferrous Metals 0% % 2.91% 2.65% 2.48% 2.23% 1.97% 5% 10% 15% 20% ^^ Note: Standard Deviation, Sharpe Ratio & Beta are calculated on Annualised basis using 3 years history of monthly returns. Risk Free Rate assumed to be 6.50% (FBIL Overnight MIBOR for 30th September, 2016) for calculating Sharpe Ratio. Definitions Standard deviation measures historical volatility. A high standard deviation suggests high volatility, while lower standard deviation would refer to more stability. Beta is the tendency of a fund's returns to respond to market swings. A beta of 1 indicates that the fund price will move with the market. A beta of less than 1 means that thesecurity will be less volatile than the market. A beta of greater than 1 indicates that the security's price will be more volatile than the market. Sharpe Ratio is used to characterise how well the return of an asset compensates the investor for the risk taken. The greater a portfolio's Sharpe ratio, the better its risk-adjusted performance has been. Portfolio Turnover Ratio is the percentage of a funds assets that have changed over the course of a year. 8 QUANTUM LONG TERM EQUITY FUND
9 QUANTUM TAX SAVING FUND An open ended Equity Linked Saving with a lock-in period of three years Features Index Fund Manager Fund Manager s Total Experience An Open-ended Equity Linked Savings with a lock-in period of 3 years The investment objective of the is to achieve long-term capital appreciation by investing primarily in shares of companies that will typically be included in the S&P BSE 200 Index and are in a position to benefit from the anticipated growth and development of the Indian economy and its markets. S&P BSE 30 Total Return Index Mr. Atul Kumar ~ ( Since December 10, 2008) 16 yrs. Associate Fund Manager Total Experience Mr. Sorbh Gupta ( Since October 1, 2016) 11 yrs. Inception Date (Date of Allotment) Current Expense Ratio December 23, 2008 Total Expense Ratio (Weighted Average for the Month) 1.24% Investment Options Growth & Dividend Minimum Application Amount (Under each Option) Purchase: ` 500/- and in multiples of ` 500/- thereafter. Purchase: ` 500/- and in multiples of ` 500/- thereafter. Lock-in 3 years from the date of allotment of the respective Units Declaration of Net Asset Value (NAV) Redemption Proceeds Entry/ Sales Load Every Business Day Nature of Investment Objective 1.25% Normally despatched within 3-4 Business Days. Not Applicable Upfront commission to distributors will be paid by the investor directly to the distributor, based on his assessment of various factors including the service rendered by the distributor. Nil Exit Load # Tax on Long Term Capital Gains - Nil Tax on Short Term Capital Gains - 15% Taxation Product Labeling Name of the This product is suitable for investors who are seeking* Riskometer Quantum Tax Saving Fund Long term capital appreciation (An Open-ended Equity Investments in equity and equity related securities of Linked Savings ) companies in S&P BSE 200 index and to save tax u/s 80 C of the Income Tax Act. Investments in this product are subject to lock in period of 3 years. Moderate Mo d Hi era gh te High Low ly HIGH LOW Investors understand that their principal will be at Moderately High Risk * Investors should consult their financial advisers if in doubt about whether the product is suitable for them. #The mentioned Tax Rates shall be increased by applicable surcharge, if any Education 2% and Secondary higher education 1% where ever as applicable. Equity oriented schemes will also attract Securities Transaction Tax 0.001% at the time of redemption and switch to other schemes. TRANSACTION CHARGES: In accordance with the SEBI Circular No.Cir / IMD / DF/13/2011 dated August 22, 2011, the AMC is allowed to deduct transaction charges of ` 100 for existing investors and ` 150 for a first time investor per subscription of ` 10,000 /- and above for the transaction / application received through distributors. The transaction charges shall be deducted by the AMC from the subscription amount received from the investor and paid to the distributor and the balance will be invested in the. Investors are requested to note that Quantum Mutual Fund is a direct to investor s Mutual Fund and no transaction charges shall be deducted from the investment amount for transactions / applications received from the distributor and full subscription amount will be invested in the. NAV (as of October 28, 2016) NAV per Unit Growth Option Dividend Option Fund Size as on #Absolute AUM (` in crores) Growth Option Dividend Option Total *Cumulative Daily AuM /No of days in the month *Average AUM (` in crores) QUANTUM TAX SAVING FUND #AuM as on October 31,
10 Quantum Tax Saving Fund Performance as on September 30, 2016 For other s Managed by Mr. Atul Kumar please refer SCHEME PERFORMANCE (FUND MANAGER-WISE) at end of the Factsheet. A. Cumulative performance Start Date NAV per Unit # # 30-Sep-15 Last 1 Year ,363 10,816 10, Sep-14 Last 2 Years ,240 10,769 10, Sep-13 Last 3 Years ,447 15,026 14,379 Returns up to 1 year period are Absolute Returns. Returns greater than 1 year period are compounded annualized (CAGR). # S&P BSE 30 TRI ## S&P BSE Sensex B. Discrete 12 month performance # # September 30, 2015 to September 30, ,363 10,816 10,654 September 30, 2014 to September 30, ,901 9,957 9,821 September 30, 2013 to September 30, ,070 13,953 13,741 Since Inception ** ,530 32,315 28,767 Returns up to 1 year period are Absolute Returns. Returns greater than 1 year period are compounded annualized (CAGR). # S&P BSE 30 TRI ## S&P BSE Sensex ** Inception Date: Dec 23, Since inception returns are calculated on NAV of ` 10 invested at inception. SIP Performance of Quantum Tax Saving Fund as on September 30, 2016 Since Inception SIP Total Amount Invested (Rs. 000) 7 Years SIP 5 Years SIP 3 Years SIP 1 Year SIP , , Returns (XIRR*) (%) Returns (XIRR*) (%) # Mkt Value as on September 30, 16 (Rs. 000) Returns (XIRR*) (%) ## ^^Standard Deviation: 15.56% Beta: 0.99 Sharpe Ratio: 0.98 Past performance may or may not be sustained in the future. # S&P BSE 30 TRI ## S&P BSE Sensex. Load is not taken into consideration and Returns are for Growth Option using applicable NAV on the SIP day (5th of every month). Return on SIP and are annualized and compounded investment return for cash flows resulting out of uniform and regular monthly subscriptions as on 5th day of every month (in case 5th is a non-business Day, then the next Business Day) and have been worked out using the Excel spreadsheet function known as XIRR. XIRR calculates the internal rate of return for series of cash flow. Assuming `. 10,000 invested every month on 5th day of every month (in case 5th is a non-business Day, then the next Business Day), the 1 year, 3 years, 5 years and since inception returns from SIP are annualized and compounded investment return computed on the assumption that SIP installments were received across the time periods from the start date of SIP from the end of the relevant period viz. 1 year, 3 years, 5 years and since Inception. *XIRR - XIRR calculates the internal rate of return to measure and compare the profitability of series of investments. Brokerage & Commissions Paid Brokerages Paid for investments for Distributor Commissions Paid till date 10 ` 16, QUANTUM TAX SAVING FUND
11 Portfolio as on October 31, 2016 Industry Name of Instrument Quantity Market % to Net Value In Assets Lakhs EQUITY & EQUITY RELATED A) Listed /Awaiting listing on the Stock Exchange 1. Bajaj Auto Limited Auto 2. Housing Development Finance Corporation Limited Finance 3. Hero MotoCorp Limited Auto 4. Infosys Limited Software 5. Tata Consultancy Services Limited Software 6. Tata Motors Limited Auto 7. Oil & Natural Gas Corporation Limited Oil 8. State Bank of India 9. ICICI Bank Limited 10. NTPC Limited Power 11. Indian Oil Corporation Limited Petroleum Products 12. Tata Chemicals Limited Chemicals 13. Exide Industries Limited Auto Ancillaries 14. Cipla Limited Pharmaceuticals 15. Power Grid Corporation of India Limited Power 16. GAIL (India) Limited Gas 17. The Indian Hotels Company Limited Hotels, Resorts And Other Recreational Activities 18. Larsen & Toubro Limited Construction Project 19. Wipro Limited Software 20. PTC India Limited Power 21. Bharti Airtel Limited Telecom - Services 22. Petronet LNG Limited Gas 23. Tata Steel Limited Ferrous Metals 24. Kotak Mahindra Bank Limited B) Unlisted Total of all Equity MONEY MARKET INSTRUMENTS A) Collateralised Borrowing & Lending Obligation (CBLO)* Net Receivable/(payable) Grand Total 12,210 24,268 9,259 26,164 9,549 41,041 66,894 70,661 65,384 1,19,471 52,746 30,360 80,785 26,239 86,297 32,977 1,18,267 8,506 25,928 1,62,331 33,566 27,565 24,741 11, , , * Cash & Cash Equivalents ^^Portfolio Turnover Ratio (Last one year): 17.46% Industry Allocation (% of Net Assets) as on October 31, 2016 Auto Software Power Finance Gas Oil Petroleum Products Chemicals Auto Ancillaries Pharmaceuticals Hotels, Resorts And Other Recreational Activities Construction Project Telecom - Services Ferrous Metals 17.61% 12.31% 9.15% 9.11% 6.74% 5.02% 3.90% 3.44% 3.32% 3.23% 3.06% 2.81% 2.53% 0% 2.16% 2.02% 2% 4% 6% 8% 10% 12% 14% 16% 18% 20% ^^ Note: Standard Deviation, Sharpe Ratio & Beta are calculated on Annualised basis using 3 years history of monthly returns. Risk Free Rate assumed to be 6.50% (FBIL Overnight MIBOR for 30th September, 2016) for calculating Sharpe Ratio. Definitions Standard deviation measures historical volatility. A high standard deviation suggests high volatility, while lower standard deviation would refer to more stability. Beta is the tendency of a fund's returns to respond to market swings. A beta of 1 indicates that the fund price will move with the market. A beta of less than 1 means that thesecurity will be less volatile than the market. A beta of greater than 1 indicates that the security's price will be more volatile than the market. Sharpe Ratio is used to characterise how well the return of an asset compensates the investor for the risk taken. The greater a portfolio's Sharpe ratio, the better its risk-adjusted performance has been. Portfolio Turnover Ratio is the percentage of a funds assets that have changed over the course of a year. QUANTUM TAX SAVING FUND 11
12 QUANTUM EQUITY FUND OF FUNDS An Open ended Equity Fund of Funds Features Nature of An Open-ended Equity Fund of Funds Investment Objective Index Fund Manager The investment objective of the scheme is to generate long-term capital appreciation by investing in a portfolio of open-ended diversified equity schemes of mutual funds registered with SEBI. There can be no assurance of positive returns from following the stated investment strategy. S&P BSE 200 Index Mr. Chirag Mehta ~ (Since November 1, 2013) Fund Manager s Total Experience 11 yrs. Inception Date (Date of Allotment) July 20, 2009 Current Expense Ratio 0.50% Total Expense Ratio (Weighted Average for the Month) 0.50% Investment Options Growth & Dividend (Dividend Option will in turn have two Facilities, Dividend Payout Facility and Dividend Re-investment Facility) Minimum Application Amount (Under each Option) Purchase: ` 500/- and in multiples of ` 1/- thereafter. Purchase: ` 500/- and in multiples of ` 1/- thereafter/ 50 units Declaration of Net Asset Value (NAV) Every Business Day Redemption Proceeds Normally despatched within 3-4 Business Days. Entry/ Sales Load Not Applicable Upfront commission to distributors will be paid by the investor directly to the distributor, based on his assessment of various factors including the service rendered by the distributor. Exit Load Repurchase/ Redemption/ Switch Out On or before 365 days from the date of allotment 1.5 %. Product Labeling Name of the This product is suitable for investors who are seeking* Riskometer Moderate Mo d Hi era gh te High Low ly Quantum Equity Fund Long term capital appreciation of Funds Investments in portfolio of open-ended diversified (An Open-ended Equity equity schemes of mutual funds registered with SEBI Fund of Funds ) whose underlying investments are in equity and equity related securities of diversified companies HIGH LOW Investors understand that their principal will be at Moderately High Risk * Investors should consult their financial advisers if in doubt about whether the product is suitable for them. Tax on Capital Gains * Resident Individuals & HUF Long Term Short Term 20% with Indexation Maximum FII s / Overseas Financial Organisations 10% without Indexation Partnership Firm 20% with Indexation Non Resident Indians 10% without Indexation (on transfer of long term capital assets being unlisted securities) Maximum Indian Companies 20% with Indexation Foreign Companies 10% without Indexation (on transfer of long term capital assets being unlisted securities) 40% * The mentioned Tax Rates shall be increased by applicable surcharge, if any Education 2% and Secondary higher education 1% where ever as applicable. TRANSACTION CHARGES: In accordance with the SEBI Circular No.Cir / IMD / DF/13/2011 dated August 22, 2011, the AMC is allowed to deduct transaction charges of ` 100 for existing investors and ` 150 for a first time investor per subscription of ` 10,000 /- and above for the transaction / application received through distributors. The transaction charges shall be deducted by the AMC from the subscription amount received from the investor and paid to the distributor and the balance will be invested in the. Investors are requested to note that Quantum Mutual Fund is a direct to investor s Mutual Fund and no transaction charges shall be deducted from the investment amount for transactions / applications received from the distributor and full subscription amount will be invested in the. NAV (as of October 28, 2016) NAV per Unit Fund Size as on *Average AUM (` in crores) #Absolute AUM (` in crores) Growth Option Growth Option Dividend Option Dividend Option Total *Cumulative Daily AuM /No of days in the month 12 QUANTUM EQUITY FUND OF FUNDS #AuM as on October 31, 2016
13 Quantum Equity Fund of Funds Performance as on September 30, 2016 For other s Managed by Mr. Chirag Mehta please refer SCHEME PERFORMANCE (FUND MANAGER-WISE) at end of the Factsheet. A. Cumulative performance Start Date NAV per Unit # # 30-Sep-15 Last 1 Year ,404 11,096 10, Sep-14 Last 2 Years ,582 11,438 10, Sep-13 Last 3 Years ,299 16,300 14,379 Returns up to 1 year period are Absolute Returns. Returns greater than 1 year period are compounded annualized (CAGR). # S&P BSE 200 INDEX ## S&P BSE Sensex B. Discrete 12 month performance September 30, 2015 to September 30, # # 11,404 11,096 10, September 30, 2014 to September 30, ,033 10,308 9,821 September 30, 2013 to September 30, ,133 14,250 13,741 Since Inception ** ,939 20,122 18,344 Returns up to 1 year period are Absolute Returns. Returns greater than 1 year period are compounded annualized (CAGR). # S&P BSE 200 INDEX ## S&P BSE Sensex ** Inception Date: July 20, Since inception returns are calculated on NAV of ` 10 invested at inception. SIP Performance of Quantum Equity Fund of Funds as on September 30, 2016 Since Inception SIP 7 Years SIP , Returns (XIRR*) (%) Returns (XIRR*) (%) # Total Amount Invested (Rs. 000) Mkt Value as on September 30, 16 (Rs. 000) Returns (XIRR*) (%) ## ^^Standard Deviation: 16.21% Beta: Years SIP 3 Years SIP 1 Year SIP , Sharpe Ratio: 1.15 Past performance may or may not be sustained in the future. # S&P BSE 200 INDEX ## S&P BSE Sensex. Load is not taken into consideration and Returns are for Growth Option using applicable NAV on the SIP day (5th of every month). Return on SIP and are annualized and compounded investment return for cash flows resulting out of uniform and regular monthly subscriptions as on 5th day of every month (in case 5th is a non-business Day, then the next Business Day) and have been worked out using the Excel spreadsheet function known as XIRR. XIRR calculates the internal rate of return for series of cash flow. Assuming `. 10,000 invested every month on 5th day of every month (in case 5th is a non-business Day, then the next Business Day), the 1 year, 3 years, 5 years and since inception returns from SIP are annualized and compounded investment return computed on the assumption that SIP installments were received across the time periods from the start date of SIP from the end of the relevant period viz. 1 year, 3 years, 5 years and since Inception. *XIRR - XIRR calculates the internal rate of return to measure and compare the profitability of series of investments. Brokerage & Commissions Paid Brokerages Paid for investments in Distributor Commissions Paid till date QUANTUM EQUITY FUND OF FUNDS 13
14 Portfolio as on October 31, 2016 Name of Instrument Quantity Market Value In Lakhs % to Net Assets 3,38,783 85,283 3,92,175 78,544 29,035 4,34,576 4,29, , , MUTUAL FUND UNITS 1. HDFC Mid Cap Opportunities Fund -Direct Plan - Growth Option 2. SBI Magnum Multiplier Fund -Direct Plan -Growth 3. Mirae Asset India Opportunities Fund - Direct Plan - Growth 4. Birla Sun Life Frontline Equity Fund - Growth - Direct Plan 5. Franklin India Prima Plus - Direct - Growth 6. Franklin India High Growth Companies Fund - Direct - Growth 7. ICICI Prudential Focused Bluechip Equity Fund - Direct Plan - Growth Total of Mutual Fund Units MONEY MARKET INSTRUMENTS A)Collateralised Borrowing & Lending Obligation (CBLO)* Net Receivable/(payable) Grand Total * Cash & Cash Equivalents ^^ Note: Standard Deviation, Sharpe Ratio & Beta are calculated on Annualised basis using 3 years history of monthly returns. Risk Free Rate assumed to be 6.50% (FBIL Overnight MIBOR for 30th September, 2016) for calculating Sharpe Ratio. Definitions Standard deviation measures historical volatility. A high standard deviation suggests high volatility, while lower standard deviation would refer to more stability. Beta is the tendency of a fund's returns to respond to market swings. A beta of 1 indicates that the fund price will move with the market. A beta of less than 1 means that thesecurity will be less volatile than the market. A beta of greater than 1 indicates that the security's price will be more volatile than the market. Sharpe Ratio is used to characterise how well the return of an asset compensates the investor for the risk taken. The greater a portfolio's Sharpe ratio, the better its risk-adjusted performance has been. 14 QUANTUM EQUITY FUND OF FUNDS
15 QUANTUM DYNAMIC BOND FUND An Open-ended Debt with Defined Credit Exposure and Dynamic Maturity Profile Features An Open-ended Debt with Defined Credit Exposure and Dynamic Maturity Profile Nature of Investment Objective Index Fund Manager To generate income and capital appreciation through active management of portfolio consisting of short term, long term debt and money market instruments. CRISIL Composite Bond Fund Index Mr. Murthy Nagarajan (Since May 19, 2015) Fund Manager s Total Experience 21 yrs. Inception Date (Date of Allotment) May 19, 2015 Current Expense Ratio 0.65% Total Expense Ratio (Weighted Average for the Month) 0.51% Investment Options Growth Option, Monthly Dividend Payout Option and Monthly Dividend Reinvestment Option Minimum Application Amount (Under each Option) Purchase: ` 500/- and in multiples of ` 1/- thereafter. Purchase: ` 500/- and in multiples of ` 1/- thereafter/ 50 units Declaration of Net Asset Value (NAV) Every Business Day Redemption Proceeds Normally despatched within 1-2 Business Days. Entry/ Sales Load Not Applicable Upfront commission to distributors will be paid by the investor directly to the distributor, based on his assessment of various factors including the service rendered by the distributor. Nil Exit Load Product Labeling This product is suitable for investors who are seeking* Regular income over short to medium term and capital appreciation Riskometer Moderate Mo d Hi era gh te ly Name of the Quantum Dynamic Bond Fund (An Open-ended Debt with Defined Credit Exposure and Dynamic Maturity Profile) High Low Investment in Debt / Money Market Instruments / Government Securities. HIGH LOW Investors understand that their principal will be at Moderate Risk * Investors should consult their financial advisers if in doubt about whether the product is suitable for them. Tax on Capital Gains * Resident Individuals & HUF Long Term Short Term 20% with Indexation Maximum FII s / Overseas Financial Organisations Partnership Firm 10% without Indexation 20% with Indexation Non Resident Indians 10% without Indexation (on transfer of long term capital assets being unlisted securities) Maximum Indian Companies 20% with Indexation Foreign Companies 10% without Indexation (on transfer of long term capital assets being unlisted securities) 40% * The mentioned Tax Rates shall be increased by applicable surcharge, if any Education 2% and Secondary higher education 1% where ever as applicable. TRANSACTION CHARGES: In accordance with the SEBI Circular No.Cir / IMD / DF/13/2011 dated August 22, 2011, the AMC is allowed to deduct transaction charges of ` 100 for existing investors and ` 150 for a first time investor per subscription of ` 10,000 /- and above for the transaction / application received through distributors. The transaction charges shall be deducted by the AMC from the subscription amount received from the investor and paid to the distributor and the balance will be invested in the. Investors are requested to note that Quantum Mutual Fund is a direct to investor s Mutual Fund and no transaction charges shall be deducted from the investment amount for transactions / applications received from the distributor and full subscription amount will be invested in the. NAV (as of October 28, 2016) NAV per Unit Fund Size as on Growth Option Growth Option Monthly Dividend Option Monthly Dividend Option Total *Cumulative Daily AuM /No of days in the month QUANTUM DYNAMIC BOND FUND *Average AUM (` in crores) #Absolute AUM (` in crores) #AuM as on October 31,
16 For other s Managed by Mr. Murthy Nagarajan please refer SCHEME PERFORMANCE (FUND MANAGER-WISE) at end of the Factsheet. Returns (%)# # Value of investment of Rs. 10,000@ (Rs.) ( ) ## September 30, 2015 to September 30, ,112 11,151 11,111 Since Inception ** ,740 11,589 11,537 Returns up to 1 year period are Simple Annualised Returns. Returns greater than 1 year period are compounded annualized (CAGR). # Crisil Composite Bond Fund Index ## Crislil 10 Year Gilt Index Weighted Average Maturity as on October 31, 2016 At the end of the month Modified Duration **Date of Inception - May 19, 2015 (In Yrs.) Brokerage & Commissions Paid Brokerages Paid for investments for Distributor Commissions Paid till date Portfolio Yield 6.83% Dividend History - Monthly Dividend payout option Record Date Net Dividend per unit (Post Dividend Distribution Tax) Individual Non Individual 25-Aug Sep Oct Portfolio as on October 31, 2016 Rating Name of Instrument Market Value In Lakhs % to Net Assets Sovereign Sovereign Sovereign 2, , , , Sovereign , , (1,642.00) 4, DEBT INSTRUMENTS A) Listed /Awaiting listing on Stock Exchanges I) Government Securities GOI(MD 11/01/2026) GOI (MD 25/05/2025) GOI (MD 19/12/2022) B) Privately Placed/Unlisted C) Securitized Debt Instruments Total of Debt Instruments MONEY MARKET INSTRUMENTS A) Treasury Bills (T-Bill) Days Tbill (MD 19/01/2017) Total of T-Bills B) Collateralised Borrowing & Lending Obligation (CBLO)* Total of Money Market Instruments Net Receivable / (Payables) Grand Total * Cash & Cash Equivalents Asset Allocation (% of Net Assets) as on October 31, 2016 Rating Profile (% of Net Asset) as on October 31, 2016 CBLO & Net Receivable / (Payable) 6.41% Govt. Securities & Treasury Bills 93.59% CBLO & Net Receivable / (Payable) 6.41% Govt. Securities & Treasury Bills CBLO & Net Receivable / (Payable) 16 QUANTUM DYNAMIC BOND FUND Sovereign 93.59% Sovereign CBLO & Net Receivable / (Payable)
17 QUANTUM LIQUID FUND An Open ended Liquid Features Nature of An Open-ended Liquid Investment Objective The primary investment objective of the is to provide optimal returns with low to moderate levels of risk and high liquidity through judicious investments in money market and debt instruments. Index Fund Manager Crisil Liquid Fund Index Mr. Murthy Nagarajan (Since November 1, 2013) Fund Manager s Total Experience 21 yrs. Inception Date (Date of Allotment) April 7, 2006 Current Expense Ratio 0.25% Total Expense Ratio (Weighted Average for the Month) 0.20% Investment Options Growth, Daily Dividend Reinvestment & Monthly Dividend Payout. Minimum Application Amount (Under each Option) Declaration of Net Asset Value (NAV) Growth Option: ` 5,000/-and in multiples of ` 1/-thereafter. Monthly Dividend Payout Option: ` 10,000/-and in multiples of ` 1/thereafter. Daily Dividend Reinvestment Option: ` 1,00,000/- and in multiples of ` 1/- thereafter. Investment: ` 500/- and in multiples of `1/- thereafter /50 units (For all options) Every Business Day Redemption Proceeds Normally despatched within 1-2 Business Days. Entry/ Sales Load Not Applicable Upfront commission to distributors will be paid by the investor directly to the distributor, based on his assessment of various factors including the service rendered by the distributor. Exit Load Nil Product Labeling Name of the This product is suitable for investors who are seeking* Quantum Liquid Fund (An Open- ended Liquid ) Income over the short term Investments in debt / money market instruments Riskometer Moderate Mo d Hi era gh te High Low ly HIGH LOW Investors understand that their principal will be at Low risk * Investors should consult their financial advisers if in doubt about whether the product is suitable for them. Tax on Capital Gains * Resident Individuals & HUF Long Term Short Term 20% with Indexation Maximum FII s / Overseas Financial Organisations 10% without Indexation Partnership Firm 20% with Indexation Non Resident Indians 10% without Indexation (on transfer of long term capital assets being unlisted securities) Maximum Indian Companies 20% with Indexation Foreign Companies 10% without Indexation (on transfer of long term capital assets being unlisted securities) 40% * The mentioned Tax Rates shall be increased by applicable surcharge, if any Education 2% and Secondary higher education 1% where ever as applicable. TRANSACTION CHARGES: In accordance with the SEBI Circular No.Cir / IMD / DF/13/2011 dated August 22, 2011, the AMC is allowed to deduct transaction charges of ` 100 for existing investors and ` 150 for a first time investor per subscription of ` 10,000 /- and above for the transaction / application received through distributors. The transaction charges shall be deducted by the AMC from the subscription amount received from the investor and paid to the distributor and the balance will be invested in the. Investors are requested to note that Quantum Mutual Fund is a direct to investor s Mutual Fund and no transaction charges shall be deducted from the investment amount for transactions / applications received from the distributor and full subscription amount will be invested in the. NAV (as of October 31, 2016) NAV per Unit Fund Size as on Growth Option Growth Option Daily Dividend Reinvestment Option Monthly Dividend Payout Option Total Monthly Dividend Payout Option Daily Dividend Reinvestment Option *Cumulative Daily AuM /No of days in the month QUANTUM LIQUID FUND *Average AUM (` in crores) #Absolute AUM (` in crores) #AuM as on October 31,
18 Quantum Liquid Fund Performance as on September 30, 2016 For other s Managed by Mr. Murthy Nagarajan please refer SCHEME PERFORMANCE (FUND MANAGER-WISE) at end of the Factsheet. A. Cumulative performance Start Date NAV per Unit Returns(%) ^ # # 23-Sep-16 7 days * ,014 10,015 10, Sep days * ,027 10,029 10, Aug days * ,053 10,058 10, Sep-15 Last 1 Year * ,707 10,769 10, Sep-14 Last 2 Years ** ,591 11,691 11, Sep-13 Last 3 Years ** ,635 12,800 12,663 Returns up to 1 year period are Simple Annualised Returns. Returns greater than 1 year period are compounded annualized (CAGR). # Crisil Liquid Fund Index ## Crisil 1 year T- Bill Index * Simple Annualised Yield ** CAGR B. Discrete 12 month performance # # September 30, 2015 to September 30, ,707 10,769 10,736 September 30, 2014 to September 30, ,825 10,856 10,886 September 30, 2013 to September 30, ,901 10,949 10,835 Since Inception ** ,852 21,437 19,018 Returns up to 1 year period are Absolute Returns. Returns greater than 1 year period are compounded annualized (CAGR). # Crisil Liquid Fund Index ## Crisil 1 year T- Bill Index ** Inception Date: April 7, Since inception returns are calculated on NAV of ` 10 invested at inception. Weighted Average Maturity as on October 31, 2016 At the end of the month Average during the month Modified Duration (Days) Brokerage & Commissions Paid Brokerages Paid for investments for Distributor Commissions Paid till date Portfolio Yield 18 Dividend History - Monthly Dividend payout option Record Date ` 1, % Net Dividend per unit (Post Dividend Distribution Tax) Individual Non Individual 25-Aug Sep Oct QUANTUM LIQUID FUND

 Listed /Awaiting listing on Stock Exchanges B) Privately Placed/Unlisted C) Securitized Debt Instruments Total of Debt Instruments MONEY MARKET INSTRUMENTS")
19 Portfolio as on October 31, 2016 Rating Residual Maturity (in days) Market Value In Lakhs % to Net Assets CRISIL A1+ CRISIL A CRISIL A1+ ICRA A Sovereign Sovereign Sovereign Sovereign Sovereign Sovereign , , , , , Name of Instrument DEBT INSTRUMENTS A) Listed /Awaiting listing on Stock Exchanges B) Privately Placed/Unlisted C) Securitized Debt Instruments Total of Debt Instruments MONEY MARKET INSTRUMENTS A) Certificate of Deposit (CD) 1. Corporation Bank CD (MD 04/11/2016) 2. Export Import Bank of India CD (MD 16/12/2016) Total of CDs B) Commerical Papers (CP) 1. Small Ind Dev Bank of India CP (MD 13/12/2016) 2. National Bank For Agri & Rural CP (MD 15/12/2016) Total of CPs C) Treasury Bills (T-Bill) Days Tbill (MD 08/12/2016) Days Tbill (MD 15/12/2016) Days Tbill (MD 22/12/2016) Days Tbill (MD 24/11/2016) Days Tbill (MD 01/12/2016) Days Tbill (MD 19/01/2017) Total of T-Bills D) Collateralised Borrowing & Lending Obligation (CBLO)* Total of Money Market Instruments Net Receivable / (Payables) Grand Total * Cash & Cash Equivalents Asset Allocation (% of Net Assets) as on October 31, 2016 CBLO & Net Receivable / (Payable) Public Financial Institution 9.59% 16.74% 5.62% CBLO & Net Receivable / (Payable) Govt. Securities Govt. Securities 68.05% Public Financial Institution Rating Profile (% of Net Asset) as on October 31, 2016 CBLO & Net Receivable /(Payable) 9.59% A % CBLO & Net Receivable / (Payable) A1+ Sovereign 68.05% QUANTUM LIQUID FUND Sovereign 19
20 QUANTUM GOLD SAVINGS FUND An Open ended Fund of Fund Features Nature of An Open ended Fund of Fund Investment Objective The investment objective of the is to provide capital appreciation by predominantly investing in units of Quantum Gold Fund Exchange Traded Fund (QGF). The performance of the may differ from that of Quantum Gold Fund and the domestic prices of gold due to expenses and certain other factors. There can be no assurance or guarantee that the investment objective of the will be achieved. Index Fund Manager Domestic Price of Gold Mr. Chirag Mehta ~ (Since May 19, 2011) Fund Manager s Total Experience 11 yrs. Inception Date (Date of Allotment) May 19, 2011 Current Expense Ratio 0.10% Total Expense Ratio (Weighted Average for the Month) Investment Options 0.10% Growth Minimum Application Amount (Under each Option) Purchase : ` 500/- and in multiples of ` 1/- thereafter. Purchase: ` 500/- and in multiples of ` 1/- thereafter / 50 units Declaration of Net Asset Value (NAV) Every Business Day Redemption Proceeds Normally despatched within 3-4 Business Days. Entry/ Sales Load Not Applicable Upfront commission to distributors will be paid by the investor directly to the distributor, based on his assessment of various factors including the service rendered by the distributor. Exit Load Repurchase/ Redemption/ Switch Out On or before 365 days from the date of allotment 1.5 %. Product Labeling Name of the This product is suitable for investors who are seeking* Riskometer Moderate Mo d Hi era gh te High Low ly Quantum Gold Savings Long term returns Fund Investments in units of Quantum Gold Fund Exchange (An Open-ended Fund Traded Fund whose underlying investments are in of Funds ) physical gold. HIGH LOW Investors understand that their principal will be at Moderately High Risk * Investors should consult their financial advisers if in doubt about whether the product is suitable for them. Tax on Capital Gains * Resident Individuals & HUF Long Term Short Term 20% with Indexation FII s / Overseas Financial Organisations 10% without Indexation Maximum Partnership Firm 20% with Indexation Non Resident Indians 10% without Indexation (on transfer of long term capital assets being unlisted securities) Maximum Indian Companies 20% with Indexation Foreign Companies 10% without Indexation (on transfer of long term capital assets being unlisted securities) 40% * The mentioned Tax Rates shall be increased by applicable surcharge, if any Education 2% and Secondary higher education 1% where ever as applicable. TRANSACTION CHARGES: In accordance with the SEBI Circular No.Cir / IMD / DF/13/2011 dated August 22, 2011, the AMC is allowed to deduct transaction charges of ` 100 for existing investors and ` 150 for a first time investor per subscription of ` 10,000 /- and above for the transaction / application received through distributors. The transaction charges shall be deducted by the AMC from the subscription amount received from the investor and paid to the distributor and the balance will be invested in the. Investors are requested to note that Quantum Mutual Fund is a direct to investor s Mutual Fund and no transaction charges shall be deducted from the investment amount for transactions / applications received from the distributor and full subscription amount will be invested in the. NAV (as of October 28, 2016) Growth Option NAV per Unit Fund Size as on Growth Option *Cumulative Daily AuM /No of days in the month 20 QUANTUM GOLD SAVINGS FUND *Average AUM (` in crores) #Absolute AUM (` in crores) #AuM as on October 31, 2016
21 Quantum Gold Savings Fund Performance as on September 30, 2016 For other s Managed by Mr. Chirag Mehta please refer SCHEME PERFORMANCE (FUND MANAGER-WISE) at end of the Factsheet. A. Cumulative performance Start Date 30-Sep Sep Sep-13 NAV per Unit Last 1 Year Last 2 Years Last 3 Years ,586 11,261 9,962 11,989 11,890 10,560 Returns up to 1 year period are Absolute Returns. Returns greater than 1 year period are compounded annualized (CAGR). # Domestic Price of Gold B. Discrete 12 month performance September 30, 2015 to September 30, ,586 11,989 September 30, 2014 to September 30, ,720 9,917 September 30, 2013 to September 30, ,846 8, ,170 14,429 Since Inception ** Returns up to 1 year period are Absolute Returns. Returns greater than 1 year period are compounded annualized (CAGR). # Domestic Price of Gold ** Inception Date: May 19, Since inception returns are calculated on NAV of ` 10 invested at inception. SIP Performance of Quantum Gold Saving Funds as on September 30, 2016 Since Inception SIP 5 Years SIP 3 Years SIP 1 Year SIP Returns (XIRR*) (%) Returns (XIRR*) (%) # Total Amount Invested (Rs. 000) Mkt Value as on September 30, 16 (Rs. 000) Past performance may or may not be sustained in the future. # Domestic Price of Gold Load is not taken into consideration and Returns are for Growth Option using applicable NAV on the SIP day (5th of every month). Return on SIP and are annualized and compounded investment return for cash flows resulting out of uniform and regular monthly subscriptions as on 5th day of every month (in case 5th is a non-business Day, then the next Business Day) and have been worked out using the Excel spreadsheet function known as XIRR. XIRR calculates the internal rate of return for series of cash flow. Assuming `. 10,000 invested every month on 5th day of every month (in case 5th is a non-business Day, then the next Business Day), the 1 year, 3 years and since inception returns from SIP are annualized and compounded investment return computed on the assumption that SIP installments were received across the time periods from the start date of SIP from the end of the relevant period viz. 1 year, 3 years and since Inception. *XIRR - XIRR calculates the internal rate of return to measure and compare the profitability of series of investments. Brokerage & Commissions Paid Brokerages Paid for investments for Distributor Commissions Paid till date ` 6, QUANTUM GOLD SAVINGS FUND 21
22 Portfolio as on October 31, 2016 Name of Instrument A) EXCHANGE TRADED FUND UNITS 1. Quantum Gold Fund Total of Exchange Traded Funds B) MONEY MARKET INSTRUMENTS 1. Collateralised Borrowing & Lending Obligation (CBLO)* Net Receivable/(payable) Grand Total Units Market Value In Lakhs % to Net Assets 92,195 1, , , * Cash & Cash Equivalents ^^Portfolio Turnover Ratio (Last one year): 10.91% Asset Allocation (% of Net Assets) as on October 31, 2016 CBLO & Net Receivable / (Payable) 0. Units of Quantum Gold Fund 99.70% Units of Quantum Gold Fund CBLO & Net Receivable / (Payable) ^^ Definitions Portfolio Turnover Ratio is the percentage of a funds assets that have changed over the course of a year. 22 QUANTUM GOLD SAVINGS FUND
23 QUANTUM MULTI ASSET FUND An Open-ended Fund of Funds Features Nature of Associate Fund Manager Total Experience An Open-ended Fund of Funds The investment objective of the is to generate modest capital appreciation while trying to reduce risk (by diversifying risks across asset classes) from a combined portfolio of equity, debt / money markets and Gold schemes of Quantum Mutual Fund. The may invest in the units of debt / money market schemes of other mutual funds to gain exposure to debt as an asset class to manage any investment and regulatory constraints that arise/ that prevent the from increasing investments in the schemes of Quantum Mutual Fund. There can be no assurance that the investment objective of the will be realized. Crisil Composite Bond Fund Index (40%)+S&P BSE Sensex Total return Index (40%)+Domestic price of gold (20%) Mr. Chirag Mehta ~ (Since July 11, 2012) 11 yrs Mr. Nilesh Shetty (Since July 11, 2012) 12 yrs Inception Date (Date of Allotment) July 11, 2012 Current Expense Ratio Total Expense Ratio (Weighted Average for the Month) 0.25% 0.25% Investment Options Growth Minimum Application Amount (Under each Option) Purchase: ` 500/- and in multiples of ` 1/- thereafter. Purchase: ` 500/- and in multiples of ` 1/- thereafter/ 50 units Every Business Day Normally despatched within 3-4 Business Days. Not Applicable Upfront commission to distributors will be paid by the investor directly to the distributor, based on his assessment of various factors including the service rendered by the distributor. Repurchase/ Redemption/ Switch Out a) On or before 90 days from the date of allotment 1.00%. b) After 90 days from the date of allotment Nil Investment Objective Index Fund Manager Fund Manager s Total Experience Declaration of Net Asset Value (NAV) Redemption Proceeds Entry/ Sales Load Exit Load Product Labeling Name of the This product is suitable for investors who are seeking* Long term capital appreciation and current income Investments in portfolio of schemes of Quantum Mutual Fund whose underlying investments are in quity and equity related securities of companies, debt and money market instruments and physical gold. Moderate Mo d Hi era gh te High Low ly Quantum Multi Asset Fund (An Open-ended Fund of Funds ) Riskometer HIGH LOW Investors understand that their principal will be at Moderately High Risk * Investors should consult their financial advisers if in doubt about whether the product is suitable for them. Tax on Capital Gains * Resident Individuals & HUF Long Term Short Term 20% with Indexation FII s / Overseas Financial Organisations 10% without Indexation Maximum Partnership Firm 20% with Indexation Indian Companies Non Resident Indians 10% without Indexation (on transfer of long term capital assets being unlisted securities) Maximum 20% with Indexation Foreign Companies 10% without Indexation (on transfer of long term capital assets being unlisted securities) 40% * The mentioned Tax Rates shall be increased by applicable surcharge, if any Education 2% and Secondary higher education 1% where ever as applicable. TRANSACTION CHARGES: In accordance with the SEBI Circular No.Cir / IMD / DF/13/2011 dated August 22, 2011, the AMC is allowed to deduct transaction charges of ` 100 for existing investors and ` 150 for a first time investor per subscription of ` 10,000 /- and above for the transaction / application received through distributors. The transaction charges shall be deducted by the AMC from the subscription amount received from the investor and paid to the distributor and the balance will be invested in the. Investors are requested to note that Quantum Mutual Fund is a direct to investor s Mutual Fund and no transaction charges shall be deducted from the investment amount for transactions / applications received from the distributor and full subscription amount will be invested in the. NAV (as of October 28, 2016) Growth Option NAV per Unit Fund Size as on Growth Option *Cumulative Daily AuM /No of days in the month QUANTUM MULTI ASSET FUND *Average AUM (` in crores) 8.37 #Absolute AUM (` in crores) 8.39 #AuM as on October 31,
24 Quantum Multi Asset Fund Performance as on September 30, 2016 For other s Managed by Mr. Chirag Mehta & Mr. Nilesh Shetty please refer SCHEME PERFORMANCE (FUND MANAGER-WISE) at end of the Factsheet. The is co-managed by Mr. Chirag Mehta & Mr. Nilesh Shetty. A. Cumulative performance Start Date 30-Sep Sep Sep-13 Last 1 Year Last 2 Years Last 3 Years NAV per Unit ,327 11,801 14,226 11,106 11,583 13,782 Returns up to 1 year period are Absolute Returns. Returns greater than 1 year period are compounded annualized (CAGR). # Crisil Composite Bond Fund Index (40%) +S&P BSE Sensex Total return Index (40%)+ Domestic price of gold (20%) B. Discrete 12 month performance September 30, 2015 to September 30, ,327 11,106 September 30, 2014 to September 30, ,419 10,429 September 30, 2013 to September 30, ,055 11,899 Since Inception ** ,424 14,885 Returns up to 1 year period are Absolute Returns. Returns greater than 1 year period are compounded annualized (CAGR). # Crisil Composite Bond Fund Index (40%)+ S&P BSE Sensex Total return Index (40%)+ Domestic price of gold (20%) ** Inception Date: July 11, Since inception returns are calculated on NAV of ` 10 invested at inception. SIP Performance of Quantum Multi Asset Fund as on September, 2016 Since Inception SIP 3 Years SIP 1 Year SIP Total Amount Invested (Rs. 000) Mkt Value as on September 30, 16 (Rs. 000) Scehem Returns (XIRR*) (%) Returns (XIRR*) (%) # ^^Standard Deviation: 5.64% Beta: 0.80 Sharpe Ratio: 0.97 Past performance may or may not be sustained in the future. # Crisil Composite Bond Fund Index (40%)+ S&P BSE Sensex Total return Index (40%)+ Domestic price of gold (20%) Load is not taken into consideration and Returns are for Growth Option using applicable NAV on the SIP day (5th of every month). Return on SIP and are annualized and compounded investment return for cash flows resulting out of uniform and regular monthly subscriptions as on 5th day of every month (in case 5th is a non-business Day, then the next Business Day) and have been worked out using the Excel spreadsheet function known as XIRR. XIRR calculates the internal rate of return for series of cash flow. Assuming `. 10,000 invested every month on 5th day of every month (in case 5th is a non-business Day, then the next Business Day), the 1 year, 3 years and since inception returns from SIP are annualized and compounded investment return computed on the assumption that SIP installments were received across the time periods from the start date of SIP from the end of the relevant period viz. 1 year, 3 years and since Inception. *XIRR - XIRR calculates the internal rate of return to measure and compare the profitability of series of investments. Brokerage & Commissions Paid Brokerages Paid for investments for Distributor Commissions Paid till date 24 ` QUANTUM MULTI ASSET FUND
25 Portfolio as on October 31, 2016 Name of Instrument Quantity Market Value In Lakhs % to Net Assets 5,21,714 10,74,654 12,27, ,261 10, A) MUTUAL FUND UNITS 1. Quantum Long Term Equity Fund-Growth Option 2. Quantum Liquid Fund-Growth Option 3. Quantum Dynamic Bond Fund-Growth Option Total of Mutual Fund Units B) EXCHANGE TRADED FUND UNITS 1. Quantum Gold Fund 2. Quantum Index Fund Total of Exchange Traded Fund Units Total (A+B) MONEY MARKET INSTRUMENTS A) Collateralised Borrowing & Lending Obligation (CBLO)* Net Receivable/(payable) Grand Total * Cash & Cash Equivalents ^^ Note: Standard Deviation, Sharpe Ratio & Beta are calculated on Annualised basis using 3 years history of monthly returns. Risk Free Rate assumed to be 6.50% (FBIL Overnight MIBOR for 30th September, 2016) for calculating Sharpe Ratio. Definitions Standard deviation measures historical volatility. A high standard deviation suggests high volatility, while lower standard deviation would refer to more stability. Beta is the tendency of a fund's returns to respond to market swings. A beta of 1 indicates that the fund price will move with the market. A beta of less than 1 means that thesecurity will be less volatile than the market. A beta of greater than 1 indicates that the security's price will be more volatile than the market. Sharpe Ratio is used to characterise how well the return of an asset compensates the investor for the risk taken. The greater a portfolio's Sharpe ratio, the better its risk-adjusted performance has been. QUANTUM MULTI ASSET FUND 25
26 QUANTUM GOLD FUND An Open ended Exchange Traded Fund - Gold Features Nature of An Open ended Exchange Traded Fund - Gold Investment Objective The Investment Objective of the is to generate returns that are in line with the performance of gold and gold related instruments subject to tracking errors. However, investment in gold related instruments will be made if and when SEBI permits mutual funds to invest, in gold related instruments. The is designed to provide returns that before expenses, closely correspond to the returns provided by gold. Index Fund Manager Domestic Price of Physical Gold Mr. Chirag Mehta ~ (Since May 01, 2009) Fund Manager s Total Experience 11 yrs Inception Date (Date of Allotment) February 22, 2008 Current Expense Ratio 1.00% Total Expense Ratio (Weighted Average for the Month) Investment Options 0.99% Growth Directly with Fund: The investors can create / redeem in exchange of Portfolio Deposit and Cash Component in creation unit size at NAV based Price. On the Exchange: Approx equal to price of 1/2 gram of Gold quoted on the NSE. On NSE, the units can be purchased / sold in minimum lot of 1 units and in multiples therefore. Minimum Application Amount (Under each Option) Declaration of Net Asset Value (NAV) Every Business Day Redemption Proceeds Entry/ Sales Load Normally despatched within 3-4 Business Days. Not Applicable Upfront commission to distributors will be paid by the investor directly to the distributor, based on his assessment of various factors including the service rendered by the distributor. Exit Load (retail investor can exit the scheme only through secondary market) Product Labeling Name of the This product is suitable for investors who are seeking* Quantum Gold Fund (An Open-ended Exchange Traded Fund- Gold) Long term returns Investments in physical gold. Riskometer Moderate Mo d Hi era gh te High Low ly HIGH LOW Investors understand that their principal will be at Moderately High Risk * Investors should consult their financial advisers if in doubt about whether the product is suitable for them. Tax on Capital Gains * Resident Individuals & HUF Long Term Short Term 20% with Indexation Maximum FII s / Overseas Financial Organisations 10% without Indexation Partnership Firm 20% with Indexation Non Resident Indians Indian Companies 20% with Indexation (on transfer of long term capital assets being listed securities) 20% with Indexation Maximum Foreign Companies 20% with Indexation (on transfer of long term capital assets being listed securities) 40% * The mentioned Tax Rates shall be increased by applicable surcharge, if any Education 2% and Secondary higher education 1% where ever as applicable. TRANSACTION CHARGES: In accordance with the SEBI Circular No.Cir / IMD / DF/13/2011 dated August 22, 2011, the AMC is allowed to deduct transaction charges of ` 100 for existing investors and ` 150 for a first time investor per subscription of ` 10,000 /- and above for the transaction / application received through distributors. The transaction charges shall be deducted by the AMC from the subscription amount received from the investor and paid to the distributor and the balance will be invested in the. Investors are requested to note that Quantum Mutual Fund is a direct to investor s Mutual Fund and no transaction charges shall be deducted from the investment amount for transactions / applications received from the distributor and full subscription amount will be invested in the. NAV (as of October 28, 2016) Growth Option NAV per Unit Fund Size as on Growth Option *Cumulative Daily AuM /No of days in the month 26 QUANTUM GOLD FUND *Average AUM (` in crores) #Absolute AUM (` in crores) #AuM as on October 31, 2016

27 Quantum Gold Fund Performance as on September 30, 2016 For other s Managed by Mr. Chirag Mehta please refer SCHEME PERFORMANCE (FUND MANAGER-WISE) at end of the Factsheet. A. Cumulative performance Start Date 30-Sep Sep Sep-13 Last 1 Year Last 2 Years Last 3 Years NAV per Unit 1, , , ,853 11,637 10,235 11,989 11,890 10,560 Returns up to 1 year period are Absolute Returns. Returns greater than 1 year period are compounded annualized (CAGR). # Domestic Price of Physical Gold B. Discrete 12 month performance September 30, 2015 to September 30, ,853 11,989 September 30, 2014 to September 30, ,818 9,917 September 30, 2013 to September 30, ,795 8, ,280 25,703 Since Inception ** ^^Tracking Error : 0.098% Returns up to 1 year period are Absolute Returns. Returns greater than 1 year period are compounded annualized (CAGR). # Domestic Price of Physical Gold ** Inception Date: February 22, Since inception returns are calculated on NAV of ` 100 invested at inception. Portfolio as on October 31, 2016 Name of Instrument Quantity Market Value In Lakhs % to Net Asset , , , GOLD 1. 1 KG Bar (995 fineness) Gram Bar (999 fineness) Total of Gold MONEY MARKET INSTRUMENTS A) Collateralised Borrowing & Lending Obligation (CBLO)* Net Receivable/(payable) Grand Total * Cash & Cash Equivalents ^^Portfolio Turnover Ratio (Last one year): 0.46% Brokerage & Commissions Paid Brokerages Paid for investments in Distributor Commissions Paid till date Asset Allocation (% of Net Assets) as on October 31, 2016 CBLO Net Receivables / (Payable) -0.24% 0.04% Note: Tracking Error is calculated on Annualised basis using 3 years history of daily returns. ^^ Definitions Tracking Error is a measure of how closely a fund follows the index to which it is benchmarked. The more passively the fund is managed, the smaller the tracking error. In the case of Exchange Traded Funds, the lower the Tracking Error, the better. QUANTUM GOLD FUND GOLD GOLD % CBLO Net Receivables / (Payable) 27
28 QUANTUM INDEX FUND An Open ended Exchange Traded Fund Features Nature of An Open-ended Exchange Traded Fund Investment Objective The investment objective of the scheme is to invest in stocks of companies comprising Nifty 50 Index and endeavour to achieve return equivalent to Nifty by Passive investment. The will be managed by replicating the index in the same weightage as in the Nifty 50 Index with the intention of minimizing the performance differences between the scheme and the Nifty 50 Index in capital terms, subject to market liquidity, costs of trading, managing expenses and other factors which may cause tracking error. Nifty 50 TRI Index Mr. Hitendra Parekh (Since June 09,2008) Index Fund Manager Fund Manager s Total Experience 22 yrs. July 10, % 0.25% Growth Inception Date (Date of Allotment) Current Expense Ratio Total Expense Ratio (Weighted Average for the Month) Investment Options Minimum Application Amount (Under each Option) Directly with Fund: The investors can create / redeem in exchange of Portfolio Deposit and Cash Component in creation unit size at NAV based Price. On the Exchange: At prices which may be close to the NAV of QIF Units. On NSE, the units can be purchased / sold in minimum lot of 1 unit and in multiples thereof. The units of QIF issued under the scheme will be approximately equal to the price of 1/10 (one-tenth) of the Nifty 50 Index. Declaration of Net Asset Value (NAV) Every Business Day Normally despatched within 3-4 Business Days. Redemption Proceeds Entry/ Sales Load Not Applicable Upfront commission to distributors will be paid by the investor directly to the distributor, based on hisassessment of various factors including the service rendered by the distributor. Exit Load (retail Investor can exit the scheme only through secondary market) Tax on Long Term Capital Gains - Nil Tax on Short Term Capital Gains - 15% Taxation# Product Labeling Name of the Riskometer This product is suitable for investors who are seeking* Moderate Mo d Hi era gh te High Low ly Quantum Index Fund Long term capital appreciation (An Open- ended Investments in equity and equity related securities of Exchange Traded Fund) companies in Nifty 50 Index. HIGH LOW Investors understand that their principal will be at Moderately High Risk * Investors should consult their financial advisers if in doubt about whether the product is suitable for them. # The mentioned Tax Rates shall be increased by applicable surcharge, if any Education 2% and Secondary higher education 1% where ever as applicable. Equity oriented schemes will also attract Securities Transaction Tax 0.001% at the time of redemption and switch to other schemes. TRANSACTION CHARGES: In accordance with the SEBI Circular No.Cir / IMD / DF/13/2011 dated August 22, 2011, the AMC is allowed to deduct transaction charges of ` 100 for existing investors and ` 150 for a first time investor per subscription of ` 10,000 /- and above for the transaction / application received through distributors. The transaction charges shall be deducted by the AMC from the subscription amount received from the investor and paid to the distributor and the balance will be invested in the. Investors are requested to note that Quantum Mutual Fund is a direct to investor s Mutual Fund and no transaction charges shall be deducted from the investment amount for transactions / applications received from the distributor and full subscription amount will be invested in the. NAV (as of October 28, 2016) Growth Option NAV per Unit Fund Size as on Growth Option *Cumulative Daily AuM /No of days in the month 28 QUANTUM INDEX FUND *Average AUM (` in crores) 3.82 #Absolute AUM (` in crores) 3.80 #AuM as on October 31, 2016
29 Quantum Index Fund Performance as on September 30, 2016 A. Cumulative performance Start Date NAV per Unit # # 30-Sep-15 Last 1 Year ,949 10,977 10, Sep-14 Last 2 Years ,024 11,072 10, Sep-13 Last 3 Years ,468 15,558 14,379 Returns up to 1 year period are Absolute Returns. Returns greater than 1 year period are compounded annualized (CAGR). # Nifty 50 TRI ## S&P BSE Sensex B. Discrete 12 month performance # # September 30, 2015 to September 30, ,949 10,977 10,654 September 30, 2014 to September 30, ,068 10,087 9,821 September 30, 2013 to September 30, ,031 14,051 13,741 Since Inception ** ,950 22,825 20,010 ^^Tracking Error: 0.083% Returns up to 1 year period are Absolute Returns. Returns greater than 1 year period are compounded annualized (CAGR). # Nifty 50 TRI ## S&P BSE Sensex ** Inception Date: July 10, Since inception returns are calculated on NAV of ` 10 invested at inception. Portfolio as on October 31, 2016 Name of Instrument Industry Quantity Market % to Net Value In Assets Lakhs EQUITY & EQUITY RELATED A) Listed /Awaiting listing on the Stock Exchange 1. HDFC Bank Limited 2. Housing Development Finance Corporation Limited 3. ITC Limited 4. Infosys Limited 5. Reliance Industries Limited 6. ICICI Bank Limited 7. Tata Consultancy Services Limited 8. Larsen & Toubro Limited 9. Tata Motors Limited 10. Kotak Mahindra Bank Limited 11. Axis Bank Limited 12. Sun Pharmaceuticals Industries Limited 13. State Bank of India 14. Maruti Suzuki India Limited 15. Mahindra & Mahindra Limited 16. Hindustan Unilever Limited 17. IndusInd Bank Limited 18. Oil & Natural Gas Corporation Limited 19. Asian Paints Limited 20. HCL Technologies Limited 21. Hero MotoCorp Limited 22. Bharti Airtel Limited 23. Dr. Reddy's Laboratories Limited 24. Yes Bank Limited Finance Consumer Non Durables Software Petroleum Products Software Construction Project Auto Pharmaceuticals Auto Auto Consumer Non Durables Oil Consumer Non Durables Software Auto Telecom - Services Pharmaceuticals QUANTUM INDEX FUND 2,401 1,898 10,157 2,401 1,988 6, ,325 1,351 2,008 1,302 3, , ,
30 25. UltraTech Cement Limited Cement 26. Coal India Limited Minerals/Mining 27. Bajaj Auto Limited Auto 28. Power Grid Corporation of India Limited Power 29. NTPC Limited Power 30. Lupin Limited Pharmaceuticals 31. Bharat Petroleum Corporation Limited Petroleum Products 32. Eicher Motors Limited Auto 33. Grasim Industries Limited Cement 34. Wipro Limited Software 35. Cipla Limited Pharmaceuticals 36. Zee Entertainment Enterprises Limited Media & Entertainment 37. Adani Ports and Special Economic Zone Limited Transportation 38. Tech Mahindra Limited Software 39. Tata Steel Limited Ferrous Metals 40. Aurobindo Pharma Limited Pharmaceuticals 41. GAIL (India) Limited Gas 42. Hindalco Industries Limited Non - Ferrous Metals 43. Ambuja Cements Limited Cement 44. Bharti Infratel Limited Telecom - Equipment & Accessories 45. Bosch Limited Auto Ancillaries 46. Tata Motors Limited DVR Shares Auto 47. Bank of Baroda 48. ACC Limited Cement 49. Tata Power Company Limited Power 50. Bharat Heavy Electricals Limited Industrial Capital Goods 51. Idea Cellular Limited Telecom - Services B) Unlisted Total of all Equity MONEY MARKET INSTRUMENTS A) Collateralised Borrowing & Lending Obligation (CBLO)* Net Receivable/(payable) Grand Total 125 1, ,629 2, , , , ,169 1,083 1, * Cash & Cash Equivalents ^^Portfolio Turnover Ratio (Last one year): 17.46% Industry Allocation (% of Net Assets) as on October 31, 2016 Software Auto Consumer Non Durables Finance Pharmaceuticals Petroleum Products Construction Project Cement Power Oil Telecom - Services Minerals/Mining Media & Entertainment Transportation Ferrous Metals Gas Non - Ferrous Metals Telecom - Equipment & Accessories Auto Ancillaries Industrial Capital Goods 24.65% 13.51% 11.75% 9.88% 6.88% 6.63% 6.60% 3.82% 3.32% 2.83% 1.63% 1.59% 1.29% 0.89% 0.88% 0.85% 0.64% 0.60% 0.58% 0.58% 0.40% 0% 5% 10% 15% 20% 25% Brokerage & Commissions Paid Brokerages Paid for investments for Distributor Commissions Paid till date ^^ Note: Tracking Error is calculated on Annualised basis using 3 years history of daily returns. Definitions Tracking Error is a measure of how closely a fund follows the index to which it is benchmarked. The more passively the fund is managed, the smaller the tracking error. In the case of Exchange Traded Funds, the lower the Tracking Error, the better. Portfolio Turnover Ratio is the percentage of a funds assets that have changed over the course of a year. 30 QUANTUM INDEX FUND
31 SCHEME PERFORMANCE - FUND MANAGER-WISE ATUL KUMAR / SORBH GUPTA QUANTUM TAX SAVING FUND A. Cumulative performance Start Date NAV B. Discrete 12 month performance Returns (%) (%) ^ (%) # ## Returns Returns Returns (%) ^ (%) # (%) ## per Unit Returns Returns # 30-Sep-15 Last 1 Year ,363 10,816 10, Sep-14 Last 2 Years ,240 10,769 10, Sep-13 Last 3 Years ,447 15,026 14,379 # Sep 30, 2015 to Sep 30, ,363 10,816 10,654 Sep 30, 2014 to Sep 30, ,901 9,957 9,821 Sep 30, 2013 to Sep 30, ,070 13,953 13,741 Since Inception ** ,530 32,315 28, ^Past performance may or may not be sustained in the future. Load is not taken into consideration and Returns are for Growth Option. Returns up to 1 year period are Absolute Returns. Returns greater than 1 year period are compounded annualized (CAGR). # S&P BSE 30 TRI ## S&P BSE Sensex ** Inception Date: Dec 23, Since inception returns are calculated on NAV of ` 10 invested at inception. SIP Performance of Quantum Tax Saving Fund as on September 30, 2016 Since Inception SIP Total Amount Invested (Rs. 000) Mkt Value as on September 30, 16 (Rs. 000) 7 Years SIP 5 Years SIP 3 Years SIP 1 Year SIP , , Returns (XIRR*) (%) Returns (XIRR*) (%) # Returns (XIRR*) (%) ## ^^Standard Deviation: 15.56% Beta: 0.99 Sharpe Ratio: 0.98 Past performance may or may not be sustained in the future. # S&P BSE 30 TRI ## S&P BSE Sensex. Load is not taken into consideration and Returns are for Growth Option using applicable NAV on the SIP day (5th of every month). Return on SIP and are annualized and compounded investment return for cash flows resulting out of uniform and regular monthly subscriptions as on 5th day of every month (in case 5th is a non-business Day, then the next Business Day) and have been worked out using the Excel spreadsheet function known as XIRR. XIRR calculates the internal rate of return for series of cash flow. Assuming `. 10,000 invested every month on 5th day of every month (in case 5th is a non-business Day, then the next Business Day), the 1 year, 3 years, 5 years 7 years and since inception returns from SIP are annualized and compounded investment return computed on the assumption that SIP installments were received across the time periods from the start date of SIP from the end of the relevant period viz. 1 year, 3 years, 5 years 7 years and since Inception. *XIRR - XIRR calculates the internal rate of return to measure and compare the profitability of series of investments. The is co-managed by Atul Kumar and Sorbh Gupta. ATUL KUMAR /ESH SHETTY QUANTUM LONG TERM EQUITY FUND A. Cumulative performance Start Date B. Discrete 12 month performance per Unit Returns Returns Returns (%) (%) ^ (%) # ## NAV # Returns Returns (%) ^ (%) # Returns (%) ## # Sep 30, 2015 to Sep 30, ,332 10,816 10,654 Sep 30, 2014 to Sep 30, ,970 9,957 9, Sep-15 Last 1 Year ,332 10,816 10, Sep-14 Last 2 Years ,295 10,769 10,464 Sep 30, 2013 to Sep 30, ,072 13,953 13, Sep-13 Last 3 Years ,531 15,026 14,379 Since Inception ** ,050 30,124 25, ^Past performance may or may not be sustained in the future. Load is not taken into consideration and Returns are for Growth Option. Returns up to 1 year period are Absolute Returns. Returns greater than 1 year period are compounded annualized (CAGR). # S&P BSE 30 TRI ## S&P BSE Sensex ** Inception Date: Mar 13, Since inception returns are calculated on NAV of ` 10 invested at inception. SIP Performance of Quantum Long Term Equity Fund as on September 30, 2016 Since Inception SIP Total Amount Invested (Rs. 000) Mkt Value as on September 30, 16 (Rs. 000) 10 Year SIP 7 Year SIP 5 Year SIP 3 Year SIP 1 Year SIP 1, , , , , Returns (XIRR*) (%) Returns (XIRR*) (%) # Returns (XIRR*) (%) ## ^^Standard Deviation: 15.42% Beta: 0.98 Sharpe Ratio: 1.00 Past performance may or may not be sustained in the future. # S&P BSE 30 TRI ## S&P BSE Sensex. Load is not taken into consideration and Returns are for Growth Option using applicable NAV on the SIP day (5th of every month). Return on SIP and are annualized and compounded investment return for cash flows resulting out of uniform and regular monthly subscriptions as on 5th day of every month (in case 5th is a non-business Day, then the next Business Day) and have been worked out using the Excel spreadsheet function known as XIRR. XIRR calculates the internal rate of return for series of cash flow. Assuming `. 10,000 invested every month on 5th day of every month (in case 5th is a non-business Day, then the next Business Day), the 1 year, 3 years, 5 years 7 years, 10 years and since inception returns from SIP are annualized and compounded investment return computed on the assumption that SIP installments were received across the time periods from the start date of SIP from the end of the relevant period viz. 1 year, 3 years, 5 years, 7 years 10 years and since Inception. *XIRR - XIRR calculates the internal rate of return to measure and compare the profitability of series of investments. The is co-managed by Atul Kumar and Nilesh Shetty. SCHEME PERFORMANCE - FUND MANAGER - WISE 31
32 CHIRAG MEHTA QUANTUM EQUITY FUND OF FUNDS A. Cumulative performance Start Date B. Discrete 12 month performance per Unit Returns Returns Returns (%) (%) ^ (%) # ## NAV ,404 11,096 10, Sep-14 Last 2 Years ,582 11,438 10, Sep-13 Last 3 Years ,299 16,300 14,379 # Sep 30, 2015 to Sep 30, % ,404 11,096 10,654 Sep 30, 2014 to Sep 30, % ,033 10,308 9,821 Sep 30, 2013 to Sep 30, % ,133 14,250 13,741 Since Inception ** ,939 20,122 18,344 # 30-Sep-15 Last 1 Year Returns Returns Returns (%) ^ (%) # (%) ## 15.33% Returns up to 1 year period are Absolute Returns. Returns greater than 1 year period are compounded annualized (CAGR). # S&P BSE 200 INDEX ## S&P BSE Sensex ** Inception Date: July 20, Since inception returns are calculated on NAV of ` 10 invested at inception. SIP Performance of Quantum Equity Fund of Funds as on September 30, 2016 Since Inception SIP Total Amount Invested (Rs. 000) Mkt Value as on September 30, 16 (Rs. 000) 5 Years SIP 7 Years SIP 3 Years SIP 1 Year SIP , , Returns (XIRR*) (%) Returns (XIRR*) (%) # Returns (XIRR*) (%) ## ^^Standard Deviation: 16.21% Beta: 1.06 Sharpe Ratio: 1.15 Past performance may or may not be sustained in the future. # S&P BSE 200 INDEX ## S&P BSE Sensex. Load is not taken into consideration and Returns are for Growth Option using applicable NAV on the SIP day (5th of every month). Return on SIP and are annualized and compounded investment return for cash flows resulting out of uniform and regular monthly subscriptions as on 5th day of every month (in case 5th is a non-business Day, then the next Business Day) and have been worked out using the Excel spreadsheet function known as XIRR. XIRR calculates the internal rate of return for series of cash flow. Assuming ` 10,000 invested every month on 5th day of every month (in case 5th is a non-business Day, then the next Business Day), the 1 year, 3 years, 5 years and since inception returns from SIP are annualized and compounded investment return computed on the assumption that SIP installments were received across the time periods from the start date of SIP from the end of the relevant period viz. 1 year, 3 years, 5 years and since Inception. *XIRR - XIRR calculates the internal rate of return to measure and compare the profitability of series of investments. QUANTUM GOLD SAVINGS FUND A. Cumulative performance Start Date B. Discrete 12 month performance NAV per Unit Returns Returns (%) ^ (%) # 30-Sep-15 Last 1 Year ,586 11, Sep-14 Last 2 Years ,261 11, Sep-13 Last 3 Years ,962 10,560 Sep 30, 2015 to Sep 30, ,586 11,989 Sep 30, 2014 to Sep 30, ,720 9,917 Sep 30, 2013 to Sep 30, ,846 8, ,170 14,429 Since Inception ** Returns up to 1 year period are Absolute Returns. Returns greater than 1 year period are compounded annualized (CAGR). # Domestic Price of Gold ** Inception Date: May 19, Since inception returns are calculated on NAV of ` 10 invested at inception. SIP Performance of Quantum Gold Savings Fund as on September 30, 2016 Since Inception SIP 3 Year SIP 3 Year SIP 1 Year SIP Returns (XIRR*) (%) Returns (XIRR*) (%) # Total Amount Invested (Rs. 000) Mkt Value as on September 30, 16 (Rs. 000) Past performance may or may not be sustained in the future. # Domestic Price of Gold Load is not taken into consideration and Returns are for Growth Option using applicable NAV on the SIP day (5th of every month). Return on SIP and are annualized and compounded investment return for cash flows resulting out of uniform and regular monthly subscriptions as on 5th day of every month (in case 5th is a non-business Day, then the next Business Day) and have been worked out using the Excel spreadsheet function known as XIRR. XIRR calculates the internal rate of return for series of cash flow. Assuming ` 10,000 invested every month on 5th day of every month (in case 5th is a non-business Day, then the next Business Day), the 1 year, 3 years and since inception returns from SIP are annualized and compounded investment return computed on the assumption that SIP installments were received across the time periods from the start date of SIP from the end of the relevant period viz. 1 year, 3 years and since Inception. *XIRR - XIRR calculates the internal rate of return to measure and compare the profitability of series of investments. 32 SCHEME PERFORMANCE - FUND MANAGER - WISE
33 CHIRAG MEHTA QUANTUM GOLD FUND A. Cumulative performance Start Date B. Discrete 12 month performance NAV per Unit Returns Returns (%) ^ (%) # 30-Sep-15 Last 1 Year Sep 30, 2015 to Sep 30, ,853 11,989 Sep 30, 2014 to Sep 30, ,818 9, ,795 8, ,280 25,703 1, ,853 11, Sep-14 Last 2 Years 1, ,637 11,890 Sep 30, 2013 to Sep 30, Sep-13 Last 3 Years 1, ,235 10,560 Since Inception ** ^^Tracking Error: 0.098% Returns up to 1 year period are Absolute Returns. Returns greater than 1 year period are compounded annualized (CAGR). # Domestic Price of Physical Gold ** Inception Date: February 22, Since inception returns are calculated on NAV of ` 100 invested at inception. CHIRAG MEHTA / ESH SHETTY QUANTUM MULTI ASSET FUND A. Cumulative performance Start Date B. Discrete 12 month performance NAV per Unit Returns Returns (%) ^ (%) # 30-Sep-15 Last 1 Year 30-Sep-14 Last 2 Years 30-Sep-13 Last 3 Years ,327 11,801 14,226 (%) Returns (%) ^ ^ 11,106 11,583 13,782 Sep 30, 2015 to Sep 30, ,327 11,106 Sep 30, 2014 to Sep 30, ,419 10,429 Sep 30, 2013 to Sep 30, ,055 11,899 Since Inception ** ,424 14,885 ^ Past performance may or may not be sustained in the future. Load is not taken into consideration and Returns are for Growth Option. Returns up to 1 year period are Absolute Returns. Returns greater than 1 year period are compounded annualized (CAGR). # Crisil Composite Bond Fund Index (40%)+ S&P BSE Sensex Total return Index (40%)+ Domestic price of gold (20%) ** Inception Date: July 11, Since inception returns are calculated on NAV of ` 10 invested at inception. SIP Performance of Quantum Multi Asset Fund as on September 30, 2016 Since Inception SIP 3 Years SIP Total Amount Invested (Rs. 000) Mkt Value as on September 30, 16 (Rs. 000) Returns (XIRR*) (%) Returns (XIRR*) (%) # ^^Standard Deviation: 5.64% Beta: Year SIP Sharpe Ratio: 0.97 Past performance may or may not be sustained in the future. # Crisil Composite Bond Fund Index (40%)+ S&P BSE Sensex Total return Index (40%)+ Domestic price of gold (20%) Load is not taken into consideration and Returns are for Growth Option using applicable NAV on the SIP day (5th of every month). Return on SIP and are annualized and compounded investment return for cash flows resulting out of uniform and regular monthly subscriptions as on 5th day of every month (in case 5th is a non-business Day, then the next Business Day) and have been worked out using the Excel spreadsheet function known as XIRR. XIRR calculates the internal rate of return for series of cash flow. Assuming ` 10,000 invested every month on 5th day of every month (in case 5th is a non-business Day, then the next Business Day), the 1 year, 3 years and since inception returns from SIP are annualized and compounded investment return computed on the assumption that SIP installments were received across the time periods from the start date of SIP from the end of the relevant period viz. 1 year, 3 years and since Inception. *XIRR - XIRR calculates the internal rate of return to measure and compare the profitability of series of investments. The is co-managed by Chirag Mehta and Nilesh Shetty. ^^ Definitions Standard deviation measures historical volatility. A high standard deviation suggests high volatility, while lower standard deviation would refer to more stability. Beta is the tendency of a fund's returns to respond to market swings. A beta of 1 indicates that the fund price will move with the market. A beta of less than 1 means that the security will be less volatile than the market. A beta of greater than 1 indicates that the security's price will be more volatile than the market. Sharpe Ratio is used to characterise how well the return of an asset compensates the investor for the risk taken. The greater a portfolio's Sharpe ratio, the better its risk-adjusted performance has been. Portfolio Turnover Ratio is the percentage of a funds assets that have changed over the course of a year. Tracking Error is a measure of how closely a fund follows the index to which it is benchmarked. The more passively the fund is managed, the smaller the tracking error. In the case of Exchange Traded Funds, the lower the Tracking Error, the better. SCHEME PERFORMANCE - FUND MANAGER - WISE 33
34 MURTHY NAGARAJAN QUANTUM LIQUID FUND A. Cumulative performance Start Date NAV per Unit Returns(%) ^ # # 23-Sep-16 7 days * ,014 10,015 10, Sep days * ,027 10,029 10, Aug days * ,053 10,058 10, Sep-15 Last 1 Year * ,707 10,769 10, Sep-14 Last 2 Years ** ,591 11,691 11, Sep-13 Last 3 Years ** ,635 12,800 12,663 Returns up to 1 year period are Simple Annualised Returns. Returns greater than 1 year period are compounded annualized (CAGR). # Crisil Liquid Fund Index ## Crisil 1 year T- Bill Index * Simple Annualised Yield ** CAGR B. Discrete 12 month performance # # Sep 30, 2015 to Sep 30, ,707 10,769 10,736 Sep 30, 2014 to Sep 30, ,825 10,856 10,886 Sep 30, 2013 to Sep 30, ,901 10,949 10,835 Since Inception ** ,852 21,437 19,018 Returns up to 1 year period are Absolute Returns. Returns greater than 1 year period are compounded annualized (CAGR). # Crisil Liquid Fund Index ## Crisil 1 year T- Bill Index ** Inception Date: April 7, Since inception returns are calculated on NAV of ` 10 invested at inception. QUANTUM DYNAMIC BOND FUND Returns (%)# # Value of investment of Rs. 10,000@ (Rs.) ( ) ## September 30, 2015 to September 30, ,112 11,151 11,111 Since Inception ** ,740 11,589 11,537 Past performance may or may not be sustained in the future Performance of the Dividend option for the investor would be net of the dividend distribution tax, as applicable **Date of Inception - May 19, SCHEME PERFORMANCE - FUND MANAGER - WISE
35 DetailsTHE & Risk Factors HOW TOStatutory READ FACTSHEET Fund Manager : An employee of the asset management company such as a mutual fund or life insurer, who manages investments of the scheme. He is usually part of a larger team of fund managers and research analysts. Application Amount for Fresh Subscription : This is the minimum investment amount for a new investor in a mutual fund scheme. Minimum Amount : This is the minimum investment amount for an existing investor in a mutual fund scheme. Yield to Maturity : The Yield to Maturity or the YTM is the rate of return anticipated on a bond if held until maturity. YTM is expressed as an annual rate. The YTM factors in the bond's current market price, par value, coupon interest rate and time to maturity. SIP : SIP or systematic investment plan works on the principle of making periodic investments of a fixed sum. It works similar to a recurring bank deposit. For instance, an investor may opt for an SIP that invests Rs 500 every 15th of the month in an equity fund for a period of three years. NAV : The NAV or the net asset value is the total asset value per unit of the mutual fund after deducting all related and permissible expenses. The NAV is calculated at the end of every business day. It is the value at which the investor enters or exits the mutual fund. : A group of securities, usually a market index, whose performance is used as a standard or benchmark to measure investment performance of mutual funds, among other investments. Some typical benchmarks include the Nifty, Sensex, BSE200, BSE500, 10-Year Gsec. Entry Load : A mutual fund may have a sales charge or load at the time of entry and/or exit to compensate the distributor/agent. Entry load is charged at the time an investor purchases the units of a mutual fund. The entry load is added to the prevailing NAV at the time of investment. For instance, if the NAV is Rs. 100 and the entry load is 1%, the investor will enter the fund at Rs 101. Note: SEBI, vide circular dated June 30, 2009 has abolished entry load and mandated that the upfront commission to distributors will be paid by the investor directly to the distributor, based on his assessment of various factors including the service rendered by the distributor Exit Load : Exit load is charged at the time an investor redeems the units of a mutual fund. The exit load is deducted from the prevailing NAV at the time of redemption. For instance, if the NAV is Rs 100 and the exit load is 1%, the redemption price would be Rs 99 Per Unit. Modified Duration : Modified duration is the price sensitivity and the percentage change in price for a unit change in yield Standard Deviation : Standard deviation is a statistical measure of the range of an investment's performance. When a mutual fund has a high standard deviation, its means its range of performance is wide, implying greater volatility. Sharpe Ratio : The Sharpe Ratio, named after its founder, the Nobel Laureate William Sharpe, is a measure of risk-adjusted returns. It is calculated using standard deviation and excess return to determine reward per unit of risk. Beta : Beta is a measure of an investment's volatility vis-à-vis the market. Beta of less than 1 means that the security will be less volatile than the market. A beta of greater than 1 implies that the security's price will be more volatile than the market. AUM : AUM or assets under management refers to the recent / updated cumulative market value of investments managed by a mutual fund or any investment firm. Holdings : The holdings or the portfolio is a mutual fund's latest or updated reported statement of investments/securities. These are usually displayed in terms of percentage to net assets or the rupee value or both. The objective is to give investors an idea of where their money is being invested by the fund manager. Nature of : The investment objective and underlying investments determine the nature of the mutual fund scheme. For instance, a mutual fund that aims at generating capital appreciation by investing in stock markets is an equity fund or growth fund. Likewise, a mutual fund that aims at capital preservation by investing in debt markets is a debt fund or income fund. Each of these categories may have sub-categories. Rating Profile : Mutual funds invest in securities after evaluating their creditworthiness as disclosed by the ratings. A depiction of the mutual fund in various investments based on their ratings becomes the rating profile of the fund. Typically, this is a feature of debt funds. HOW TO READ FACTSHEET 35

36 Details & Risk Factors FACTORS STATUTORYStatutory DETAILS & RISK Disclaimer, Statutory Details & Risk Factors: Mutual fund investments are subject to market risks read all scheme related documents carefully. Please visit to read scheme specific risk factors. Investors in the (s) are not being offered a guaranteed or assured rate of return and there can be no assurance that the schemes objective will be achieved and the NAV of the scheme(s) may go up and down depending upon the factors and forces affecting securities market. Investment in mutual fund units involves investment risk such as trading volumes, settlement risk, liquidity risk, default risk including possible loss of capital. Past performance of the sponsor / AMC / Mutual Fund does not indicate the future performance of the (s). Statutory Details:Quantum Mutual Fund (the Fund) has been constituted as a Trust under the Indian Trusts Act, Sponsor : Quantum Advisors Private Limited. (liability of Sponsor limited to Rs. 1,00,000/-) Trustee : Quantum Trustee Company Private Limited Investment Manager : Quantum Asset Management Company Private Limited. The Sponsor, Trustee and Investment Manager are incorporated under the Companies Act, Specific Risk Factors : The investors of Quantum Equity Fund of Funds, Quantum Gold Savings Fund and Quantum Multi Asset Fund will bear the recurring expenses, transaction charges and loads if any of the s in addition to the expenses, transaction charges and loads of the underlying s. Disclaimer of IISL: Quantum Index Fund (QIF) is benchmarked to Nifty 50 Index are not sponsored, endorsed, sold or promoted by India Index Services & Products Limited (IISL). IISL is not responsible for any errors or omissions or the results obtained from the use of such index and in no event shall IISL have any liability to any party for any damages of whatsoever nature (including lost profits) resulted to such party due to purchase or sale or otherwise of such product benchmarked to such index. Please refer SID of the QIF for full Disclaimer clause in relation to the Nifty 50 Index". Disclaimer of NSE: It is to be distinctly understood that the permission given by National Stock Exchange of India Limited (NSE) should not in any way be deemed or construed that the Information Document (SID) of Quantum Gold Fund (QGF) and Quantum Index Fund (QIF) has been cleared or approved by NSE nor does it certify the correctness or completeness of any of the contents of the SIDs. The investors are advised to refer to the SID of QIF for the full text of the Disclaimer clause of NSE. Want To Have The Latest Information About Us? Registered Office: Quantum Asset Management Company Pvt Ltd. 505, Regent Chambers, 5th floor, Nariman Point, Mumbai Corporate Identity Number (CIN): U65990MH2005PTC STATUTORY DETAILS & RISK FACTORS
Scheme Features. 10 yrs. 13-Mar Mar % 1.25% 1.25% Facility) Purchase : ` 500/- and in multiples of ` 1/- thereafter.
 Purchase : ` 500/- and in multiples of ` 1/- thereafter.") An Open ended Equity Features Nature of Investment Objective An Open-ended Open-ended Equity Equity The investment objective of the is to achieve long-term capital by investing investingprimarily primarilyinin
An Open ended Equity Features Nature of Investment Objective An Open-ended Open-ended Equity Equity The investment objective of the is to achieve long-term capital by investing investingprimarily primarilyinin
Scheme Features yrs. 13-Mar % Growth Dividend (Dividend Option will in turn have two Investment Options
 QUANTUM LONG TERM EQUITY FUND An Open ended Equity Nature of Features An Open-ended Equity Equity Investment Objective The investment objective of the is to achieve long-term capital appreciation by investing
QUANTUM LONG TERM EQUITY VALUE FUND
 QUANTUM LONG TERM EQUITY VALUE FUND An Open Ended Equity following a Value Investment Strategy Investment Objective : The investment objective of the is to achieve long-term capital appreciation by investing
QUANTUM LONG TERM EQUITY VALUE FUND
 QUANTUM LONG TERM EQUITY VALUE FUND An Open Ended Equity following a Value Investment Strategy Investment Objective : The investment objective of the is to achieve long-term capital appreciation by investing
QUANTUM TAX SAVING FUND
 QUANTUM TAX SAVING FUND An Open Ended Equity Linked Saving with a Statutory Lock in of 3 years and Tax Benefit Investment Objective : The investment objective of the is to achieve long-term capital appreciation
Scheme Features. Purchase : ` 500/- and in multiples of ` 1/- thereafter. Additional Purchase: ` 500/- and in multiples of ` 1/- thereafter / 50 units
 An Open ended Fund of Fund Features Nature of An Open ended Fund of Fund Investment Objective The investment objective of the is to provide capital appreciation by predominantly investing in units of Quantum
QUANTUM TAX SAVING FUND
 QUANTUM TAX SAVING FUND An Open Ended Equity Linked Saving with a Statutory Lock in of 3 years and Tax Benefit Investment Objective : The investment objective of the is to achieve long-term capital appreciation
QUANTUM LONG TERM EQUITY VALUE FUND
 QUANTUM LONG TERM EQUITY VALUE FUND An Open Ended Equity following a Value Investment Strategy Investment Objective : The investment objective of the is to achieve long-term capital appreciation by investing
QUANTUM EQUITY FUND OF FUNDS
 QUANTUM EQUITY FUND OF FUNDS An Open Ended Fund of Funds scheme Investing in Open Ended Diversified Equity s of Mutual Fund Investment Objective : The investment objective of the scheme is to generate
QUANTUM EQUITY FUND OF FUNDS
 QUANTUM EQUITY FUND OF FUNDS An Open Ended Fund of Funds scheme Investing in Open Ended Diversified Equity s of Mutual Fund Investment Objective : The investment objective of the scheme is to generate
QUANTUM TAX SAVING FUND
 QUANTUM TAX SAVING FUND An Open Ended Equity Linked Saving with a Statutory Lock in of 3 years and Tax Benefit Investment Objective : The investment objective of the is to achieve long-term capital appreciation
QUANTUM EQUITY FUND OF FUNDS
 QUANTUM EQUITY FUND OF FUNDS An Open Ended Fund of Funds scheme Investing in Open Ended Diversified Equity s of Mutual Fund Investment Objective : The investment objective of the scheme is to generate
INDEX QUANTUM DYNAMIC BOND FUND - QDBF HOW TO READ THE FACTSHEET. April 2016
 INDEX CONTENTS PAGE NO. 03 06 09 12 QUANTUM DYNAMIC BOND FUND - QDBF 15 17 20 23 26 28 31 HOW TO READ THE FACTSHEET 35 36 36 QUANTUM VIEW FOR APRIL 2016 Equity Outlook Atul Kumar- Head - Equity Funds n
INDEX QUANTUM DYNAMIC BOND FUND - QDBF 14. June 2015
 INDEX CONTENTS PAGE NO. 03 05 08 11 QUANTUM DYNAMIC BOND FUND - QDBF 14 16 19 22 25 27 30 33 33 QUANTUM VIEW FOR JUNE 2015 Equity Outlook Atul Kumar- Head - Equity Funds Debt Outlook Mr. Murthy Nagarajan
INDEX QUANTUM DYNAMIC BOND FUND - QDBF HOW TO READ THE FACTSHEET. September 2016
 INDEX CONTENTS PAGE NO. 03 06 09 12 QUANTUM DYNAMIC BOND FUND - QDBF 15 17 20 23 26 28 31 HOW TO READ THE FACTSHEET 35 36 36 QUANTUM VIEW FOR OCTOBER 2016 Equity Outlook Atul Kumar- Head - Equity Funds
INDEX QUANTUM DYNAMIC BOND FUND - QDBF QUANTUM NIFTY ETF - Q NIFTY HOW TO READ THE FACTSHEET. July 2017
 INDEX CONTENTS PAGE NO. 03 06 09 12 QUANTUM DYNAMIC BOND FUND - QDBF 15 18 21 24 27 QUANTUM NIFTY ETF - Q NIFTY 29 32 HOW TO READ THE FACTSHEET 35 36 36 QUANTUM VIEW FOR JULY 2017 Equity Outlook Atul Kumar-
QUANTUM EQUITY FUND OF FUNDS
 QUANTUM EQUITY FUND OF FUNDS An Open Ended Fund of Funds scheme Investing in Open Ended Diversified Equity s of Mutual Fund Investment Objective : The investment objective of the scheme is to generate
INDEX CONTENTS PAGE NO.
 INDEX CONTENTS PAGE NO. 03 05 08 11 14 17 20 23 25 28 31 31 QUANTUM VIEW FOR APRIL 2015 Equity Outlook Atul Kumar- Head - Equity Funds he S&P BSE Sensex fell by 3.38% during the month of on a total return
INDEX QUANTUM DYNAMIC BOND FUND - QDBF QUANTUM NIFTY ETF - Q NIFTY HOW TO READ THE FACTSHEET. May 2018
 INDEX CONTENTS PAGE NO. 03 06 09 12 QUANTUM DYMIC BOND FUND - QDBF 15 18 21 24 27 QUANTUM NIFTY ETF - Q NIFTY 29 32 HOW TO READ THE FACTSHEET 35 36 36 QUANTUM VIEW FOR MAY 2018 Equity Outlook Atul Kumar-
QUANTUM GOLD SAVINGS FUND
 QUANTUM GOLD SAVINGS FUND An Open Ended Fund of Fund Investing in Quantum Gold Fund Investment Objective : The investment objective of the is to provide capital appreciation by predominantly investing
INDEX QUANTUM DYNAMIC BOND FUND - QDBF QUANTUM NIFTY ETF - Q NIFTY HOW TO READ THE FACTSHEET. September 2017
 INDEX CONTENTS PAGE NO. 03 06 09 12 QUANTUM DYNAMIC BOND FUND - QDBF 15 18 21 24 27 QUANTUM NIFTY ETF - Q NIFTY 29 32 HOW TO READ THE FACTSHEET 35 36 36 QUANTUM VIEW FOR SEPTEMBER 2017 Equity Outlook Atul
INDEX QUANTUM DYNAMIC BOND FUND - QDBF QUANTUM NIFTY ETF - Q NIFTY HOW TO READ THE FACTSHEET. November 2017
 INDEX CONTENTS PAGE NO. 03 06 09 12 QUANTUM DYNAMIC BOND FUND - QDBF 15 18 21 24 27 QUANTUM NIFTY ETF - Q NIFTY 29 32 HOW TO READ THE FACTSHEET 35 36 36 QUANTUM VIEW FOR NOVEMBER 2017 Equity Outlook Atul
INDEX QUANTUM VIEW 03 QUANTUM LONG TERM EQUITY VALUE FUND - QLTEVF 06 QUANTUM TAX SAVING FUND - QTSF 10 QUANTUM EQUITY FUND OF FUNDS - QEFOF 14
 INDEX CONTENTS PAGE NO. QUANTUM VIEW 03 QUANTUM LONG TERM EQUITY VALUE FUND - QLTEVF 06 QUANTUM TAX SAVING FUND - QTSF 10 QUANTUM EQUITY FUND OF FUNDS - QEFOF 14 QUANTUM DYNAMIC BOND FUND - QDBF 18 QUANTUM
Quantum Index Fund. Factsheet for the month of August, 2010
 Quantum Index Fund Factsheet for the month of August, 2010 Quantum Index Fund An Open ended Exchange Traded Fund Fact Sheet as on 31st August 2010 Net Asset Value as on August 31, 2010 (Rs./Unit) Growth
Quantum Mutual Fund. Factsheets for the month of July, 2010
 Quantum Mutual Fund Factsheets for the month of July, 2010 Quantum Long Term Equity Fund An Open ended Equity Scheme 5 Star Rated by Value Research~ Fact Sheet as on 31st July 2010 Net Asset Value as on
Market Outlook. Nifty % Sensex %
 Market Outlook 22000 BSE NSE 6500 Key Indices 30-Apr-13 31-Mar-13 % Change 21000 20000 19000 18000 17000 16000 15000 6000 5500 5000 4500 4000 3500 Nifty 5930.20 5682.55 4.36% Sensex 19504.18 18835.77 3.55%
CONTENTS. page no. MARKET REVIEW HDFC Equity Fund... 5 HDFC Top 200 Fund... 6
 March 2017 CONTENTS page no. MARKET REVIEW... 3 HDFC Growth Fund... 4 HDFC Equity Fund... 5 HDFC Top 200 Fund... 6 HDFC Capital Builder Fund... 7 HDFC Core & Satellite Fund... 8 HDFC Premier Multi-Cap
CONTENTS. page no. MARKET REVIEW HDFC Equity Fund... 5 HDFC Top 200 Fund... 6
 February 2017 CONTENTS page no. MARKET REVIEW... 3 HDFC Growth Fund... 4 HDFC Equity Fund... 5 HDFC Top 200 Fund... 6 HDFC Capital Builder Fund... 7 HDFC Core & Satellite Fund... 8 HDFC Premier Multi-Cap
Published on 22 May 2017
 Published on 22 May 2017 QUANTUM LIQUID FUND (An open ended Liquid Scheme) Fact Sheet as on 19-May-17 Fund Size as on (Rs. in crores) 19-May-17 Absolute AUM DIRECT PLAN GROWTH OPTION 96.8866 DIRECT PLAN
How much will your current lifestyle cost at 60?
 (MODERATE PLAN) How much will your current lifestyle cost at 60? DATE OF ALLOTMENT November 01,2011 BENCHMARK CRISIL Hybrid 25+75 - Aggressive Index (WEF From 1st February 2018) FUND SIZE: Rs.733.18 (Rs.
CONTENTS. page no. MARKET REVIEW HDFC Equity Fund... 5 HDFC Top 200 Fund HDFC Premier Multi-Cap Fund... 9 HDFC Large Cap Fund...
 October 2016 CONTENTS page no. MARKET REVIEW... 3 HDFC Growth Fund... 4 HDFC Equity Fund... 5 HDFC Top 200 Fund... 6 HDFC Capital Builder Fund... 7 HDFC Core & Satellite Fund... 8 HDFC Premier Multi-Cap
How much will your current lifestyle cost at 60?
 (MODERATE PLAN) How much will your current lifestyle cost at 60? DATE OF ALLOTMENT November 01,2011 BENCHMARK CRISIL Hybrid 25+75 - Aggressive Index (WEF From 1st February 2018) FUND SIZE: Rs.856.45 (Rs.
How much will your current lifestyle cost at 60?
 (PROGRESSIVE PLAN) How much will your current lifestyle cost at 60? DATE OF ALLOTMENT November 01, 2011 BENCHMARK S&P BSE Sensex TRI (WEF From 1st February 2018) FUND SIZE Rs.474.87 (Rs. in Cr.) MONTHLY
How much will your current lifestyle cost at 60?
 (MODERATE PLAN) How much will your current lifestyle cost at 60? DATE OF ALLOTMENT November 01,2011 BENCHMARK CRISIL Hybrid 25+75 - Aggressive Index (WEF From 1st February 2018) FUND SIZE: Rs.772.12 (Rs.
Quantum Long Term Equity Fund
 Scheme Feature Quantum Long Term Equity Fund An Open ended Equity Scheme Fund Manager Fund Manager Total Experience Inception Date (Date of Allotment) Expense Ratio (Under each Oprion) Lock-in Period Net
How much will your current lifestyle cost at 60?
 (PROGRESSIVE PLAN) How much will your current lifestyle cost at 60? DATE OF ALLOTMENT November 01, 2011 BENCHMARK S&P BSE Sensex TRI (WEF From 1st February 2018) FUND SIZE Rs.547.64 (Rs. in Cr.) MONTHLY
INDEX QUANTUM VIEW 03 QUANTUM LONG TERM EQUITY VALUE FUND - QLTEVF 08 QUANTUM TAX SAVING FUND - QTSF 12 QUANTUM EQUITY FUND OF FUNDS - QEFOF 16
 INDEX CONTENTS PAGE NO. QUANTUM VIEW 03 QUANTUM LONG TERM EQUITY VALUE FUND - QLTEVF 08 QUANTUM TAX SAVING FUND - QTSF 12 QUANTUM EQUITY FUND OF FUNDS - QEFOF 16 QUANTUM DYNAMIC BOND FUND - QDBF 20 QUANTUM
M O N T H L Y F A C T S H E E T M A Y Schemes - Product Labeling
 TIMES M O N T H L Y F A C T S H E E T M A Y 2 0 1 7 Schemes - Product Labeling Name of the Scheme This product is suitable for Investors who are seeking* Riskometer Taurus Starshare An open - ended equity
How much will your current lifestyle cost at 60?
 (PROGRESSIVE PLAN) How much will your current lifestyle cost at 60? DATE OF ALLOTMENT November 01, 2011 BENCHMARK S&P BSE Sensex TRI (WEF From 1st February 2018) FUND SIZE Rs.467.54 (Rs. in Cr.) MONTHLY
Franklin India Prima Plus*
 Franklin India Prima Plus* Add Scale & Scope to your portfolio November 2017 *Please refer Slide 9 for Product Label 0 What do Multi-caps offer? Diversification across SECTORS Relatively lower volatility
MONTHLY UPDATE NOVEMBER 2018
 MONTHLY UPDATE NOVEMBER 2018 November 2018 A champion is defined not by their wins but by how they can recover when they fall. Equity markets - Serena Williams Indices 31 st Oct 2018 30 th Nov 2018 1 Month
Mid-Quarter Monetary Policy Review
 18 December, 2013 Mid-Quarter Monetary Policy Review RBI maintained status quo in the mid-quarter monetary policy meeting held today preferring to wait and watch for more forthcoming macro-economic data
Quantum Asset Management Company Private Limited Registered Office: 505, Regent Chambers, 5th Floor, Nariman Point, Mumbai
 Quantum Asset Management Company Private Limited Registered Office: 505, Regent Chambers, 5th Floor, Nariman Point, Mumbai-400 021. Quantum Long Term Equity Fund (An Open ended growth scheme with no assured
Equity Market Outlook. May, 2016
 Equity Market Outlook May, 2016 Global Economy Update Jan-15 Feb-15 Mar-15 Apr-15 May-15 Jun-15 Jul-15 Aug-15 Sep-15 Oct-15 Nov-15 Dec-15 Jan-16 Feb-16 Mar-16 Apr-16 Global Central Bank Monetary Policies
How much will your current lifestyle cost at 60?
 (MODERATE PLAN) How much will your current lifestyle cost at 60? DATE OF ALLOTMENT November 01,2011 BENCHMARK CRISIL Balanced Fund - Aggressive Index FUND SIZE Rs.370.53 (Rs. in Cr.) MONTHLY AVERAGE AUM
Product Labeling This product is suitable for investors who are seeking*: Riskometer
 Product Labeling This product is suitable for investors who are seeking*: Riskometer Long term capital appreciation. Investments in high growth companies along with the liquidity of an open-ended scheme
Invesco India Dynamic Equity Fund (An open-ended equity scheme)
") Invesco India Dynamic Equity Fund (An open-ended equity scheme) September 2016 Suitable for investors who are seeking*: Capital appreciation over long-term Investment in focused portfolio of equity and
Invesco India Dynamic Equity Fund (An open-ended equity scheme) September 2016 Suitable for investors who are seeking*: Capital appreciation over long-term Investment in focused portfolio of equity and
MONTHLY UPDATE SEPTEMBER 2017
 MONTHLY UPDATE SEPTEMBER 2017 September 2017 "I am a better investor because I am a businessman and a better businessman because I am an investor. - Warren Buffett Equity Markets Indices 31 st Aug 2017
Reliance ETF Sensex An Open Ended Index Exchange Traded Fund [Rajiv Gandhi Equity Savings Scheme (RGESS) Qualified Scheme]
![Reliance ETF Sensex An Open Ended Index Exchange Traded Fund [Rajiv Gandhi Equity Savings Scheme (RGESS) Qualified Scheme]](/thumbs/74/70975708.jpg "Reliance ETF Sensex An Open Ended Index Exchange Traded Fund [Rajiv Gandhi Equity Savings Scheme (RGESS) Qualified Scheme]") Reliance ETF Sensex An Open Ended Index Exchange Traded Fund [Rajiv Gandhi Equity Savings Scheme (RGESS) Qualified Scheme] This product is suitable for investors who are seeking*: Product labels Long-term
Reliance ETF Sensex An Open Ended Index Exchange Traded Fund [Rajiv Gandhi Equity Savings Scheme (RGESS) Qualified Scheme] This product is suitable for investors who are seeking*: Product labels Long-term
CONTENTS. page no. MARKET REVIEW HDFC Equity Fund... 5 HDFC Top 200 Fund... 6
 April 2017 CONTENTS page no. MARKET REVIEW... 3 HDFC Growth Fund... 4 HDFC Equity Fund... 5 HDFC Top 200 Fund... 6 HDFC Capital Builder Fund... 7 HDFC Core & Satellite Fund... 8 HDFC Premier Multi-Cap
Reliance ETF Sensex An Open Ended Index Exchange Traded Fund [Rajiv Gandhi Equity Savings Scheme (RGESS) Qualified Scheme]
![Reliance ETF Sensex An Open Ended Index Exchange Traded Fund [Rajiv Gandhi Equity Savings Scheme (RGESS) Qualified Scheme]](/thumbs/75/72534747.jpg "Reliance ETF Sensex An Open Ended Index Exchange Traded Fund [Rajiv Gandhi Equity Savings Scheme (RGESS) Qualified Scheme]") Reliance ETF Sensex An Open Ended Index Exchange Traded Fund [Rajiv Gandhi Equity Savings Scheme (RGESS) Qualified Scheme] This product is suitable for investors who are seeking*: Product labels Long-term
Reliance ETF Sensex An Open Ended Index Exchange Traded Fund [Rajiv Gandhi Equity Savings Scheme (RGESS) Qualified Scheme] This product is suitable for investors who are seeking*: Product labels Long-term
Riskometer. *Investors should consult their financial advisers if in doubt about whether the product is suitable for them.
 1 Product Labeling This product is suitable for investors who are seeking*: Regular income and capital appreciation. To generate income by investing in arbitrage opportunities in the cash and derivatives
Franklin India Flexi Cap Fund*
 Franklin India Flexi Cap Fund* A flexible approach to allocate between Scale & Scope November 2017 *Please refer Slide 8 for Product Label 0 What do Multi-caps offer? Diversification across SECTORS Relatively
STRIVE FOR BALANCE BETWEEN GROWTH AND STABILITY.
 MAGNUM BALANCED FUND An Open-ended Balanced Scheme STRIVE FOR BALANCE BETWEEN GROWTH AND STABILITY. Invest in a mix of equity and debt with SBI Magnum Balanced. BALANCED FUNDS A Balanced aims to balance
US Economic Outlook Improving
 Government Bonds Have Never Looked Less Attractive OUTLOOK Executive Summary Kenneth J. Taubes Chief Investment Officer, US Economic Outlook US GDP growth may lead growth among developed nations, at approximately
Invesco India Dynamic Equity Fund (An open-ended equity scheme)
") Invesco India Dynamic Equity Fund (An open-ended equity scheme) June 2017 Suitable for investors who are seeking*: Capital appreciation over long-term Investment in focused portfolio of equity and equity
Invesco India Dynamic Equity Fund (An open-ended equity scheme) June 2017 Suitable for investors who are seeking*: Capital appreciation over long-term Investment in focused portfolio of equity and equity
M O N T H L Y F A C T S H E E T A U G U S T Schemes - Product Labeling
 TIMES M O N T H L Y F A C T S H E E T A U G U S T 2 0 1 7 Schemes - Product Labeling Name of the Scheme This product is suitable for Investors who are seeking* Riskometer Taurus Starshare An open - ended
Prepaid SIP. new age thinking! Time to move with. Factsheet May A New Age Investment Plan
 Scan QR Code with your mobile and learn more. If you don t have the QR reader, simply download one of the many free applications available for your handset!!! Factsheet May 2013 Time to move with new age
Reliance Focused Large Cap Fund
 Reliance Focused Large Cap Fund Formerly, Reliance Equity Fund (An open ended Diversified Equity Scheme) To know more call us at 1800 300 11111 visit www.reliancemutual.com Download Free App Download with
Fixed Income Update October 2015
 Month Overview Average Liquidity Support by RBI Rs -5,527 Cr. Includes: LAF, MSF, SLF & Term Repo Bank Credit Growth Money Market Bank Deposit Growth 9.6% 11.6% Change in basis points Tenure CD Change
M O N T H L Y F A C T S H E E T N O V E M B E R Schemes - Product Labeling
 TIMES M O N T H L Y F A C T S H E E T N O V E M B E R 2 0 1 8 Schemes - Product Labeling Name of the Scheme This product is suitable for Investors who are seeking* Riskometer Taurus Starshare (Multi Cap)
FIXED INCOME UPDATE 1
 1 FIXED INCOME UPDATE Abstract Rates are headed down on lower inflation Inflation is likely to hit the RBI s disinflationary path Bond yields may further fall on continuation of rate cuts Macro conditions
Why Small and Midcap Companies
 August 2012 1 Why Small and Midcap Companies Superior Growth Growth Presence in generally new & faster growing segments MATURITY Ability to gain share due to DECLINE new technology, better products / services
CANARA ROBECO LARGE CAP+ FUND FEBRUARY 2018
 CANARA ROBECO LARGE CAP+ FUND FEBRUARY 2018 Canara Robeco Large Cap+ Fund The sign (+) in the name of the fund has been used in terms of asset allocation and not in return/yield An Open Ended Equity Scheme
Mutual Fund Screener For the quarter ended Dec-17
 Mutual Fund Screener For the quarter ended Dec-17 Mutual Fund Screener What s Inside 01 Industry Size 02 Investor Trends 03 Inflow Outflow Analysis 04 Sector Update 05 Category Performance 06 Industry
Participate in one of the key drivers of Growth & Development in India
 Participate in one of the key drivers of Growth & Development in India DATE OF ALLOTMENT December 28, 2015 BENCHMARK Nifty Financial Services TRI (WEF From 1st February 2018) FUND SIZE Rs.261.73 (Rs. in
*Investors should consult their financial advisers if in doubt about whether the product is suitable for them.
 Product Labelling This product is suitable for investors who are seeking*: Long term capital appreciation Investment in diversified basket of equity stocks spanning the entire market capitalization spectrum
With an eventful year 2015 coming to an end, at the very outset, we wish everyone a very happy and prosperous New Year
 Equity View With an eventful year 2015 coming to an end, at the very outset, we wish everyone a very happy and prosperous New Year- 2016. Key highlights: We believe that 2016 can be a year of immense possibilities
Sapne ek din mein sach nahin hotey! Start an SIP with as little as `500 per month, and aim to achieve your dreams in the long run.
 Reliance Nippon Life Asset Management Limited (formerly Reliance Capital Asset Management Limited) A Reliance Capital Company October 2016 Sapne ek din mein sach nahin hotey! Start an SIP with as little
Axis Corporate Debt Fund. (An open ended debt scheme predominantly investing in AA+ and above rated corporate bonds)
") Axis Corporate Debt Fund (An open ended debt scheme predominantly investing in AA+ and above rated corporate bonds) Macro economic indicators are showing signs of stability Indicator Current* Outlook Inflation
Axis Corporate Debt Fund (An open ended debt scheme predominantly investing in AA+ and above rated corporate bonds) Macro economic indicators are showing signs of stability Indicator Current* Outlook Inflation
Mutual Funds. Fortune Equity Brokers (India) Ltd.
 Ltd.") Mutual Funds A simple tool to achieve financial i goals.. What is Mutual Funds? Passed back to Generates Returns = Investor Pools money with Fund House Fund Managers invest in Capital Market Types of Mutual
Mutual Funds A simple tool to achieve financial i goals.. What is Mutual Funds? Passed back to Generates Returns = Investor Pools money with Fund House Fund Managers invest in Capital Market Types of Mutual
INDIA INTEREST RATES: CHANGING GEARS
 INDIA INTEREST RATES: CHANGING GEARS 2017 was a volatile year for the interest rates markets. Expectations built at the beginning of the year of a sustained low interest rate regime got increasingly questioned
Presenting. (An Open-Ended Balanced Scheme) August 2012
 August 2012") Presenting HDFC Balanced Fund (An Open-Ended Balanced ) August 2012 1 Table of Contents Balanced Fund- Basics Product Rationale and Asset Allocation Pattern Investment Strategy Portfolio Composition Performance
Presenting HDFC Balanced Fund (An Open-Ended Balanced ) August 2012 1 Table of Contents Balanced Fund- Basics Product Rationale and Asset Allocation Pattern Investment Strategy Portfolio Composition Performance
Gratuity Fund Performance
 Gratuity Fund Performance Monthly Fund Update, May 13 IN THIS POLICY, THE INVESTMENT RISK IN INVESTMENT PORTFOLIO IS BORNE BY THE POLICYHOLDER ECONOMY ECONOMY S.No. Indicators Mar-13 Apr-13 M-o-M Variation
Mutual Fund Screener For the quarter ended Mar-18
 Mutual Fund Screener For the quarter ended Mar-18 Mutual Fund Screener What s Inside 01 Industry 02 Investor 03 Inflow Outflow 04 Sector Size Trends Analysis Update 05 Category Performance 06 Industry
Managing your money using
 FACT SHEET - SEPTEMBER 2018 Managing your money using Value Investing principles! OF VALUING VALUE INVESTING! 2013-18 About the Fund Parag Parikh Long Term Equity Fund (PLTEF) is an open ended equity oriented
KEY INFORMATION MEMORANDUM AND APPLICATION FORM
 KEY INFORMATION MEMORANDUM AND APPLICATION FORM Axis Asset Management Company Limited (Investment Manager) AXIS BLUECHIP FUND (Formerly known as Axis Equity Fund) (An open ended equity scheme predominantly
Gratuity Fund Performance
 Gratuity Fund Performance Monthly Fund Update, December 11 IN THIS POLICY, THE INVESTMENT RISK IN INVESTMENT PORTFOLIO IS BORNE BY THE POLICYHOLDER ECONOMY ECONOMY Indicators Nov 2011 Dec 2011 M-o-M Variation
M O N T H L Y R E P O R T F E B R U A R Y Schemes - Product Labeling THIS PRODUCT IS SUITABLE FOR INVESTORS WHO ARE SEEKING*
 TIMES M O N T H L Y R E P O R T F E B R U A R Y 2 0 1 4 Schemes - Product Labeling Name of the Scheme Taurus Starshare An open end equity growth scheme Taurus Ethical Fund An open end equity oriented scheme
Mutual Fund Screener For the quarter ended Jun -18
 Mutual Fund Screener For the quarter ended Jun -18 Mutual Fund Screener What s Inside 01 Industry Size 02 Investor Trends 03 Inflow Outflow Analysis 04 Sector Update 05 Category Performance 06 Industry
HDFC Prudence Fund (An Open Ended Balanced Scheme)
") Rs 10,000 has become Rs 5.4 lacs (54 times) in 22 years CAGR of 19.2% for over 22 years since inception HDFC Prudence Fund (An Open Ended Balanced Scheme) Prudence Yatra is Prudent Yatra Over 2 Decades
Rs 10,000 has become Rs 5.4 lacs (54 times) in 22 years CAGR of 19.2% for over 22 years since inception HDFC Prudence Fund (An Open Ended Balanced Scheme) Prudence Yatra is Prudent Yatra Over 2 Decades
UTI Dual Advantage Fixed Term Fund Series IV I (1279 days)
") UTI Dual Advantage Fixed Term Fund Series IV I (1279 days) (A Close-ended Hybrid Scheme) NFO Opens: November 22, 2016 NFO Closes: December 06, 2016 RISKOMETER The product is suitable for investors who
UTI Dual Advantage Fixed Term Fund Series IV I (1279 days) (A Close-ended Hybrid Scheme) NFO Opens: November 22, 2016 NFO Closes: December 06, 2016 RISKOMETER The product is suitable for investors who
Managing your money using
 FACT SHEET - AUGUST 2018 Managing your money using Value Investing principles! OF VALUING VALUE INVESTING! 2013-18 About the Fund Parag Parikh Long Term Equity Fund (PLTEF) is an open ended equity oriented
CANARA ROBECO BLUE CHIP EQUITY FUND
 CANARA ROBECO BLUE CHIP EQUITY FUND JULY 2018 CONTENTS Blue Chip Equity Funds Risk-Reward Matrix An Introduction Canara Robeco Blue Chip Equity Fund Investment Process Portfolio Performance Why Canara
Think Of Us Before You Invest
 Think Of Us Before You Invest DATE OF ALLOTMENT March 31,1996 BENCHMARK S&P BSE Sensex FUND SIZE Rs.679.21 (Rs. in Cr.) MONTHLY AVERAGE AUM Rs.668.51 (Rs. in Cr.) EXIT LOAD Nil (Compulsory lock-in period
Equity: Buy on dips. Build portfolio for long term wealth creation Fixed Income: Invest in short to medium duration funds
 Equity: Buy on dips. Build portfolio for long term wealth creation Fixed Income: Invest in short to medium duration funds 1 Month Returns' (%) Global Indices Among the emerging countries India outperformed
ONE FUND. THREE BENEFITS.
 EQUITY SAVINGS FUND An Open-ended Equity Scheme ONE FUND. THREE BENEFITS. INCOME OPPORTUNITY GROWTH POTENTIAL OF EQUITY TAX EFFICIENCY PRESENTING SBI EQUITY SAVINGS FUND: SBI Equity Savings Fund, is an
Mirae Asset Emerging Bluechip Fund (MAEBF)
") Mirae Asset Emerging Bluechip Fund (MAEBF) (An Open Ended Equity Fund) Product Literature December 2014 MAEBF Our Goal Our endeavour has been to Spot the Potential of Emerging Companies and consistently
Mirae Asset Emerging Bluechip Fund (MAEBF) (An Open Ended Equity Fund) Product Literature December 2014 MAEBF Our Goal Our endeavour has been to Spot the Potential of Emerging Companies and consistently
Equity Market Update Bank of Baroda: About Us Pioneer Global Asset Management S.p.A.: Contact Points: Statutory Details: Sponsors:
 Equity Market Update In September, Indian equity markets continued its upward march to reach a new high. The gained over 9% to close at 17126, the highest level for the year 29. has exceeded investor expectations
fun Equity Diversified Large Cap Index Diversified Mid Cap & Small Cap Diversified Multi Cap Balanced Diversified Theme Based Sector Tax Saver
 fun e ge Equity Diversified Large Cap Vision Fund... 02 Top 200 Fund... 03 Quant Plus Fund... 04 NRI Equity Fund... 05 Equity Fund... 06 Index Index Fund - Nifty Plan... 06 Index Fund - Sensex Plan...
Q U A R T E R L Y F A C T S H E E T J U N E Schemes - Product Labeling
 TIMES Q U A R T E R L Y F A C T S H E E T J U N E 2 0 1 7 Schemes - Product Labeling Name of the Scheme This product is suitable for Investors who are seeking* Riskometer Taurus Starshare An open - ended
Weekly Review June 29, 2018
 Weekly Review June 29, 2018 Key Economic News International Domestic According to the Commerce Department report, real Gross Domestic Product (GDP) of U.S. rose 2.0% YoY in the Mar quarter of 2018, slower
MONTHLY UPDATE APRIL 2018
 MONTHLY UPDATE APRIL 2018 April 2018 The stock market is the story of cycles and of the human behavior that is responsible for overreactions in both directions. Equity Markets - Seth Klarman Indices 28
A subsidiary of TVS Wealth Pvt Ltd
 A subsidiary of TVS Wealth Pvt Ltd IMMPL Annual Outlook 2019 2018 A CHALLENGING YEAR, BETTER STARTING POINT IN 2019 The year gone by The year 2018 was a challenging year for investors. Almost all asset
MONETARY POLICY OUTLOOK- THE FIFTH BI-MONTHLY MONETARY POLICY REVIEW OF THE CURRENT FINANCIAL YEAR DECEMBER-MARCH
 MONETARY POLICY OUTLOOK- THE FIFTH BI-MONTHLY MONETARY POLICY REVIEW OF THE CURRENT FINANCIAL YEAR DECEMBER-MARCH 2018-19 Dr. Arun Kumar Misra, Associate Professor, Finance & Accounts, VGSOM, IIT Kharagpur
fun Equity Diversified Large Cap Index Diversified Mid Cap & Small Cap Diversified Multi Cap Balanced Sector Tax Saver Arbitrage ETF
 fun e ge Equity Diversified Large Cap Vision Fund... 06 Top 200 Fund... 07 Quant Plus Fund... 08 NRI Equity Fund... 09 Equity Fund... 10 Index Index Fund - Nifty Plan... 11 Index Fund - Sensex Plan...
KEY INFORMATION MEMORANDUM AND APPLICATION FORM FOR
 Axis Asset Management Company Limited (Investment Manager) KEY INFORMATION MEMORANDUM AND APPLICATION FORM FOR AXIS EQUITY FUND (An open-ended growth scheme) AXIS TRIPLE ADVANTAGE FUND (An open-ended hybrid
Reliance ETF NV20 (Formerly R*Shares NV20 ETF) An Open Ended Index Exchange Traded Fund [Rajiv Gandhi Equity Savings Scheme (RGESS) Qualified Scheme]
![Reliance ETF NV20 (Formerly R*Shares NV20 ETF) An Open Ended Index Exchange Traded Fund [Rajiv Gandhi Equity Savings Scheme (RGESS) Qualified Scheme]](/thumbs/80/82428439.jpg "Reliance ETF NV20 (Formerly R*Shares NV20 ETF) An Open Ended Index Exchange Traded Fund [Rajiv Gandhi Equity Savings Scheme (RGESS) Qualified Scheme]") Reliance ETF NV20 (Formerly R*Shares NV20 ETF) An Open Ended Index Exchange Traded Fund [Rajiv Gandhi Equity Savings Scheme (RGESS) Qualified Scheme] This product is suitable for investors who are seeking*:
Reliance ETF NV20 (Formerly R*Shares NV20 ETF) An Open Ended Index Exchange Traded Fund [Rajiv Gandhi Equity Savings Scheme (RGESS) Qualified Scheme] This product is suitable for investors who are seeking*:
RBI s Sixth Bi-Monthly Monetary Policy Review ( ) Maintains status quo...neutral Stance
 Maintains status quo...neutral Stance") 7h February 2018 RBI s Sixth Bi-Monthly Monetary Policy Review (2017-18) Maintains status quo...neutral Stance Repo Rate unchanged at Reverse Repo Rate stands at 5.75% Marginal Standing Facility and Bank
7h February 2018 RBI s Sixth Bi-Monthly Monetary Policy Review (2017-18) Maintains status quo...neutral Stance Repo Rate unchanged at Reverse Repo Rate stands at 5.75% Marginal Standing Facility and Bank