Accelerating Condensate Development in the Heart of the Montney While Retaining Capital Flexibility
|
|
|
- Anna Dawson
- 5 years ago
- Views:
Transcription

1 Accelerating Condensate Development in the Heart of the Montney While Retaining Capital Flexibility Investor Presentation TSX: AAV March 2019
 Total Production Liquids Production Exit Liquids Production 41,651 boe/d 1,491 bbls/d 1,974 bbls/d Advantage Montney Assets Progress 2019 Guidance (2) Total")
 Forward-looking information.")
2 ADVANTAGE AT A GLANCE TSX 52-week trading range $ $4.80 Shares Outstanding (basic) 186 million Market Capitalization $0.4 billion Enterprise Value $0.7 billion Estimated Production (1) Total Production Liquids Production Exit Liquids Production 41,651 boe/d 1,491 bbls/d 1,974 bbls/d Advantage Montney Assets Progress 2019 Guidance (2) Total Production 43,500 to 46,500 boe/d Liquids Production (100% Increase) 3,100 bbls/d Exit Liquids Production ~4,500 bbls/d Glacier Valhalla Pipestone/ Wembley Notes: (1) operational and financial results are estimates only and have not been reviewed or audited by our independent auditor. (2) Forward-looking information. Refer to three year development plan (page 11) and Advisory for material assumptions and risk factors. Advantage holds 131,840 net acres (206 net sections) in the condensate-rich Montney Glacier/Pipestone fairway 2


3 DEVELOPMENT PLAN FURTHER STRENGTHENS BUSINESS MODEL Solid Today Solid Tomorrow Free Cash Generating Asset Ultra-low Costs Financial Strength & Flexibility World Class Montney Resource Reinvest to Diversify & Enhance Free Cash Generation Maintain & Strengthen Netbacks Preserve & Enhance Investment Returns Condensate/Light Oil & Natural Gas Capital Allocation Flexibility 3

 Forward-looking information.")
4 DEVELOPMENT PLAN - INTERNALLY-FUNDED GROWTH (1) Glacier The Foundation Valhalla Progress Glacier/Pipestone Liquids Development The Next Phase 6 miles Pipestone/ Wembley Condensate & Light Oil Focused Drill 96 Montney wells: 42 Pipestone/Wembley 14 Valhalla 36 Glacier 4 Progress Utilize 3 rd party gas processing for initial Pipestone/Wembley development Utilize spare processing capacity at Glacier gas plant for growth at Valhalla, Glacier, Progress & 3 rd party processing income Build liquids handling hub at Pipestone/Wembley Notes: (1) Forward-looking information. Refer to three year development plan (page 11) and Advisory for material assumptions and risk factors. 4

 Liquids-rich Middle Montney Only 65 liquids-rich wells")
 Management Estimates. Refer to Advisory. (2) Based on Sproule December 31, Reserves Report.")
5 OPERATIONS OVERVIEW SHIFTING TO MIDDLE MONTNEY LIQUIDS Glacier Progress Deep Liquids-Rich Inventory (1)(2)(3) Booked Undeveloped Unbooked Upside TOTAL future location inventory ~1,200 to 1,400 Valhalla Pipestone/ Wembley <25 bbls/mmcf bbls/mmcf >100 bbls/mmcf Total of ~206 net sections (131,840 net acres) Middle Montney is liquids-rich throughout (25 to 280 bbls/mmcf) Liquids-rich Middle Montney Only 65 liquids-rich wells drilled to date 5% of inventory 100% Ownership of Glacier gas plant 400 mmcf/d capacity, 6,800 bbls/d liquids handling (1) Management Estimates. Refer to Advisory. (2) Based on Sproule December 31, Reserves Report. (3) C 3 + shallow cut recoveries. 5
 Inventory of >200 wells in primary development zones (4) AAV 1,312 boe/d 62% liquids Half-cycle Economics (1)(2) (AECO Cdn $2.")
 Average over 1- Year Production (boe/d) TOTAL EUR (boe) Oil 581 303 361,000 Gas 409 260 384,000 NGL")
6 PIPESTONE/WEMBLEY LIQUIDS RICH DEVELOPMENT Pipestone BBI CNQ ECA Kelt The premium condensate play in Canada 31 net sections Recent M&A land values exceeding $4.5 million per section 42 wells planned from 2019 to 2021 (4) Inventory of >200 wells in primary development zones (4) AAV 1,312 boe/d 62% liquids Half-cycle Economics (1)(2) (AECO Cdn $2.00/mcf & $US 60/bbl WTI) Rate of Return % Payout Years Breakeven (3) 160% - 200% <$1.00/mcf Pipestone Oil Corp Blackbird Energy Area Well Performance Average Initial Production (boe/d) Average over 1- Year Production (boe/d) TOTAL EUR (boe) Oil ,000 Gas ,000 NGL ,000 Total 1, ,000 Liquid Yield Bbls/mmcf (1) Management estimates. (2) Rate of Return is the percentage return earned on the capital invested in a well during the well s producing life assuming initial capital of $5.3 million per well DCE+T (drilling, completion, equipping and tie-in) with natural gas and NGL prices and costs escalated at 1.5% annually. (3) Breakeven based on NPV10 pre-tax equal to zero and calculated AECO Cdn price. (4) There are 11 proved and no probable undeveloped locations booked by our independent reserve evaluator in this area. Refer to Appendix and Advisory. 6
 Management estimates.")
 with natural gas and NGL prices and costs escalated at 1.5% annually.")

7 VALHALLA LIQUIDS DEVELOPMENT ADVANCING Upper Montney Middle Montney 2 Middle Montney 3 Middle Montney 4 Lower Montney AAV Liquids Handling Hub 2 well pad completion planned February 2019 Competitor well IP30 1,400 boe/d 68% liquids (1) Management estimates. (2) Rate of Return is the percentage return earned on the capital invested in a well during the well s producing life assuming initial capital of $4.8 million per well DCE+T (drilling, completion, equipping and tie-in) with natural gas and NGL prices and costs escalated at 1.5% annually. (3) Breakeven based on NPV10 pre-tax equal to zero and calculated AECO Cdn price. (4) There are 13 proved and 1 probable undeveloped locations booked by our independent reserve evaluator in this area. All remaining locations are unbooked estimates by Management. Refer to Appendix and Advisory. Industry results in Middle Montney have proven ultra-rich condensate on offsetting lands Advantage to target same interval Q Extension of Wembley reservoir 42 net sections 200 well inventory and growing (4) Pipeline connected to Advantage Glacier gas plant through new AAV liquids hub Half-cycle Economics (1)(2) (AECO Cdn $2.00/mcf & $US 60/bbl WTI) Rate of Return % Payout Years Breakeven (3) (AECO Cdn $) 40% - 90% <$1.00/mcf 7
, including 480 liquids-rich Low costs = high netbacks IP30 well liquids rates up to 400 bbls/d Half-cycle Economics (1)(2) (AECO Cdn $2.")
8 LIQUIDS-RICH MIDDLE MONTNEY AT GLACIER STEPPING UP Only 41 Middle Montney drills to date Early development was in Upper and Lower Montney Recent focus on Middle Montney, where liquids range from bbls/mmcf 90 net sections 750 well inventory (4), including 480 liquids-rich Low costs = high netbacks IP30 well liquids rates up to 400 bbls/d Half-cycle Economics (1)(2) (AECO Cdn $2.00/mcf & $US 60/bbl WTI) Rate of Return % Payout Years Breakeven (3) (AECO Cdn $) Upper Montney Middle Montney 2 Middle Montney 3 Middle Montney 4 Lower Montney 40% - 90% <$1.00/mcf (1) Management estimates. (2) Rate of Return is the percentage return earned on the capital invested in a well during the well s producing life assuming initial capital of $4.8 million per well DCE+T (drilling, completion, equipping and tie-in) with natural gas and NGL prices and costs escalated at 1.5% annually. (3) Breakeven based on NPV10 pre-tax equal to zero and calculated AECO Cdn price. (4) There are 303 proved and 28 probable undeveloped locations booked by our independent reserve evaluator in this area. All remaining locations are unbooked estimates by Management. Refer to Appendix and Advisory. 8
")

9 STRATEGIC INFRASTRUCTURE CONTROL, FLEXIBLE PIPELINE ACCESS 100% Owned Glacier Gas Plant 400 mmcf/d Raw Gas + 6,800 bbls/d C3+ Liquids Extraction Advantage Gas Plant Alliance Sales Gas Line Liquids Handling Hub Pembina NGL Line NGTL Sales Gas Mainline Company Land Company Gas Plant TransCanada Pipeline Pembina Pipeline Advantage Pipeline Alliance Pipeline Keyera Pipestone Plant (2021) Tidewater Pipestone Plant (2019) Growth beyond 400 mmcf/d can be accommodated on existing plant site NGTL Natural Gas Firm Transportation Service in-place Several new gas plants underway in Pipestone/Wembley area competitive options available 3 rd Party processing capacity in H to match Pipestone/Wembley growth profile Advantage s Wembley to Glacier planned pipeline routing work continuing 9
10 REVENUE & MARKET DIVERSIFICATION, HEDGING AND TRANSPORTATION (1) Revenue Diversification 22% 8% 13% 37% 48% 15% 17% 20% 20% 58% 14% 13% 15% 2019E 2020E 2021E Market Diversification Benefits Diversifies Advantage s sales portfolio Liquids Midwest US Dawn Fixed Price AECO Enhances commercial terms to optimize netbacks & increases commercial flexibility $3.45 Current Hedging Transactions (MMcf/d) Hedging Strategy Actively hedge future commodity prices to ensure cash expectations and preserve development project economics Transportation Sufficient current and future transportation capacity available to meet requirements of development plan Actively manage contracted transportation capacity to minimize unutilized demand charges 10 Notes: (1) Forward-looking information. Refer to three year development plan (page 11) and Advisory for material assumptions and risk factors. $2.75 $2.75 $2.93 $3.01 $2.87 $2.87 $2.87 $3.09 $2.34 $1.72 $2.84 $2.83 $1.84 $1.84 $2.07 0% Q1-18 Q2-18 Q3-18 Q4-18 Q1-19 Q2-19 Q3-19 Q4-19 AECO ($Cdn/Mcf) Dawn ($US/Mmbtu) % of Production Hedged 60% 50% 40% 30% 20% 10%
11 DEVELOPMENT PLAN AS AT NOVEMBER (1) Guidance and Estimates (2)(3) 2019 Guidance 2020 Estimate 2021 Estimate Average production (boe/day) 43,500-46,500 47,850 52,300 Gas production (mmcf/d) 244 to Liquids production (bbls/d) 2,900 to 3,200 7,000 11,370 % Liquids / % Condensate/light oil 7% / 75% 15% / 80% 22% / 82% Royalties ($/boe) and Royalty Rate (%) $0.65 (4%) $0.90 (4%) $1.15 (4.5%) Operating Cost ($/boe) $2.00 $2.45 $2.65 Transportation Cost ($/boe) $3.35 $3.45 $3.40 G&A/Finance Cost ($/boe) $1.35 $1.35 $1.25 Cash Used in Investing Activities (6) (millions) $185 to $215 $225 $240 Net Capital Expenditures (4)(5)(6) (millions) $185 to $215 $225 $240 Capital Efficiency (4)(6) ($/boe/d) $12,800 $13,700 $12,700 Cash Provided by Operating Activities (millions) $185 $235 $315 Adjusted Funds Flow (4)(5) (millions) $185 $235 $315 per boe $11.28 $13.38 $16.56 per share $0.99 $1.25 $1.67 Total debt to adjusted funds flow (4) WTI (US$/bbl) (2) $66.79 $66.37 $63.29 Advantage C5+/Light oil differential to WTI (CAD$/bbl) (2) $(7.00) $(6.00) $(6.00) CAD/USD exchange rate (2) $0.77 $0.77 $0.77 AECO (C$/GJ) (2) $1.68 $1.61 $1.78 Notes: 1) Forward-looking information. Refer to Advisory for cautionary statements regarding Advantage s budget and three-year development plan including material assumptions and risk factors. 2) Based on assumptions and strip pricing effective as at October 23, as set forth above. 3) Management estimates representing mid-point of range. 4) Non-GAAP Measure which may not be comparable to similar non-gaap measures used by other entities. Refer to Advisory. 5) Net Capital Expenditures is the same as Cash Used in Investing Activities and Adjusted Funds Flow is the same as Cash Provided by Operating Activities as no change in non-cash working capital is assumed between years and other differences are immaterial. 6) 2019 Capital Guidance updated. Refer to Year-End Reserves & Operations Update News Release dated February 11,
12 THREE AR DEVELOPMENT PLAN STRENGTHENING FOUNDATION (1) G&A and Finance Transport Operating Royalties Total Production (boe/d) 9% 52,300 6% 47,850 45,000 22% 7% 15% 2019E 2020E 2021E Gas Liquids % of Total Costs ($/boe) $1.35 $1.35 $1.25 $3.45 $3.00 $3.35 $2.00 $2.45 $2.65 $0.65 $0.90 $1.15 3,100 75% Liquids Production and Composition (bbls/d) 125% 7,000 80% 62% Capital program calibrated to maintain strong balance sheet Average capital efficiency ~$13,000/boe/d (2) 11,370 81% 2019E 2020E 2021E Three Year Development Plan 14,000 bbls/d Exit C E 2020E 2021E Notes: (1) Forward-looking information. Refer to three year development plan (page 11) and Advisory for material assumptions and risk factors. (2) Non-GAAP measure which may not be comparable to similar non-gaap measures used by other entities. Refer to Advisory. 12


 and Advisory for")


13 NET CAPITAL EXPENDITURES FOCUSED ON DRILLING (1)(2) Progress 5% 2019 Capital By Area Other 6% $200 million Wembley 26% Valhalla 16% Glacier 47% 2019 Capital Breakdown Other $13 Facility & Tie-in $53 Drill & Complete $134 67% Allocated to Drilling & Completions Total Capital By Area Progress 3% Other 7% Wembley 49% Total Capital Breakdown Other $43 67% Allocated to Drilling & Facility & Tie-in $177 Glacier 29% Drill & Complete $445 $665 million Valhalla 12% Completions Notes: (1) Forward-looking information. Refer to three year development plan (page 11) and Advisory for material assumptions and risk factors. (2) Non-GAAP measure which may not be comparable to similar non-gaap measures used by other entities. Refer to Advisory. 13
14 DEVELOPMENT PLAN PRICE SENSITIVITY - MANAGING VOLATILITY (1) Total Debt to Trailing Adjusted Funds Flow Sensitivity (1) AECO $1.30/mcf AECO $1.50/mcf AECO $1.70/mcf Total Debt to Trailing Adjusted Funds Flow Sensitivity (1) WTI US$50.00/bbl WTI US$60.00/bbl WTI US$70.00/bbl Notes: (1) Forward-looking information. Refer to three year development plan (page 11) and Advisory for material assumptions and risk factors. (2) Non-GAAP measure which may not be comparable to similar non-gaap measures used by other entities. Refer to Advisory. (3) Gas sensitivity assumes flat price WTI US $55/bbl and liquids sensitivity assumes flat price AECO $1.40/mcf. Estimated C 5 +/Light Oil differential to WTI of $7.00/bbl Cdn 2019, $6.00/bbl Cdn 2020 & 2021 and Fx $0.77 Cdn/US. Other market diversification based on future prices as of October 23,. 14
15 2019 BUDGET RETAINS CAPITAL FLEXIBILITY (1) Advantage has flexibility to defer ~$100 million of 2019 capital spending with minimal impact on 2019 estimated production to preserve a strong balance sheet if prices remain below forecast. Net Capital Expenditures (2)(3) Production and Composition Total Debt to Adjusted Funds Flow (2) $185 - $215 Million Budget 45,000 boe/d 3,100 bbls/d Liquids <2.0x Up to $100 million flexibility $100 million 100% increase over 251 mmcf/d Natural gas 2019E 2019E 2019E Notes: (1) Forward-looking information. Refer to three year development plan (page 11) and Advisory for material assumptions and risk factors. (2) Non-GAAP measure which may not be comparable to similar non-gaap measures used by other entities. Refer to Advisory. (3) 2019 Capital guidance range reduced. Refer to Year-End Reserves & Operations Update News Release dated February 11,


16 Financial Discipline Operationally Nimble Returns Focus
17 APPENDIX 17


18 GLACIER LOCATED IN THE HEART OF THE MONTNEY RESOURCE PLAY Montney Siltstone Comparison: 700 times more permeability 4x more formation thickness Very low clay content Liquids & Improved well efficiencies strong economics Up to 83 bbls/mmcf 18
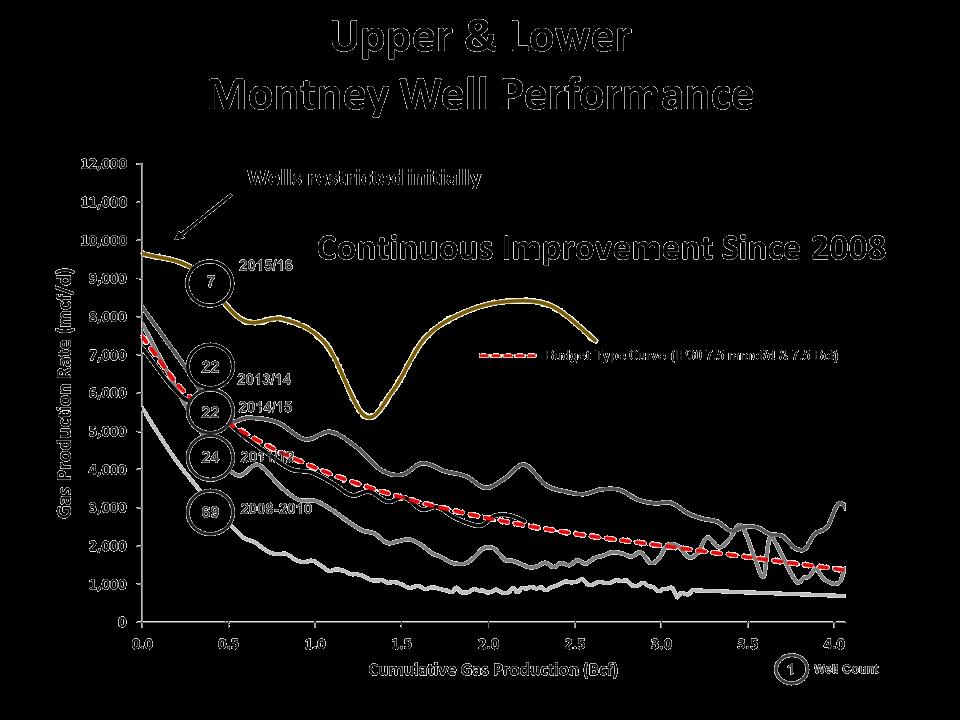
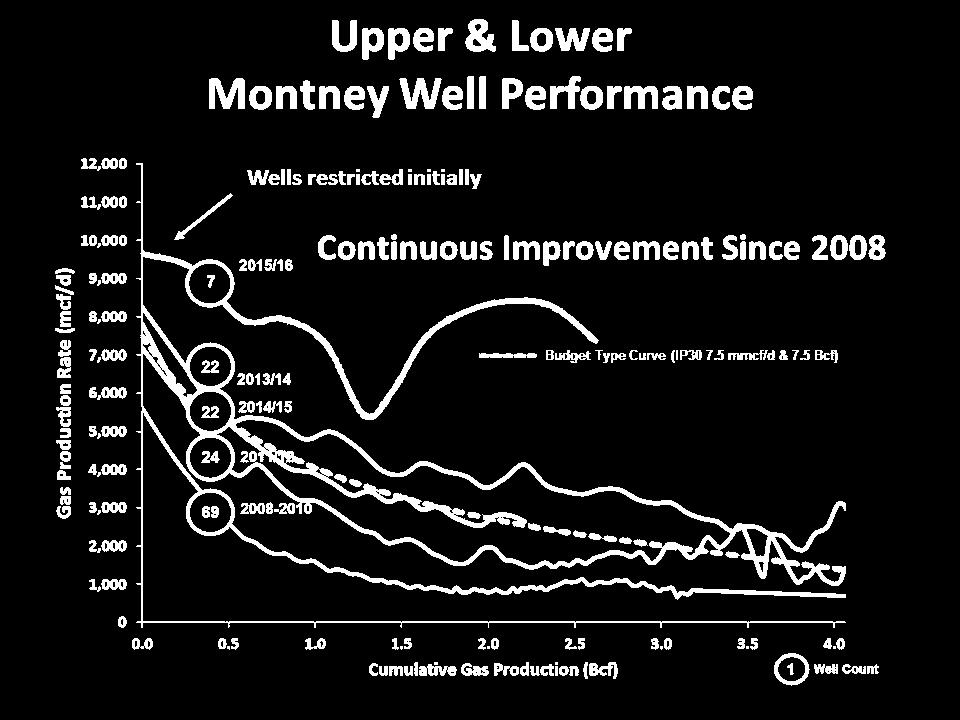

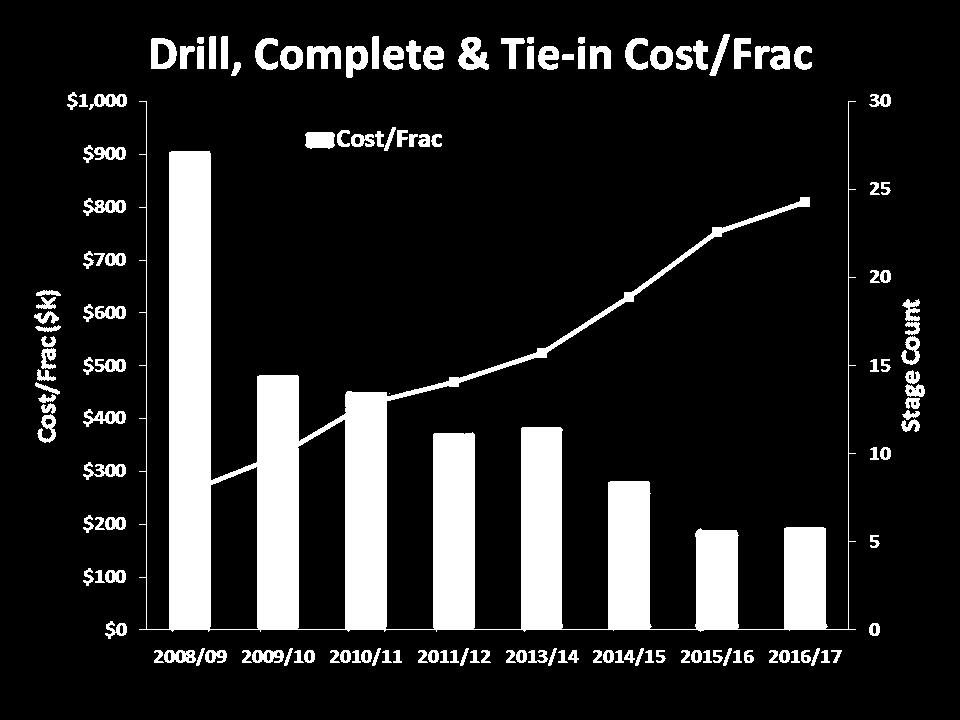

19 CONTINUOUS IMPROVEMENT HAS LED TO EXCEPTIONAL EFFICIENCIES Production restrictions 19

20 MIDDLE MONTNEY PRODUCTION CONTINUES TO INCREASE 6 wells Gen 6: Slickwater, OH Packers, Stage completions Avg 34 frac stages Wells Gen 5: Slickwater, OH Packers, Cased hole & Stage completions Avg 27 frac stages Middle Montney wells with frac design changes including >20 frac stages & numerous mechanical systems to be evaluated 34 total Middle Montney wells on-production across Glacier land block wells Gen 4: Slickwater, OH Packers Avg 19 frac stages wells Gen 3: Slickwater, OH Packers Avg 15 frac stages wells Gen 2: Poly CO2, & Slickwater Plug and Perf Avg 13 frac stages wells Gen 1: Poly CO2, Sand Plugs, Avg 15 frac stages Note: Production plot affected by low number of producing wells >350 days and wells being choked. Middle Montney Budget Type Curve (IP mmcf/d & 5.0 Bcf) 20
21 GLACIER MONTNEY ASSIGNED 2P EUR PER WELL & INTERVAL Glacier - 2P Recoveries per Interval (1) # of Gross HZ Wells 2P Recovery [bcf/well] Interval 2016 Developed Undeveloped Total Developed Undeveloped Total UM MM MM MM LM Total Interval 2016 # of Gross HZ Wells 2P Recovery [bcf/well] Developed Undeveloped Total Developed Undeveloped Total 2016 Valhalla - 2P Recoveries per Interval (1) UM MM MM Total (1) Based on Sproule year-end reserve reports. Indicated raw gas volumes per well. Refer to Statement of Reserves Data and Other Oil and Gas Information in the Corporation s Annual Information Forms which are available at and 21
22 WEMBLEY MONTNEY ASSIGNED 2P EUR PER WELL & INTERVAL Wembley Montney Assigned 2P EUR Per Well & Interval (1) # of Gross HZ Wells 2P Gas & Free Liquids Recovery [bcf/well mstb/well] Interval Developed Undeveloped Total Developed Undeveloped Total 4 MM Total (1) Based on Sproule and year-end reserve reports. Indicated raw gas volumes per well. Refer to Statement of Reserves Data and Other Oil and Gas Information in the Corporation s Annual Information Forms which are available at and 22
23 ADVISORY Forward-Looking Information and Statements The information in this presentation contains certain forward-looking information and forward-looking statements (collectively, "forward-looking statements") within the meaning of applicable securities laws relating to the Corporation's plans and other aspects of its anticipated future operations, management focus, strategies, financial, operating and production results and business opportunities. These statements relate to future events or our future intentions or performance. All statements other than statements of historical fact may be forward-looking statements. The statements have been prepared by management to provide an outlook of the Corporation's activities and results and may not be appropriate for other purposes. Forward-looking statements are often, but not always, identified by the use of words such as seek, anticipate, plan, continue, estimate, guidance, demonstrate, expect, may, can, will, project, predict, potential, target, intend, could, might, should, believe, would and similar expressions and include statements relating to, among other things, the Corporation's 2019 to 2021 Development Plan (the "Plan"), the Plan's development focus and the timing thereof, the expected sources of funding for the Plan; expected results and benefits to be derived from the Plan include, but are not limited to, increasing the anticipated amount of annual average liquids production, increasing C5+/light oil production mix and the expected amount of C5+/light oil production mix, diversifying the Corporation's revenue sources including the composition of natural gas and liquids, developing additional operational and infrastructure optionality and how this will be achieved; annual production average and the expected amount by which total annual average production will be increased by in 2019 to 2021; expected net capital expenditures for 2019 to 2021, including the expected focus and allocation of such expenditures; the expected adjusted funds flow per share and per boe in each of 2019 to 2021; expected yearend total debt to adjusted funds flow ratios in each of 2019 to 2021; the expected cumulative adjusted funds flow and capital investment over the Plan's three years; resource development potential beyond the Plan and the Corporation's future drilling inventory; the benefits derived from third party processing arrangements the Corporation entered into with two midstream firms; whether the Corporation will extend its gathering pipelines from Glacier to Wembley; and other matters. Advantage s actual decisions, activities, results, performance or achievement could differ materially from those expressed in, or implied by, such forward-looking statements and accordingly, no assurances can be given that any of the events anticipated by the forward-looking statements will transpire or occur or, if any of them do, what benefits that Advantage will derive from them. With respect to the forward-looking statements contained in this presentation, Advantage has made a number of material assumptions regarding, but not limited to: current and future commodity prices; the Corporation's current and future hedging program; future exchange rates; future production and composition including natural gas and liquids; royalty regimes and future royalty rates; future operating costs; future transportation costs and availability of product transportation capacity; future general and administrative costs; the estimated well costs including frac stages and lateral lengths per well; the number of new wells required to achieve the objectives of the Plan; that the Corporation will be able to complete its infrastructure projects on a timely basis; the timing for the construction to be completed on third party mid-stream facilities; timing and amount of net capital expenditures; and that the Corporation will have sufficient financial resources required to fund its capital and operating expenditures and requirements as needed. 23
24 ADVISORY Management has included the summary of assumptions and risks related to forward-looking information in order to provide shareholders with a more complete perspective on Advantage's future operations and such information may not be appropriate for other purposes. Advantage s actual results, performance or achievement could differ materially from those expressed in, or implied by, these forward-looking statements and, accordingly, no assurance can be given that any of the events anticipated by the forward-looking statements will transpire or occur, or if any of them do so, what benefits that Advantage will derive there from. Management does not have firm commitments for all the costs, expenditures, prices or other financial assumptions used to prepare the forward-looking information or assurance that such operating results will be achieved and, accordingly, the complete financial effects of all of those costs, expenditures, prices and operating results are not objectively determinable. Readers are cautioned that the foregoing lists of factors are not exhaustive. The Corporation and management believe that the statements have been prepared on a reasonable basis, reflecting management's best estimates and judgments. However, because this information is highly subjective and subject to numerous risks including the risks discussed above, it should not be relied on as necessarily indicative of future results. These forward-looking statements are made as of the date of this presentation and Advantage disclaims any intent or obligation to update publicly any forward-looking statements, whether as a result of new information, future events or results or otherwise, other than as required by applicable securities laws. These statements involve substantial known and unknown risks and uncertainties, certain of which are beyond Advantage s control, including, but not limited to: changes in general economic, market and business conditions; industry conditions; impact of significant declines in market prices for oil and natural gas; actions by governmental or regulatory authorities including increasing taxes and changes in investment or other regulations; changes in tax laws, royalty regimes and incentive programs relating to the oil and gas industry; the effect of acquisitions; Advantage's success at acquisition, exploitation and development of reserves; failure to achieve production targets on timelines anticipated or at all; unexpected drilling results; changes in commodity prices, currency exchange rates, net capital expenditures, reserves or reserves estimates and debt service requirements; the occurrence of unexpected events involved in the exploration for, and the operation and development of, oil and gas properties, including hazards such as fire, explosion, blowouts, cratering, and spills, each of which could result in substantial damage to wells, production facilities, other property and the environment or in personal injury; changes or fluctuations in production levels; individual well productivity; lack of available capacity on pipelines; delays in anticipated timing of drilling and completion of wells; delays in completion of infrastructure; lack of available capacity on pipelines; individual well productivity; competition from other producers; the lack of availability of qualified personnel or management; credit risk; changes in laws and regulations including the adoption of new environmental laws and regulations and changes in how they are interpreted and enforced; our ability to comply with current and future environmental or other laws; stock market volatility and market valuations; liabilities inherent in oil and natural gas operations; uncertainties associated with estimating oil and natural gas reserves; competition for, among other things, capital, acquisitions of reserves, undeveloped lands and skilled personnel; incorrect assessments of the value of acquisitions; geological, technical, drilling and processing problems and other difficulties in producing petroleum reserves; ability to obtain required approvals of regulatory authorities; and ability to access sufficient capital from internal and external sources. Many of these risks and uncertainties and additional risk factors are described in the Corporation s Annual Information Form dated March 5, which is available at and Readers are also referred to risk factors described in other documents Advantage files with Canadian securities authorities. 24
25 ADVISORY Oil and Gas Information Barrels of oil equivalent ("boe") and thousand cubic feet of natural gas equivalent ("mcfe") may be misleading, particularly if used in isolation. Boe and mcfe conversion ratios have been calculated using a conversion rate of six thousand cubic feet of natural gas equivalent to one barrel of oil. A boe and mcfe conversion ratio of 6 mcf: 1 bbl is based on an energy equivalency conversion method primarily applicable at the burner tip and does not represent a value equivalency at the wellhead. Given that the value ratio based on the current price of crude oil as compared to natural gas is significantly different from the energy equivalency of 6:1, utilizing a conversion on a 6:1 basis may be misleading as an indication of value. This presentation discloses drilling inventory in the Glacier, Valhalla, Progress and Pipestone/Wembley areas in three categories: (i) proved locations; (ii) probable locations; and (iii) unbooked locations. Proved locations and probable locations are derived from Sproule Associates Limited reserves evaluation effective December 31, and account for drilling locations that have associated proved and/or probable reserves, as applicable. Unbooked locations are internal estimates based on our prospective acreage and an assumption as to the number of wells that can be drilled per section based on industry practice and internal review. Unbooked locations do not have attributed reserves or resources. Of the 1,200 to 1,400 total drilling locations identified herein, 327 are proved locations, 29 are probable locations and 844 to 1,044 are unbooked locations. Unbooked locations have been identified by management as an estimation of our multi-year drilling activities based on evaluation of applicable geologic, seismic, engineering, production and reserves information. There is no certainty that the Corporation will drill all unbooked drilling locations and if drilled there is no certainty that such locations will result in additional oil and gas reserves, resources or production. The drilling locations on which we actually drill wells will ultimately depend upon the availability of capital, regulatory approvals, seasonal restrictions, oil and natural gas prices, costs, actual drilling results, additional reservoir information that is obtained and other factors. While certain of the unbooked drilling locations have been de-risked by drilling existing wells in relative close proximity to such unbooked drilling locations, other unbooked drilling locations are farther away from existing wells where management has less information about the characteristics of the reservoir and therefore there is more uncertainty whether wells will be drilled in such locations and if drilled there is more uncertainty that such wells will result in additional oil and gas reserves, resources or production. Any references in this presentation to initial production rates or IP30 rates are useful in confirming the presence of hydrocarbons, however, such rates are not determinative of the rates at which such wells will continue production and decline thereafter. While encouraging, readers are cautioned not to place reliance on such rates in calculating the aggregate production for Advantage. Advantage has presented certain type curves and well economics for its Montney areas. The type curves presented are based on Advantage's historical production. Such type curves and well economics are useful in understanding management's assumptions of well performance in making investment decisions in relation to development drilling in the Montney area and for determining the success of the performance of development wells; however, such type curves and well economics are not necessarily determinative of the production rates and performance of existing and future wells and such type curves do not reflect the type curves used by our independent qualified reserves evaluator in estimating our reserves volumes. The type curves differ as a result of varying horizontal well length, stage count and stage spacing. The type 25
26 ADVISORY curves represent the average type curves expected. In this presentation, estimated ultimate recovery represents the estimated ultimate recovery associated with the type curves presented; however, there is no certainty that Advantage will ultimately recover such volumes from the wells it drills. In presenting such type curves, inputs and economics information and in this presentation generally, Advantage has used a number of oil and gas metrics which do not have standardized meanings and therefore may be calculated differently from the metrics presented by other oil and gas companies. Such metrics include DCE+T, "EUR", "NPV10", "payout", "rate of return" (or "ROR"), "half cycle ROR", operating netback", and "capital efficiency". EUR represents the estimated ultimate recovery of resources associated with the type curves presented. NPV 10 represents the anticipated net present value of the future net revenue discounted at a rate of 10% associated with the type curves presented. Payout means the anticipated years of production from a well required to fully pay for the DCE+T of such well. ROR means the rate of return of a well or the discount rate required to arrive at a NPV equal to zero. Half cycle ROR means the rate of return of a well or the discount rate required to arrive at a NPV equal to zero when taking into account "half cycle" costs, which include drilling, completion, equip and tie-in capital expenditures. Production estimates contained herein are expressed as anticipated average production over the calendar year. In determining anticipated production for the years ended 2019 to 2021 Advantage considered historical drilling, completion and production results for prior years and took into account the estimated impact on production of the Corporation s 2019 to 2021 expected drilling and completion activities. 26
27 ADVISORY Non-GAAP Measures The Corporation discloses several financial and performance measures that do not have any standardized meaning prescribed under International Financial Reporting Standards ("IFRS" or GAAP ). These financial and performance measures include net capital expenditures, adjusted funds flow, total debt, total debt to adjusted funds flow, and capital efficiency. Such financial and performance measures should not be considered as alternatives to, or more meaningful than measures determined in accordance with GAAP including net income, comprehensive income, cash provided by operating activities, or cash used in investing activities. Management believes that these measures provide an indication of the results generated by the Corporation s principal business activities and provide useful supplemental information for analysis of the Corporation s operating performance and liquidity. Advantage s method of calculating these measures may differ from other companies, and accordingly, they may not be comparable to similar measures used by other companies. Net capital expenditures include total capital expenditures related to property, plant and equipment and exploration and evaluation assets incurred during the period. Management considers this measure reflective of actual capital activity for the period as it excludes changes in working capital related to other periods. The Corporation considers adjusted funds flow to be a useful measure of Advantage s ability to generate cash from the production of natural gas and liquids, which may be used to settle outstanding debt and obligations, and to support future capital expenditures plans. Changes in non-cash working capital are excluded from adjusted funds flow as they may vary significantly between periods and are not considered to be indicative of the Corporation s operating performance as they are a function of the timeliness of collecting receivables or paying payables. Expenditures on decommissioning liabilities are excluded from the calculation as the amount and timing of these expenditures are unrelated to current production, highly variable and discretionary. Total debt is the total of bank indebtedness and working capital deficit. Total debt to adjusted funds flow is a ratio calculated as total debt divided by adjusted funds flow for the previous four quarters. Total debt to adjusted funds flow is considered by management to be a useful measure as it is commonly used to evaluate the leverage of a company and the ability to settle outstanding debt and obligations with cash generated from operations. Capital efficiency is calculated by dividing total capital development costs for oil and gas activities including drilling, completion, facilities, infrastructure, office and capitalized general and administrative costs (excluding abandonment and reclamation costs, exploration and evaluation costs, and acquisition and disposition related costs and proceeds) by the average production additions of the applicable year to replace base production declines and deliver production growth targets, expressed in $/boe/d. Capital efficiency is considered by management to be a useful performance measure as a common metric used to evaluate the efficiency with which capital activity is allocated to achieve production additions. Refer to the Corporation s most recent Management s Discussion and Analysis, which is available at and for additional information about certain financial measures, including reconciliations to the nearest GAAP measures, as applicable. 27
28 ADVISORY Abbreviations The following abbreviations used in this presentation have the meanings set forth below. bbl barrel bbl/d bbls/d bbls/mmcf boe boe/d GJ mcf Mcfe mmcf/d mmcfe/d NGL DCE+T barrel per day barrels per day Barrels per million cubic feet barrels of oil equivalent of natural gas, on the basis of one barrel of oil or natural gas liquids for six thousand cubic feet of natural gas barrels of oil equivalent per day Gigajoule thousand cubic feet thousand cubic feet equivalent on the basis of six thousand cubic feet of natural gas for one barrel of oil or natural gas liquids million cubic feet per day million cubic feet equivalent per day natural gas liquids C3+ propane plus C5+ pentanes plus drill, complete, equip and tie-in 28

29 ADVANTAGE CONTACT INFORMATION Investor Relations Listed on TSX: AAV Advantage Oil & Gas Ltd. Suite 300, 440 2nd Avenue SW Calgary, Alberta T2P 5E9 Advantage 100% W.I. Glacier Gas Plant Main: Facsimile: Andy Mah, P.Eng. Mike Belenkie, P.Eng. Craig Blackwood, C.A. Director, President & Chief Executive Officer Chief Operating Officer VP Finance & Chief Financial Officer
Record Q Production & Three Year Plan to Accelerate Pipestone Condensate Development
 Record Q3 2018 Production & Three Year Plan to Accelerate Pipestone Condensate Development Investor Presentation TSX: AAV December 2018 ADVANTAGE AT A GLANCE TSX 52 week trading range $1.82 $5.73 Shares
Accelerating Condensate Development in the Heart of the Montney While Retaining Capital Flexibility
 Accelerating Condensate Development in the Heart of the Montney While Retaining Capital Flexibility Investor Presentation TSX: AAV April 2019 ADVANTAGE AT A GLANCE TSX 52-week trading range $1.80 - $4.80
Q First Quarter Report
 Q1 2017 First Quarter Report Financial and Operating Highlights 2017 2016 Financial ($000, except as otherwise indicated) Sales including realized hedging $ 72,957 $ 41,625 Funds from operations $ 53,972
Glacier Montney Outperformance Improves Capital Efficiencies, Enables Lower Capital and Maintains Future Production Growth. Highly Efficient 2014
 Glacier Montney Outperformance Improves Capital Efficiencies, Enables Lower Capital and Maintains Future Production Growth. Highly Efficient 2014 Reserve Additions Reaffirms High Quality Glacier Asset.
Advantage Production Reaches 183 mmcfe/d Target During Commissioning of Expanded Glacier Plant in July Excess Standing Well Productivity &
 Advantage Production Reaches 183 mmcfe/d Target During Commissioning of Expanded Glacier Plant in July 2015. Excess Standing Well Productivity & Spare Plant Capacity Sets the Foundation for Low Risk Development
Low Risk Glacier Montney Development, Strong Balance Sheet & Hedging Program Supports Profitable & Sustainable Growth
 Low Risk Glacier Montney Development, Strong Balance Sheet & Hedging Program Supports Profitable & Sustainable Growth Investor Presentation TSX / NYSE: AAV September 2015 ADVANTAGE: AT A GLANCE Canadian
2016 Budget Targets 39% Production Growth, $0.75/mcf Total Cash Costs and 1.6x Debt to Cash AECO Cdn $2.50/mcf
 2016 Budget Targets 39% Production Growth, $0.75/mcf Total Cash Costs and 1.6x Debt to Cash Flow @ AECO Cdn $2.50/mcf Investor Presentation TSX / NYSE: AAV December 2015 ADVANTAGE AT A GLANCE TSX, NYSE:
Disposition of Non-Core Assets
 Press Release Page 1 of 5 Advantage Oil & Gas Ltd Advantage Announces Disposition of Non-core Assets, Glacier Montney Update, Appointment of Financial Advisors and Natural Gas Hedging for 2013 (TSX: AAV,
OUR MONTNEY JOURNEY HAS BEEN SERVED WELL BY OUR GUIDING PRINCIPLES SINCE 2008
 Annual General Meeting May 26, 2016 OUR MONTNEY JOURNEY HAS BEEN SERVED WELL BY OUR GUIDING PRINCIPLES SINCE 2008 Develop Glacier in a Sustainable manner Maintain a Strong Balance Sheet
Record Low Reserve Addition Costs of PDP $0.84/Mcfe in 2016 Tops Off A Stellar Year of Operating & Financial Results. Development Plan Growth to 316
 Record Low Reserve Addition Costs of PDP $0.84/Mcfe in 2016 Tops Off A Stellar Year of Operating & Financial Results. Development Plan Growth to 316 mmcfe/d (52,670 boe/d) Underway" Investor Presentation
2018 Cash Flow Funded Capital Budget Increases Focus on Liquids Development & Growth Driven by Strong Well Results
 2018 Cash Flow Funded Capital Budget Increases Focus on Liquids Development & Growth Driven by Strong Well Results Investor Presentation TSX / NYSE: AAV January 2018 ADVANTAGE AT A GLANCE TSX 52-week trading
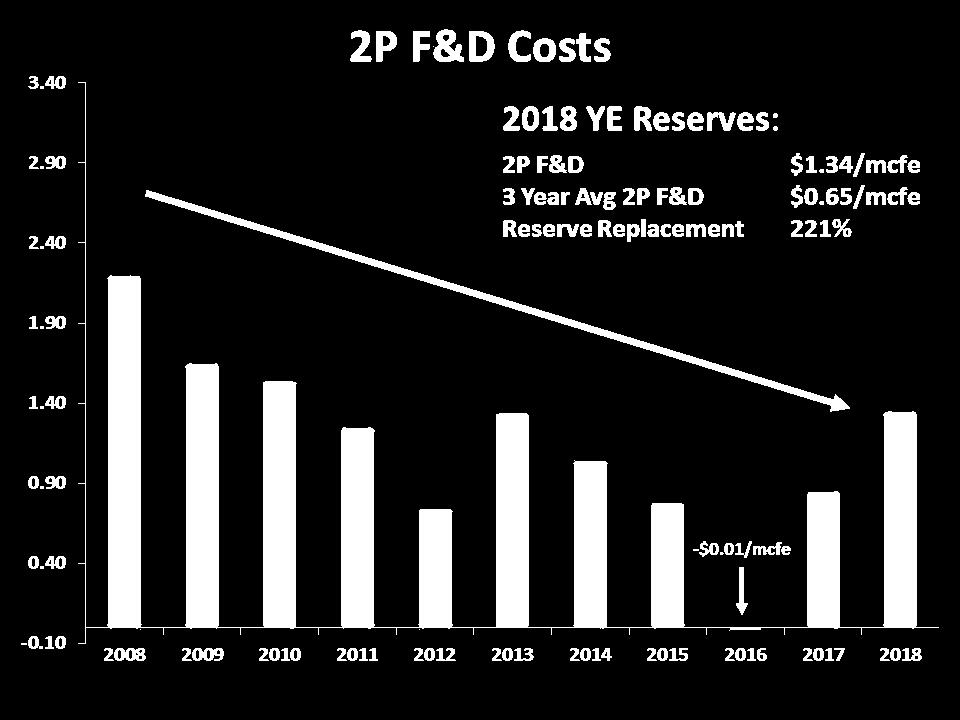
Low Cost 2017 Reserve Additions Replaced 433% of Production at a 2P F&D Cost of $0.84/mcfe ($5.04/boe) with a 35% Increase in Liquids Reserves
 with a 35% Increase in Liquids Reserves") Low Cost 2017 Reserve Additions Replaced 433% of Production at a 2P F&D Cost of $0.84/mcfe ($5.04/boe) with a 35% Increase in Liquids Reserves Investor Presentation TSX / NYSE: AAV February 2018 ADVANTAGE
Low Cost 2017 Reserve Additions Replaced 433% of Production at a 2P F&D Cost of $0.84/mcfe ($5.04/boe) with a 35% Increase in Liquids Reserves Investor Presentation TSX / NYSE: AAV February 2018 ADVANTAGE
to announce Operating Results March 22, 2011 boe/d. $38.5 million to funds from cash flow for $45.1 million the increasing optimization of our other
 Press Release Advantage Oil & Gas Ltd Page 1 of 6 News Release Advantage Announces 2010 Year End Financial Results Glacier Production Exceeding 100 mmcf/d March 22, 2011 (TSX: AAV, NYSE: AAV) CALGARY,
Strong Production Growth, Top Quartile Well Results and Lowest Corporate Cash Costs in the Montney Underpins Glacier Plant Expansion Plans to 350
 Strong Production Growth, Top Quartile Well Results and Lowest Corporate Cash Costs in the Montney Underpins Glacier Plant Expansion Plans to 350 MMcf/d (58,330 Boe/d) Investor Presentation TSX / NYSE:
Solid Cash Flow with Increased Production and Lower Costs Maintains Balance Sheet at 1.0x D/CF at End of Q H Investment Will Set the
 Solid Cash Flow with Increased Production and Lower Costs Maintains Balance Sheet at 1.0x D/CF at End of Q3 2017. H2 2017 Investment Will Set the Stage for 2018 and Beyond Investor Presentation TSX / NYSE:
Q First Quarter Report
 Q1 2018 First Quarter Report Financial and Operating Highlights 2018 2017 Financial ($000, except as otherwise indicated) Sales including realized hedging $ 73,378 $ 72,957 Net income and comprehensive
Well Results at Valhalla, Wembley and Progress Confirm A Significant & Growing Liquids Rich Drill Inventory. First Wembley Well with Liquids Yield up
 Well Results at Valhalla, Wembley and Progress Confirm A Significant & Growing Liquids Rich Drill Inventory. First Wembley Well with Liquids Yield up to 277 bbls/mmcf & Condensate Yields up to 211 bbls/mmcf
42% Production Growth to 238 mmcfe/d (39,635 boe/d) and a 79% Increase in Cash Flow to $54 Million Fully Funded our Q Capital Program.
 and a 79% Increase in Cash Flow to $54 Million Fully Funded our Q Capital Program.") 42% Production Growth to 238 mmcfe/d (39,635 boe/d) and a 79% Increase in Cash Flow to $54 Million Fully Funded our Q1 2017 Capital Program. 39% Increase in Undeveloped Montney Land Adds to Long Term Development
42% Production Growth to 238 mmcfe/d (39,635 boe/d) and a 79% Increase in Cash Flow to $54 Million Fully Funded our Q1 2017 Capital Program. 39% Increase in Undeveloped Montney Land Adds to Long Term Development
Lowering Natural Gas Production & Increasing Liquids Rich Drilling. Liquids Production Could Reach 13% or More of Total Production in 2020
 Lowering Natural Gas Production & Increasing Liquids Rich Drilling. Liquids Production Could Reach 13% or More of Total Production in 2020 Investor Presentation TSX / NYSE: AAV May 2018 ADVANTAGE AT A
Q Second Quarter Report
 Q2 2018 Second Quarter Report Financial and Operating Highlights 2018 2017 2018 2017 Financial ($000, except as otherwise indicated) Sales including realized hedging (3) $ 45,319 $ 69,169 $ 118,697 $ 142,126
PETRUS RESOURCES ANNOUNCES FOURTH QUARTER AND YEAR END 2017 FINANCIAL & OPERATING RESULTS AND YEAR END RESERVE INFORMATION
 PETRUS RESOURCES ANNOUNCES FOURTH QUARTER AND YEAR END 2017 FINANCIAL & OPERATING RESULTS AND YEAR END RESERVE INFORMATION CALGARY, ALBERTA, Thursday, March 8 th, 2018 Petrus Resources Ltd. ( Petrus or
Advantage Announces 2011 Year End Financial Results and Provides Interim Guidance
 Press Release Page 1 of 10 Advantage Oil & Gas Ltd Advantage Announces 2011 Year End Financial Results and Provides Interim Guidance (TSX: AAV, NYSE: AAV) CALGARY, ALBERTA, March 22, 2012 ( Advantage or
Investor Presentation TSX, NYSE: AAV July, Page 1
 Pure Play Montney Producer with a proven operating team, industry leading cost structure & clear visibility to a significant drilling inventory creates a solid foundation for multi-year growth Investor
Lowering Natural Gas Production & Increasing Liquids-Rich Development. Liquids Production Could Reach 13% or More of Total Production in 2020
 Lowering Natural Gas Production & Increasing Liquids-Rich Development. Liquids Production Could Reach 13% or More of Total Production in 2020 Investor Presentation TSX / NYSE: AAV August 2018 ADVANTAGE
Production Growth, Record Low Cash Costs of $0.75/mcfe & Top Quartile Well Results Underpins Glacier Plant Expansion Plans to 350 MMcf/d (58,330
 Production Growth, Record Low Cash Costs of $0.75/mcfe & Top Quartile Well Results Underpins Glacier Plant Expansion Plans to 350 MMcf/d (58,330 Boe/d) Investor Presentation TSX / NYSE: AAV June 2016 ADVANTAGE
Annual Production Budget
 Strong Glacier Operating Results Generate Surplus Cash & Strengthens Balance Sheet to 0.7x D/CF as of June 30, 2017. Delineation Drilling Commenced on Undeveloped Montney Lands" Enercom Presentation Denver,
2011 Annual Report. Non-Consolidated Financial and Operating Highlights (1) Year ended December 31, Three months ended December 31, 2010
 Year ended December 31, Three months ended December 31, 2010") 2011 Annual Report Non-Consolidated Financial and Operating Highlights (1) Three months ended December 31, 2011 Three months ended December 31, 2010 December 31, 2011 December 31, 2010 Financial ($000,
2011 Annual Report Non-Consolidated Financial and Operating Highlights (1) Three months ended December 31, 2011 Three months ended December 31, 2010 December 31, 2011 December 31, 2010 Financial ($000,
BUILT TO LAST. April 2016
 BUILT TO LAST April 2016 Built to Last Low Debt Low Decline Strong Capital Efficiencies 2 Cardinal Energy Profile Shares Outstanding (1) TSX: CJ Basic 65,124,209 ergy Ltd. Fully Diluted 67,595,248 Annual
RMP Energy Reports Second Quarter 2017 Results and Provides Initial Elmworth Production Information
 RMP Energy Reports Second Quarter 2017 Results and Provides Initial Elmworth Production Information CALGARY, Alberta, Aug. 14, 2017 (GLOBE NEWSWIRE) -- RMP Energy Inc. ( RMP or the Company ) (TSX:RMP)
DELPHI ENERGY ANNOUNCES CLOSING OF DISPOSITION OF WAPITI ASSETS
 DELPHI ENERGY ANNOUNCES CLOSING OF DISPOSITION OF WAPITI ASSETS CALGARY, ALBERTA July 22, 2015 Delphi Energy Corp. ( Delphi or the Company ) is pleased to report that it has closed the previously announced
CURRENT HEADLINES PAINT AN OVERLY NEGATIVE PICTURE FOR CANADIAN PRODUCERS
 Annual General Meeting May 25, 2017 CURRENT HEADLINES PAINT AN OVERLY NEGATIVE PICTURE FOR CANADIAN PRODUCERS 2 CREATING UNCERTAINTY, FEAR AND NOISE Sky is Falling Opportunity or Not 3 BUT DON T FORGET
Strengthened Balance Sheet with Industry leading Total Cash Costs of $0.77 per mcfe, capital efficiencies and strong hedging positions Advantage for
 Strengthened Balance Sheet with Industry leading Total Cash Costs of $0.77 per mcfe, capital efficiencies and strong hedging positions Advantage for continual organic growth. Investor Presentation TSX
Q Third Quarter Report
 Q3 2018 Third Quarter Report Financial and Operating Highlights 2018 2017 2018 2017 Financial ($000, except as otherwise indicated) Sales including realized hedging (3) $ 57,928 $ 51,706 $ 176,625 $ 193,832
indicated) per share ( per boe , , ,487 41, , , ,390 80,
 per share ( per boe , , ,487 41, , , ,390 80,") 2010 Annual Report Financial ($000, except as otherwise indicated) Revenue before royalties (1) (2) per share ( per boe Funds from operations (2) per share ( per boe Net income (loss) (2) per share ( Expenditures
2010 Annual Report Financial ($000, except as otherwise indicated) Revenue before royalties (1) (2) per share ( per boe Funds from operations (2) per share ( per boe Net income (loss) (2) per share ( Expenditures
CHINOOK ENERGY INC. ANNOUNCES FOURTH QUARTER 2016 RESULTS AND PROVIDES OPERATIONAL UPDATE
 CHINOOK ENERGY INC. ANNOUNCES FOURTH QUARTER 2016 RESULTS AND PROVIDES OPERATIONAL UPDATE CALGARY, ALBERTA March 23, 2017 Chinook Energy Inc. ("our", "we", or "us") (TSX: CKE) is pleased to announce its
DELPHI ENERGY RELEASES YEAR END 2015 RESERVES
 DELPHI ENERGY RELEASES YEAR END 2015 RESERVES CALGARY, ALBERTA February 29, 2016 Delphi Energy Corp. ( Delphi or the Company ) is pleased to report its crude oil and natural gas reserves information for
A PROUD CANADIAN CLEAN ENERGY PRODUCER FOCUSED ON DEVELOPMENT OF ITS SIGNIFICANT MONTNEY NATURAL GAS AND LIQUIDS RESOURCE
 A PROUD CANADIAN CLEAN ENERGY PRODUCER FOCUSED ON DEVELOPMENT OF ITS SIGNIFICANT MONTNEY NATURAL GAS AND LIQUIDS RESOURCE Annual General Meeting May 29, 2018 CANADIAN E&P COMPANIES CHALLENGING TIMES BUT
2017 Annual Report. Financial and Operating Highlights
 2017 Annual Report Financial and Operating Highlights Three months ended 2017 2016 2017 2016 Financial ($000, except as otherwise indicated) Sales including realized hedging $ 65,779 $ 71,090 $ 259,611
CONSOLIDATED MANAGEMENT S DISCUSSION & ANALYSIS The following Management s Discussion and Analysis ( MD&A ), dated as of March 25, 2015, provides a
, dated as of March 25, 2015, provides a") CONSOLIDATED MANAGEMENT S DISCUSSION & ANALYSIS The following Management s Discussion and Analysis ( MD&A ), dated as of March 25, 2015, provides a detailed explanation of the consolidated financial and
CONSOLIDATED MANAGEMENT S DISCUSSION & ANALYSIS The following Management s Discussion and Analysis ( MD&A ), dated as of March 25, 2015, provides a detailed explanation of the consolidated financial and
September 28, 2018 SEPTEMBER PRESENTATION
 September 28, 2018 SEPTEMBER PRESENTATION BIGSTONE PROLIFIC, LIQUIDS RICH MONTNEY Pure play MONTNEY E&P company with WORLD CLASS ASSETS: Successful delineation drilling to the west and south Growing condensate
BELLATRIX EXPLORATION LTD. ANNOUNCES FOURTH QUARTER 2018 AND YEAR END FINANCIAL AND OPERATING RESULTS
 For Immediate Release TSX: BXE BELLATRIX EXPLORATION LTD. ANNOUNCES FOURTH QUARTER 2018 AND YEAR END FINANCIAL AND OPERATING RESULTS CALGARY, ALBERTA (March 14, 2019) - Bellatrix Exploration Ltd. ( Bellatrix,
PETRUS RESOURCES ANNOUNCES SECOND QUARTER 2018 FINANCIAL & OPERATING RESULTS
 PETRUS RESOURCES ANNOUNCES SECOND QUARTER 2018 FINANCIAL & OPERATING RESULTS CALGARY, ALBERTA, Thursday, August 9 th, 2018 Petrus Resources Ltd. ( Petrus or the Company ) is pleased to report financial
Yangarra Announces Second Quarter 2018 Financial and Operating Results
 Suite 1530, 715 5 Avenue S.W. Calgary, Alberta T2P 2X6 Phone: (403) 262-9558 Fax: (403) 262-8281 Webpage: www.yangarra.ca Email: info@yangarra.ca August 8, Yangarra Announces Second Quarter Financial and
CEQUENCE ENERGY ANNOUNCES OPERATIONAL UPDATE AND 2014 RESERVES AND FINANCIAL AND OPERATING RESULTS
 CEQUENCE ENERGY ANNOUNCES OPERATIONAL UPDATE AND 2014 RESERVES AND FINANCIAL AND OPERATING RESULTS CALGARY, March 5, 2015 Cequence Energy Ltd. ("Cequence" or the "Company") (TSX: CQE) is pleased to announce
May 2018 HIGH-MARGIN, LIQUIDS-RICH PRODUCTION IN THE WORLD- CLASS MONTNEY BIGSTONE REGION
 May 2018 HIGH-MARGIN, LIQUIDS-RICH PRODUCTION IN THE WORLD- CLASS MONTNEY BIGSTONE REGION WHY OWN DELPHI. Pure play MONTNEY E&P company with WORLD CLASS ASSETS: Robust well economics driven by: High condensate
CEQUENCE ENERGY LTD. ANNOUNCES OVER 36 % GROWTH IN RESERVES AND RESERVE VALUE AND FOURTH QUARTER AND YEAR END 2011 RESULTS
 CEQUENCE ENERGY LTD. ANNOUNCES OVER 36 % GROWTH IN RESERVES AND RESERVE VALUE AND FOURTH QUARTER AND YEAR END 2011 RESULTS CALGARY, March 8, 2012 Cequence Energy Ltd. ("Cequence" or the "Company") (TSX:
SPARTAN ENERGY CORP. ANNOUNCES STRATEGIC SOUTHEAST SASKATCHEWAN LIGHT OIL ACQUISITION
 Suite 500, 850 2 nd Street SW Calgary, AB T2P 0R8 Canada Ph.: (403) 355-8920 Fax: (403) 355-2779 SPARTAN ENERGY CORP. ANNOUNCES STRATEGIC SOUTHEAST SASKATCHEWAN LIGHT OIL ACQUISITION CALGARY, ALBERTA (May
CRESCENT POINT ANNOUNCES STRATEGIC CONSOLIDATION ACQUISITION OF CORAL HILL ENERGY LTD. AND UPWARDLY REVISED 2015 GUIDANCE
 PRESS RELEASE CRESCENT POINT ANNOUNCES STRATEGIC CONSOLIDATION ACQUISITION OF CORAL HILL ENERGY LTD. AND UPWARDLY REVISED 2015 GUIDANCE July 2, 2015 CALGARY, ALBERTA. Crescent Point Energy Corp. ( Crescent
DELPHI ENERGY CORP. REPORTS 2018 YEAR END RESERVES
 DELPHI ENERGY CORP. REPORTS 2018 YEAR END RESERVES CALGARY, ALBERTA March 4, 2019 Delphi Energy Corp. ( Delphi or the Company ) is pleased to announce its crude oil and natural gas reserves information
DELPHI ENERGY CORP. REPORTS 2018 YEAR END RESULTS
 DELPHI ENERGY CORP. REPORTS 2018 YEAR END RESULTS CALGARY, ALBERTA March 13, 2019 Delphi Energy Corp. ( Delphi or the Company ) is pleased to announce its financial and operational results for the year
April 2018 HIGH-MARGIN, LIQUIDS-RICH PRODUCTION IN THE WORLD- CLASS MONTNEY BIGSTONE REGION
 April 2018 HIGH-MARGIN, LIQUIDS-RICH PRODUCTION IN THE WORLD- CLASS MONTNEY BIGSTONE REGION WHY OWN DELPHI. Pure play MONTNEY E&P company with WORLD CLASS ASSETS: Robust well economics driven by: High
RMP Energy Provides Second Quarter 2012 Financial and Operating Results
 NEWS RELEASE August 9, 2012 RMP Energy Provides Second Quarter 2012 Financial and Operating Results Calgary, Alberta RMP Energy Inc. ( RMP or the Company ) (TSX:RMP) today provided its financial and operating
PETRUS RESOURCES ANNOUNCES THIRD QUARTER 2018 FINANCIAL & OPERATING RESULTS
 PETRUS RESOURCES ANNOUNCES THIRD QUARTER 2018 FINANCIAL & OPERATING RESULTS CALGARY, ALBERTA, Thursday, November 8 th, 2018 Petrus Resources Ltd. ( Petrus or the Company ) is pleased to report financial
CEQUENCE ENERGY ANNOUNCES OPERATIONAL UPDATE, 2016 FINANCIAL AND OPERATING RESULTS AND RESERVES
 CEQUENCE ENERGY ANNOUNCES OPERATIONAL UPDATE, 2016 FINANCIAL AND OPERATING RESULTS AND RESERVES CALGARY, March 13, 2017 Cequence Energy Ltd. ("Cequence" or the "Company") (TSX: CQE) is pleased to provide
INPLAY OIL CORP. ANNOUNCES 2016 YEAR END RESERVES AND AN OPERATIONS UPDATE
 March 14, 2017 INPLAY OIL CORP. ANNOUNCES 2016 YEAR END RESERVES AND AN OPERATIONS UPDATE CALGARY, ALBERTA (March 14, 2017) InPlay Oil Corp. ("InPlay" or the "Company") (TSX:IPO) is pleased to present
2018 Annual Report. Financial and Operating Highlights. Financial Highlights
 2018 Annual Report Financial and Operating Highlights Three months ended Year ended Financial Highlights ($000, except as otherwise indicated) 2018 2017 2018 2017 Financial Statement Highlights Sales including
FIRST QUARTER REPORT HIGHLIGHTS
 FIRST QUARTER REPORT For the three months ended March 31, 2018 Petrus Resources Ltd. ( Petrus or the Company ) (TSX: PRQ) is pleased to report financial and operating results for the first quarter of 2018.
Corporate Presentation. August 2016
 Corporate Presentation August 2016 Future Oriented Information (See additional advisories at the end of this document) In the interest of providing information regarding Paramount Resources Ltd. ("Paramount"
KELT REPORTS SIGNIFICANT INCREASES IN RESERVES AND PRODUCTION IN 2014
 PRESS RELEASE (Stock Symbol KEL TSX) February 10, 2015 Calgary, Alberta KELT REPORTS SIGNIFICANT INCREASES IN RESERVES AND PRODUCTION IN 2014 Kelt Exploration Ltd. ( Kelt or the Company ) has released
SURVIVE TO THRIVE 2016 CAPP SCOTIABANK INVESTMENT SYMPOSIUM
 SURVIVE TO THRIVE 2016 CAPP SCOTIABANK INVESTMENT SYMPOSIUM April 12, 2016 1 CORPORATE PROFILE Corporate Summary Q4/2015 Avg. Daily Production 67,934 boe/d Production Mix 1 ~60% liquids/40% gas Corporate
For Immediate Release Granite Oil Corp. Announces 2017 Record Year End Reserve Metrics and Operational Update
 For Immediate Release Granite Oil Corp. Announces 2017 Record Year End Reserve Metrics and Operational Update CALGARY, ALBERTA (Marketwired March 7, 2018) GRANITE OIL CORP. ( Granite or the Company ) (TSX:GXO)(OTCQX:GXOCF)
NEWS RELEASE. March 21, 2017
 NEWS RELEASE March 21, 2017 RMP Energy Provides Operations Update Highlighting Elmworth Delineation Success, Updates Market Guidance and Reports Year-End Reserves and Fiscal 2016 Financial Results Calgary,
CEQUENCE ENERGY ANNOUNCES SECOND QUARTER FINANCIAL AND OPERATING RESULTS
 CEQUENCE ENERGY ANNOUNCES SECOND QUARTER FINANCIAL AND OPERATING RESULTS CALGARY, August 10, 2017 Cequence Energy Ltd. ("Cequence" or the "Company") (TSX: CQE) is pleased to announce its operating and
CHINOOK ENERGY INC. ANNOUNCES SECOND QUARTER 2017 RESULTS
 CHINOOK ENERGY INC. ANNOUNCES SECOND QUARTER 2017 RESULTS CALGARY, ALBERTA August 10, 2017 Chinook Energy Inc. ("our", "we", or "us") (TSX: CKE) is pleased to announce its second quarter 2017 financial
CEQUENCE ENERGY ANNOUNCES 35% GROWTH IN RESERVES AND 2012 FINANCIAL AND OPERATING RESULTS
 CEQUENCE ENERGY ANNOUNCES 35% GROWTH IN RESERVES AND 2012 FINANCIAL AND OPERATING RESULTS CALGARY, March 7, 2013 Cequence Energy Ltd. ("Cequence" or the "Company") (TSX: "CQE") is pleased to announce its
CANADIAN NATURAL RESOURCES LIMITED ANNOUNCES 2016 YEAR END RESERVES CALGARY, ALBERTA FEBRUARY 14, 2017 FOR IMMEDIATE RELEASE
 CANADIAN NATURAL RESOURCES LIMITED ANNOUNCES 2016 YEAR END RESERVES CALGARY, ALBERTA FEBRUARY 14, 2017 FOR IMMEDIATE RELEASE Canadian Natural Resources Limited ( Canadian Natural or the Company ) is pleased
Annual and Special Shareholder Meeting May 17, 2018
 Annual and Special Shareholder Meeting May 17, 2018 2017 in Review Mandate: Increase light oil exposure Increase netbacks Reduce operating Costs Maintain dividend 2 Grande Prairie Acquisition (March 2017)
Premium Pipestone Asset Acquisition. August 9, 2018
 Premium Pipestone Asset Acquisition August 9, 2018 READER ADVISORY GENERAL A final short form prospectus containing important information relating to the offering (the "Offering") of subscription receipts
January 2018 HIGH-MARGIN, LIQUIDS-RICH PRODUCTION IN THE WORLD- CLASS MONTNEY BIGSTONE REGION
 January 2018 HIGH-MARGIN, LIQUIDS-RICH PRODUCTION IN THE WORLD- CLASS MONTNEY BIGSTONE REGION WHY OWN DELPHI. Pure play MONTNEY E&P company with WORLD CLASS ASSETS: Robust well economics driven by: High
DELPHI ENERGY CORP. REPORTS 2017 YEAR END RESULTS AND RESERVES AND PROVIDES OPERATIONS UPDATE
 DELPHI ENERGY CORP. REPORTS 2017 YEAR END RESULTS AND RESERVES AND PROVIDES OPERATIONS UPDATE CALGARY, ALBERTA March 7, 2018 Delphi Energy Corp. ( Delphi or the Company ) is pleased to announce its financial
Corporate Presentation. March 2018
 Corporate Presentation March 218 Advisory Regarding Forward-Looking Information and Statements This presentation contains forward-looking statements and forward-looking information within the meaning of
SUSTAINABLE DIVIDEND & GROWTH September 2018
 SUSTAINABLE DIVIDEND & GROWTH September 2018 Cardinal Profile Shares Outstanding TSX: CJ Basic (1) Diluted (excluding debentures) 114.2 MM 117.9 MM 2018 Annual Dividend ($/share) $0.42 2018 Average Production
Freehold Royalties Ltd. Announces 2017 Results, Increases Dividend and Unveils 2018 Guidance
 NEWS RELEASE TSX: FRU Freehold Royalties Ltd. Announces 2017 Results, Increases Dividend and Unveils 2018 Guidance CALGARY, ALBERTA, (GLOBE NEWSWIRE March 8, 2018) Freehold Royalties Ltd. (Freehold) (TSX:FRU)
Corporate Presentation. January 2017
 Corporate Presentation January 2017 Future Oriented Information (See additional advisories at the end of this document) In the interest of providing information regarding Paramount Resources Ltd. ("Paramount"
NEWS RELEASE NOVEMBER 7, 2018
 NEWS RELEASE NOVEMBER 7, 2018 TOURMALINE DELIVERS STRONG Q3 EARNINGS AND CASH FLOW GROWTH, INCREASES 2018 EXIT AND 2019 PRODUCTION ESTIMATES AND REDUCES 2019 CAPITAL PROGRAM Calgary, Alberta - Tourmaline
POSITIONED FOR SUCCESS
 POSITIONED FOR SUCCESS CORPORATE PRESENTATION November 2018 TSX: BNE 1 Forward Looking Information Certain statements contained in this Presentation include statements which contain words such as anticipate,
CEQUENCE ENERGY ANNOUNCES 2015 FINANCIAL AND OPERATING RESULTS
 CEQUENCE ENERGY ANNOUNCES 2015 FINANCIAL AND OPERATING RESULTS CALGARY, March 29, 2015 Cequence Energy Ltd. ("Cequence" or the "Company") (TSX: CQE) is pleased to announce its operating and financial results
CEQUENCE ENERGY ANNOUNCES 2015 INDEPENDENT RESERVES EVALUATION
 CEQUENCE ENERGY ANNOUNCES 2015 INDEPENDENT RESERVES EVALUATION CALGARY, February 22, 2016 Cequence Energy Ltd. ("Cequence" or the "Company") (TSX: CQE) is pleased to announce the results of its year end
18-10 November 14, 2018
 18-10 November 14, 2018 BIRCHCLIFF ENERGY LTD. ANNOUNCES STRONG THIRD QUARTER 2018 RESULTS, STRATEGIC MONTNEY LAND ACQUISITION IN POUCE COUPE AND PRELIMINARY 2019 PLANS Calgary, Alberta Birchcliff Energy
Athabasca Oil Corporation Announces 2018 Year end Results
 FOR IMMEDIATE RELEASE March 6, 2019 Athabasca Oil Corporation Announces 2018 Year end Results CALGARY Athabasca Oil Corporation (TSX: ATH) ( Athabasca or the Company ) is pleased to provide its 2018 year
BAYTEX ANNOUNCES 2019 BUDGET
 BAYTEX ANNOUNCES 2019 BUDGET CALGARY, ALBERTA (December 17, 2018) - Baytex Energy Corp. ( Baytex ) (TSX, NYSE: BTE) announces that its Board of Directors has approved a 2019 capital budget of $550 to $650
BELLATRIX ANNOUNCES 2018 YEAR END RESERVES HIGHLIGHTED BY 13% RESERVE GROWTH AND LOW COST RESERVE ADDITIONS
 For Immediate Release Calgary, Alberta TSX: BXE BELLATRIX ANNOUNCES 2018 YEAR END RESERVES HIGHLIGHTED BY 13% RESERVE GROWTH AND LOW COST RESERVE ADDITIONS CALGARY, ALBERTA (March 14, 2019) Bellatrix Exploration
Obsidian Energy. Peters & Co. Annual Energy Conference. January 2018
 Obsidian Energy Peters & Co. Annual Energy Conference January 2018 Important Notices to the Readers This presentation should be read in conjunction with the Company's audited consolidated financial statements,
Predictable & Sustainable Per Share Growth
 Predictable & Sustainable Per Share Growth January 23, 2018 T V E : T S X www.tamarackvalley.ca 1 Disclaimers Forward Looking Statements Certain information included in this presentation constitutes forward-looking
CRESCENT POINT ANNOUNCES SASKATCHEWAN VIKING CONSOLIDATION ACQUISITION AND UPWARDLY REVISED GUIDANCE FOR 2014
 PRESS RELEASE CRESCENT POINT ANNOUNCES SASKATCHEWAN VIKING CONSOLIDATION ACQUISITION AND UPWARDLY REVISED GUIDANCE FOR 2014 June 12, 2014 CALGARY, ALBERTA. Crescent Point Energy Corp. ( Crescent Point
SUSTAINABLE DIVIDEND & GROWTH May 2018
 SUSTAINABLE DIVIDEND & GROWTH May 2018 Cardinal Profile Shares Outstanding TSX: CJ Basic (1) Fully Diluted (excluding debentures) 110.8 MM 114.0 MM 2018 Annual Dividend ($/share) $0.42 2018 Average Production
InPlay Oil Corp. Announces First Quarter 2018 Financial and Operating Results Highlighted by a 24 % Increase in Light Oil Production
 InPlay Oil Corp. Announces First Quarter 2018 Financial and Operating Results Highlighted by a 24 % Increase in Light Oil Production May 10, 2018 - Calgary Alberta InPlay Oil Corp. (TSX: IPO) (OTCQX: IPOOF)
Corporate Presentation. April, 2017
 Corporate Presentation April, 2017 Future Oriented Information (See additional advisories at the end of this document) In the interest of providing information regarding Paramount Resources Ltd. ("Paramount"
Obsidian Energy. Corporate Presentation. January 2018
 Obsidian Energy Corporate Presentation January 2018 Important Notices to the Readers This presentation should be read in conjunction with the Company's audited consolidated financial statements, management's
CEQUENCE ENERGY ANNOUNCES SECOND QUARTER 2018 FINANCIAL RESULTS
 CEQUENCE ENERGY ANNOUNCES SECOND QUARTER 2018 FINANCIAL RESULTS CALGARY, August 10, 2018 Cequence Energy Ltd. ("Cequence" or the "Company") (TSX: CQE) is pleased to announce its operating and financial
Corporate Presentation. March 2017
 Corporate Presentation March 2017 Future Oriented Information (See additional advisories at the end of this document) In the interest of providing information regarding Paramount Resources Ltd. ("Paramount"
NOT FOR DISTRIBUTION TO U.S. NEWS WIRE SERVICES OR FOR DISSEMINATION IN THE U.S.
 NEWS RELEASE June 25, 2014 200, 707 7 Avenue SW Calgary, Alberta T2P 3H6 Telephone: (403) 262-1901 Facsimile (403) 262-1905 TSXV Trading Symbol: MVN OTC Trading Symbol: MDLNF NOT FOR DISTRIBUTION TO U.S.
Corporate Presentation. May 2016
 Corporate Presentation May 2016 Future Oriented Information (See additional advisories at the end of this document) In the interest of providing information regarding Paramount Resources Ltd. ("Paramount"
FINANCIAL AND OPERATING HIGHLIGHTS (THREE MONTHS ENDED MARCH 31, 2018)
") FOR IMMEDIATE RELEASE: May 14, 2018 TSX SYMBOLS: ZAR; ZAR.DB.A ZARGON OIL & GAS LTD. PROVIDES 2018 FIRST QUARTER RESULTS AND PROVIDES SECOND HALF 2018 GUIDANCE CALGARY, ALBERTA Zargon Oil & Gas Ltd. (
FOR IMMEDIATE RELEASE: May 14, 2018 TSX SYMBOLS: ZAR; ZAR.DB.A ZARGON OIL & GAS LTD. PROVIDES 2018 FIRST QUARTER RESULTS AND PROVIDES SECOND HALF 2018 GUIDANCE CALGARY, ALBERTA Zargon Oil & Gas Ltd. (
BAYTEX ANNOUNCES CLOSING OF STRATEGIC COMBINATION WITH RAGING RIVER, UPDATED 2018 GUIDANCE AND CONFIRMATION OF PRELIMINARY 2019 PLANS
 BAYTEX ANNOUNCES CLOSING OF STRATEGIC COMBINATION WITH RAGING RIVER, UPDATED 2018 GUIDANCE AND CONFIRMATION OF PRELIMINARY 2019 PLANS CALGARY, ALBERTA (August 22, 2018) Baytex Energy Corp. ( Baytex )(TSX,
NEWS RELEASE FEBRUARY 14, 2018 TOURMALINE ADDS 558 MMBOE OF 2P RESERVES, GROWS LIQUID RESERVES BY 73% AND 2P RESERVE VALUE BY $2.
 NEWS RELEASE FEBRUARY 14, 2018 TOURMALINE ADDS 558 MMBOE OF 2P RESERVES, GROWS LIQUID RESERVES BY 73% AND 2P RESERVE VALUE BY $2.4 BILLION (1) Calgary, Alberta - Tourmaline Oil Corp. (TSX:TOU) ( Tourmaline
SUSTAINABLE DIVIDEND & GROWTH July 2018
 SUSTAINABLE DIVIDEND & GROWTH July 2018 Cardinal Profile Shares Outstanding TSX: CJ Basic (1) Fully Diluted (excluding debentures) 110.8 MM 114.0 MM 2018 Annual Dividend ($/share) $0.42 2018 Average Production
FORM F1 STATEMENT OF RESERVES DATA AND OTHER OIL AND GAS INFORMATION. Year Ended December 31, 2016
 FORM 51-101F1 STATEMENT OF RESERVES DATA AND OTHER OIL AND GAS INFORMATION Year Ended December 31, 2016 March 2, 2017 TABLE OF CONTENTS DATE OF STATEMENT AND RELEVANT DATES... 1 DISCLOSURE OF RESERVES
May 22, 2018 AGM PRESENTATION
 May 22, 2018 AGM PRESENTATION BIGSTONE PROLIFIC, LIQUIDS RICH MONTNEY Pure play MONTNEY E&P company with WORLD CLASS ASSETS: Successful delineation drilling to the west and south Growing condensate production
RMP Energy Announces $80 Million Disposition of Assets and Name Change
 RMP Energy Announces $80 Million Disposition of Assets and Name Change CALGARY, Alberta, Sept. 01, 2017 (GLOBE NEWSWIRE) -- RMP Energy Inc. ( RMP or the Company ) (TSX:RMP) is pleased to announce that