TOYOTA MOTOR FINANCE (NETHERLANDS) B.V. REGISTERED NUMBER: Annual Report & Financial Statements for the year ended 31 March 2015
|
|
|
- Bryce Owen
- 5 years ago
- Views:
Transcription
1 . TOYOTA MOTOR FINANCE (NETHERLANDS) B.V. REGISTERED NUMBER: Annual Report & Financial Statements for the year ended 31 March 2015
2 Contents Report of the Board of Management for the year ended 31 March Statement of comprehensive income for the year ended 31 March Statement of financial position as at 31 March Statement of changes in equity for the year ended 31 March Statement of cash flows for the year ended 31 March Notes to the Financial Statements General information Summary of significant accounting policies Critical accounting estimates and judgements Segment information Interest income Guarantee fee income Interest expense Fee expenses Administration expenses Net gains Dividend income Independent auditor expenses Taxation Loans to related companies Available-for-sale investment - related company Derivative financial instruments Property, plant and equipment Intangible assets Deferred tax Other receivables Current taxes Cash and cash equivalents Borrowings Financial guarantee liability Other liabilities and accrued expenses Capital management Share capital Fair value reserve Related-party transactions Contingent liabilities Cash generated from / (used in) operations Financial risk management Fair value of financial instruments Events after the balance sheet date Other Information Auditor s Report BOARD OF MANAGEMENT Yoriyuki Hirayama Katsunobu Katayama William Kilpatrick 2
3 Report of the Board of Management for the year ended 31 March 2015 The Board of Management submits herewith its report and the Financial Statements of Toyota Motor Finance (Netherlands) B.V. ( the Company ) for the year ended 31 March Overview of activities The principal activity of the Company is to act as a group finance company and to provide finance services for Toyota group companies. The Company raises funds by issuing bonds and notes in the international capital markets and from other sources and on lends to other Toyota companies. The Company also issues guarantees for debt issuances of other Toyota companies. A profit of 40.5 million was earned in the year compared to a profit of 13.1 million for the year ended 31 March. At the balance sheet date, a total equivalent amount of 7,034 million had been lent to related companies, compared to 5,855 million at 31 March. Gross profit for the year increased to 15.5 million from 12.9 million for the year ended 31 March. The profit before tax for the year of 54.1 million compares to a profit before tax of 17.8 million for the year ended 31 March. The increase in profit is primarily due to mark to market gains on derivatives in addition to an increase of gross profit resulting from increased lending to group companies. The mark to market gains on derivatives are caused by the relative decline in euro interest rates compared to the interest rates of other currencies. More details of the reasons for the volatility of the Company's results are given in Note 10 of the Notes to the Financial Statements. During the year the Company has increased the proportion of funds from the capital markets, mainly by increasing MTN funding. At 31 March 2015, there were net current assets of 934 million, compared to net current liabilities of 1,009 million for the year ending 31 March. The excess of current assets over current liabilities is due to short-term lending growth compared to a decline in short-term funding at the year ending 31 March. The nature of the activities of the Company has remained unchanged during /2015 from the prior year, and there have been no significant events since the balance sheet date. Risk management The Board of Management utilises a risk management policy and receives regular reports from the business to enable prompt identification of financial risks so that appropriate actions may be taken. The Company employs written policy and procedures that sets out specific guidelines to manage foreign exchange risk, interest rate risk, credit risk and the use of financial instruments to manage these. Please refer to note 32 to the Financial Statements where the Company has explained its use of financial instruments. Composition of the Board The size and composition of the Board of Management and the combined experience and expertise should reflect the best fit for the profile and strategy of the Company. Currently the Board consists of three male board members. The Company is aware that the gender diversity is below the goals as set out in article section 2 of the Dutch Civil Code and the Company will pay close attention to gender diversity in the process of recruiting and appointing new managing directors. Future outlook It is expected that the nature of the activities of the Company will remain unchanged during the year to 31 March Future financial performance is expected to be profitable and will depend largely on the net interest margin earned on loans to Toyota group companies and changes in value of derivatives entered into for risk management purposes. 27 July 2015 Report of the Board of Management for the year ended 31 March
4 Board of Management Yoriyuki Hirayama Katsunobu Katayama William Kilpatrick 4
5 Statement of comprehensive income for the year ended 31 March 2015 Note 2015 Interest income 5 99,040 97,281 Guarantee fee income 6 4,103 3,236 Revenue 103, ,517 Interest expense 7 (79,612) (81,423) Fee expenses 8 (7,992) (6,176) Cost of funding (87,604) (87,599) Gross profit 15,539 12,918 Administration expenses 9 (3,962) (3,852) Net gains on financial instruments 10 42,397 8,595 Dividend income Profit before tax 54,092 17,750 Taxation 13 (13,556) (4,643) Profit for the year 40,536 13,107 Other comprehensive income, net of tax: Fair value gains / (losses) on available for sale investments (34) Total comprehensive income for the year 40,791 13,073 Attributable to: Owners of the parent 40,791 13,073 The notes on pages 9 to 40 are an integral part of these Financial Statements 5
6 Statement of financial position as at 31 March 2015 Note 2015 Assets Current assets Loans to related companies 14 3,881,905 2,205,679 Other receivables 20 86, ,581 Current tax assets Derivative financial instruments , ,804 Cash and cash equivalents 22 80,625 1,390 Total current assets 4,681,455 2,620,620 Non-current assets Loans to related companies 14 3,151,639 3,649,478 Available-for-sale investment - related company 15 1, Property, plant and equipment Intangible assets Total non-current assets 3,152,694 3,650,295 Liabilities Current liabilities Borrowings 23 2,996,121 3,251,368 Derivative financial instruments , ,414 Financial guarantee liability 24 4,860 3,193 Current tax liability Other liabilities and accrued expenses , ,152-39,348 Bank overdraft 22 2,536 1 Total current liabilities 3,747,816 3,629,324 Net current assets / (liabilities) 933,639 (1,008,704) Non-current liabilities Borrowings 23 3,902,185 2,507,820 Deferred tax liabilities 19 14,431 4,845 Total non-current liabilities 3,916,616 2,512,665 Net assets 169, ,926 Shareholder s equity Equity attributable to owners of the parent Share capital Retained earnings 168, ,995 Fair value reserve Total shareholder s equity 169, ,926 The notes on pages 9 to 40 are an integral part of these Financial Statements 6
7 Statement of changes in equity for the year ended 31 March 2015 Attributable to: Owners of the parent Note Share Capital Retained Earnings Fair Value Reserves Total Balance at 31 March , ,853 Fair value (losses) (34) (34) Profit for the year - 13,107-13,107 Total comprehensive income for the year - 13,107 (34) 13,073 Balance at 31 March , ,926 Fair value gains Profit for the year - 40,536-40,536 Total comprehensive income for the year - 40, ,791 Balance at 31 March , ,717 The notes on pages 9 to 40 are an integral part of these Financial Statements 7
8 Statement of cash flows for the year ended 31 March 2015 Note 2015 Cash flow from operating activities Cash used in operations 31 (380,622) (1,152,008) Interest received 99,400 97,870 Interest paid (59,624) (73,296) Tax paid (2,082) (1,544) Net cash used in operating activities (342,928) (1,128,978) Cash flow from investing activities Purchase of equipment and software - (3) Dividend income Net cash generated from investing activities Cash flow from financing activities Proceeds from borrowings 12,124,290 15,388,071 Repayment of borrowings (11,705,661) (14,257,441) Net cash generated from financing activities 418,629 1,130,630 Net (decrease) / increase in cash and cash equivalents 75,819 1,738 Cash and cash equivalents at the beginning of the year 1, Exchange gains / (losses) on cash and cash equivalents 881 (662) Cash and cash equivalents at the end of the year 22 78,089 1,389 The notes on pages 9 to 40 are an integral part of these Financial Statements 8
9 Notes to the Financial Statements 1. General information Toyota Motor Finance (Netherlands) B.V. ( the Company ) is a wholly owned subsidiary of Toyota Financial Services Corporation. The principal activity of the Company is to act as a finance company. The Company raises funds by issuing bonds and notes in the international capital markets and from other sources and on lends to other Toyota companies. The Company also issues guarantees for debt issuance of other Toyota companies. The Company is incorporated and domiciled in the Netherlands. The address of its registered office is World Trade Center, Tower H, Level 10, Zuidplein 90, 1077 XV, Amsterdam, The Netherlands. The ultimate holding company and controlling party and the largest undertaking into which the Company's results are consolidated is Toyota Motor Corporation, which is incorporated in Japan. The smallest undertaking into which the Company s results are consolidated is Toyota Financial Services Corporation, which is incorporated in Japan. The Financial Statements of the Toyota Motor Corporation can be obtained from These Financial Statements have been approved for issue by the Board of Management on 27 July Summary of significant accounting policies The principal accounting policies applied in the preparation of these Financial Statements are set out below. These policies have been consistently applied to all the years presented, unless otherwise stated. The Company has no subsidiary, joint venture or associated company investments and is therefore not required to prepare consolidated financial statements. Basis of preparation The Financial Statements of the Company have been prepared in accordance with International Financial Reporting Standards (IFRS) and interpretations issued by the International Financial Reporting Interpretations Committee (IFRIC) as adopted by the European Union and also in accordance with the statutory provisions of Part 9, Book 2 of the Netherlands Civil Code. As a result of the accounting policies adopted, the Financial Statements of the Company are also consistent with all IFRS issued by the International Accounting Standards Board (IASB) and interpretations issued by IFRIC. The Financial Statements have been prepared under the historical cost convention, as modified by the revaluation to fair values of available-for-sale financial assets, and financial assets and liabilities at fair value through profit or loss. The preparation of financial statements in conformity with IFRS requires the use of certain critical accounting estimates. It also requires management to exercise its judgement in the process of applying the Company s accounting policies. The areas involving a higher degree of judgement or complexity, or areas where assumptions and estimates are significant to the Financial Statements are disclosed in note 3. The Company s Financial Statements are presented in euro, which is the Company s functional and reporting currency. Except as indicated financial information presented has been presented in euro and rounded to the nearest thousand. Going concern There was an excess of current assets over current liabilities at 31 March Management of liquidity risk is explained in note 32.5 and, having assessed the available liquidity facilities and credit support facilities in place, the directors have a reasonable expectation that the company has adequate resource to continue to fund its current obligations for the foreseeable future and therefore the Financial Statements have been prepared on a going concern basis. 9
10 Changes in accounting policy and disclosures New and amended standards effective for the financial year starting 1 April Amendment to IFRS 10, Consolidated Financial Statements outlines the requirements for the preparation and presentation of consolidated financial statements, requiring entities to consolidate entities it controls. Control requires exposure or rights to variable returns and the ability to affect those returns through power over an investee. The amendment has no impact on the Financial Statements of the Company. Amendment to IFRS 12, Disclosure of Interests in Other Entities is a consolidated disclosure standard requiring a wide range of disclosures about an entity's interests in subsidiaries, joint arrangements, associates and unconsolidated 'structured entities'. The amendment has no impact on the Financial Statements of the Company. Amendment to IAS 32, Financial Instruments: Presentation regarding the accounting requirements for the presentation of financial instruments, particularly as to the classification of such instruments into financial assets, financial liabilities and equity instruments. The standard also provides guidance on the classification of related interest, dividends and gains/losses, and when financial assets and financial liabilities can be offset. The amendment has no impact on the Financial Statements of the Company. Amendment to IAS 36, Impairment of Assets seeks to ensure that an entity's assets are not carried at more than their recoverable amount (i.e. the higher of fair value less costs of disposal and value in use). With the exception of goodwill and certain intangible assets for which an annual impairment test is required, entities are required to conduct impairment tests where there is an indication of impairment of an asset, and the test may be conducted for a 'cash-generating unit' where an asset does not generate cash inflows that are largely independent of those from other assets. The amendment has no impact on the Financial Statements of the Company. New standards, amendments and interpretations issued but not effective for the financial year beginning 1 April and not early adopted Amendment to IFRS 2 Share-based Payment requires an entity to recognise share-based payment transactions (such as granted shares, share options, or share appreciation rights) in its financial statements, including transactions with employees or other parties to be settled in cash, other assets, or equity instruments of the entity. The amendment is expected to have no impact on the Financial Statements of the Company. Amendment to IFRS 3 Business Combinations outlines the accounting when an acquirer obtains control of a business (e.g. an acquisition or merger). Such business combinations are accounted for using the 'acquisition method', which generally requires assets acquired and liabilities assumed to be measured at their fair values at the acquisition date. The amendment is expected to have no impact on the Financial Statements of the Company. Amendment to IFRS 5 Non-current Assets Held for Sale and Discontinued Operations outlines how to account for non-current assets held for sale (or for distribution to owners). In general terms, assets (or disposal groups) held for sale are not depreciated, are measured at the lower of carrying amount and fair value less costs to sell, and are presented separately in the statement of financial position. The amendment is expected to have no impact on the Financial Statements of the Company. Amendment to IFRS 7 Financial Instruments: Disclosures requires disclosure of information about the significance of financial instruments to an entity, and the nature and extent of risks arising from those financial instruments, both in qualitative and quantitative terms. The amendment is expected to have no impact on the Financial Statements of the Company. Amendment to IFRS 8 Operating Segments requires particular classes of entities (essentially those with publicly traded securities) to disclose information about their operating segments, products and services, the geographical areas in which they operate, and their major customers. Information is based on internal management reports, both in the identification of operating segments and measurement of disclosed segment information. The amendment is expected to have no impact on the Financial Statements of the Company. IFRS 9, Financial instruments, addresses the classification, measurement and recognition of financial assets and financial liabilities. IFRS 9 was issued in November 2009 and October It replaces the parts of IAS 39 that relate to the classification and measurement of financial instruments. IFRS 9 requires financial assets to be classified into two measurement categories: those measured as at fair value and those measured at amortised cost. The determination is made at initial recognition. The classification depends on the entity s business model for managing its financial instruments and the contractual cash flow characteristics of the instrument. For financial liabilities, the standard retains most of the IAS 39 requirements. The main change is that, in cases where the fair value option is taken for financial liabilities, 10
11 the part of a fair value change due to an entity s own credit risk is recorded in other comprehensive income rather than the income statement, unless this creates an accounting mismatch. The Company is yet to assess IFRS 9 s full impact. The Company will also consider the impact of the remaining phases of IFRS 9 when completed by the Board. Amendment to IFRS 11 Joint Arrangements outlines the accounting by entities that jointly control an arrangement. The amendment is expected to have no impact on the Financial Statements of the Company. Amendment to IFRS 13 Fair Value Measurement applies to IFRSs that require or permit fair value measurements or disclosures and provides a single IFRS framework for measuring fair value and requires disclosures about fair value measurement. The amendment is expected to have no impact on the Financial Statements of the Company. Amendment to IFRS 14 Regulatory Deferral Accounts permits an entity which is a first-time adopter of International Financial Reporting Standards to continue to account, with some limited changes, for 'regulatory deferral account balances' in accordance with its previous GAAP, both on initial adoption of IFRS and in subsequent financial statements. The amendment is expected to have no impact on the Financial Statements of the Company. Amendment to IFRS 15 Revenue from contracts with customers specifies how and when an IFRS reporter will recognise revenue as well as requiring such entities to provide users of financial statements with more informative, relevant disclosures. The amendment is expected to have no impact on the Financial Statements of the Company. Amendment to IAS 1 Presentation of Financial Statements sets out the overall requirements for financial statements, including how they should be structured, the minimum requirements for their content and overriding concepts such as going concern, the accrual basis of accounting and the current/non-current distinction. The amendment is expected to have no impact on the Financial Statements of the Company. Amendment to IAS 16 Property, Plant and Equipment outlines the accounting treatment for most types of property, plant and equipment. Property, plant and equipment is initially measured at its cost, subsequently measured either using a cost or revaluation model, and depreciated so that its depreciable amount is allocated on a systematic basis over its useful life. The amendment is expected to have no impact on the Financial Statements of the Company. Amendment to IAS 19 Employee Benefits (amended 2011) outlines the accounting requirements for employee benefits, including short-term benefits (e.g. wages and salaries, annual leave), post-employment benefits such as retirement benefits, other long-term benefits (e.g. long service leave) and termination benefits. The amendment is expected to have no impact on the Financial Statements of the Company. Amendment to IAS 24 Related Party Disclosures requires disclosures about transactions and outstanding balances with an entity's related parties. The standard defines various classes of entities and people as related parties and sets out the disclosures required in respect of those parties, including the compensation of key management personnel. The amendment is expected to have no impact on the Financial Statements of the Company. Amendment to IAS 28 Investments in Associates and joint ventures outlines the accounting for investments in associates. An associate is an entity over which an investor has significant influence, being the power to participate in the financial and operating policy decisions of the investee (but not control or joint control), and investments in associates are, with limited exceptions, required to be accounted for using the equity method. The amendment is expected to have no impact on the Financial Statements of the Company. Amendment to IAS 34 Interim Financial Reporting applies when an entity prepares an interim financial report, without mandating when an entity should prepare such a report. Permitting less information to be reported than in annual financial statements (on the basis of providing an update to those financial statements), the standard outlines the recognition, measurement and disclosure requirements for interim reports. The amendment is expected to have no impact on the Financial Statements of the Company. Amendment to IAS 39, Financial Instruments, Recognition and Measurement outlines the requirements for the recognition and measurement of financial assets, financial liabilities, and some contracts to buy or sell non-financial items. Financial instruments are initially recognised when an entity becomes a party to the contractual provisions of the instrument, and are classified into various categories depending upon the type of instrument, which then determines the subsequent measurement of the instrument (typically amortised cost or fair value). Special rules apply to embedded derivatives and hedging instruments. The amendment is expected to have no impact on the Financial Statements of the Company. Amendment to IAS 38 Intangible Assets outlines the accounting requirements for intangible assets, which are non-monetary assets which are without physical substance and identifiable (either being separable or arising from contractual or other legal rights). Intangible assets meeting the relevant recognition criteria are initially measured at cost, subsequently measured at cost or using the revaluation model, and amortised on a systematic basis over their useful lives (unless the asset has an indefinite useful life, in which case it is not amortised). The amendment is expected to have no impact on the Financial Statements of the Company. 11
12 Amendment to IAS 40 Investment Property applies to the accounting for property (land and/or buildings) held to earn rentals or for capital appreciation (or both). Investment properties are initially measured at cost and, with some exceptions. may be subsequently measured using a cost model or fair value model, with changes in the fair value under the fair value model being recognised in profit or loss. The amendment is expected to have no impact on the Financial Statements of the Company. There are no other IFRSs or IFRIC interpretations that are not yet effective that would be expected to have a material impact on the Company. Segmental reporting The single operating segment is reported in a manner consistent with the internal reporting provided to the chief operating decision-maker. The chief operating decision-maker, who is responsible for allocating resources and assessing performance of the operating segments, has been identified as the Board of Management that makes strategic decisions. Foreign currency Transactions and balances Foreign currency transactions are translated into the functional currency using the exchange rates prevailing at the dates of the transactions. Foreign exchange gains and losses resulting from the settlement of such transactions and from the translation at year-end exchange rates of monetary assets and liabilities denominated in foreign currencies are recognised in the Statement of comprehensive income, in Net gainson financial instruments. Changes in the fair value of monetary securities denominated in foreign currency classified as available-forsale are analysed between translation differences resulting from changes in the amortised cost of the security, and other fair value changes in the carrying amount of the security. Translation differences are recognised in profit or loss, and other fair value changes in carrying amount are recognised in equity. Translation differences on non-monetary financial assets and liabilities are reported as part of the fair value gain or loss. Translation differences on non-monetary financial assets and liabilities such as equities held at fair value through profit or loss are recognised in the Statement of comprehensive income, in Net gains on financial instruments. Translation differences on non-monetary financial assets such as equities classified as available-for-sale are included in the fair value reserve in equity. Financial assets Financial assets are classified in the following categories: loans and receivables, available-for-sale investments, held to maturity financial assets or financial assets at fair value through profit or loss. The classification depends on the purpose for which the financial assets were acquired. Management determines the classification of the investments at initial recognition. Regular-way trades of derivatives contracts are accounted for on a trade date basis, and regular-way trades of all other financial assets are accounted for on a settlement date basis. a) Loans and receivables The Company s loans and advances to Toyota group related entities are classified as loans and receivables. Loans and receivables are non-derivative financial assets with fixed or determinable payments that are not quoted in an active market, whose recoverability is based solely on the credit risk of the related company and where the Company has no intention of trading the loan. Loans and receivables are initially recognised at fair value including any incremental funding costs. Subsequent recognition is at amortised cost using the effective interest method. Guarantee fees receivable from fellow subsidiaries in respect of debt guaranteed by the Company are included in Other receivables in the Statement of financial position. b) Available-for-sale financial assets Available-for-sale financial assets are non-derivative financial assets, principally (but not exclusively) investment securities intended to be held for an indefinite period of time which may be sold in response to needs for liquidity or changes in interest rates or market prices. Therefore, based on the expectation of management, available for sale investments are classified between current and non-current. They are initially measured at fair value including direct and incremental transaction costs. Subsequent measurement is at fair value, with changes in fair value being recognised in equity except for impairment losses and translation differences, which are recognised in the Statement of comprehensive income. Upon derecognition of the asset, or where there is objective evidence that the investment security is impaired, the cumulative gains and losses recognised in equity are removed from equity and recognised in the Statement of comprehensive income. 12
13 c) Held to maturity financial assets Held to maturity financial assets are non-derivative financial assets with fixed or determinable payments that the Company has the ability and intention to hold to maturity. They are initially measured at fair value including direct and incremental transaction costs. Subsequent measurement is at amortised cost using the effective interest method. d) Financial assets at fair value through profit or loss Financial assets at fair value through profit or loss are financial assets held for trading. Derivatives are categorised as 'held for trading' unless they are designated as hedging instruments. Currently no derivatives have been designated as hedging instruments. The Company enters into derivatives to mitigate the risks associated with other underlying financial assets and financial liabilities. Derivatives are initially recognised at fair value on the date a derivative contract is entered into are subsequently corrected at fair value. Transaction costs are expensed in the Statement of comprehensive income. The method of recognising the resulting gain or loss depends on whether the derivative is designated as a hedging instrument, and if so, the nature of the item being hedged. Currently none of the Company s derivatives have been designated as hedging instruments. Consequently, all changes in the fair value of any derivative instruments, net of accrued interest on derivatives, are recognised immediately in the Statement of comprehensive income, within Net gains on financial instruments. Accrued interest on derivatives is recorded in the Statement of comprehensive income within Interest expense. Impairment of financial assets A financial asset, or portfolio of financial assets, is impaired, and an impairment loss incurred, if there is objective evidence that an event or events since initial recognition of the asset have adversely affected the amount or timing of future cash flows from the asset. The Company assesses financial assets for impairment at each balance sheet date. Evidence of impairment would include a debt issuer being unable to pay as and when the debt falls due. The Company measures the amount of the loss as the difference between the carrying amount of the asset or group of assets and the present value of estimated future cash flows from the asset or group of assets discounted at the effective interest rate of the instrument at initial recognition. Impairment losses are assessed individually for financial assets that are individually significant and individually or collectively for assets that are not individually significant. In making a collective assessment of impairment, financial assets are grouped into portfolios on the basis of similar risk characteristics. Future cash flows from these portfolios are estimated on the basis of the contractual cash flows and historical loss experience for assets with similar credit risk characteristics. Historical loss experience is adjusted, on the basis of current observable data, to reflect the effects of current conditions not affecting the period of historical experience. Impairment losses are recognised in profit or loss and the carrying amount of the financial asset or group of financial assets reduced by establishing an allowance for impairment losses. If in a subsequent period the amount of the impairment loss reduces and the reduction can be ascribed to an event after the impairment was recognised, the previously recognised loss is reversed by adjusting the allowance. Once an impairment loss has been recognised on a financial asset or group of financial assets, interest income is recognised on the carrying amount using the effective interest rate at which estimated future cash flows were discounted in measuring impairment. Property, plant and equipment Items of property, plant and equipment are carried at cost less any accumulated depreciation and any accumulated impairment losses. Depreciation is charged to profit or loss on a straight-line basis so as to write off the depreciable amount of property, plant and equipment over the estimated useful life of the assets as follows: o Fixture & Fittings: 5 years o Furniture: 5 years o Computer hardware: 5 years The assets residual values and useful lives are reviewed, and adjusted if appropriate, at each balance sheet date. Gains and losses on disposal of items of property, plant and equipment are determined by comparing proceeds with carrying amount. These are included in Administration expenses in the Statement of comprehensive income. 13
14 Intangible assets Intangible assets that are acquired by the Company are stated at cost less accumulated amortisation and any accumulated impairment losses. Amortisation is charged to profit or loss on a straight-line basis over the asset s estimated useful life and is included in Administration expenses in the Statement of comprehensive income. The estimated useful economic lives are as follows: o Computer software: 5 years The assets residual values and useful lives are reviewed, and adjusted if appropriate, at each balance sheet date. Gains and losses on disposal of items of intangible assets are determined by comparing proceeds with carrying amount. These are included in Administration expenses in the Statement of comprehensive income. Impairment of non-financial assets An impairment loss is the amount by which the carrying amount of an asset exceeds its recoverable amount. At each reporting date the Company assesses whether there is any indication that an asset may be impaired. If any such indication exists, the recoverable amount of the asset is estimated. Property, plant and equipment, and intangible assets are subject to an impairment review if there are events or changes in circumstance which indicate that the carrying amount may not be recoverable. Cash and cash equivalents Cash and cash equivalents are defined as cash and deposits which can be realised within three months. These include overnight money market deposits with banks, current account and deposit account balances with banks and short-term investments. Cash and cash equivalents are measured at amortised cost. Borrowings Borrowings are recognised initially at fair value, net of transaction costs incurred and subsequently at amortised cost. Recognition and de-recognition is on a settlement basis. Depending on the maturity date of the contract the borrowing is classified as current or non-current. Taxation The charge for current tax is based on the results for the period as adjusted for items that are not taxable or disallowed. It is calculated using tax rates that have been enacted or substantively enacted by the balance sheet date. Deferred income tax is provided in full, using the balance sheet liability method, on temporary differences arising between the tax bases of assets and liabilities and their carrying amounts in the Financial Statements. However, the deferred income tax is not accounted for if it arises from initial recognition of an asset or liability in a transaction other than a business combination that at the time of the transaction affects neither accounting, nor taxable profit or loss. Deferred income tax is determined using tax rates (and laws) that have been enacted or substantively enacted by the balance sheet date and are expected to apply when the related deferred income tax asset is realised or the deferred income tax liability is settled. Deferred income tax assets are recognised to the extent that it is probable that future taxable profit will be available against which the temporary differences can be utilised. Deferred income tax is provided on temporary differences arising on investments in subsidiaries and associates, except for deferred income tax liability where the timing of the reversal of the temporary difference is controlled by the reporting entity and it is probable that the temporary difference will not reverse in the foreseeable future. Deferred income tax assets and liabilities are offset when there is a legally enforceable right to offset current tax assets against current tax liabilities and when the deferred income taxes assets and liabilities relate to income taxes levied by the same taxation authority on either the same taxable entity or different taxable entities where there is an intention to settle the balances on a net basis. Guarantees 14
15 The Company issues guarantees to debt holders of fellow Toyota Motor Corporation subsidiaries. The Company receives guarantee fees from these fellow subsidiaries in respect of the guaranteed debt in issuance. Guarantees are classified as financial liabilities under IAS39 (amended), and as such the guarantees are recognised in the Statement of financial position. The guarantees are initially stated at fair value, which is determined by reference to the present value of the future fee cash flows at the point of issuance of the debt being guaranteed. Guarantees are derecognised at the point of repayment of the guaranteed debt. Subsequent measurement of the guarantee liability is the higher of the amount determined by IAS 37 Provisions, contingent liabilities and contingent assets or the amortised initial present value recognition of the guarantee using the effective interest rate method. Revenue recognition Interest income Interest income is recognised on a time-proportion basis using the effective interest method. When a receivable is impaired, the Company reduces the carrying amount to its recoverable amount, being the estimated future cash flow discounted at the original effective interest rate of the instrument, and subsequently continues unwinding the discount as interest income. The effective interest rate method calculates the amortised cost of a financial asset or liability, and allocates the interest income or interest expense over the relevant period. The effective interest rate is the rate that exactly discounts estimated future cash receipts and payments through the expected life of the financial instrument or, when appropriate, a shorter period to the net carrying amount of the financial asset or liability. When calculating the effective interest rate, the Company estimates cash flows considering all contractual terms of the financial instrument but does not consider future credit losses. The calculation includes all amounts received or paid by the Company that are an integral part of the overall return, direct incremental transaction costs related to the acquisition or issue of a financial instrument, and all other premiums and discounts. Interest on derivatives and the amortisation of the interest component of foreign exchange derivatives are recognised on an effective yield basis within interest expense in the Statement of comprehensive income. Guarantee fee income Guarantee fee income is recognised on an accruals basis in accordance with the substance of the relevant agreements. Dividend income Dividend income is recognised when the right to receive payment is established. 3. Critical accounting estimates and judgements The notes to the Financial Statements set out areas where significant judgement, complex calculations or assumptions have been used to arrive at the Financial Statements presented. Areas of significant judgement or complexity will include the fair valuation of financial instruments, loans and guarantees. 3.1 Fair value estimation of financial instruments The fair value of financial instruments that are not traded in an active market is determined by using valuation techniques. The Company uses a variety of methods and market assumptions that are based on market conditions existing at each balance sheet date. Quoted market prices or dealer quotes for similar instruments are used for long-term debt. Other techniques, such as estimated discounted cash flows, are used to determine the fair value for the remaining financial instruments. The fair value of interest rate swaps, cross currency swaps and forward foreign exchange contracts is calculated as the present value of the estimated future cash flows. The nominal value less impairment provision of other receivables and payables, normally maturing within 30 days, are assumed to approximate their fair values. The fair value of financial liabilities for disclosure purposes is estimated by discounting the future contractual cash flows at the current market interest rate that is available to the Company for similar financial instruments. 15
16 3.2 Initial recognition and valuation of guarantees The initial fair value recognition of guarantee liabilities, in relation to related party debt issuance, is required by IAS 39. As the guarantees of related party debt are not actively traded and no initial fee is charged for entering into the guarantee, a valuation technique is required to assess the initial liability to the third party debt holder. The Company uses the discounted future income cash flows over the life of the guarantee to assess the initial guarantee liability. The initial recognition of the guarantee liability is calculated using the market interest rates applicable to the specific currency of debt issuance on the date the related party issues the debt. The estimation of the initial fair value of the guarantees is subject to a significant level of management judgement and complexity, as the individual related group companies do not have a separate credit rating from that of the overall Toyota Motor Corporation group. A guarantee asset is recognised of an amount equal to the guarantee liability. Changes in the value of the guarantee liability are matched by equal changes in the value of the guarantee asset; since such changes have no impact on the Statement of comprehensive income, no sensitivity analysis of the guarantee liability is included in the notes to the Financial Statements. 4. Segment information The Company consists of a single operating reporting segment as defined under IFRS 8. Income generation is principally from lending to related companies, with other income generation from guarantees of related companies and from other investment and deposit income incidental to the primary funding activities. Income can be categorized geographically as follows: Income by area 2015 Russia (group) 31,970 UK (group) 26,453 Norway (group) 12,458 Other countries (group) 32,106 Interest received from others 156 Total 103,143 Income by area Russia (group) 31,832 UK (group) 21,912 Norway (group) 11,936 Other countries (group) 34,593 Interest received from others 245 Total 100,518 Segments are not shown by customer as the income, apart from third party interest, is from within the group, which is controlled by Toyota Motor Corporation. 16
17 5. Interest income Interest income 2015 Interest income on loans to related companies 98,884 97,036 Interest income on deposits Interest receivable (corporation tax) 3 - Interest income on collateral deposits paid Total 99,040 97, Guarantee fee income The Company guarantees the debt of certain other Toyota Motor Corporation subsidiaries, for which it receives guarantee fee income. All guarantee fee income is from related parties. Guarantee fee income for the year 2015 was 4,103,000 (: 3,236,000). 7. Interest expense Interest expense 2015 Interest expense on loans from related parties (1,677) (5,088) Interest expense from bank borrowing (11,556) (10,391) Net interest on swap agreements 55,783 27,313 Interest charge on euro medium term notes (116,138) (87,331) Interest expense on commercial paper (5,182) (3,900) Interest component of foreign exchange derivative contracts (809) (1,983) Interest on bank overdraft (4) (3) Interest expense on collateral deposits received (22) (40) Interest on bank penalty (7) - Total (79,612) (81,423) 8. Fee expenses The Company has the benefit of credit support agreements with Toyota Financial Services Corporation and Toyota Motor Corporation, for which it pays credit support fees based on the Company s debt issuance and guarantees issued to related parties. The credit support fees paid in the year to related parties were 7,992,000 (: 6,176,000). 17
18 9. Administration expenses Administration expenses 2015 Staff costs (1,215) (1,194) Legal fees (527) (489) Commitment facility fee (382) (306) Independent auditor s remuneration (273) (254) Communication expenses (124) (122) Office rent (109) (120) Rating annual fees (66) (122) Tax advisor fees (24) (15) Other administration expenses (1,226) (1,212) Depreciation of PPE and write off of PPE (15) (16) Amortisation of intangible assets (1) (2) Total (3,962) (3,852) Other administration expenses include related party costs of 665,000 (: 655,000) for business services. The Company had an average of 9 employees, 2 seconded and 7 local (: 9 employees, 2 seconded and 7 local) during the year. Staff costs consist of the following expenses and include the payroll costs of seconded employees; Staff costs 2015 Wages, salaries and bonuses (on accruals basis) (1,101) (1,075) Social security costs (67) (68) Pension premiums (defined pension scheme on accruals basis) (47) (51) Total (1,215) (1,194) Payments to key management below consist of all payments and benefits to directors of the Company. Compensation to key management 2015 Short-term employee benefits (447) (305) Fees paid to corporate director - (32) Total (447) (337) 18
19 10. Net gains on financial instruments Net gains and losses arise from both foreign exchange rate movements and from interest rate movements on the following categories of financial instruments; Net gains on finanacial instruments 2015 (Losses) / gains arising from foreign exchange rate movements Held for trading financial assets or liabilities at fair value through profit 694,335 (330,113) or loss Loans and receivables at amortised cost 286,637 (147,770) Financial liabilities measured at amortised cost (976,921) 478,150 Gains / (losses) arising from interest rate movements 4, Held for trading financial assets or liabilities at fair value through profit or loss Fair value losses Fair value gains (96,511) 134,857 (69,164) 77,492 Total 42,397 8,595 The Company issues loans to related parties, and debt to meet investor demand, in a number of currencies, and then swaps this lending and borrowing back into one of four funding books; US Dollar (USD), Pounds Sterling (GBP), Japanese Yen (JPY) and Euro (EUR) (as described in Note 32.2 'Foreign exchange risk'). The effect of foreign exchange rate movements on the market value of the derivatives is offset by equal and opposite exchange losses or gains on the underlying financial assets and liabilities. The net gains and losses arising from foreign exchange rate movements arise from the Company s net foreign exposure to GBP, USD, and JPY (as shown in Note 32.2). The Company has opted to fair value the derivatives whereas the other financial assets and liabilities are measured at amortised cost. The Company does not apply hedge accounting. Therefore, the effect of interest movements on the market value of the derivatives is not offset by an opposite movement on the underlying financial assets and liabilities leading to volatility in the statement of income. The increase from 8,595,000 gain on the derivatives due to interest rate movements for the year ending March to 42,397,000 gain for the year ending March 2015 is caused by the relative larger decline in other currencies interest rates compared to the euro interest rates. 11. Dividend income The Company received a dividend from Toyota Leasing (Thailand) Co. Ltd. of 118,000 in the year (: 89,000). 19
20 12. Independent auditor expenses Administration expenses includes the following fees paid to the Company s independent auditor PricewaterhouseCoopers Accountants N.V. for the statutory audit. Independent auditor expenses 2015 Audit - statutory (116) (114) Audit - other assurance services (157) (140) Total (273) (254) Other assurance services consists of fees paid to PricewaterhouseCoopers Accountants N.V. for Comfort Letters relating to the issuing of Euro Medium Term Notes. Also included under other assurance services are fees paid to PricewaterhouseCoopers Aarata (Japan) for translation services provided in translating the comfort letters and accompanying documents. 13. Taxation Taxation 2015 Current Taxation on profit for the year (4,462) (2,738) Prior period tax adjustment (3,970) (2,561) Deferred Origination / reversal of timing differences (9,586) (2,082) Total (13,556) (4,643) The tax on the Company s profit before tax differs from the theoretical amounts that would arise using the weighted average tax rate applicable to the profits of the Company as follows: Reconciliation of tax charge 2015 Profit before tax 54,092 17,751 Average applicable tax rate for the year 24.94% 24.89% Tax calculated at domestic tax rates applicable (13,488) (4,418) Change in tax rates on deferred tax balances (25) (9) Irrecoverable withholding tax (563) (414) Taxable expense (1) (1) Non-taxable income Prior period tax adjustment Total (13,556) (4,643) The current tax rate is 25% for calendar year 2015 (: 25%, 2013: 25%) in the Netherlands. 20
21 14. Loans to related companies The Company lends to other Toyota Motor Corporation subsidiaries on both a fixed rate and a floating rate basis. All fixed rate lending is swapped into floating on either a three month or six month floating basis in line with the Company s risk management policy. The currency of related party lending is determined by counterparty demand and then either funded directly from one of four main funding books (USD, GBP, JPY and EUR) or swapped back into the appropriate funding currency using a matching currency swap. Loans to related companies 2015 Current loans to related companies 3,881,905 2,205,679 Non-current loans to related companies 3,151,639 3,649,478 Total 7,033,544 5,855,157 No related party loans are overdue and there is no impairment of related party loans either in the current or previous financial years. There has been no renegotiation of any loans that would otherwise have been past due or impaired. Interest rates on group lending can be either fixed or floating. The interest range for group lending on 31 March 2015 was between (0.65%) and 13.95% per annum dependent on the currency of the loan. No impairment provisions or losses have been incurred in the current or previous financial year for any class of financial asset. 15. Available-for-sale investment - related company The Company owns 0.047% (: 0.053%) of the issued share capital of Toyota Leasing (Thailand) Co. Ltd. ( TLT ), a company domiciled in Thailand. TLT has issued share capital of 51.4 million shares (face value 1,000 Thai Bath (THB) per share) (: 45 million shares). Of the registered share capital of THB 51,400,000,000, THB 15,100,000,000 is fully paid up. The original cost of the investment in 1997 was 750,000. Management has assessed the fair value of the investment in TLT with reference to discounted cash flow modelling of TLT assets and liabilities, and by applying the current market interest rates and exchange rates prevailing on 31 March The investment in TLT shares at the balance sheet date is measured at fair value. The valuation of TLT, although using third party market data to value the company, is subject to significant management judgement when assessing the probable cash flows from the current asset base. Investment in Toyota Leasing (Thailand) Co. Ltd Balance at the start of year Fair value adjustment 255 (33) Total 1, Derivative financial instruments The derivative financial instruments are categorised as held for trading and are carried at fair value through profit or loss. The fair values of derivative contracts are shown in the table below. Additional disclosures are set out in the accounting policies relating to risk management. 21
22 Derivative financial instruments - Assets 2015 Interest swaps 684 6,104 Cross-currency swaps 591, ,295 Forward foreign currency contracts 39,668 4,405 Total 632, ,804 Derivative financial instruments - Liabilities 2015 Interest swaps 11,508 11,664 Cross-currency swaps 263, ,588 Forward foreign currency contracts 1,985 11,163 Total 277, ,415 In accordance with IAS 39, Financial instruments: Recognition and measurement, the Company has reviewed all contracts for embedded derivatives and found there are none. Derivative assets and liabilities are recognised at fair value through the Statement of comprehensive income. Derivative assets of 632,210,000 and liabilities of 277,425,000 are therefore shown as short-term, irrespective of when the contract matures. This leads to volatility in current assets and current liabilities due to an accounting mismatch. Within the derivative assets, contracts for an amount of 425,503,000 have a maturity date beyond 1 year and within the derivative liabilities contracts with a maturity date beyond one year amount to 192,178,000. The majority of derivative contracts have collateral agreements attached therefore the debit/credit valuation adjustment is not considered material and is not considered in determining the fair value of derivative assets and liabilities. 22
23 17. Property, plant and equipment Property, plant and equipment 2015 Computer hardware and office equipment Computer hardware and office equipment Cost Cost b/fwd at 1 April / Additions - 4 Disposals - (13) Total Depreciation Depreciation b/fwd at 1 April / Depreciation charge for the year Disposals (13) Total Reconciliation at the beginning and end of the year Opening net book amount - at 1 April / Closing net book amount - at 31 March 2015 / Intangible assets Intangible assets 2015 Computer software Computer software Cost Cost b/fwd at 1 April / Disposals - (16) Total 9 9 Amortisation Amortisation b/fwd at 1 April / Amortisation charge for the year Disposals 1-2 (16) Total 8 7 Reconciliation at the beginning and end of the year Opening net book amount - at 1 April / Closing net book amount - at 31 March 2015 /
24 19. Deferred tax Deferred tax is provided in full on temporary differences under the balance sheet liability method, using the current tax rate of 25.0%. The tax rates apply to calendar years. The movement on the deferred tax account is shown below: Deferred tax 2015 Deferred tax b/fwd 1 April / 2013 (4,845) (2,763) Fair valuation of assets and liabilities through profit or loss (9,586) (2,082) Total (14,431) (4,845) Deferred tax liabilities have been recognised for all tax gains and other temporary differences giving rise to deferred tax liabilities, because it is possible that these liabilities will crystallise. 20. Other receivables Other receivables 2015 Deposit on rent Prepaid rent 32 4 Collateral deposits paid 79, ,600 Interest receivable (cash collateral posted) Related party receivable 2,046 1,686 Non-related party receivable Guarantee fee 4,860 3,193 Total 86, ,581 Collateral deposits paid are cash deposits with derivative counterparties held as collateral under derivative contracts. The fair value of those deposits approximates the carrying amount. 21. Current taxes Current taxes are charged based on the prevailing tax rates. The tax rates apply to calendar years and profit for the accounting year is therefore pro-rated between the two calendar years on a day-count basis to compute the effective tax rate. The current tax rates are 25.0% for calendar year 2015 (: 25.0%, 2013: 25.0%) in the Netherlands. Corporation tax liability at 31 March 2015 is 1,722,000 (: 166,000 asset). The tax payments are made during the year in which the profits are earned on an estimated basis. The extent to which the final taxable charge differs from the original amount estimated, results in a current tax asset or liability due to over or under payment of tax respectively. 24
25 22. Cash and cash equivalents Cash and cash equivalents 2015 Cash at bank and in hand 1, Short-term bank deposits 79, Accrued interest on short term bank deposits 1 - Cash and bank balances 80,625 1,390 Bank overdraft (2,536) (1) Total 78,089 1, Borrowings Borrowings 2015 Current 2015 Noncurrent Current Noncurrent Euro commercial paper 1,332,372-1,015,841 - Medium term notes 754,765 2,795, ,683 1,932,970 Loans payable group company 725, ,581 - Loans payable bank 183,732 1,107, , ,850 Total 2,996,121 3,902,185 3,251,368 2,507,820 The Company s principal borrowings are from a euro short-term commercial paper programme, a long-term medium term note programme, group borrowing and long term bank borrowing. Euro commercial paper is a short-term debt instrument normally issued at a discount and repaid at the face value. The Company can issue commercial paper with maturities between 1 day and 364 days. Interest rates on group and bank borrowings are floating and based on the relevant three months Libor plus spread. The interest range for group and bank borrowings on 31 March 2015 was between (0.01%) and 8.85% per annum. As at the 31 March 2015 there are current borrowings of 2,996,121,000 (: 3,251,368,000) and noncurrent borrowings of 3,902,185,000 (: 2,507,820,000). 24. Financial guarantee liability The current amortised fair value of guarantee fees outstanding is: 4,860,000 (: 3,193,000) and these relate only to guarantees issued in respect of debt issuance for other related group companies (see note 2). 25
26 25. Other liabilities and accrued expenses Other liabilities and accrued expenses 2015 Collateral deposits received 460,300 35,500 Interest payable on collateral deposits 4 5 Related party accounts payable 4,342 3,326 Accrued administration expenses Other accrued taxes Total 465,152 39,348 Collateral deposits received are cash deposits from derivative counterparties held as collateral under derivative contracts. 26. Capital management The Company s internal objectives when managing capital are: o To safeguard the Company s ability to continue as a going concern, so that it can continue to provide returns for shareholders and benefits for other stakeholders; and o To provide an adequate return to the Company s primary shareholder, Toyota Financial Services Corporation ( TFSC ), by pricing products and services commensurately with the level of risk. Fiscal equity is accounting equity adjusted for temporary tax timing differences. The main tax timing differences are disclosed in note 19, Deferred tax. Accounting equity is defined as the sum of issued share capital (see note 27). During the financial year 2015 the Company s capital management strategy remained unchanged from the financial year and was to operate profitably and to add to retained reserves. The Company has complied with internal capital requirements by maintaining adequate capital during the year. 27. Share capital Share capital 2015 Authorised 10,000 (: 10,000) ordinary shares of Euro 454 each 4,540 4,540 Issued and fully paid up 2,000 (: 2,000) ordinary shares of Euro 454 each % of the share capital of the Company is owned by Toyota Financial Services Corporation (see note 1). 26
27 28. Fair value reserve Fair value reserve At 1 April Movement Gross unrealised losses on available-for-sale financial assets (34) At 31 March 23 Gross unrealised gains on available-for-sale financial assets 255 At 31 March The fair valuation reserve arises from the fair valuation through equity of available for sale financial assets and the related deferred taxation on the fair valuation adjustment. 29. Related-party transactions Parent and ultimate controlling party The Company is a wholly-owned subsidiary of Toyota Financial Services Corporation (TFSC), a company incorporated in Japan. The ultimate holding company and controlling party is Toyota Motor Corporation (TMC), a company incorporated in Japan. Transactions with parent company During the year TFSC provided credit support to the Company in respect of group loans, debt issuance in the capital markets and related party guarantees. The fees charged were 7,992,000 (: 6,176,000) with 4,143,000 (: 3,174,000) outstanding at year end. The outstanding amount bears no interest and there are no fixed repayment terms. Fellow subsidiaries During the year transactions were entered into with the following TMC subsidiaries:- Toyota (GB) PLC Toyota Digital Cruise Europe NV/SA Toyota Financial Services Korea Co. Ltd. Toyota Financial Services (UK) PLC, as well as its subsidiaries and associated undertakings; Toyota Financial Services (UK) PLC subsidiaries:- Toyota Finance Finland Oy Toyota Financial Services Czech s.r.o. Toyota Financial Services Slovakia s.r.o. Toyota Financial Services Danmark A/S Toyota Financial Services Hungary Rt. Toyota Financial Services Kazakhstan MFO LLP Toyota Financial Services (UK) PLC associated undertakings:- Toyota Financial Services (South Africa) (Proprietary) Limited Toyota Kreditbank GmbH, as well as with its branches and subsidiaries; Toyota Kreditbank GmbH branches:- Toyota France Financement Toyota Financial Services Norway Toyota Financial Services Sweden Toyota Financial Services Spain Toyota Kreditbank GmbH subsidiaries:- 27
28 Toyota Bank Polska S.A. Toyota Leasing GmbH Toyota Leasing Polska Sp.z o.o. ZAO Toyota Bank Toyota Leasing (Thailand) Co. Ltd Toyota Motor Credit Corporation Toyota Capital Malaysia Sdn. Bhd.(formerly UMW Toyota Capital Sdn.Bhd) Transactions with fellow subsidiaries Guarantees The Company earned 4,103,000 (: 3,236,000) from fellow subsidiaries as guarantees fees. The amount relating to the guarantee fees that remained unpaid at year-end was 2,046,000 (: 1,685,000). The outstanding amount bears no interest and has not been impaired. Dividends The Company received 118,000 (: 89,000) in dividends as disclosed on note 11 on its unlisted investment in Toyota Leasing (Thailand) Co. Ltd. Borrowings The Company s borrowings from fellow subsidiaries during the year are shown below. At 31 March 2015, borrowings from other related companies are all short-term. Reference is made to Note 23 for the terms and conditions of the borrowings. Loans from other related companies 2015 Balance at the beginning of the year 601, ,477 Loans received during the year 1,331,591 2,252,362 Loans repaid during the year (1,285,614) (2,368,738) Interest expense 1,621 5,088 Interest paid (1,473) (5,032) Exchange revaluation of loans from related companies 77,546 (23,576) Total 725, ,581 Lending The summary of loans to fellow subsidiaries and the income and expenses incurred thereon during the year is set out below: Loans to related companies 2015 Balance at the beginning of the year 5,855,157 5,110,242 Loans advanced during the year 4,994,573 6,184,537 Loans received (4,044,165) (5,285,213) Interest charged 98,884 97,036 Interest received (99,243) (97,624) Interest expense (56) - Exchange revaluation of related party company loans 228,394 (153,821) Total 7,033,554 5,855,157 No impairment has been recognised on the amounts outstanding at year-end (see note 14). 28
29 Directors There were no changes in the Board of Management during the year. Transactions with directors There were no transactions with directors during the year. Summary of related party payables included in other liabilities Summary of related party payables included in other liabilities 2015 Credit support fees payable to parent company 4,143 3,174 Business and administration services payable to related companies Total 4,342 3,326 Summary of guarantees and related party receivables Summary of guarantees and related party receivables 2015 Related party receivables for guarantees 2,046 1,686 Total 2,046 1,686 Amounts receivable from related parties have not been impaired. 30. Contingent liabilities The Company issues guarantees to debt holders of other Toyota Motor Corporation subsidiaries. The Company receives guarantee fees from Toyota Motor Corporation subsidiaries in respect of the guaranteed debt in issuance. The Company assesses the need for provisions by reviewing the net assets and profitability of the companies for the year ending 31 March The accounts of the respective debt issuers indicate that there is adequate net equity to cover the borrowings. No provisions have been required against contingent liabilities in either the current or prior fiscal years. Set out below is the Euro equivalent of the guarantees issued in relation to debt issuance by other Toyota Motor Corporation subsidiaries. Contingent liabilities as at 31 March Currency of debt guaranteed 2015 Malaysian Ringgit 25, ,058 South African Rand 312, ,633 Thai Baht 1,394,063 2,037,385 Total 1,731,461 2,464,076 The nature of the guarantees is that they are unconditional guarantees issued to the debt holders. If for any reason the issuer is unable to pay as and when the debt falls due, the Company may be required to repay 29
30 the debt on behalf of the issuer. The guarantees are for bills of exchange, commercial paper, medium-term notes and bank loans. 31. Cash generated from / (used in) operations Cash generated / (used) from operations 2015 Net profit 40,536 13,107 Adjustments for: Depreciation and amortisation Dividends received (118) (89) Taxation 13,556 4,643 Interest income (99,040) (97,281) Interest expense 79,612 81,423 Fair value unrealised gains and losses (503,937) 259,397 Unrealised foreign exchange gains and losses 474,826 (237,114) Changes in working capital: (Increase) / decrease in loans to related companies (950,408) (899,325) (Increase) / decrease in other current assets 138,532 (211,462) Increase / (decrease) in other current liabilities 425,803 (65,324) Total (380,622) (1,152,008) 32. Financial risk management 32.1 Financial risk factors The Company s principal activities are the lending of funds to other subsidiaries of Toyota Financial Services Corporation (the parent company) and acting as a guarantee vehicle for third party debts of other related companies within the Toyota Motor Corporation group. The Company s role as a financing vehicle for Toyota related companies exposes it to a variety of financial risks that include credit risk, liquidity risk, interest rate risk and foreign currency exchange rate risk. The Company has in place a risk management program that seeks to limit the adverse effects on the financial performance of the Company of those risks by matching foreign currency assets and liabilities and through the use of financial instruments, including interest rate swaps, cross-currency swaps and foreign currency contracts, to manage interest rate and foreign currency risk. In respect of the credit risk arising from the market values of derivative contracts to manage market risks, agreements are concluded to exchange collateral with counterparties to mitigate those credit risks. The board of management utilise a risk management policy and receive regular reports from the business to enable prompt identification of financial risks so that appropriate actions may be taken. The Company employs written policies and procedures that specify guidelines for managing foreign exchange risk, interest rate risk, credit risk and the use of financial instruments to manage these risks Foreign exchange risk The Company lends to related Toyota group companies in euro, other continental European currencies, South African Rand, Sterling Pound, Japanese Yen and US Dollars. The Company actively borrows in a number of currencies to meet investor demand for its issued debt. The Company makes use of crosscurrency swaps and forward foreign exchange contracts to match assets and liabilities into specific currency portfolios. The net exposure results in the Company being exposed to foreign exchange risks primarily with respect to Sterling Pound, US Dollars and Japanese Yen. The Company manages its exposure to foreign exchange risk by ensuring that its holdings of financial assets and financial liabilities are matched within each of its four funding currency portfolios, to ensure that any net long or short positions within each currency fall within levels that management consider acceptable. The remaining net exposures at the balance sheet date were as follows: 30
31 Net exposure to foreign exchange risk 2015 Sterling 3,153 62,993 US Dollar 282 1,472 Japanese Yen (10) 3,965 Other 3,089 (287) Total 6,514 68,143 The above exposure represents the present value of future foreign currency cash flows discounted at market interest rates at the balance sheet date. The exposure derives from the net equity investment in the three main foreign currency funding books that the Company uses to provide funding to related parties. The following sensitivity analysis shows the impact on equity, through both Statement of comprehensive income and recognition directly in reserves, of a 5% appreciation and depreciation in the value of the Euro against all other currencies at the balance sheet date. The assumed 5% parallel shift in currency exchange rates has been based on historic average annual change in exchange rates of the key currencies, in which the Company s net assets are invested. Sensitivity analysis of the Statement of comprehensive income and net assets to changes in exchange rates at the balance sheet date is as follows: 2015 Statement of comprehensive income Gain/(Loss) Unrealised reserve Gain/(Loss) Total net equity Gain/(Loss) Statement of comprehensive income Gain/(Loss) Unrealised reserve Gain/(Loss) Total net equity Gain/(Loss) 5 % Euro strengthening 2, ,476 1, ,684 5 % Euro weakening (5,609) (14) (5,623) (6,735) (1) (6,736) 32.3 Interest rate risk The Company has both interest-bearing assets and interest-bearing liabilities. The Company has a policy of maintaining assets and liabilities at floating interest rates. The Company uses swaps, in respect of financial assets, including inter-company lending to manage risk. In respect of borrowing, swaps are used to retain flexibility in the debt capital markets. The interest rate swaps are settled on a bi-annual or quarterly basis with payment or receipt of the difference between the agreed fixed interest rate and the floating interest rate amounts on the principal. Interest rate risk in relation to the Company s related party lending activities is managed by ensuring that any fixed rate funding is swapped into floating rate, with reset dates typically of a three month duration. This interest rate profile broadly matches that of the Company s intra-group loan assets either carrying variable coupons with a three month re-pricing or, where fixed for longer periods, are swapped into three month floating rates. 31
32 Market risk measurement techniques - Interest rate Value at Risk (VaR) The Company applies a Value at Risk methodology (VaR) to estimate the market risk of positions held and the maximum losses expected, based upon a number of assumptions for various changes in market conditions. Senior management set limits on the value of risk that may be accepted, in line with Toyota group global policy, which are then monitored on a regular basis by senior management via an Asset Liability Committee (ALCO). VaR is a statistically based estimate of the potential loss on the current portfolio from adverse market movements. It expresses the maximum amount the Company might lose, but only to a certain level of confidence (95%). The Company s VaR measure is based on market data over the preceding 12 months. Actual outcomes are monitored regularly to test the validity of the assumptions and parameters/factors used in the VaR calculation. The use of this approach does not prevent losses outside of these limits in the event of more significant market movements. As VaR constitutes an integral part of the Company s market risk control regime, VaR limits are reviewed by the Board of Management annually for the trading operations and business units. Actual exposure against limits, together with the VaR for each business unit, is reviewed monthly by the ALCO Year High 2015 Year Low 2015 Year Average March Closing Interest rate VaR Year High Year Low Year Average 31 March Closing Interest rate VaR 1, While the table above details the Company's best estimate of the VaR at each balance sheet date, actual results could differ from estimates, as a number of assumptions are used: - Assumptions are made regarding repayment rates for loans and receivables and projections of future market interest rate changes; - The VaR model assumes a certain holding period until positions can be closed (1 month); - It also assumes that market movements occurring over this holding period will follow a similar pattern to those that have occurred over 1 month periods in the past. The Company's interest rate risk exposure derives from the following financial contracts: 32
33 Interest rate risk exposure at 31 March 2015 Fixed rate Floating rate Noninterest bearing Total Non-current assets Loans to related companies 1,325,975 1,825,664-3,151,639 Available for sale investment related company - - 1,033 1,033 Current assets Loans to related companies 725,710 3,156,195-3,881,905 Receivables from affiliated companies - - 2,046 2,046 Other receivables financial instruments only - 79, ,810 Cash and cash equivalents - 80,625-80,625 Current liabilities ECP - (1,332,372) - (1,332,372) EMTN (616,663) (138,102) - (754,765) Bank loans - (183,732) - (183,732) Loans from related parties - (725,252) - (725,252) Affiliated company accounts payable - - (4,342) (4,342) Other liabilities and accrued expenses - financial instruments only - (460,304) (505) (460,809) Bank overdraft - (2,536) - (2,536) Non-current liabilities EMTN (2,560,981) (234,067) - (2,795,048) Bank loans - (1,107,137) - (1,107,137) Pre-derivative position (a) (1,125,959) 958,682 (1,658) (168,935) Nominal value derivatives (b) 1,125,854 (771,207) ,785 Net interest bearing asset / (liability) position (a)+(b) (105) 187,475 (1,520) 185,850 33
34 Interest rate risk exposure at 31 March Fixed rate Floating rate Noninterest bearing Total Non-current assets Loans to related companies 1,515,684 2,133,794-3,649,478 Available for sale investment related company Current assets Loans to related companies 506,886 1,698,793-2,205,679 Receivables from affiliated companies - - 1,686 1,686 Other receivables financial instruments only - 218, ,600 Cash and cash equivalents - 1,390-1,390 Current liabilities ECP (50,817) (965,024) - (1,015,841) EMTN (577,996) (205,687) - (783,683) Bank loans - (850,263) - (850,263) Loans from related parties - (601,581) - (601,581) Affiliated company accounts payable - - (3,326) (3,326) Other liabilities and accrued expenses - financial instruments only - (35,505) (517) (36,022) Bank overdraft - (1) - (1) Non-current liabilities EMTN (1,890,698) (42,272) - (1,932,970) Bank loans - (574,850) - (574,850) Pre-derivative position (a) (496,941) 777,394 (1,379) 279,074 Nominal value derivatives (b) 447,260 (593,089) 220 (145,609) Net interest bearing asset / (liability) position (a)+(b) (49,681) 184,305 (1,159) 133,465 Short-term borrowing with an original term of less than 6 months is subject to regular interest rate changes on replacement, therefore, short-term funding of this nature is classified as floating rate funding in the above tables Credit risk Counter party exposure from investments, deposits and derivative financial investments is limited to financial institutions with investment-grade credit ratings with more stringent rating thresholds for exposures in excess of 5 years. The amount of exposure to any individual counter-party is subject to a limit, which is reassessed annually. The Company is exposed to credit risk from its activities as a lender and guarantor of Toyota Motor Corporation operating companies third party debts in various geographical locations. While the Company s primary credit risk exposure is default by the related companies to which it lends or issues guarantees to third parties, this risk is mitigated by credit support agreements with its parent and ultimate parent company, whereby they have undertaken to the debt and guarantee holders to maintain the net equity of the Company at a specified level. 34
35 In addition, the Company s lending and guarantee activity is to significant operating entities as part of the Toyota group, and therefore the Company s continuing trading viability is ultimately dependent upon the trading performance of the Toyota Motor Corporation group as a whole. Lending is on an un-subordinated basis, but there are instances where loans are subordinated to assist in meeting regulatory funding requirements of the borrower. Derivatives entered into by the Company exclusively to manage its interest rate and currency risk are traded solely with recognised credit institutions with credit ratings as detailed above. The Company s cash and cash equivalents are held with a selection of banks from a list approved by Toyota Motor Corporation/Toyota Financial Services Corporation within specified limits. The maximum exposure to credit risk from financial instruments at the balance sheet date is as follows: Credit risk 2015 Non-current assets Loans to related companies 3,151,639 3,649,478 Current assets Loans to related companies 3,881,905 2,205,679 Other receivables financial instruments and receivables from affiliated companies 81, ,285 Derivative financial instruments 632, ,804 Cash and cash equivalents 80,625 1,390 Contingent liabilities Guarantees of related party debt 1,731,461 2,464,076 Agreements to exchange collateral in cash have been concluded with several counterparties to mitigate the credit risk arising from the value of derivative financial instruments shown above. At 31 March 2015, the value of cash collateral received, shown as Collateral deposits received in note 25 within Other liabilities and accrued expenses was 460,300,000 (: 35,500,000). Details of the Contingent liabilities are shown in note 30. The maximum single exposure from derivative assets at the balance sheet date to a single counterparty is 78,482,000 (: 11,341,000) and the 3 largest counterparty positions represent 209,225,000 (: 31,861,000) Liquidity risk Liquidity risk is the risk that the Company is unable to meet payment obligations associated with its financial liabilities when they fall due. The Company regularly forecasts short and medium-term funding requirements incorporating information from other related companies and ensures that there is an appropriate level of liquid resources to cover any unforeseen cash requirements. The Company actively maintains a mixture of long-term and short-term debt maturities, together with longterm committed facilities and liquid investments that are designed to ensure the Company has sufficient available funds for operations. The Company maintains committed credit lines with a syndicate of commercial banks to mitigate the liquidity risk. In addition, the Company has entered into a credit support agreement and a supplemental credit support agreement with its parent company in which it will make sufficient funds available to the Company so that the Company will be able to service the obligations arising out of its capital market borrowing and guarantee obligations respectively. The credit support agreement and the supplemental credit support agreement provide for termination by either party upon 30 days written notice to the other party. Such terminations will not take effect until or unless all relevant securities have been repaid or each relevant rating agency has confirmed to the parent company or the Company that the debt ratings of all relevant securities will be unaffected by such termination. 35
36 The following table details the expected maturity of non-derivative financial liabilities. The analysis is based on gross contractual (undiscounted) cash flows payable. Foreign currency cash flows included in the table below have been translated using market rates. Where future interest payments are variable, the cash flows are based on the interest rate index at the balance sheet date. Debt cash flows at 31 March 2015 Due within 3 months Due between 4 and 12 months Due between 1 and 5 years Due after 5 years Related party borrowings 569, , Bank borrowings 184,817 5,595 1,125,518 - Commercial paper 930, , EMTN 304, ,322 3,019,715 - Collateral deposits received 460, Total 2,449,871 1,127,494 4,145,233 - Debt cash flows at 31 March Due within 3 months Due between 4 and 12 months Due between 1 and 5 years Due after 5 years Related party borrowings 412, , Bank borrowings 2, , ,717 - Commercial paper 718, , EMTN 25, ,169 2,093,854 - Collateral deposits received 35, Total 1,194,225 2,262,582 2,675,571 - The following table details the expected maturity of derivative financial instruments. The analysis is based on the gross contractual (undiscounted) cash flows. When the amount payable or receivable is not fixed, the amount disclosed has been determined by reference to current market indices at the reporting date. 36
37 Net cash flows at 31 March 2015 Due within 3 months Due between 4 and 12 months Due between 1 and 5 years Due after 5 years Net settled: Interest derivatives payable / (receivable) 1,717 3,459 4,494 - Gross settled: Currency derivatives receivable (875,894) (1,193,393) (5,494,445) (6,591) Currency derivatives payable 1,043,254 1,128,377 5,168,692 5,555 Total derivative cash flows 169,077 (61,557) (321,259) (1,036) Total 2,618,948 1,065,937 3,823,974 (1,036) Net cash flows at 31 March Due within 3 months Due between 4 and 12 months Due between 1 and 5 years Due after 5 years Net settled: Interest derivatives payable / (receivable) (704) 828 7,237 - Gross settled: Currency derivatives receivable (967,515) (2,079,405) (4,050,542) (72,633) Currency derivatives payable 950,165 2,029,050 4,165,999 67,081 Total derivative cash flows (18,054) (49,527) 122,694 (5,552) Total 1,176,171 2,213,055 2,798,265 (5,552) The Company has extended loan facilities to related parties and to the extent that these loan facilities are undrawn at the balance sheet date this represents a future lending commitment. Potential cash outflows from undrawn loan facilities at the reporting date are shown in the table below at the earliest possible drawn down date. The cash flow effect of probable future related party borrowing requirements is monitored through regular cash flow forecasts provided to the Company by the related parties. Undrawn commitments at 31 March 2015 Due within 3 months Due between 4 and 12 months Due between 1 and 5 years Due after 5 years Undrawn loan commitments 2,710, Total 2,710,
38 Undrawn commitments at 31 March Due within 3 months Due between 4 and 12 months Due between 1 and 5 years Due after 5 years Undrawn loan commitments 3,569, Total 3,569, Price risk The Company is not significantly exposed to equity price risk or commodity price risk Offsetting financial assets and financial liabilities The following financial instruments are subject to enforceable master netting agreements. As at 31 March 2015 Gross amounts of recognised financial assets Gross amounts of recognised financial liabilities Net collateral exchanged Net assets / (liabilities) Derivative financial instruments Collateralized Derivative financial instruments Non-Collateralized 563,313 68,897 (276,267) (1,158) (380,600) - (93,554) 67,739 Total 632,210 (277,425) (380,600) (25,815) As at 31 March Gross amounts of recognised financial assets Gross amounts of recognised financial liabilities Net collateral exchanged Net assets / (liabilities) Derivative financial instruments Collateralized Derivative financial instruments Non Collateralized 147,821 41,983 (307,376) (28,038) 183,100-23,545 13,945 Total 189,804 (335,414) 183,100 37,490 Financial instruments are settled on a gross basis, however, each party to a master netting agreement will have the option to settle all such amounts on a net basis in the event of default of the other party. All financial instruments on the Statement of financial position are shown on a gross basis. 38
39 33. Fair value of financial instruments Fair value is obtained by calculating the amount at which an asset or liability could be exchanged in an arm's length transaction between informed and willing parties other than in a forced liquidation Financial assets and liabilities at fair value in the statement of financial position The table below analyses financial instruments carried at fair value, by valuation method. The different levels have been defined as follows: Level 1 - Quoted prices (unadjusted) in active markets for identical assets and liabilities; Level 2 Inputs other than quoted prices included within level 1 that are observable for the asset or liability, either directly (that is, as prices) or indirectly (that is derived from prices); Level 3 Inputs for the asset or liability that are not based on observable market data (that is, unobservable inputs). 31 March March Level Level 2 Level Total Level Level 2 Level Total '000 Financial Assets Investment in affiliated company Derivative financial instruments Guarantee fee receivable - 1,033-1, , , , ,804-4,860-4,860-3,193-3,193 Financial Liabilities Derivative - 277, , , ,414 financial instruments Related party guarantee - 4,860-4,860-3,193-3,193 There were no transfers between levels 1 and 2 during the year Financial assets and liabilities at carrying value in the statement of financial position The following tables compare the carrying value and fair value of those financial assets and liabilities not presented on the statement of financial position at fair value. 31 March 2015 Level 2 31 March Level 2 Carrying Value Fair value Carrying Value Fair value Financial assets Loans to related parties 7,033,544 7,057,647 5,855,157 5,887,763 Financial liabilities Loans payable group company 725, , , ,735 Loans payable bank 1,290,869 1,306,012 1,425,113 1,435,121 Euro medium term notes 3,549,813 3,640,803 2,716,653 2,743,449 39
40 Financial assets The fair value calculation for loans to related parties is based on discounting expected future cash flows using an estimated discount rate that reflects the expected future interest rates, derived from quoted market rates at the balance sheet date. Early settlements, credit losses and credit spread assumptions are reviewed periodically, but currently are not relevant to this class of asset. Statistical methods are used that divide receivables into segments by type of receivables and contractual term. Financial liabilities The fair value of borrowings is based on current market prices where available. Fair value of EMTN is based on the discounted cash flow model that incorporates observable inputs including interest rate yield curves and the appropriate discount rate for the currency and tenor of the cash flow. Where active market prices are not available, the fair value of fixed interest borrowings is based on future cash flows discounted at the current rate for similar debt or assets with the same remaining maturities. 34. Events occurring after the balance sheet date There are no events after the balance sheet events to disclose. Board of Management Yoriyuki Hirayama Katsunobu Katayama William Kilpatrick 40
41 Other Information Retained Earnings In accordance with Article 21 of the Articles of Association, retained earnings are at the disposal of the shareholder in general meeting. Subject to the Company being in a profitable position, the Board of Management may decide to pay an interim dividend subject to the approval of the shareholder in general meeting. Appropriation of Profit The Board of Management proposed that the profit for the past financial year be added to the retained earnings. Auditor s Report The auditor s report is set out on page

42


43


44
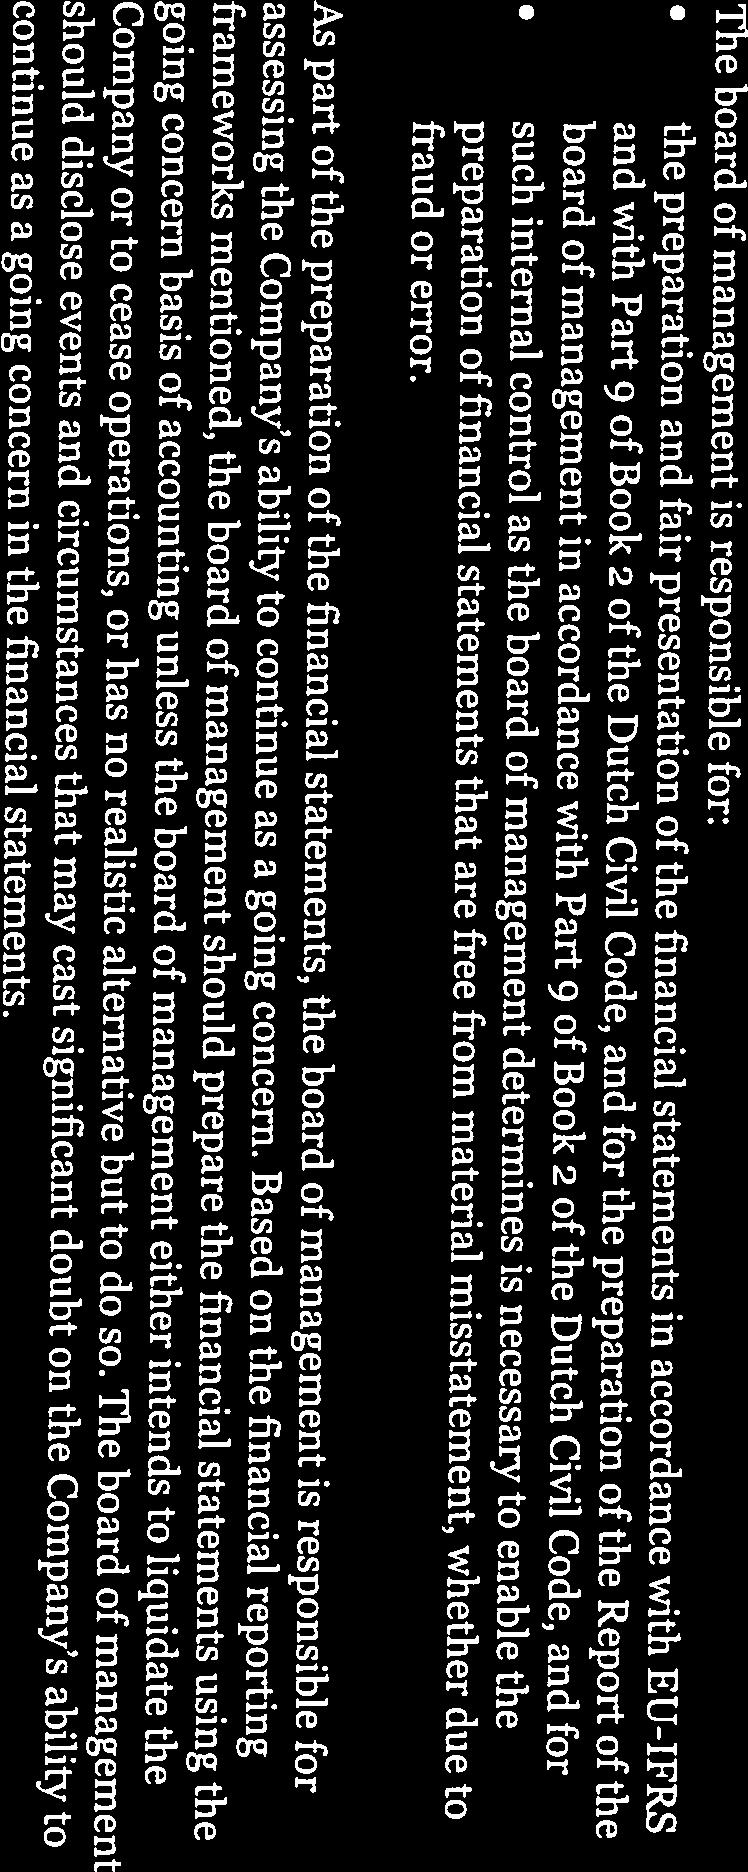
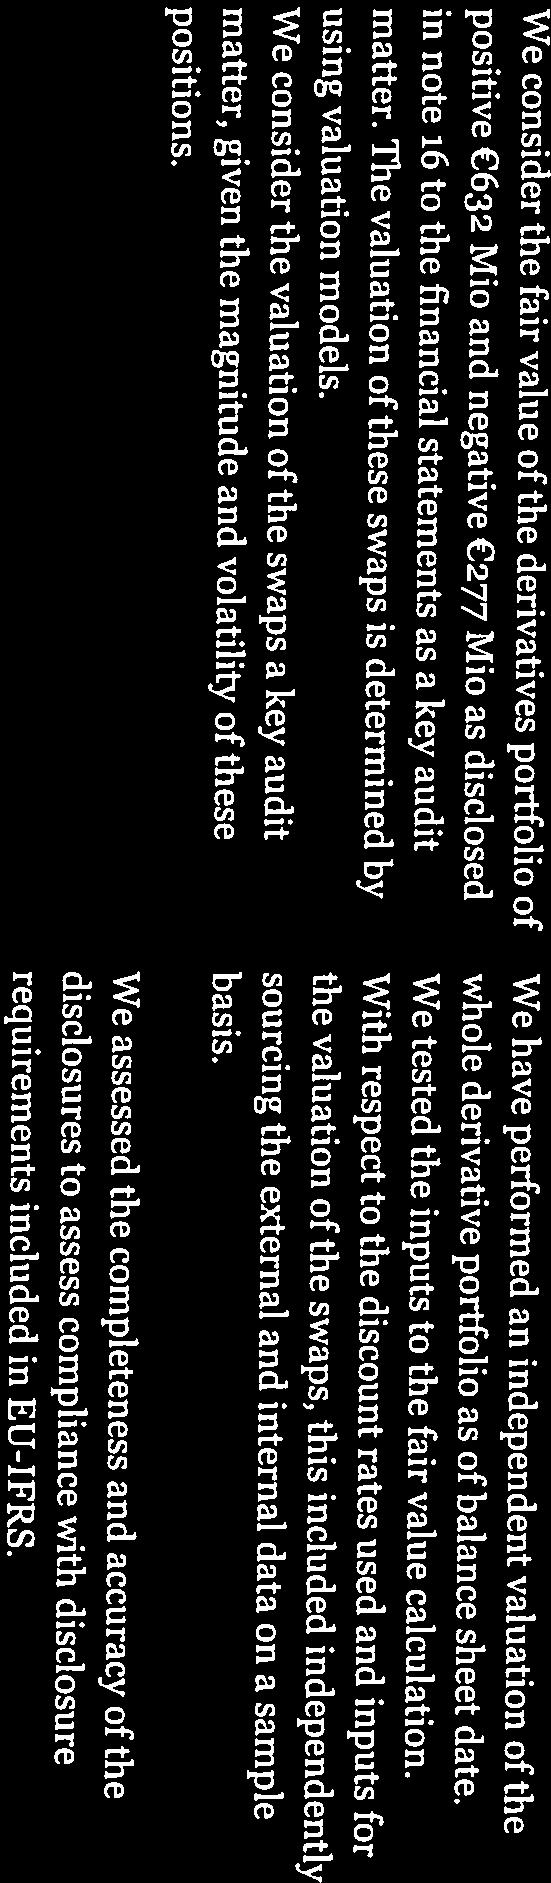
45
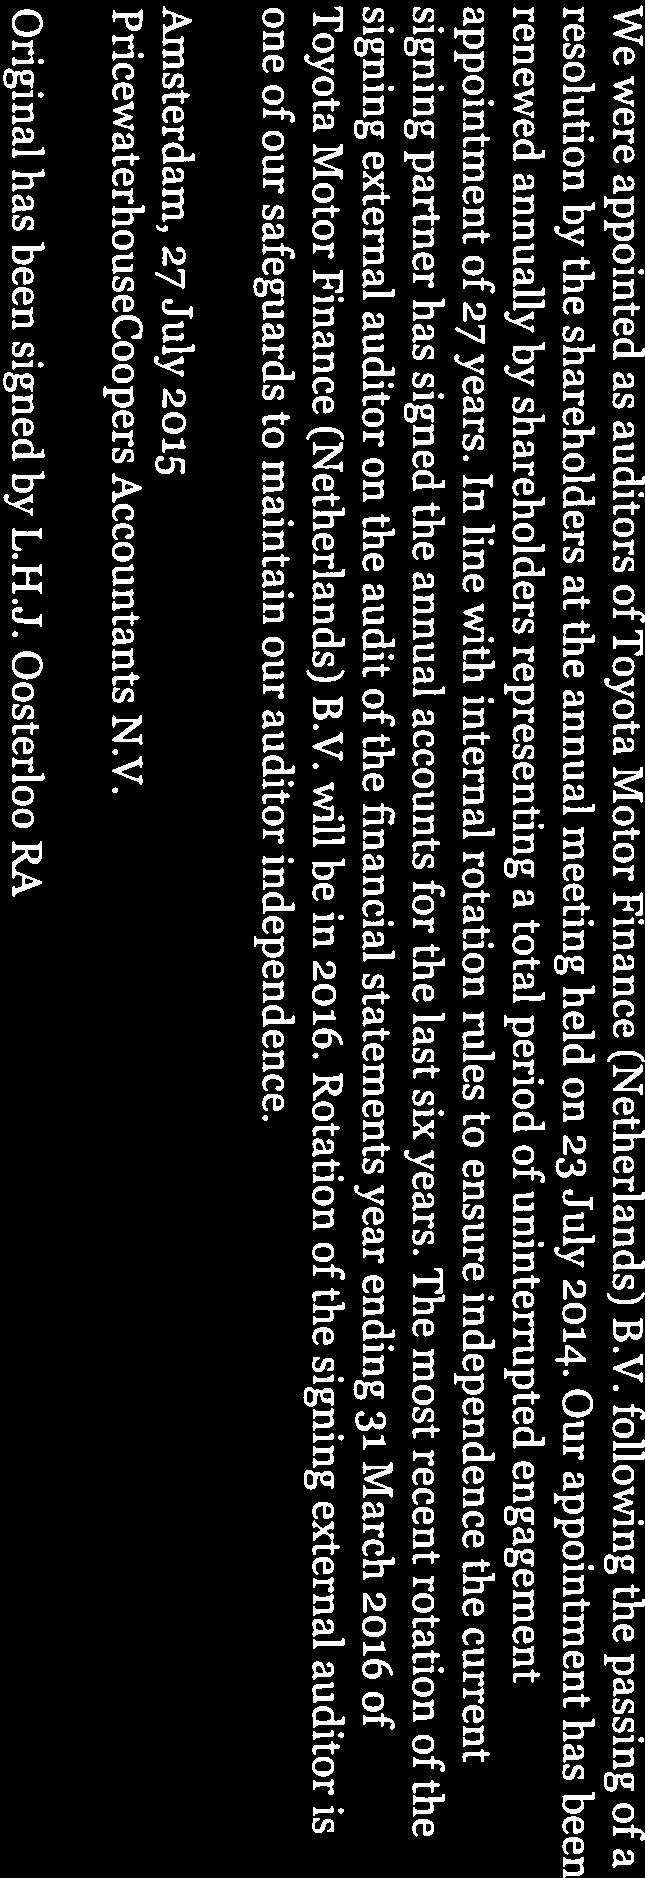
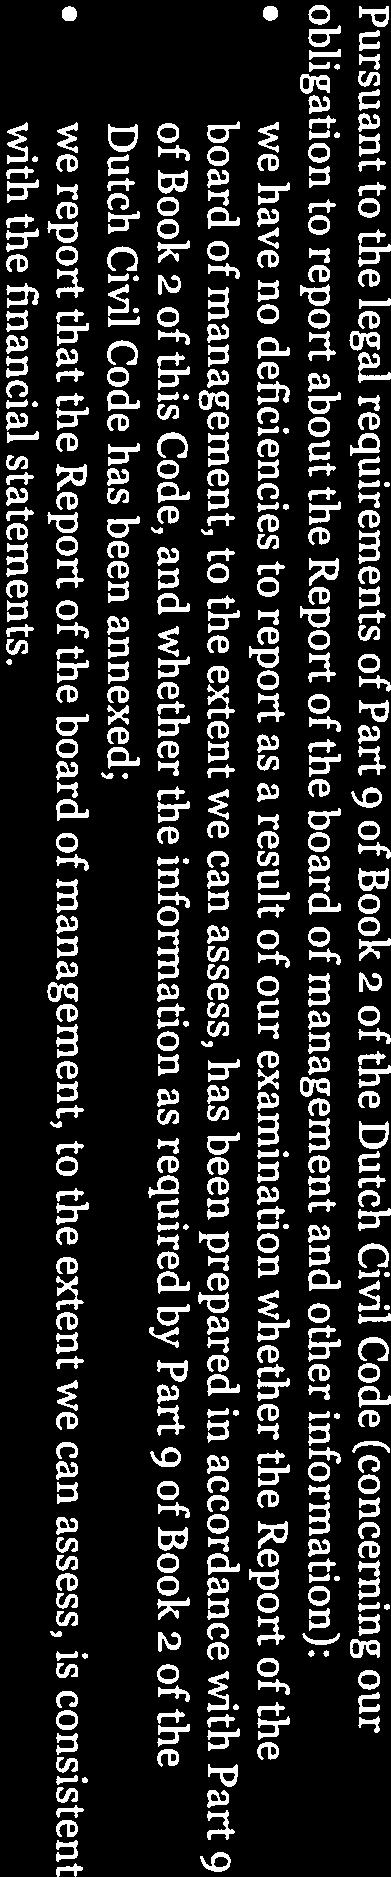
46

47
JAMAICAN TEAS LIMITED CONSOLIDATED FINANCIAL STATEMENTS 30 SEPTEMBER 2015
 CONSOLIDATED FINANCIAL STATEMENTS CONSOLIDATED FINANCIAL STATEMENTS I N D E X PAGE Independent Auditors' Report to the Members 1-2 FINANCIAL STATEMENTS Consolidated Statement of Profit or Loss and Other
LASCO FINANCIAL SERVICES LIMITED FINANCIAL STATEMENTS 31 MARCH 2016
 FINANCIAL STATEMENTS FINANCIAL STATEMENTS I N D E X PAGE Independent Auditors' Report to the Members 1-2 FINANCIAL STATEMENTS Consolidated Statement of Profit or Loss and Other Comprehensive Income 3 Consolidated
Fortis Financial Statements 2007
 Fortis Financial Statements 2007 Fortis Financial Statements 2007 Fortis Consolidated Financial Statements Report of the Board of Directors of Fortis SA/NV and Fortis N.V. Fortis SA/NV Financial Statements
PUBLIC JOINT STOCK COMPANY JOINT STOCK BANK UKRGASBANK Financial Statements. Year ended 31 December 2011 Together with Independent Auditors Report
 PUBLIC JOINT STOCK COMPANY JOINT STOCK BANK UKRGASBANK Financial Statements Year ended 31 December 2011 Together with Independent Auditors Report Contents Independent Auditors Report Statement of financial
Universal Investment Bank AD Skopje. Financial Statements for the year ended 31 December 2007
 for the year ended 31 December 2007 Contents Auditors' report Balance sheet 1 Income statement 2 Statement of changes in equity 3 Statement of cash flows 4 Notes to the financial statement 5 Income
EUROSTANDARD Banka AD Skopje. Consolidated Financial Statements for the year ended 31 December 2007
 Consolidated Financial Statements for the year ended 31 December 2007 Contents Auditors' report Financial Statements Consolidated balance sheet 2 Consolidated income statement 3 Consolidated statement
 - CONSOLIDATED STATEMENT OF PROFIT OR LOSS AND OTHER COMPREHENSIVE INCOME Note 2015 2014 US$ 000s US$ 000s (Restated) Continuing operations Lease revenue 56,932 48,691 Other income 9 3,202 3,435 60,134
Annual Report and Accounts
 /11 Annual Report and Accounts Financial Statements Contents of financial statements Directors statement and independent Auditors report 110 Statement of Directors responsibilities 111 Independent Auditors
Financial Statements. DBS Group HolDinGS ltd and its SuBSiDiarieS. DBS Bank ltd
 FINANCIAL STATEMENTS 123 Financial Statements DBS Group HolDinGS ltd and its SuBSiDiarieS 124 Consolidated income Statement 125 Consolidated Statement of Comprehensive income 126 Balance Sheets 127 Consolidated
JSC MICROFINANCE ORGANIZATION FINCA GEORGIA. Financial statements. Together with the Auditor s Report. Year ended 31 December 2010
 JSC MICROFINANCE ORGANIZATION FINCA GEORGIA Financial statements Together with the Auditor s Report Year ended 31 December 2010 JSC MICROFINANCE ORGANIZATION FINCA Georgia FINANCIAL STATEMENTS Contents:
Consolidated Interim Financial Statements
 M K B B a n k Z r t. G r o u p 10 011 922 641 911 400 statistic code Consolidated Interim Financial Statements Prepared under International Financial Reporting Standards as adopted by the EU Budapest,
DBS GROUP HOLDINGS LTD (Incorporated in Singapore. Registration Number: M) AND ITS SUBSIDIARIES
 AND ITS SUBSIDIARIES") DBS GROUP HOLDINGS LTD (Incorporated in Singapore. Registration Number: 199901152M) AND ITS SUBSIDIARIES FINANCIAL STATEMENTS For the financial year ended 31 December 2014 Financial Statements Table of
DBS GROUP HOLDINGS LTD (Incorporated in Singapore. Registration Number: 199901152M) AND ITS SUBSIDIARIES FINANCIAL STATEMENTS For the financial year ended 31 December 2014 Financial Statements Table of
Statement of profit or loss for the year ended 31 March 2018 (Expressed in United States dollars)
") Statement of profit or loss for the year ended 31 March 2018 (Expressed in United States dollars) Note Interest income 4(a) 32,407,110 29,988,115 Interest expense 4(b) (9,879,516) (7,319,963) Net interest
Statement of profit or loss for the year ended 31 March 2018 (Expressed in United States dollars) Note Interest income 4(a) 32,407,110 29,988,115 Interest expense 4(b) (9,879,516) (7,319,963) Net interest
In $ millions Note
 DBS BANK LTD AND ITS SUBSIDIARIES CONSOLIDATED INCOME STATEMENTS FOR THE YEAR ENDED 31 DECEMBER 2006 Group In $ millions Note 2006 2005 2006 2005 Income Interest income 7,809 5,542 5,324 3,774 Interest
ACCOUNTING POLICIES Year ended 31 March The numbers
 ACCOUNTING POLICIES Year ended 31 March 2015 Basis of preparation The consolidated and Company financial statements have been prepared on a historical cost basis. They are presented in sterling and all
LASCO DISTRIBUTORS LIMITED FINANCIAL STATEMENTS 31 MARCH 2016
 FINANCIAL STATEMENTS FINANCIAL STATEMENTS I N D E X PAGE Independent Auditors Report to the Members 1-2 FINANCIAL STATEMENTS Statement of Profit or Loss and Other Comprehensive Income 3 Statement of Financial
ST. KITTS-NEVIS-ANGUILLA NATIONAL BANK LIMITED
 Consolidated balance sheet As of June 30, 2013 ASSETS Notes Cash and balances with Central Bank 6 355,574 254,466 Treasury bills 7 137,962 99,179 Deposits with other financial institutions 8 526,884 418,865
K.L.E. GROUP LIMITED FINANCIAL STATEMENTS 31 DECEMBER 2017
 FINANCIAL STATEMENTS FINANCIAL STATEMENTS I N D E X Independent Auditors Report to the Members 1-5 FINANCIAL STATEMENTS Statement of Profit or Loss and Other Comprehensive Income 6 Statement of Financial
Bank Muscat (SAOG) NOTES TO THE CONSOLIDATED FINANCIAL STATEMENTS YEAR ENDED 31 DECEMBER 2012
 NOTES TO THE CONSOLIDATED FINANCIAL STATEMENTS YEAR ENDED 31 DECEMBER 2012") YEAR ENDED 1 LEGAL STATUS AND PRINCIPAL ACTIVITIES Bank Muscat (SAOG) (the Bank or the Parent Company) is a joint stock company incorporated in the Sultanate of Oman and is engaged in commercial and investment
YEAR ENDED 1 LEGAL STATUS AND PRINCIPAL ACTIVITIES Bank Muscat (SAOG) (the Bank or the Parent Company) is a joint stock company incorporated in the Sultanate of Oman and is engaged in commercial and investment
Xanthus Holdings p.l.c.
 Xanthus Holdings p.l.c. 168 St. Christopher Street Valetta VLT1467 / Malta interim consolidated financial statements for the period from 21 st March to 30 th June 2011 Xanthus Holdings p.l.c, Malta Interim
Financial Statements. First Nations Bank of Canada October 31, 2017
 Financial Statements First Nations Bank of Canada Independent auditors report To the Shareholders of First Nations Bank of Canada We have audited the accompanying financial statements of First Nations
JAMAICAN TEAS LIMITED CONSOLIDATED FINANCIAL STATEMENTS 30 SEPTEMBER 2017
 CONSOLIDATED FINANCIAL STATEMENTS CONSOLIDATED FINANCIAL STATEMENTS I N D E X PAGE Independent Auditors' Report to the Members 1-4 FINANCIAL STATEMENTS Consolidated Statement of Profit or Loss and Other
Consolidated Financial Statements HSBC Bank Bermuda Limited
 2011 Consolidated Financial Statements HSBC Bank Bermuda Limited Consolidated Financial Statements and Audit Report for the year ended 31 December 2011 Contents Page Independent Auditors Report... 1 Consolidated
OJSC Nordea Bank. International Financial Reporting Standards Unconsolidated Financial Statements and Auditors Report.
 International Financial Reporting Standards Unconsolidated Financial Statements and Auditors Report 31 December 2012 CONTENTS AUDITORS REPORT UNCONSOLIDATED FINANCIAL STATEMENTS Unconsolidated Statement
UNITED BANK FOR AFRICA PLC. Consolidated and Separate Financial Statements for the 6 months ended 30 June 2013 (Un-audited)
") UNITED BANK FOR AFRICA PLC Consolidated and Separate Financial Statements for the 6 months ended 30 June 2013 (Un-audited) UNITED BANK FOR AFRICA PLC SIGNIFICANT ACCOUNTING POLICIES 1 Reporting entity
UNITED BANK FOR AFRICA PLC Consolidated and Separate Financial Statements for the 6 months ended 30 June 2013 (Un-audited) UNITED BANK FOR AFRICA PLC SIGNIFICANT ACCOUNTING POLICIES 1 Reporting entity
Notes to the Consolidated Accounts For the year ended 31 December 2017
 National Express Group PLC Annual Report Financial Statements 119 Notes to the Consolidated Accounts 1 Corporate information The Consolidated Financial Statements of National Express Group PLC and its
FINANCIAL STATEMENTS CONSOLIDATED BALANCE SHEET PROVISIONS CONSOLIDATED INCOME STATEMENT TRADE AND OTHER PAYABLES 84
 56 AALBERTS INDUSTRIES N.V. ANNUAL REPORT 2015 1. CONSOLIDATED BALANCE SHEET 58 18. PROVISIONS 81 2. CONSOLIDATED INCOME STATEMENT 59 19. TRADE AND OTHER PAYABLES 84 3. CONSOLIDATED STATEMENT OF COMPREHENSIVE
NASCON ALLIED INDUSTRIES PLC. Unaudited Financial Statements
 Unaudited Financial Statements Unaudited Financial Statements CONTENTS PAGE Statement of Profit or Loss and Other Comprehensive income 2 Statement of Financial Position 3 Statement of Changes in Equity
Ameriabank cjsc. Financial Statements For the second quarter of 2016
 Financial Statements For the second quarter of Contents Statement of profit or loss and other comprehensive income... 3 Statement of financial position... 4 Statement of cash flows... 5 Statement of changes
DBS BANK LTD (Incorporated in Singapore. Registration Number: E) AND ITS SUBSIDIARIES
 AND ITS SUBSIDIARIES") DBS BANK LTD (Incorporated in Singapore. Registration Number: 196800306E) AND ITS SUBSIDIARIES ANNUAL REPORT For the financial year ended 31 December 2011 Financial Statements Table of Contents Financial
DBS BANK LTD (Incorporated in Singapore. Registration Number: 196800306E) AND ITS SUBSIDIARIES ANNUAL REPORT For the financial year ended 31 December 2011 Financial Statements Table of Contents Financial
Alpha Bank AD Skopje. Financial Statements for the year ended 31 December 2007
 for the year ended 31 December 2007 Contents Auditors' report Balance sheet 2 Income statement 3 Statement of changes in equity 4 Statement of cash flows 5 Notes to the financial statement 6 Balance sheet
BLUESCOPE STEEL LIMITED FINANCIAL REPORT 2011/2012
 BLUESCOPE STEEL LIMITED FINANCIAL REPORT / ABN 16 000 011 058 Annual Financial Report - Page Financial statements Statement of comprehensive income 2 Statement of financial position 3 Statement of changes
Selecta Group B.V. and its subsidiaries, Amsterdam (The Netherlands)
") Selecta Group B.V. and its subsidiaries, Amsterdam (The Netherlands) Consolidated financial statements for the year ended 30 September and report of the independent auditor Table of Contents Consolidated
Selecta Group B.V. and its subsidiaries, Amsterdam (The Netherlands) Consolidated financial statements for the year ended 30 September and report of the independent auditor Table of Contents Consolidated
INFORMA 2017 FINANCIAL STATEMENTS 1
 INFORMA 2017 FINANCIAL STATEMENTS 1 GENERAL INFORMATION This document contains Informa s Consolidated Financial Statements for the year ending 31 December 2017. These are extracted from the Group s 2017
NASCON ALLIED INDUSTRIES PLC. Financial Statements
 Financial Statements Financial Statements CONTENTS PAGE Statement of profit or loss and other comprehensive income 2 Statement of financial position 3 Statement of changes in equity 4 Statement of cash
Balsan / Carpet tiles
 Balsan / Carpet tiles Financial report I. Definitions 47 II. Financial statements 48 III. Notes to the consolidated financial statements for the year ended 30 November 2005 54 IV. Statutory auditor s report
Notes to the Accounts
 Notes to the Accounts 1. Accounting Policies Statement of compliance The Group financial statements consolidate those of the Company and its subsidiaries (together referred to as the Group ), equity account
Accounting policies extracted from the 2016 annual consolidated financial statements
 Steinhoff International Holdings N.V. (Steinhoff N.V.) is a Netherlands registered company with tax residency in South Africa. The consolidated annual financial statements of Steinhoff N.V. for the period
ING Bank (Eurasia) ZAO Financial Statements
 ZAO Financial Statements") Financial Statements Year ended 31 December 2008 Together with Independent Auditors Report CONTENTS INDEPENDENT AUDITORS REPORT Balance sheet... 1 Income statement... 2 Statement of changes in equity...
Financial Statements Year ended 31 December 2008 Together with Independent Auditors Report CONTENTS INDEPENDENT AUDITORS REPORT Balance sheet... 1 Income statement... 2 Statement of changes in equity...
NOTES TO THE FINANCIAL STATEMENTS
 NOTES TO THE FINANCIAL STATEMENTS 1. ACCOUNTING POLICIES 1.1 Nature of business Super Group Limited (Registration number 1943/016107/06), the holding Company (the Company) of the Group, is a Company listed
Independent Auditor s Report To the Members of Stobart Group Limited
 Financial Statements Independent Auditor s Report To the Members of Stobart Group Limited We have audited the Group financial statements of Stobart Group Limited for the year ended 28 February 2009 which
Tirana Bank sh.a. Financial Statements as of and for the year ended 31 December 2016
 Financial Statements as of and for the year ended 31 December 2016 TABLE OF CONTENT AUDITOR S REPORT STATEMENT OF PROFIT OR LOSS AND OTHER COMPREHENSIVE INCOME 8 STATEMENT OF FINANCIAL POSITION 9 STATEMENT
Notes to the financial statements appendices
 A5 ACCOUNTING POLICIES Basis of consolidation The group financial statements consolidate the financial statements of the company and entities controlled by the company (its subsidiaries), and incorporate
Piraeus Bank ICB International Financial Reporting Standards Financial Statements and Independent Auditor s Report 31 December 2010
 International Financial Reporting Standards Financial Statements and Independent Auditor s Report 31 December 2010 CONTENTS INDEPENDENT AUDITOR S REPORT FINANCIAL STATEMENTS Statement of Financial Position...
BANK MELLI IRAN BAKU BRANCH
 BANK MELLI IRAN BAKU BRANCH 31 December 2013 Financial Statements in accordance with International Financial Reporting Standards and Independent Auditor s Report TABLE OF CONTENTS Independent Auditor s
Independent Auditor s report to the members of Standard Chartered PLC
 Financial statements and notes Independent Auditor s report to the members of Standard Chartered PLC For the year ended 31 December We have audited the financial statements of the Group (Standard Chartered
UNITED BANK FOR AFRICA PLC
 UNITED BANK FOR AFRICA PLC Consolidated Financial Statements for the nine months ended 30 September 2015 UNITED BANK FOR AFRICA PLC NOTES TO THE FINANCIAL STATEMENTS UNITED BANK FOR AFRICA PLC SIGNIFICANT
Barita Unit Trusts Management Company Limited. Financial Statements 30 September 2014
 Barita Unit Trusts Management Company Limited Financial Statements Barita Unit Trusts Management Company Limited Index Independent Auditors Report to the Members Page Financial Statements Statement of
 STATEMENT OF PROFIT OR LOSS For the year ended 31 December 2014 Financial statements Note 2014 2013 Interest income Cash and cash equivalents 893,744 506,424 Loans to customers 1,020,693 440,642 Amounts
STRUCTURED CONNECTIVITY SOLUTIONS (PTY) LTD (Registration number 2002/001640/07) Historical FInancial Information for the year ended 31 August 2012
 LTD (Registration number 2002/001640/07) Historical FInancial Information for the year ended 31 August 2012") STRUCTURED CONNECTIVITY SOLUTIONS (PTY) LTD Historical FInancial Information for the year ended 31 August 2012 Index The reports and statements set out below comprise the historical financial information
STRUCTURED CONNECTIVITY SOLUTIONS (PTY) LTD Historical FInancial Information for the year ended 31 August 2012 Index The reports and statements set out below comprise the historical financial information
A7 Accounting policies
 A7 Accounting policies Of the accounting policies outlined below, those deemed to be the most significant for the group are those that align with the critical accounting judgements and key sources of estimation
Notes to the Financial Statements
 85 Notes to the Financial Statements for the year ended 31 December 2010 These Notes are integral to the financial statements. The consolidated financial statements for the year ended 31 December 2010
NOTES TO THE GROUP ANNUAL FINANCIAL STATEMENTS FOR THE YEAR ENDED 30 SEPTEMBER 2014
 14 NOTES TO THE GROUP ANNUAL FINANCIAL STATEMENTS 1. ACCOUNTING POLICIES The financial statements are presented in South African Rand, unless otherwise stated, rounded to the nearest million, which is
The Hongkong and Shanghai Banking Corporation Limited, Bangkok Branch
 The Hongkong and Shanghai Banking Corporation Limited, Bangkok Branch Financial statements for the year ended 31 December 2013 and Independent Auditor s Report Note Contents 1 General information
Suntory Holdings Limited and its Subsidiaries
 Suntory Holdings Limited and its Subsidiaries Consolidated Financial Statements for the Year Ended December 31, 2017, and Independent Auditor's Report Consolidated statement of financial position Suntory
Continuing operations Revenue 3(a) 464, ,991. Revenue 464, ,991
 464, ,991. Revenue 464, ,991") STATEMENT OF PROFIT OR LOSS For the year ended 30 June 2017 Consolidated Consolidated Note Continuing operations Revenue 3(a) 464,411 323,991 Revenue 464,411 323,991 Other Income 3(b) 4,937 5,457 Share
STATEMENT OF PROFIT OR LOSS For the year ended 30 June 2017 Consolidated Consolidated Note Continuing operations Revenue 3(a) 464,411 323,991 Revenue 464,411 323,991 Other Income 3(b) 4,937 5,457 Share
STATEMENT OF COMPREHENSIVE INCOME
 FINANCIAL REPORT STATEMENT OF COMPREHENSIVE INCOME for the year ended 30 June 2014 Notes $ 000 $ 000 Revenue Sale of goods 2 697,319 639,644 Services 2 134,776 130,182 Other 5 1,500 1,216 833,595 771,042
Unaudited consolidated interim financial statements and independent auditor s review report BORETS INTERNATIONAL LIMITED 30 June 2015
 Unaudited consolidated interim financial statements and independent auditor s review report BORETS INTERNATIONAL LIMITED 30 June 2015 Contents Independent Auditor s Review Report Unaudited Consolidated
Financial statements. DBS Group Holdings Ltd and its Subsidiaries. DBS Bank Ltd
 Financial statements DBS Group Holdings Ltd and its Subsidiaries 121 Consolidated Income Statement 122 Consolidated Statement of Comprehensive Income 123 Balance Sheets 124 Consolidated Statement of Changes
NASCON ALLIED INDUSTRIES PLC. Unaudited Financial Statements
 Unaudited Financial Statements Unaudited Financial Statements CONTENTS PAGE Statement of Profit or Loss and Other Comprehensive Income 2 Statement of Financial Position 3 Statement of Changes in Equity
For personal use only
 31 ST MARCH AUDITORS REPORT INDEPENDENT AUDITORS REPORT TO THE SHAREHOLDERS OF TRILOGY INTERNATIONAL LIMITED Report on the Financial Statements We have audited the financial statements of Trilogy International
Notes to the consolidated financial statements for the year ended 30 June 2017
 Notes to the consolidated financial statements for the year ended 30 June 2017 1 Principal accounting policies Hansard Global plc ( the Company ) is a limited liability company, incorporated in the Isle
OUR GOVERNANCE. The principal subsidiary undertakings of the Company at 3 April 2015 are detailed in note 4 to the Company balance sheet on page 109.
 STRATEGIC REPORT OUR GOVERNANCE FINANCIAL STATEMENTS SHAREHOLDER INFORMATION POLICIES GENERAL INFORMATION Halfords Group plc is a company domiciled in the United Kingdom. The consolidated financial statements
For personal use only
 PRELIMINARY FINAL REPORT RULE 4.3A APPENDIX 4E APN News & Media Limited ABN 95 008 637 643 Preliminary final report Full year ended 31 December Results for Announcement to the Market As reported Revenue
1 st National Bank St. Lucia Limited (formerly St. Lucia Co-operative Bank Limited)
") 1 st National Bank St. Lucia Limited (formerly St. Lucia Co-operative Bank Limited) Financial Statements March 29, 2005 Auditors Report To the Shareholders of We have audited the accompanying balance sheet
1 st National Bank St. Lucia Limited (formerly St. Lucia Co-operative Bank Limited) Financial Statements March 29, 2005 Auditors Report To the Shareholders of We have audited the accompanying balance sheet
financial statements 2017
 financial statements 2017 1. Consolidated balance sheet 60 18. Provisions 84 2. Consolidated income statement 61 19. Trade and other payables 87 3. Consolidated statement of comprehensive income 62 20.
Introduction Consolidated statement of comprehensive income for the year ended 31 December 20XX... 6
 PKF International Limited administers a network of legally independent member firms which carry on separate businesses under the PKF Name. PKF International Limited is not responsible for the acts or omissions
General notes to the consolidated financial statements
 80 ARCADIS Financial Statements 2013 General notes to the consolidated financial statements General notes to the consolidated financial statements 1 General information ARCADIS NV is a public company organized
Open Joint Stock Company Raiffeisen Bank Aval Consolidated Financial Statements
 Open Joint Stock Company Raiffeisen Bank Aval Consolidated Financial Statements Year ended 31 December Together with Independent Auditors Report Consolidated Financial Statements CONTENTS INDEPENDENT AUDITORS
The notes on pages 7 to 59 are an integral part of these consolidated financial statements
 CONSOLIDATED BALANCE SHEET As at 31 December Restated Restated Notes 2013 $'000 $'000 $'000 ASSETS Non-current Assets Investment properties 6 68,000 68,000 - Property, plant and equipment 7 302,970 268,342
Directors Report 3. Income Statements 4. Statements of Changes in Equity 5. Balance Sheets 6. Statements of Cash Flows 7-8
 Rakon Limited Annual Report 2009 Table of Contents Directors Report 3 Income Statements 4 Statements of Changes in Equity 5 Balance Sheets 6 Statements of Cash Flows 7-8 Notes to Financial Statements
Commercial Bank J.P. Morgan Bank International (Limited Liability Company) International Financial Reporting Standards Financial Statements and
 International Financial Reporting Standards Financial Statements and") Commercial Bank J.P. Morgan Bank International (Limited Liability Company) International Financial Reporting Standards Financial Statements and Independent Auditor s Report 31 December 2014 CONTENTS INDEPENDENT
Commercial Bank J.P. Morgan Bank International (Limited Liability Company) International Financial Reporting Standards Financial Statements and Independent Auditor s Report 31 December 2014 CONTENTS INDEPENDENT
BANK VTB (AZERBAIJAN) OPEN JOINT STOCK COMPANY
 OPEN JOINT STOCK COMPANY") BANK VTB (AZERBAIJAN) OPEN JOINT STOCK COMPANY The International Financial Reporting Standards Financial Statements and Independent Auditors Report For the Year Ended 2010 TABLE OF CONTENTS Page STATEMENT
BANK VTB (AZERBAIJAN) OPEN JOINT STOCK COMPANY The International Financial Reporting Standards Financial Statements and Independent Auditors Report For the Year Ended 2010 TABLE OF CONTENTS Page STATEMENT
JSC VTB Bank (Georgia) Consolidated financial statements
 Consolidated financial statements") Consolidated financial statements For the year ended 31 December 2017 together with independent auditor s report 2017 consolidated financial statements Contents Independent auditor s report Consolidated
Consolidated financial statements For the year ended 31 December 2017 together with independent auditor s report 2017 consolidated financial statements Contents Independent auditor s report Consolidated
1 SIGNIFICANT ACCOUNTING POLICIES The principal accounting policies adopted in the preparation of these financial statements as set out below have
 1 SIGNIFICANT ACCOUNTING POLICIES The principal accounting policies adopted in the preparation of these financial statements as set out below have been applied consistently to all periods presented in
ICAP plc Annual Report 2016 FINANCIAL STATEMENTS. Strategic report. Page number
 FINANCIAL STATEMENTS ICAP plc Annual Report 77 Strategic report Page number Consolidated income statement 78 Consolidated statement of comprehensive income 80 Consolidated and Company balance sheet 81
May & Baker Nig Plc RC. UNAUDITED CONSOLIDATED FINANCIAL STATEMENTS 31 MARCH 2017
 ` May & Baker Nig Plc RC. 558 UNAUDITED CONSOLIDATED FINANCIAL STATEMENTS 31 MARCH 2017 UNAUDITED CONSOLIDATED STATEMENT OF PROFIT OR LOSS AND OTHER COMPREHENSIVE INCOME Note Continuing operations Revenue
UNITED BANK FOR AFRICA PLC. Consolidated Financial Statements for the Quarter Ended 31 March 2014 (Un-audited )
") Consolidated Financial Statements for the Quarter Ended 31 March 2014 (Un-audited ) NOTES TO THE FINANCIAL STATEMENTS UNITED BANK FOR AFRICA PLC SIGNIFICANT ACCOUNTING POLICIES 1 (i) Basis of preparation
Consolidated Financial Statements for the Quarter Ended 31 March 2014 (Un-audited ) NOTES TO THE FINANCIAL STATEMENTS UNITED BANK FOR AFRICA PLC SIGNIFICANT ACCOUNTING POLICIES 1 (i) Basis of preparation
The consolidated financial statements of WPP plc
 Our 2011 financial statements Accounting policies The consolidated financial statements of WPP plc and its subsidiaries (the Group) for the year ended 31 December 2011 have been prepared in accordance
Significant Accounting Policies
 50 Low & Bonar Annual Report 2009 Significant Accounting Policies General information Low & Bonar PLC (the Company ) is a company domiciled in Scotland and incorporated in the United Kingdom under the
Frontier Digital Ventures Limited
 Frontier Digital Ventures Limited Significant accounting policies This note provides a list of the significant accounting policies adopted in the preparation of these consolidated financial statements
Joint Stock Company The State Export-Import Bank of Ukraine Consolidated Financial Statements
 Joint Stock Company The State Export-Import Bank of Ukraine Consolidated Financial Statements Year ended 31 December 2006 Together with Independent Auditors Report 2006 Consolidated Financial Statements
OAO Scientific Production Corporation Irkut
 Consolidated Financial Statements for the year ended 31 December 2011 Consolidated Financial Statements for the year ended 31 December 2011 Contents Independent Auditors Report 3 Consolidated Income Statement
HSBC Bank Middle East Limited - UAE Operations Financial statements As at and for the year ended 31 December 2010
 Financial statements As at and for the year ended 31 December 2010 Financial statements As at and for the year ended 31 December 2010 Contents Independent auditors' report Page 1 Statement of income 2
Georgian Leasing Company LLC Consolidated financial statements
 Consolidated financial statements For the year ended 31 December 2015 together with the independent auditors report Consolidated financial statements Contents Independent auditors report Consolidated statement
DBS BANK LTD. (Incorporated in Singapore. Registration Number: E) AND ITS SUBSIDIARIES
 AND ITS SUBSIDIARIES") DBS BANK LTD. (Incorporated in Singapore. Registration Number: 196800306E) AND ITS SUBSIDIARIES FINANCIAL STATEMENTS For the financial year ended 31 December 2016 20B 0BFinancial Statements Table of Contents
DBS BANK LTD. (Incorporated in Singapore. Registration Number: 196800306E) AND ITS SUBSIDIARIES FINANCIAL STATEMENTS For the financial year ended 31 December 2016 20B 0BFinancial Statements Table of Contents
Girişim Faktoring Anonim Şirketi
 Girişim Faktoring Anonim Şirketi Table of Contents Independent Auditors Report Statement of Financial Position Statement of Comprehensive Income Statement of Changes in Equity Statement of Cash Flows Statement
Union Bank of Nigeria Plc
 Consolidated Interim Financial Statements For the period ended 31 March 2013 Table of Contents Consolidated financial statements Page Consolidated financial statements: Consolidated statement of financial
AzerTurkBank OJSC. International Financial Reporting Standards Financial Statements and Independent Auditor s Report
 AzerTurkBank OJSC International Financial Reporting Standards Financial Statements and Independent Auditor s Report 31 December 2013 CONTENTS INDEPENDENT AUDIT OPINION FINANCIAL STATEMENTS Statement of
2007 Financial Statements. Consolidated Financial Statements of the Nestlé Group Financial Statements of Nestlé S.A.
 2007 Financial Statements Consolidated Financial Statements of the Nestlé Group Financial Statements of Nestlé S.A. Consolidated Financial Statements of the Nestlé Group Principal exchange rates...2 Consolidated
Abbreviated financial statement of Bank Zachodni WBK SA
 Abbreviated financial statement of Bank Zachodni WBK SA 1. Income statement of Bank Zachodni WBK S.A... 3 2. Balance sheet of Bank Zachodni WBK S.A.... 4 3. Movements on equity of Bank Zachodni WBK S.A...
Independent Auditors Report - to the members 1. Consolidated Statement of Financial Position 2. Consolidated Statement of Comprehensive Income 3
 AND ITS SUBSIDIARIES CONTENTS Independent Auditors Report - to the members 1 Page FINANCIAL STATEMENTS Consolidated Statement of Financial Position 2 Consolidated Statement of Comprehensive Income 3 Consolidated
Consolidated financial statements for the year ended December 31 st, In accordance with International Financial Reporting Standards («IFRS»)
") INFO-QUEST S.A. Consolidated financial statements for the year ended December 31 st, 2009 In accordance with International Financial Reporting Standards («IFRS») The attached financial statements have
INFO-QUEST S.A. Consolidated financial statements for the year ended December 31 st, 2009 In accordance with International Financial Reporting Standards («IFRS») The attached financial statements have
NEIMETH INTERNATIONAL PHARMACEUTICALS PLC UNAUDITED FINANCIAL STATEMENTS 31 DECEMBER 2018
 UNAUDITED FINANCIAL STATEMENTS 31 DECEMBER 2018 FINANCIAL STATEMENTS AS AT QUARTER ENDED 31 DECEMBER 2018 Contents Page Statement of financial position 1 Statement of profit or loss and other comprehensive
The Hongkong and Shanghai Banking Corporation Limited, Bangkok Branch. Annual financial statements and Audit Report of Certified Public Accountant
 The Hongkong and Shanghai Banking Corporation Limited, Bangkok Branch Annual financial statements and Audit Report of Certified Public Accountant For the years ended 31 December 2011 and 2010 Statements
Income Statements...39 Statements of Recognised Income and Expense...40 Balance Sheets...41 Statements of Cash Flows...42
 38 GWA INTERNATIONAL LIMITED 2007 ANNUAL REPORT CONTENTS Income Statements...39 Statements of Recognised Income and Expense...40 Balance Sheets...41 Statements of Cash Flows...42 Note 1 Significant accounting
JSC ASIAСREDIT BANK (АЗИЯКРЕДИТ БАНК) Financial Statements for the year ended 31 December 2012
 Financial Statements for the year ended 31 December 2012") JSC ASIAСREDIT BANK (АЗИЯКРЕДИТ БАНК) Financial Statements for the year ended 31 December CONTENTS STATEMENT OF MANAGEMENT S RESPONSIBILITIES FOR THE PREPARATION AND APPROVAL OF THE FINANCIAL STATEMENTS
JSC ASIAСREDIT BANK (АЗИЯКРЕДИТ БАНК) Financial Statements for the year ended 31 December CONTENTS STATEMENT OF MANAGEMENT S RESPONSIBILITIES FOR THE PREPARATION AND APPROVAL OF THE FINANCIAL STATEMENTS
BANCA INTESA (CLOSED JOINT-STOCK COMPANY) Consolidated financial statements. Year ended 31 December 2013 Together with Auditors report
 Consolidated financial statements. Year ended 31 December 2013 Together with Auditors report") BANCA INTESA (CLOSED JOINT-STOCK COMPANY) Consolidated financial statements Year ended 31 December 2013 Together with Auditors report BANCA INTESA (CLOSED JOINT-STOCK COMPANY) 2013 Consolidated financial
BANCA INTESA (CLOSED JOINT-STOCK COMPANY) Consolidated financial statements Year ended 31 December 2013 Together with Auditors report BANCA INTESA (CLOSED JOINT-STOCK COMPANY) 2013 Consolidated financial
RBC Trust (Trinidad & Tobago) Limited. Financial Statements 31 October 2011
 Limited. Financial Statements 31 October 2011") Financial Statements Contents Page Statement of management responsibilities I Independent auditors' report 2 Statement of financial position 3 Statement of comprehensive income 4 Statement of changes in
Financial Statements Contents Page Statement of management responsibilities I Independent auditors' report 2 Statement of financial position 3 Statement of comprehensive income 4 Statement of changes in
Financial statements. The University of Newcastle. newcastle.edu.au F1. 52 The University of Newcastle, Australia
 Financial statements The University of Newcastle 52 The University of Newcastle, Australia newcastle.edu.au F1 Contents Income statement................. 54 Statement of comprehensive income..... 55 Statement