DBS BANK LTD. (Incorporated in Singapore. Registration Number: E) AND ITS SUBSIDIARIES
|
|
|
- Cecil Gordon
- 5 years ago
- Views:
Transcription
1 DBS BANK LTD. (Incorporated in Singapore. Registration Number: E) AND ITS SUBSIDIARIES FINANCIAL STATEMENTS For the financial year ended 31 December 2016
2 20B 0BFinancial Statements Table of Contents Financial Statements Income Statements 1 Statements of Comprehensive Income 1 Balance Sheets 2 Consolidated Statement of Changes in Equity 3 Statement of Changes in Equity 4 Consolidated Cash Flow Statement 5 Notes to the Financial Statements 1 Domicile and Activities 6 2 Summary of Significant Accounting Policies 6 3 Critical Accounting Estimates 14 15BIncome Statement 4 Net Interest Income 15 5 Net Fee and Commission Income 15 6 Net Trading Income 15 7 Net Income from Investment Securities 16 8 Other Income 16 9 Employee Benefits Other Expenses Allowances for Credit and Other Losses Income Tax Expense 18 16Balance Sheet: Assets 13 Classification of Financial Instruments Cash and Balances with Central Banks Government Securities and Treasury Bills Bank and Corporate Securities Loans and Advances to Customers Financial Assets Transferred Other Assets Deferred Tax Assets/Liabilities Subsidiaries and Consolidated Structured Entities Associates Unconsolidated Structured Entities Acquisition Properties and Other Fixed Assets Goodwill and Intangibles 36 17Balance Sheet: Liabilities 27 Deposits and Balances from Customers Other Liabilities Other Debt Securities Due to Subsidiaries Subordinated Term Debts Balance Sheet: Share Capital and Reserves 32 Share Capital Other Equity Instruments Other Reserves and Revenue Reserves Non-controlling Interests 44 18BOff-Balance Sheet Information 36 Contingent Liabilities and Commitments Financial Derivatives 46 19BAdditional Information 38 Share-based Compensation Plans Related Party Transactions Fair Value of Financial Instruments Risk Governance Credit Risk Market Risk Liquidity Risk Operational Risk Capital Management Segment Reporting Subsequent Event 80 Directors Statement 81 20BIndependent Auditor s Report 85
3 DBS BANK LTD. AND ITS SUBSIDIARIES INCOME STATEMENTS FOR THE YEAR ENDED 31 DECEMBER 2016 Bank In $ millions Note Interest income 9,748 9,644 7,568 7,080 Interest expense 2,457 2,558 2,007 1,691 Net interest income 4 7,291 7,086 5,561 5,389 Net fee and commission income 5 2,334 2,144 1,700 1,536 Net trading income 6 1,352 1, Net income from investment securities Other income Non-interest income 4,182 3,854 2,980 2,643 Total income 11,473 10,940 8,541 8,032 Employee benefits 9 2,725 2,651 1,753 1,667 Other expenses 10 2,240 2,242 1,474 1,450 Total expenses 4,965 4,893 3,227 3,117 Profit before allowances 6,508 6,047 5,314 4,915 Allowances for credit and other losses 11 1, Profit before tax 5,074 5,304 4,335 4,480 Income tax expense Net profit 4,355 4,579 3,720 3,844 Attributable to: Shareholders 4,254 4,503 3,720 3,844 Non-controlling interests ,355 4,579 3,720 3,844 STATEMENTS OF COMPREHENSIVE INCOME FOR THE YEAR ENDED 31 DECEMBER 2016 Bank In $ millions Net profit 4,355 4,579 3,720 3,844 Other comprehensive income (a) : Foreign currency translation differences for foreign operations Share of other comprehensive income of associates (6) Available-for-sale financial assets and others Net valuation taken to equity 131 (218) 168 (222) Transferred to income statement (188) 61 (181) 58 Tax on items taken directly to or transferred from equity Other comprehensive income, net of tax (9) (121) 39 (137) Total comprehensive income 4,346 4,458 3,759 3,707 Attributable to: Shareholders 4,230 4,375 3,759 3,707 Non-controlling interests ,346 4,458 3,759 3,707 (a) Items recorded in Other comprehensive income above will be reclassified to the income statement when specific conditions are met (e.g. when foreign operations or available-for-sale financial assets are disposed of). (See notes on pages 6 to 80, which form part of these financial statements) 1
4 DBS BANK LTD. AND ITS SUBSIDIARIES BALANCE SHEETS AS AT 31 DECEMBER 2016 Bank In $ millions Note Assets Cash and balances with central banks 14 26,840 18,828 20,001 11,021 Government securities and treasury bills 15 33,401 34,501 27,281 29,181 Due from banks 30,000 38,274 24,971 32,704 Derivatives 37 25,778 23,631 23,994 22,791 Bank and corporate securities 16 45,417 40,073 41,700 35,978 Loans and advances to customers , , , ,287 Other assets 19 11,027 11,587 7,632 8,818 Associates , Subsidiaries ,381 25,331 Properties and other fixed assets 25 1,572 1, Goodwill and intangibles 26 5,117 5, Total assets 481, , , ,266 Liabilities Due to banks 15,915 18,251 12,694 15,797 Deposits and balances from customers , , , ,082 Derivatives 37 24,525 22,191 22,944 21,386 Other liabilities 28 15,853 12,363 10,339 8,726 Other debt securities 29 25,345 36,194 24,393 34,554 Due to holding company 2,102 2,133 1,029 1,085 Due to subsidiaries ,205 24,432 Subordinated term debts 31 2,457 4,026 2,457 4,026 Total liabilities 433, , , ,088 Net assets 47,915 42,555 40,852 36,178 Equity Share capital 32 24,146 23,496 24,146 23,496 Other equity instruments 33 1,813-1,813 - Other reserves 34 (119) 2, ,435 Revenue reserves 34 19,552 14,486 14,779 10,247 Shareholders' funds 45,392 40,247 40,852 36,178 Non-controlling interests 35 2,523 2, Total equity 47,915 42,555 40,852 36,178 (See notes on pages 6 to 80, which form part of these financial statements) 2
5 DBS BANK LTD. AND ITS SUBSIDIARIES CONSOLIDATED STATEMENT OF CHANGES IN EQUITY FOR THE YEAR ENDED 31 DECEMBER 2016 In $ millions Share capital Other equity instruments Other reserves Revenue reserves Total Noncontrolling Shareholders funds interests Total equity 2016 Balance at 1 January 23,496-2,265 14,486 40,247 2,308 42,555 Issue of ordinary shares Issue of preference shares Issue of perpetual capital securities - 1, ,813-1,813 Transfers - - (2,360) 2, Dividends paid to holding company (1,510) (1,510) - (1,510) Dividends paid on preference shares (38) (38) - (38) Dividends paid to non-controlling interests (104) (104) Change of non-controlling interests (58) (58) Total comprehensive income - - (24) 4,254 4, ,346 Balance at 31 December 24,146 1,813 (119) 19,552 45,392 2,523 47, Balance at 1 January 22,096-2,471 11,521 36,088 1,695 37,783 Issue of ordinary shares 1, ,400-1,400 Issue of preference shares and perpetual loan Dividends paid to holding company (1,500) (1,500) - (1,500) Dividends paid on preference shares (38) (38) - (38) Dividends paid to non-controlling interests (86) (86) Acquisition of non-controlling interests - - (78) - (78) (72) (150) Total comprehensive income - - (128) 4,503 4, ,458 Balance at 31 December 23,496-2,265 14,486 40,247 2,308 42,555 (See notes on pages 6 to 80, which form part of these financial statements) 3
6 DBS BANK LTD. AND ITS SUBSIDIARIES STATEMENT OF CHANGES IN EQUITY FOR THE YEAR ENDED 31 DECEMBER 2016 Bank In $ millions Share capital Other equity instruments Other reserves Revenue reserves Total equity 2016 Balance at 1 January 23,496-2,435 10,247 36,178 Issue of ordinary shares Issue of perpetual capital securities - 1, ,813 Transfers - - (2,360) 2,360 - Dividends paid to holding company (1,510) (1,510) Dividends paid on preference shares (38) (38) Total comprehensive income ,720 3,759 Balance at 31 December 24,146 1, ,779 40, Balance at 1 January 22,096-2,572 7,941 32,609 Issue of ordinary shares 1, ,400 Dividends paid to holding company (1,500) (1,500) Dividends paid on preference shares (38) (38) Total comprehensive income - - (137) 3,844 3,707 Balance at 31 December 23,496-2,435 10,247 36,178 (See notes on pages 6 to 80, which form part of these financial statements) 4
7 DBS BANK LTD. AND ITS SUBSIDIARIES CONSOLIDATED CASH FLOW STATEMENT FOR THE YEAR ENDED 31 DECEMBER 2016 In $ millions Cash flows from operating activities Net profit 4,355 4,579 Adjustments for non-cash items: Allowances for credit and other losses 1, Depreciation of properties and other fixed assets Share of profits or losses of associates 47 (14) Net gain on disposal (net of write-off) of properties and other fixed assets (47) (82) Net income from investment securities (330) (339) Interest expense on subordinated term debts Income tax expense Profit before changes in operating assets and liabilities 6,566 5,979 Increase/(Decrease) in: Due to banks (2,354) 1,858 Deposits and balances from customers 25,659 (1,592) Other liabilities 3,639 1,631 Other debt securities and borrowings (10,942) 5,735 Due to holding company (31) (1,955) (Increase)/Decrease in: Restricted balances with central banks Government securities and treasury bills 1,616 (4,350) Due from banks 8,250 4,359 Bank and corporate securities (5,265) (1,911) Loans and advances to customers (17,363) (4,076) Other assets (805) (5,189) Tax paid (805) (731) Net cash generated from operating activities (1) 8, Cash flows from investing activities Dividends from associates Proceeds from disposal of interest in associates 3 - Acquisition of interest in associate - (21) Proceeds from disposal of properties and other fixed assets Purchase of properties and other fixed assets (321) (334) Acquisition of non-controlling interests - (150) Net cash used in investing activities (2) (206) (333) Cash flows from financing activities Interest paid on subordinated term debts (125) (108) Redemption/purchase of subordinated term debts (973) (743) Increase in share capital 650 1,400 Issue of perpetual capital securities 1,813 - Issue of preference shares and perpetual loan Dividends paid to shareholders of the Bank (1,548) (1,538) Change in non-controlling interests (58) - Dividends paid to non-controlling interests (104) (86) Net cash used in financing activities (3) (84) (387) Exchange translation adjustments (4) Net change in cash and cash equivalents (1)+(2)+(3)+(4) 8, Cash and cash equivalents at 1 January 12,077 11,839 Cash and cash equivalents at 31 December (Note 14) 20,132 12,077 (See notes on pages 6 to 80, which form part of these financial statements) 5
8 These Notes are integral to the financial statements. The consolidated financial statements for the year ended 31 December 2016 were authorised for issue by the Directors on 15 February Domicile and Activities DBS Bank Ltd. (the Bank) is incorporated and domiciled in the Republic of Singapore and has its registered office at 12 Marina Boulevard, Marina Bay Financial Centre Tower Three, Singapore It is a wholly-owned subsidiary of DBS Group Holdings Ltd (DBSH). The Bank is principally engaged in a range of commercial banking and financial services, principally in Asia. The financial statements relate to the Bank and its subsidiaries (the Group) and the Group s interests in associates. 2 Summary of Significant Accounting Policies 2.1 Basis of preparation Compliance with Singapore Financial Reporting Standards (FRS) The financial statements of the Bank and the consolidated financial statements of the Group are prepared in accordance with Singapore Financial Reporting Standards (FRS) and related Interpretations promulgated by the Accounting Standards Council (ASC). In accordance with Section 201(18) of the Companies Act (the Act), the requirements of FRS 39 Financial Instruments: Recognition and Measurement in respect of loan loss provisioning are modified by the requirements of Notice to Banks No. 612 Credit Files, Grading and Provisioning (MAS Notice 612) issued by the Monetary Authority of Singapore. The financial statements are presented in Singapore dollars and rounded to the nearest million, unless otherwise stated. Differences between International Financial Reporting Standards (IFRS) and FRS Other than the above modification to FRS related to MAS Notice 612, there are no significant differences between IFRS and FRS in terms of their application to the Group. The consolidated financial statements and the notes thereon satisfy all necessary disclosures under IFRS and FRS. notes the intention, as announced by the ASC on 29 May 2014, for Singapore-incorporated companies listed on the Singapore Exchange to apply a new financial reporting framework identical to IFRS with effect from 1 January The implementation of FRS 109 s credit impairment requirements will be dependent on any changes that could be made to the current regulatory specifications and the Group will continue to monitor developments on this front. 2.2 Significant estimates and judgement The preparation of financial statements requires management to exercise judgement, use estimates and make assumptions in the application of policies and in reporting the amounts in the financial statements. Although these estimates are based on management s best knowledge of current events and actions, actual results may differ from these estimates. Critical accounting estimates and assumptions used that are significant to the financial statements, and areas involving a higher degree of judgement and complexity, are disclosed in Note New or amended FRS and Interpretations effective for 2016 year-end On 1 January 2016, the Group adopted the following revised FRS that are issued by the ASC and relevant for the Group. The adoption has no significant impact on the Group s financial statements. Amendments to FRS 1: Disclosure initiatives Amendments to FRS 27: Equity Method in Separate Financial Statements Amendments to FRS 111: Accounting for Acquisitions of Interests in Joint Operations Improvements to FRSs (issued in November 2014) 2.4 New or amended FRS and Interpretations effective for future periods The significant new or amended FRS and Interpretations that are applicable to the Group in future reporting periods, and which have not been early-adopted, include: FRS 115 Revenue from Contracts with Customers (effective 1 January 2018) replaces the existing revenue recognition guidance and establishes a comprehensive framework for determining whether, how much and when revenue is recognised. FRS 116 Leases (effective 1 January 2019) replaces the existing lease accounting guidance and requires almost all leases to be recognised on the balance sheet. It also changes the way in which lease expenses are presented in the income statement. FRS109 Financial Instruments (effective 1 January 2018) FRS 109: Financial Instruments FRS 109 replaces the existing guidance in FRS 39 Financial Instruments: Recognition and Measurement. It includes revised guidance on the classification and measurement of financial instruments; requires a more timely recognition of expected credit losses arising from the impairment of financial assets; and introduces revised requirements for general hedge accounting. It is currently not yet practicable to reliably estimate the financial impact of FRS 109 on the Group s financial statements. 6
9 Classification and measurement FRS 109 will replace the classification and measurement model in FRS 39 with a new model that categorises financial assets based on the business model within which the assets are managed, and whether the contractual cash flows from the financial assets solely represent the payment of principal and interest. expects that the current measurement approach for most of its financial assets will remain unchanged. is evaluating the impact on (a) a portfolio of financial assets that contains embedded derivatives, which may subsequently be measured at fair value through profit or loss (FVPL), as well as (b) a portfolio of quoted available-for-sale (AFS) debt securities that are held to collect contractual cash flows, which may subsequently be measured at amortised cost. Subsequent changes in fair value from non-trading equity instruments can be taken through profit or loss or through other comprehensive income (FVOCI), as elected. Impairment Under FRS 109, expected credit losses (ECL) will be assessed using an approach which classifies financial assets into three categories or stages, each of which is associated with an ECL requirement that is reflective of the assessed credit risk profile in each instance. A financial asset is classified under Stage 1 if it was not credit-impaired upon origination and there has not been a significant increase in its credit risk since. A provision for 12-month ECL is required. A financial asset is classified under Stage 2 if it was not credit-impaired upon origination but has since suffered a significant increase in credit risk. A provision for life-time ECL is required. A financial asset which has been credit-impaired with objective evidence of default is classified under Stage 3. The assessed ECL is expected to be unchanged from the existing specific allowances taken for such assets. ECL are probability-weighted amounts determined by evaluating a range of possible outcomes and taking into account past events, current conditions and assessments of future economic conditions, and will necessarily involve the use of management judgement. Hedge accounting FRS 109 will introduce a more principle-based approach to assess hedge effectiveness. expects that all its existing hedges that are designated in effective hedging relationships will continue to qualify for hedge accounting under FRS 109. A) General Accounting Policies A summary of the most significant group accounting policies is described further below starting with those relating to the entire financial statements followed by those relating to the income statement, the balance sheet and other specific topics. This does not reflect the relative importance of these policies to the Group. 2.5 Group Accounting Subsidiaries Subsidiaries are entities (including structured entities) over which the Group has control. controls an entity when it is exposed to, or has rights to, variable returns from its involvement with the entity and has the ability to affect those returns through its power over the entity. Subsidiaries are consolidated from the date control is transferred to the Group to the date control ceases. The acquisition method is used to account for business combinations. Refer to Note 2.13 for the Group s accounting policy on goodwill. All intra-group transactions and balances are eliminated on consolidation. Associates Associates are entities over which the Group has significant influence, but no control where the Group generally holds a shareholding of between and including 20% and 50% of the voting rights. Investments in associates are accounted for using the equity method. 2.6 Foreign currency treatment Functional and presentation currency Items in the financial statements are measured using the functional currency of each entity in the Group, this being the currency of the primary economic environment in which the entity operates. s financial statements are presented in Singapore dollars, which is the functional currency of the Bank. Foreign currency transactions and balances Transactions in foreign currencies are measured using the exchange rate at the date of the transaction. Monetary assets and liabilities denominated in foreign currencies are translated into the functional currency of the entity undertaking the transaction at the exchange rates at the balance sheet date. Foreign exchange differences arising from this translation are recognised in the income statement within Net trading income. Non-monetary assets and liabilities measured at cost in a foreign currency are translated using the exchange rates at the date of the transaction. Non-monetary assets and liabilities measured at fair values in foreign currencies are translated using the exchange rates at the date when the fair values are determined, which is generally the balance sheet date. Unrealised foreign exchange differences arising from non-monetary financial assets and liabilities classified as fair value through profit or loss are recognised in the income statement within trading income. For non- 7
10 monetary financial assets such as equity investments classified as available-for-sale, unrealised foreign exchange differences are recorded in other comprehensive income and accumulated in equity until the assets are disposed of or become impaired, upon which they are reclassified to the income statement. Subsidiaries and branches The results and financial position of subsidiaries and branches whose functional currency is not Singapore dollars ( foreign operations ) are translated into Singapore dollars in the following manner: Assets and liabilities are translated at the exchange rates at the balance sheet date; Income and expenses in the income statement are translated at exchange rates prevailing at each month-end, approximating the exchange rates at the dates of the transactions; and All resulting exchange differences are recognised in other comprehensive income and accumulated under capital reserves in equity. When a foreign operation is partially or fully disposed of, or when share capital is repaid, such exchange differences are recognised in the income statement as part of the gain or loss. For acquisitions prior to 1 January 2005, the foreign exchange rates at the respective dates of acquisition were used. Please refer to Note 26 for an overview of goodwill recorded. Goodwill and fair value adjustments arising on the acquisition of a foreign operation on or after 1 January 2005 are treated as assets and liabilities of the foreign operation and translated at the closing rate. 2.7 Segment reporting Operating segments are reported in a manner consistent with the internal reporting provided to management. In preparing the segment information, amounts for each business segment are shown after the allocation of certain centralised costs, funding income and the application of transfer pricing, where appropriate. Transactions between segments are recorded within the segment as if they are third party transactions and are eliminated on consolidation. Please refer to Note 47 for further details on business and geographical segment reporting. B) Income Statement 2.8 Income recognition Interest income and interest expense Interest income and interest expense as presented in Note 4 arise from all interest-bearing financial assets and financial liabilities regardless of their classification and measurement, with the exception of the Group s structured investment deposits which are carried at fair value through profit or loss. Interest expense on such structured investment deposits is presented together with other fair value changes in trading income. Interest income and interest expense are recognised on a time-proportionate basis using the effective interest method. The calculation includes significant fees and transaction costs that are integral to the effective interest rate, as well as premiums or discounts. Fee and commission income earns fee and commission income from a diverse range of products and services provided to its customers. Fee and commission income is generally recognised on the completion of a transaction. Such fees include underwriting fees, brokerage fees, bancassurance sales commission and variable service fees and fees related to completion of corporate finance transactions. For a service that is provided over a period of time, fee and commission income is recognised over the period during which the related service is provided or credit risk is undertaken. Such fees include the income from issuance of financial guarantees and bancassurance fixed service fees. Fee and commission income is recorded net of expenses directly related to it. These expenses typically include brokerage fees paid, card-related expenses and sales commissions, but do not include expenses for services delivered over a period (such as service contracts) and other expenses that are not specifically related to fee and commission income transactions. Dividend income Dividend income is recognised when the right to receive payment is established. This is generally the ex-dividend date for listed equity securities, and the date when shareholders approve the dividend for unlisted equity securities. Dividend income arising from held-for-trading financial assets is recognised in Net trading income, while those arising from available-for-sale financial assets is recognised in Net income from investment securities. Allowances for credit and other losses Please refer to Note 2.11 for the accounting policy on impairment of financial assets. C) Balance Sheet 2.9 Financial assets Initial recognition Purchases and sales of all financial assets, even if their classification and measurement are subsequently changed, are recognised on the date that the Group enters into the contractual arrangements with counterparties. When the Group acts as a trustee or in a fiduciary capacity for assets it does not directly control or benefit from, the assets and the corresponding income belonging to a customer are excluded from the financial statements. 8
11 Financial assets are initially recognised at fair value, which is generally the transaction price. Classification and subsequent measurement classifies and measures financial assets based on their nature and the purpose for which they are acquired. This generally corresponds to the business models in which they are applied and how management monitors performance, as follows: Non-derivative financial assets that are managed mainly for longer-term holding and collection of payments are classified as loans and receivables. These assets have fixed or determinable payments, are not quoted in an active market and are mainly in the Consumer Banking/Wealth Management and Institutional Banking segments. Loans and receivables are carried at amortised cost using the effective interest method. Non-derivative financial assets that are managed on a fair value basis, which are mainly in the Treasury segment, are classified as financial assets at fair value through profit or loss. Such assets include instruments held for the purpose of short-term selling and market-making ( held for trading ), or designated under the fair value option if doing so eliminates or significantly reduces measurement or recognition inconsistencies that would otherwise arise, or if the financial asset contains an embedded derivative that would otherwise need to be separately recorded ( designated at fair value through profit or loss ). Realised or unrealised gains or losses on such financial assets, except interest income, are taken to Net trading income in the income statement in the period they arise. Derivatives (including derivatives embedded in other contracts but separated for accounting purposes) are also categorised as held for trading unless they are designated as hedging instruments in accordance with Note Derivatives are classified as assets when the fair value is positive and as liabilities when the fair value is negative. Changes in the fair value of derivatives other than those designated as hedging instruments in cash flow or net investment hedges are included in Net trading income. Non-derivative financial assets that the Group intends to hold to maturity are classified as held to maturity. These are Singapore Government securities that the Group holds for satisfying regulatory liquidity requirements and are held within the Others segment. These assets are carried at amortised cost using the effective interest method. also holds other non-derivative financial assets for the purpose of investment or satisfying regulatory liquidity requirements. Such assets are held for an indefinite period and may be sold in response to needs for liquidity or changes in interest rates, credit spreads, exchange rates or equity prices. Financial assets in this category are held in all business segments as well as the liquidity management unit in the Others segment. These assets are classified as available-for-sale and initially and subsequently measured at fair value. Unrealised gains or losses arising from changes in fair value are recognised in other comprehensive income and accumulated in available-for-sale revaluation reserves. When sold or impaired, the accumulated fair value adjustments in the availablefor-sale revaluation reserves are reclassified to the income statement. Unquoted equity investments classified as available-for-sale for which fair values cannot be reliably determined are carried at cost, less impairment (if any). Where the classification and measurement of financial assets do not reflect the management of the financial assets (or financial liabilities), the Group may apply hedge accounting where permissible and relevant to better reflect the management of the financial assets. Please refer to Note 2.19 for details on hedging and hedge accounting. Please refer to Note 13 for further details on the types of financial assets classified and measured as above. Reclassification When the purpose for holding a financial asset changes, or when FRS otherwise requires it, non-derivative financial assets are reclassified accordingly. Financial assets may be classified out of the fair value through profit or loss or available-for-sale categories only in particular circumstances as prescribed by FRS 39. In 2008 and 2009, the Group reclassified certain financial assets between categories as a result of a change in its holding intention. The reclassifications did not have a material impact on the income statement and statement of comprehensive income for the current year. Determination of fair value The fair value of financial assets is the price that would be received if the asset is sold in an orderly transaction between market participants at the measurement date. Fair value is generally estimated by discounting the future contractual cash flows at the current market interest rate that is available to the Group for similar financial instruments. Where applicable, a valuation reserve or pricing adjustment is applied to arrive at the fair value. The determination of fair value is considered a significant accounting policy for the Group and further details are disclosed in Note 40. Offsetting Financial assets and liabilities are presented net when there is a legally enforceable right to offset the recognised amounts and there is an intention to settle them on a net basis, or realise the asset and settle the liability simultaneously. 9
12 Derecognition Financial assets are derecognised when the rights to receive cash flows from the financial assets have expired or when they have been transferred together with substantially all the risks and rewards of ownership. enters into certain transactions where it transfers financial assets recognised on its balance sheet but retains either all or a portion of the risks and rewards of the transferred financial assets. In such cases, the transferred financial assets are not derecognised from the balance sheet. Such transactions include repurchase transactions described in Note They also include transactions where control over the financial asset is retained, for example, by a simultaneous transaction (such as options) with the same counterparty to which the asset is transferred. These are mainly transacted in the Treasury segment. In such cases the Group continues to recognise the asset to the extent of its continuing involvement which is the extent to which it is exposed to changes in the value of the transferred asset. Please refer to Note 18 for disclosures on transferred financial assets Cash and cash equivalents For the purposes of the cash flow statement, cash and cash equivalents comprise cash on hand and nonrestricted balances with central banks which are readily convertible into cash Impairment of financial assets assesses at each balance sheet date whether there is evidence that a financial asset or a group of financial assets is impaired. (a) Financial assets classified as loans and receivables and held to maturity carries out regular and systematic reviews of all credit facilities extended to customers. The criteria that the Group uses to determine whether there is evidence of an impairment loss include: Significant financial difficulty of the issuer or obligor, including breach of covenants and/or financial conditions. A breach of contract, such as a default or delinquency in interest or principal payments. Granting of a concession to the borrower, for economic or legal reasons relating to the borrower s financial difficulty, that the Group would not otherwise consider. High probability of bankruptcy or other financial reorganisation of the borrower. Specific allowances for credit losses A specific allowance for credit losses is recognised if there is evidence that the Group will be unable to collect all amounts due under a claim according to the original contractual terms or the equivalent value. A claim means a loan, debt security or a commitment such as financial guarantees and letters of credit. A specific allowance for credit losses is recorded as a reduction in the carrying value of a claim on the balance sheet. For an off-balance sheet item such as a commitment, a specific allowance for credit loss is recorded as provision for loss in respect of off-balance sheet credit exposures within Other liabilities. Specific allowances for credit losses are evaluated either individually or collectively for a portfolio. Specific allowance for an individual credit exposure is made when existing facts, conditions or valuations indicate that the Group is not likely to collect the principal and interest due contractually on the claim. An allowance is reversed only when there has been an identifiable event that has led to an improvement in the collectability of the claim. The amount of specific allowance also takes into account the collateral value, which may be discounted to reflect the impact of a forced sale or untimely liquidation. Overdue unsecured consumer loans which are homogenous in nature, such as credit card receivables, are pooled according to their delinquency behaviour and evaluated for impairment collectively as a group, taking into account the historical loss experience of such loans. When a loan is uncollectible, it is written off against the related allowance for loan impairment. Such loans are written off after all the recovery procedures have been exhausted and the amount of the loss has been determined. Recoveries in full or in part of amounts previously written off are credited to the income statement in Allowances for credit and other losses. General allowances for credit losses Apart from specific allowances, the Group also recognises general allowances for credit losses. The Group maintains a level of allowances that is deemed sufficient to absorb the estimated credit losses inherent in its loan portfolio (including off-balance sheet credit exposures). maintains general allowances of at least 1% of credit exposures arising from both on and off-balance sheet items (against which specific allowances have not been made), adjusted for collateral held. This is in accordance with the transitional arrangements under MAS Notice 612. (b) Financial assets classified as available-for-sale assesses at each balance sheet date whether there is evidence that an available-for-sale financial asset is impaired. In the case of an equity investment, a significant or prolonged decline in the fair value of the security below its cost is a factor in determining whether the asset is impaired. When there is evidence of an impairment of an availablefor-sale financial asset, the cumulative loss measured 10
13 as the difference between the acquisition cost and the current fair value, less any impairment loss on that financial asset previously recognised in the income statement is reclassified from the revaluation reserve within equity to the income statement as Allowances for credit and other losses. For equity investments, impairment losses are not reversed until they are disposed of. For impaired debt instruments that subsequently recover in value, the impairment losses are reversed through the income statement if there has been an identifiable event that led to the recovery Repurchase agreements Repurchase agreements (Repos) are treated as collateralised borrowings. The amount borrowed is reflected as a financial liability either as Due to banks or Deposits and balances from customers. The securities sold under repos are treated as pledged assets and remain on the balance sheet at amortised cost or fair value depending on their classification. Reverse repurchase agreements (Reverse repos) are treated as collateralised lending. The amount lent is reflected as a financial asset as Cash and balances with central banks, Due from banks or Loans and advances to customers. Amounts paid and received in excess of the amounts borrowed and lent on the repos and reverse repos are amortised as interest expense and interest income respectively using the effective interest method Goodwill Goodwill arising from business combinations generally represents the excess of the acquisition cost over the fair value of identifiable assets acquired and liabilities and contingent liabilities assumed on the acquisition date. Goodwill is stated at cost less impairment losses and is tested at least annually for impairment. At the acquisition date, any goodwill acquired is allocated to each of the cash-generating units (CGU) or group of CGUs expected to benefit from the combination s synergies. An impairment loss is recognised when the carrying amount of a CGU, or group of CGUs, including the goodwill, exceeds the applicable recoverable amount. The recoverable amount of a CGU or CGU group is the higher of the CGU s or CGU group s fair value less cost to sell and its value-in-use. An impairment loss on goodwill is recognised in the income statement and cannot be reversed in subsequent periods Properties and other fixed assets Properties (including investment properties) and other fixed assets are stated at cost less accumulated depreciation and impairment losses. Depreciation is calculated using the straight-line method over the estimated useful lives of the assets. Generally, the useful lives are as follows: Buildings Leasehold land Computer software Office equipment, furniture and fittings 50 years or over the remaining lease period, whichever is shorter. 100 years or over the remaining lease period, whichever is shorter. Leasehold land where the unexpired lease period is more than 100 years is not depreciated. 3-5 years 5-10 years Please refer to Note 25 for the details of properties and other fixed assets and their movements during the year Financial liabilities Initial recognition, classification and subsequent measurement Financial liabilities are initially recognised at fair value. generally classifies and measures its financial liabilities in accordance with the purpose for which the financial liabilities are incurred and managed. Accordingly: Financial liabilities are classified as financial liabilities at fair value through profit or loss if they are incurred for the purpose of repurchasing in the near term ( held for trading ), and this may include debt securities issued and short positions in securities for the purpose of ongoing market-making or trading. Financial liabilities at fair value through profit or loss can also be designated by management on initial recognition ( designated at fair value through profit or loss ) if doing so eliminates or significantly reduces measurement or recognition inconsistencies that would otherwise arise, or if the financial liability contains an embedded derivative that would otherwise need to be separately recorded. Financial liabilities in this classification are usually within the Treasury segment. Realised or unrealised gains or losses on financial liabilities held for trading and financial liabilities designated under the fair value option, except interest expense, are taken to Net trading income in the income statement in the period they arise. Interest expense on structured investment deposits at fair value through profit or loss is also presented together with other fair value changes in Net trading income. Derivative liabilities are treated consistently with derivative assets. Please refer to Note 2.9 for the accounting policy on derivatives. 11
14 Other financial liabilities are carried at amortised cost using the effective interest method. These comprise predominantly the Group s Deposits and balances from customers, Due to banks and Other debt securities. Please refer to Note 13 for further details on the types of financial liabilities classified and measured as above. Determination of fair value The fair value of financial liabilities is the price that would be paid to transfer the liability in an orderly transaction between market participants at the measurement date. Please refer also to Note 40 for further fair value disclosures. Derecognition A financial liability is derecognised from the balance sheet when the obligation specified in the contract is discharged, cancelled or expired Loan commitments, letters of credit and financial guarantees Loan commitments Loan commitments are typically not financial instruments and are not recognised on the balance sheet. They are disclosed in accordance with FRS 37 and form part of the disclosures in Note 36. Upon a loan draw-down, the amount of the loan is accounted for under loans and receivables as described in Note 2.9. Letters of credit Letters of credit are recorded off-balance sheet as contingent liabilities upon issuance, and the corresponding payables to the beneficiaries and receivables from the applicants are recognised onbalance sheet upon acceptance of the underlying documents. Financial guarantees A financial guarantee is initially recognised in the financial statements at fair value on the date the guarantee is given. This is generally the amount (fee) paid by the counterparty. Subsequently, the fee is recognised over time as income in accordance with the principles in Note 2.8. Off-balance sheet credit exposures are managed for credit risk in the same manner as financial assets. Please refer to Note 2.11 on the Group s accounting policies on allowances for credit losses Provisions and other liabilities Provisions for other liabilities of uncertain timing and amounts are recognised when: the Group has a present legal or constructive obligation as a result of past events; it is probable that an outflow of resources embodying economic benefits will be required to settle the obligation; and a reliable estimate of the amount of the obligation can be made. The amount recognised as a provision is the best estimate of the expenditure required to settle the present obligation at the balance sheet date Share capital and other instruments classified as equity Ordinary shares, preference shares and other instruments which do not result in the Group having a contractual obligation to deliver cash or another financial asset, or to exchange financial assets or financial liabilities with the holder under conditions that are potentially unfavourable to the Group, are classified as equity. Distributions arising from such instruments are recognised in equity as there is no contractual obligation to pay distributions on these instruments. Incremental external costs directly attributable to the issuance of such instruments are accounted for as a deduction from equity. Dividends are recorded during the financial year in which they are approved by the Board of Directors and declared payable. D) Other Specific Topics 2.19 Hedging and hedge accounting uses derivative contracts mainly as part of its risk management strategies for hedging interest rate risk arising from maturity mismatches or for hedging currency risk arising from currency mismatches and cash flows in foreign currencies. In some cases, where the strict criteria in FRS 39 are met, hedge accounting is applied as set out in subsequent paragraphs. At the inception of each hedging relationship, the Group documents the relationship between the hedging instrument and the hedged item; the risk management objective for undertaking the hedge transaction; and the methods used to assess the effectiveness of the hedge. At inception and on an ongoing basis, the Group also documents its assessment of whether the hedging instrument is highly effective in offsetting changes in the fair value or cash flows of the hedged item. Fair value hedge s fair value hedges consist principally of interest rate swaps used for managing the interest rate gaps that naturally arise from its purchases or issues of debt securities, and where a mismatch in the measurement between the hedging derivative and the hedged item exists. Such hedges are mainly used in the Treasury and Others segments. For a qualifying fair value hedge, the changes in the fair value of the hedging derivatives are recorded in the income statement, together with any changes in the fair value of the hedged item attributable to the hedged risk. 12
15 If the hedge no longer meets the criteria for hedge accounting, the adjustment to the carrying amount of a hedged item is amortised to the income statement over its remaining maturity, using the effective interest method. Cash flow hedge For transactions with highly probable cash flows, derivatives are used to hedge against cash flow variability due to exchange rate movements in certain situations. Cash flow hedge accounting is principally applied in such cases. The effective portion of changes in the fair value of a derivative designated and qualifying as a cash flow hedge is recognised in other comprehensive income and accumulated under the cash flow hedge reserve in equity. This amount is reclassified to the income statement in the periods when the hedged forecast cash flows affect the income statement. The ineffective portion of the gain or loss is recognised immediately in the income statement under Net trading income. When a hedging instrument expires or is sold, or when a hedge no longer meets the criteria for hedge accounting, any cumulative gain or loss existing in the cash flow hedge reserve remains until the forecast transaction is recognised in the income statement. When a forecast transaction is no longer expected to occur, the cumulative gain or loss in the cash flow hedge reserve is reclassified from equity to the income statement. Net investment hedge Net investment hedge accounting is applied to hedged investments in foreign operations which comprise certain subsidiaries, branches and associates with a functional currency different from that of the Bank. Under the Group s hedging strategy, the carrying amount of these investments could be fully hedged, partially hedged or not hedged at all. Hedges of net investments in the Group s foreign operations are accounted for in a manner similar to cash flow hedges. On disposal of the foreign operations, the cumulative gain or loss in the capital reserves is reclassified to the income statement as part of the gain or loss on disposal. Economic hedges which do not qualify for hedge accounting Some derivatives may be transacted as economic hedges as part of the Group s risk management but do not qualify for hedge accounting under FRS 39. These include swaps and other derivatives (e.g. futures and options) that the Group transacts to manage interest rate, foreign exchange or other risks. Such derivatives are treated in the same way as derivatives held for trading purposes, i.e. realised and unrealised gains and losses are recognised in Net trading income. In some cases, the hedged exposures are designated at fair value through profit or loss, thereby achieving some measure of offset in the income statement. Please refer to Note 37.2 for disclosures on hedging derivatives Employee benefits Employee benefits, which include base pay, cash bonuses, share-based compensation, contribution to defined contribution plans such as the Central Provident Fund and other staff-related allowances, are recognised in the income statement when incurred. For defined contribution plans, contributions are made to publicly or privately administered funds on a mandatory, contractual or voluntary basis. Once the contributions have been paid, the Group has no further payment obligations. Employee entitlement to annual leave is recognised when they accrue to employees. A provision is made for the estimated liability for annual unutilised leave as a result of services rendered by employees up to the balance sheet date Share-based compensation Employee benefits also include share-based compensation, namely the DBSH Share Ownership Scheme (the Scheme), the DBSH Share Plan and the DBSH Employee Share Plan (the Plans). The details of the Scheme and Plans are described in Note 38. Equity instruments granted and ultimately vested under the Plans are recognised in the income statement based on the fair value of the equity instrument at the date of grant. The expense is amortised over the vesting period of each award, with a corresponding adjustment to the share option/plan reserves. Monthly contributions to the Scheme are expensed off when incurred Current and deferred taxes Current income tax for current and prior periods is recognised as the amount expected to be paid or recovered from the tax authorities, using the tax rates and tax laws that have been enacted or substantively enacted by the balance sheet date. considers uncertain tax positions generally at the level of the total tax liability to each tax authority for each period. The liability is determined based on the total amount of current tax expected to be paid, taking into account all tax uncertainties, using either an expected value approach or a single best estimate of the most likely outcome. Tax assets and liabilities of the same type (current or deferred) are offset when a legal right of offset exist and settlement in this manner is intended. This applies generally when they arise from the same tax reporting group and relate to the same tax authority. Deferred income tax is provided on temporary differences arising between the tax bases of assets and liabilities and their carrying amounts in the financial statements. The amount of deferred tax provided is based on the expected manner of realisation or settlement of the carrying amount of assets and liabilities, using tax rates enacted or substantively enacted by the balance sheet date. 13
16 The amount of deferred tax assets recognised takes into account the likelihood the amount that can be used to offset payable taxes on future profits. Deferred tax related to fair value re-measurement of available-for-sale investments, which are recognised outside profit or loss, is also recognised outside profit or loss, i.e. in other comprehensive income and accumulated in the available-for-sale revaluation reserves. 3 Critical Accounting Estimates s accounting policies and use of estimates are integral to the reported amounts in the financial statements. Certain accounting estimates require management s judgement in determining the appropriate methodology for valuation of assets and liabilities. Procedures are in place to ensure that methodologies are reviewed and revised as appropriate. believes its estimates for determining the valuation of its assets and liabilities are appropriate. The following is a brief description of the Group s critical accounting estimates that involve management s valuation judgement. 21B3.1 Impairment of financial assets It is the Group s policy to recognise, through charges against profit, specific and general allowances in respect of estimated and inherent credit losses in its portfolio as described in Note In estimating specific allowances, the Group assesses the gap between borrowers obligations to the Group and their repayment ability. The assessment takes into account various factors, including the economic or business outlook, the future profitability of the borrowers and the liquidation value of collateral. Such assessment requires considerable judgement. Policies and procedures have been established to facilitate the exercise of judgement in determining the risk characteristics of various financial instruments, discount rates, estimates of future cash flows and other factors used in the valuation process. Please refer to Note 40 for details on fair valuation and fair value hierarchy of the Group s financial instruments measured at fair value. 23B3.3 Goodwill impairment performs an impairment review to ensure that the carrying amount of a CGU to which goodwill is allocated does not exceed the recoverable amount of the CGU. Note 26 provides details of goodwill at the reporting date. The recoverable amount represents the present value of the estimated future cash flows expected to arise from continuing operations. Therefore, in arriving at the recoverable amount, management exercises judgement in estimating the future cash flows, growth rate and discount rate. 3.4 B24BIncome taxes has exposure to income taxes in numerous jurisdictions. Significant judgement is involved in determining the Group s provision for income taxes. The Group recognises liabilities for expected tax issues based on reasonable estimates of whether additional taxes will be due. Where uncertainty exists around the Group s tax position including resolution of any related appeals or litigation processes, appropriate provisions are provided based on technical merits of the positions with the same tax authority. Note 20 provides details of the Group s deferred tax assets/liabilities. In general, determination of the value of assets/liabilities relating to carry forward tax losses requires judgement. Another area requiring judgement is the calculation of general allowances, which are determined after taking into account historical data and management s assessment of the current economic and credit environment, country and portfolio risks, as well as industry practices. Please refer to Note 42 for a further description of the Group s credit risk management. 22B3.2 Fair value of financial instruments The majority of the Group s financial instruments reported at fair value are based on quoted and observable market prices or on internally developed models that are based on independently sourced market parameters. The fair value of financial instruments without an observable market price in an active market may be determined using valuation models. The choice of model requires significant judgement for complex products especially those in the Treasury segment. 14
17 70B DBS Bank Ltd. and its subsidiaries 4 Net Interest Income 70B Bank In $ millions Cash and balances with central banks and Due from banks Customer non-trade loans 6,628 6,126 5,094 4,404 Trade assets 958 1, Securities and others 1,791 1,758 1,589 1,526 Total interest income 9,748 9,644 7,568 7,080 Deposits and balances from customers 1,726 1,940 1, Other borrowings Total interest expense 2,457 2,558 2,007 1,691 Net interest income 7,291 7,086 5,561 5,389 Comprising: Interest income from financial assets at fair value through profit or loss Interest income from financial assets not at fair 9,196 8,996 7,123 6,526 value through profit or loss Interest expense from financial liabilities at fair (193) (204) (188) (203) value through profit or loss Interest expense from financial liabilities not at (2,264) (2,354) (1,819) (1,488) fair value through profit or loss Total 7,291 7,086 5,561 5,389 5 Net Fee and Commission Income Bank In $ millions Brokerage Investment banking Transaction services (a)(b) Loan-related Cards (c) Wealth management Others Fee and commission income 2,649 2,452 1,898 1,728 Less: fee and commission expense Net fee and commission income (a) 2,334 2,144 1,700 1,536 (a) Includes net fee and commission income of $56 million (2015: $51 million) and $36 million (2015: $34 million) for the Group and Bank respectively, which was derived from the provision of trust and other fiduciary services during the year Net fee and commission income earned from financial assets or liabilities not at fair value through profit or loss was $793 million (2015: $776 million) and $637 million (2015: $615 million) during the year for the Group and Bank respectively (b) Includes trade & remittances, guarantees and deposit-related fees (c) Card fees are net of interchange fees paid 6 Net Trading Income Bank In $ millions Net trading income - Foreign exchange Interest rates, credit, equities and others (a) Net gain/(loss) from financial assets designated at 80 (89) 80 (89) fair value Net (loss)/gain from financial liabilities designated (83) 80 (81) 89 at fair value Total 1,352 1, (a) Includes dividend income of $24 million (2015: $23 million) for both the Group and Bank 15
18 72B DBS Bank Ltd. and its subsidiaries 7 Net Income from Investment Securities Bank In $ millions Debt securities - Available-for-sale Loans and receivables 5 # 5 # Equity securities (a)(b) Total (c) Of which: net gains transferred from available-for-sale revaluation reserves # Amount under $500,000 (a) Includes dividend income of $60 million (2015: $63 million) for the Group; and $54 million (2015: $56 million) for the Bank (b) 2015 includes an amount of $136 million for the Group and the Bank relating to gain from disposal of a property investment (c) Includes fair value impact of hedges for the investment securities 8 Other Income 72B 73Bank In $ millions Rental income Net gain on disposal of properties and other # # fixed assets Others (a)/(b) Total # Amount under $500,000 (a) Includes share of profits or losses of associates for the Group (b) Includes dividend income from subsidiaries and associates of $14 million (2015: $485 million) for the Bank 9 Employee Benefits Bank In $ millions Salaries and bonuses 2,203 2,149 1,403 1,351 Contributions to defined contribution plans Share-based expenses Others Total 2,725 2,651 1,753 1,667 16
19 10 Other Expenses Bank In $ millions Computerisation expenses (a) Occupancy expenses (b) Revenue-related expenses Others (c) Total 2,240 2,242 1,474 1,450 (a) Includes hire and maintenance costs of computer hardware and software (b) Includes rental expenses of office and branch premises of $247 million (2015: $241 million) for the Group, and $138 million (2015: $134 million) for the Bank and amounts incurred in the maintenance and service of buildings (c) Includes office administration expenses (e.g. printing, stationery, telecommunications, etc), legal and professional fees Bank In $ millions Depreciation expenses Hire and maintenance costs of fixed assets, including building-related expenses Expenses on investment properties 7 7 # # Audit fees payable to external auditors (a) : - Auditors of the Bank Associated firms of Auditors of the Bank Non-audit fees payable to external auditors (a) : - Auditors of the Bank Associated firms of Auditors of the Bank # Amount under $500,000 (a) PricewaterhouseCoopers network firms 11 Allowances for Credit and Other Losses Bank In $ millions Loans and advances to customers (Note 17) 1, Investment securities - Available-for-sale Loans and receivables 17 (8) 18 (9) Properties and other fixed assets - (14) - - Off-balance sheet credit exposures Others Total 1,
20 12 Income Tax Expense Bank In $ millions Current tax expense - Current year Prior years provision (59) (55) (57) (35) Deferred tax expense - Prior years provision - (10) - (1) - Origination of temporary differences (22) (36) (27) 5 Total The deferred tax charge/(credit) in the income statement comprises the following temporary differences: Bank In $ millions Accelerated tax depreciation Allowances for loan losses (46) (49) (28) (13) Other temporary differences 21 (2) - 2 Deferred tax (credit)/charge to income statement (22) (46) (27) 4 The tax on the Group s and Bank s profit before tax differs from the theoretical amount that would arise using the Singapore basic tax rate as follows: Bank In $ millions Profit before tax 5,074 5,304 4,335 4,480 Prima facie tax calculated at a tax rate of 17% (2015: 17%) Effect of different tax rates in other countries (1) 9 (4) 7 Net income not subject to tax (58) (54) (37) (104) Net income taxed at concessionary rate (114) (79) (114) (79) Expenses not deductible for tax Others 14 (69) Income tax expense charged to income statement Deferred income tax relating to available-for-sale financial assets and others of $12 million (2015: $7 million) was credited directly to equity for the Group. Deferred income tax relating to available-for-sale financial assets and others of $4 million (2015: $7 million) was credited to equity for the Bank. Refer to Note 20 for further information on deferred tax assets/liabilities. 18
21 93B13 Classification of Financial Instruments In $ millions 2016 Held for trading Designated at fair value through profit or loss Loans and receivables /amortised cost Availablefor-sale Held to maturity Hedging derivatives Assets Cash and balances with central banks 2,822-20,783 3, ,840 Government securities and treasury bills 8, ,441 1,962-33,401 Due from banks 5,852-22,966 1, ,000 Derivatives 25, ,778 Bank and corporate securities 7, ,145 16, ,417 Loans and advances to customers , ,516 Other financial assets , ,694 Total financial assets 50, ,645 43,323 1, ,646 Other asset items outside the scope 7,912 of FRS 39 (a) Total assets 481,558 Total Liabilities Due to banks , ,915 Deposits and balances from customers 81 1, , ,446 Derivatives 24, ,525 Other financial liabilities 2,303-12, ,713 Other debt securities 4, , ,345 Due to holding company - - 2, ,102 Subordinated term debts - - 2, ,457 Total financial liabilities 31,594 1, , ,503 Other liability items outside the scope 1,140 of FRS 39 (b) Total liabilities 433,643 19
22 In $ millions 2015 Held for trading Designated at fair value through profit or loss Loans and receivables /amortised cost Available -for-sale Held to maturity Hedging derivatives Assets Cash and balances with central banks ,363 4, ,828 Government securities and treasury bills 7, ,267 1,665-34,501 Due from banks 4,961-32, ,274 Derivatives 23, ,631 Bank and corporate securities 9, ,380 13, ,073 Loans and advances to customers - 1, , ,289 Other financial assets , ,288 Total financial assets 45,042 1, ,611 43,825 1, ,884 Other asset items outside the scope of 7,963 FRS 39 (a) Total assets 457,847 Total Liabilities Due to banks , ,251 Deposits and balances from customers 91 1, , ,134 Derivatives 22, ,191 Other financial liabilities , ,286 Other debt securities 4,114 1,424 30, ,194 Due to holding company - - 2, ,133 Subordinated term debts - - 4, ,026 Total financial liabilities 28,062 2, , ,215 Other liability items outside the scope of 1,077 FRS 39 (b) Total liabilities 415,292 (a) Includes associates, goodwill and intangibles, properties and other fixed assets and deferred tax assets (b) Includes current tax liabilities, deferred tax liabilities and provision for loss in respect of off-balance sheet credit exposures 20
23 In $ millions 2016 Held for trading Designated at fair value through profit or loss Loans and receivables/ amortised cost Bank Available -for-sale Held to maturity Hedging derivatives Assets Cash and balances with central banks 2,822-15,999 1, ,001 Government securities and treasury bills 6, ,467 1,962-27,281 Due from banks 5,200-18,589 1, ,971 Derivatives 23, ,994 Bank and corporate securities 6, ,914 13, ,700 Loans and advances to customers , ,744 Other financial assets - - 7, ,428 Due from subsidiaries , ,910 Total financial assets 45, ,125 34,828 1, ,029 Other asset items outside the scope of 12,818 FRS 39 (a) Total assets 422,847 Total Liabilities Due to banks 71-12, ,694 Deposits and balances from customers , ,934 Derivatives 22, ,944 Other financial liabilities 832-8, ,237 Other debt securities 4, , ,393 Due to holding company - - 1, ,029 Due to subsidiaries , ,205 Subordinated term debts - - 2, ,457 Total financial liabilities 28,234 1, , ,893 Other liability items outside the scope of 1,102 FRS 39 (b) Total liabilities 381,995 21
24 In $ millions 2015 Held for trading Designated at fair value through profit or loss Loans and receivables /amortised cost Bank Available -for-sale Held to maturity Hedging derivatives Assets Cash and balances with central banks 241-9,305 1, ,021 Government securities and treasury bills 6, ,314 1,665-29,181 Due from banks 4,550-27, ,704 Derivatives 22, ,791 Bank and corporate securities 7, ,789 11, ,978 Loans and advances to customers - 1, , ,287 Other financial assets - - 8, ,652 Due from subsidiaries , ,924 Total financial assets 40,687 1, ,089 35,390 1, ,538 Other asset items outside the scope of 12,728 FRS 39 (a) Total assets 396,266 Total Liabilities Due to banks , ,797 Deposits and balances from customers , ,082 Derivatives 21, ,386 Other financial liabilities 555-7, ,716 Other debt securities 4,114 1,344 29, ,554 Due to holding company - - 1, ,085 Due to subsidiaries , ,432 Subordinated term debts - - 4, ,026 Total financial liabilities 26,171 2, , ,078 Other liability items outside the scope of 1,010 FRS 39 (b) Total liabilities 360,088 (a) Includes investments in subsidiaries, associates, properties and other fixed assets and deferred tax assets (b) Includes current tax liabilities, deferred tax liabilities and provision for loss in respect of-balance sheet credit exposures Financial assets and liabilities are presented net when there is a legally enforceable right to offset the recognised amounts, and there is intention to settle them on a net basis or to realise the asset and settle the liability simultaneously. Financial assets and liabilities offset on the balance sheet As at 31 December 2016, there was no offset of financial assets and liabilities. As at 31 December 2015, Loans and advances to customers of $170 million were offset against Deposits and balances from customers of $170 million because contractually there is a legally enforceable right to offset these amounts at both the Group and Bank, and intent to settle the loans and the deposits simultaneously at maturity or termination dates. Financial assets and liabilities subject to netting agreement but not offset on the balance sheet enters into master netting arrangements with counterparties where it is appropriate and feasible to do so to mitigate counterparty risk. The credit risk associated with favourable contracts is reduced by a master netting arrangement to the extent that if an event of default occurs, all amounts with the counterparty are settled on a net basis. Master netting arrangements do not result in an offset of financial assets and liabilities on the balance sheet, as the legal right to offset the transactions is conditional upon default. These agreements include derivative master agreements (including the International Swaps and Derivatives Association (ISDA) Master Agreement), global master repurchase agreements and global securities lending agreements. The collateral received and pledged under these agreements is generally conducted under terms that are in accordance with normal market practice. In these agreements, the counterparty is typically allowed to sell or re-pledge those non-cash collateral (i.e. securities) lent or transferred, but has an obligation to return the securities at maturity. If the securities decrease in value, the Group may, in certain circumstances, be required to place additional cash collateral, and typically the counterparty has recourse only to the securities. 22
25 In addition, the Group receives cash and other collateral such as marketable securities to reduce its credit exposure. also engages in a variety of counterparty credit mitigation arrangements in addition to netting and collateral arrangements. The disclosures set out in the tables below pertain to financial assets and liabilities that are not offset in the Group s and Bank s balance sheets but are subject to enforceable master netting arrangement or similar agreement that covers similar financial instruments. The disclosures enable the understanding of both the gross and net amounts, as well as provide additional information on how such credit risk is mitigated. Related amounts not offset on balance sheet Types of financial assets/liabilities Carrying Financial instruments not in Gross recognised financial Financial collateral Net In $ millions amounts on balance sheet (A) scope of offsetting disclosures (B) instruments in scope (A B = C + D +E) Financial instruments (C) received/ pledged (D) amounts in scope (E) 2016 Financial Assets Derivatives 25,778 8,720 (a) 17,058 14,788 (a) 1, Reverse repurchase agreements 6,845 (b) 228 6,617-6,617 - Securities borrowings 74 (c) Total 32,697 8,948 23,749 14,845 8, Financial Liabilities Derivatives 24,525 6,863 (a) 17,662 14,788 (a) 1,750 1,124 Repurchase agreements 1,423 (d) 1, Short sale of securities 2,303 (e) 845 1,458 1, Total 28,251 9,051 19,200 16,246 1,830 1, Financial Assets Derivatives 23,631 11,203 (a) 12,428 11,047 (a) 1, Reverse repurchase agreements 5,227 (b) 124 5,103-5,097 6 Securities borrowings 47 (c) Total 28,905 11,327 17,578 11,091 6, Financial Liabilities Derivatives 22,191 8,551 (a) 13,640 11,047 (a) 2, Repurchase 2,930 (d) 1,050 1,880-1,880 - agreements Short sale of securities 886 (e) Total 26,007 10,162 15,845 11,372 3, (a) Related amounts under Financial instruments are prepared on the same basis as netting arrangements recognised for computation of Capital Adequacy Ratio (CAR) as set out under MAS Notice 637 (unaudited), which incorporates a conservative stance on enforceable netting. Accordingly, the amounts shown under Financial instruments not in scope of offsetting disclosures are those where either no netting agreement exists or where the netting agreement has not been recognised for computation of CAR (b) Reverse repurchase agreements are presented under separate line items on the balance sheet, namely Cash and balances with central banks, Due from banks and Loans and advances to customers (c) Cash collateral pledged under securities borrowings are presented under Other assets on the balance sheet (d) Repurchase agreements are presented under separate line items on the balance sheet, namely Due to banks and Deposits and balances from customers (e) Short sale of securities are presented under Other liabilities on the balance sheet 23
26 The Bank Related amounts not offset on balance sheet Types of financial assets/liabilities In $ millions 2016 Financial Assets Carrying amounts on balance sheet (A) Financial instruments not in scope of offsetting disclosures (B) Gross recognised financial instruments in scope (A - B= C + D +E) Financial instruments (C) Financial collateral received/ pledged (D) Net amounts in scope (E) Derivatives 23,994 6,377 (a) 17,617 15,104 (a) 1, Reverse repurchase 6,832 (b) 228 6,604-6,604 - agreements Securities borrowings 74 (c) Total 30,900 6,605 24,295 15,161 8, Financial Liabilities Derivatives 22,944 4,959 (a) 17,985 15,104 (a) 2, Repurchase agreements 1,003 (d) Total 23,947 5,891 18,056 15,104 2, Financial Assets Derivatives 22,791 8,665 (a) 14,126 11,405 (a) 1,073 1,648 Reverse repurchase 5,119 (b) 16 5,103-5,097 6 agreements Securities borrowings 47 (c) Total 27,957 8,681 19,276 11,449 6,170 1,657 Financial Liabilities Derivatives 21,386 7,389 (a) 13,997 11,405 (a) 2, Repurchase agreements 2,164 (d) 284 1,880-1,880 - Total 23,550 7,673 15,877 11,405 3, (a) Related amounts under Financial instruments are prepared on the same basis as netting arrangements recognised for computation of Capital Adequacy Ratio (CAR) as set out under MAS Notice 637 (unaudited), which incorporates a conservative stance on enforceable netting. Accordingly, the amounts shown under Financial instruments not in scope of offsetting disclosures are those where either no netting agreement exists or where the netting agreement has not been recognised for computation of CAR (b) Reverse repurchase agreements are presented under separate line items on the balance sheet, namely Cash and balances with central banks, Due from banks and Loans and advances to customers (c) Cash collateral pledged under securities borrowings are presented under Other assets on the balance sheet (d) Repurchase agreements are presented under separate line items on the balance sheet, namely Due to banks and Deposits and balances from customers 24
27 14 Cash and Balances with Central Banks Bank 94BIn $ millions Cash on hand 2,938 3,069 2,697 2,869 Non-restricted balances with central banks 17,194 9,008 12,460 3,270 Cash and cash equivalents 20,132 12,077 15,157 6,139 Restricted balances with central banks (a) 6,708 6,751 4,844 4,882 Total 26,840 18,828 20,001 11,021 (a) Mandatory balances with central banks 15 Government Securities and Treasury Bills In $ millions Held for trading Availablefor-sale Held to maturity 2016 Singapore Government securities and 3,567 6,454 1,962 11,983 treasury bills (a) Other government securities and 5,431 15,987-21,418 treasury bills (b) Total 8,998 22,441 1,962 33, Singapore Government securities and 2,569 8,078 1,665 12,312 treasury bills (a) Other government securities and 5,000 17,189-22,189 treasury bills (b) Total 7,569 25,267 1,665 34,501 (a) Includes financial assets transferred of $70 million (2015: $579 million) (See Note 18) (b) Includes financial assets transferred of $2,740 million (2015: $1,900 million) (See Note 18) Total In $ millions Held for trading Bank Availablefor-sale Held to maturity 2016 Singapore Government securities and 3,567 6,454 1,962 11,983 treasury bills (a) Other government securities and 3,285 12,013-15,298 treasury bills (b) Total 6,852 18,467 1,962 27, Singapore Government securities and 2,569 8,078 1,665 12,312 treasury bills (a) Other government securities and 3,633 13,236-16,869 treasury bills (b) Total 6,202 21,314 1,665 29,181 (a) Includes financial assets transferred of $70 million (2015: $579 million) (See Note 18) (b) Includes financial assets transferred of $1,130 million (2015: $1,550 million) (See Note 18) Total 25
28 56B 57B 58B 59B 60B DBS Bank Ltd. and its subsidiaries 25B16 Bank and Corporate Securities In $ millions Held for trading Designated at fair value through profit or loss Loans and receivables Availablefor-sale 2016 Bank and corporate debt securities (a) 5, ,299 14,897 41,593 Less: Impairment allowances - - (154) - (154) Equity securities 2, ,568 3,978 Total 7, ,145 16,465 45, Bank and corporate debt securities (a) 7, ,530 11,884 37,145 Less: Impairment allowances - - (150) - (150) Equity securities 1, ,697 3,078 Total 9, ,380 13,581 40,073 (a) Includes financial assets transferred of $414 million (2015: $787 million) (See Note 18) Total Held for trading Bank Designated at fair value through profit or loss Loans and receivables Availablefor-sale In $ millions Total 2016 Bank and corporate debt securities 4, ,066 12,479 37,923 Less: impairment allowances - - (152) - (152) Equity securities 2, ,520 3,929 Total 6, ,914 13,999 41, Bank and corporate debt securities 5, ,936 10,220 33,116 Less: impairment allowances - - (147) - (147) Equity securities 1, ,628 3,009 Total 7, ,789 11,848 35, Loans and Advances to Customers 26BIn $ millions Gross 305, , , ,047 Less: Specific allowances 1, General allowances 2,629 2,761 2,195 2, , , , ,287 56BAnalysed by product 57BLong-term loans 136, , , ,985 58BShort-term facilities 65,894 62,976 54,928 51,722 59BHousing loans 64,465 58,569 55,419 49,773 60BTrade loans 38,751 40,964 28,313 28,567 61BGross total 305, , , ,047 62BAnalysed by currency Singapore dollar 123, , , ,547 Hong Kong dollar 35,588 34,386 14,416 12,631 US dollar 102,120 89,283 90,242 77,150 Chinese yuan 11,577 19,516 3,089 8,628 Others 32,397 26,099 21,339 16,091 Gross total 305, , , ,047 Refer to Note 42.4 for breakdown of loans and advances to customers by geography and by industry. Bank 26
29 The table below shows the movements in specific and general allowances for loans and advances to customers during the year: In $ millions 2016 Specific allowances Balance at 1 January Charge/(Writeback) to income statement Net write-off during the year Exchange and other movements Balance at 31 December Manufacturing (143) Building and construction (26) Housing loans General commerce (146) Transportation, storage and (261) communications Financial institutions, (59) 1 15 investment and holding companies Professionals and private (116) 4 71 individuals (excluding housing loans) Others (37) Total specific allowances 821 1,111 (788) 126 1,270 Total general allowances 2,761 (111) - (21) 2,629 Total allowances 3,582 1,000 (788) 105 3, Specific allowances Manufacturing (303) Building and construction (43) Housing loans 8 (2) General commerce (133) Transportation, storage and (87) 3 94 communications Financial institutions, (48) 4 60 investment and holding companies Professionals and private (99) 2 58 individuals (excluding housing loans) Others (35) Total specific allowances (748) Total general allowances 2, ,761 Total allowances 3, (748) 88 3,582 27
30 Bank Balance at 1 January Charge/(Writeback) to income statement Net write-off during the year Exchange and other movements Balance at 31 December In $ millions 2016 Specific allowances Manufacturing (66) Building and construction (25) Housing loans 4 1 (1) - 4 General commerce (68) Transportation, storage and communications Financial institutions, investment and holding companies Professionals and private individuals (excluding housing loans) (245) (48) 1 36 Others (34) Total specific allowances (487) Total general allowances 2,291 (80) - (16) 2,195 Total allowances 2, (487) 133 3, Specific allowances Manufacturing (152) Building and construction (28) Housing loans General commerce (27) 3 56 Transportation, storage and (83) 4 75 communications Financial institutions, investment 38 3 (39) - 2 and holding companies Professionals and private (48) 1 27 individuals (excluding housing loans) Others (4) 4 81 Total specific allowances (381) Total general allowances 2, ,291 Total allowances 2, (381) 52 2,760 Included in loans and advances to customers are loans designated at fair value, as follows: Bank 27BIn $ millions Fair value designated loans and advances and related credit derivatives/enhancements Maximum credit exposure 459 1, ,269 Credit derivatives/enhancements protection (459) (1,269) (459) (1,269) bought Cumulative change in fair value arising from (98) (280) (98) (280) changes in credit risk Cumulative change in fair value of related credit derivatives/enhancements Changes in fair value arising from changes in credit risk are determined as the amount of change in fair value that is not attributable to changes in market conditions that give rise to market risk. These changes in market conditions include changes in a benchmark interest rate, foreign exchange rate or index of prices or rates. During the year, the amount of change in the fair value of the loans and advances attributable to credit risk was a gain of $182 million (2015: loss of $86 million) for both the Group and Bank. During the year, the amount of change in the fair value of the related credit derivatives/enhancements was a loss of $182 million for both the Group and Bank (2015: gain of $86 million). 28
31 18 Financial Assets Transferred transfers financial assets to third parties or structured entities in the course of business, for example when it pledges securities as collateral for repurchase agreements or when it undertakes securities lending arrangements. Transferred assets are derecognised in the Group s financial statements when substantially all of their risks and rewards are also transferred. Among them is pledged collateral (mainly cash) for derivative transactions under credit support annexes agreements. Derecognised assets that were subject to the Group s partial continuing involvement were not material in 2016 and Where the Group retains substantially all the risks and rewards of the transferred assets, they continue to be recognised in the Group s financial statements. These assets are described below. Securities Securities transferred under repurchase agreements and securities lending arrangements are generally conducted under terms in line with normal market practice. The counterparty is typically allowed to sell or re-pledge the securities but has an obligation to return them at maturity. If the securities decrease in value, the Group may, in certain circumstances, be required to place additional cash collateral. The counterparty typically has no further recourse to the Group s other assets beyond the transferred securities. For repurchase agreements, the securities transferred are either classified as fair value through profit or loss or available-for-sale. receives cash in exchange and records a financial liability for the cash received. The Group also pledged assets to secure its short position in securities and to facilitate settlement operations. The fair value of the associated liabilities approximates the carrying amount of $2,881 million (2015: $3,255 million) for the Group and $1,003 million (2015: $2,164 million) for the Bank, which are recorded under Due to banks, Deposits and balances from customers and Other liabilities on the balance sheet. For securities lending transactions, the securities lent are classified as available-for-sale or loans and receivables on the balance sheet, and the carrying amount approximates the fair value. As the Group mainly receives other financial assets in exchange, the associated liabilities recorded are not material. Bank 95BIn $ millions Securities pledged and transferred Singapore Government securities and treasury bills Other government securities and treasury bills 2,740 1,900 1,130 1,550 Bank and corporate debt securities Total securities pledged and transferred 3,224 3,266 1,200 2,129 Covered bonds Pursuant to the Bank s Global Covered Bond Programme, selected pools of residential mortgages originated by the Bank have been assigned to a bankruptcy-remote structured entity, Bayfront Covered Bonds Pte Ltd (see Notes 21.2 and 29.4). These residential mortgages continue to be recognised on the Bank s balance sheet as the Bank remains exposed to the risks and rewards associated with them. As at 31 December 2016, the carrying value of the covered bonds in issue was $2,227 million (2015: $1,412 million), while the carrying value of assets assigned was $8,636 million (2015: $4,268 million). The difference in values is attributable to an intended over-collateralisation required to maintain the credit ratings of the covered bonds in issue, and additional assets assigned to facilitate future issuances. Other financial assets also enters into structured funding transactions where it retains the contractual rights to receive cash flows of financial assets extended to third parties, but assumes a contractual obligation to pay these cash flows under the issued notes. The carrying amounts and fair values of these financial assets and liabilities of the Group and the Bank both amount to $516 million (2015: $1,355 million). 29
32 19 Other Assets Bank In $ millions Accrued interest receivable 1,165 1, Deposits and prepayments Receivables from securities business Sundry debtors and others 5,495 6,440 3,369 4,567 Cash collateral pledged (a) 2,968 2,957 2,968 2,955 Deferred tax assets (Note 20) Total 11,027 11,587 7,632 8,818 (a) Mainly relates to cash collateral pledged in respect of derivative portfolios 20 Deferred Tax Assets/Liabilities Deferred tax assets and liabilities are offset when there is a legally enforceable right to set off current tax assets against current tax liabilities and when the deferred income taxes relate to the same tax authority. The deferred tax assets and liabilities are determined after appropriate offsetting, as shown in Other assets (Note 19) and Other liabilities (Note 28) respectively. Deferred tax assets and liabilities comprise the following temporary differences: Bank In $ millions Deferred income tax assets Allowances for loan losses Available-for-sale financial assets and others Other temporary differences Amounts offset against deferred tax liabilities (206) (158) (124) (125) Total Deferred income tax liabilities Accelerated tax depreciation Available-for-sale financial assets and others Other temporary differences Amounts offset against deferred tax assets (206) (158) (124) (125) Total Net deferred tax assets
33 21 Subsidiaries and Consolidated Structured Entities 28BIn $ Bank millions Investment in subsidiaries (a)(b) 11,471 11,407 Due from subsidiaries 14,910 13,924 Total 26,381 25,331 (a) (b) The carrying amounts of certain investments which are designated as hedged items in a fair value hedge are adjusted for fair value changes attributable to the hedged risks The carrying amounts presented are net of impairment allowances 21.1 Main operating subsidiaries The main operating subsidiaries within the Group are listed below: Name of subsidiary Country of incorporation Effective shareholding % Commercial Banking DBS Bank (Hong Kong) Limited* Hong Kong DBS Bank (China) Limited* China DBS Bank (Taiwan) Limited* Taiwan PT Bank DBS Indonesia* Indonesia Stockbroking DBS Vickers Securities Holdings Pte Ltd Singapore * Audited by PricewaterhouseCoopers network firms outside Singapore s main subsidiaries are regulated banks and non-bank financial institutions. Statutory, contractual or regulatory requirements as well as protective rights of non-controlling interests may restrict the ability of the Bank to access and transfer assets freely to or from other entities within the Group and to settle liabilities of the Group. Since the Group did not have any material non-controlling interests as at the balance sheet dates, any protective rights associated with these did not give rise to significant restrictions in 2015 and Refer to Note 35 for information on non-controlling interests Subsidiary classified as asset held for sale DBS China Square Limited (DCS), a wholly-owned subsidiary of the Bank, was held as an asset for sale. Its carrying amount was $101 million as at 31 December Refer to Note 48 for further information on the sale transaction Consolidated structured entity The structured entity consolidated by the Group is listed below: Name of entity Purpose of consolidated structured entity Country of incorporation Bayfront Covered Bonds Pte Ltd Covered bond guarantor Singapore Bayfront Covered Bonds Pte Ltd is a bankruptcy-remote structured entity established in conjunction with the Bank s USD 10 billion Global Covered Bond Programme (see Note 29.4). As part of the contractual structures that are integral to this programme, the Bank provides funding and hedging facilities to it. 31
34 22 Associates 96BIn $ millions Quoted equity securities (a) Unquoted equity securities (b) Sub-total Share of post-acquisition reserves Total 890 1,000 (a) The market value of the quoted associate amounted to $60 million (2015: $51 million) and was based on the last traded price on 1 September 2016 prior to its trading suspension (b) The carrying amounts of certain investments which are designated as hedged items in a fair value hedge are adjusted for fair value changes attributable to the hedged risks 97BIn $ Bank millions Quoted equity securities (a) Unquoted equity securities (b) Total (a) The market value of the quoted associate amounted to $9 million (2015: $8 million) and was based on the last traded price on 1 September 2016 prior to trading suspension (b) The carrying amounts of certain investments which are designated as hedged items in a fair value hedge are adjusted for fair value changes attributable to the hedged risks s share of income and expenses, assets and liabilities and off-balance sheet items of the associates at 31 December are as follows: In $ millions Income statement Share of income Share of expenses (202) (152) Balance sheet Share of total assets 1,701 1,721 Share of total liabilities Off-balance sheet Share of contingent liabilities and commitments # # # Amount under $500, Main associates The main associates of the Group are listed below: Effective shareholding % Name of associate Country of incorporation Unquoted Central Boulevard Development Pte Ltd** Singapore Network for Electronic Transfers (Singapore) Pte Ltd Singapore Changsheng Fund Management Company** China ** Audited by other auditors As of 31 December 2016 and 31 December 2015, no associate was individually material to the Group. As a noncontrolling shareholder, the Group s ability to receive dividends is subject to agreement with other shareholders. The associates may also be subject to statutory, contractual or regulatory requirements restricting dividend payments or to repay loans or advances made. s share of commitments and contingent liabilities of the associates as well as its commitments to finance or otherwise provide resources to them are not material. 32
35 23 Unconsolidated Structured Entities Unconsolidated structured entities are those structured entities as defined by FRS 112 and are not controlled by the Group. To facilitate customer transactions and for specific investment opportunities, the Group in the normal course of business enters into transactions with a range of counterparties, some of which would be defined as unconsolidated structured entities. While the economic exposures may be the same as those to other type of entities, FRS 112 specifically requires companies to disclose such exposures arising from transactions with unconsolidated structured entities. The table below reflects exposures to third party securitisation structures where the Group holds an interest in the normal course of business. As is the case with other types of counterparties, the carrying amount from transactions with unconsolidated structured entities have been included in the Group s financial statements. The risks arising from such transactions are subject to the Group s risk management practices. The table below represents the Group s and Bank s maximum exposure to loss which for on-balance sheet assets and liabilities is represented by the carrying amount and does not reflect mitigating effects from the availability of netting arrangements and financial instruments that the Group may utilise to economically hedge the risks inherent in third party structured entities or risk-reducing effects of collateral or other credit enhancements. 98BIn $ millions Derivatives Bank and corporate securities 1,267 1,317 1,241 1,221 Loans and advances to customers Other assets # 1 # 1 Total assets 1,286 1,429 1,260 1,333 Commitments and guarantees Maximum Exposure to Loss 1,309 1,632 1,283 1,536 Bank Derivatives Total liabilities # Amount under $500,000 also sponsors third party structured entities, primarily by acting as lead arranger, underwriter or book runner for the issuance of securities by clients or by providing nominee services. Income, in the nature of fees from and assets transferred by all parties to sponsored structured entities, was not material. The total assets of the third party structured entities are not considered meaningful for the purposes of understanding the related risks since they are neither representative of the Group s exposure nor the income earned, and so have not been presented. has not provided any specific non-contractual financial support during the year and does not expect to provide non-contractual support to these third party structured entities in the future. 24 Acquisition On 31 October 2016, the Bank agreed to acquire the wealth management and retail banking business of Australia and New Zealand Banking Group Limited (ANZ) in five markets for approximately $110 million above book value. The portfolio of businesses being acquired is in Singapore, Hong Kong, China, Taiwan and Indonesia, representing total deposits of $17 billion and loans of $11 billion. The acquisition of the businesses in each jurisdiction is independent of each other. Subject to obtaining regulatory approvals, the transaction is expected to be completed progressively from the second quarter of 2017 onwards, and the target is for full completion in all markets by early The transaction has no impact to 2016 s financial statements. 33
36 1B 2B 4B 5B 6B 7B DBS Bank Ltd. and its subsidiaries 63B25 Properties and Other Fixed Assets Subtotal of owner-occupied In $ millions Investment properties Owneroccupied properties Other fixed assets (a) properties and other fixed assets Total (1) (2) (3) (4)=(2)+(3) (5)=(1)+(4) 1B2016 2BCost Balance at 1 January ,840 2,369 2,996 Additions Disposals (25) (2) (115) (117) (142) Exchange differences Balance at 31 December ,056 2,601 3,204 Less: Accumulated depreciation Balance at 1 January ,111 1,250 1,422 Depreciation charge Disposals (15) (2) (96) (98) (113) Exchange differences Balance at 31 December ,279 1,439 1,604 5BLess: Allowances for impairment Net book value at 31 December ,134 1,572 Market value at 31 December B2015 7BCost Balance at 1 January ,553 2,091 2,735 Additions Disposals (24) (53) (69) (122) (146) Transfers (2) Exchange differences Balance at 31 December ,840 2,369 2,996 Less: Accumulated depreciation Balance at 1 January ,033 1,203 Depreciation charge Disposals (6) (11) (58) (69) (75) Transfers (1) Exchange differences Balance at 31 December ,111 1,250 1,422 10BLess: Allowances for impairment Net book value at 31 December ,092 1,547 Market value at 31 December (a) Refers to computer hardware, software, office equipment, furniture and fittings and other fixed assets 34
37 11B 12B 13B 14B DBS Bank Ltd. and its subsidiaries Subtotal of owner-occupied In $ millions Investment properties Owneroccupied properties Other fixed assets (a) properties and other fixed assets Total (1) (2) (3) (4)=(2)+(3) (5)=(1)+(4) 11B BCost Balance at 1 January ,289 1,445 1,483 Additions Disposals - - (37) (37) (37) Exchange differences - - # - - Balance at 31 December ,479 1,637 1,675 Less: Accumulated depreciation Balance at 1 January Depreciation charge Disposals - - (30) (30) (30) Exchange differences - - # - - Balance at 31 December ,005 Net book value at 31 December Market value at 31 December B BCost Balance at 1 January ,078 1,233 1,270 Additions Disposals - - (32) (32) (32) Transfers 1 (1) - (1) - Exchange differences Balance at 31 December ,289 1,445 1,483 Less: Accumulated depreciation Balance at 1 January Depreciation charge Disposals - - (23) (23) (23) Transfers 1 (1) - (1) - Exchange differences Balance at 31 December Net book value at 31 December Market value at 31 December # Amount under $500,000 (a) Refers to computer hardware, software, office equipment, furniture and fittings and other fixed assets 25.1 PWC Building was held as an asset for sale. Its net book value was $380 million as at 31 December 2016 (2015: $386 million) and its fair value based on the agreed property value in the sale of DBS China Square Limited (DCS), which owns PWC Building, was $747 million. As at 31 December 2015, its fair value was independently appraised at $711 million. Refer to Note 48 for the subsequent event disclosure on the sale of DCS The market values of the other properties are determined using an investment method, or using a combination of comparable sales and investment methods. The properties are classified under Level 3 of the fair value hierarchy and the significant unobservable input used for valuation is market yields. As at 31 December 2016, there were no transfers into or out of Level 3. Bank 35
38 leases out investment properties under operating leases. The leases typically run for an initial period of one to five years, and may contain an option to renew the lease after that date at which time all terms will be renegotiated. The minimum lease receivables as at the balance sheet date are as follows: Bank In $ millions Minimum lease receivables (a) Not later than 1 year Later than 1 year but not later than 5 years Total # Amount under $500,000 (a) Includes lease receivables from operating leases under PWC Building, an asset held for sale. Refer to Note 48 for subsequent event disclosure on the sale of DBS China Square Limited, which owns PWC Building 26 Goodwill and Intangibles The carrying amounts of the Group s and Bank s goodwill and intangibles arising from business acquisitions are as follows: Bank 99BIn $ millions DBS Bank (Hong Kong) Limited 4,631 4, Others Total 5,117 5, The carrying amounts of the CGUs are reviewed at least once a year to determine if the goodwill associated with them should be impaired. If a CGU s carrying amount exceeds its recoverable value, a goodwill impairment charge is recognised in the income statement. The recoverable value is determined based on a value-in-use calculation. The CGU s five-year projected cash flows, taking into account projected regulatory capital requirements, are discounted by its cost of capital to derive its present value. To derive the value beyond the fifth year, a long-term growth rate is imputed to the fifth-year cash flow and then discounted by the cost of capital to derive the terminal value. The long-term growth rate used does not exceed the historical long-term growth rate of the market the CGU operates in. The recoverable value is the sum of the present value of the five-year cash flows and the terminal value A growth rate of 4.5% (2015: 4.5%) and discount rate of 9.0% (2015: 9.0%) were assumed in the value-in-use calculation for DBS Bank (Hong Kong) Limited s franchise. The process of evaluating goodwill impairment involves management judgement and prudent estimates of various factors including future cash flows as well as the cost of capital and long-term growth rates. The results can be highly sensitive to the assumptions used. Management believes that any reasonably possible change in the key assumptions would not cause the carrying amount of the operating unit to exceed its recoverable amount at 31 December However, if conditions in Hong Kong and the banking industry deteriorate and turn out to be significantly worse than anticipated in the Group s performance forecast, the goodwill may be further impaired in future periods. 36
39 27 Deposits and Balances from Customers 29BIn $ Bank millions BAnalysed by currency Singapore dollar 152, , , ,525 US dollar 112, ,298 87,620 84,815 Hong Kong dollar 36,234 31,849 5,434 5,787 Chinese yuan 9,822 14, ,470 Others 37,168 31,715 21,592 17,485 Total 347, , , , BAnalysed by product Savings accounts 140, , , ,440 Current accounts 73,984 65,989 62,134 55,852 Fixed deposits 130, ,269 88,553 82,007 Other deposits 2,667 2,811 1,247 1,783 Total 347, , , , Other Liabilities Bank In $ millions Cash collateral received (a) 1, , Accrued interest payable Provision for loss in respect of off-balance sheet credit exposures Payable in respect of securities business Sundry creditors and others (b) 9,645 8,648 6,806 5,999 Current tax liabilities Short sale of securities 2, Deferred tax liabilities (Note 20) Total 15,853 12,363 10,339 8,726 (a) Mainly relates to cash collateral received in respect of derivative portfolios (b) Includes income received in advance of $1,493 million (2015: $800 million) and $1,141 million (2015: $800 million) for the Group and Bank respectively arising from a 15-year regional distribution agreement entered with Manulife 37
40 80B 78B 79B DBS Bank Ltd. and its subsidiaries 29 Other Debt Securities Bank In $ millions Negotiable certificates of deposit (Note 29.1) 2,137 1,200 1, Senior medium term notes (Note 29.2) 4,010 7,986 4,010 7,986 Commercial papers (Note 29.3) 11,586 19,174 11,586 19,174 Covered bonds (Note 29.4) 2,227 1,412 2,227 1,412 Other debt securities (Note 29.5) 5,385 6,422 5,074 5,817 Total 25,345 36,194 24,393 34,554 Due within 1 year 17,539 26,736 17,296 25,838 Due after 1 year 7,806 9,458 7,097 8,716 Total 25,345 36,194 24,393 34, Negotiable certificates of deposit issued and outstanding at 31 December are as follows: 74BIn $ millions 75B Currency Interest Rate and Repayment Terms Issued by the Bank and other subsidiaries HKD 2.25 % to 4.22%, payable quarterly HKD 3M HIBOR %, payable quarterly HKD 3M HIBOR +0.2%, payable quarterly HKD 2.5% to 4.2%, payable annually HKD Zero-coupon, payable on maturity AUD 1.74% to 2.51%, payable on maturity 1, , USD 0.7%, payable on maturity IDR 10.4% to 10.65%, payable on maturity TWD 0.438% to 0.468%, payable on maturity INR Zero-coupon, payable on maturity CNY 2.97%, payable on maturity Total 2,137 1,200 1, Bank The outstanding negotiable certificates of deposit as at 31 December 2016 were issued between 22 August 2008 and 22 December 2016 (2015: 22 August 2008 and 15 December 2015) and mature between 5 January 2017 and 16 March 2021 (2015: 5 January 2016 and 16 March 2021) Senior medium term notes issued and outstanding at 31 December are as follows: 77BIn $ millions 78B 79Bank 80BCurrency Interest Rate and Repayment Terms Issued by the Bank USD 1.27% to 1.41%, payable quarterly GBP Floating rate note, payable quarterly - 3,604-3,604 USD 2.35%, payable semi-annually 1,447 1,418 1,447 1,418 USD Floating rate note, payable quarterly 1,273 2,658 1,273 2,658 USD 1.454%, payable annually HKD 2.24%, payable quarterly CNH 4.4%, payable annually Total 4,010 7,986 4,010 7,986 The senior medium term notes were issued by the Bank under its USD 30 billion Global Medium Term Note Programme. The outstanding senior medium term notes as at 31 December 2016 were issued between 21 February 2012 and 7 September 2016 (2015: 21 February 2012 and 10 September 2015) and mature between 20 January 2017 and 15 January 2020 (2015: 14 January 2016 and 15 January 2020) The zero-coupon commercial papers which are payable on maturity were issued by the Bank under its USD 5 billion Euro Commercial Paper Programme and USD 15 billion US Commercial Paper Programme. The outstanding notes as at 31 December 2016 were issued between 21 September 2016 and 16 December 2016 (2015: 2 July 2015 and 30 December 2015) and mature between 3 January 2017 and 12 April 2017 (2015: 4 January 2016 and 24 May 2016). 38
41 29.4 To augment its sources of wholesale funding, the Bank established a USD 10 billion Global Covered Bond Programme on 16 June A covered bond is a senior obligation of the Bank backed by a cover pool comprising assets that have been ring-fenced via contractual structures in a bankruptcy-remote structured entity, Bayfront Covered Bonds Pte Ltd. Bayfront Covered Bonds Pte Ltd has provided an unconditional and irrevocable guarantee, which is secured over the cover pool, to the covered bond holders. The outstanding covered bonds as at 31 December 2016 were issued between 6 August 2015 and 3 June 2016 (2015: on 6 August 2015) and mature between 6 August 2018 and 3 June 2019 (2015: on 6 August 2018) Other debt securities issued and outstanding at 31 December are as follows: 81BIn $ millions 82B 83Bank Type Issued by the Bank and other subsidiaries Equity linked notes 1,521 1,603 1,501 1,600 Credit linked notes 1,202 2,058 1,202 2,058 Interest linked notes 2,042 1,817 2,042 1,737 Foreign exchange linked notes Fixed rate bonds Total 5,385 6,422 5,074 5,817 The outstanding securities as at 31 December 2016 were issued between 4 October 2011 and 30 December 2016 (2015: 31 March 2006 and 31 December 2015) and mature between 3 January 2017 and 30 August 2046 (2015: 4 January 2016 and 13 November 2045). 30 Due to Subsidiaries Bank 101BIn $ millions Subordinated term debts issued to DBS Capital Funding Corporation II (Note 30.1) 1,500 1,500 Due to subsidiaries 39,705 22,932 Total 41,205 24, The $1,500 million 5.75% subordinated note was issued on 27 May 2008 by the Bank to DBS Capital Funding II Corporation, both wholly-owned subsidiaries of DBSH. Interest is payable in arrears on 15 June and 15 December each year at a fixed rate of 5.75% per annum up to 15 June Thereafter, interest is payable quarterly in arrears on 15 March, 15 June, 15 September and 15 December each year at a floating rate of three-month Singapore Dollar Swap Offer Rate % per annum. 39
42 31 Subordinated Term Debts The following subordinated term debts issued by the Bank are classified as liabilities. These term debt instruments have a junior or lower priority claim on the issuing entity s assets in the event of a default or liquidation. These instruments are in the first instance ineligible as capital instruments under Basel III rules as they lack provisions for conversion to ordinary shares or write-down at the point of non-viability as determined by the Monetary Authority of Singapore, but are accorded partial eligibility as Tier 2 capital (subject to a cap) for calculating capital adequacy ratios under the Basel III transitional arrangements for capital instruments issued prior to 1 January In $ millions Bank Instrument Note Issue Date Maturity Date Issued by the Bank Interest payment US$900m Floating Rate Subordinated Notes Callable with Step-up in Jun Jul 2021 Jan/Apr/ Jul/Oct S$500m 4.47% Subordinated Notes Callable with Step-up in Jul Jul 2021 Jan/Jul S$1,000m 3.30% Subordinated Notes Callable in 2017 US$750m 3.625% Subordinated Notes Callable in Feb Feb 2022 Feb/Aug Mar Sep 2022 Mar/Sep 1,085 1,064 1,085 1,064 S$1,000m 3.10% Subordinated Notes Aug Feb 2023 Feb/Aug Callable in 2018 Total 2,457 4,026 2,457 4,026 Due within 1 year Due after 1 year 1,591 4,026 1,591 4,026 Total 2,457 4,026 2,457 4, These notes have been fully redeemed on 15 July Interest on the notes is payable at 3.30% per annum up to 21 February Thereafter, the interest rate resets to the then-prevailing five-year Singapore Dollar Swap Offer Rate plus 2.147% per annum. Interest is paid semi-annually on 21 February and 21 August each year. The notes are redeemable on 21 February 2017 or on any interest payment date thereafter. Swaps have been entered into to exchange the fixed rate payments on the notes to floating rate payments based on the six-month Singapore Dollar Swap Offer Rate. On 11 January 2016, the holding company purchased $ million of the notes. Pursuant to a notice of redemption issued on 11 January 2017, all of the outstanding notes will be redeemed on 21 February Interest on the notes is payable at 3.625% per annum up to 21 September Thereafter, the interest rate resets to the then-prevailing five-year U.S. Dollar Swap Rate plus 2.229% per annum. Interest is paid semi-annually on 21 March and 21 September each year. The notes are redeemable on 21 September 2017 or on any interest payment date thereafter. Swaps have been entered into to exchange the fixed rate payments on the notes to floating rate payments based on the three-month U.S. Dollar London Interbank Offered Rate Interest on the notes is payable at 3.10% per annum up to 14 February Thereafter, the interest rate resets to the then-prevailing 5-year Singapore Dollar Swap Offer Rate plus 2.085% per annum. Interest is paid semi-annually on 14 February and 14 August each year. The notes are redeemable on 14 February 2018 or on any interest payment date thereafter. Swaps have been entered into to exchange the fixed rate payments on the notes to floating rate payments based on the six-month Singapore Dollar Swap Offer Rate. On 11 January 2016, the holding company purchased $ million of the notes. For more information on each instrument, please refer to the Capital Disclosures section (unaudited) at the Group s website ( 40
43 30B 31B 36B 37B DBS Bank Ltd. and its subsidiaries 32 Share Capital and Bank Shares ( 000) In $ millions Ordinary shares Balance at 1 January 2,574,643 2,489,381 22,697 21,297 Issue of shares (Note 32.1) 36,599 85, ,400 Balance at 31 December 2,611,242 2,574,643 23,347 22,697 Non-cumulative preference shares S$800m 4.70% Non-Cumulative, Non-Convertible, Non-Voting Preference Shares Callable in 2020 (Note 32.2) 8,000 8, Issued share capital at 31 December 24,146 23, The ordinary shares are fully paid-up and do not have par value. In 2016, the Bank issued 37 million ordinary (2015: 85 million) shares to its holding company, DBS Group Holdings Ltd, for a total cash consideration of $650 million (2015: $1.4 billion). The newly issued shares rank pari passu in all respect with the previously issued shares The preference shares were issued on 22 November 2010 with a liquidation preference of $100 each. Dividends, if declared by the Board of Directors of the Bank, are payable semi-annually on 22 May and 22 November each year at 4.70% per annum. They are redeemable on 22 November 2020 or on any date thereafter. The preference shares are in the first instance ineligible as capital instruments under Basel III rules as they lack provisions for conversion to ordinary shares or write-off at the point of non-viability as determined by the Monetary Authority of Singapore, but are accorded partial eligibility as Additional Tier 1 capital (subject to a cap) for calculating capital adequacy ratios under the Basel III transitional arrangements for capital instruments issued prior to 1 January Other Equity Instruments The following perpetual capital securities issued by the Bank are classified as other equity instruments. These instruments are subordinated to all liabilities of the Bank and senior only to ordinary shareholders of the Bank. Their terms require them to be written-off if and when the Monetary Authority of Singapore notifies the Bank that a write-off of the instruments, or a public sector injection of capital (or equivalent support), is necessary, without which the Group would become non-viable. These instruments qualify as Additional Tier 1 capital under MAS Notice BIn $ millions 35BNote 30BIssue 31BDate 32BDistribution Payment 36B B2015 Issued by the Bank S$550m 3.85% Non-Cumulative Non-Convertible Perpetual Capital Securities First Callable in 2021 US$185m 4.0% Non-Cumulative Non-Convertible Perpetual Capital Securities First Callable in Sep 2016 Sep Sep 2016 Sep US$750m 3.60% Non-Cumulative Non-Convertible Sep 2016 Mar/Sep 1,011 Perpetual Capital Securities First Callable in Total 1, Distributions are payable at 3.85% per annum up to 1 September Thereafter, the distribution rate resets every 5 years to the then-prevailing five-year Singapore Dollar Swap Offer Rate plus 2.13% per annum. Distributions are paid annually on 1 September each year, unless cancelled by the Bank. The capital securities are redeemable on 1 September 2021 or on any date thereafter Distributions are payable at 4.0% per annum up to 1 September Thereafter, the distribution rate resets every 5 years to the then-prevailing five-year U.S. Dollar Swap Rate plus 2.84% per annum. Distributions are paid annually on 1 September each year, unless cancelled by the Bank. The capital securities are redeemable on 1 September 2021 or on any date thereafter. 41
44 65B 66B 67B 68B 69B DBS Bank Ltd. and its subsidiaries 33.3 Distributions are payable at 3.60% per annum up to 7 September Thereafter, the distribution rate resets every 5 years to the then-prevailing five-year U.S. Dollar Swap Rate plus 2.39% per annum. Distributions are paid semiannually on 7 March and 7 September each year, unless cancelled by the Bank. The capital securities are redeemable on 7 September 2021 or on any distribution payment date thereafter. 34 Other Reserves and Revenue Reserves 34.1 Other reserves 38BIn $ Bank millions BAvailable-for-sale revaluation reserves BCash flow hedge reserves BGeneral reserves 95 2,453-2,360 68BCapital reserves (182) (214) 27 (23) 69BOthers (78) (78) - - Total (119) 2, ,435 Movements in other reserves for the Group during the year are as follows: 103BIn $ millions 104BAvailablefor-sale revaluation reserves 105BCash flow hedge reserves 102B 106BGeneral reserves (a) 107BCapital reserves (b) Other reserves Total 2016 Balance at 1 January ,453 (214) (78) 2,265 Transfer to revenue reserves (Note 34.2) - - (2,360) - - (2,360) Net exchange translation adjustments (5) Share of associates reserves (3) (5) (6) Available-for-sale (AFS) financial assets and others: - net valuation taken to equity 185 (54) transferred to income statement (261) (c) (188) - tax on items taken directly to or 14 (2) transferred from equity Balance at 31 December (182) (78) (119) 2015 Balance at 1 January 284 (33) 2,453 (233) - 2,471 Net exchange translation adjustments Acquisition of non-controlling interests (78) (78) Share of associates reserves (1) Available-for-sale (AFS) financial assets and others: - net valuation taken to equity (74) (144) (218) - transferred to income statement (125) (c) tax on items taken directly to or 11 (4) transferred from equity Balance at 31 December ,453 (214) (78) 2,265 (a) During the year, the Bank transferred $2.36 billion of general reserves to revenue reserves (b) Capital reserves include net exchange translation adjustments arising from translation differences on net investments in foreign subsidiaries, associates and branches, and the related foreign currency financial instruments designated as a hedge (c) Include impairment of AFS financial assets of $7 million (2015: $15 million) 42
45 Movements in other reserves for the Bank during the year are as follows: 108BThe Bank 109BIn $ millions 110BAvailable-for-sale revaluation reserves 111BCash flow hedge reserves 112BGeneral reserves (a) Capital reserves (b) Total 2016 Balance at 1 January ,360 (23) 2,435 Net exchange translation adjustments (2) Transfer to revenue reserves (Note 34.2) - - (2,360) - (2,360) Available-for-sale financial assets and others: - net valuation taken to equity 210 (42) transferred to income statement (240) (c) (181) - tax on items taken directly to or transferred 6 (2) from equity Balance at 31 December Balance at 1 January 288 (33) 2,360 (43) 2,572 Net exchange translation adjustments Available-for-sale financial assets and others: - net valuation taken to equity (79) (144) - - (223) - transferred to income statement (128) (c) tax on items taken directly to or transferred 11 (4) from equity Balance at 31 December ,360 (23) 2,435 (a) During the year, the Bank transferred $2.36 billion of general reserves to revenue reserves (b) Capital reserves include net exchange translation adjustments arising from translation differences on net investments in foreign branches and the related foreign currency instruments designated as a hedge (c) Include impairment of AFS financial assets of $1 million (2015: Nil) 34.2 Revenue reserves Bank In $ millions Balance at 1 January 14,486 11,521 10,247 7,941 Transfer from general reserves (Note 34.1) 2,360-2,360 - Net profit attributable to shareholders 4,254 4,503 3,720 3,844 Amount available for distribution 21,100 16,024 16,327 11,785 Less: Dividends paid to holding company 1,510 1,500 1,510 1,500 Dividends paid on preference shares Balance at 31 December 19,552 14,486 14,779 10,247 43
46 35 Non-controlling Interests The following instruments issued by subsidiaries of the Group are classified as non-controlling interests. These instruments have a deeply subordinated claim on the issuing entity s assets in the event of a liquidation. The instruments are in the first instance ineligible as capital instruments under Basel III rules as they lack provisions for conversion to ordinary shares or write-off at the point of non-viability as determined by the Monetary Authority of Singapore, but are accorded eligibility as Additional Tier 1 capital (subject to a cap) for calculating capital adequacy ratios under the Basel III transitional arrangements for capital instruments issued prior to 1 January In $ millions Instrument Note Issue Date Liquidation Preference Distribution Payment Issued by DBS Capital Funding II Corporation S$ 1,500m 5.75% Non-Cumulative, Non-Convertible, Non-Voting, Guaranteed Preference Shares Callable with Step-up in 2018 Issued by Heedum Pte Ltd S$ 344m 1.6% Perpetual Subordinated Loan Issued by DBS Bank (Taiwan) Ltd TW$ 8,000m 4% Non-Cumulative and Perpetual Preferred Shares Issued by DBS Bank (Hong Kong) Limited HK$ 1,400m 3.9% Non-Cumulative Preference Shares May Nov Jan Oct 2016 S$ 250,000 Jun/Dec 1,500 1,500 Nov HK$ 10,000,000 Mar Non-controlling interests in subsidiaries Total 2,523 2, Dividends are payable if declared by the Board of Directors of DBS Capital Funding II Corporation. They are payable semi-annually on 15 June and 15 December each year at 5.75% per annum up to 15 June 2018, and thereafter quarterly on 15 March, 15 June, 15 September and 15 December each year at a floating rate of the three-month Singapore Dollar Swap Offer Rate plus 3.415% per annum. The preference shares are redeemable on 15 June 2018 or any dividend payment date thereafter. For more information on each instrument, please refer to the Capital Disclosures section (unaudited) at the Group s website ( 44
47 36 Contingent Liabilities and Commitments issues guarantees, performance bonds and indemnities in the ordinary course of business. The majority of these facilities are offset by corresponding obligations of third parties. Guarantees and performance bonds are generally written by the Group to support the performance of a customer to third parties. As the Group will only be required to meet these obligations in the event of the customer s default, the cash requirements of these instruments are expected to be considerably below their nominal amount. Endorsements are residual liabilities of the Group in respect of bills of exchange, which have been paid and subsequently rediscounted. Bank 113BIn $ millions Guarantees on account of customers 15,078 13,605 14,930 13,285 Endorsements and other obligations on 7,636 6,296 5,488 4,345 account of customers Undrawn credit commitments (a) 235, , , ,132 Undisbursed and underwriting commitments in securities Sub-total 258, , , ,771 Operating lease commitments (Note 36.2) Capital commitments Total 258, , , ,135 Analysed by industry (excluding operating lease and capital commitments) Manufacturing 42,718 38,188 33,135 28,541 Building and construction 23,436 17,210 20,753 15,545 Housing loans 7,155 9,239 6,942 9,060 General commerce 50,338 52,695 36,810 38,678 Transportation, storage and communications 13,933 13,203 11,796 11,819 Financial institutions, investment and holding 22,686 22,007 22,380 21,480 companies Professionals and private individuals 75,615 67,140 59,940 52,802 (excluding housing loans) Others 22,166 20,001 20,454 17,846 Total 258, , , ,771 Analysed by geography (excluding operating lease and capital commitments) (b) Singapore 105, , , ,002 Hong Kong 48,334 48,550 20,342 21,069 Rest of Greater China 22,533 18,073 10,339 6,812 South and Southeast Asia 25,750 22,732 24,003 20,697 Rest of the World 56,289 48,807 53,270 46,191 Total 258, , , ,771 (a) Include commitments that are unconditionally cancellable at any time by the Group (2016: $193,016 million, 2015: $183,125 million) and Bank (2016: $152,153 million, 2015: $143,141 million) (b) Based on the country of incorporation of the counterparty or borrower 36.1 has existing outsourcing agreements for the provision of information technology and related support to the Group s operations. There are various termination clauses in the agreements that could require the Group to pay termination fees on early termination of the contract or part thereof. The termination fees are stipulated in the agreements and are determined based on the year when the agreements or part thereof are terminated has existing significant operating lease commitments including the leasing of office premises in Changi Business Park and Marina Bay Financial Centre in Singapore; and One Island East in Hong Kong. These include lease commitments for which the payments will be determined in the future based on the prevailing market rates in accordance with the lease agreements, of which the related amounts have not been included. The leases have varying terms, escalation clauses and renewal rights. 45
48 37 Financial Derivatives Financial derivatives are financial instruments whose characteristics are derived from the underlying assets, or from interest and exchange rates or indices. These include forwards, swaps, futures and options. The following sections outline the nature and terms of the most common types of derivatives used by the Group. Interest rate derivatives Forward rate agreements give the buyer the ability to determine the underlying rate of interest for a specified period commencing on a specified future date (the settlement date). There is no exchange of principal and settlement is effected on the settlement date. The settlement amount is the difference between the contracted rate and the market rate prevailing on the settlement date. Interest rate swaps involve the exchange of interest obligations with a counterparty for a specified period without exchanging the underlying (or notional) principal. Interest rate futures are exchange-traded agreements to buy or sell a standard amount of a specified fixed income security or time deposit at an agreed interest rate on a standard future date. Interest rate options give the buyer on payment of a premium the right, but not the obligation, to fix the rate of interest on a future deposit or loan, for a specified period and commencing on a specified future date. Interest rate caps and floors give the buyer the ability to fix the maximum or minimum rate of interest. There is no facility to deposit or draw down funds, instead the writer pays to the buyer the amount by which the market rate exceeds or is less than the cap rate or the floor rate respectively. This category includes combinations of interest rate caps and floors, which are known as interest rate collars. Foreign exchange derivatives Forward foreign exchange contracts are agreements to buy or sell fixed amounts of currency at agreed rates of exchange on a specified future date. Cross currency swaps are agreements to exchange, and on termination of the swap, re-exchange principal amounts denominated in different currencies. Cross currency swaps may involve the exchange of interest payments in one specified currency for interest payments in another specified currency for a specified period. Currency options give the buyer, on payment of a premium, the right but not the obligation, to buy or sell specified amounts of currency at agreed rates of exchange on or before a specified future date. Equity derivatives Equity options give the buyer, on payment of a premium, the right but not the obligation, either to purchase or sell a specified stock or stock index at a specified price or level on or before a specified date. Equity swaps involve the exchange of a set of payments whereby one of these payments is based on an equity-linked return while the other is typically based on an interest reference rate. Credit derivatives Credit default swaps involve the transfer of credit risk of a reference asset from the protection buyer to the protection seller. The protection buyer makes one or more payments to the seller in exchange for an undertaking by the seller to make a payment to the buyer upon the occurrence of a predefined credit event. Commodity derivatives Commodity contracts are agreements between two parties to exchange cash flows which are dependent on the price of the underlying physical assets. Commodity futures are exchange-traded agreements to buy or sell a standard amount of a commodity at an agreed price on a standard future date. Commodity options give the buyer, on payment of a premium, the right but not the obligation, to buy or sell a specific amount of commodity at an agreed contract price on or before a specified date Trading derivatives Most of the Group s derivatives relate to sales and trading activities. Sales activities include the structuring and marketing of derivatives to customers to enable them to take, transfer, modify or reduce current or expected risks. Trading activities are entered into principally for dealer s margin or for the purpose of generating a profit from short-term fluctuations in price. Trading includes mainly market-making and warehousing to facilitate customer orders. Marketmaking involves quoting bid and offer prices to other market participants with the intention of generating revenues based on spread and volume. Warehousing involves holding on to positions in order to liquidate in an orderly fashion with timing of unwinding determined by market conditions and traders views of markets as they evolve Hedging derivatives The accounting treatment of the hedge derivative transactions varies according to the nature of the hedge and whether the hedge meets the specified criteria to qualify for hedge accounting. Derivatives transacted as economic hedges but do not qualify for 46
49 hedge accounting are treated in the same way as derivative instruments held for trading purposes. Fair value hedges s fair value hedges consist principally of interest rate swaps used for managing interest rate gaps. For the year ended 31 December 2016, the gain on hedging instruments was $77 million (2015: $4 million). The total loss on hedged items attributable to the hedged risk amounted to $81 million (2015: $4 million). At the Bank, for the year ended 31 December 2016, the gain on hedging instruments was $66 million (2015: loss of $60 million). The total loss on hedged items attributable to the hedged risk amounted to $69 million (2015: gain of $60 million). swaps have maturity dates that coincide within the expected occurrence of these transactions. The forecast transactions are expected to occur within five years from the balance sheet date, and are expected to affect income statement in the same period these cash flows occur. The ineffectiveness arising from these hedges was insignificant. Net investment hedges hedges part of the currency translation risk of investments through financial derivatives and borrowings. The ineffectiveness arising from hedging of investments was insignificant. regularly reviews its hedging strategy and rebalance based on long-term outlook of the currency fundamentals. Cash flow hedges s cash flow hedges consist principally of currency forwards and currency swaps transacted to hedge highly probable forecast transactions expected to occur at various future dates against variability in exchange rates. The currency forwards and currency The tables below analyses the currency exposure of Group by functional currency at 31 December: In $ millions Net investments in foreign operations (a) Financial instruments which hedge the net investments Remaining unhedged currency exposures 2016 Hong Kong dollar 10,161 9,065 1,096 US dollar Others 6,600 1,648 4,952 Total 17,627 11,578 6, Hong Kong dollar 8,398 8,392 6 US dollar (9) Others 6,047 1,867 4,180 Total 15,379 11,202 4,177 (a) Refer to net tangible assets of subsidiaries, associates and overseas operations The following table summarises the contractual or underlying principal amounts of derivative financial instruments held or issued for trading and hedging purposes outstanding at balance sheet date. They do not represent amounts at risk. In the financial statements, trading derivative financial instruments are revalued on a gross position basis and the unrealised gains or losses are reflected as derivative assets or derivative liabilities. Derivative assets and liabilities arising from different transactions are only offset if the transactions are done with the same counterparty, a legal right of offset exists, and the parties intend to settle the cash flows on a net basis. There was no offset of derivative assets and liabilities in 2016 and
50 In $ millions Underlying notional Assets Liabilities Underlying notional Assets Liabilities Derivatives held for trading Interest rate derivatives Forward rate agreements 1,000 # # Interest rate swaps 1,084,216 6,767 6, ,276 6,504 6,414 Interest rate futures 14, , Interest rate options 8, , Interest rate caps/floors 27, , Sub-total 1,135,479 7,354 7,670 1,027,448 6,868 7,272 Foreign exchange (FX) derivatives FX contracts 576,932 8,227 8, ,433 6,445 5,951 Currency swaps 208,102 8,373 7, ,677 7,394 6,332 Currency options 94, , ,269 1,774 1,629 Sub-total 879,207 17,583 16, ,379 15,613 13,912 Equity derivatives Equity options 2, , Equity swaps 1, Sub-total 4, , Credit derivatives Credit default swaps and others 31, , Sub-total 31, , Commodity derivatives Commodity contracts 1, , Commodity futures 1, , Commodity options Sub-total 3, , Total derivatives held for trading 2,054,386 25,357 24,279 2,049,166 23,236 22,017 Derivatives held for hedging Interest rate swaps held for fair value hedge 11, , Interest rate swaps held for cash flow hedge # FX contracts held for cash flow hedge 3, , FX contracts held for hedge of net investment 1, , Currency swaps held for fair value hedge , Currency swaps held for cash flow hedge 1, Currency swaps held for hedge of net investment ,441 # # Total derivatives held for hedging 18, , Total derivatives 2,073,295 25,778 24,525 2,070,999 23,631 22,191 Impact of netting arrangements recognised for computation of Capital Adequacy Ratio (CAR)(unaudited) (14,788) (14,788) (11,047) (11,047) 10,990 9,737 12,584 11,144 Of which derivatives with holding company 2, , # Amount under $500,000 48
51 In $ millions Bank Underlying notional Assets Liabilities Underlying notional Assets Liabilities Derivatives held for trading Interest rate derivatives Forward rate agreements 1,000 # # 1, Interest rate swaps 954,852 6,459 6, ,216 6,314 6,241 Interest rate futures 14, , Interest rate options 8, , Interest rate caps/floors 27, , Sub-total 1,006,096 7,045 7, ,821 6,711 7,112 Foreign exchange (FX) derivatives FX contracts 499,642 7,043 7, ,454 6,102 5,467 Currency swaps 205,281 8,235 7, ,967 7,174 6,248 Currency options 85, ,166 1,687 1,564 Sub-total 790,478 16,197 15, ,587 14,963 13,279 Equity derivatives Equity options 2, , Equity swaps 1, Sub-total 4, , Credit derivatives Credit default swaps and others 31, , Sub-total 31, , Commodity derivatives Commodity contracts 1, , Commodity futures 1, , Commodity options Sub-total 3, , Total derivatives held for trading 1,836,169 23,662 22,800 1,892,661 22,430 21,224 Derivatives held for hedging Interest rate swaps held for fair value hedge 10, , Interest rate swaps held for cash flow hedge # FX contracts held for fair value hedge 1, , FX contracts held for cash flow hedge 1, , FX contracts held for hedge of net investment Currency swaps held for fair value hedge , Currency swaps held for cash flow hedge 1, Currency swaps held for hedge of net investment # # Total derivatives held for hedging 15, , Total derivatives 1,852,120 23,994 22,994 1,912,953 22,791 21,386 Impact of netting arrangements recognised for computation of Capital Adequacy Ratio (CAR) (unaudited) (15,104) (15,104) (11,405) (11,405) 8,890 7,890 11,386 9,981 Of which derivatives with subsidiaries and holding company 60, ,009 1, # Amount under $500,000 The contractual or underlying principal amounts of derivative financial instruments of bank and non-bank counterparties amounted to $1,127 billion (2015: $1,084 billion) and $946 billion (2015: $987 billion) respectively for the Group and $933 billion (2015: $989 billion) and $919 billion (2015: $924 billion) respectively for the Bank. These positions are mainly booked in Singapore. For purpose of managing its credit exposures, the Group maintains collateral agreements and enters into master netting agreements with most of these counterparties. For those arrangements that comply with the regulatory requirements as set out in MAS Notice 637, the Group recognises the netting arrangements in the computation of its Capital Adequacy Ratios. 49
52 114B38 Share-based Compensation Plans As part of the Group s remuneration policy, the Group provides various share-based compensation plans to foster a culture that aligns employees interests with shareholders, enable employees to share in the bank s performance and enhance talent retention. Main Scheme/Plan DBSH Share Plan (Share Plan) The Share Plan is granted to Group executives as determined by the Committee appointed to administer the Share Plan from time to time. Participants are awarded shares of DBSH or, at the Committee s discretion, their equivalent cash value or a combination. Awards consist of main award and retention award (20% of main award). Dividends on unvested shares do not accrue to employees. The vesting of main award is staggered between 2 to 4 years after grant i.e. 33% will vest 2 years after grant; another 33% will vest on the third year and the remaining 34% plus the retention award will vest 4 years after grant. The market price of shares on the grant date is used to estimate the fair value of the shares awarded. Vested and unvested shares are subject to clawback/malus. Conditions that trigger such clawback/malus are in the Corporate Governance section of DBSH s Annual Report. Shares are awarded to non-executive directors as part of director s remuneration. Details of these awards are disclosed in the Corporate Governance section of DBSH s Annual Report. DBSH Employee Share Plan (ESP) The ESP caters to employees not eligible to participate in the above listed Share Plan. Eligible employees are awarded ordinary shares of DBSH, their equivalent cash value or a combination of both (at the discretion of the Committee), when time-based conditions are met. The awards structure and vesting conditions are similar to DBSH Share Plan. There are no additional retention awards for shares granted to top performers and key employees. However, in specific cases where the award forms part of an employee s annual performance remuneration, the retention award which constitutes 20% of the shares given in the main award will be granted. The shares in the retention award will vest 4 years after the date of grant. For such cases, vested and unvested shares are subject to clawback/malus. Conditions that trigger such clawback/malus are in the Corporate Governance section of DBSH s Annual Report. DBSH Share Ownership Scheme All Singapore-based employees with at least one year of service who hold the rank of Assistant Vice President and below are eligible. Participants contribute up to 10% of monthly salary and the Group will match up to 5% of monthly base salary to buy units of the DBSH s ordinary shares. DBSH Share Option Plan (Option Plan) The Option Plan expired on 19 June Any outstanding unexercised options as of 1 March 2015 had lapsed following the expiry of all options granted under the plan. Note DBSH Share Plan and DBSH Employee Share Plan The following table sets out the movements of the awards during the year Number of shares Share Plan ESP Share Plan ESP Balance at 1 January 17,368,488 1,998,781 17,216,431 1,777,193 Granted 8,251,608 1,067,078 5,718, ,166 Vested (5,507,188) (551,646) (5,154,074) (471,393) Forfeited (449,630) (226,799) (412,391) (196,185) Balance at 31 December 19,663,278 2,287,414 17,368,488 1,998,781 Weighted average fair value of the shares granted during the year $13.72 $13.69 $19.50 $
53 Bank Number of shares Share Plan ESP Share Plan ESP Balance at 1 January 14,193,645 1,125,508 14,027, ,298 Granted 6,925, ,951 4,606, ,645 Vested (4,575,466) (310,599) (4,220,134) (264,206) Transferred 438,701 (1,657) (29,769) 5,581 Forfeited (310,380) (109,193) (190,664) (95,810) Balance at 31 December 16,672,078 1,298,010 14,193,645 1,125,508 Weighted average fair value of the shares granted during the year $13.71 $13.69 $19.49 $ DBSH Share Ownership Scheme The outstanding shares held under DBSH Share Ownership Scheme are as follows: and Bank Ordinary shares Market value Number (In $ millions) Balance at 1 January 7,282,740 6,593, Balance at 31 December 8,388,820 7,282, DBSH Share Option Plan The following table sets out movements of the unissued ordinary shares of DBSH under outstanding options. Unissued number of ordinary shares under outstanding options Weighted average exercise price ($) Balance at 1 January - 354, Movements during the year: - Exercised - (350,623) Forfeited/Expired - (4,254) Balance at 31 December In 2015, 350,623 options were exercised at their contractual exercise prices and the corresponding weighted average market price of the DBSH s shares was $ Unissued number of ordinary shares under outstanding options Weighted average exercise price ($) Balance at 1 January - 307, Movements during the year: - Exercised - (305,652) Transferred Forfeited/Expired - (2,020) Balance at 31 December In 2015, 305,652 options were exercised at their contractual exercise prices and the corresponding weighted average market price of the DBSH s shares was $ Bank 51
54 84B 86B DBS Bank Ltd. and its subsidiaries 39 Related Party Transactions 39.1 Transactions between the Bank and its subsidiaries, including consolidated structured entities, associates which are related parties of the Bank, are disclosed in Notes 39.4 to During the financial year, the Group had banking transactions with related parties, consisting of subsidiaries, associates and key management personnel of the Group. These included the taking of deposits and extension of credit card and other loan facilities. These transactions were made in the ordinary course of business and carried out at armslength commercial terms, and were not material. In addition, key management personnel received remuneration for services rendered during the financial year. Non cash benefits including performance shares were also granted Total compensation and fees to key management personnel (a) are as follows: 84B 85Bank In $ millions Short-term benefits (b) Share-based payments (c) Total Of which: Bank Directors remuneration and fees (a) Includes Bank Directors and members of the Management Committee who have authority and responsibility in planning the activities and direction of the Group. The composition and number of Directors and Management Committee members may differ from year to year (b) Includes cash bonus based on amount accrued during the year, to be paid in the following year (c) Share-based payments are expensed over the vesting period in accordance with FRS Income received and expenses paid to related parties 86B 87Bank In $ millions Income received from: -Holding company 3 # 3 # -Subsidiaries Associates Total Expenses paid to: -Holding company Subsidiaries Associates Total # Amount under $500, Amounts due to and from related parties 88Bank In $ millions Amounts due from: -Subsidiaries 14,910 13,924 -Associates Total 15,891 14,897 Amounts due to: -Holding company 1,029 1,085 -Subsidiaries 41,205 24,432 -Associates Total 42,401 25, Guarantees to related parties Guarantees granted to and from subsidiaries amounted to $1,952 million (2015: $1,045 million) and $1,455 million (2015: $2,188 million) respectively. The Bank also finances customer through discounting bills issued by related parties. As at 31 December 2016, outstanding amount of such bills was $93 million (2015: $437 million). 52
55 40 Fair Value of Financial Instruments 40.1 Valuation Process The valuation processes within the Group are governed by the Valuation Policy and supporting Standards, which are approved by the Board Risk Management Committee and the Group Market and Liquidity Risk Committee respectively. The policy and standards apply to financial assets and liabilities where mark-tomarket or model valuation is required. The Valuation Policy and supporting Standards govern the revaluation of all financial assets and liabilities that are measured at fair value, covering both market prices as well as model inputs. Financial assets and liabilities are marked directly using reliable and independent market prices or by using reliable and independent market parameters (as model inputs) in conjunction with a valuation model. Products with a liquid market or those traded via an exchange will fall under the former while most over-the-counter (OTC) products will form the latter. Market parameters include interest rate yield curves, credit spreads, exchange prices, dividend yields, option volatilities and foreign exchange rates. Valuation models go through an assurance process carried out by the Risk Management Group (RMG), independent of the model developers. This assurance process covers the review of the underlying methodology including its logic and conceptual soundness together with the model inputs and outputs. Model assurances are conducted prior to implementation and subject to regular review or when there are significant changes arising from market or portfolio changes. Where necessary, the Group also imposes model reserves and other adjustments in determining fair value. Models are approved by the Group Market and Liquidity Risk Committee. The majority of OTC derivatives are traded in active markets. Valuations are determined using generally accepted models (for example discounted cash flows, Black-Scholes model, interpolation techniques) based on quoted market prices for similar instruments or underlyings or market parameters. A process of independent price verification (IPV) is in place to establish the accuracy of the market parameters used when the marking is performed by the Front Office. The IPV process entails independent checks to compare traders marks to independent sources such as broker/dealer sources or market consensus providers. The results of the IPV are reviewed by independent control functions on a monthly basis. For illiquid financial instruments where mark-to-market is not possible, the Group will value these products using an approved valuation model. Prices and parameters used as inputs to the model or to any intermediate technique involving a transformation process must be derived using approved market sources. Where possible, the inputs must be checked against multiple sources for reliability and accuracy. Reliance will be placed on the model assurance process established by RMG for assurance of valuation models as fit for purpose. uses various market accepted benchmark interest rates such as LIBOR and Swap Offer Rates to determine the fair value of the financial instruments. Where significant unobservable inputs are used in these models, the financial instruments are classified as Level 3 in the fair value hierarchy and valuation adjustments or reserves are taken to provide for any uncertainty in valuations. Valuation adjustments or reserve methodologies are also used to substantiate the significance of unobservable inputs. Such methodologies are approved by the Group Market and Liquidity Risk Committee and governed by the Valuation Policy and supporting Standards. The main valuation adjustments and reserves are described below: Model and Parameter Uncertainty Adjustments Valuation uncertainties may occur during fair value measurement either due to uncertainties in the required input parameters or uncertainties in the modelling methods used in the valuation process. In such situations, adjustments may be necessary to take these factors into account. For example, where market data such as prices or rates for an instrument are no longer observable after an extended period of time, these inputs used to value the financial instruments may no longer be relevant in the current market conditions. In such situations, adjustments may be necessary to address the pricing uncertainty arising from the use of stale market data inputs. Credit Valuation Adjustments Credit valuation adjustments are taken to reflect the impact on fair value of counterparty credit risk. Credit valuation adjustments are based upon the creditworthiness of the counterparties, magnitude of the current or potential exposure on the underlying transactions, netting and collateral arrangements, and the maturity of the underlying transactions. Funding Valuation Adjustments Funding valuation adjustments represent an estimate of the adjustment to fair value that a market participant would make in incorporating funding costs and benefits that arise in relation to uncollateralised derivatives positions. Day 1 Profit or Loss (P&L) Reserve In situations where the market for an instrument is not active and its fair value is established using a valuation model based on significant unobservable market parameters, the Day 1 P&L arising from the difference in transacted price and end-of-day model valuation is set aside as reserves. A market parameter is defined as being significant when its impact on the Day 1 P&L 53
56 is greater than an internally determined threshold. The Day 1 P&L reserve is released to the income statement when the parameters become observable or when the transaction is closed out or amortised over the duration of the transaction. At year end, the unamortised Day 1 P&L was not material. Bid-Offer Adjustments often holds, at varying points in time, both long or short positions in financial instruments which are valued using mid-market levels. Bid-offer adjustments are then made to account for close-out costs Fair Value Hierarchy The fair value hierarchy accords the highest level to observable inputs such as unadjusted quoted prices in active markets for identical assets or liabilities and the lowest level to unobservable inputs. The fair value measurement of each financial instrument is categorised in accordance with the same level of the fair value hierarchy as the input with the lowest level that is significant to the entire measurement. If unobservable inputs are deemed significant, the financial instrument will be categorised as Level 3. Financial instruments that are valued using quoted prices in active markets are classified as Level 1 within the fair value hierarchy. These would include government and sovereign securities, listed equities and corporate debt securities which are actively traded. Derivatives contracts which are traded in an active exchange market are also classified as Level 1 of the valuation hierarchy. Where fair value is determined using quoted market prices in less active markets or quoted prices for similar assets and liabilities, such instruments are generally classified as Level 2. In cases where quoted prices are generally not available, the Group will determine the fair value based on valuation techniques that use market parameters as inputs including but not limited to yield curves, volatilities and foreign exchange rates. The majority of valuation techniques employ only observable market data so that reliability of the fair value measurement is high. These would include corporate debt securities, repurchase, reverse repurchase agreements and most of the Group s OTC derivatives. classifies financial instruments as Level 3 when there is reliance on unobservable inputs to the valuation model attributing to a significant contribution to the instrument value. These would include all input parameters which are derived from historical data, for example asset correlations or certain volatilities, as well as unquoted equity securities. The fair value of unquoted equity securities is measured based on the net asset value of the investments. Level 3 inputs also include all quoted security prices that have not been updated for more than 3 months, quoted proxies in active markets for non-similar asset classes (e.g. bonds valued using credit default swap spreads), as well as prices/valuations that are obtained from counterparties. Valuation reserves or pricing adjustments where applicable are used to converge to fair value. The following table presents assets and liabilities measured at fair value, classified by level within the fair value hierarchy: In $ millions Level 1 Level 2 Level 3 Total Level 1 Level 2 Level 3 Total Assets Financial assets at fair value through profit or loss (FVPL) - Government securities and treasury bills 7,713 1,285-8,998 4,897 2,672-7,569 - Bank and corporate securities 5,022 2, ,807 4,416 3, ,112 - Other financial assets - 9,133-9,133-6,471-6,471 Available-for-sale (AFS) financial assets - Government securities and treasury bills 21,352 1,089-22,441 24,094 1,173-25,267 - Bank and corporate securities (a) 14,510 1, ,223 10,364 2, ,007 - Other financial assets - 4,417-4,417-4,977-4,977 Derivatives 57 25, , , ,631 Liabilities Financial liabilities at fair value through profit or loss (FVPL) - Other debt securities - 5, ,049-5, ,538 - Other financial liabilities 2,290 1,881-4, , ,185 Derivatives 66 24, , , ,191 (a) Excludes unquoted equities stated at cost of $242 million (2015: $574 million) 54
57 In $ millions Bank Level 1 Level 2 Level 3 Total Level 1 Level 2 Level 3 Total Assets Financial assets at fair value through profit or loss (FVPL) - Government securities and treasury bills 5, ,852 4,312 1,890-6,202 - Bank and corporate securities 4,742 2, ,787 4,071 2, ,341 - Other financial assets - 8,481-8,481-6,060-6,060 Available-for-sale (AFS) financial assets - Government securities and treasury bills 18, ,467 21, ,314 - Bank and corporate securities (a) 12,533 1, ,789 9,199 1, ,307 - Other financial assets - 2,362-2,362-2,228-2,228 Derivatives 57 23, , , ,791 Liabilities Financial liabilities at fair value through profit or loss (FVPL) - Other debt securities - 4, ,969-5, ,458 - Other financial liabilities , , ,774 Derivatives 66 22, , , ,386 (a) Excludes unquoted equities stated at cost of $210 million (2015: $541 million) The following table presents the changes in Level 3 instruments for the financial year ended for the Group: In $ millions Financial assets Financial liabilities FVPL AFS Derivatives FVPL Derivatives Bank and corporate securities Bank and corporate securities Other debt securities Other financial liabilities 2016 Balance at 1 January (17) (73) (123) Purchases/ Issues (4) - - Settlements (747) (35) (24) Transfers: - Transfers into Level (16) - Transfers out of Level 3 (127) (20) (4) Gains/(losses) recorded in the income (4) (16) statement Gains/(losses) recognised in other - (13) comprehensive income Balance at 31 December (4) - (16) 55
58 In $ millions Financial assets Financial liabilities FVPL AFS Derivatives FVPL Derivatives Bank and corporate securities Bank and corporate securities Other debt securities Other financial liabilities 2015 Balance at 1 January (8) - (135) Purchases/ Issues (4) (48) - Settlements (19) (18) (2) 9-2 Transfers: - Transfers into Level (14) (49) (2) - Transfers out of Level 3 - (3) (8) Gains/(losses) recorded in the income (1) - (2) statement Gains/(losses) recognised in other comprehensive income Balance at 31 December (17) (73) (123) The following table presents the changes in Level 3 instruments for the financial year ended for the Bank: In $ millions Bank Financial assets Financial liabilities FVPL AFS Derivatives FVPL Derivatives Bank and corporate securities Bank and corporate securities Other debt securities Other financial liabilities 2016 Balance at 1 January (17) (73) (123) Purchases/ Issues (4) - - Settlements (747) (35) (24) Transfers: - Transfers into Level (16) - Transfers out of Level 3 (127) (20) (8) Gains/(losses) recorded in the income (4) (16) statement Gains/(losses) recognised in other - (13) comprehensive income Balance at 31 December (4) - (16) 2015 Balance at 1 January (8) - (135) Purchases/ Issues (4) (48) - Settlements (19) (18) (2) 9-2 Transfers: - Transfers into Level (14) (49) (2) - Transfers out of Level 3 - (3) (8) Gains/(losses) recorded in the income (1) - (2) statement Gains/(losses) recognised in other comprehensive income Balance at 31 December (17) (73) (123) Economic hedges entered into for Level 2 exposures may be classified within a different category (i.e. Level 1) and similarly, hedges entered for Level 3 exposures may also be classified within a different category (i.e. Level 1 and/or Level 2). The effects are presented gross in the table. 56
59 During the year, the Group transferred financial assets and liabilities from Level 1 to Level 2 due to reduced market activity and from Level 2 to Level 1 arising from increased market activity. Gains and losses on Level 3 financial assets and liabilities measured at fair value for the Group and the Bank In $ millions 2016 Net trading Income Net income from investment securities Total Total gain/(loss) for the period included in income statement (13) 6 (7) Of which: Change in unrealised gain/(loss) for assets and liabilities held at the end of the reporting period (8) - (8) 2015 Total gain/(loss) for the period included in income statement Of which: Change in unrealised gain/(loss) for assets and liabilities held at the end of the reporting period In $ millions Bank 2016 Net trading Income Net income from investment securities Total Total gain/(loss) for the period included in income statement (13) 6 (7) Of which: Change in unrealised gain/(loss) for assets and liabilities held at the end of the reporting period (8) - (8) 2015 Total gain/(loss) for the period included in income statement Of which: Change in unrealised gain/(loss) for assets and liabilities held at the end of the reporting period Fair value gains or losses taken to other comprehensive income are reported in the Statement of Comprehensive Income as Net valuation taken to equity. Effect of changes in significant unobservable inputs to reflect reasonably possible alternatives As at 31 December 2016, financial instruments measured with valuation techniques using significant unobservable inputs (Level 3) included equity investments, bank and corporate debt securities, interest rate, equity and credit derivatives and financial liabilities from structured product issuances. There are limited inter-relationships between unobservable inputs as the financial instruments are usually categorised as Level 3 because of a single unobservable input. In estimating significance, the Group performed sensitivity analysis based on methodologies applied for fair value adjustments. These adjustments reflect the values which the Group estimates to be appropriate to reflect uncertainties in the inputs used (e.g. based on stress testing methodologies on the unobservable input). The methodologies used can be statistical or based on other relevant approved techniques. The movement in fair value arising from reasonably possible changes to the significant unobservable inputs is assessed as not significant. 57
60 In $ millions Classification Valuation technique Unobservable Input Assets Bank and corporate debt securities FVPL Discounted cash flows Credit spreads Bank and corporate debt securities AFS Discounted cash flows Credit spreads Equity securities - 23 FVPL Equity pricing model Prices Equity securities (Unquoted) AFS Net asset value Net asset value of securities Derivatives 1 20 FVPL Discounted cash flows / CDS models / Option & interest rate pricing Credit spreads / Correlations / Volatility models Total 158 1,014 Liabilities Other debt securities 4 17 FVPL Discounted cash flows / Option pricing model Other financial liabilities - 73 FVPL CDS models / Option & interest rate pricing model Derivatives FVPL Discounted cash flows / CDS models / Option & interest rate pricing model Total Credit spreads / Correlations Credit spreads / Correlations Credit spreads / Correlations / Volatility Bank In $ millions Classification Valuation technique Unobservable Input Assets Bank and corporate debt securities FVPL Discounted cash flows Credit spreads Bank and corporate debt securities 1 46 AFS Discounted cash flows Credit spreads Equity securities - 23 FVPL Equity pricing model Prices Equity securities (Unquoted) AFS Net asset value Net asset value of securities Derivatives 1 24 FVPL Discounted cash flows / CDS models / Option & interest rate pricing Credit spreads / Correlations / Volatility model Total 139 1,018 Liabilities Other debt securities 4 17 FVPL Discounted cash flows / Option pricing model Other financial liabilities - 73 FVPL CDS models / Option & interest rate pricing model Derivatives FVPL Discounted cash flows / CDS models / Option & interest rate pricing model Total Credit spreads / Correlations Credit spreads / Correlations Credit spreads / Correlations / Volatility 40.3 Financial assets & liabilities not carried at fair value For financial assets and liabilities not carried at fair value in the financial statements, the Group has ascertained that their fair values were not materially different from their carrying amounts at year-end. For cash and balances with central banks, due from banks, loans and advances to customers, as well as due to banks and deposits and balances from customers, the basis of arriving at fair values is by discounting cash flows using the relevant market interest rates for the respective currencies. For investment debt securities and subordinated term debts issued, fair values are determined based on independent market quotes, where available. Where market prices are not available, fair values are estimated using discounted cash flow method. 58
61 For unquoted equities not carried at fair value, fair values have been estimated by referencing to the net tangible asset backing of the investee. Unquoted equities of $242 million as at 31 December 2016 (2015: $574 million) for the Group and $210 million as at 31 December 2016 (2015: $541 million) for the Bank were stated at cost less accumulated impairment losses because the fair value cannot be reliably estimated using valuation techniques supported by observable market data. intends to dispose of such instruments through public listing or trade sale. The fair value of variable interest-bearing as well as short-term financial instruments accounted for at amortised cost is assumed to be approximated by their carrying amounts. 41 Risk Governance Board oversees the Group s affairs and provides sound leadership for the CEO and management. Authorised by the Board, various Board committees oversee specific responsibilities based on clearly defined terms of reference. Under the Group s risk management frameworks, the Board, through the Board Risk Management Committee (BRMC), sets the Group s risk appetite, oversees the establishment of enterprise-wide risk management policies and processes, and sets risk limits to guide risk-taking within the Group. The BRMC oversees the identification, monitoring, management and reporting of credit, market, liquidity, operational and reputational risks. To facilitate the BRMC s risk oversight, the following risk management committees have been established: 1. Risk Executive Committee (Risk ExCo); 2. Product Approval Committee (PAC); 3. Group Credit Risk Models Committee (GCRMC); 4. Group Credit Policy Committee (GCPC); 5. Group Scenario and Stress Testing Committee (GSSTC); 6. Group Credit Risk Committee (GCRC); 7. Group Market and Liquidity Risk Committee (GMLRC); 8. Group Operational Risk Committee (GORC); As the overall executive body regarding risk matters, the Risk ExCo oversees the Group s risk management as a whole. The PAC oversees new product approvals, which are vital for mitigating risk within the Group. Other than the PAC, the committees as a whole serve as an executive forum to discuss and implement the Group s risk management. Recommend scenarios and the resulting macroeconomic variable projections used for enterprise-wide stress tests. The members in these committees comprise representatives from the Risk Management Group (RMG) as well as key business and support units. Most of the above committees are supported by local risk committees in all major locations, where appropriate. These local risk committees oversee the local risk positions for all businesses and support units, ensuring that they keep within the limits set by the group risk committees. They also approve locationspecific risk policies. The Chief Risk Officer (CRO), who is a member of the Group Executive Committee and reports to the Chairman of the BRMC and the CEO, oversees the risk management function. The CRO is independent of business lines and is actively involved in key decisionmaking processes. He often engages with regulators to discuss risk matters, enabling a more holistic risk management perspective. Working closely with the risk and business committees, the CRO is responsible for the following: Management of the Group s risks, including systems and processes to identify, approve, measure, monitor, control and report risks; Engagement with senior management about material matters regarding all risk types; Development of risk controls and mitigation processes; and Ensuring the Group s risk management is effective and the Risk Appetite established by the Board is adhered to. Key responsibilities: Assess and approve risk-taking activities; Oversee the Group s risk management infrastructure, which includes frameworks, decision criteria, authorities, people, policies, standards, processes, information and systems; Approve risk policies such as model governance standards, stress testing scenarios, and the evaluation and endorsement of risk models; Identify specific concentrations of risk; and 59
62 42 Credit Risk The most significant measurable risk the Group faces is credit risk, which arises from borrowers or counterparties failing to meet their debt or contractual obligations. The activities which give rise to credit risk include lending to retail, corporate and institutional customers; trading endeavors such as foreign exchange, derivatives and debt securities; and the settlement of transactions. Credit Risk Management s approach to credit risk management comprises the following building blocks: Policies The dimensions of credit risk and the scope of its application are defined in the Group Credit Risk Management Policy. Senior management sets the overall direction and policy for managing credit risk at the enterprise level. Core Credit Risk Policies established for Consumer Banking/Wealth Management and Institutional Banking (herein referred to as CCRPs) set forth the principles by which the Group conducts its credit risk management and control activities. These policies, supplemented by a number of operational policies and standards, ensure consistency in identifying, assessing, underwriting, measuring, reporting and controlling credit risk across the Group, and provide guidance in the formulation of business-specific and/or location-specific credit risk policies and standards. The operational policies and standards are established to provide greater details on the implementation of the credit principles within the Group CCRPs and are adapted to reflect different credit environments and portfolio risk profiles. The CCRPs are considered and approved by GCPC. Risk Methodologies Credit risk is managed by thoroughly understanding the Group s customers the businesses they are in, as well as the economies in which they operate. The usage of credit ratings and lending limits is an integral part of the Group s credit risk management process, and it uses an array of rating models for its corporate and retail portfolios. Most of these models are built internally using the Group s loss data, and the limits are driven by the Group s Risk Appetite Statement and the Target Market and Risk Acceptance Criteria (TMRAC). The wholesale borrowers are assessed individually using both judgmental credit models and statistical credit models. They are further reviewed and evaluated by experienced credit risk managers who consider relevant credit risk factors in the final determination of the borrower's risk. For some portfolios within the small and medium-sized enterprises (SME) segment, the Group also uses a programme-based approach to achieve a balanced management of risks and rewards. Retail exposures are assessed using credit scoring models, credit bureau records, and internally and externally available customer behaviour records. These are supplemented by the Group s Risk Acceptance Criteria. Credit extensions are proposed by the business unit, and these are approved by the credit risk function after taking into account independent credit assessments and the business strategies set by senior management. Pre-settlement credit risk for derivatives arising from a counterparty potentially defaulting on its obligations is quantified by a mark-to-market evaluation, as well as any potential exposure in the future. This is used to calculate the Group s regulatory capital under the Current Exposure Method (CEM), and is included under the Group s overall credit limits to counterparties for internal risk management. Issuer default risk that may also arise from derivatives and securities are generally measured based on jump-to-default computations. actively monitors and manages its exposure to counterparties in over-the-counter (OTC) derivative trades to protect its balance sheet in the event of a counterparty default. Counterparty risk exposures that may be adversely affected by market risk events are identified, reviewed and acted upon by management, and highlighted to the appropriate risk committees. Specific wrong-way risk arises when the exposure to a counterparty positively correlates with the probability of defaulting due to the nature of the transactions. has a policy to guide the handling of specific wrong-way risk transactions, and its risk measurement metric takes into account the higher risks associated with such transactions. Concentration Risk Management s risk management processes, which are aligned with its Risk Appetite, ensure that an acceptable level of risk diversification is maintained across the Group. For credit risk, the Group uses Economic Capital (EC) as its measurement tool, since it combines the individual risk factors of Probability of Default (PD), Loss Given Default (LGD) and Exposure at Default (EAD), as well as portfolio concentration factors. Granular EC thresholds are set to ensure that the allocated EC stays within its Risk Appetite. Thresholds regarding major industry groups and single counterparty exposures are monitored regularly, and notional limits for country exposures are set as well. Governance processes also exist to ensure that the Group s exposures are regularly monitored with these thresholds in mind, and appropriate action is taken when the thresholds are breached. 60
63 continually examines how it can enhance the scope of its thresholds to effect better risk management. Country Risk Country risk refers to the risk of loss due to events in a specific country (or a group of countries). This includes political, exchange rate, economic, sovereign and transfer risks. manages country risk through the Group Credit Risk Management Policy and CCRP, and the said risk is part of its concentration risk management. The way the Group manages transfer risk is set out in its Country Risk Management Standard. This includes an internal transfer risk and sovereign risk rating system, where assessments are made independently of business decisions. s transfer risk limits are set in accordance with its Risk Appetite Policy. Limits for strategic and non-strategic countries are set based on country-specific strategic business considerations as well as the acceptable potential loss according to the Group s Risk Appetite. Senior management and credit management actively evaluate what the right transfer risk exposures for the Group should be, taking into account the risks and rewards, as well as whether they are in line with the Group s strategic intent. Limits for all other countries are set using a model-based approach. All country limits are subject to approval by the BRMC. Stress testing engages in various types of credit stress testing, and these are driven either by regulators or our internal requirements and management. s credit stress tests are performed at total portfolio or sub-portfolio level, and are generally meant to assess the impact of changing economic conditions on asset quality, earnings performance, capital adequacy and liquidity. The Group s stress testing programme is comprehensive, and covers all major functions and areas of business. typically performs the following types of credit stress testing at a minimum and others as necessary: Pillar 2 credit stress testing Industrywide stress testing Sensitivity and scenario analyses minimum regulatory capital. conducts Pillar 2 credit stress testing once a year as part of the internal capital adequacy assessment process (ICAAP). Under Pillar 2 credit stress testing, the Group assesses the impact of stress scenarios, with different levels of severity, on asset quality, earnings performance, internal and regulatory capital. The results of the credit stress tests form an input to the capital planning process under ICAAP. The purpose of the Pillar 2 credit stress testing is to examine, in a rigorous and forward-looking manner, the possible events or changes in market conditions that could adversely impact the Group. participates in the annual industry-wide stress test (IWST) conducted by the Monetary Authority of Singapore (MAS) to facilitate its ongoing assessment of financial stability. Under the IWST, the Group is required to assess the impact of adverse scenarios, as defined by the regulator, on asset quality, earnings performance and capital adequacy. also conducts multiple independent sensitivity analyses and credit portfolio reviews based on various scenarios. The intent of these analyses and reviews is to identify vulnerabilities for the purpose of developing and executing mitigating actions. Processes, Systems and Reports constantly invests in systems to support risk monitoring and reporting for its Institutional Banking and Consumer Banking/Wealth Management businesses. The end-to-end credit process is continually being reviewed and improved through various front-toback initiatives involving the business units, the operations unit, the RMG and other key stakeholders. Day-to-day monitoring of credit exposures, portfolio performance and external environmental factors potentially affecting credit risk profiles is key to its philosophy of effective credit risk management. Pillar 1 credit stress testing conducts Pillar 1 credit stress testing regularly as required by regulators. Under Pillar 1 credit stress testing, the Group assesses the impact of a mild stress scenario (at least two consecutive quarters of zero GDP growth) on Internal Ratings- Based (IRB) estimates (i.e. PD, LGD and EAD) and the impact on regulatory capital. The purpose of the Pillar 1 credit stress test is to assess the robustness of internal credit risk models and the cushion above In addition, risk reporting on credit trends, which may include industry analysis, early warning alerts and significant weak credits, is submitted to the various credit committees, allowing key strategies and action plans to be formulated and evaluated. Credit control functions also ensure that any credit risk taken complies with group-wide credit policies and guidelines. These functions ensure that approved limits are activated, credit excesses and policy exceptions are appropriately endorsed, compliance with credit standards is carried out, and covenants established by management and regulators are monitored. 61
64 Independent risk management functions that report to the CRO are jointly responsible for developing and maintaining a robust credit stress testing programme. These units oversee the implementation of credit stress tests as well as the analysis of the results, of which management, various risk committees and regulators are informed. Non-performing assets s credit facilities are classified as Performing assets or Non-performing assets (NPA), in accordance with the MAS Notice 612. These guidelines require credit portfolios to be categorised into one of the following five categories, according to the Group s assessment of a borrower s ability to repay a credit facility from its normal sources of income. Classification Description grade Performing Assets Pass Indicates that the timely repayment of the outstanding credit facilities is not in doubt. Special Indicates that the borrower exhibits mention potential weaknesses that, if not corrected in a timely manner, may adversely affect future repayments and warrant close attention by the Group. Classified or NPA Substandard Indicates that the borrower exhibits definable weaknesses in its business, cash flow or financial position that may jeopardise repayment on existing terms. These credit facilities may be nondefaulting. Doubtful Indicates that the borrower exhibits severe weaknesses such that the prospect of full recovery of the outstanding credit facilities is questionable and the prospect of a loss is high, but the exact amount remains undeterminable. Loss Indicates that the amount of recovery is assessed to be insignificant. A default is considered to have occurred with regard to a particular borrower when either or both of the following events have taken place: Subjective default: Borrower is considered to be unlikely to pay its credit obligations in full, without the Group taking actions such as realising security (if held) Technical default: Borrower is more than 90 days past due on any credit obligation to the Group This is consistent with the guidance provided under the MAS Notice 637. Credit facilities are classified as restructured assets when the Group grants non-commercial concessions to a borrower because it is in a worse financial position or is unable to meet the original repayment schedule. A restructured credit facility is classified into the appropriate non-performing grade based on the assessment of the borrower s financial condition and its ability to repay according to the restructured terms. Such credit facilities are not returned to the performing status until there are reasonable grounds to conclude that the borrower will be able to service all future principal and interest payments on the credit facility in accordance with the restructured terms. Apart from what has been described, the Group does not grant concessions to borrowers in the normal course of business. Any restructuring of credit facilities are reviewed on a case-by-case basis and conducted only on commercial terms. In addition, it is not within the Group s business model to acquire debts that have been restructured at inception (e.g. distressed debts). Refer to Note 2.11 for the Group s accounting policies regarding specific and general allowances for credit losses. In general, specific allowances are recognised for defaulting credit exposures rated sub-standard and below. The breakdown of the Group s NPA by loan grading and industry and the related amounts of specific allowances can be found in Note A breakdown of past due loans can also be found in the same note. When required, the Group will take possession of all collateral and dispose them as soon as practicable. Realised proceeds are used to reduce outstanding indebtedness. A breakdown of collateral held for NPA is shown in Note Repossessed collateral is classified in the balance sheet as other assets. The amounts of such other assets for 2016 and 2015 were not material. Credit Risk Mitigants Collateral received Where possible, the Group takes collateral as a secondary recourse to the borrower. This includes cash, marketable securities, properties, trade receivables, inventory and equipment and other physical and financial collateral. may also take fixed and floating charges on the assets of borrowers. Policies have been put in place to determine the eligibility of collateral for credit risk mitigation. These include requiring specific collateral to meet minimum operational requirements in order to be considered as effective risk mitigants. s collateral is generally diversified and valued periodically. Properties constitute the bulk of its collateral, while marketable securities and cash are immaterial. For derivatives, repurchase agreements (repo) and other repo-style transactions with financial market 62
65 counterparties, collateral arrangements are typically covered under market-standard documentation, such as the Master Repurchase Agreements and the International Swaps and Derivatives Association (ISDA) Agreements. The collateral received is mark-to-market on a frequency which the Group and the counterparties mutually agreed upon. This is governed by internal guidelines with respect to the eligibility of the collateral. In the event of a default, the credit risk exposure is reduced by master-netting arrangements where the Group is allowed to offset what it owes a counterparty against what is due from that counterparty in a netting-eligible jurisdiction. Collateral held against derivatives generally consists of cash in major currencies and highly rated government or quasi-government bonds. Exceptions may arise in certain countries, where due to domestic capital markets and business conditions, the Group may be required to accept less highly rated or liquid government bonds and currencies. Reverse repotransactions are generally limited to large institutions with reasonably good credit standing. takes haircuts against the underlying collateral of these transactions that commensurate with collateral quality to ensure credit risks are adequately mitigated. In times of difficulty, the Group will review the customer s specific situation and circumstances to assist them in restructuring their repayment liabilities. However, should the need arise, disposal and recovery processes are in place to dispose of collateral held by the Group. also maintains a panel of agents and solicitors that helps it to dispose of non-liquid assets and specialised equipment quickly. Other Risk Mitigants uses guarantees as credit risk mitigants. Internal thresholds for considering eligibility of guarantors for credit risk mitigation are in place Maximum exposure to credit risk The following table shows the exposure to credit risk of on-balance sheet and off-balance sheet financial instruments, before taking into account any collateral held, other credit enhancements and netting arrangements. For on-balance sheet financial assets, the maximum credit exposure is the carrying amounts. For contingent liabilities, the maximum exposure to credit risk is the amount the Group would have to pay if the instrument is called upon. For undrawn facilities, the maximum exposure to credit risk is the full amount of the undrawn credit facilities granted to customers. 39BIn $ millions On-balance sheet Cash and balances with central banks (excluding cash on hand) 23,902 15,759 Government securities and treasury bills 33,401 34,501 Due from banks 30,000 38,274 Derivatives 25,778 23,631 Bank and corporate debt securities 41,439 36,995 Loans and advances to customers 301, ,289 Other assets (excluding deferred tax assets) 10,694 11, , ,737 Off-balance sheet Contingent liabilities and commitments (excluding operating lease and capital commitments) 258, ,683 Total 724, ,420 s exposures to credit risk, measured using the expected gross credit exposures that will arise upon a default of the end obligor are as shown in the Group s Basel II Pillar 3 Disclosures. These exposures, which include both onbalance sheet and off-balance sheet financial instruments, are shown without taking into account any collateral held or netting arrangements. Analysis of Collateral Whilst the Group s maximum exposure to credit risk is the carrying amount of the assets or, in the case of off-balance sheet instruments, the amount guaranteed, committed, accepted or endorsed, the likely exposure may be lower due to offsetting collateral, credit guarantees and other actions taken to mitigate the Group s exposure. The description of collateral for each class of financial asset is set out below: Balances with central banks, government securities and treasury bills, due from banks and bank and corporate debt securities Collateral is generally not sought for these assets. 63
66 Derivatives maintains collateral agreements and enters into master netting agreements with most of the counterparties for derivative transactions. Please refer to Note 37 for the impact of netting arrangements recognised for the computation of Capital Adequacy Ratio (CAR). Loans and advances to customers, contingent liabilities and commitments Certain loans and advances to customers, contingent liabilities and commitments are typically collateralised to a substantial extent. In particular, residential mortgage exposures are generally fully secured by residential properties. Income-producing real estate, which is a sub-set of the Specialised Lending exposure, is fully secured by the underlying assets financed. The extent to which credit exposures are covered by Basel II-eligible collateral, besides real estate, after the application of the requisite regulatory hair-cuts, is shown in the Group s Basel II Pillar 3 Disclosures. The amounts are a sub-set of the actual collateral arrangements entered by the Group as Basel II imposes strict legal and operational standards before collateral can be admitted as credit risk mitigants. As a result, certain collateral arrangements which do not meet its criteria will not be included. Certain collateral types which are not permitted as credit risk mitigants for credit exposures under the Standardised Approach are also excluded Loans and advances to customers 40BIn $ millions Loans and advances to customers Performing Loans - Neither past due nor impaired (i) 299, ,946 - Past due but not impaired (ii) 1,397 1,313 Non-Performing Loans - Impaired (iii) 4,416 2,612 Total gross loans (Note 17) 305, ,871 (i) Neither past due nor impaired loans by grading and industry The credit quality of the portfolio of loans and advances that are neither past due nor impaired can be assessed by reference to the loan gradings in MAS Notice 612: In $ millions Pass Special Mention Total 2016 Manufacturing 29,184 1,053 30,237 Building and construction 57, ,930 Housing loans 63, ,862 General commerce 44,873 1,005 45,878 Transportation, storage and communications 28,815 1,585 30,400 Financial institutions, investment and holding companies 16, ,606 Professionals and private individuals (excluding housing loans) 24, ,424 Others 29, ,265 Total 295,010 4, , Manufacturing 29, ,200 Building and construction 54, ,176 Housing loans 58,023-58,023 General commerce 46, ,350 Transportation, storage and communications 25, ,992 Financial institutions, investment and holding companies 13, ,620 Professionals and private individuals (excluding housing loans) 23, ,505 Others 28, ,080 Total 279,912 3, ,946 64
67 (ii) Past due but not impaired loans by past due period and industry In $ millions Less than 30 days past due 30 to 59 days past due 60 to 90 days past due 2016 Manufacturing Building and construction Housing loans General commerce Transportation, storage and communications Financial institutions, investment and holding companies Professionals and private individuals (excluding housing loans) Others Total 1, , Manufacturing Building and construction Housing loans General commerce Transportation, storage and communications Financial institutions, investment and holding companies Professionals and private individuals (excluding housing loans) Others Total 1, ,313 Total (iii) Non-performing assets (NPAs) Non-performing assets by grading and industry NPAs Specific allowances In $ millions Substandard Doubtful Loss Total Substandard Doubtful Loss Total 2016 Manufacturing Building and construction Housing loans General commerce Transportation, storage and 1, , communications Financial institutions, investment and holding companies Professional and private individuals (excluding housing loans) Others Total non-performing loans 3, , ,270 Debt securities, contingent liabilities and others Total 3, , ,541 Of which: restructured assets
68 118B DBS Bank Ltd. and its subsidiaries NPAs Specific allowances In $ millions Substandard Doubtful Loss Total Substandard Doubtful Loss Total 2015 Manufacturing Building and construction Housing loans General commerce Transportation, storage and communications Financial institutions, investment and holding companies Professional and private individuals (excluding housing loans) Others Total non-performing loans 1, , Debt securities, contingent liabilities and others Total 1, , Of which: restructured assets Non-performing assets by geography (a) 116BNPAs Specific 118Ballowances 115BIn $ millions 2016 Singapore 1, Hong Kong Rest of Greater China South and Southeast Asia 1, Rest of the World Total non-performing loans 4,416 1,270 Debt securities, contingent liabilities and others Total 4,856 1, Singapore Hong Kong Rest of Greater China South and Southeast Asia Rest of the World Total non-performing loans 2, Debt securities, contingent liabilities and others Total 2, (a) Based on the country of incorporation of the borrower Non-performing assets by past due period 119BIn $ millions Not overdue Less than 90 days past due to180 days past due 1, More than 180 days past due 2,238 1,340 Total past due assets 4,151 2,272 Total 4,856 2,792 66
69 43B DBS Bank Ltd. and its subsidiaries Secured non-performing assets by collateral type 120BIn $ millions B2015 Properties Shares and debentures Fixed deposits Others 1, Total 2,614 1, Credit quality of Government securities and treasury bills and Bank and corporate debt securities The table below presents an analysis of Government securities and treasury bills and Bank and corporate debt securities for the Group by rating agency designation as at 31 December: 41BAnalysed by issue ratings Singapore Government securities and treasury bills Other government securities and treasury bills Bank and corporate debt securities 42BIn $ millions 43B2016 AAA 11,983 5,454 16,158 AA- to AA+ - 10,715 5,116 A- to A+ - 1,283 4,141 Lower than A- - 3,966 4,001 Unrated ,023 Total 11,983 21,418 41,439 44B2015 AAA 12,312 5,812 11,024 AA- to AA+ - 12,466 4,845 A- to A+ - 1,016 5,272 Lower than A- - 2,895 4,296 Unrated ,558 Total 12,312 22,189 36,995 67
70 42.4 Credit risk by geography (a) and industry Analysed by geography In $ millions Government securities and treasury bills Due from banks Derivatives Bank and corporate debt securities Loans and advances to customers (Gross) Total 2016 Singapore 11, ,373 13, , ,260 Hong Kong 3, ,744 1,717 50,223 57,677 Rest of Greater China 2,440 15,576 2,903 2,595 43,060 66,574 South and Southeast Asia 3,964 2,817 1,498 4,580 27,389 40,248 Rest of the World 11,169 10,890 17,260 19,237 39,718 98,274 Total 33,401 30,000 25,778 41, , , Singapore 12, ,475 12, , ,384 Hong Kong 2, ,999 1,779 50,976 58,936 Rest of Greater China 4,199 16,054 1,966 3,907 45,129 71,255 South and Southeast Asia 2,892 3,011 1,124 4,669 26,443 38,139 Rest of the World 12,390 18,474 15,067 14,164 28,463 88,558 Total 34,501 38,274 23,631 36, , ,272 (a) Based on the country of incorporation of the issuer (for debt securities), counterparty (for derivatives), borrower (for loans) or the issuing bank in the case of bank backed export financing 68
71 Analysed by industry In $ millions Government securities and treasury bills Due from banks Derivatives Bank and corporate debt securities Loans and advances to customers (Gross) Total 2016 Manufacturing ,632 31,235 34,324 Building and construction ,215 58,358 61,987 Housing loans ,465 64,465 General commerce ,063 46,881 48,404 Transportation, storage and communications ,509 31,964 35,142 Financial institutions, investment and holding companies - 30,000 22,737 19,291 16,742 88,770 Government 33, ,401 Professionals and private individuals (excluding housing loans) ,091 25,831 Others ,729 30,679 43,709 Total 33,401 30,000 25,778 41, , , Manufacturing - - 1,038 2,849 30,874 34,761 Building and construction ,976 55,584 58,890 Housing loans ,569 58,569 General commerce ,249 50,149 Transportation, storage and communications ,192 26,357 29,350 Financial institutions, investment and holding companies - 38,274 19,406 15,547 13,725 86,952 Government 34, ,501 Professionals and private individuals (excluding housing loans) ,105 24,711 Others ,451 29,408 42,389 Total 34,501 38,274 23,631 36, , ,272 69
72 43 Market Risk 45B s exposure to market risk is categorised into: 46BTrading portfolios: Arising from positions taken for (i) market-making (ii) client-facilitation and (iii) benefiting from market opportunities. 47BNon-trading portfolios: Arising from (i) positions taken to manage the interest rate risk of the Group s Institutional Banking and Consumer Banking assets and liabilities, (ii) equity investments comprising of investments held for yield and/or long-term capital gains, (iii) strategic stakes in entities and (iv) structural foreign exchange risk arising mainly from the Group s strategic investments, which are denominated in currencies other than the SGD. 48BMarket Risk Management s approach to market risk management comprises the following building blocks: Policies The Market Risk Management Policy sets the Group s overall approach towards market risk management, while the Market Risk Management Standard establishes the basic requirements for the said management within the Group. The Market Risk Management Guide complements the Market Risk Management Standard by providing more details regarding specific subject matters. Both the Market Risk Management Standard and Market Risk Management Guide facilitate the identification, measurement, control, monitoring and reporting of market risk in a consistent manner. They also set out the overall approach, standards and controls governing market risk stress testing across the Group. The criteria for determining the positions to be included in the trading book are stipulated in the Trading Book Policy Statement. Risk Methodologies Value-at-Risk (VaR) is a method that computes the potential losses of risk positions as a result of market movement over a specified time horizon and according to a given level of confidence. s VaR model is based on historical simulation with a one-day holding period. The Group uses Expected Shortfall (ES), which is the average of potential loss beyond a given level of confidence, to monitor and limit market risk exposures. The market risk economic capital that is allocated by the BRMC is linked to ES by a multiplier. ES is supplemented by risk control metrics such as sensitivities to risk factors and loss triggers for management action. conducts back-testing to verify the predictiveness of the VaR model. Back-testing compares VaR calculated for positions at the close of each business day with the profit and loss (P&L) that actually arises in those positions on the following business day. The back-testing P&L 70 excludes fees and commissions, and revenues from intra-day trading. For back-testing, VaR at the 99% level of confidence and over a one-day holding period is used. adopts the standardised approach to compute market risk regulatory capital under MAS Notice 637 for the trading book positions. As such, VaR back-testing does not impact the Group s regulatory capital for market risk. VaR models allow the Group to estimate the aggregate portfolio market risk potential loss due to a range of market risk factors and instruments.however, there are limitations to VaR models. For example, past changes in market risk factors may not provide accurate predictions of future market movements, and the risk arising from adverse market events may be understated. To monitor the Group s vulnerability to unexpected but plausible extreme market risk-related events, it conducts multiple market risk stress tests regularly. These cover trading and non-trading portfolios and follow a combination of historical and hypothetical scenarios depicting risk-factor movement. ES is the key risk metric used to manage the Group s assets and liabilities. As an exception, credit spread risk regarding loans and receivables is managed under the credit risk management framework. also manages banking book interest rate risk arising from mismatches in the interest rate profiles of assets, liabilities and capital instruments (and associated hedges), which includes basis risk arising from different interest rate benchmarks, interest rate re-pricing risk, yield curve risk and embedded optionality. Behavioural assumptions are applied when managing the interest rate risk of banking book deposits with indeterminate maturities. measures interest rate risk in the banking book on a weekly basis. Credit derivatives are used in the trading book with single name or index underlying instruments to support the Group s business strategy to build a regional fixed income franchise. actively monitors its counterparty credit risk in credit derivative contracts. More than 90% of the gross notional value of the Group s credit derivative positions as at 31 December 2016 was to 19 established names, with which it maintains collateral agreements. Processes, Systems and Reports Robust internal control processes and systems have been designed and implemented to support the Group s market risk management approach. reviews these control processes and systems regularly, and these reviews allow senior management to assess their effectiveness. The RMG Market and Liquidity Risk unit an
73 independent market risk management function reporting to the CRO monitors, controls and analyses the Group s market risk daily. The unit comprises risk control, risk analytics, production and reporting teams. 49BMarket Risk level ES considers the market risks of both the trading and banking books. s ES (based on a 97.5% level of confidence) is tabulated below. The period-end, average, high and low ES are shown. 1 Jan 2016 to 31 Dec 2016 In $ millions As at 31 Dec 2016 Average High Low Total Jan 2015 to 31 Dec 2015 In $ millions As at 31 Dec 2015 Average High Low Total s major market risk driver is interest rate risk in the trading and banking books. The average ES for 2016 was lower than 2015 mainly due to drop-off of volatile rates scenarios for ES calculation and updates to models used to measure interest rate risks in banking book. The following table shows the period-end, average, high and low diversified ES and ES by risk class for Treasury s trading portfolios. The ES reported below are based on a 97.5% level of confidence. 1 Jan 2016 to 31 Dec 2016 In $ millions As at 31 Dec 2016 Average High Low Diversified Interest Rates Foreign Exchange Equity Credit Spread Commodity # # 1 # 1 Jan 2015 to 31 Dec 2015 In $ millions As at 31 Dec 2015 Average High Low Diversified Interest Rates Foreign Exchange Equity Credit Spread Commodity # 1 2 # # Amount under $500,000 The main risk factors driving Treasury s trading portfolios in 2016 were interest rates, foreign exchange and credit spreads. Treasury s trading portfolios average diversified ES remained relatively flat compared to
74 Treasury s trading portfolios experienced five back-testing exceptions in The exceptions occurred in January, February, March, September and December. The four exceptions for the period from January to September were mainly due to (i) pronounced volatilities in SGD interest rates and SGD swap spreads; and (ii) basis risks in onshore/offshore Chinese foreign exchange and interest rate. The exception in December was due to valuation adjustments carried out at the month end. The key market risk drivers of the Group s non-trading portfolios are SGD and USD interest rate positions. The economic value changes were negative $156 million and negative $239 million (2015: negative $250 million and negative $425 million) based on interest rate changes of 100 basis points and 200 basis points respectively. The negative economic value impact declined in December 2016 mainly due to a refinement of the behavioural assumptions for current account balances. 44 Liquidity Risk s liquidity risk arises from its obligations to honour withdrawals of deposits, repayments of borrowed funds at maturity, and its commitments to extend loans to its customers. seeks to manage its liquidity in a manner that ensures that its liquidity obligations will continue to be honoured under normal as well as adverse circumstances. 50BLiquidity Risk Management Liquidity Management and Funding Strategy strives to develop a diversified funding base with access to funding sources across retail and wholesale channels. 's funding strategy is anchored on strengthening its core deposit franchise as the foundation of the Group s long-term funding advantage. With increasing diversification of funding sources, optimising the mismatch in fund deployment against sources with respect to pricing, size, currency and tenor remains challenging. To this end, where practicable and transferable without loss in value, the Group makes appropriate use of the swap markets for different currencies, commensurate with the liquidity of each, in the conversion and deployment of surplus funds across locations. As these swaps typically mature earlier than loans, the Group is exposed to potential cash flow mismatches arising from the risk that counterparties may not roll over maturing swaps with us to support the continual funding of loans. The Group mitigates this risk by setting triggers on the number of swaps transacted with the market and making conservative assumptions on the cash flow behaviour of swaps under its cash flow maturity gap analysis. Overseas locations are encouraged but not required to centralise the majority of their borrowing and deployment of funds with the Group s head office, taking into account the relevant regulatory restrictions while maintaining a commensurate level of presence and participation in the local funding markets. Intragroup funding transactions are priced with reference to the prevailing market rates and parameters set within the Group Funds Transfer Pricing policy. During the Group s annual budget and planning process, each overseas location conducts an in-depth review of its projected loan and deposit growth as well as its net funding and liquidity profile for the next year. The consolidated Group funding and liquidity profiles are reviewed and revised as necessary by senior management. Each overseas location is required to provide justification if head office funding support is required. Assets and Liabilities Committee and respective Location Assets and Liabilities Committee regularly review the Group s balance sheet composition, the growth in loans and deposits, its utilisation of wholesale funding, the momentum of its business activities, market competition, the economic outlook, market conditions and other factors that may affect liquidity in the continual refinement of the Group s funding strategy. Approach to Liquidity Risk Management s approach to liquidity risk management comprises the following building blocks: Policies Liquidity Risk Management Policy sets its overall approach towards liquidity risk management and describes the range of strategies the Group employs to manage its liquidity. These strategies include maintaining an adequate counterbalancing capacity to address potential cash flow shortfalls and having diversified sources of liquidity. s counterbalancing capacity includes liquid assets, the capacity to borrow from the money markets (including the issuance of commercial papers and covered bonds), and forms of managerial interventions that improve liquidity. In the event of a potential or actual crisis, the Group has in place a set of liquidity contingency and recovery plans to ensure that it maintains adequate liquidity. Liquidity Risk Management Policy is 72
75 supported by Standards that establish the detailed requirements for liquidity risk identification, measurement, reporting and control within the Group. The set of Policies, Standards and supporting Guides communicate these baseline requirements to ensure consistent application throughout the Group. Risk Methodologies The primary measure used to manage liquidity within the tolerance defined by the Board is cash flow maturity mismatch analysis. This form of analysis is performed on a regular basis under normal and adverse scenarios. It assesses the adequacy of the Group s counterbalancing capacity to fund or mitigate any cash flow shortfalls that may occur as forecasted in the cash flow movements across successive time bands. To ensure that liquidity is managed in line with the Group s Risk Appetite, core parameters such as the types of scenarios, the survival period and the minimum level of liquid assets, are pre-specified for monitoring and control on a group-wide basis. Any occurrences of forecasted shortfalls that cannot be covered by the Group s counterbalancing capacity will be escalated to the relevant committees for evaluation and action. Liquidity risk stress testing is performed regularly using cash flow maturity mismatch analysis, and covers adverse scenarios involving shocks that are general market and/or name-specific in nature. Stress tests assess the Group s vulnerability when liability run-offs increase, asset rollovers increase and/or liquid asset buffers decrease. In addition, ad hoc stress tests are performed as part of the Group s recovery planning and ICAAP exercises. Liquidity risk control measures such as liquidityrelated ratios and balance sheet analysis are complementary tools for cash flow maturity mismatch analysis, and they are performed regularly to obtain deeper insights and finer control over the Group s liquidity profile across different locations. The liquidity risk control measures also include concentration measures regarding top depositors, wholesale borrowing and swapped funds ratios. Processes, systems and reports Robust internal control processes and systems support the Group s overall approach in identifying, measuring, aggregating, controlling and monitoring liquidity risk across the Group. Following enhancements on the in-house data platform made in the past two years, internal liquidity risk reporting was centralised in 2016, improving Group oversight of its liquidity positions across key locations and currencies. The RMG Market and Liquidity Risk unit manages the day-to-day liquidity risk monitoring, control reporting and analysis. Liquidity risk in 2016 actively monitors and manages its liquidity profile through cash flow maturity mismatch analysis. In forecasting cash flow under the analysis, behavioural profiling is necessary in cases where a product has indeterminate maturity or the contractual maturity does not realistically reflect the expected cash flow. Two examples are maturity-indeterminate savings and current account deposits, which are generally viewed as sources of stable funding for commercial banks. In fact, they consistently exhibit stability even under historical periods of stress. A conservative view is adopted in the behavioural profiling of assets, liabilities and off-balance sheet commitments that have exhibited cash flow patterns that differ significantly from the contractual maturity profile shown under Note
76 44.1 Contractual maturity profile of assets and liabilities The table below analyses assets and liabilities of the Group as at 31 December based on the remaining period as at balance sheet date to the contractual maturity date: 51B Less than 7 days 1 week to 1 month 1 to 3 months 3 to 12 months 1 to 3 years 3 to 5 years More than 5 years No specific maturity 52BIn $ millions 2016 Cash and balances with central banks 15,674 6,853 2,394 1, ,840 Government securities 470 1,475 3,178 7,524 6,874 4,452 9,428-33,401 and treasury bills Due from banks 11,458 2,971 4,197 10,078 1, ,000 Derivatives (a) 25, ,778 Bank and corporate 23 1, ,183 14,889 12,213 8,016 3,978 45,417 securities Loans and advances to 27,832 39,568 28,797 44,478 54,008 39,447 67, ,516 customers Other assets 5, ,315 2, ,027 Associates Properties and other ,572 1,572 fixed assets Goodwill and intangibles ,117 5,117 Total assets 86,775 52,980 40,800 69,885 77,615 56,350 84,862 12, ,558 Due to banks 10,660 2,877 1, ,915 Deposits and balances 239,622 43,131 34,511 26,475 3, ,446 from customers Derivatives (a) 24, ,525 Other liabilities 6,502 1,082 2,080 3, ,788 15,853 Other debt securities 1,074 3,516 8,891 4,058 4,155 1,584 2,067-25,345 Due to holding company ,102 Subordinated term ,591-2,457 debts Total liabilities 282,796 50,606 47,576 34,688 7,498 2,738 4,953 2, ,643 Non-controlling interests ,523 2,523 Shareholders funds ,392 45,392 Total equity ,915 47, Cash and balances with central banks 14,208 1, ,935 1, ,828 Government securities ,328 4,535 12,089 4,338 10,333-34,501 and treasury bills Due from banks 19,265 3,020 5,799 9, ,274 Derivatives (a) 23, ,631 Bank and corporate ,148 13,384 9,083 8,034 3,078 40,073 securities Loans and advances to 24,711 36,063 28,343 45,259 51,893 34,646 62, ,289 customers Other assets 5, ,437 1,422 1, ,587 Associates ,000 1,000 Properties and other ,547 1,547 fixed assets Goodwill and intangibles ,117 5,117 Total assets 88,360 41,674 39,490 67,810 79,990 48,379 80,753 11, ,847 Due to banks 13,575 2,634 1, ,251 Deposits and balances 218,063 42,716 34,018 23,237 1, ,134 from customers Derivatives (a) 22, ,191 Other liabilities 4,222 1,174 1,678 2, ,294 12,363 Other debt securities 1,765 6,622 13,279 5,070 5,195 2,241 2,022-36,194 Due to holding company 1, ,133 Subordinated term ,026-4,026 debts Total liabilities 260,903 53,146 50,810 30,437 7,437 3,263 7,002 2, ,292 Non-controlling interests ,308 2,308 Shareholders funds ,247 40,247 Total equity ,555 42,555 (a) Derivative financial assets and liabilities are included in the Less than 7 days bucket as they are mainly held for trading. Refer to the table in Note 44.2 on cash flows associated with these derivatives Total 74
77 The above table includes disclosure of the contractual maturity of financial liabilities, which approximates the same analysis on an undiscounted basis as total future interest payments are not material relative to the principal amounts. Assets and liabilities (including non-maturing savings/current deposits) are represented on a contractual basis or in a period when it can legally be withdrawn. On a behavioural basis for liquidity risk analysis, the assets and liabilities cash flows may differ from contractual basis Derivatives The table below shows the contractual undiscounted cash flows for derivatives settled on net and gross settlement basis: Less than 7 days 1 week to 1 month 1 to 3 months 3 to 12 months More than 1 year 53BIn $ millions (a) 2016 Derivatives settled on a net basis (475) (12) ,406 1,321 Derivatives settled on a gross basis - inflow 59, , , , , ,701 - outflow (58,909) (104,280) (171,858) (232,889) (184,541) (752,477) 2015 Derivatives settled on a net basis (402) (3) Derivatives settled on a gross basis - inflow 48,301 93, , , , ,157 - outflow (48,045) (93,041) (141,708) (264,009) (136,252) (683,055) (a) Positive indicates inflow and negative indicates outflow of funds Total 44.3 Contingent liabilities and commitments The table below shows the Group s contingent liabilities and commitments based on the remaining period as at the balance sheet date to contractual expiry date: Less than 1 to 3 3 to 5 Over 5 Total 54BIn $ millions 1 year years years years 2016 Guarantees, endorsements and other contingent 22, ,714 liabilities Undrawn credit commitments (a) and other facilities 206,183 11,970 13,028 4, ,333 Operating lease commitments Capital commitments Total 229,185 12,249 13,073 4, , Guarantees, endorsements and other contingent 19, ,901 liabilities Undrawn credit commitments (a) and other facilities 197,676 8,985 10,389 2, ,782 Operating lease commitments Capital commitments Total 217,836 9,335 10,480 2, ,392 (a) Includes commitments that are unconditionally cancellable at any time by the Group expects that not all of the contingent liabilities and undrawn credit commitments will be drawn before expiry. 75
78 45 Operational Risk Operational risk includes processing errors, fraudulent acts, inappropriate behaviour of staff, vendor misperformance, system failure and natural disasters. Operational risk is inherent in the Group s businesses and activities. s objective is to keep operational risk at appropriate levels, taking into account the markets the Group operates in, the characteristics of the businesses as well as its economic and regulatory environment. 55BOperational Risk Management s approach to operational risk management comprises the following building blocks: Policies Operational Risk Management (ORM) Policy sets its overall approach for managing operational risk in a structured, systematic and consistent manner. There are policies, standards, tools and programmes in place to govern ORM practices across the Group. These include corporate operational risk policies and standards that are owned by the respective corporate oversight and control functions. The key policies address risk areas relating to technology, compliance, fraud, money laundering, financing of terrorisms and sanctions, new product and outsourcing. Risk methodologies adopts the standardised approach to compute operational risk regulatory capital. To manage and control operational risk, the Group uses various tools, including risk and control selfassessment, operational risk event management and key risk indicator monitoring. Risk and control self-assessment is used by each business or support unit to identify key operational risk and assess how effective the internal controls are. When control issues are identified, the units develop action plans and track the resolution of the issues. Operational risk events are classified in accordance with Basel standards. Such events, including any significant incidents that may impact the Group s reputation, must be reported based on certain established thresholds. Key risk indicators with pre-defined escalation triggers are employed to facilitate risk monitoring in a forward-looking manner. Additional methodologies are in place to address subject-specific risks, including, but not limited to, the following: Technology risk Information Technology (IT) risk is managed through an enterprise technology risk approach. This covers risk governance, communication, monitoring, assessment, mitigation and acceptance, and is supported by a set of IT policies and standards, control processes and risk mitigation programmes. has also established policies and standards to manage and address cyber security risk. To enhance the management of this risk, the Group has appointed a Chief Information Security Officer who is responsible for its cyber security risk management strategy and programme. Compliance risk Compliance risk refers to the risk of the Group not being able to successfully conduct its business because of any failure to comply with laws, regulatory requirements, industry codes or standards of business and professional conduct applicable to the financial sector. This includes, in particular, laws and regulations applicable to the licensing and conducting of banking or other financial businesses, financial crime such as anti-money laundering and countering the financing of terrorism, fraud and bribery/corruption. maintains a compliance programme designed to identify, assess, measure, mitigate and report on such risks through a combination of policy and relevant systems and controls. also provides relevant training and implements assurance processes. strongly believes in the need to promote a strong compliance culture as well, and this is developed through the leadership of its Board and senior management. Fraud risk has established minimum standards for its business and support units to prevent, detect, investigate and remediate fraud and related events. This is based on the Fraud Management Programme, through which standards are implemented at the unit and geographical levels. These standards aim to provide end-to-end management for fraud and related issues within the Group. Money laundering, financing of terrorism and sanctions risks There are minimum standards for the Group s business and support units to mitigate and manage its actual and/or potential exposure to money laundering, terrorist financing, sanctions, corruption, or other illicit financial activities. Accountabilities have also been established for the protection of the Group s assets and reputation, as well as the interests of its customers and shareholders. New product and outsourcing risks Each new product, service or outsourcing initiative 76
79 is subject to a risk review and sign-off process, where relevant risks are identified and assessed by departments independent of the risk-taking unit proposing the product or service. Variations of existing products or services and outsourcing initiatives are also subject to a similar process. Other mitigation programmes To manage business disruptions effectively, business continuity management is vital as part of the Group s risk mitigation programme. A robust crisis management and business continuity management programme is in place within essential business services for unforeseen events. Planning for business resilience includes the identification of key business processes via Business Impact Analysis as well as the documentation and maintenance of the Group s Business Continuity Plan (BCP). s BCP aims to minimise the impact of business interruption stemming from severe loss scenarios, and provide a reasonable level of service until normal business operations are resumed. Within the crisis management structure, the Group has in place an incident management process. This contains the situation from the point it begins and the crisis is declared to when the relevant committees or teams are activated to manage the crisis. Exercises are conducted annually, simulating different scenarios to test the Group s BCPs and crisis management protocol. These scenarios include incidents like technology issues affecting essential banking services across the Group, natural disasters with wide geographical impact, safety-at-risk incidents (e.g. terrorism) and other events leading to significant business disruption. The effectiveness of these exercises, as well as the Group s business continuity readiness, its alignment to regulatory guidelines and its disclosure of residual risks, are communicated and verified with the BRMC on an annual basis. To mitigate losses from specific unexpected and significant event risks, the Group purchases groupwide insurance policies under the Group Insurance Programme from third-party insurers. has acquired insurance policies relating to crime and professional indemnity; director and officer liability; property damage and business interruption; general liability; and terrorism. Processes, Systems and Reports Robust internal control processes and systems are integral to identifying, monitoring, managing and reporting operational risk. self-assessment, key risk indicators, the tracking of issues or action plans and operational risk reporting. s units are responsible for the day-today management of operational risk in their products, processes, systems and activities, in accordance with the various frameworks and policies. The RMG Operational Risk unit and other corporate oversight and control functions oversee and monitor the effectiveness of operational risk management, assess key operational risk issues with the units to determine the impact across the Group, and report and/or escalate key operational risks to relevant senior management and Boardlevel committees with recommendations on appropriate risk mitigation strategies. 46 Capital Management The Board is responsible for setting the Group s capital management objective, which is to maintain a strong capital position consistent with regulatory requirements under MAS Notice 637 and the expectations of various stakeholders, e.g. customers, investors and rating agencies. The Board articulates this objective in the form of capital targets. This objective is pursued while delivering returns to shareholders and ensuring that adequate capital resources are available for business growth and investment opportunities as well as adverse situations, taking into consideration the Group s strategic plans and risk appetite. s capital management objective is implemented via a capital management and planning process that is overseen by the Capital Committee. The Chief Financial Officer chairs the Capital Committee. The Capital Committee receives regular updates on the Group s current and projected capital position. A key tool for capital planning is the annual Internal Capital Adequacy Assessment Process (ICAAP) through which the Group assesses its forecast capital supply and demand relative to regulatory requirements and internal capital targets. The ICAAP has a three-year horizon and covers various scenarios, including stress scenarios of differing scope and severity. is subject to and has complied with the capital adequacy requirements set out in the MAS Notice 637, which effects the Basel Committee on Banking Supervision s capital adequacy framework in Singapore throughout the year. s capital adequacy ratios as at 31 December 2016 have been subject to an external limited assurance review, pursuant to MAS Notice 609 Auditors Reports and Additional Information to be submitted with Annual Accounts. has implemented a web-based system that supports multiple operational risk management processes and tools, including operational risk event reporting, risk and control 77
80 47 Segment Reporting 47.1 Business segment reporting s various business segments are described below: Consumer Banking/Wealth Management Consumer Banking/ Wealth Management provides individual customers with a diverse range of banking and related financial services. The products and services available to customers include current and savings accounts, fixed deposits, loans and home finance, cards, payments, investment and insurance products. Institutional Banking Institutional Banking provides financial services and products to institutional clients including bank and non-bank financial institutions, government- linked companies, large corporates and small and mediumsized businesses. The business focuses on broadening and deepening customer relationships. Products and services comprise the full range of credit facilities from short-term working capital financing to specialised lending. It also provides global transactional services such as cash management, trade finance and securities and fiduciary services; treasury and markets products; corporate finance and advisory banking as well as capital markets solutions. 89BTreasury Treasury provides treasury services to corporations, institutional and private investors, financial institutions and other market participants. It is primarily involved in sales, structuring, market-making and trading across a broad range of financial products including foreign exchange, interest rate, debt, credit, equity and other structured derivatives. Income from these financial products and services offered to the customers of Consumer Banking/Wealth Management and Institutional Banking, is reflected in the respective segments. Treasury is also responsible for managing surplus funds. Others Others encompass a range of activities from corporate decisions and include income and expenses not attributed to other business segments, including capital and balance sheet management, funding and liquidity. DBS Vickers Securities and Islamic Bank of Asia are also included in this segment. 78
81 The following table analyses the results, total assets and total liabilities of the Group by business segment: Consumer Banking/ In $ millions Wealth Management Institutional Banking Treasury Others Total 2016 Net interest income 2,715 3, ,291 Non-interest income 1,564 1, ,182 Total income 4,279 5,216 1, ,473 Expenses 2,384 1, ,965 Allowances for credit and other losses 129 1,499 - (194) 1,434 Profit before tax 1,766 1, ,074 Income tax expense 719 Net profit attributable to shareholders 4,254 Total assets before goodwill and intangibles 96, , ,701 45, ,441 Goodwill and intangibles 5,117 Total assets 481,558 Total liabilities 187, ,598 47,836 30, ,643 Capital expenditure Depreciation (a) Net interest income 2,157 3, ,086 Non-interest income 1,390 1, ,854 Total income 3,547 5,290 1, ,940 Expenses 2,261 1, ,893 Allowances for credit and other losses (38) Profit before tax 1,170 3, ,304 Income tax expense 725 Net profit attributable to shareholders 4,503 Total assets before goodwill and intangibles 90, ,196 91,257 46, ,730 Goodwill and intangibles 5,117 Total assets 457,847 Total liabilities 172, ,231 43,354 43, ,292 Capital expenditure Depreciation (a) (a) Amounts for each business segment are shown before allocation of centralised costs 79
82 47.2 Geographical segment reporting Income and net profit attributable to shareholders (Net profit) are based on the country in which the transactions are booked. Total assets are shown by geographical area in which the assets are booked. The total assets, income and net profit are stated after elimination of inter-group assets and revenues. Rest of Greater China (a) South and Southeast Asia (b) Rest of the World (c) In $ millions Singapore Hong Kong Total 2016 Net interest income 4,874 1, ,291 Non-interest income 2, ,182 Total income 7,524 2, ,473 Total expenses 2, ,965 Allowances for credit and other losses ,434 Profit before tax 4, (2) ,074 Income tax expense Net profit attributable to shareholders 3, (21) ,254 Total assets before goodwill and 316,896 73,338 40,436 21,613 24, ,441 intangibles Goodwill and intangibles 5, ,117 Total assets 321,979 73,372 40,436 21,613 24, ,558 Non-current assets (d) 1, , Net interest income 4,644 1, ,086 Non-interest income 2, ,854 Total income 6,812 2,289 1, ,940 Total expenses 2, ,893 Allowances for credit and other losses Profit before tax 3,683 1, ,304 Income tax expense Net profit attributable to shareholders 3,140 1, ,503 Total assets before goodwill and 303,543 73,013 41,784 16,304 18, ,730 intangibles Goodwill and intangibles 5, ,117 Total assets 308,626 73,047 41,784 16,304 18, ,847 Non-current assets (d) 2, ,547 (a) Rest of Greater China includes branch, subsidiary and associate operations in Mainland China and Taiwan (b) South and Southeast Asia includes branch, subsidiary and associate operations in India, Indonesia, Malaysia and Vietnam (c) Rest of the World includes branch operations in South Korea, Japan, Dubai, United Kingdom and Australia. (d) Includes investments in associates, properties and other fixed assets 48 Subsequent Event On 10 February 2017, DBSH announced that the Bank had agreed to sell its entire equity interest in DBS China Square Limited (DCS) to an indirect subsidiary of Manulife Financial Corporation. The sale is expected to be completed by the end of March 2017 and will result in a net gain of approximately $350 million to be recognised in the first quarter of As at 31 December 2016, DCS main asset, PWC Building, was classified as an asset held for sale (refer to Note 25.1). The remaining assets, liabilities and reserves of DCS were not material and hence not classified as held for sale. 80
83 123BDirectors' Statement The Directors are pleased to submit their statement to the Members, together with the audited consolidated financial statements of DBS Bank Ltd. (the Bank) and its subsidiaries (the Bank Group) and the financial statements of the Bank for the financial year ended 31 December These have been prepared in accordance with the provisions of the Companies Act, Chapter 50 (the Companies Act) and the Singapore Financial Reporting Standards, as modified by the requirements of Notice to Banks No. 612 Credit Files, Grading and Provisioning issued by the Monetary Authority of Singapore. In the opinion of the Directors, the consolidated financial statements of the Bank Group, consisting of the Bank and its subsidiaries and the financial statements of the Bank, together with the notes thereon, as set out on pages 1 to 80, are drawn up so as to give a true and fair view of the financial position of the Bank and Bank Group, as at 31 December 2016, and the performance and changes in equity of the Bank and Bank Group, and cash flow statement of the Bank Group for the financial year ended on that date. As at the date of this statement, there are reasonable grounds to believe that the Bank and the Bank Group will be able to pay their debts as and when they fall due. DBSH Share Plan During the financial year, time-based awards in respect of an aggregate of 8,251,608 ordinary shares were granted pursuant to the DBSH Share Plan to selected employees of the Bank Group. This included 487,626 ordinary shares comprised in awards granted to the executive Director, Mr Piyush Gupta, which formed part of his remuneration. During the financial year, certain non-executive Directors received an aggregate of 68,136 share awards, which formed part of their directors fees for acting as Directors of DBSH. Details are set out below. Directors of the Bank Share awards granted during the financial year under review Share awards vested during the financial year under review Peter Seah (2) 36,253 43,892 Piyush Gupta 487,626 (1) 338,811 Bart Broadman (2) 4,367 6,014 Euleen Goh (2) 7,188 10,149 Ho Tian Yee (2) 4,157 5,165 Nihal Kaviratne CBE (2) 4,995 6,359 Andre Sekulic (2) 5,284 5,284 Danny Teoh (2) 5,892 8,148 (1) Mr Gupta s awards formed part of his remuneration for 2015 (2) The awards of these non-executive Directors formed part of their directors fees for acting as Directors of DBSH in All the awards granted to these non-executive Directors during the financial year under review vested immediately upon grant. 81
84 Information on the DBSH Share Plan is as follows: (i) Awards over DBSH s ordinary shares may be granted to Bank Group executives who hold such rank as may be determined by the Compensation and Management Development Committee of DBSH from time to time. Awards may also be granted to (amongst others) executives of associated companies of the Bank who hold such rank as may be determined by the Compensation and Management Development Committee from time to time, and non-executive Directors of DBSH. The participants of the DBSH Share Plan shall not be eligible to participate in the DBSH Employee Share Plan or other equivalent plans. (ii) (iii) (iv) (v) Where time-based awards are granted, participants are awarded ordinary shares of DBSH or, at the Compensation and Management Development Committee s discretion, their equivalent cash value or a combination of both as part of their deferred bonus, at the end of the prescribed vesting periods. Awards are granted under the DBSH Share Plan at the absolute discretion of the Compensation and Management Development Committee. Dividends on unvested shares do not accrue to employees. The DBSH Share Plan shall continue to be in force at the discretion of the Compensation and Management Development Committee, subject to a maximum period of ten years. At an Extraordinary General Meeting of DBSH held on 8 April 2009, the DBSH Share Plan was extended for another ten years, from 18 September 2009 to 17 September 2019, provided always that the DBSH Share Plan may continue beyond the above stipulated period with the approval of the shareholders of DBSH by ordinary resolution in general meeting and of any relevant authorities which may then be required. Awards under the DBSH Share Plan may be granted at any time in the course of a financial year, and may lapse by reason of cessation of employment or misconduct of the participant, except in cases such as retirement, redundancy, ill health, injury, disability, death, bankruptcy of the participant, or by reason of the participant, being a non-executive Director, ceasing to be a Director, or in the event of a take-over, winding up or reconstruction of DBSH. Subject to the prevailing legislation and the rules of the Singapore Exchange, DBSH will have the flexibility to deliver ordinary shares of DBSH to participants upon vesting of their awards by way of an issue of new ordinary shares and/or the transfer of existing ordinary shares (which may include ordinary shares held by DBSH in treasury). The class and/or number of ordinary shares of DBSH comprised in an award to the extent not yet vested, and/or which may be granted to participants, are subject to adjustment by reason of any variation in the ordinary share capital of DBSH (whether by way of a capitalisation of profits or reserves or rights issue, reduction, subdivision, consolidation, or distribution) or if DBSH makes a capital distribution or a declaration of a special dividend (whether in cash or in specie), upon the written confirmation of the auditor of DBSH that such adjustment (other than in the case of a capitalisation issue) is fair and reasonable. 124Board of Directors The Directors in office at the date of this statement are: Peter Seah Lim Huat - Chairman Piyush Gupta - Chief Executive Officer Bart Joseph Broadman Euleen Goh Yiu Kiang Ho Tian Yee Nihal Vijaya Devadas Kaviratne CBE Andre Sekulic Danny Teoh Leong Kay Woo Foong Pheng (Mrs Ow Foong Pheng) Dr Bart Broadman, Mr Ho Tian Yee and Mrs Ow Foong Pheng will retire in accordance with Article 95 of the Bank s Constitution at the forthcoming annual general meeting (AGM) and will offer themselves for re-election at the AGM. 82
85 Arrangements to enable Directors to acquire shares or debentures Neither at the end of, nor at any time during the financial year, was the Bank a party to any arrangement, the object of which is to enable the Directors to acquire benefits through the acquisition of shares in or debentures of the Bank or any other body corporate, save as disclosed in this statement. 125BDirectors' interest in shares or debentures The following Directors, who held office at the end of the financial year, had, according to the register of directors shareholdings required to be kept under Section 164 of the Companies Act, an interest in shares of the Bank and related corporations as stated below: DBSH ordinary shares Holdings in which Directors have a direct interest 91BAs at As at 31 Dec Jan 2016 Holdings in which Directors are deemed to have an interest 92BAs at 31 Dec 2016 As at 1 Jan 2016 Peter Seah 175, , Piyush Gupta 962, , , ,000 Bart Broadman 109,876 28, Euleen Goh 45,209 34, Ho Tian Yee 38,591 12, Nihal Kaviratne CBE 16,224 9, Andre Sekulic 17,476 11, Danny Teoh 34,636 25,966 19,099 18,723 Ow Foong Pheng 25,464 24, Share awards (unvested) granted under the DBSH Share Plan Peter Seah - 7, Piyush Gupta (1) 1,201,521 1,052, Bart Broadman - 1, Euleen Goh - 2, Ho Tian Yee - 1, Nihal Kaviratne CBE - 1, Danny Teoh - 2, DBS Bank 4.7% non-cumulative non-convertible redeemable perpetual preference shares Euleen Goh 3,000 3, (1) Mr Gupta s share awards form part of his remuneration. Details of the DBSH Share Plan are set out in Note Note 38 of the Notes to the 2016 Bank Group s financial statements There was no change in any of the above-mentioned interests between the end of the financial year and 21 January
86
87
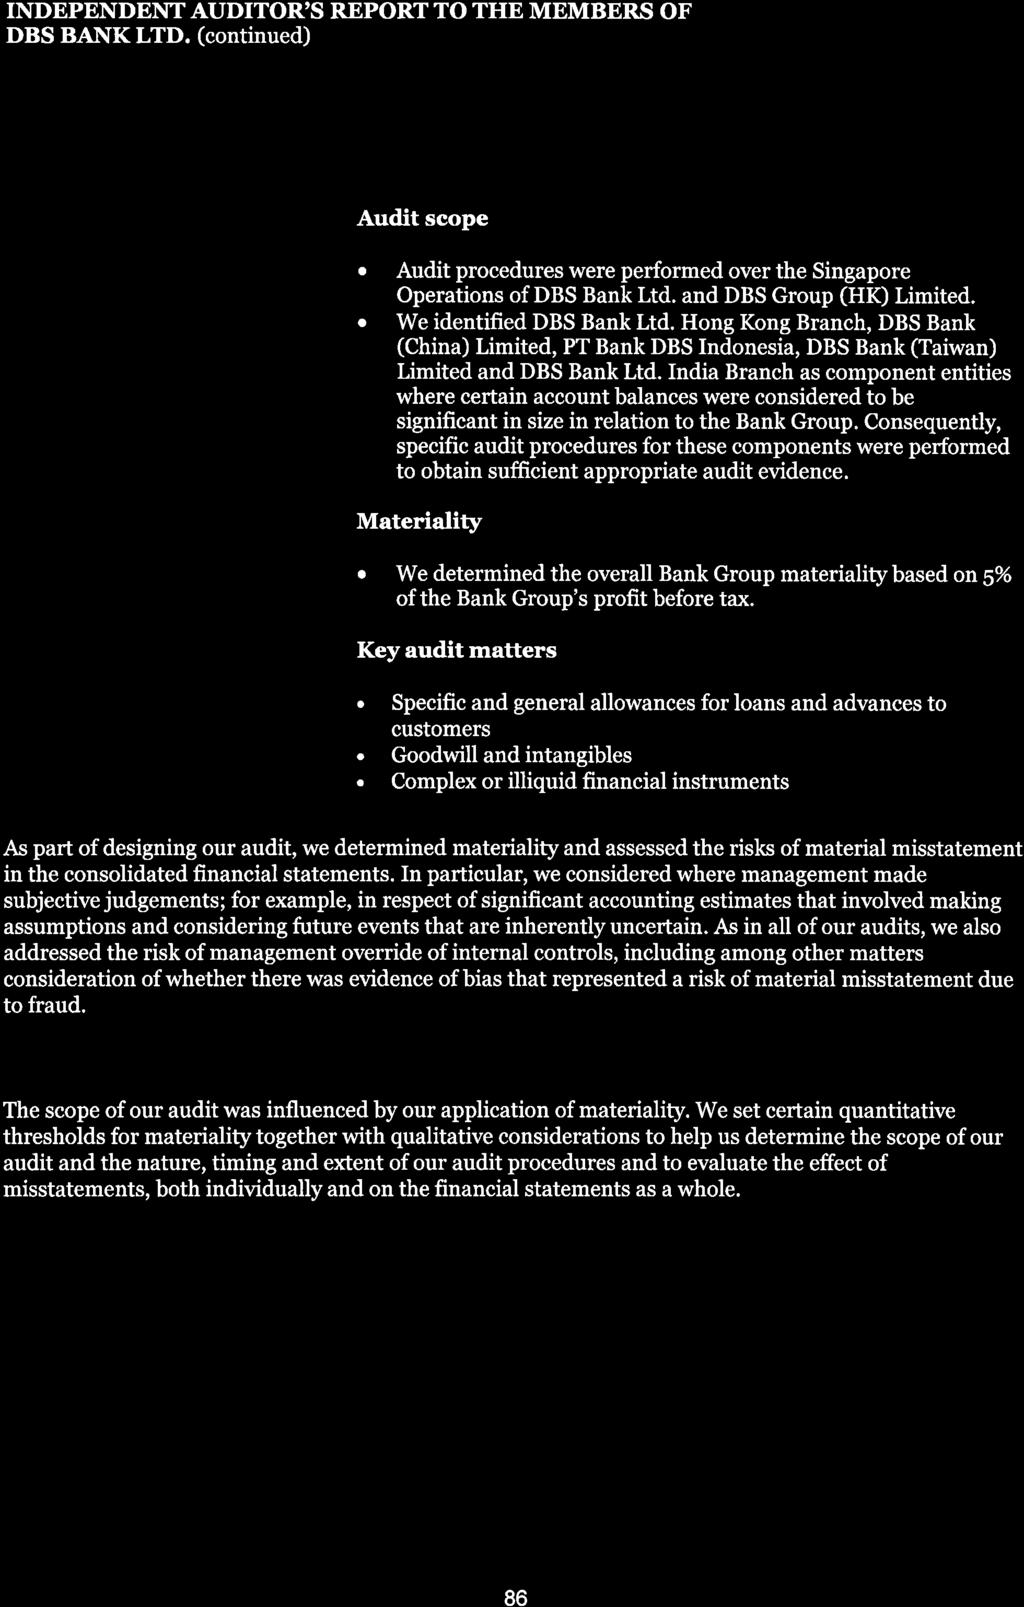
88

89
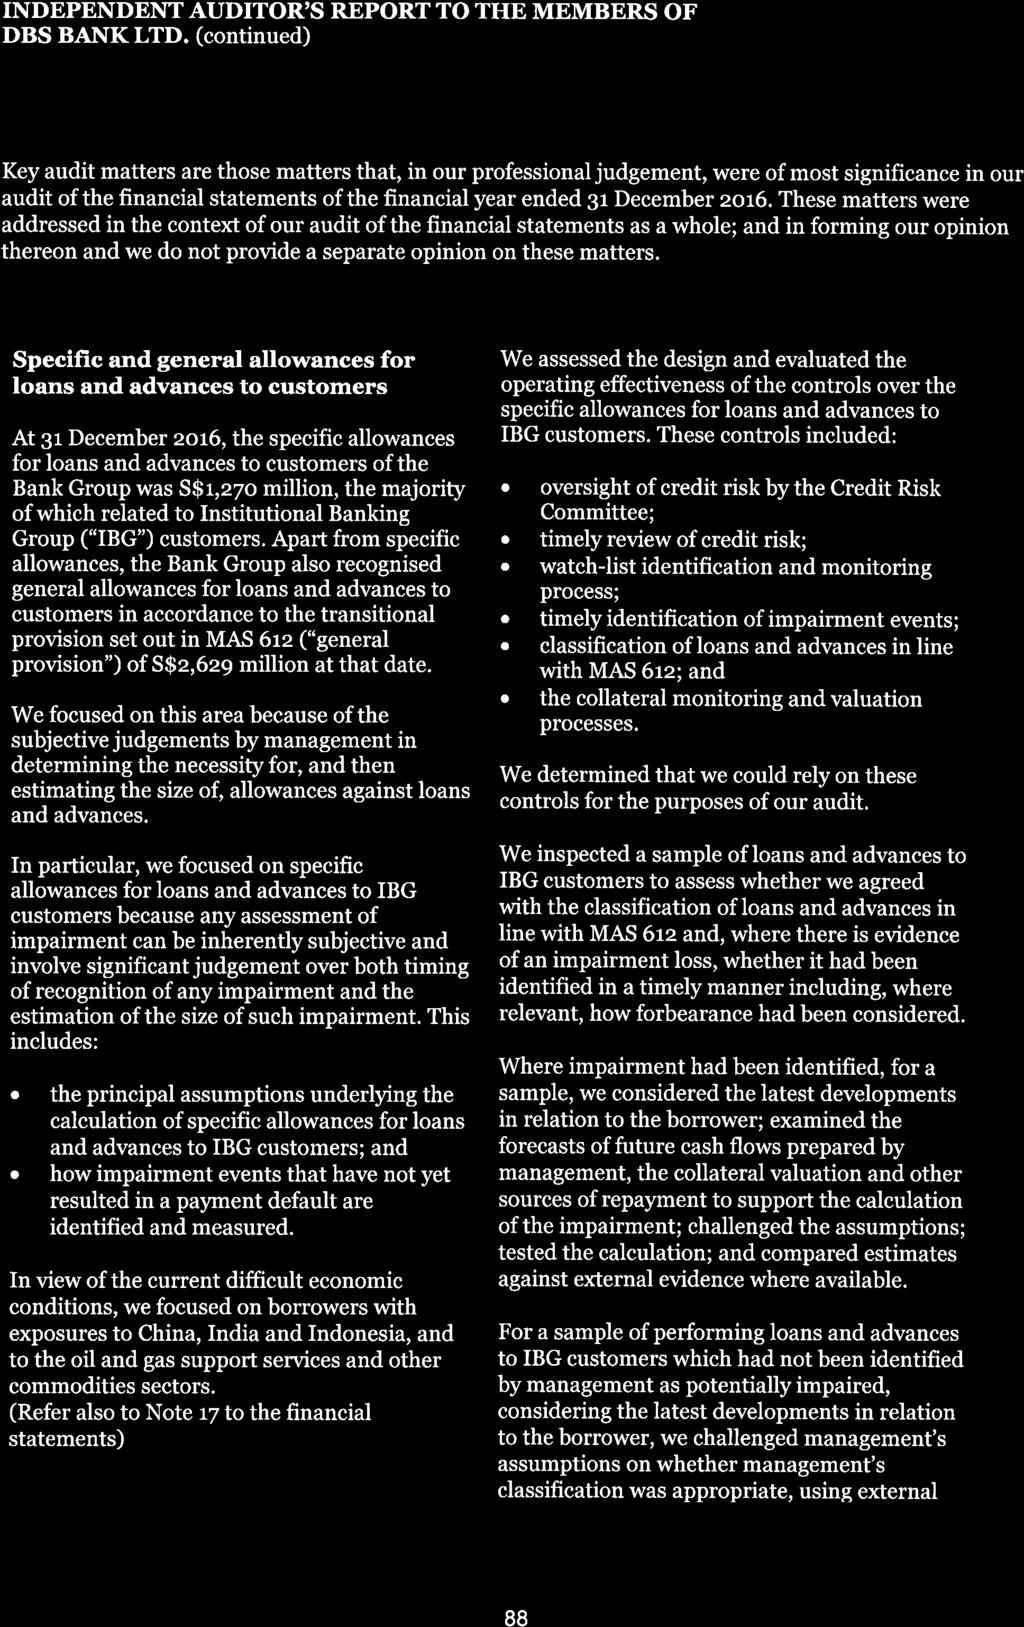
90
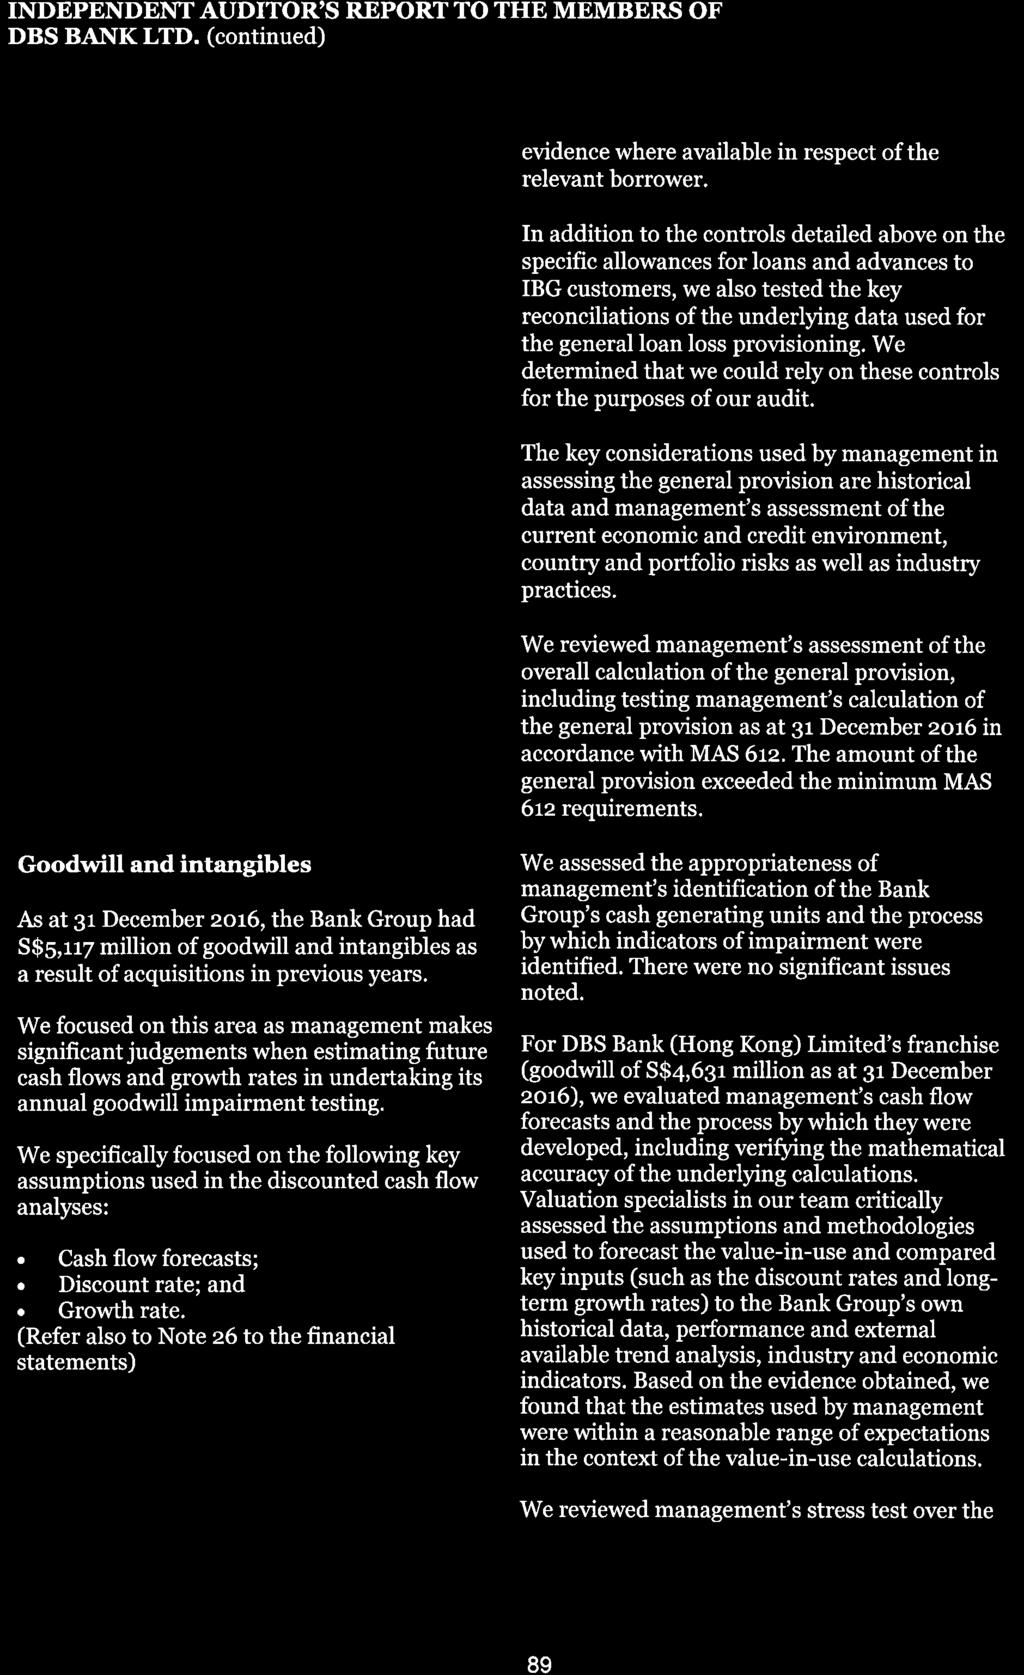
91
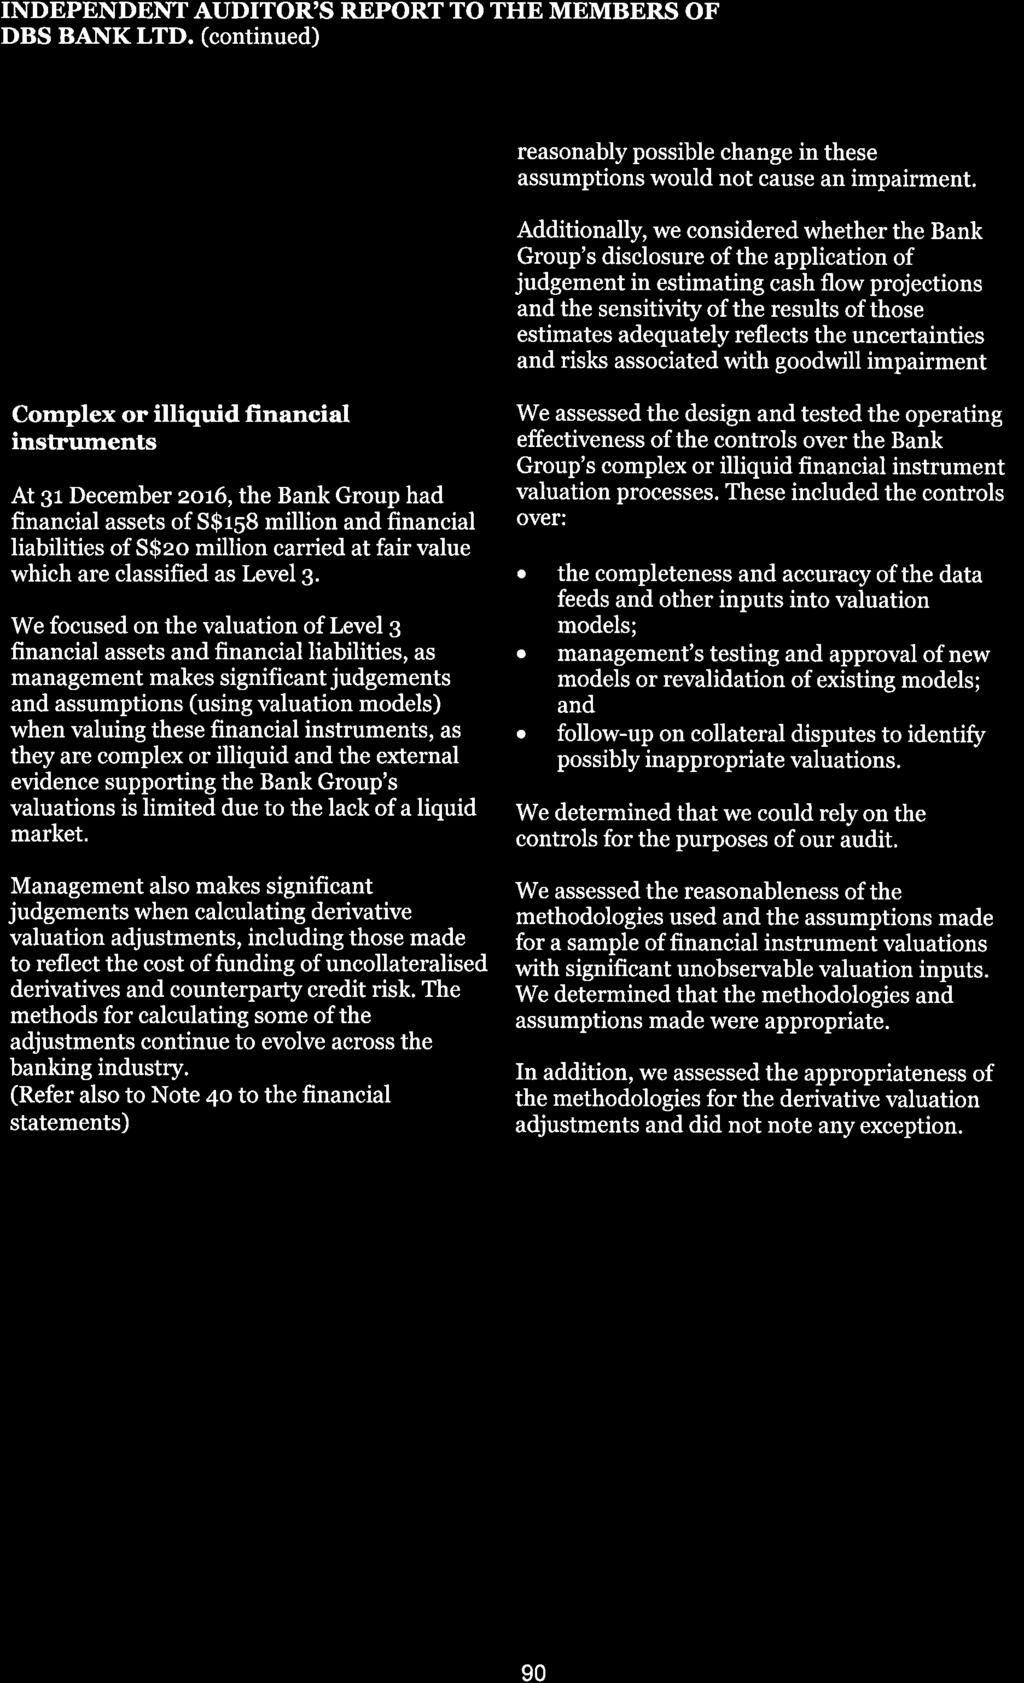
92
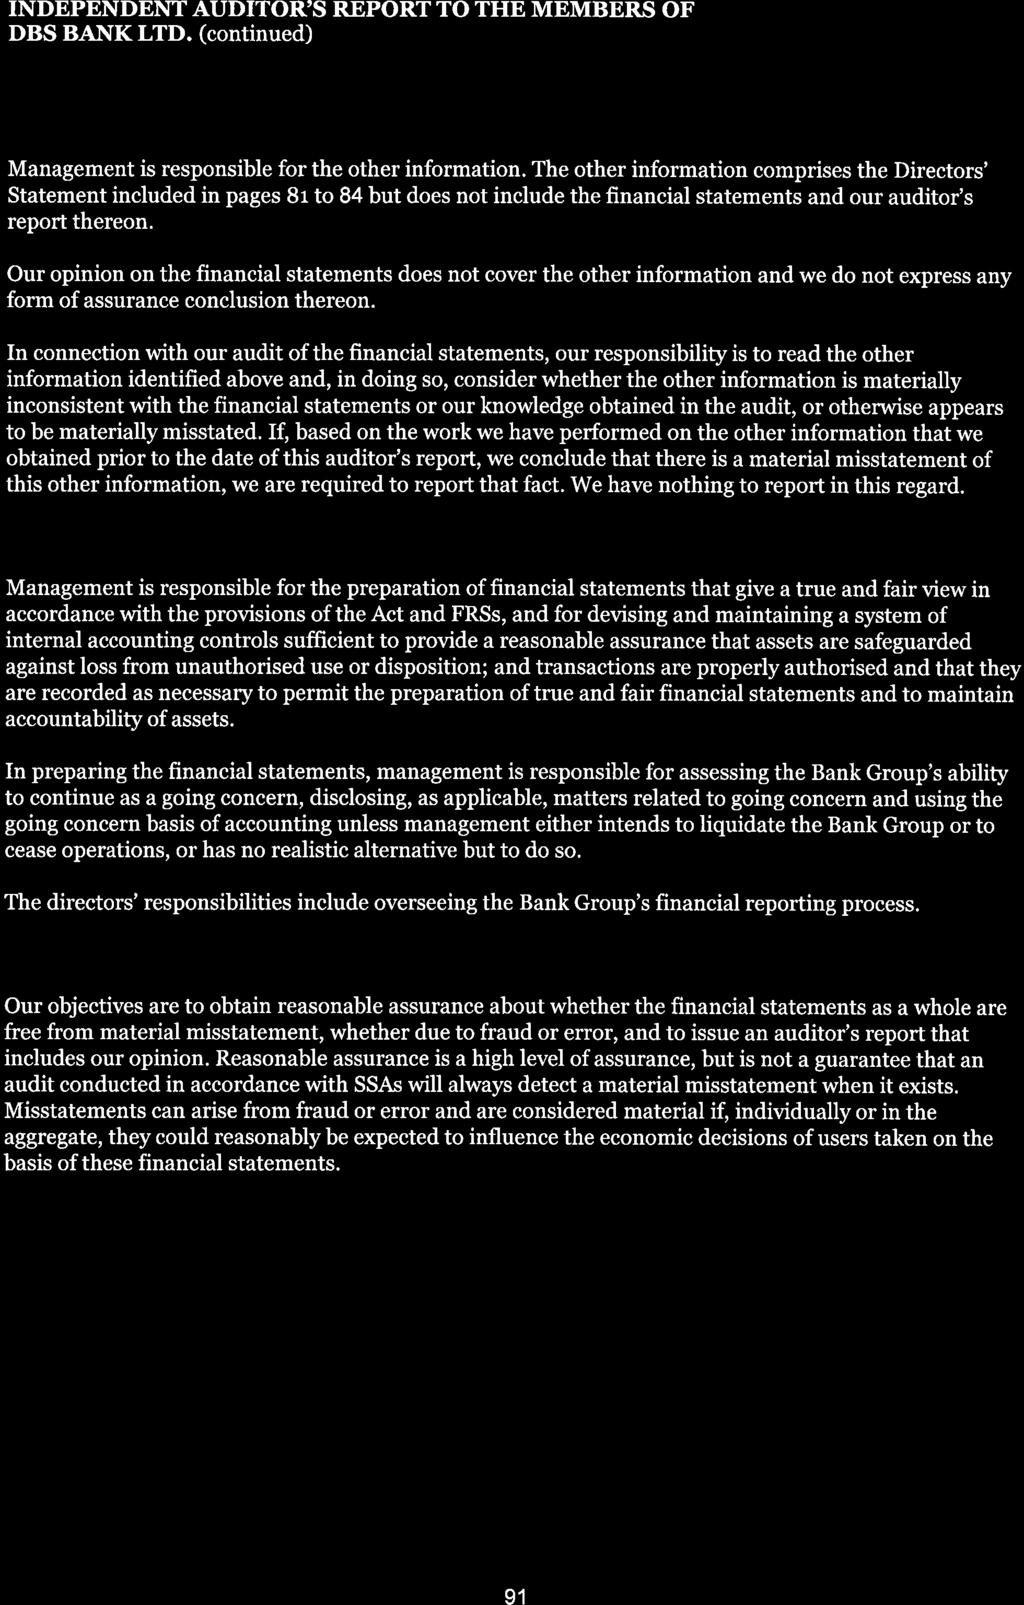
93
94
Financial statements. DBS Group Holdings Ltd and its Subsidiaries. DBS Bank Ltd
 Financial statements DBS Group Holdings Ltd and its Subsidiaries 121 Consolidated Income Statement 122 Consolidated Statement of Comprehensive Income 123 Balance Sheets 124 Consolidated Statement of Changes
DBS GROUP HOLDINGS LTD (Incorporated in Singapore. Registration Number: M) AND ITS SUBSIDIARIES
 AND ITS SUBSIDIARIES") DBS GROUP HOLDINGS LTD (Incorporated in Singapore. Registration Number: 199901152M) AND ITS SUBSIDIARIES FINANCIAL STATEMENTS For the financial year ended 31 December 2014 Financial Statements Table of
DBS GROUP HOLDINGS LTD (Incorporated in Singapore. Registration Number: 199901152M) AND ITS SUBSIDIARIES FINANCIAL STATEMENTS For the financial year ended 31 December 2014 Financial Statements Table of
Financial statements. DBS Group Holdings Ltd and its Subsidiaries. DBS Bank Ltd
 126 DBS Annual Report 2017 Financial statements DBS Group Holdings Ltd and its Subsidiaries 127 Consolidated Income Statement 128 Consolidated Statement of Comprehensive Income 129 Balance Sheets 130 Consolidated
DBS GROUP HOLDINGS LTD (Incorporated in Singapore. Registration Number: M) AND ITS SUBSIDIARIES
 AND ITS SUBSIDIARIES") DBS GROUP HOLDINGS LTD (Incorporated in Singapore. Registration Number: 199901152M) AND ITS SUBSIDIARIES FINANCIAL STATEMENTS For the financial year ended 31 December 2013 Financial Statements Table of
DBS GROUP HOLDINGS LTD (Incorporated in Singapore. Registration Number: 199901152M) AND ITS SUBSIDIARIES FINANCIAL STATEMENTS For the financial year ended 31 December 2013 Financial Statements Table of
Financial Statements. DBS Group HolDinGS ltd and its SuBSiDiarieS. DBS Bank ltd
 FINANCIAL STATEMENTS 123 Financial Statements DBS Group HolDinGS ltd and its SuBSiDiarieS 124 Consolidated income Statement 125 Consolidated Statement of Comprehensive income 126 Balance Sheets 127 Consolidated
DBS BANK LTD (Incorporated in Singapore. Registration Number: E) AND ITS SUBSIDIARIES
 AND ITS SUBSIDIARIES") DBS BANK LTD (Incorporated in Singapore. Registration Number: 196800306E) AND ITS SUBSIDIARIES ANNUAL REPORT For the financial year ended 31 December 2011 Financial Statements Table of Contents Financial
DBS BANK LTD (Incorporated in Singapore. Registration Number: 196800306E) AND ITS SUBSIDIARIES ANNUAL REPORT For the financial year ended 31 December 2011 Financial Statements Table of Contents Financial
Notes to the Financial Statements
 85 Notes to the Financial Statements for the year ended 31 December 2010 These Notes are integral to the financial statements. The consolidated financial statements for the year ended 31 December 2010
Notes to the Financial Statements
 54 DBS Annual Report 2008 DBS GROUP HOLDINGS LTD & ITS SUBSIDIARIES These Notes are integral to the financial statements. The consolidated financial statements for the year ended 31 December 2008 were
In $ millions Note
 DBS BANK LTD AND ITS SUBSIDIARIES CONSOLIDATED INCOME STATEMENTS FOR THE YEAR ENDED 31 DECEMBER 2006 Group In $ millions Note 2006 2005 2006 2005 Income Interest income 7,809 5,542 5,324 3,774 Interest
Notes to the Accounts
 Notes to the Accounts 1. Accounting Policies Statement of compliance The Group financial statements consolidate those of the Company and its subsidiaries (together referred to as the Group ), equity account
FINANCIAL STATEMENTS. Income Statement for the year ended 30 September
 FINANCIAL STATEMENTS Income Statement for the year ended 30 September Note 1 1 Interest income 3 29,951 30,526 26,387 26,665 Interest expense 3 (14,856) (15,910) (15,622) (16,249) Net interest income 15,095
NOTES TO THE FINANCIAL STATEMENTS
 1: Significant Accounting Policies The financial statements of Australia and New Zealand Banking Group Limited (the Company) and its controlled entities (the Group) for the year ended 30 September 2015
Bank Muscat (SAOG) NOTES TO THE CONSOLIDATED FINANCIAL STATEMENTS YEAR ENDED 31 DECEMBER 2012
 NOTES TO THE CONSOLIDATED FINANCIAL STATEMENTS YEAR ENDED 31 DECEMBER 2012") YEAR ENDED 1 LEGAL STATUS AND PRINCIPAL ACTIVITIES Bank Muscat (SAOG) (the Bank or the Parent Company) is a joint stock company incorporated in the Sultanate of Oman and is engaged in commercial and investment
YEAR ENDED 1 LEGAL STATUS AND PRINCIPAL ACTIVITIES Bank Muscat (SAOG) (the Bank or the Parent Company) is a joint stock company incorporated in the Sultanate of Oman and is engaged in commercial and investment
ANZ Bank New Zealand Limited Annual Report and Registered Bank Disclosure Statement
 ANZ Bank New Zealand Limited Annual Report and Registered Bank Disclosure Statement FOR THE YEAR ENDED 30 SEPTEMBER 2015 NUMBER 79 ISSUED NOVEMBER 2015 ANZ Bank New Zealand Limited Annual Report and Registered
Orange Rules GUARANTY TRUST BANK PLC
 Orange Rules GUARANTY TRUST BANK PLC Contents Page Consolidated financial statements Consolidated statement of financial position 1 Consolidated statement of comprehensive income 2 Consolidated statement
Union Bank of Nigeria Plc
 Union of Nigeria Plc IFRS Consolidated Financial Statements IFRS Consolidated Financial Statements For the interim period ended 30 June 2012 UNION BANK OF NIGERIA PLC Consolidated and Separate Statements
Accounting policies. 1. Introduction. 2. Basis of presentation. 3. Consolidation
 2 202 FirstRand Group annual financial statements Accounting policies 1. Introduction FirstRand Limited ( the Group ) is an integrated financial services company consisting of banking, insurance and asset
PUBLIC JOINT STOCK COMPANY JOINT STOCK BANK UKRGASBANK Financial Statements. Year ended 31 December 2011 Together with Independent Auditors Report
 PUBLIC JOINT STOCK COMPANY JOINT STOCK BANK UKRGASBANK Financial Statements Year ended 31 December 2011 Together with Independent Auditors Report Contents Independent Auditors Report Statement of financial
Australia and New Zealand Banking Group Limited - ANZ New Zealand Registered Bank Disclosure Statement
 Australia and New Zealand Banking Group Limited - ANZ New Zealand Registered Bank Disclosure Statement FOR THE YEAR ENDED 30 SEPTEMBER 2015 NUMBER 28 ISSUED DECEMBER 2015 Australia and New Zealand Banking
ZAO Bank Credit Suisse (Moscow) Financial Statements for the year ended 31 December 2010
 Financial Statements for the year ended 31 December 2010") Financial Statements for the year ended 31 December 2010 Contents Independent Auditors Report... 3 Statement of Comprehensive Income... 4 Statement of Financial Position... 5 Statement of Cash Flows...
Financial Statements for the year ended 31 December 2010 Contents Independent Auditors Report... 3 Statement of Comprehensive Income... 4 Statement of Financial Position... 5 Statement of Cash Flows...
DBS Group Holdings Ltd & its Subsidiary Companies
 Consolidated Profit and Loss Account Year ended December 31 In $ millions Note 2004 2003 Interest income 4,011 3,640 Less: Interest expense 1,445 1,265 Net interest income 5 2,566 2,375 Fee and commission
ANZ BANK NEW ZEALAND LIMITED ANNUAL REPORT AND REGISTERED BANK DISCLOSURE STATEMENT
 ANZ BANK NEW ZEALAND LIMITED ANNUAL REPORT AND REGISTERED BANK DISCLOSURE STATEMENT FOR THE YEAR ENDED 30 SEPTEMBER 2017 NUMBER 87 ISSUED NOVEMBER 2017 ANZ Bank New Zealand Limited ANNUAL REPORT AND REGISTERED
auditor s opinion on the consolidated financial statements
 financial part auditor s opinion on the consolidated financial statements Independent Auditor s Report to the Shareholders of Československá obchodní banka, a. s. We have audited the accompanying consolidated
Intesa Sanpaolo Banka d.d. Bosna i Hercegovina
 Intesa Sanpaolo Banka d.d. Bosna i Hercegovina Financial Statements as at 2016 Intesa Sanpaolo Banka, d.d. Financial statements as at 2016 Contents Management Board s Report 2 Responsibilities of the Management
Union Bank of Nigeria Plc IFRS Consolidated Financial Statements For the year ended 31 December 2011
 Union Bank of Nigeria Plc IFRS Consolidated Financial Statements For the year ended 31 December 2011 Draft for Discussion purposes only Consolidated and Separate Statements of Financial Position Group
AUSTRALIA AND NEW ZEALAND BANKING GROUP LIMITED - ANZ NEW ZEALAND REGISTERED BANK DISCLOSURE STATEMENT
 AUSTRALIA AND NEW ZEALAND BANKING GROUP LIMITED - ANZ NEW ZEALAND REGISTERED BANK DISCLOSURE STATEMENT FOR THE YEAR ENDED 30 SEPTEMBER 2017 NUMBER 36 ISSUED NOVEMBER 2017 Australia and New Zealand Banking
BANK DHOFAR SAOG FINANCIAL STATEMENTS 31 DECEMBER Registered and principal place of business:
 FINANCIAL STATEMENTS 31 DECEMBER 2017 Registered and principal place of business: Bank Dhofar SAOG Central Business District P.O. Box 1507 Ruwi 112 Sultanate of Oman STATEMENT OF FINANCIAL POSITION 2017
CONSOLIDATED FINANCIAL STATEMENTS FOR THE YEAR ENDED 31 DECEMBER 2017
 CONSOLIDATED FINANCIAL STATEMENTS FOR THE YEAR ENDED 31 DECEMBER 2017 CONTENTS CONSOLIDATED FINANCIAL STATEMENTS Page(s) Independent auditor s report 1-5 Consolidated statement of financial position 6
Accounting policy
 Accounting policy 30.06.18 1. Principal activities ACBA-Credit Agricole Bank CJSC (the Bank ) is the parent company in the Group, which is comprised of the Bank and its subsidiary ACBA Leasing Credit Organization
AUDITORS REPORT. December 16, To the Shareholders of FirstCaribbean International Bank Limited
 Financial Statements 2005 December 16, 2005 AUDITORS REPORT To the Shareholders of FirstCaribbean International Bank Limited We have audited the accompanying consolidated balance sheet of FirstCaribbean
Unconsolidated statement of shareholders equity for the six months ended 30 June 2010 unaudited in BGN 000 Issued share capital.
 Unconsolidated statement of shareholders equity for the six months ended 30 June 2010 unaudited in BGN 000 Issued share capital Share premium Retained earnings Revaluation reserve Statutory reserve Total
JSC «AsiaСredit Bank (АзияКредит Банк)» Financial Statements for the year ended 31 December 2010
» Financial Statements for the year ended 31 December 2010") JSC «AsiaСredit Bank (АзияКредит Банк)» Financial Statements for the year ended 31 December Contents Independent Auditors Report Statement of Comprehensive Income 5 Statement of Financial Position 6 Statement
JSC «AsiaСredit Bank (АзияКредит Банк)» Financial Statements for the year ended 31 December Contents Independent Auditors Report Statement of Comprehensive Income 5 Statement of Financial Position 6 Statement
EUROSTANDARD Banka AD Skopje. Consolidated Financial Statements for the year ended 31 December 2007
 Consolidated Financial Statements for the year ended 31 December 2007 Contents Auditors' report Financial Statements Consolidated balance sheet 2 Consolidated income statement 3 Consolidated statement
 9 Income Statement Year ended Company Notes 2017 2016 2017 2016 $ 000 $ 000 $ 000 $ 000 Interest income 19 735,665 732,747 25,623 2,798 Interest expenses 19 (488,676) (481,991) ( 16,493) - Net interest
SMP Bank (OJSC) Consolidated Financial Statements for the year ended 31 December 2011
 Consolidated Financial Statements for the year ended 31 December 2011") Consolidated Financial Statements for the year ended 31 December 2011 Contents Independent Auditors Report... 3 Consolidated statement of comprehensive income... 4 Consolidated statement of financial position...
Consolidated Financial Statements for the year ended 31 December 2011 Contents Independent Auditors Report... 3 Consolidated statement of comprehensive income... 4 Consolidated statement of financial position...
Stanbic IBTC Bank PLC Unaudited interim group financial statements 31 March
 Stanbic IBTC PLC Unaudited interim group financial ch RC 125097 Table of contents Building for the future, with our range of products and services at the heart of our strategy Providing innovative solutions
Notes to the Consolidated Financial Statements
 (Amount in millions of Renminbi, unless otherwise stated) I GENERAL INFORMATION AND PRINCIPAL ACTIVITIES Bank of China Limited (the Bank ), formerly known as Bank of China, a State-owned joint stock commercial
Statement of profit or loss for the year ended 31 March 2018 (Expressed in United States dollars)
") Statement of profit or loss for the year ended 31 March 2018 (Expressed in United States dollars) Note Interest income 4(a) 32,407,110 29,988,115 Interest expense 4(b) (9,879,516) (7,319,963) Net interest
Statement of profit or loss for the year ended 31 March 2018 (Expressed in United States dollars) Note Interest income 4(a) 32,407,110 29,988,115 Interest expense 4(b) (9,879,516) (7,319,963) Net interest
UNITED BANK FOR AFRICA PLC. Consolidated and Separate Financial Statements for the 6 months ended 30 June 2013 (Un-audited)
") UNITED BANK FOR AFRICA PLC Consolidated and Separate Financial Statements for the 6 months ended 30 June 2013 (Un-audited) UNITED BANK FOR AFRICA PLC SIGNIFICANT ACCOUNTING POLICIES 1 Reporting entity
UNITED BANK FOR AFRICA PLC Consolidated and Separate Financial Statements for the 6 months ended 30 June 2013 (Un-audited) UNITED BANK FOR AFRICA PLC SIGNIFICANT ACCOUNTING POLICIES 1 Reporting entity
UNITED BANK FOR AFRICA PLC
 Consolidated Financial Statements for the three months ended 31 March 2015 NOTES TO THE FINANCIAL STATEMENTS UNITED BANK FOR AFRICA PLC SIGNIFICANT ACCOUNTING POLICIES 1 Reporting entity United Bank for
Consolidated Financial Statements HSBC Bank Bermuda Limited
 2011 Consolidated Financial Statements HSBC Bank Bermuda Limited Consolidated Financial Statements and Audit Report for the year ended 31 December 2011 Contents Page Independent Auditors Report... 1 Consolidated
Alpha Bank AD Skopje. Financial Statements for the year ended 31 December 2007
 for the year ended 31 December 2007 Contents Auditors' report Balance sheet 2 Income statement 3 Statement of changes in equity 4 Statement of cash flows 5 Notes to the financial statement 6 Balance sheet
Issued share capital. Share premium Retained earnings
 Unconsolidated statement of changes in equity for the three months ended 31 March 2011 unaudited Issued share capital Share premium Retained earnings Revaluation reserve Statutory reserve in BGN 000 Balance
Consolidated Financial Statements For the Year Ended 31 December 2017
 Consolidated Financial Statements For the Year Ended 31 December 2017 Consolidated Income Statement 2017 2016 Notes QR000 QR000 Interest Income 25 41,958,662 36,936,478 Interest Expense 26 (24,070,437)
Ameriabank cjsc. Financial Statements for the year ended 31 December 2012
 Financial Statements for the year ended 31 December Contents Independent Auditors Report... 3 Statement of comprehensive income... 4 Statement of financial position... 5 Statement of cash flows... 6 Statement
Ameriabank cjsc. Financial Statements For the second quarter of 2016
 Financial Statements For the second quarter of Contents Statement of profit or loss and other comprehensive income... 3 Statement of financial position... 4 Statement of cash flows... 5 Statement of changes
BANK DHOFAR SAOG FINANCIAL STATEMENTS 31 DECEMBER Registered and principal place of business:
 BANK DHOFAR SAOG FINANCIAL STATEMENTS 31 DECEMBER 2015 Registered and principal place of business: Bank Dhofar SAOG Central Business District P.O. Box 1507 Ruwi 112 Sultanate of Oman STATEMENT OF FINANCIAL
UNITED BANK FOR AFRICA PLC. Consolidated Financial Statements for the Quarter Ended 31 March 2014 (Un-audited )
") Consolidated Financial Statements for the Quarter Ended 31 March 2014 (Un-audited ) NOTES TO THE FINANCIAL STATEMENTS UNITED BANK FOR AFRICA PLC SIGNIFICANT ACCOUNTING POLICIES 1 (i) Basis of preparation
Consolidated Financial Statements for the Quarter Ended 31 March 2014 (Un-audited ) NOTES TO THE FINANCIAL STATEMENTS UNITED BANK FOR AFRICA PLC SIGNIFICANT ACCOUNTING POLICIES 1 (i) Basis of preparation
FIDELITY BANK PLC CONDENSED UNAUDITED FINANCIAL STATEMENTS FOR THE PERIOD ENDED
 FIDELITY BANK PLC CONDENSED UNAUDITED FINANCIAL STATEMENTS FOR THE PERIOD ENDED SEPTEMBER 30 2016 FIDELITY BANK PLC Table of contents for the period ended September 30 2016 CONTENTS Page Income Statement
NOTES TO THE FINANCIAL STATEMENTS
 1. Corporate information The Company is a public limited company, incorporated and domiciled in Malaysia, and is listed on the Main Market of Bursa Malaysia Securities Berhad. The registered office of
OMAN ARAB BANK SAOC. Report and financial statements for the year ended 31 December 2017
 OMAN ARAB BANK SAOC Report and financial statements for the year ended 31 December 2017 OMAN ARAB BANK SAOC Report and financial statements for the year ended 31 December 2017 Page Independent auditor
Open Joint Stock Company Raiffeisen Bank Aval Consolidated Financial Statements
 Open Joint Stock Company Raiffeisen Bank Aval Consolidated Financial Statements Year ended 31 December Together with Independent Auditors Report Consolidated Financial Statements CONTENTS INDEPENDENT AUDITORS
JSC VTB Bank (Georgia) Consolidated financial statements
 Consolidated financial statements") Consolidated financial statements For the year ended 31 December 2017 together with independent auditor s report 2017 consolidated financial statements Contents Independent auditor s report Consolidated
Consolidated financial statements For the year ended 31 December 2017 together with independent auditor s report 2017 consolidated financial statements Contents Independent auditor s report Consolidated
FInAnCIAl StAteMentS
 Financial STATEMENTS The University of Newcastle ABN 157 365 767 35 Contents 106 Income statement 107 Statement of comprehensive income 108 Statement of financial position 109 Statement of changes in equity
Notes to the Consolidated Financial Statements (Amount in millions of Renminbi, unless otherwise stated)
") (Amount in millions of Renminbi, unless otherwise stated) I GENERAL INFORMATION AND PRINCIPAL ACTIVITIES Bank of China Limited (the Bank ), formerly known as Bank of China, a State-owned joint stock commercial
(Amount in millions of Renminbi, unless otherwise stated) I GENERAL INFORMATION AND PRINCIPAL ACTIVITIES Bank of China Limited (the Bank ), formerly known as Bank of China, a State-owned joint stock commercial
UBA CAPITAL PLC. Un-audited results for half year ended 30 June 2014
 Un-audited results for half year ended 30 June 2014 Consolidated and Separate Statement of Comprehensive Income Half year ended 30 June 2014 Notes 30th June 2014 30th June 2013 Gross Earnings 2,258,102
PASHA YATIRIM BANKASI A.Ş. FINANCIAL STATEMENTS AS AT 31 DECEMBER 2017 TOGETHER WITH INDEPENDENT AUDITOR S REPORT
 FINANCIAL STATEMENTS AS AT 31 DECEMBER 2017 TOGETHER WITH INDEPENDENT AUDITOR S REPORT CONTENTS Independent auditors review report Statement of financial position... 1 Statement of income... 2 Statement
BANCA INTESA (CLOSED JOINT-STOCK COMPANY) Consolidated financial statements. Year ended 31 December 2013 Together with Auditors report
 Consolidated financial statements. Year ended 31 December 2013 Together with Auditors report") BANCA INTESA (CLOSED JOINT-STOCK COMPANY) Consolidated financial statements Year ended 31 December 2013 Together with Auditors report BANCA INTESA (CLOSED JOINT-STOCK COMPANY) 2013 Consolidated financial
BANCA INTESA (CLOSED JOINT-STOCK COMPANY) Consolidated financial statements Year ended 31 December 2013 Together with Auditors report BANCA INTESA (CLOSED JOINT-STOCK COMPANY) 2013 Consolidated financial
Commercial Bank J.P. Morgan Bank International (Limited Liability Company) International Financial Reporting Standards Financial Statements and
 International Financial Reporting Standards Financial Statements and") Commercial Bank J.P. Morgan Bank International (Limited Liability Company) International Financial Reporting Standards Financial Statements and Independent Auditor s Report 31 December 2014 CONTENTS INDEPENDENT
Commercial Bank J.P. Morgan Bank International (Limited Liability Company) International Financial Reporting Standards Financial Statements and Independent Auditor s Report 31 December 2014 CONTENTS INDEPENDENT
INDEPENDENT AUDITOR S REPORT
 INDEPENDENT AUDITOR S REPORT TO THE SHAREHOLDERS OF (Incorporated in the Cayman Islands with limited liability) We have audited the consolidated financial statements of Harmony Asset Limited (the Company
NOTES TO THE FINANCIAL STATEMENTS
 1 GENERAL INFORMATION Kerry Properties Limited (the Company ) is a limited liability company incorporated in Bermuda. The address of its registered office is Canon s Court, 22 Victoria Street, Hamilton
CONTENTS Consolidated Financial Statements INDEPENDENT AUDITORS REPORT
 2007 Consolidated Financial Statements CONTENTS INDEPENDENT AUDITORS REPORT Consolidated balance sheet...1 Consolidated income statement...2 Consolidated statement of changes in equity...3 Consolidated
Anelik Bank CJSC. Financial Statements for the year ended 31 December 2016
 Financial Statements for the year ended 31 December Contents Independent Auditors Report... 3 Statement of profit or loss and other comprehensive income... 7 Statement of financial position... 8 Statement
Arab Banking Corporation (B.S.C.) CONSOLIDATED FINANCIAL STATEMENTS
 CONSOLIDATED FINANCIAL STATEMENTS") CONSOLIDATED FINANCIAL STATEMENTS 31 DECEMBER 2014 CONSOLIDATED STATEMENT OF COMPREHENSIVE INCOME Year ended Note PROFIT FOR THE YEAR 318 297 Other comprehensive income: Other comprehensive income
CONSOLIDATED FINANCIAL STATEMENTS 31 DECEMBER 2014 CONSOLIDATED STATEMENT OF COMPREHENSIVE INCOME Year ended Note PROFIT FOR THE YEAR 318 297 Other comprehensive income: Other comprehensive income
UNITED BANK FOR AFRICA PLC
 UNITED BANK FOR AFRICA PLC Consolidated Financial Statements for the nine months ended 30 September 2015 UNITED BANK FOR AFRICA PLC NOTES TO THE FINANCIAL STATEMENTS UNITED BANK FOR AFRICA PLC SIGNIFICANT
Independent Auditor s report to the members of Standard Chartered PLC
 Financial statements and notes Independent Auditor s report to the members of Standard Chartered PLC For the year ended 31 December We have audited the financial statements of the Group (Standard Chartered
NOTES TO THE FINANCIAL STATEMENTS for the financial year ended 31 December 2009
 32 KLW HOLDINGS LIMITED ANNUAL REPORT 2009 1 GENERAL INFORMATION The financial statements of the Group and of the Company were authorised for issue in accordance with a resolution of the directors on the
Ahli Bank Q.S.C. CONSOLIDATED FINANCIAL STATEMENTS 31 DECEMBER 2017
 CONSOLIDATED FINANCIAL STATEMENTS 31 DECEMBER 2017 CONTENTS CONSOLIDATED FINANCIAL STATEMENTS Page(s) Independent auditors report -- Consolidated statement of financial position 1 Consolidated statement
Open Joint Stock Company Raiffeisen Bank Aval Consolidated Financial Statements
 Open Joint Stock Company Raiffeisen Bank Aval Consolidated Financial Statements For the year ended 31 December Together with Independent Auditors Report Consolidated Financial Statements CONTENTS INDEPENDENT
Universal Investment Bank AD Skopje. Financial Statements for the year ended 31 December 2007
 for the year ended 31 December 2007 Contents Auditors' report Balance sheet 1 Income statement 2 Statement of changes in equity 3 Statement of cash flows 4 Notes to the financial statement 5 Income
AGBANK OPEN JOINT-STOCK COMPANY
 AGBANK OPEN JOINT-STOCK COMPANY Financial Statements for the year ended 31 December Contents Independent Auditors Report... 3 Statement of profit or loss and other comprehensive income... 5 Statement of
BANKDHOFAR S.A.O.G. Report and financial statements. 31 December Registered and principal place of business:
 Report and financial statements 31 December 2012 Registered and principal place of business: BankDhofar S.A.O.G Central Business District P O Box 1507 Ruwi 112 Sultanate of Oman BANKDHOFAR SAOG Report
Total assets 214,589, ,246,479
 CONSOLIDATED STATEMENT OF FINANCIAL POSITION As at December 31, and Notes ASSETS Cash and balances with SAMA 4 25,315,736 20,928,549 Due from banks and other financial institutions 5 3,914,504 4,438,656
Nordea Bank Polska S.A. Annual Report 2011
 Nordea Bank Polska S.A. Annual Report 2011 This document is a free translation of the Polish original. Terminology current in Anglo-Saxon countries has been used where practicable for the purposes of this
Ameriabank CJSC Financial statements
 Ameriabank CJSC Financial statements for the year ended 31 December together with independent auditor s report Ameriabank CJSC Financial statements Contents Independent auditor s report Statement of comprehensive
CREDIT BANK OF MOSCOW (open joint-stock company) Consolidated Financial Statements for the year ended 31 December 2010
 Consolidated Financial Statements for the year ended 31 December 2010") CREDIT BANK OF MOSCOW (open joint-stock company) Consolidated Financial Statements Contents Independent Auditor s Report... 3 Consolidated Statement of Comprehensive Income... 4 Consolidated Statement
CREDIT BANK OF MOSCOW (open joint-stock company) Consolidated Financial Statements Contents Independent Auditor s Report... 3 Consolidated Statement of Comprehensive Income... 4 Consolidated Statement
 1 General Banque Saudi Fransi (BSF the Bank) is a Saudi Joint Stock Company established by Royal Decree No. M/23 dated Jumada Al Thani 17, 1397H (corresponding to June 4, 1977). The Bank formally commenced
VOLKSBANK CZ, a.s. FOR THE YEAR ENDED 31 DECEMBER 2006
 VOLKSBANK CZ, a.s. REPORT OF INDEPENDENT AUDITORS AND FINANCIAL STATEMENTS (Prepared in accordance with International Financial Reporting Standards as adopted by the European Union) FOR THE YEAR ENDED
VTB Bank (Armenia) cjsc. Financial Statements For the year ended 31 December 2008
 cjsc. Financial Statements For the year ended 31 December 2008") Financial Statements For the year ended 31 December Contents Independent Auditors Report...3 Income Statement...4 Balance Sheet...5 Statement of Cash Flows...6 Statement of Changes in Shareholders Equity...7
Financial Statements For the year ended 31 December Contents Independent Auditors Report...3 Income Statement...4 Balance Sheet...5 Statement of Cash Flows...6 Statement of Changes in Shareholders Equity...7
Union Bank of Nigeria Plc
 Consolidated Interim Financial Statements For the period ended 31 March 2013 Table of Contents Consolidated financial statements Page Consolidated financial statements: Consolidated statement of financial
Financial statements. The University of Newcastle newcastle.edu.au F1
 Financial statements The University of Newcastle newcastle.edu.au F1 Income statement For the year ended 31 December Consolidated Parent Revenue from continuing operations Australian Government financial
Financial statements. The University of Newcastle. newcastle.edu.au F1. 52 The University of Newcastle, Australia
 Financial statements The University of Newcastle 52 The University of Newcastle, Australia newcastle.edu.au F1 Contents Income statement................. 54 Statement of comprehensive income..... 55 Statement
May & Baker Nig Plc RC. UNAUDITED CONSOLIDATED FINANCIAL STATEMENTS 31 MARCH 2017
 ` May & Baker Nig Plc RC. 558 UNAUDITED CONSOLIDATED FINANCIAL STATEMENTS 31 MARCH 2017 UNAUDITED CONSOLIDATED STATEMENT OF PROFIT OR LOSS AND OTHER COMPREHENSIVE INCOME Note Continuing operations Revenue
Bankpozitif Kredi ve Kalkınma Bankası Anonim Şirketi
 Bankpozitif Kredi ve Kalkınma Bankası Anonim Şirketi TABLE OF CONTENTS Page ------ Independent auditors report on review of condensed consolidated interim financial information Condensed consolidated interim
HSBC BANK BERMUDA LIMITED Consolidated Financial Statements
 Consolidated Financial Statements 2012 Consolidated Financial Statements and Audit Report for the year ended 31 December 2012 THIS PAGE IS INTENTIONALLY LEFT BLANK Consolidated Financial Statements and
Notes to the Financial Statements
 These notes form an integral part of and should be read in conjunction with the financial statements. 1. GENERAL INFORMATION The Company is incorporated and domiciled in Singapore. The address of its registered
ING Bank (Eurasia) ZAO Financial Statements
 ZAO Financial Statements") Financial Statements Year ended 31 December 2008 Together with Independent Auditors Report CONTENTS INDEPENDENT AUDITORS REPORT Balance sheet... 1 Income statement... 2 Statement of changes in equity...
Financial Statements Year ended 31 December 2008 Together with Independent Auditors Report CONTENTS INDEPENDENT AUDITORS REPORT Balance sheet... 1 Income statement... 2 Statement of changes in equity...
Consolidated Interim Financial Statements
 M K B B a n k Z r t. G r o u p 10 011 922 641 911 400 statistic code Consolidated Interim Financial Statements Prepared under International Financial Reporting Standards as adopted by the EU Budapest,
Australia and New Zealand Banking Group Limited - New Zealand Branch Disclosure Statement
 Australia and New Zealand Banking Group Limited - New Zealand Branch Disclosure Statement FOR THE YEAR ENDED 30 SEPTEMBER 2012 NUMBER 16 ISSUED NOVEMBER 2012 Australia and New Zealand Banking Group Limited
Consolidated Financial Statements For the Year Ended 31 December 2018
 Consolidated Financial Statements For the Year Ended 31 December 2018 Consolidated Income Statement 2018 2017 Notes QR000 QR000 Interest Income 25 50,744,709 41,958,662 Interest Expense 26 (31,711,804)
Australia and New Zealand Banking Group Limited - New Zealand Branch Registered Bank Disclosure Statement
 Australia and New Zealand Banking Group Limited - New Zealand Branch Registered Bank Disclosure Statement FOR THE YEAR ENDED 30 SEPTEMBER 2014 NUMBER 24 ISSUED DECEMBER 2014 Australia and New Zealand Banking
1 st National Bank St. Lucia Limited (formerly St. Lucia Co-operative Bank Limited)
") 1 st National Bank St. Lucia Limited (formerly St. Lucia Co-operative Bank Limited) Financial Statements March 29, 2005 Auditors Report To the Shareholders of We have audited the accompanying balance sheet
1 st National Bank St. Lucia Limited (formerly St. Lucia Co-operative Bank Limited) Financial Statements March 29, 2005 Auditors Report To the Shareholders of We have audited the accompanying balance sheet
Notes to the Consolidated Financial Statements (Amount in millions of Renminbi, unless otherwise stated)
") Notes to the Consolidated Financial Statements (Amount in millions of Renminbi, unless otherwise stated) I GENERAL INFORMATION AND PRINCIPAL ACTIVITIES Bank of China Limited (the Bank ), formerly known
Notes to the Consolidated Financial Statements (Amount in millions of Renminbi, unless otherwise stated) I GENERAL INFORMATION AND PRINCIPAL ACTIVITIES Bank of China Limited (the Bank ), formerly known
National Investment Corporation of the National Bank of Kazakhstan JSC. Financial Statements for the year ended 31 December 2016
 National Investment Corporation of the National Bank of Kazakhstan JSC Financial Statements for the year ended 31 December 2016 Contents Independent Auditors Report Statement of Profit or Loss and Other
Ardshinbank CJSC. Consolidated Financial Statements for the year ended 31 December 2016
 Consolidated Financial Statements for the year ended 31 December 2016 Contents Independent Auditors Report... 3 Consolidated statement of profit or loss and other comprehensive income... 8 Consolidated
Artsakhbank cjsc. Financial Statements for the year ended 31 December 2013
 Financial Statements for the year ended 31 December Artslllcllbllllk cjsc Stateml!nt ofprofit or Loss Clnd Other Comprehensive income for the year ended 31 December 20 13 Notes AMD'OOO AMD'OOO Interest
DIAMOND BANK PLC CONSOLIDATED FINANCIAL STATEMENT FOR THE QUARTER ENDED 31 MARCH 2013
 DIAMOND BANK PLC CONSOLIDATED FINANCIAL STATEMENT FOR THE QUARTER ENDED 31 MARCH 2013 1. General information Diamond Bank Plc (the "Bank") was incorporated in Nigeria as a private limited liability company
Significant Accounting Policies
 108 Significant Accounting Policies For the year ended 31 December 2013 These financial statements have been prepared on the historical cost basis except for certain properties and financial instruments,
Frontier Digital Ventures Limited
 Frontier Digital Ventures Limited Significant accounting policies This note provides a list of the significant accounting policies adopted in the preparation of these consolidated financial statements
Anelik Bank CJSC. Financial Statements for the year ended 31 December 2017
 Financial Statements for the year ended 31 December Contents Independent Auditors Report... 3 Statement of profit or loss and other comprehensive income... 8 Statement of financial position... 9 Statement