PUBLIC JOINT STOCK COMPANY JOINT STOCK BANK UKRGASBANK Financial Statements. Year ended 31 December 2011 Together with Independent Auditors Report
|
|
|
- Milton Stevens
- 5 years ago
- Views:
Transcription
1 PUBLIC JOINT STOCK COMPANY JOINT STOCK BANK UKRGASBANK Financial Statements Year ended 31 December 2011 Together with Independent Auditors Report
2 Contents Independent Auditors Report Statement of financial position... 1 Statement of comprehensive income... 2 Statement of changes in equity... 3 Statement of cash flows... 4 Notes to financial statements 1. Background Basis of preparation Significant accounting policies Significant accounting judgements and estimates Segment information Cash and cash equivalents Amounts due from credit institutions Derivative financial instruments Loans to customers Investment securities available-for-sale Investment property Property, equipment and intangible assets Taxation Other impairment and provisions Other assets and liabilities Amounts due to the National Bank of Ukraine Amounts due to credit institutions Amounts due to customers Debt securities issued Subordinated debt Equity Commitments and contingencies Net fee and commission income Net losses from investment securities available-for-sale Loss on initial recognition of investment securities available-for sale Other income Personnel and other operating expenses Risk management Fair values of financial instruments Maturity analysis of assets and liabilities Related party disclosures Capital adequacy Subsequent events... 41

3
4

5
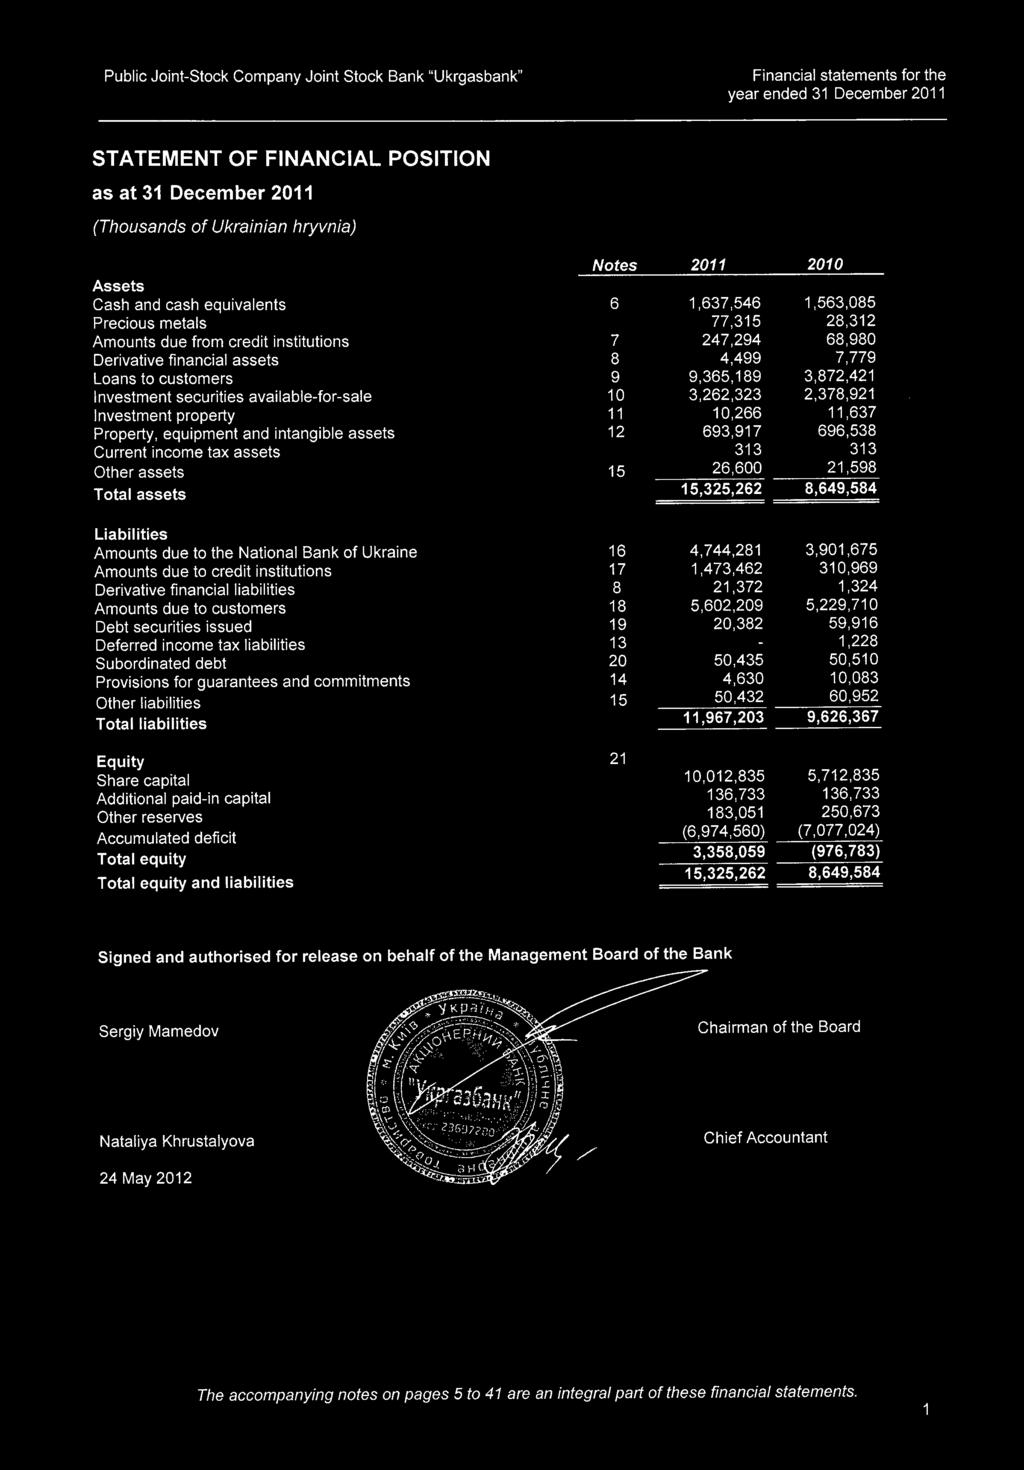
6 STATEMENT OF COMPREHENSIVE INCOME for the (Thousands of Ukrainian hryvnia) Notes Interest income Loans to customers 1,174, ,174 Amounts due from credit institutions 22,649 51,674 Investment securities available-for-sale 370, ,336 1,567,703 1,324,184 Interest expense Amounts due to the National Bank of Ukraine (343,276) (366,421) Amounts due to customers (525,887) (648,022) Amounts due to credit institutions (58,498) (15,050) Debt securities issued (6,827) (15,382) Subordinated debt (5,926) (6,000) (940,414) (1,050,875) Net interest income 627, ,309 Allowance for loan impairment and amounts due to credit institutions 7, 9 (73,115) (1,013,999) Net interest income after allowance for loan impairment 554,174 (740,690) Net fee and commission income ,339 84,851 Net losses from investment securities available-for-sale 24 (47,831) (43,519) Loss on initial recognition of investment securities availablefor-sale 25 (1,845) (130,377) Net gains/(losses) from foreign currencies: - dealing 87,813 18,483 - translation differences (12,989) (2,123) Net gains/(losses) from investment property 68 (109) Other income 26 20,943 6,819 Non-interest expense 147,498 (65,975) Personnel expenses 27 (320,742) (312,465) Other operating expenses 27 (172,712) (185,046) Depreciation and amortization 12 (52,868) (54,729) Other impairment and provisions 14,15 (33,768) (27,152) Non-interest expense (580,090) (579,392) Profit (loss) before income tax 121,582 (1,386,057) Income tax expense / (benefit) 13 (19,118) 7,208 Net profit (loss) 102,464 (1,378,849) Other comprehensive income: Unrealised gains on investment securities available-for-sale 21 (100,090) 14,857 Realised losses on investment securities available-for-sale reclassified to profit and loss 21 (5,689) (2,090) Revaluation of buildings 21 17,811 - Income tax relating to components of other comprehensive 13 income 20,346 44,954 Other comprehensive income for the year (67,622) 57,721 Total comprehensive loss for the year 34,842 (1,321,128) Weighted average number of shares (in thousands) 7,561,370 5,517,808 Basic and diluted loss per share (0.00) (0.24) 2
7 STATEMENT OF CHANGES IN EQUITY for the (Thousands of Ukrainian hryvnia) Share capital Additional paid-in capital Other reserves Accumulated deficit Total equity 31 December ,363, , ,964 (5,698,187) 344,355 Total comprehensive loss for the year ,721 (1,378,849) (1,321,128) Transfer to retained earnings - - (12) 12 - Issue of share capital (Note 21) 349,796 (349,806) - - (10) 31 December ,712, , ,673 (7,077,024) (976,783) Total comprehensive income for the year - - (67,622) 102,464 34,842 Issue of share capital (Note 21) 4,300, ,300, December ,012, , ,051 (6,974,560) 3,358,059 3
8 STATEMENT OF CASH FLOWS for the (Thousands of Ukrainian hryvnia) Notes Cash flows from operating activities Interest received 1,242, ,166 Interest paid (1,007,730) (1,097,215) Fees and commissions received 124, ,611 Fees and commissions paid (23,175) (20,223) Receipts from dealing in foreign currencies 111,141 16,674 Other income received 7,812 6,819 Personnel expenses paid (315,360) (307,645) Other operating expenses paid (171,718) (158,682) Cash flows used in operating activities before changes in operating assets and liabilities (32,355) (551,495) Net (increase)/decrease in operating assets Precious metals (48,847) (3,815) Amounts due from credit institutions (167,174) 31,108 Loans to customers (5,425,971) 220,465 Other assets (44,956) (36,221) Net increase /(decrease) in operating liabilities Amounts due to credit institutions 1,271,402 (132,772) Amounts due to customers 394,288 1,210,785 Other liabilities (16,290) (6,048) Net cash flows from (used in) operating activities before income tax (4,069,903) 732,007 Income tax paid - - Net cash from (used in) operating activities (4,069,903) 732,007 Cash flows from investing activities Purchase of investment securities (25,611,682) (23,207,010) Proceeds from sale and redemption of investment securities 29,029,529 21,740,250 Purchase of property and equipment (19,101) (29,380) Proceeds from sale of property and equipment 999 1,163 Net cash used in investing activities 3,399,745 (1,494,977) Cash flows from financing activities Proceeds from borrowings from credit institutions (111,294) (105,826) Repayment of borrowings from credit institutions - - Proceeds from borrowings from the National bank of Ukraine 899,999 - Proceeds from issue of share capital Proceeds from bonds issued 10,737 6,508 Redemption of bonds issued (50,066) (63,023) Net cash from (used in) financing activities 749,376 (162,341) Effect of exchange rates changes on cash and cash equivalents (4,757) (3,055) Net decrease/(increase) in cash and cash equivalents 74,461 (928,366) Cash and cash equivalents, beginning 1,563,085 2,491,451 Cash and cash equivalents, ending 6 1,637,546 1,563,085 Non-cash financing activities: - - Issue of share capital/ Purchase of investment securities (Note 21) 4,300,000-4
9 1. Background Organisation and operations The (the Bank) was established on 22 August 1995 as a closed joint stock company under the National Bank of Ukraine (the NBU) license #183 from the former Closed Joint Stock Company Joint Stock Bank Hadjibei, which later was renamed to Intergazbank. On 27 May 1997 the Bank changed its name from Intergazbank to Ukrgasbank. Subsequently, on 10 October 1997, Ukrgasbank was reregistered by the NBU as an open joint stock company joint stock bank. In September 2009, the Bank changed its name from Open Joint Stock Company Joint Stock Bank Ukrgasbank to Public Joint Stock Company Joint Stock Bank Ukrgasbank according to the requirements of Ukrainian legislation and the decision of the general meeting of shareholders dated 29 May The Bank accepts deposits from the public and extends loans, transfers payments in Ukraine and abroad, exchanges currencies and provides other banking services to its commercial and retail customers. Its main office is in Kyiv and it has 1 branch and 277operating outlets ( branches and 268 operating outlets) in different regions of Ukraine. The Bank s main office address is 39, Velyka Vasilkivska St., Kyiv, Ukraine. The Bank s registered legal address is 1, Yerevanska St., Kyiv, Ukraine. As at 31 December, the structure of the Bank s shareholders was as follows: Shareholder 2011 % 2010 % The Ministry of Finance of Ukraine Financial Investment Alliance LLC Company Ukrgasinvest plus LLC Investanalityk LLC Ukrainian company of projects development LLC Ukrainian venture capital LLC Other Total Ukrainian business environment Ukraine is experiencing political and economic change that has affected, and may continue to affect, the activities of enterprises operating in this environment. In addition, the contraction in the capital and credit markets and its impact on the economy of Ukraine have further increased the level of economic uncertainty in the environment. These financial statements reflect management s current assessment of the impact of the Ukrainian business environment on the operations and the financial position of the Bank. The future business environment may differ from management s assessment. 2. Basis of preparation Statement of compliance These financial statements are prepared in accordance with International Financial Reporting Standards (IFRS). Basis of measurement These financial statements are prepared on the historical cost basis except that derivative financial instruments, available-for-sale financial assets and investment property are stated at fair value, and buildings are stated at revalued amounts. Functional and presentation currency The national currency of Ukraine is the Ukrainian hryvnia (UAH). Consequently, the functional and presentation currency for the purposes of these financial statements is the Ukrainian hryvnia. 3. Significant accounting policies The accounting policies set out below are applied consistently to all periods presented in these financial statements. Foreign currency translation Transactions in foreign currencies are initially recognised in the Bank s functional currency at the exchange rate at the date of the transaction. Monetary assets and liabilities denominated in foreign currencies at the reporting date are translated to the functional currency at the exchange rate at that date. The foreign currency gain or loss is recognised in the statement of comprehensive income as net result from foreign currency transactions. Non-monetary assets and 5
10 liabilities denominated in foreign currencies that are measured at fair value are translated into hryvnias at the exchange rate at the date that the fair value is determined. Non-monetary items that are measured in terms of historical cost in a foreign currency are translated using the exchange rate at the date of the transaction. The differences between a contractual exchange rate on a specific transaction in a foreign currency and the official rate of the National Bank of Ukraine ruling at the date of such transaction are also included in the result of dealing in foreign currencies. The official UAH exchange rates of the National Bank of Ukraine used in the preparation of these financial statements are as follows: Currency US dollar EUR As at the date of these financial statements are authorised for issue, 24 May 2012, the NBU exchange rate is UAH to USD 1.00 and UAH to EUR Financial assets Initial recognition Financial assets in the scope of IAS 39 Financial Instruments: Recognition and Measurement are classified as either financial assets at fair value through profit or loss, loans and receivables, held-to-maturity investments, or available-forsale financial assets, as appropriate. When financial assets are recognised initially, they are measured at fair value, plus, in the case of investments not at fair value through profit or loss, directly attributable transaction costs. The Bank determines the classification of its financial assets upon initial recognition, and subsequently can reclassify financial assets in certain cases as described below. Date of recognition All regular way purchases and sales of financial assets are recognised on the trade date i.e., the date that the Bank commits to purchase the asset. Regular way purchases or sales are purchases or sales of financial assets that require delivery of assets within the period generally established by regulation or convention in the marketplace. Financial assets at fair value through profit or loss Financial assets classified as held for trading and those designated at fair value through profit or loss at inception are included in the category investment securities designated at fair value through profit or loss. Financial assets are classified as held for trading if they are acquired for the purpose of selling in the near term. Gains or losses on financial assets at fair value through profit or loss are recognised in profit and loss. The Bank may designate financial assets and liabilities at fair value through profit or loss where either the assets or liabilities are managed and evaluated on a fair value basis, the designation eliminates or significantly reduces an accounting mismatch which would otherwise arise or, the asset or liability contains an embedded derivative that significantly modifies the cash flows that would otherwise be required under the contract. Financial assets at fair value through profit and loss and derivative financial instruments are not reclassified subsequent to initial recognition. Loans and receivables Loans and receivables are non-derivative financial assets with fixed or determinable payments that are not quoted in an active market. They are not entered into with the intention of immediate or short-term resale and are not classified as trading securities or designated as investment securities available-for-sale. Such assets are carried at amortised cost using the effective interest method. Gains and losses are recognised in profit and loss when the loans and receivables are derecognised or impaired, as well as through the amortisation process. Available-for-sale financial assets Available-for-sale financial assets are those non-derivative financial assets that are designated as available-for-sale or are not classified as financial assets at fair value through profit or loss, held-to-maturity financial assets or loans and receivables. After initial recognition available-for sale financial assets are measured at fair value with gains or losses being recognised in other comprehensive income until the investment is derecognised or until the investment is determined to be impaired at which time the cumulative gain or loss previously reported in other comprehensive income is reclassified to profit and loss. Interest calculated using the effective interest method is recognised in profit and loss. Measurement Subsequent to initial recognition, financial assets, including derivatives that are assets, are measured at their fair values, without any deduction for transaction costs that may be incurred on sale or other disposal, except for: 6
11 loans and receivables which are measured at amortized cost using the effective interest method or held-to-maturity investments that are measured at amortized cost using the effective interest method or investments in equity instruments that do not have a quoted market price in an active market and whose fair value can not be reliably measured which are measured at cost. All financial liabilities, other than those designated at fair value through profit or loss and financial liabilities that arise when a transfer of a financial asset carried at fair value does not qualify for derecognition, are measured at amortized cost. The amortised cost of a financial asset or liability is the amount at which the financial asset or liability is measured at initial recognition, minus principal repayments, plus or minus the cumulative amortisation using the effective interest method of any difference between the initial amount recognised and the maturity amount, minus any reduction for impairment. Premiums and discounts, including initial transaction costs, are included in the carrying amount of the related instrument and amortized based on the effective interest rate of the instrument. Gains and losses on subsequent measurement A gain or loss arising from a change in the fair value of a financial asset or liability is recognized as follows: a gain or loss on a financial instrument classified as at fair value through profit or loss is recognized in profit or loss a gain or loss on an available-for-sale financial asset is recognized as other comprehensive income in equity (except for impairment losses and foreign exchange gains and losses on debt financial instruments available-forsale) until the asset is derecognized, at which time the cumulative gain or loss previously recognised in equity is recognized in profit or loss. Interest in relation to an available-for-sale financial asset is recognized in profit or loss using the effective interest method. For financial assets and liabilities carried at amortized cost, a gain or loss is recognized in profit or loss when the financial asset or liability is derecognized or impaired, and through the amortization process. Determination of fair value The fair value for financial instruments traded in active market at the reporting date is based on their quoted market price or dealer price quotations (bid price for long positions and ask price for short positions), without any deduction for transaction costs. For all other financial instruments not listed in an active market, the fair value is determined by using appropriate valuation techniques with a maximum use of market inputs. Valuation techniques include net present value techniques, comparison to similar instruments for which market observable prices exist, options pricing models and other relevant valuation models. Offsetting Financial assets and liabilities are offset and the net amount is reported in the statement of financial position when there is a legally enforceable right to set off the recognised amounts and there is an intention to settle on a net basis, or to realise the asset and settle the liability simultaneously. Reclassification of financial assets A financial asset classified as available-for-sale that would have met the definition of loans and receivables may be reclassified to the loans and receivables category if the Bank has the intention and ability to hold it for the foreseeable future or until maturity. Cash and cash equivalents Cash and cash equivalents include cash on hand, unrestricted balances with the NBU, amounts due from credit institutions that mature within ninety days of the date of origination and that are free from contractual encumbrances, and highly liquid financial assets with original maturities of less than three months, which are subject to insignificant risk of changes in their fair value, and are used to manage short-term commitments. The mandatory reserve deposit with the NBU is not considered to be a cash equivalent due to restrictions on its withdrawability. Precious metals Precious metals are stated at the lower of net realizable value or cost. The net realizable value of precious metals is estimated based on quoted market prices. The cost of precious metals is assigned using the first-in, first-out cost formula. Repurchase and reverse repurchase agreements and securities lending Sale and repurchase agreements are treated as secured financing transactions. Securities sold under sale and repurchase agreements are retained in the statement of financial position and, in case the transferee has the right by 7
12 contract or custom to sell or repledge them, reclassified as securities pledged under sale and repurchase agreements. The corresponding liability is presented within amounts due to credit institutions or customers. Securities purchased under agreements to resell (reverse repurchase agreements) are recorded as amounts due from credit institutions or loans to customers as appropriate. The difference between sale and repurchase price is treated as interest and accrued over the life of repo agreements using the effective yield method. Securities lent to counterparties are retained in the financial statements. Securities borrowed are not recorded in the financial statements, unless these are sold to third parties, in which case the purchase and sale are recorded within gains less losses from trading securities in profit and loss. The obligation to return them is recorded at fair value as a trading liability. Derivative financial instruments In the normal course of business, the Bank enters into various derivative financial instruments including forwards and swaps in the foreign exchange market primarily with Ukrainian Banks. Derivatives are initially recognised at fair value on the date on which a derivative contract is entered into and are subsequently remeasured at fair value. All derivatives are carried as assets when their fair value is positive and as liabilities when their fair value is negative. Changes in the fair value of derivatives are recognised immediately in profit or loss. Although the Bank trades in derivative instruments for risk hedging purposes, these instruments do not qualify for hedge accounting. Borrowings Issued financial instruments or their components are classified as liabilities, where the substance of the contractual arrangement results in the Bank having an obligation either to deliver cash or another financial asset to the holder, or to satisfy the obligation other than by the exchange of a fixed amount of cash or another financial asset for a fixed number of own equity instruments. Such instruments include amounts due to the National Bank of Ukraine, amounts due to credit institutions, amounts due to customers, debt securities issued and subordinated debt. After initial recognition, borrowings are subsequently measured at amortised cost using the effective interest method. Gains and losses are recognised in profit and loss when the borrowings are derecognised as well as through the amortisation process. If the Bank purchases its own debt, it is removed from the statement of financial position and the difference between the carrying amount of the liability and the consideration paid is recognised in profit and loss. Leases i. Operating Bank as lessee Leases of assets under which the risks and rewards of ownership are effectively retained by the lessor are classified as operating leases. Lease payments under an operating lease are recognised as expenses on a straight-line basis over the lease term and included into other operating expenses. ii. Operating Bank as lessor The Bank presents assets subject to operating leases in the statement of financial position according to the nature of the asset. Lease income from operating leases is recognised in profit and loss on a straight-line basis over the lease term as either net gains/losses from investment property for buildings and premises or other income. The aggregate cost of incentives provided to lessees is recognised as a reduction of rental income over the lease term on a straightline basis. Initial direct costs incurred specifically to earn revenues from an operating lease are added to the carrying amount of the leased asset. Impairment of financial assets The Bank assesses at each reporting date whether there is any objective evidence that a financial asset or a group of financial assets is impaired. A financial asset or a group of financial assets is deemed to be impaired if, and only if, there is objective evidence of impairment as a result of one or more events that has occurred after the initial recognition of the asset (an incurred loss event ) and that loss event (or events) has an impact on the estimated future cash flows of the financial asset or the group of financial assets that can be reliably estimated. Evidence of impairment may include indications that the borrower or a group of borrowers is experiencing significant financial difficulty, default or delinquency in interest or principal payments, the probability that they will enter bankruptcy or other financial reorganisation and where observable data indicate that there is a measurable decrease in the estimated future cash flows, such as changes in arrears or economic conditions that correlate with defaults. 8
13 Amounts due from credit institutions and loans to customers For amounts due from credit institutions and loans to customers carried at amortised cost, the Bank first assesses individually whether objective evidence of impairment exists individually for financial assets that are individually significant, or collectively for financial assets that are not individually significant. If the Bank determines that no objective evidence of impairment exists for an individually assessed financial asset, whether significant or not, it includes the asset in a group of financial assets with similar credit risks characteristics and collectively assesses them for impairment. Assets that are individually assessed for impairment and for which an impairment loss is, or continues to be, recognised are not included in a collective assessment of impairment. If there is objective evidence that an impairment loss has been incurred, the amount of the loss is measured as the difference between the assets carrying amount and the present value of estimated future cash flows (excluding future expected credit losses that have not yet been incurred). The carrying amount of the asset is reduced through the use of an allowance account and the amount of the loss is recognised in profit and loss. Interest income continues to be accrued on the reduced carrying amount based on the rate of interest used to discount the future cash flows for the purpose of measuring the impairment loss. Loans together with the associated allowance are written off when there is no realistic prospect of future recovery and all collateral has been realised or has been transferred to the Bank. If, in a subsequent year, the amount of the estimated impairment loss increases or decreases because of an event occurring after the impairment was recognised, the previously recognised impairment loss is increased or reduced by adjusting the allowance account. If a future write-off is later recovered, the recovery is credited to the allowance account. The present value of the estimated future cash flows is discounted at the financial asset s original effective interest rate. If a loan has a variable interest rate, the discount rate for measuring any impairment loss is the current effective interest rate. The calculation of the present value of the estimated future cash flows of a collateralised financial asset reflects the cash flows that may result from foreclosure less costs for obtaining and selling the collateral, whether or not foreclosure is probable. For the purpose of a collective evaluation of impairment, financial assets are grouped on the basis of the Bank s internal credit grading system that considers credit risk characteristics such as asset type, industry, geographical location, collateral type, past-due status and other relevant factors. Future cash flows on a group of financial assets that are collectively evaluated for impairment are estimated on the basis of historical loss experience for assets with credit risk characteristics similar to those in the group. Historical loss experience is adjusted on the basis of current observable data to reflect the effects of current conditions that did not affect the years on which the historical loss experience is based and to remove the effects of conditions in the historical period that do not exist currently. Estimates of changes in future cash flows reflect, and are directionally consistent with, changes in related observable data from year to year (such as changes in unemployment rates, property prices, commodity prices, payment status, or other factors that are indicative of incurred losses in the group or their magnitude). The methodology and assumptions used for estimating future cash flows are reviewed regularly to reduce any differences between loss estimates and actual loss experience. Loans to customers The main considerations for the loan impairment assessment include whether any payments of principal or interest are overdue or there are any known difficulties in the cash flows of counterparties, credit rating downgrades, or infringement of the original terms of the contract. The Bank addresses impairment assessment in two areas: individually assessed allowances and collectively assessed allowances. i. Individually assessed allowances The Bank determines the allowances appropriate for each individually significant loan on an individual basis. Items considered when determining allowance amounts include the sustainability of the counterparty s business plan, its ability to improve performance once a financial difficulty has arisen, projected receipts, the availability of other financial support and the realisable value of collateral, and the timing of the expected cash flows and other factors. The impairment losses are evaluated at each reporting date. ii. Collectively assessed allowances Allowances are assessed collectively for losses on loans to customers that are not individually significant and for individually significant loans where there is not yet objective evidence of individual impairment. Allowances are evaluated on each reporting date with each portfolio receiving a separate review. The collective assessment takes account of impairment that is likely to be present in the portfolio even though there is no yet objective evidence of the impairment in an individual assessment. Impairment losses are estimated by taking into consideration the following information: historical losses on the portfolio, current economic conditions, the appropriate delay between the time a loss is likely to have been uncured and the time it will be identified as requiring an individually assessed impairment allowance, and expected receipts and recoveries once impaired. Financial guarantees and letters of credit are assessed and provision made in a similar manner as for loans. 9
14 Renegotiated loans Where possible, the Bank seeks to restructure loans rather than to take possession of collateral. This may involve extending the payment arrangements and the agreement of new loan conditions. The accounting treatment of such restructuring is as follows: if the currency of the loan has changed the old loan is derecognised and the new loan is recognised if the loan restructuring is not caused by the financial difficulties of the borrower but the cash flows are renegotiated on favourable terms for the borrower the loan is not recognised as impaired. The loan is not derecognised and a new effective interest rate is determined based on the remaining cash flows under the loan agreement till maturity if the loan is impaired after restructuring, the Bank uses the original effective interest rate in respect of new cash flows to estimate the recoverable amount of the loan. The difference between the recalculated present value of the new cash flows taking into account collateral and the carrying amount before restructuring is included in the provision charges for the period. Once the terms have been renegotiated, the loan is no longer considered past due. Management continuously reviews renegotiated loans to ensure that all criteria are met and that future payments are likely to occur. The loans continue to be subject to an individual or collective impairment assessment, calculated using the loan s original or current effective interest rate. Available-for-sale investment securities For available-for-sale investment securities, the Bank assesses at each reporting date whether there is objective evidence that an investment or a group of investments is impaired. In the case of equity investments classified as available-for-sale, objective evidence would include a significant or prolonged decline in the fair value of the investment below its cost. Where there is evidence of impairment, the cumulative loss measured as the difference between the acquisition cost and the current fair value, less any impairment loss on that investment previously recognised in the profit and loss is removed from equity and recognised in the profit and loss. Impairment losses on equity investments are not reversed through profit and loss; increases in their fair value after impairment are recognised in other comprehensive income. In the case of debt instruments classified as available-for-sale, impairment is assessed based on the same criteria as financial assets carried at amortised cost. Future interest income is based on the reduced carrying amount and is accrued using the rate of interest used to discount the future cash flows for the purpose of measuring the impairment loss. The interest income is recorded in profit and loss. If, in a subsequent year, the fair value of a debt instrument increases and the increase can be objectively related to an event occurring after the impairment loss was recognised in profit and loss, the impairment loss is reversed through profit and loss. No-financial assets Other non-financial assets, other than deferred taxes, are assessed at each reporting date for any indications of impairment. The recoverable amount of non financial assets is the greater of their fair value less costs to sell and value in use. In assessing value in use, the estimated future cash flows are discounted to their present value using a pre-tax discount rate that reflects current market assessments of the time value of money and the risks specific to the asset. For an asset that does not generate cash inflows largely independent of those from other assets, the recoverable amount is determined for the cash-generating unit to which the asset belongs. An impairment loss is recognised when the carrying amount of an asset or its cash-generating unit exceeds its recoverable amount. All impairment losses in respect of non financial assets are recognized in profit or loss and reversed only if there has been a change in the estimates used to determine the recoverable amount. Any impairment loss reversed is only reversed to the extent that the asset s carrying amount does not exceed the carrying amount that would have been determined, net of depreciation or amortisation, if no impairment loss had been recognised. Derecognition of financial assets and liabilities Financial assets A financial asset (or, where applicable a part of a financial asset or part of a group of similar financial assets) is derecognised where: the rights to receive cash flows from the asset have expired the Bank has transferred its rights to receive cash flows from the asset, or retained the right to receive cash flows from the asset, but has assumed an obligation to pay them in full without material delay to a third party under a pass-through arrangement the Bank either (a) has substantially all the risks and rewards of the asset, or (b) has neither transferred nor retained substantially all the risks and rewards of the asset, but has transferred control of the asset. Where the Bank has transferred its rights to receive cash flows from an asset and has neither transferred nor retained substantially all the risks and rewards of the asset nor transferred control of the asset, the asset is recognised to the 10
15 extent of the Bank s continuing involvement in the asset. Continuing involvement that takes the form of a guarantee over the transferred asset is measured at the lower of the original carrying amount of the asset and the maximum amount of consideration that the Bank could be required to repay. Financial liabilities A financial liability is derecognised when the obligation under the liability is discharged or cancelled or expires. Where an existing financial liability is replaced by another from the same lender on substantially different terms, or the terms of an existing liability are substantially modified, such an exchange or modification is treated as a derecognition of the original liability and the recognition of a new liability, and the difference in the respective carrying amounts is recognised in profit and loss. Financial guarantees In the ordinary course of business, the Bank gives financial guarantees consisting of letters of credit, guarantees and other forms of credit insurance. Financial guarantees are initially recognised in the financial statements at fair value, in Other liabilities, being the premium received. Subsequent to initial recognition, the Bank s liability under each guarantee is measured at the higher of the amortised premium and the best estimate of expenditure required to settle any financial obligation arising as a result of the guarantee. Any increase in the liability relating to financial guarantees is taken to profit and loss. The premium received is recognised in profit and loss on a straight-line basis over the life of the guarantee. Taxation The current income tax charge is calculated in accordance with Ukrainian taxation regulations. Deferred tax assets and liabilities are calculated in respect of temporary differences using the balance sheet method. Deferred income taxes are provided for all temporary differences arising between the tax bases of assets and liabilities and their carrying values for financial reporting purposes, except where the deferred income tax arises from the initial recognition of goodwill or of an asset or liability in a transaction that is not a business combination and, at the time of the transaction, affects neither the accounting profit nor taxable profit or loss. A deferred tax asset is recorded only to the extent that it is probable that taxable profit will be available against which the deductible temporary differences can be utilised. Deferred tax assets and liabilities are measured at tax rates that are expected to apply to the period when the asset is realised or the liability is settled, based on tax rates that have been enacted or substantively enacted at the reporting date. Ukraine also has various operating taxes that are assessed on the Bank s activities. These taxes are included as a component of administrative and operating expenses. Property and equipment Following initial recognition at cost, buildings are carried at their revalued amount, which is the fair value at the date of the revaluation less any subsequent accumulated depreciation and subsequent accumulated impairment losses. Valuations are performed frequently enough to ensure that the fair value of a revalued asset does not differ materially from its carrying amount. Any revaluation surplus is credited to the revaluation reserve which is included in other comprehensive income, except to the extent that it reverses a revaluation decrease of the same asset previously recognised in profit and loss, in which case the increase is recognised in profit and loss. A revaluation deficit is recognised in profit and loss, except that a deficit directly offsetting a previous surplus on the same asset is directly offset against the surplus in the property revaluation reserve. Additionally, accumulated depreciation as at the revaluation date is eliminated against the gross carrying amount of the asset and the net amount is restated to the revalued amount of the asset. Upon disposal, any revaluation reserve relating to the particular asset being sold is transferred to retained earnings. Depreciation of an asset begins when it is available for use. Depreciation is calculated on a straight-line basis over the following estimated useful lives: Years Buildings 50 Furniture and equipment 3-10 Leasehold improvements over the period of the related lease agreement Motor vehicles 5 The asset s residual values, useful lives and depreciation methods are reviewed, and adjusted as appropriate, at each reporting date. 11
16 Costs related to repairs and renewals are charged when incurred and included in other operating and administrative expenses unless they qualify for capitalisation. Intangible assets Intangible assets include computer software. Intangible assets acquired separately are measured on initial recognition at cost. The cost of intangible assets acquired in a business combination is fair value as at the date of acquisition. Following initial recognition, intangible assets are carried at cost less any accumulated amortisation and any accumulated impairment losses. The useful lives of intangible assets are assessed to be either finite or indefinite. Intangible assets with finite lives are amortised over the useful economic lives of 3 years and assessed for impairment whenever there is an indication that the intangible asset may be impaired. Amortisation periods and methods for intangible assets with indefinite useful lives are reviewed at least at each financial year-end. Provisions Provisions are recognised when the Bank has a present legal or constructive obligation as a result of past events, and it is probable that an outflow of resources embodying economic benefits will be required to settle the obligation and a reliable estimate of the amount of obligation can be made. Retirement and other benefit obligations The Bank has pension arrangements to the State pension system of Ukraine, which requires current contributions by the employer calculated as a percentage of current gross salary payments; such expense is charged in the period the related salaries are earned. Also the Bank has voluntary contribution pension arrangements with the non-state pension fund, which requires current contributions by the employer calculated as a percentage of employees payments to this pension fund; such expense is charged in the period the related salaries are earned. Bank has no post-retirement benefits or significant other compensated benefits requiring accrual. Share capital Ordinary and preference shares are classified as equity. Any excess of consideration received over the par value of shares issued is recognised as additional paid-in capital. Segment reporting The Bank s segmental reporting is based on the following operating segments: retail banking, corporate banking, financial institutions, asset management and other. Contingencies Contingent liabilities are not recognised in the statement of financial position but are disclosed if the possibility of any outflow in settlement is more than remote. A contingent asset is not recognised in the statement of financial position but disclosed when an inflow of economic benefits is probable. Recognition of income and expense Revenue is recognised to the extent that it is probable that the economic benefits will flow to the Bank and the revenue can be reliably measured. The following specific recognition criteria must also be met before revenue is recognised: Interest and similar income and expense For all financial instruments measured at amortised cost and interest bearing securities classified as available-for-sale, interest income or expense is recorded at the effective interest rate, which is the rate that exactly discounts estimated future cash payments or receipts through the expected life of the financial instrument or a shorter period, where appropriate, to the net carrying amount of the financial asset or financial liability. The calculation takes into account all contractual terms of the financial instrument (for example, prepayment options) and includes any fees or incremental costs that are directly attributable to the instrument and are an integral part of the effective interest rate, but not future credit losses. The carrying amount of the financial asset or financial liability is adjusted if the Bank revises its estimates of payments or receipts. The adjusted carrying amount is calculated based on the original effective interest rate and the change in carrying amount is recorded as interest income or expense. Once the recorded value of a financial asset or a group of similar financial assets has been reduced due to an impairment loss, interest income continues to be recognised using the original effective interest rate applied to the new carrying amount. Fee and commission income The Bank earns fee and commission income from a diverse range of services it provides to its customers. Fees earned for the provision of services over a period of time are accrued over that period. These fees include commission income and asset management, custody and other management and advisory fees. Loan commitment fees for loans that are likely to be drawn down and other credit related fees are deferred (together with any incremental costs) and recognised as an adjustment to the effective interest rate on the loan. 12
17 New standards and interpretations not yet adopted A number of new standards, amendments to standards and interpretations are not yet effective as at 31 December 2011, and are not applied in preparing these financial statements. Of these pronouncements, potentially the following will have an impact on the financial position and performance. Management plans to adopt these pronouncements when they become effective. IFRS 9 Financial Instruments will be effective for annual periods beginning on or after 1 January The new standard is to be issued in phases and is intended ultimately to replace International Financial Reporting Standard IAS 39 Financial Instruments: Recognition and Measurement. The first phase of IFRS 9 was issued in November 2009 and relates to the classification and measurement of financial assets. The second phase regarding classification and measurement of financial liabilities was published in October The remaining parts of the standard are expected to be issued during The Group recognises that the new standard introduces many changes to the accounting for financial instruments and is likely to have a significant impact on Group s consolidated financial statements. The impact of these changes will be analysed during the course of the project as further phases of the standard are issued. The Group does not intend to adopt this standard early. New IFRS 10 Consolidated Financial Statements replacing the requirements previously contained in IAS 27. Applicable to annual reporting periods beginning on or after 1 January New IFRS 11 Joint Arrangements replaces IAS 31 Interests in Joint Ventures. Requires a party to a joint arrangement to determine the type of joint arrangement in which it is involved by assessing its rights and obligations and then account for those rights and obligations in accordance with that type of joint arrangement. Applicable to annual reporting periods beginning on or after 1 January New IFRS 12 Disclosure of Interests in Other Entities requires the extensive disclosure of information that enables users of financial statements to evaluate the nature of, and risks associated with, interests in other entities and the effects of those interests on its financial position, financial performance and cash flows. Applicable to annual reporting periods beginning on or after 1 January New IFRS 13 Fair Value Measurement replaces the guidance on fair value measurement in existing IFRS accounting literature with a single standard. Applicable to annual reporting periods beginning on or after 1 January The new standard replaces the fair value measurement guidance contained in individual IFRSs with a single source of fair value measurement guidance. It provides a revised definition of fair value, establishes a framework for measuring fair value and sets out disclosure requirements for fair value measurements. IFRS 13 does not introduce new requirements to measure assets or liabilities at fair value, nor does it eliminate the practicability exceptions to fair value measurement that currently exist in certain standards. The standard is applied prospectively with early adoption permitted. Comparative disclosure information is not required for periods before the date of initial application. Improvements to IAS 27 'Separate Financial Statements include using only for them, because requirement to consolidated statements replaced in IFRS 10 Consolidated Financial Statements. Applicable to annual reporting periods beginning on or after 1 January Improvements to IAS 28 Investments in Associates sets out the requirements for the application of the equity method when accounting for investments in associates and joint ventures. Applicable to annual reporting periods beginning on or after 1 January An amended version of IAS 19 Employee Benefits with revised requirements for pensions and other postretirement benefits, termination benefits and other changes. Applicable to annual reporting periods beginning on or after 1 January Amends IAS 32 Financial Instruments: Presentation and IFRS 7 Financial Instruments: Disclosure to clarify certain aspects because of diversity in application of the requirements on offsetting financial assets and financial liabilities. Applicable to annual reporting periods beginning on or after 1 January Amends the disclosure requirements in IFRS 7 Financial Instruments: Disclosure to require information about all recognized financial instruments that are set off. Applicable to annual periods beginning on or after 1 January 2013 and interim periods within those periods. Amends IAS 1 Presentation of Financial Statements to revise the way other comprehensive income is presented. Applicable to annual reporting periods beginning on or after 1 July Amends IAS 12 Income Taxes to provide a presumption that recovery of the carrying amount of an asset measured using the fair value model in IAS 40 Investment Property will, normally, be through sale. Applicable to annual periods beginning on or after 1 January Management is currently studying what effect these new standards and amendments may have on the financial position and result of operations. 13
18 4. Significant accounting judgements and estimates The preparation of financial statements in conformity with IFRSs requires management to make judgments, estimates and assumptions that affect the application of policies and the reported amounts of assets, liabilities, income and expense. The estimates and associated assumptions are based on historical experience and various other factors that are believed to be reasonable under the circumstances, the results of which form the basis of making the judgements about carrying values of assets and liabilities that are not readily apparent from other sources. Although these estimates are based on management s best knowledge of current events and actions, actual results ultimately may differ from these estimates. In particular, information about significant areas of estimation uncertainty and judgements in applying accounting policies is as follows: Critical accounting estimates Fair value of financial instruments Where the fair values of financial assets and financial liabilities recorded on the statement of financial position cannot be derived from active markets, they are determined using a variety of valuation techniques that include the use of mathematical models. The input to these models is taken from observable markets where possible, but where this is not feasible, a degree of judgement is required in establishing fair values. Allowance for impairment of loans and receivables Management estimates impairment by assessing the likelihood of repayment of loans and advances based on analysis of individual accounts for individually significant loans, and collectively for loans with similar terms and risk characteristics. Factors taken into consideration when assessing individual loans include collection history, current financial condition of the borrower, timeliness of repayments and collateral, if any. To determine the amount of impairment, management estimates the amounts and timing of future payments of principal and interest and proceeds from the disposal of collateral, if any. These cash flows are then discounted using the loan s original interest rate. Actual principal and interest payments depend on the borrowers ability to generate cash flows from operations or obtain alternative financing, and could differ from management s estimates. Factors taken into consideration when estimating impairment on loans assessed collectively include historical loss experience, portfolio delinquency rates, and overall economic conditions. Note 9 contains a description of the sensitivity of the carrying amount of loans and advances to changes in estimates. Should actual repayments be less than management estimates, the Bank would be required to record additional impairment expense. Fair value of buildings As stated in Note 3, buildings are carried at revalued amount less any subsequent accumulated depreciation and impairment losses. The method used to estimate fair value is the market approach. The market approach is based on an analysis of the results of comparable sales of similar buildings. Estimating the fair value of buildings requires the exercise of judgment and the use of assumptions regarding the comparability of properties and other factors. Management engages external independent appraisers to estimate the fair value of property. Note 12 contains a description of the key assumptions used in estimating the fair value of buildings. Critical accounting judgements The Bank s accounting policies allow offsetting of assets and liabilities (i.e. loans due from and deposits due to the same banks) only when there is legally enforceable right to set off the recognised amounts and there is an intention to settle on a net basis, or to realise the asset and settle the liability simultaneously. Although settlement of loans and deposits is typically done on the same day, loans due from and deposits due to the same banks are settled by receiving and paying separate amounts, thus exposing the Bank to credit risk for the full amount of the asset or liquidity risk for the full amount of the liability. These risk exposures may be significant even though relatively brief. Management believes that these transactions are in substance foreign currency exchange swaps and accounts for these transactions in accordance with the Bank s accounting policy in respect of derivatives (Note 3). Accordingly, the net fair value of foreign currency exchange swaps is recognised as an asset when the fair value is positive and as a liability when the fair value is negative. The gross amount of amounts receivable/payable on settlement (having the legal form of loans due from and deposits due to the same banks) are offset and not recognised on the balance sheet. Refer to Note 28 for information about maximum exposure to credit risk arising from these derivative instruments (i.e. gross amount of receivable upon settlement of loans due from banks) and information about exposure to liquidity risk (i.e. gross amount of payable upon settlement of deposits due to banks). 14
19 5. Segment information For management purposes, the Bank is organised into four operating segments based on products and services as follows: Corporate Private individuals Financial institutions Asset management and other Principally handling loans and other credit facilities and deposit and current accounts for corporate and institutional customers. Principally handling individual customers deposits, and providing consumer loans, overdrafts, credit cards facilities and funds transfer facilities. Principally placing funds with financial institutions, attracting deposits and other borrowings from financial institutions. Finance and other central functions Management monitors the operating results of its business units separately for the purpose of making decisions about resource allocation and performance assessment. Segment performance, as explained in the table below, is measured differently from profit or loss in the financial statements. Income taxes are managed on a central basis and are not allocated to operating segments. The segment information below is presented on the basis used by the Bank s chief operating decision maker to evaluate performance, in accordance with IFRS 8 Operating segments. The Board reviews discrete financial information for each of its segments, including measures of operating results, assets and liabilities. The segments are managed primarily on the basis of their results without analysis of funding between segments and income and expenses between them. In 2011, the Bank received revenue from the loan transactions with a single client of UAH 434,807 thousand, which is more than 10% of the Bank s total revenue. In 2010, the Bank did not have any revenue from operations with a single customer, which would be more than 10% of the Bank s total revenue. The following tables present income and profit and certain asset and liability information regarding the Bank s operating segments for the years ended 31 December 2011 and 2010: Private individuals Financial institutions Asset management and other 2011 Corporate Total Revenue Third party Interest income 911, ,285 22, ,566 1,567,703 Fee and commission income 38,633 57,452 21,463 6, ,168 Net losses from investment securities available-for-sale (47,831) (47,831) Net gains from foreign currencies ,824 74,824 Loss on initial recognition of investment securities available-forsale (1,845) (1,845) Other income 7,718 11, ,304 21,011 Total revenue 957, ,229 44, ,638 1,738,030 Interest expense (99,003) (432,810) (401,774) (6,827) (940,414) Fee and commission expense (8,375) (10,550) (467) (3,437) (22,829) Allowance for loan impairment (194,971) 76,534 45,322 - (73,115) Personnel expenses (118,975) (176,929) (7,666) (17,172) (320,742) Depreciation and amortization (19,611) (29,163) (1,264) (2,830) (52,868) Other impairment and provisions (22,028) (32,757) 24,196 (3,179) (33,768) Other segment expenses (56,703) (99,190) (9,312) (7,507) (172,712) Segment results 437,888 (372,636) (306,356) 362, ,582 Income tax expense (19,118) (19,118) Income for the year 343, ,464 Segment assets 7,970,472 2,059,401 1,279,248 4,016,141 15,325,262 Segment liabilities (1,358,219) (4,395,758) (6,168,773) (44,453) (11,967,203) Other segment information Capital expenditure 7,085 10, ,023 19,101 15
20 Private individuals Financial institutions Asset management and other 2010 Corporate Total Revenue Third party Interest income 752, ,288 51, ,336 1,324,184 Fee and commission income 36,100 47,110 18,215 4, ,576 Net losses from investment securities available-for-sale (43,519) (43,519) Net gains from foreign currencies ,360 16,360 Loss on initial recognition of investment securities available-forsale (130,377) (130,377) Other income 2,732 3, ,710 Total revenue 791, ,985 70, ,110 1,278,934 Interest expense (96,956) (557,066) (381,471) (15,382) (1,050,875) Fee and commission expense (9,302) (10,151) (669) (603) (20,725) Allowance for loan impairment (1,196,453) 229,156 (46,702) - (1,013,999) Personnel expenses (126,632) (165,255) (10,764) (9,814) (312,465) Depreciation and amortization (22,180) (28,945) (1,885) (1,719) (54,729) Other impairment and provisions (579) (756) (25,772) (45) (27,152) Other segment expenses (71,180) (102,521) (8,037) (3,308) (185,046) Segment results (731,564) (424,553) (405,179) 175,239 (1,386,057) Income tax benefit 7,208 7,208 Loss for the year 182,447 (1,378,849) Segment assets 2,534,112 2,008, ,954 3,200,372 8,649,584 Segment liabilities (921,994) (4,425,112) (4,214,759) (64,502) (9,626,367) Other segment information Capital expenditure 11,906 15,537 1, , Cash and cash equivalents Cash and cash equivalents comprise: Cash on hand 329, ,728 Current accounts with the National Bank of Ukraine 293, ,882 Current accounts with other credit institutions 812, ,905 Time deposits with credit institutions up to 90 days 201,524 - Ukrainian State bonds received as a contribution to share capital - 256,570 Cash and cash equivalents 1,637,546 1,563,085 The current account with the NBU represents amounts deposited with the NBU relating to daily settlements and other activities. The average daily requirement for the period from 1 to 31 December 2011 was UAH 89,449 thousand (2010: UAH 118,123 thousand). The Bank complied with the NBU obligatory reserve requirements as at 31 December 2011 and As at 31 December 2010 Ukrainian State bonds received as a contribution to share capital are included to cash and cash equivalents, as these bonds can be exchanged for cash on the Bank s demand. 16
21 7. Amounts due from credit institutions Amounts due from credit institutions comprise: Obligatory reserve with the National Bank of Ukraine Time deposits for more than 90 days and overdue 583, ,981 Other amounts due from credit institutions 87,410 68,935 Overdue current accounts with other credit institutions 699, ,261 1,370,317 1,278,222 Less allowance for impairment (1,123,023) (1,209,242) Amounts due from credit institutions 247,294 68,980 As at 31 December 2011, time deposits for more than 90 days for the amount of UAH 583,497 thousand (2010: UAH 509,981 thousand) were overdue more than ninety days and fully provided for. The mandatory reserve balance is calculated in accordance with regulations issued by the NBU. As at 31 December 2011 and 2010, the Bank complied with the NBU requirements in respect of mandatory reserve balance. As at 31 December 2011, Ukrainian State bonds amounting to UAH 178,500 thousand (2010: UAH 143,500 thousand). As at 31 December 2011, withdrawability of UAH 199 thousand is restricted (2010: UAH 45 thousand). Other amounts due from credit institutions represent security deposits, placed mainly in respect of customers transactions, such as letters of credit, performance guarantees and transactions with travellers cheques. The movements in allowance for impairment of amounts due from credit institutions were as follows: 1 January 1,209,242 1,162,516 Charge (reversal) (45,322) 46,702 Write-offs (40,907) - Translation difference December 1,123,023 1,209, Derivative financial instruments The Bank has loans due from and deposits due to the same banks that are denominated in different currencies for the same period with the same or similar amounts. Cash flows under these instruments are similar to cash flows under foreign exchange swaps. The Bank enters into these instruments for risk hedging purposes; however, these instruments do not qualify for hedge accounting. Refer to Note 4 for a description of critical accounting judgments made by management in application of the Bank s accounting policies for these instruments. The Bank enters into operations on currency conversion operations whereby it is obliged to supply one currency in exchange for another under pre-determined exchange rates. Such transactions are entered into with domestic and international banks. Delivery under such contracts is usually within one month. The Bank also enters into agreement with its customers for delivery of currency with fixed exchange rates. Notional amounts in the tables below represent receivable in the respective currency Notional Fair values Notional Fair value amount Asset Liability amount Asset Liability Foreign exchange contracts Swaps 2,596,106 3,825 (20,915) 1,277,709 2,286 (1,324) Spots 433, (457) 765,295 5,493 - Total derivative assets/liabilities 4,499 (21,372) 7,779 (1,324) 17
22 9. Loans to customers Loans to customers comprise: Corporate 12,652,785 7,094,574 Private individuals 2,685,217 2,647,017 Gross loans to customers 15,338,002 9,741,591 Less allowance for impairment (5,972,813) (5,869,170) Loans to customers 9,365,189 3,872,421 Loans and advances include loan principal and accrued interest as at 31 December 2011 and As at 31 December 2011, the carrying amount of loans under repurchase agreements comprised UAH 179,379 thousand (2010: UAH 57,237 thousand). Changes in collection estimates can affect the impairment losses recognised. For example, to the extent that the net present value of the estimated cash flows differs by plus/minus one percent, the loan impairment as at 31 December 2011 would be UAH 93,652 thousand lower/higher (2010: UAH 38,724 thousand). As at 31 December 2011, loans to customers in the gross amount of UAH 51,190 thousand (2010: UAH 154,045 thousand,) were pledged as collateral under loans received from another bank (Note 17). As at 31 December 2011, loans to customers in the gross amount of UAH 3,832,950 thousand (2010: UAH 431,590 thousand) were pledged as collateral under loans due to the National Bank of Ukraine (Note 16). As at 31 December 2011, the total restructured loans that would otherwise be overdue amounted to UAH 413,669 thousand (2010: UAH 755,480 thousand). Analysis of the credit quality of loans to customers is represented in Note 28. Allowance for impairment of loans to customers A reconciliation of the allowance for impairment of loans to customers by class is as follows: Corporate Private individuals Total At 1 January ,769,911 1,099,259 5,869,170 Charge (reversal) for the year 194,971 (76,534) 118,437 Amounts written off (12,397) (1,239) (13,636) Translation difference (3,199) 2,041 (1,158) At 31 December ,949,286 1,023,527 5,972,813 Gross amount of loans determined to be impaired, before deducting any assessed impairment allowance 6,795,237 2,463,717 9,258,954 Corporate Private individuals Total At 1 January ,579,999 1,325,346 4,905,345 Charge (reversal) for the year 1,196,453 (229,156) 967,297 Amounts written off (13,832) (19) (13,851) Translation difference 7,291 3,088 10,379 At 31 December ,769,911 1,099,259 5,869,170 Gross amount of loans determined to be impaired, before deducting any assessed impairment allowance 5,859,595 2,440,752 8,300,347 Impaired corporate loans and loans to private individuals of UAH 6,795,237 thousand and UAH 2,463,717 thousand (2010: UAH 5,859,595 thousand and UAH 2,440,752 thousand), respectively, include loans, which were assessed applying the portfolio method. Impaired loans Interest income accrued on loans, for which impairment allowances have been recognised, for the year ended 31 December 2011, comprised UAH 848,786 thousand (2010: UAH 646,576 thousand). 18
23 Collateral The following table provides an analysis of the gross loan portfolio by types of collateral: Type of collateral Corporate loans Total Corporate loans Private individuals loans Private individuals loans Impaired loans Deposits 29,474 3,610 33,084 19,974 3,570 23,544 Real estate 4,246,369 1,685,817 5,932,186 3,812,831 1,705,463 5,518,294 Other assets 1,488, ,020 1,848,723 1,052, ,054 1,470,725 Unsecured 1,030, ,270 1,444, , ,665 1,287,784 Total impaired loans 6,795,237 2,463,717 9,258,954 5,859,595 2,440,752 8,300,347 Total Loans without specifically identified impairment Deposits 79,473 43, ,007 50,261 28,943 79,204 Real estate 189, , , , , ,961 Other assets 5,409,980-5,409, , ,191 Unsecured 179,065 18, ,899 65,507 4,381 69,888 Total loans without specifically identified impairment 5,857, ,500 6,079,047 1,234, ,265 1,441,244 Total 12,652,785 2,685,217 15,338,002 7,094,574 2,647,017 9,741,591 The amounts shown in the table above represent the carrying value of the loans, and do not necessarily represent the fair value of collateral. The Bank assesses the fair value of collateral when the loan is extended, when collateral under the loan agreement is changed or when the collateral is foreclosed in case of the borrower s inability to repay the loan. When assessing the impairment allowance, the Bank applies the reduction factors of 40%-100% depending on the type of the collateral, except for deposits in the Bank that are taken as collateral without applying such reduction factors. The Bank takes into consideration historical data on the realisable value of collateral. As at 31 December 2011 and 2010, other assets comprise movable property, goods in turnover, etc. As at 31 December 2011, an estimated difference between the Bank s actual impairment losses for corporate loans and what they would have been without any collateral amounts to UAH 595,668 thousand (2010: UAH 666,084 thousand). As at 31 December 2011, an estimated difference between the Bank s actual impairment losses for loans to private individuals and what they would have been without any collateral amounts to UAH 514,250 thousand (2010: UAH 577,465 thousand). As at 31 December 2011, the Bank had a concentration of loans of UAH 7,555,926 thousand due from the ten largest entities (49,29% of gross loan portfolio) (2010: UAH 2,957,373 thousand or 30,4%). Loans are made principally within Ukraine in the following industry sectors: Services 5,863,309 1,342,852 Private individuals 2,685,217 2,647,017 Trade 2,049,553 1,725,184 Finance 900, ,809 Agriculture and food processing 895, ,175 Manufacturing 871, ,003 Construction 767, ,708 Real estate 711, ,583 Transport 480, ,130 Metallurgy 58,455 81,155 Other 53,949 48,975 Total 15,338,002 9,741,591 As at 31 December 2011, the Services sector above includes some loans to enterprises of the energy sector under state-control in the amount of UAH 4,588,964 thousand (2010: UAH 17,878 thousand). 19
24 10. Investment securities available-for-sale Available-for-sale securities comprise: Ukrainian State bonds 2,940,728 1,948,433 Municipal bonds 152,327 31,622 Corporate bonds 147, ,739 Corporate shares 21,340 15,825 State Mortgage Institution bonds - 145,302 Investment securities available-for-sale 3,262,323 2,378,921 As at 31 December 2011, the total amount of impairment loss recognised on investment securities comprised UAH 549,007 thousand (2010: UAH 511,205 thousand). As at 31 December 2011, the overdue investment securities were fully provided for. As at 31 December 2011 Ukrainian State bonds with a carrying value of UAH 1,293,636 thousand (2010: UAH 1,033,051 thousand) were pledged as collateral under the loans due to the National Bank of Ukraine (Note 16). As at 31 December 2011, Municipal bonds with a carrying value of UAH 23,244 thousand (2010: nill) were pledged as collateral under the loans due to the National Bank of Ukraine (Note 16). 11. Investment property The movements of investment property were as follows: 1 January 11,637 16,306 Additions - 3 Transfer from (to) property and equipment (993) (4,111) Fair value adjustment (378) (561) 31 December 10,266 11,637 Investment property, comprising office buildings, was held for long-term rental yields or appreciation in value and is not occupied by the Bank. Investment property was initially measured at cost together with transaction costs. Subsequent to initial recognition, investment property is carried at fair value with gain or loss resulting from a change in the fair value recognised in profit and loss in the period in which it arises. The valuation of investment property was performed by an independent appraiser as at 31 December Fair values were determined by reference to market-based evidence. The method used to estimate fair value includes comparison to recent sales of similar buildings. Key assumptions relate to the condition, quality and location of buildings used as comparatives. Investment property rental income of UAH 446 thousand for the (2010: UAH 452 thousand) is included in net gains/(losses) from investment property in profit and loss. 20
25 12. Property, equipment and intangible assets The movements in property, equipment and intangible assets were as follows: Furniture and equipment Leasehold improvements Motor vehicles Construction in progress Intangible assets Buildings Total Cost or revalued amount 1 January , ,018 28,378 18,747 57,567 17, ,987 Additions 1,246 1, ,944 7,240 19,101 Disposals - (6,221) (6,149) (468) (3) (284) (13,125) Transfers , (15,646) - - Reclassification from investment property Revaluation (5,795) ,099-6, December , ,102 23,336 18,285 61,961 24, ,230 Accumulated depreciation 1 January , ,829 21,876 13,649-7, ,449 Depreciation charge 12,487 29,321 3,788 2,509-4,763 52,868 Disposals - (6,032) (5,619) (414) - (271) (12,336) Reclassification from investment property (30) (30) Revaluation (24,638) (24,638) 31 December ,118 20,045 15,744-12, ,313 Net book value: 1 January ,466 78,189 6,502 5,098 57,567 9, , December ,960 64,984 3,291 2,541 61,961 12, ,917 Furniture and equipment Leasehold improvements Motor vehicles Construction in progress Intangible assets Buildings Total Cost or revalued amount 1 January , ,504 28,304 19, ,802 11, ,011 Additions , ,018 5,853 29,377 Disposals (36) (5,503) (1,211) (1,105) (26) (113) (7,994) Transfers 26, (26,752) - - Reclassification from investment property 4, ,068 Loss on devaluation (35 475) (35 475) 31 December , ,018 28,378 18,747 57,567 17, ,987 Accumulated depreciation 1 January ,359 17,421 11,331-5, ,731 Depreciation charge 12,228 31,524 5,537 3,033-2,407 54,729 Disposals (4) (5,054) (1,082) (715) - (113) (6,968) Reclassification from investment property (43) (43) 31 December , ,829 21,876 13,649-7, ,449 Net book value: 1 January ,663 91,145 10,883 8, ,802 6, , December ,466 78,189 6,502 5,098 57,567 9, ,538 Buildings are carried at a revalued amount representing fair value less subsequent accumulated depreciation and subsequent accumulated impairment losses. To determine the fair value of buildings, management obtained appraisals from independent and professionally qualified appraisers as at 31 December The method used to estimate fair value includes comparison to recent sales of similar buildings. Key assumptions relate to the condition, quality and location of buildings used as comparatives. 21
26 As at 31 December 2011, the carrying amount of buildings that would have been included in the financial statements had the buildings been carried at its cost less any accumulated depreciation and any accumulated impairment losses is UAH 321,805 thousand (2010: UAH 335,803 thousand). As at 31 December 2011, buildings in the carrying amount of UAH 343,028 thousand (2010: UAH 301,144 thousand) were pledged as collateral under loans due to the National Bank of Ukraine (Note 16). 13. Taxation The corporate income tax benefit comprises: Current tax charge - - Changes in deferred taxes origination and reversal of temporary differences 19,118 (7,208) Income tax expense (benefit) 19,118 (7,208) In December 2010, a new Tax Code was adopted in Ukraine. The new Tax Code assumes significant changes in tax accounting for VAT and corporate income tax, including changes in applicable rates and accounting policies for recognition of taxable income and expenses. In particular, under the new Tax Code, the corporate income tax rate will be decreased in steps from 25% in 2010 to 16% in The effective income tax rate differs from the statutory income tax rates. A reconciliation of the income tax benefit (loss) based on statutory rates with actual is as follows: Profit (loss) before tax 121,582 (1,386,057) Statutory tax rate 23% 25% Theoretical income tax expense (benefit) at the statutory rate 27,964 (346,514) Non-deductible expenditures 20,772) 17,203 Adjustments to the tax base of loans and advances due to changes in legislation 670,212 - Change in unrecognised deferred tax assets (678,792) 318,713 Changes in tax rate (21,038) 3,390 Income tax expense (benefit) 19,118 (7,208) 22
27 Deferred tax assets and liabilities as at 31 December and their movements for the respective years comprise: Origination and reversal of temporary differences in profit and loss Origination and reversal of temporary differences in profit and loss in equity 2010 in equity 2011 Tax effect of deductible temporary differences: Allowance for loan impairment 258,767-1,421,513 (1,421,513) - - Valuation of investment securities available for sale 12,274-12,274 (12,274) - - Valuation of loans to customers (4,079) Valuation of interbank loans Accruals and provisions 12,669-33,796 18,666-52,462 Valuation of debt securities issued (487) - 1,836 (1,768) - 68 Valuation of due to customers (1,230) Derivatives 3,853-3,853 (3,853) - - Tax losses carried forward 42, , ,475-1,200,044 Gross deferred tax asset 324,138-1,725,841 (472,941) - 1,252,900 (1,720,152 Unrecognised deferred tax asset (318,713) ) 678,792 - (1,041,360) Deferred tax asset (liability) 5,425-5, , ,540 Tax effect of taxable temporary differences: Property, equipment and intangible assets (4,951) 48,146 (6,510) (3,093) (4,097) (13,700) Derivative financial instruments (86) - (86) Valuation of interbank loans (407) Valuation of loans to customers (186,972) - (186,972) Valuation of investment securities available for sale 6,178 (3,192) - (35,225) 24,443 (10,782) Deferred tax liability 1,783 44,954 (6,917) (224,969) 20,346 (211,540) Net deferred tax liability 7,208 44,954 (1,228) (19,118) 20,346 - Deferred tax assets are not recognised because it is not probable that future taxable profit will be available to allow realisation of these temporary differences. 14. Other impairment and provisions The movements in other impairment allowances and provisions were as follows: Construction in progress Other assets Guarantees and commitments Total 1 January ,834 46,285 49,119 (Reversal) / charge 35,475 28,619 (36,942) 27,152 Write-offs - (66) - (66) Translation difference December ,475 31,403 10,083 76,961 (Reversal) / charge - 39,175 (5,407) 33,768 Write-offs Translation difference - (1) (46) (47) 31 December ,475 70,577 4, ,682 Allowance for impairment of assets is deducted from the carrying amounts of the related assets. Provisions for claims, guarantees and commitments are recorded as liabilities. 23
28 15. Other assets and liabilities Other assets comprise: Receivables resulting from executed guarantees 64,330 - Prepayments 11,811 14,142 Receivables for operations with credit cards 11,955 5,608 Other accrued income 3,101 2,913 Settlements with employees 1,815 1,799 Inventory Clearing payments for payment cards 1, Prepaid taxes other than income tax Receivables for claims - 25,616 Other 1,927 1,762 97,177 53,001 Less allowance for impairment of other assets (Note 14) (70,577) (31,403) Other assets 26,600 21,598 Other liabilities comprise: Penalties 9,858 26,962 Accrual for unused vacations 21,748 16,366 Payables to Guarantee Fund of Individuals' Deposits 5,481 5,024 Other accounts payables 334 3,039 Transit account in respect of transactions with plastic cards 1,624 2,921 Payables for operations with clients 5,549 1,704 Payables to plastic cards transactions processing centre 1,417 1,305 Other 4,421 3,631 Other liabilities 50,432 60,952 24
29 16. Amounts due to the National Bank of Ukraine Loans from the National Bank of Ukraine comprise: Long-term refinancing loans from the National Bank of Ukraine: Curre ncy Maturity Interest rate % UAH 28 July 2016 NBU discount rate %. 1,000,000 1,000,000 UAH 28 July 2016 NBU discount rate % 108, ,000 UAH 30 May 2016 NBU discount rate % 108, ,000 UAH 30 October 2012 NBU discount rate % 12,500 12,500 1,228,500 1,228,500 Long-term stabilization loan from the National Bank of Ukraine: UAH 28 July 2016 NBU discount rate % 2,608,100 2,673,175 Total long-term due to the National Bank of Ukraine 3,836,600 3,901,675 Short-term loan under repurchase agreement UAH 11 January ,3% 907,681 - Total due to the National Bank of Ukraine 4,744,281 3,901,675 As at 31 December 2011, the NBU discount rate is 7.75% (2010: 7.75%). As at 31 December 2011 the NBU short-term loan under repurchase agreement secured by Ukrainian State bonds with a carrying value of UAH 911,949 thousand (2010: nil). The short-term loan under repurchase agreement was repaid on 4 January As at 31 December the following assets were pledged under loans from the National Bank of Ukraine (carrying amount): Notes Loans to customers 9 3,832, ,590 Ukrainian state bonds 10 1,293,636 1,033,051 Buildings , ,144 Municipal bonds 10-23,244 Shares of the Bank owned by shareholders 3,640,950 3,640, Amounts due to credit institutions Amounts due to credit institutions comprise: Current accounts 1,148,366 36,759 Time deposits and loans 325, ,210 Amounts due to credit institutions 1,473, ,969 Included in time deposits and loans the amounts of UAH 1,259,796 thousand (2010: UAH 238,475 thousand) are due to two banks. As at 31 December 2011 loans to customer of gross amount of UAH 51,190 thousand (2010: UAH 154,045 thousand), were pledged as collateral under loan received from one bank (Note 9). The Bank is a party to various arrangements with other credit institutions, which contain financial covenants relating to the financial performance and general risk profile of the Bank. Under such covenants, the Bank is required to maintain a minimum capital adequacy ratio of 12%, to limit credit exposure to a single borrower and to ensure a certain level of operating activity. These financial covenants may restrict the Bank s ability to execute certain business strategies and enter into other significant transactions in the future. 25
30 At 31 December 2011 and 2010, the Bank is in breach of certain financial covenants or loans received from credit institutions with a total carrying value of UAH 99,417 thousand, which represents an event of default. An event of default allows the lenders to require immediate repayment of amounts due. Consequently, these loans are presented in note 28 and in note 30. As at the date of these financial statements, the lenders did not require early execution of obligations under the relevant loan agreements. 18. Amounts due to customers The amounts due to customers include the following: Current accounts: - Individuals 1,141, ,252 - Legal entities 771, ,810 - Budget organisations 12,385 10,652 1,925,568 1,511,714 Time deposits: - Individuals 3,221,048 3,413,288 - Legal entities 455, ,708 3,676,641 3,717,996 Amounts due to customers 5,602,208 5,229,710 At 31 December 2011, amounts due to customers of UAH 751,880 thousand (13,42%) are due to the ten largest customers (2010: UAH 713,525 thousand (14%)). In accordance with the Ukrainian legislation, the Bank is obliged to repay time deposits of private individuals upon demand of a customer. Customers by industry are summarised as follows: Individuals 4,362,827 4,384,540 Financial services 262,688 14,263 Construction 197, ,716 Services 193, ,931 Trade 169, ,285 Insurance 97,761 58,181 Transport 91, ,741 Energy 91,513 57,917 Manufacturing 71,655 31,591 Agriculture and food industry 52,815 32,672 Metallurgy 8,928 17,215 Other 1, Due to customers 5,602,209 5,229, Debt securities issued As at 31 December 2011, the Bank has issued interest-bearing bonds with a total carrying value of UAH 20,382 thousand (2010: UAH 59,916 thousand). Bonds issued by the Bank bear interest at 16% p.a. and mature in Subordinated debt In August 2004, the Bank obtained a loan amounting to UAH 50,000 thousand with interest rate of 12% p.a. from a Ukrainian entity. Starting from 1 December 2011 the interest rate was changed to a floating rate that equals the NBU discount rate plus 2.5% per annum. This loan matures in July-August Interest payments are made on a monthly basis in arrears on the first day of each month. 26
31 21. Equity Share capital As at 31 December 2011, authorised issued share capital comprised 9,999, ordinary shares and 477,000 preference shares (2010: 5,699, ordinary shares and 477,000 preference shares), with a nominal value of UAH 1 per share. The ordinary shares give rights for participation on the General Shareholders Meetings, receipt of dividends and share value. The Shareholders of preferred shares have the vote in certain cases according to the Regulations and eligible for annual receipt of fixed dividends except some cases of law. Quantity of issued and fully paid shares: Number of shares, 000 Nominal amount, UAH 000 Nominal amount, Ordinary Preferred Ordinary Preferred UAH December ,349, ,349, ,363,039 Shares issued and paid but not registered 349, , , December ,699, ,699, ,712,835 Shares issued and paid 4,300,000-4,300,000-4,300, December ,999, ,999, ,012,835 In March 2009, the Bank applied to the Government of Ukraine with the offer for the State to take control over the Bank participating in the Bank s share capital. In June 2009, the Government of Ukraine agreed to obtain control over the Bank acquiring additional share issue of 3,100,000,000 ordinary shares. As a result of this transaction the Government of Ukraine received 81.58% ownership of the Bank. The total consideration received for these shares was UAH 3,100,000 thousand in the form of Ukrainian State bonds which cannot be sold to third parties but are subject to repurchase by the NBU for cash within 5 days at the Bank s request. In 2011 share capital of the Bank was increased by UAH 4,300,000 thousand by exchange of Ukrainian state bonds for shares of additional issue of the Bank (2010: nil). Movements in other reserves Movements in other reserves were as follows: Revaluation reserve for buildings Revaluation reserve for investment securities availablefor-sale Total At 1 January ,970 8, ,964 Revaluation of buildings 48,146-48,146 Tax effect of revaluation of buildings (12) - (12) Net unrealised gains on available-for-sale investments - 14,857 14,857 Realised gains on investment securities available-for-sale reclassified to profit and loss - (2,090) (2,090) Tax effect of net gains on investment securities available-for-sale - (3,192) (3,192) At 31 December ,104 18, ,673 Realised revaluation of buildings 17,811-17,811 Net unrealised gains on available-for-sale investments - (100,090) (100,090) Realised gains on investment securities available-for-sale reclassified to profit and loss - (5,689) (5,689) Tax effect from revaluation of buildings (4,097) - (4,097) Tax effect of net gains on investment securities available-for-sale - 24,443 24,443 At 31 December ,818 (62,767) 183,051 27
32 Under the New Tax Code adopted in Ukraine in December 2010 (Note 13), tax values of property and equipment revalued as at 1 April 2011 is to be consistent with financial accounting records (prepared in accordance with Ukrainian National Accounting Standards, which correspond with IFRS in this respect) as at that date. This effectively means that a deferred tax liability arising on this temporary difference as at 31 December 2010 no longer meets the definition of a liability (to the extent that is not realised in the first quarter 2011, when the old rules still apply) since no outflow of economic benefits will occur during the realisation of this temporary difference. This resulted in the elimination of existing temporary differences between the carrying amount of property and equipment for financial reporting and the amounts used for the tax purposes as at 31 December As a result, the previously recognised deferred tax liability amounting to UAH 48,146 thousand was reversed and recognised in other comprehensive income for the year ended 31 December 2010 (to the extent of previously recognised deferred tax effect in revaluation reserve). 22. Commitments and contingencies Legal In the ordinary course of business, the Bank is subject to legal actions and complaints. Management believes that the amount of liabilities, if any, arising from such actions or complaints will not have a material adverse effect on the financial condition or the results of future operations of the Bank. Taxation The Ukrainian tax system be characterised by numerous taxes and frequently changing legislation. Tax regulations are often unclear, open to wide interpretation, and in some instances are conflicting. Instances of inconsistent opinions between local, regional and national tax authorities and between the NBU and the Ministry of Finance are not unusual. Tax declarations are subject to review and investigation by a number of authorities that are enabled by law to impose penalties and interest charges. These facts create tax risks in Ukraine substantially more significant than typically found in countries with more developed tax systems. Management believes that it has complied with all existing tax legislation. However, there can be no assurance that the tax authorities will not have a different interpretation of the Bank s compliance with existing legislation and assess fines and penalties. No provision for potential tax assessments has been made in these financial statements, because as at 31 December 2011 management believes that its interpretation of the relevant legislation is appropriate and that the Bank s tax position will be sustained. Commitments and contingencies As at 31 December financial commitments and contingencies comprised the following: Credit related commitments Guarantees 24, ,784 Undrawn loan commitments (revocable) 36,206 42,205 Letters of credit 1,332 9,232 Promissory note guarantees 4,225 6,793 Total 66, ,014 As at 31 December 2011, total provisions recognised in respect of the Bank s commitments and contingencies comprised UAH 4,630 thousand (2010: UAH 10,083 thousand) (Note 14). As at 31 December 2011, commitments and contingencies are secured by cash collateral in the amount of UAH 20,401 thousand (2010: UAH 29,657 thousand). 28
33 23. Net fee and commission income Net fee and commission income comprises: Settlements operations 117, ,581 Guarantees and letters of credit 1,121 1,704 Securities operations Other 4, Fee and commission income 124, ,576 Settlements operations (19,126) (19,192) Guarantees and letters of credit (1,281) (1,524) Currency conversion operations (2,413) (1) Other (9) (8) Fee and commission expense (22,829) (20,725) Net fee and commission income 101,339 84, Net losses from investment securities available-for-sale Net losses from investment securities available-for-sale recognised in the statement of operations comprise: Net losses from sale of investment securities available-for-sale (15,718) (10,991) Losses from impairment of investment securities available-for-sale (37,802) (34,618) Losses from investment securities available-for-sale (53,520) (45,609) Net gains from sale of investment securities available-for-sale, previously recognised in other comprehensive income (Note 21) 5,689 2,090 Net losses from investment securities available-for-sale (47,831) (43,519) 25. Loss on initial recognition of investment securities available-for sale Loss on initial recognition represents difference between the transaction price and fair value of the investment. Several transactions with securities conducted during 2011 and 2010 were not based on market terms. The fair value was estimated using valuation techniques. 26. Other income Reversal of impairment of property recognized in previous years 13,130 - Penalties received 3,547 3,559 Fees received from insurance companies 1, Fees received for rental of safe boxes Reversal of written-off assets Dividend income Other 2,381 1,581 Total other income 20,943 6,819 29
34 27. Personnel and other operating expenses Personnel and other operating expenses comprise: Salaries and bonuses 237, ,570 Employment taxes 81,224 77,833 Payments to non-state pension fund 1,185 1,728 Other personnel expenses Personnel expenses 320, ,465 Communications 34,729 30,574 Repair and maintenance of property and equipment 29,912 25,835 Occupancy and rent 27,414 28,211 Payments to the Individual s Deposit Guarantee Fund 21,846 17,918 Security expenses 9,817 10,666 Professional services fees 9,427 8,709 Office supplies 8,360 6,971 Taxes, other than income tax 7,286 12,637 Expenses for cash collection 5,960 4,409 Business travel 3, Charity 2,834 3,868 Marketing and advertising 2,701 1,851 Loss on disposal of property and equipment Fines and penalties ,739 Other 8,623 9,375 Other operating expenses 172, , Risk management Risk is inherent in the Bank s activities but is managed through a process of ongoing identification, measurement and monitoring, subject to risk limits and other controls. The process of risk management is critical to the Bank s performance, and each member of staff is accountable for the risk exposures relating to his or her responsibilities. The Bank is exposed to credit risk, liquidity risk, market risk and operation risks. The independent risk control process does not include business risks such as changes in the environment, technology and industry. They are monitored through the Bank s strategic planning process. Risk management structure Supervisory Board The Supervisory Board is ultimately responsible for final setting and approving the risks to which the Bank is exposed in a process of its activities and also for capital requirements; however, there are separate committees and departments responsible for managing and monitoring risks. Management Board The Management Board of Directors is responsible for the overall risk management approach and for implementation of the risk strategies and principles taken by Supervisory Board. Credit Council The Credit Council bears the overall responsibility for the development of the credit risk management strategy and implementing related principles, frameworks, policies and limits. Credit Committee The Credit Committee is responsible for authorising issuance of loans and related commitments within the established internal risk limits. The Assets and Liabilities Management Committee The Assets and Liabilities Management Committee is responsible for implementation, management and monitoring of the liquidity objectives and establishing the internal risk limits for the Bank. 30
35 Treasury The Treasury is responsible for monitoring the liquidity position. It is also primarily responsible for managing assets and liabilities. Risk Management Department The Risk Management Department is responsible for monitoring all the risk-management processes and also gives support to the Credit council, Credit Committee and Assets and Liabilities Management Committee. In particular, it values risks, proposes limits, monitors risk positions and develops internal risk management regulations. Risk mitigation As part of its overall risk management, the Bank uses different instruments to manage exposures resulting from changes in interest rates, foreign currencies and exposures arising from forecast transactions. The Bank actively uses collateral to reduce its credit risks (see below for more detail). Excessive risk concentration Concentrations arise when a number of counterparties are engaged in similar business activities, or activities in the same geographic region, or have similar economic features that would cause their ability to meet contractual obligations to be similarly affected by changes in economic, political or other conditions. Concentrations indicate the relative sensitivity of the Bank s performance to developments affecting a particular industry or geographical location. In order to avoid excessive concentrations of risks, policies and procedures include specific guidelines to focus on maintaining a diversified portfolio. Identified concentrations of credit risks are controlled and managed accordingly. Credit risk Credit risk is the risk that the Bank will incur a loss because its customers, clients or counterparties failed to discharge their contractual obligations. The Bank manages and controls credit risk by setting limits on the amount of risk it is willing to accept for individual counterparties and for geographical and industry concentrations, and by monitoring exposures in relation to such limits. The Bank has established a credit quality review process to provide early identification of possible changes in the creditworthiness of counterparties, including regular collateral revisions. Counterparty limits are established by the use of a credit risk classification system, which assigns each counterparty a risk rating. Risk ratings are subject to regular revision. The credit quality review process allows the Bank to assess the potential loss as a result of the risks to which it is exposed and take corrective action. Derivative financial instruments Credit risk arising from derivative financial instruments is limited to a nominal amount for the relevant contracts. Credit-related commitments risks The Bank makes available to its customers guarantees which may require that the Bank make payments on their behalf. Such payments are collected from customers based on the terms of the letter of credit. They expose the Bank to similar risks to loans and these are mitigated by the same control processes and policies. The table below shows the maximum exposure to credit risk for the components of the statement of financial position, including derivatives. The maximum exposure is shown gross, except for derivatives that are shown net. Maximum exposure 2011 Maximum exposure 2010 Notes Cash and cash equivalents (excluding cash on hand) 6 1,307,889 1,243,357 Amounts due from credit institutions 7 247,294 68,980 Derivative financial assets 8 4,499 7,779 Loans to customers 9 9,365,189 3,872,421 Investment securities available-for-sale 10 3,240,983 2,363,096 Other assets 15 11,934 4,932 14,177,788 7,560,565 Financial commitments and contingencies 22 61, ,931 Total credit risk exposure 14,239,671 7,712,496 Where financial instruments are recorded at fair value, the amounts shown above represent the current credit risk exposure but not the maximum risk exposure that could arise in the future as a result of changes in values. For more detail on the maximum exposure to credit risk for each class of financial instrument, refer to the notes. 31
36 Credit quality per class of financial assets The credit quality of net financial assets as at 31 December 2011 is as follows: Neither past due nor impaired Past due but not impaired Impaired Total Notes Amounts due from credit institutions 7 247, ,294 Loans to customers 9 Corporate 5,835,779 21,769 1,845,952 7,703,500 Private individuals 200,043 21,457 1,440,189 1,661,689 Investment securities available-for-sale 10 3,240, ,240,983 Total 9,524,099 43,226 3,286,141 12,853,466 The credit quality of net financial assets as at 31 December 2010 is as follows: Neither past due nor impaired Past due but not impaired Impaired Total Notes Amounts due from credit institutions 7 68, ,980 Loans to customers 9 Corporate 949, ,115 1,089,684 2,324,663 Private individuals 122,526 83,739 1,341,493 1,547,758 Investment securities available-for-sale 10 2,363, ,363,096 Total 3,504, ,854 2,431,177 6,304,497 Impaired loans include loans assessed individually for impairment and loans assessed collectively for impairment and found to be impaired. An analysis of past due loans, by age, is provided below. It is the Bank s policy to maintain accurate and consistent risk ratings across the credit portfolio. This facilitates focused management of the applicable risks and the comparison of credit exposures across all lines of business, geographic regions and products. The rating system is supported by a financial analytics of the Bank, combined with processed market information to provide the main inputs for the measurement of counterparty risk. All internal risk ratings are tailored to the various categories and are derived in accordance with the Bank s rating policy. The attributable risk ratings are assessed and updated regularly. Ageing analysis of past due but not impaired loans per class of financial assets as at 31 December 2011 is as follows: Less than 31 days to 60 days to 90 days 2011 More than 90 days 2011 Total 2011 Loans to customers Corporate lending ,769 21,769 Private individuals ,457 21,457 Total ,226 43,226 Aging analysis of past due but not impaired loans per class of financial assets as at 31 December 2010 is as follows: Less than 31 days to 60 days to 90 days 2010 More than 90 days 2010 Total 2010 Loans to customers Corporate 6, , ,115 Private individuals 5, ,318 75,858 83,739 Total 12, , , ,854 See Note 9 for more detailed information with respect to the allowance for impairment of loans to customers. 32
37 The geographical concentration of financial assets and liabilities is set out below: 2011 Ukraine OECD CIS and other foreign banks Total Assets: Cash and cash equivalents 1,632,179-5,367 1,637,546 Precious metals 77, ,315 Amounts due from credit institutions 169,010 78, ,294 Derivative financial assets 4, ,449 Loans to customers 9,365, ,365,189 Investment securities available-for-sale 3,244,491 17,832-3,262,323 Other assets 11, ,934 14,504,567 96,116 5,367 14,606,050 Liabilities: Amounts due to the National Bank of Ukraine 4,744, ,744,281 Amounts due to credit institutions 1,437,348 36,114-1,473,462 Derivative financial liabilities 21, ,372 Amounts due to customers 5,602, ,602,209 Debt securities issued 20, ,382 Subordinated debt 50, ,435 Other liabilities 4, ,630 23, ,203 11,903,860 36,114-11,939,974 Difference between assets and liabilities 2,600,707 60,002 5,367 2,666, Ukraine OECD CIS and other foreign banks Total Assets: Cash and cash equivalents 773, ,948 39,289 1,563,085 Precious metals 28, ,312 Amounts due from credit institutions 56 68,924-68,980 Derivative financial assets 7, ,779 Loans to customers 3,872, ,872,421 Investment securities available-for-sale 2,366,603 12,318-2,378,921 Other assets 4, ,932 7,053, ,190 39,289 7,924,430 Liabilities: Amounts due to the National Bank of Ukraine 3,901, ,901,675 Amounts due to credit institutions 200, , ,969 Derivative financial liabilities 1, ,324 Amounts due to customers 5,229, ,229,710 Debt securities issued 59, ,916 Subordinated debt 50, ,510 Other liabilities 39, ,562 9,483, ,033-9,593,666 Difference between assets and liabilities (2,429,682) 721,157 39,289 (1,669,236) Liquidity risk and funding management Liquidity risk is the risk that the Bank will be unable to meet its payment obligations when they fall due under normal and stress circumstances. Management of the Bank also performs day-to-day liquidity management activities, with due account for balances on the correspondent accounts and cash inflow/outflow projections,; management of current liquidity (up to 1 month) through identification of the Bank s requirements for liquid assets and assessment of the liquidity gap for the period; management of liquidity (over 1 month) through evaluation of mismatch between maturities on assets and liabilities and development of remedial actions to maintain the Bank s relevant liquidity levels in the future. Analysis of financial liabilities by remaining contractual maturities 33
38 The tables below summarise the maturity profile of financial liabilities as at 31 December based on contractual undiscounted repayment obligations except for gross settled derivatives which are shown by contractual maturity. Repayments which are subject to repayment upon a call are treated as if the call were to be given immediately. However, the Bank expects that many customers will not request repayment on the earliest date. Less than 3 months 3 to 12 months 1 to 5 years Over 5 years Total 2011 Amounts due to the National Bank of Ukraine 1,026, ,088 4,257,804-5,731,534 Amounts due to credit institutions 1,351, ,490 63,137-1,585,574 Derivative financial liabilities 21, ,372 Amounts due to customers 3,391,347 2,034, ,498 26,828 5,832,169 Debt securities issued , ,481 Subordinated debt 1,281 3,844 68,569-73,694 Other liabilities 23, ,203 Total undiscounted financial liabilities 5,816,593 2,677,598 4,769,008 26,828 13,290,027 Less than 3 months 3 to 12 months 1 to 5 years Over 5 years Total 2010 Amounts due to the National Bank of Ukraine 94, ,921 4,824,920-5,201,180 Amounts due to credit institutions 281,139 15,882 16, ,369 Derivative financial liabilities 1, ,324 Amounts due to customers 3,115,425 1,801, , ,404,655 Debt securities issued 2,368 7,173 66,372-75,913 Subordinated debt 1,496 4,504 24,000 53,740 83,740 Other liabilities 39, ,562 Total undiscounted financial liabilities 3,535,653 2,111,332 5,418,505 54,253 11,119,743 The table below shows the contractual expiry by maturity of financial commitments and contingencies. Each undrawn loan commitment is included in the time band containing the earliest date it can be drawn down. For issued financial guarantee contracts, the maximum amount of the guarantee is allocated to the earliest period in which the guarantee could be called. Less than 3 months 3 to 12 months 1 to 5 years Over 5 years Total ,662 48, , ,486 65,320 2, ,014 The Bank expects that not all of the contingent liabilities or commitments will be drawn before expiry of the commitments. The Bank received significant funds from the NBU and several Ukrainian and OECD credit institutions. Any significant withdrawal of these funds would have an adverse impact on the operations of the Bank. As discussed in more details in Note 16, the loans received from the NBU will mature in Management believes that the NBU loans will not be subject to early withdrawal, as the contracts with the NBU do not provide for early withdrawal in case of the Bank s non-compliance with their covenants; however, penalties are stipulated in the amount of UAH 30 thousand. Included in due to customers are term deposits of individuals. In accordance with the Ukrainian legislation, the Bank is obliged to repay such deposits upon demand of a depositor within the period specified in the relevant deposit agreement. Market risk Market risk is the risk that the fair value or future cash flows of financial instruments will fluctuate due to changes in market variables such as interest rates, foreign exchanges, and equity prices. The Bank classifies exposures to market risk into either trading or non-trading portfolios. The market risk for the non-trading positions are managed and monitored using other sensitivity analysis. 34
39 Interest rate risk Interest rate risk arises from the possibility that changes in interest rates will affect future cash flows or the fair values of financial instruments. The following table demonstrates the sensitivity to a reasonable possible change in interest rates, with all other variables held constant, of the Bank s profit and loss. The sensitivity of profit and loss is the effect of the assumed changes in interest rates on the net interest income for one year, based on the floating rate non-trading financial assets and financial liabilities held as at 31 December. Increase in basis points 2011 Sensitivity of net interest income 2011 Decrease in basis points 2011 Sensitivity of net interest income 2011 Currency UAH +100 (38,366) ,366 USD +100 (1,121) EUR +100 (36) Increase in basis points 2010 Sensitivity of net interest income 2010 Decrease in basis points 2010 Sensitivity of net interest income 2010 Currency UAH +100 (38,366) ,366 USD +100 (2,644) EUR +100 (112) Currency risk Currency risk is the risk that the value of a financial instrument will fluctuate due to changes in foreign exchange rates. The Assets and Liabilities Management Committee has set limits on positions by currency based on the National Bank of Ukraine regulations. Positions are monitored on a daily basis. The major foreign currency positions of assets and liabilities as at 31 December 2011 are as follows: UAH USD EUR Other currencies Total Assets Cash and cash equivalents 556, ,027 74,874 53,581 1,637,546 Precious metals ,315 77,315 Amounts due from credit institutions 159,894 87, ,294 Loans to customers 8,155,283 1,181,251 28,655-9,365,189 Investment securities available-forsale 3,051, , ,262,323 Investment property 10, ,266 Property, equipment and intangible 693, ,917 assets Current tax assets Other assets 22,572 2,691 1, ,600 Total assets 12,649,805 2,435, , ,178 15,320,763 Liabilities: Amounts due to NBU 4,744, ,744,281 Amounts due to credit institutions 1,171, ,556 6,198-1,473,462 Amounts due to customers 2,800,032 2,073, ,168 81,515 5,602,209 Debt securities issued 20, ,382 Subordinated debt 50, ,435 Provisions 860 3, ,630 Other liabilities 47,063 2, ,432 Total liabilities 8,834,761 2,375, ,209 81,518 11,945,831 Net long (short) recognised position 3,815,044 59,853 (549,625) 49,660 Unrecognised position: Nominal amount of financial assets 1,209,336 1,126, ,356 8,695 3,029,256 Nominal amount of financial liabilities (1,221,115) (1,549,466) (252,291) (23,257) (3,046,129) Commitments and contingencies (52,373) (13,893) (247) - (66,513) Net long (short) unrecognised position (64,152) (436,490) 431,818 (14,562) Net long (short) recognised and unrecognised position 3,750,892 (376,637) (117,807) 35,098 35
40 The major foreign currency positions of assets and liabilities as at 31 December 2010 are as follows: UAH USD EUR Other currencies Total Assets Cash and cash equivalents 646, , ,714 38,841 1,563,085 Precious metals ,312 28,312 Amounts due from credit institutions 10 68, ,980 Loans to customers 2,328,323 1,505,578 38,520-3,872,421 Investment securities available-for-sale 2,366,603 12, ,378,921 Investment securities under REPO agreements Investment property 11, ,637 Property, equipment and intangible 696, ,538 assets Current tax assets Other assets 17,933 2,172 1, ,598 Total assets 6,067,956 2,361, ,368 67,525 8,641,805 Liabilities: Amounts due to NBU 3,901, ,901,675 Amounts due to credit institutions 15, ,211 16, ,969 Amounts due to customers 2,797,046 1,678, ,941 49,346 5,229,710 Debt securities issued 59, ,916 Deferred tax liabilities 1, ,228 Subordinated debt 50, ,510 Provisions Other liabilities 58,690 1, ,952 Total liabilities 6,884,094 1,959, ,832 49,500 9,614,960 Net long (short) recognised position (816,138) 402,422 (577,464) 18,025 Unrecognised position: Nominal amount of financial assets 1,270,989 7, ,056 15,733 2,049,460 Nominal amount of financial liabilities - (1,735,969) (307,036) - (2,043,305) Commitments and contingencies (140,337) (18,697) (2,980) - (162,014) Net long (short) unrecognised position 1,130,652 (1,746,984) 445,040 15,733 Net long (short) recognised and unrecognised position 314,514 (1,344,562) (132,424) 33,758 The tables below indicate the currencies to which the Bank had significant exposure at 31 December on its non-trading monetary assets and liabilities and its forecasted cash flows. The analysis includes the effect of a reasonably possible movement of the currency rate against hryvnia, with all other variables held constant on profit and loss (due to the fair value of currency sensitive non-trading monetary assets and liabilities). The effect on equity does not differ from the effect on profit and loss. A negative amount in the table reflects a potential net increase in loss or decrease of equity, while a positive amount reflects a net potential decrease in loss or increase of equity. Increase in currency rate in % 2011 Effect on loss before tax 2011 Increase in currency rate in % 2010 Effect on loss before tax 2010 Currency USD 10.00% (37,664) 10.00% (134,456) EUR 10.00% (11,781) 10.00% (13,242) Decrease in currency rate in % 2011 Effect on loss before tax 2011 Decrease in currency rate in % 2010 Effect on loss before tax 2010 Currency USD % 37, % (134,456) EUR % 11, % (13,242) 36
41 29. Fair values of financial instruments The Bank uses the following hierarchy for determining and disclosing the fair value of financial instruments by valuation technique: Level 1: quoted (unadjusted) prices in active markets for identical assets or liabilities; Level 2: techniques for which all inputs which have a significant effect on the recorded fair value are observable, either directly or indirectly; and Level 3: techniques which use inputs which have a significant effect on the recorded fair value that are not based on observable market data. The following table shows an analysis of financial instruments recorded at fair value by level of the fair value hierarchy: At 31 December 2011 Level 1 Level 2 Level 3 Total Financial assets - 4,499-4,499 Derivative financial instruments Investment securities available-for-sale 202,588 3,056,227 3,507 3,262, ,588 3,060,726 3,507 3,266,822 Financial liabilities Derivative financial instruments - 21,372-21,372-21,372-21,372 At 31 December 2010 Level 1 Level 2 Level 3 Total Financial assets Derivative financial instruments - 7,779-7,779 Investment securities available-for-sale 2,157, ,207 3,507 2,378,921 2,157, ,986 3,507 2,386,700 Financial liabilities Derivative financial instruments - 1,324-1,324-1,324-1,324 Level 3 available-for-sale financial assets include a number of debt securities issued by Ukrainian enterprises which are listed but not quoted on an active market. Management applied valuation technique which includes, amongst other, significant adjustments to observable inputs. Therefore, these securities are classified as the level 3 in these financial statements. Financial instruments recorded at fair value The following is a description of the determination of fair value for financial instruments which are recorded at fair value using valuation techniques. These incorporate the Bank s estimate of assumptions that a market participant would make when valuing the instruments. Derivatives Derivatives valued using a valuation technique with market observable inputs are mainly interest rate swaps, currency swaps and forward foreign exchange contracts. The most frequently applied valuation techniques include forward pricing and swap models, using present value calculations. The models incorporate various inputs including the credit quality of counterparties, foreign exchange spot and forward rates and interest rate curves. Investment securities available-for-sale Investment securities available-for-sale valued using a valuation technique or pricing models primarily consist of unquoted equity and debt securities. These securities are valued using models which sometimes only incorporate data observable in the market and at other times use both observable and non-observable data. The non-observable inputs to the models include assumptions regarding the future financial performance of the investee, its risk profile, and economic assumptions regarding the industry and geographical jurisdiction in which the investee operates. Movements in level 3 financial instruments measured at fair value The following table shows a reconciliation of the opening and closing amount of Level 3 financial assets and liabilities which are recorded at fair value: 37
42 At 1 January 2011 Total gain/(loss) recorded in profit or loss Purchases Sales Settlements Transfers from level 1 and level 2 At 31 December 2011 Investment securities available-for-sale 3, ,507 At 1 January 2010 Total gain/(loss) recorded in profit or loss Purchases Sales Settlements Transfers from level 1 and level 2 At 31 December 2010 Investment securities available-for-sale 109,372 95, (201,770) - - 3,507 Impact on fair value of level 3 financial instruments measured at fair value of changes to key assumptions The following table shows the impact on the fair value of level 3 instruments of using reasonably possible alternative assumptions: Carrying amount Effect of reasonably possible alternative Carrying assumptions amount Effect of reasonably possible alternative assumptions Financial assets Investment securities available-for-sale 3,507 (3,507) 3,507 (3,507) Fair value of financial assets and liabilities not carried at fair value The estimated fair values of financial assets and liabilities are determined using market prices, discounted cash flow and other appropriate valuation methodologies and may not be indicative of the fair value of those instruments at the date these consolidated financial statements are distributed. These estimates do not reflect any premium or discount that could result from offering for sale at one time the entire holdings of a particular financial instrument. Fair value estimates are based on judgments regarding future expected cash flows, current economic conditions, risk characteristics of various financial instruments and other factors. Fair value estimates are based on existing financial instruments without attempting to estimate the value of anticipated future business and the value of assets and liabilities not considered financial instruments. In addition, tax ramifications related to the realization of the unrealised gains and losses can have an effect on fair value estimates and have not been considered. Due from and due to banks comprise short term placements and borrowings. Due to short term life of those financial instruments and corresponding of actual interest rates to those prevailing money market interest rates for similar financial instruments the carrying amount of due from banks balances approximate their fair value. To determine fair value expected cash flows are discounted at market rates prevailing as at the reporting date for similar instruments. Carrying value 2011 Fair value 2011 Carrying value 2010 Fair value 2010 Financial assets Loans to customers 9,365,189 9,260,617 3,872,421 3,855,294 Financial liabilities Amounts due to customers 5,602,209 5,637,242 5,229,710 5,272,457 Subordinated debt 50,435 50,435 50,510 50,510 Debt securities issued 20,382 19,834 59,916 62,032 38
43 30. Maturity analysis of assets and liabilities The table below shows an analysis of assets and liabilities according to when they are expected to be recovered or settled. See Note 28 for the Bank s contractual undiscounted repayment obligations. Within one year More than one year More No Within than one maturity Total one year year No maturity Total Cash and cash equivalents 1,637, ,637,546 1,563, ,563,085 Precious metals 77, ,315 28, ,312 Derivative financial - assets 4,499-4,499 7, ,779 Amounts due from credit - institutions 247, ,294 68, ,980 Loans to customers 6,456,794 2,908,395-9,365,189 1,396,458 2,475,963-3,872,421 Investment securities available-for-sale 806,096 2,456,227-3,262, ,935 1,936,986-2,378,921 Investment securities pledged under repurchase agreements Investment property - 10,266 10, ,637 11,637 Property, equipment and intangible assets , , , ,538 Current income tax assets Other assets 26, ,600 21, ,598 Total 9,256,144 5,364, ,183 15,325,262 3,528,147 4,413, ,175 8,649,584 Amounts due to the National bank of Ukraine 1,159,281 3,584,600-4,744,281 59,740 3,841,935-3,901,675 Amounts due to credit institutions 1,417,186 56,276-1,473, ,948 16, ,969 Derivative financial liabilities 21, ,372 1, ,324 Amounts due to customers 5,272, ,208-5,602,209 4,799, ,366-5,229,710 Debt securities issued ,024-20,382 1,284 58,632-59,916 Deferred income tax liabilities ,228-1,228 Subordinated debt ,000-50, ,000-50,510 Provisions 4, ,630 10, ,083 Other liabilities 50, ,432 60, ,952 Total 7,926,095 4,041,108-11,967,203 5,228,185 4,398,182-9,626,367 Net 1,330,049 1,323, ,183 3,358,059 (1,700,03 8) 15, ,175 (976,783) As at 31 December 2011, loans to customers within one year include UAH 425,788 thousand of the overdue loans (2010: UAH 528,605 thousand). As at 31 December 2011, the Bank was in breach of certain financial covenants. According to the terms of the respective loan agreements, the lenders may at their option, by notice to the Bank, declare all or any portion of the loan and accrued interest either due and payable on demand or immediately due and payable. The carrying value of loans from other credit institutions where the Bank was in breach of certain financial covenants is UAH 99,417 thousand as at 31 December 2011 and are presented as due within one year in the table above. As at the date of these financial statements the lenders did not require early implementation of obligations under the relevant loan agreement. 39
44 31. Related party disclosures The Bank grants loans and advances to customers, attracts deposits and performs other transactions with related parties in the ordinary course of business. Parties are considered to be related if one party has the ability directly or indirectly through one or more intermediaries to control the other party or exercises significant influence over the party when making financial and operational decisions. Terms on transactions with related parties are established on a daily basis and may differ from the market terms. Related parties comprise the shareholders of the Bank, companies which are under common control with the Bank, key management personnel and their close family members, companies that are controlled or significantly influenced by the shareholders, by key management personnel or by their close family members. The balances and transactions with related parties as at 31 December and for the years ended are as follows: State controlled entities Key management State Other Other related controlled related parties personnel entities parties Key management personnel Current accounts with the National Bank of Ukraine 293, , Current accounts with other credit institutions 15, , Ukrainian State bonds (included in cash and cash equivalents) , Obligatory reserve with the National Bank of Ukraine Loans outstanding at 31 December, gross 5,628, , Less allowance for impairment (5,580) - (2) (417) - (11) Investment securities availablefor-sale Ukrainian State bonds 2,940, ,093, Investment securities pledged under repurchase agreements Amounts due to the National Bank of Ukraine 4,744, ,901, Amounts due to credit institutions 1,179, , Deposits 84, ,176 33,455 4,056 1,107 Current accounts 336, , Commitments and guarantees issued ,194 Interest income on loans 530, , Interest income on investment securities available-for-sale 281, , Interest expense on amounts due to the National Bank of Ukraine 344, , Interest expense on amounts due to credit institutions 52, , Interest expense on deposits 8, , Other operating expenses - 15, ,232 9 Compensation of key management personnel is comprised of the following: Salaries and bonuses 7,315 6,941 Employment taxes 2,692 2,554 Payments to non-state pension fund Total key management personnel compensation 10,043 9,576 Information regarding increase of share capital in 2011 is presented in Note
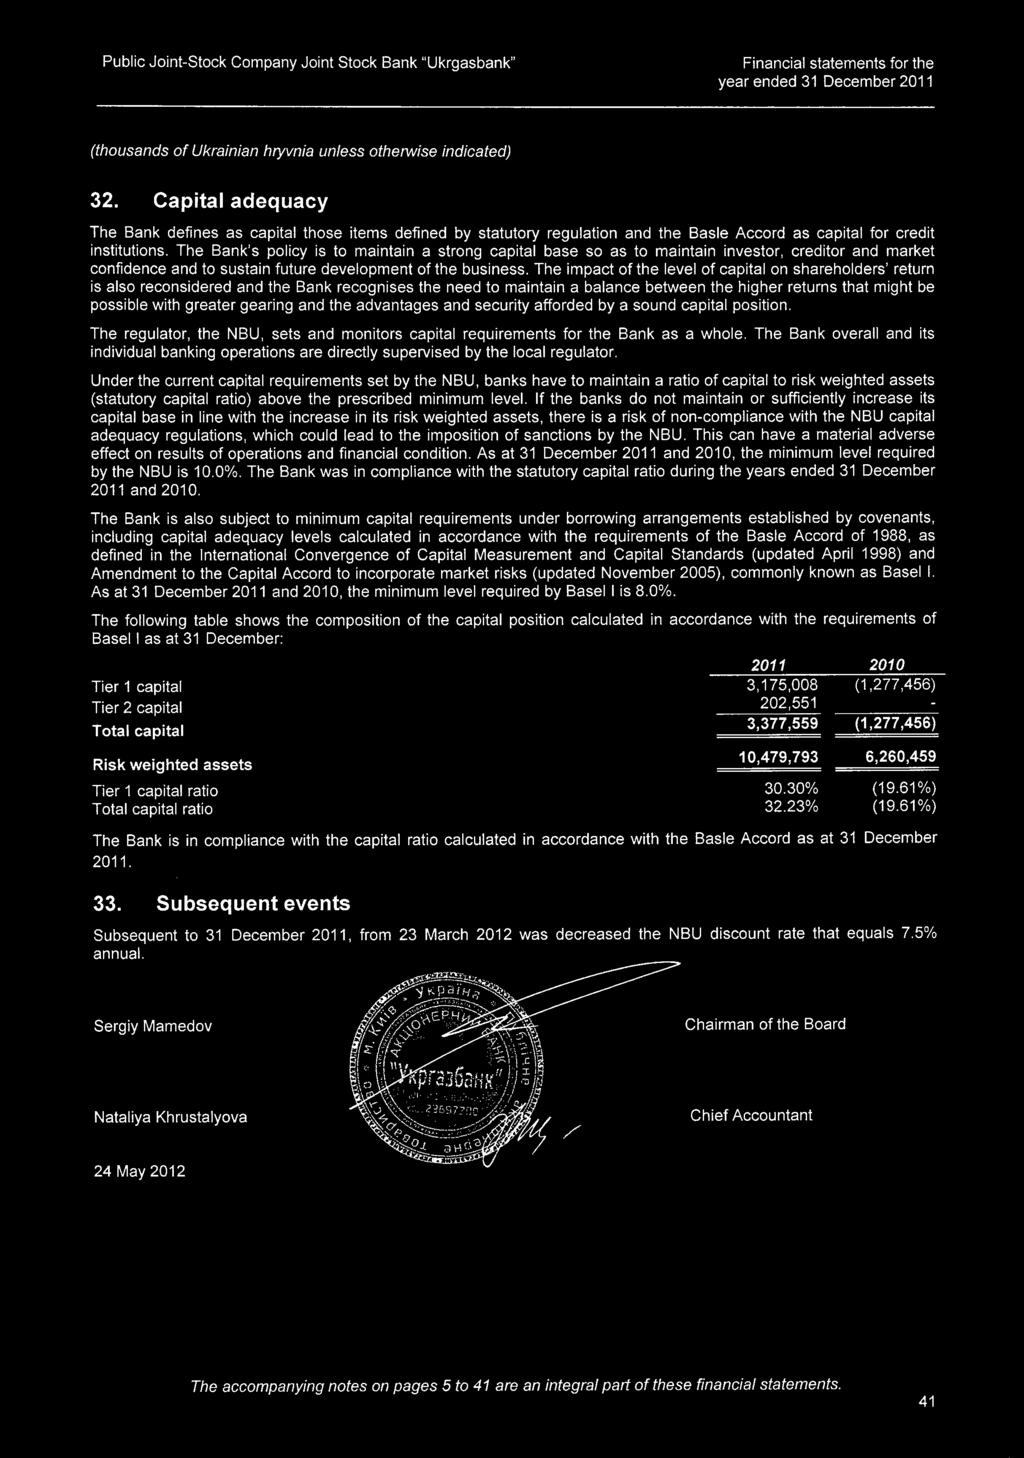
45
Open Joint Stock Company Raiffeisen Bank Aval Consolidated Financial Statements
 Open Joint Stock Company Raiffeisen Bank Aval Consolidated Financial Statements Year ended 31 December Together with Independent Auditors Report Consolidated Financial Statements CONTENTS INDEPENDENT AUDITORS
Open Joint Stock Company Raiffeisen Bank Aval Consolidated Financial Statements
 Open Joint Stock Company Raiffeisen Bank Aval Consolidated Financial Statements For the year ended 31 December Together with Independent Auditors Report Consolidated Financial Statements CONTENTS INDEPENDENT
PUBLIC JOINT-STOCK COMPANY JOINT STOCK BANK UKRGASBANK
 PUBLIC JOINT-STOCK COMPANY Financial statements for the year ended Together with independent auditor s report Table of contents Independent auditor s report STATEMENT OF FINANCIAL POSITION... 1 STATEMENT
PUBLIC JOINT-STOCK COMPANY JOINT STOCK BANK UKRGASBANK
 PUBLIC JOINT-STOCK COMPANY JOINT STOCK BANK UKRGASBANK, Together with Independent Auditor s Report Table of Contents Statement of management s responsibilities for the preparation and approval of the financial
Public Joint-Stock Company ING Bank Ukraine. IFRS Financial statements. Year ended 31 December 2012 together with independent auditors' report
 Public Joint-Stock Company ING Bank Ukraine IFRS Financial statements Year ended 31 December 2012 together with independent auditors' report Translation from Ukrainian original 2012 IFRS Financial statements
OJSC Kapital Bank Financial Statements. Year ended 31 December 2012 Together with Independent Auditors Report
 Financial Statements Year ended 31 December Together with Independent Auditors Report financial statements CONTENTS Independent auditors report Statement of financial position... 1 Income statement...
JSC VTB Bank (Georgia) Consolidated financial statements
 Consolidated financial statements") Consolidated financial statements For the year ended 31 December 2017 together with independent auditor s report 2017 consolidated financial statements Contents Independent auditor s report Consolidated
Consolidated financial statements For the year ended 31 December 2017 together with independent auditor s report 2017 consolidated financial statements Contents Independent auditor s report Consolidated
Accounting policy
 Accounting policy 30.06.18 1. Principal activities ACBA-Credit Agricole Bank CJSC (the Bank ) is the parent company in the Group, which is comprised of the Bank and its subsidiary ACBA Leasing Credit Organization
CONTENTS Consolidated Financial Statements INDEPENDENT AUDITORS REPORT
 2007 Consolidated Financial Statements CONTENTS INDEPENDENT AUDITORS REPORT Consolidated balance sheet...1 Consolidated income statement...2 Consolidated statement of changes in equity...3 Consolidated
Public Joint Stock Company ING Bank Ukraine IFRS Financial statements
 Public Joint Stock Company ING Bank Ukraine IFRS Financial statements Year ended 31 December 2015 together with independent auditors' report 2015 IFRS Financial statements Contents Independent auditors'
Joint Stock Company The State Export-Import Bank of Ukraine Consolidated Financial Statements
 Joint Stock Company The State Export-Import Bank of Ukraine Consolidated Financial Statements Year ended 31 December 2006 Together with Independent Auditors Report 2006 Consolidated Financial Statements
Public Joint Stock Company Raiffeisen Bank Aval Consolidated Financial Statements
 Public Joint Stock Company Raiffeisen Bank Aval Consolidated Financial Statements For the year ended 31 December Together with Independent Auditors Report Consolidated IFRS Financial Statements CONTENTS
Publick stock company Joint-Stock Commercial Industrial & Investment Bank IFRS Financial Statements
 Publick stock company Joint-Stock Commercial Industrial & Investment Bank IFRS Financial Statements Year ended 31 December 2009 Together with Independent Auditors Report Public stock company Joint-Stock
Public Joint Stock Company Raiffeisen Bank Aval. Consolidated IFRS Financial Statements
 Public Joint Stock Company Raiffeisen Bank Aval Consolidated IFRS Financial Statements for the year ended 31 December 2016 Together with Independent Auditors Report 2016 Consolidated IFRS Financial Statements
Azer-Turk Bank Open Joint Stock Company Financial statements. Year ended 31 December 2016 together with independent auditor s report
 Financial statements Year ended 31 December together with independent auditor s report financial statements Contents Independent auditor s report Financial statements Statement of financial position...
Yapi Kredi Bank Azerbaijan CJSC Consolidated financial statements
 Yapi Kredi Bank Azerbaijan CJSC Consolidated financial statements Year ended 31 December 2014 together with independent auditors report 2014 Consolidated financial statements Contents Independent auditors
Public Joint Stock Company Raiffeisen Bank Aval. Consolidated IFRS Financial Statements
 Public Joint Stock Company Raiffeisen Bank Aval Consolidated IFRS Financial Statements For the year ended 31 December 2014 Together with Independent Auditors Report 2014 Consolidated IFRS Financial Statements
OJSC Belvnesheconombank Consolidated IFRS Financial Statements. Year ended 31 December 2010 Together with Independent Auditors Report
 Consolidated IFRS Financial Statements Year ended 31 December 2010 Together with Independent Auditors Report 2010 Consolidated IFRS financial statements Contents Independent auditors report Consolidated
Consolidated IFRS Financial Statements
 PUBLIC JOINT STOCK COMPANY RAIFFEISEN BANK AVAL Consolidated IFRS Financial Statements for the year ended 31 December 2017 Together with Independent Auditors Report www.aval.ua 2017 Consolidated IFRS Financial
BPS-Sberbank and subsidiaries Consolidated financial statements
 and subsidiaries Consolidated financial statements For the year ended together with independent auditors report Consolidated financial statements Contents Audit report of independent audit firm Consolidated
OJSC Belarusky Narodny Bank Consolidated Financial Statements. Year ended 31 December 2010 Together with Independent Auditors Report
 OJSC Belarusky Narodny Bank Consolidated Financial Statements Year ended 31 December 2010 Together with Independent Auditors Report CONTENTS Independent auditors report Consolidated statement of financial
Converse Bank Closed Joint Stock Company Consolidated financial statements. Year ended 31 December 2016 together with independent auditor s report
 Consolidated financial statements Year ended 31 December 2016 together with independent auditor s report 2016 Consolidated financial statements Contents Independent auditor s report Consolidated statement
UNITY BANK PLC Unaudited Management Accounts 31 March 2017
 UNITY BANK PLC Unaudited Management Accounts 31 March 2017 1.1 Corporate Information Unity Bank Plc provides banking and other financial services to corporate and individual customers. Such services include
UNITY BANK PLC UNAUDITED FINANCIAL STATEMENTS Jun-17
 UNITY BANK PLC UNAUDITED FINANCIAL STATEMENTS Jun-17 1.1 Corporate Information Unity Bank Plc provides banking and other financial services to corporate and individual customers. Such services include
ZAO Mizuho Corporate Bank (Moscow) Financial statements
 Financial statements") Financial statements Year ended 31 December 2012 Together with Independent Auditors' Report Financial statements CONTENTS INDEPENDENT AUDITORS' REPORT Statement of financial position... 1 Income statement...
Financial statements Year ended 31 December 2012 Together with Independent Auditors' Report Financial statements CONTENTS INDEPENDENT AUDITORS' REPORT Statement of financial position... 1 Income statement...
ING Bank (Eurasia) ZAO Financial Statements
 ZAO Financial Statements") Financial Statements Year ended 31 December 2008 Together with Independent Auditors Report CONTENTS INDEPENDENT AUDITORS REPORT Balance sheet... 1 Income statement... 2 Statement of changes in equity...
Financial Statements Year ended 31 December 2008 Together with Independent Auditors Report CONTENTS INDEPENDENT AUDITORS REPORT Balance sheet... 1 Income statement... 2 Statement of changes in equity...
Public Joint Stock Company Raiffeisen Bank Aval. Consolidated IFRS Financial Statements
 Public Joint Stock Company Raiffeisen Bank Aval Consolidated IFRS Financial Statements For the year ended 31 December 2015 Together with Independent Auditors Report 2015 Consolidated IFRS Financial Statements
Tirana Bank sh.a. Financial Statements as of and for the year ended 31 December 2016
 Financial Statements as of and for the year ended 31 December 2016 TABLE OF CONTENT AUDITOR S REPORT STATEMENT OF PROFIT OR LOSS AND OTHER COMPREHENSIVE INCOME 8 STATEMENT OF FINANCIAL POSITION 9 STATEMENT
ACBA-CREDIT AGRICOLE BANK closed joint stock company
 Consolidated Financial Statements and Independent Auditor's Report ACBA-CREDIT AGRICOLE BANK closed joint stock company 31 December 2012 ACBA-CREDIT AGRICOLE BANK closed joint stock company Contents Page
JSC Liberty Bank and Subsidiaries Consolidated financial statements
 Consolidated financial statements Year ended 31 December 2014 together with independent auditor s report 2014 Consolidated financial statements Contents Independent auditor s report Consolidated statement
Piraeus Bank ICB International Financial Reporting Standards Financial Statements and Independent Auditor s Report 31 December 2010
 International Financial Reporting Standards Financial Statements and Independent Auditor s Report 31 December 2010 CONTENTS INDEPENDENT AUDITOR S REPORT FINANCIAL STATEMENTS Statement of Financial Position...
Converse Bank closed joint stock company
 Converse Bank closed joint stock company Consolidated Financial Statements 30 September 2016 Consolidated financial statements as at 30 September 2016 Contents Consolidated statement of financial position...
ZAO Bank Credit Suisse (Moscow) Financial Statements for the year ended 31 December 2010
 Financial Statements for the year ended 31 December 2010") Financial Statements for the year ended 31 December 2010 Contents Independent Auditors Report... 3 Statement of Comprehensive Income... 4 Statement of Financial Position... 5 Statement of Cash Flows...
Financial Statements for the year ended 31 December 2010 Contents Independent Auditors Report... 3 Statement of Comprehensive Income... 4 Statement of Financial Position... 5 Statement of Cash Flows...
Public Joint-Stock Company Joint-Stock Commercial Bank Industrialbank Financial Statements
 Public Joint-Stock Company Joint-Stock Commercial Bank Industrialbank Financial Statements For the year ended 31 December 2016 Together with Independent Auditors Report 2016 Financial statements CONTENTS
Converse Bank closed joint stock company. Consolidated Financial Statements. 31 December 2017
 Converse Bank closed joint stock company Consolidated Financial Statements 31 December 2017 1 Converse Bank CJSC Consolidated financial statements as at 31 December 2017 Contents Consolidated statement
JSC Kor Standard Bank Consolidated Financial Statements
 Consolidated Financial Statements For the year ended 31 December Together with Independent Auditors Report Contents Independent auditors report Consolidated statement of financial position... 1 Consolidated
PJSC BANK CREDIT DNEPR Financial statements
 Financial statements As at and for the year ended 31 December 2011 Together with Independent Auditors Report 2011 Financial Statements CONTENTS INDEPENDENT AUDITORS REPORT FINANCIAL STATEMENTS Statement
ACBA-Credit Agricole Bank CJSC Consolidated financial statements
 Consolidated financial statements Year ended 31 December 2016 together with independent auditor s report 2016 Consolidated financial statements Contents Independent auditor s report Consolidated statement
BANCA INTESA (CLOSED JOINT-STOCK COMPANY) Consolidated financial statements. Year ended 31 December 2013 Together with Auditors report
 Consolidated financial statements. Year ended 31 December 2013 Together with Auditors report") BANCA INTESA (CLOSED JOINT-STOCK COMPANY) Consolidated financial statements Year ended 31 December 2013 Together with Auditors report BANCA INTESA (CLOSED JOINT-STOCK COMPANY) 2013 Consolidated financial
BANCA INTESA (CLOSED JOINT-STOCK COMPANY) Consolidated financial statements Year ended 31 December 2013 Together with Auditors report BANCA INTESA (CLOSED JOINT-STOCK COMPANY) 2013 Consolidated financial
 STATEMENT OF PROFIT OR LOSS For the year ended 31 December 2014 Financial statements Note 2014 2013 Interest income Cash and cash equivalents 893,744 506,424 Loans to customers 1,020,693 440,642 Amounts
OMAN ARAB BANK SAOC. Report and financial statements for the year ended 31 December 2017
 OMAN ARAB BANK SAOC Report and financial statements for the year ended 31 December 2017 OMAN ARAB BANK SAOC Report and financial statements for the year ended 31 December 2017 Page Independent auditor
Ameriabank cjsc. Financial Statements for the year ended 31 December 2012
 Financial Statements for the year ended 31 December Contents Independent Auditors Report... 3 Statement of comprehensive income... 4 Statement of financial position... 5 Statement of cash flows... 6 Statement
SMP Bank (OJSC) Consolidated Financial Statements for the year ended 31 December 2011
 Consolidated Financial Statements for the year ended 31 December 2011") Consolidated Financial Statements for the year ended 31 December 2011 Contents Independent Auditors Report... 3 Consolidated statement of comprehensive income... 4 Consolidated statement of financial position...
Consolidated Financial Statements for the year ended 31 December 2011 Contents Independent Auditors Report... 3 Consolidated statement of comprehensive income... 4 Consolidated statement of financial position...
JSC Microfinance Organization Credo Financial statements. Year ended 31 December 2016 together with independent auditor s report
 Financial statements Year ended 31 December 2016 together with independent auditor s report Financial statements Contents Independent auditor s report Statement of financial position... 1 Statement of
PASHA YATIRIM BANKASI A.Ş. FINANCIAL STATEMENTS AS AT 31 DECEMBER 2017 TOGETHER WITH INDEPENDENT AUDITOR S REPORT
 FINANCIAL STATEMENTS AS AT 31 DECEMBER 2017 TOGETHER WITH INDEPENDENT AUDITOR S REPORT CONTENTS Independent auditors review report Statement of financial position... 1 Statement of income... 2 Statement
OJSC Nordea Bank. International Financial Reporting Standards Unconsolidated Financial Statements and Auditors Report.
 International Financial Reporting Standards Unconsolidated Financial Statements and Auditors Report 31 December 2012 CONTENTS AUDITORS REPORT UNCONSOLIDATED FINANCIAL STATEMENTS Unconsolidated Statement
Financial Statements and Independent Auditor's Report. ARMBUSINESSBANK Closed Joint Stock Company. 31 December 2015
 Financial Statements and Independent Auditor's Report ARMBUSINESSBANK Closed Joint Stock Company ARMBUSINESSBANK Closed Joint Stock Company Contents Page Independent auditor s report 1 Statement of profit
Georgian Leasing Company LLC Consolidated financial statements
 Consolidated financial statements For the year ended 31 December 2015 together with the independent auditors report Consolidated financial statements Contents Independent auditors report Consolidated statement
PUBLIC JOINT-STOCK COMPANY JOINT STOCK BANK UKRGASBANK
 PUBLIC JOINT-STOCK COMPANY Financial statements for the year ended 2017 Together with independent auditor s report Contents Independent auditor s report Statement of financial position... 1 Statement of
UNITED BANK FOR AFRICA PLC
 Consolidated Financial Statements for the three months ended 31 March 2015 NOTES TO THE FINANCIAL STATEMENTS UNITED BANK FOR AFRICA PLC SIGNIFICANT ACCOUNTING POLICIES 1 Reporting entity United Bank for
FIDELITY BANK PLC CONDENSED UNAUDITED FINANCIAL STATEMENTS FOR THE PERIOD ENDED
 FIDELITY BANK PLC CONDENSED UNAUDITED FINANCIAL STATEMENTS FOR THE PERIOD ENDED SEPTEMBER 30 2016 FIDELITY BANK PLC Table of contents for the period ended September 30 2016 CONTENTS Page Income Statement
Ameriabank cjsc. Financial Statements For the second quarter of 2016
 Financial Statements For the second quarter of Contents Statement of profit or loss and other comprehensive income... 3 Statement of financial position... 4 Statement of cash flows... 5 Statement of changes
Bank Muscat (SAOG) NOTES TO THE CONSOLIDATED FINANCIAL STATEMENTS YEAR ENDED 31 DECEMBER 2012
 NOTES TO THE CONSOLIDATED FINANCIAL STATEMENTS YEAR ENDED 31 DECEMBER 2012") YEAR ENDED 1 LEGAL STATUS AND PRINCIPAL ACTIVITIES Bank Muscat (SAOG) (the Bank or the Parent Company) is a joint stock company incorporated in the Sultanate of Oman and is engaged in commercial and investment
YEAR ENDED 1 LEGAL STATUS AND PRINCIPAL ACTIVITIES Bank Muscat (SAOG) (the Bank or the Parent Company) is a joint stock company incorporated in the Sultanate of Oman and is engaged in commercial and investment
St. Kitts-Nevis-Anguilla National Bank Limited. Separate Financial Statements June 30, 2017 (expressed in Eastern Caribbean dollars)
") St. Kitts-Nevis-Anguilla National Bank Limited Separate Financial Statements (expressed in Eastern Caribbean dollars) Separate Statement of Financial Position As at (expressed in Eastern Caribbean
St. Kitts-Nevis-Anguilla National Bank Limited Separate Financial Statements (expressed in Eastern Caribbean dollars) Separate Statement of Financial Position As at (expressed in Eastern Caribbean
JSC «AsiaСredit Bank (АзияКредит Банк)» Financial Statements for the year ended 31 December 2010
» Financial Statements for the year ended 31 December 2010") JSC «AsiaСredit Bank (АзияКредит Банк)» Financial Statements for the year ended 31 December Contents Independent Auditors Report Statement of Comprehensive Income 5 Statement of Financial Position 6 Statement
JSC «AsiaСredit Bank (АзияКредит Банк)» Financial Statements for the year ended 31 December Contents Independent Auditors Report Statement of Comprehensive Income 5 Statement of Financial Position 6 Statement
BANK VTB (AZERBAIJAN) OPEN JOINT STOCK COMPANY
 OPEN JOINT STOCK COMPANY") BANK VTB (AZERBAIJAN) OPEN JOINT STOCK COMPANY The International Financial Reporting Standards Financial Statements and Independent Auditors Report For the Year Ended 2010 TABLE OF CONTENTS Page STATEMENT
BANK VTB (AZERBAIJAN) OPEN JOINT STOCK COMPANY The International Financial Reporting Standards Financial Statements and Independent Auditors Report For the Year Ended 2010 TABLE OF CONTENTS Page STATEMENT
Notes to the Accounts
 Notes to the Accounts 1. Accounting Policies Statement of compliance The Group financial statements consolidate those of the Company and its subsidiaries (together referred to as the Group ), equity account
2.4 SUMMARY OF SIGNIFICANT ACCOUNTING POLICIES
 Franshion Properties (China) Limited Annual Report 2013 175 2.4 SUMMARY OF SIGNIFICANT ACCOUNTING POLICIES Subsidiaries A subsidiary is an entity (including a structured entity), directly or indirectly,
Financial Statements and Independent Auditor s Report. ARARATBANK open joint stock company. 31 December 2013
 Financial Statements and Independent Auditor s Report ARARATBANK open joint stock company 31 December 2013 ARARATBANK open joint stock company Contents Page Independent auditor s report 1 Statement of
UNITED BANK FOR AFRICA PLC
 UNITED BANK FOR AFRICA PLC Consolidated Financial Statements for the nine months ended 30 September 2015 UNITED BANK FOR AFRICA PLC NOTES TO THE FINANCIAL STATEMENTS UNITED BANK FOR AFRICA PLC SIGNIFICANT
YIOULA GLASSWORKS S.A. AND SUBSIDIARIES NOTES TO THE CONSOLIDATED FINANCIAL STATEMENTS SEPTEMBER 30, 2012
 1. CORPORATE INFORMATION: Yioula Glassworks S.A., a corporation formed under the laws of the Hellenic Republic (also known as Greece), οn August 5, 1959, by Messrs Kyriacos and Ioannis Voulgarakis is the
VOLKSBANK CZ, a.s. FOR THE YEAR ENDED 31 DECEMBER 2006
 VOLKSBANK CZ, a.s. REPORT OF INDEPENDENT AUDITORS AND FINANCIAL STATEMENTS (Prepared in accordance with International Financial Reporting Standards as adopted by the European Union) FOR THE YEAR ENDED
DBS BANK LTD (Incorporated in Singapore. Registration Number: E) AND ITS SUBSIDIARIES
 AND ITS SUBSIDIARIES") DBS BANK LTD (Incorporated in Singapore. Registration Number: 196800306E) AND ITS SUBSIDIARIES ANNUAL REPORT For the financial year ended 31 December 2011 Financial Statements Table of Contents Financial
DBS BANK LTD (Incorporated in Singapore. Registration Number: 196800306E) AND ITS SUBSIDIARIES ANNUAL REPORT For the financial year ended 31 December 2011 Financial Statements Table of Contents Financial
KREDOBANK Group International Financial Reporting Standards Consolidated Financial Statements and. 31 December 2014
 KREDOBANK Group International Financial Reporting Standards Consolidated Financial Statements and 31 December 2014 CONTENTS CONSOLIDATED FINANCIAL STATEMENTS Consolidated Statement of Financial Position...1
Public Joint Stock Company STATE SAVINGS BANK OF UKRAINE. Separate Financial Statements for the Year Ended 31 December 2012
 Public Joint Stock Company STATE SAVINGS BANK OF UKRAINE Separate Financial Statements for the Year Ended PUBLIC JOINT STOCK COMPANY STATE SAVINGS BANK OF UKRAINE TABLE OF CONTENTS Page STATEMENT OF MANAGEMENT
UNITED BANK FOR AFRICA PLC. Consolidated Financial Statements for the Quarter Ended 31 March 2014 (Un-audited )
") Consolidated Financial Statements for the Quarter Ended 31 March 2014 (Un-audited ) NOTES TO THE FINANCIAL STATEMENTS UNITED BANK FOR AFRICA PLC SIGNIFICANT ACCOUNTING POLICIES 1 (i) Basis of preparation
Consolidated Financial Statements for the Quarter Ended 31 March 2014 (Un-audited ) NOTES TO THE FINANCIAL STATEMENTS UNITED BANK FOR AFRICA PLC SIGNIFICANT ACCOUNTING POLICIES 1 (i) Basis of preparation
Tekstil Bankası Anonim Şirketi and Its Subsidiaries
 TABLE OF CONTENTS Page ------ Independent Auditors Report Consolidated Statement of Financial Position 1 Consolidated Statement of Comprehensive Income 2-3 Consolidated Statement of Changes in Equity 4
Independent Auditor s report to the members of Standard Chartered PLC
 Financial statements and notes Independent Auditor s report to the members of Standard Chartered PLC For the year ended 31 December We have audited the financial statements of the Group (Standard Chartered
UBA CAPITAL PLC. Un-audited results for half year ended 30 June 2014
 Un-audited results for half year ended 30 June 2014 Consolidated and Separate Statement of Comprehensive Income Half year ended 30 June 2014 Notes 30th June 2014 30th June 2013 Gross Earnings 2,258,102
PJSC CB PRIVATBANK Separate financial statements and Independent Auditor's Report 31 December Translation from Ukrainian original
 PJSC CB PRIVATBANK Separate financial statements and Independent Auditor's Report 31 December 2016 CONTENTS INDEPENDENT AUDITOR'S REPORT SEPARATE FINANCIAL STATEMENTS Separate Statement of Financial Position.....................................................................................................................1
auditor s opinion on the consolidated financial statements
 financial part auditor s opinion on the consolidated financial statements Independent Auditor s Report to the Shareholders of Československá obchodní banka, a. s. We have audited the accompanying consolidated
Universal Investment Bank AD Skopje. Financial Statements for the year ended 31 December 2007
 for the year ended 31 December 2007 Contents Auditors' report Balance sheet 1 Income statement 2 Statement of changes in equity 3 Statement of cash flows 4 Notes to the financial statement 5 Income
Joint Stock Company The State Export-Import Bank of Ukraine Consolidated Financial Statements
 Joint Stock Company The State Export-Import Bank of Ukraine Consolidated Financial Statements Year ended 31 December 2004 Together with Independent Auditors Report 2004 Consolidated Financial Statements
UNITED BANK FOR AFRICA PLC. Consolidated and Separate Financial Statements for the 6 months ended 30 June 2013 (Un-audited)
") UNITED BANK FOR AFRICA PLC Consolidated and Separate Financial Statements for the 6 months ended 30 June 2013 (Un-audited) UNITED BANK FOR AFRICA PLC SIGNIFICANT ACCOUNTING POLICIES 1 Reporting entity
UNITED BANK FOR AFRICA PLC Consolidated and Separate Financial Statements for the 6 months ended 30 June 2013 (Un-audited) UNITED BANK FOR AFRICA PLC SIGNIFICANT ACCOUNTING POLICIES 1 Reporting entity
Ardshinbank CJSC. Interim Financial Statements for the period ended 30 September 2016
 Interim Financial Statements for the period ended 30 September 2016 Contents Interim statement of profit or loss and other comprehensive income... 3 Interim statement of financial position... 4 Interim
Artsakhbank cjsc. Financial Statements for the year ended 31 December 2013
 Financial Statements for the year ended 31 December Artslllcllbllllk cjsc Stateml!nt ofprofit or Loss Clnd Other Comprehensive income for the year ended 31 December 20 13 Notes AMD'OOO AMD'OOO Interest
Abbreviated financial statement of Bank Zachodni WBK SA
 Abbreviated financial statement of Bank Zachodni WBK SA 1. Income statement of Bank Zachodni WBK S.A... 3 2. Balance sheet of Bank Zachodni WBK S.A.... 4 3. Movements on equity of Bank Zachodni WBK S.A...
Ameriabank CJSC Financial statements
 Ameriabank CJSC Financial statements for the year ended 31 December together with independent auditor s report Ameriabank CJSC Financial statements Contents Independent auditor s report Statement of comprehensive
Accounting policies. 1. Introduction. 2. Basis of presentation. 3. Consolidation
 2 202 FirstRand Group annual financial statements Accounting policies 1. Introduction FirstRand Limited ( the Group ) is an integrated financial services company consisting of banking, insurance and asset
Activities report for the Year from 1 Jan.2010 to 30 June.2010
 Activities report for the Year from 1 Jan.2010 to 30 June.2010 The following are the significant variances for the Balance Sheet and Income Statement as of June 30,2010 compared to December 31,2009 Balance
Georgian Leasing Company LLC Consolidated financial statements
 Consolidated financial statements For the year ended 31 December together with the independent auditor s report Consolidated financial statements Contents Independent auditor s report Consolidated statement
Statement of profit or loss for the year ended 31 March 2018 (Expressed in United States dollars)
") Statement of profit or loss for the year ended 31 March 2018 (Expressed in United States dollars) Note Interest income 4(a) 32,407,110 29,988,115 Interest expense 4(b) (9,879,516) (7,319,963) Net interest
Statement of profit or loss for the year ended 31 March 2018 (Expressed in United States dollars) Note Interest income 4(a) 32,407,110 29,988,115 Interest expense 4(b) (9,879,516) (7,319,963) Net interest
BANKDHOFAR S.A.O.G. Report and financial statements. 31 December Registered and principal place of business:
 Report and financial statements 31 December 2012 Registered and principal place of business: BankDhofar S.A.O.G Central Business District P O Box 1507 Ruwi 112 Sultanate of Oman BANKDHOFAR SAOG Report
Ameriabank cjsc. Financial Statements for the Year Ended 31 December 2009
 Financial Statements for the Year Ended 31 December Contents Independent Auditors Report... 3 Statement of comprehensive income... 4 Statement of financial position... 5 Statement of cash flows... 6 Statement
DIAMOND BANK PLC CONSOLIDATED FINANCIAL STATEMENT FOR THE QUARTER ENDED 31 MARCH 2013
 DIAMOND BANK PLC CONSOLIDATED FINANCIAL STATEMENT FOR THE QUARTER ENDED 31 MARCH 2013 1. General information Diamond Bank Plc (the "Bank") was incorporated in Nigeria as a private limited liability company
Consolidated Interim Financial Statements
 M K B B a n k Z r t. G r o u p 10 011 922 641 911 400 statistic code Consolidated Interim Financial Statements Prepared under International Financial Reporting Standards as adopted by the EU Budapest,
S.A.E Consolidated Balance Sheet In Jun. 30, 2010
 S.A.E Consolidated Balance Sheet In Jun. 30, 2010 Assets:- Note No. Jun. 30, 2010 Dec. 31, 2009 (Restated) - Cash and Due From Central Bank (15) 4,444,111,709 4,179,256,489 - Due From Banks (16) 7,450,054,044
CENTER-INVEST BANK GROUP
 CENTER-INVEST BANK GROUP International Financial Reporting Standards Consolidated Financial Statements and Independent Auditor s Report 31 December 2014 CONTENTS INDEPENDENT AUDITOR S REPORT CONSOLIDATED
Joint Stock Company Nordea Bank. International Financial Reporting Standards Consolidated Financial Statements and Independent Auditors Report
 Joint Stock Company Nordea Bank International Financial Reporting Standards Consolidated Financial Statements and Independent Auditors Report 31 December 2015 CONTENTS AUDITORS REPORT CONSOLIDATED FINANCIAL
JSC ASIAСREDIT BANK (АЗИЯКРЕДИТ БАНК) Financial Statements for the year ended 31 December 2012
 Financial Statements for the year ended 31 December 2012") JSC ASIAСREDIT BANK (АЗИЯКРЕДИТ БАНК) Financial Statements for the year ended 31 December CONTENTS STATEMENT OF MANAGEMENT S RESPONSIBILITIES FOR THE PREPARATION AND APPROVAL OF THE FINANCIAL STATEMENTS
JSC ASIAСREDIT BANK (АЗИЯКРЕДИТ БАНК) Financial Statements for the year ended 31 December CONTENTS STATEMENT OF MANAGEMENT S RESPONSIBILITIES FOR THE PREPARATION AND APPROVAL OF THE FINANCIAL STATEMENTS
FFA PRIVATE BANK SAL CONSOLIDATED FINANCIAL STATEMENTS 31 DECEMBER 2014
 CONSOLIDATED FINANCIAL STATEMENTS 31 DECEMBER 2014 CONSOLIDATED INCOME STATEMENT For the year ended Notes Interest and similar income 8,198,628 4,826,609 Interest and similar expense (2,821,045) (1,146,822)
Stanbic IBTC Bank PLC Unaudited interim group financial statements 31 March
 Stanbic IBTC PLC Unaudited interim group financial ch RC 125097 Table of contents Building for the future, with our range of products and services at the heart of our strategy Providing innovative solutions
Financial Statements. Separate Financials. Consolidated Financials. Auditors Report 54. Balance Sheet 04. Income Statement 57
 years of excellence Financial Statements Separate Financials Auditors Report 02 Balance Sheet 04 Income Statement 05 Cash Flow 06 Changes in Shareholder s Equity 08 Notes 10 Consolidated Financials Auditors
UNITED BANK FOR AFRICA PLC
 UNITED BANK FOR AFRICA PLC Condensed Consolidated Financial Statements for the nine months ended 30 September 2017 Condensed Consolidated Statements of Comprehensive Income For the nine months ended 30
OPEN JOINT STOCK COMPANY BANK OF BAKU
 OPEN JOINT STOCK COMPANY BANK OF BAKU Consolidated Financial Statements For the Year Ended * *Note: The audit opinion to the financial statements as of is not ready due to technical reasons. Thus, the
ERSTE BANK A.D., NOVI SAD FINANCIAL STATEMENTS FOR THE YEAR ENDED 31 DECEMBER 2014
 FINANCIAL STATEMENTS FOR THE YEAR ENDED 31 DECEMBER 2014 ERSTE BANK a.d. NOVI SAD CONTENT Page Independent Auditors' Report 1 Income statement for the year ended 31 December 2014 2 Statement of comprehensive
BYBLOS BANK SAL CONSOLIDATED FINANCIAL STATEMENTS
 BYBLOS BANK SAL CONSOLIDATED FINANCIAL STATEMENTS 31 DECEMBER 2009 BYBLOS BANK SAL CONSOLIDATED FINANCIAL STATEMENTS 1) Auditors' report; 2) Consolidated income statement for the year ended ; 3) Consolidated
Notes to the Consolidated Financial Statements 6-48
 Tekstil Bankası Anonim Şirketi Consolidated Financial Statements Together With Report of Independent Auditors TABLE OF CONTENTS Independent Auditors Report 1 Consolidated Balance Sheet 2 Consolidated Income
Arab Banking Corporation (B.S.C.) CONSOLIDATED FINANCIAL STATEMENTS
 CONSOLIDATED FINANCIAL STATEMENTS") CONSOLIDATED FINANCIAL STATEMENTS 31 DECEMBER 2014 CONSOLIDATED STATEMENT OF COMPREHENSIVE INCOME Year ended Note PROFIT FOR THE YEAR 318 297 Other comprehensive income: Other comprehensive income
CONSOLIDATED FINANCIAL STATEMENTS 31 DECEMBER 2014 CONSOLIDATED STATEMENT OF COMPREHENSIVE INCOME Year ended Note PROFIT FOR THE YEAR 318 297 Other comprehensive income: Other comprehensive income
Intesa Sanpaolo Banka d.d. Bosna i Hercegovina
 Intesa Sanpaolo Banka d.d. Bosna i Hercegovina Financial Statements as at 2016 Intesa Sanpaolo Banka, d.d. Financial statements as at 2016 Contents Management Board s Report 2 Responsibilities of the Management