Charoen Pokphand Foods Plc.
|
|
|
- Ronald Cunningham
- 5 years ago
- Views:
Transcription

1 Charoen Pokphand Foods Plc. 9M16 Creating quality and delightful dishes for every customer RESULTS BRIEFING November 14, 2016
2 Contents 1 Kitchen of The World Business Overview 9M16 Results Briefing Financial Highlights Future Plan Appendix A: 3Yr Historical Results B: Product & Raw Materials Price Trend C: Product Sample & Retail Outlet Format D: Highlights - 3Q16 Results E: Export Destination F: M&A in
3 CPF Investment Highlights 2 One of the World s leading listed animal feed manufacturers, swine producers, and shrimp integrated business Diversified portfolio with operations in 14 countries catered to over 3 billion population, and exports to more than 30 countries Multi-species of animal proteins (mainly poultry, swine and shrimp) Member of SET 50 : Ticker CPF under Agro & Food Industry Sector Member of Dow Jones Sustainability Index (Emerging Markets) Growth Platform : Globalization by establishing operations in foreign markets, including M&A : Value-added business by expanding portfolio towards more value added and innovated products to serve rising new market demands
4 Company Facts (as of September 30, 2016) 3 Vision Portfolio : Kitchen of the World 4 Listed Investments onboard (HKSE:00043, HKSE:3839, TWSE: 1215, SET:CPALL) 24 Series of Debentures listed on Thai Bond Market Association TBMA Market Cap : THB 229,028 million or ~USD6.5 billion Highlights FY15 Sales : THB421 billion or ~USD 12.0 billion Capital (as of November 11, 2016) : 7,743 million shares (paid-up), par value of THB.1.00 per share TH- Export, 6% TH- Domestic, 34% By Operations Book Value : THB16.61* per share (as of September 30, 2016) Shareholders : Charoen Pokphand Group Ltd. 45.4% of Paid-Up Capital (as of August 26, 2016) Credit Rating : A+ with Stable Outlook (as of March 31, 2016) Livestock, 85% Aquaculture, 15% International, 60% By Business By Product Feed, 52% Food, 12% Farm, 36% Note: USD1 = THB (as of November 11, 2016) * Exclude Non-Controlling Interests (NCI)
5 CPF Operational Structure 4 9M16 : Sales: Net Profit: THB 344,839 m THB 12,965 m CPF Thailand 39% of Sales 61% of Sales CPF International Associates & Joint Ventures 33% of Sales Domestic 6% of Sales Export 39% of sales CPP- HKSE:43 (50.43%)* 22% of sales 17% of sales China Vietnam 22% of sales India (99.99%) TW:1215 CPE Taiwan (32.67%) Turkey (100.00%) Russia (99.99%) RBPI (75.82%) S&W (79.99%) SET: CP ALL (34.70%) CPH (Malaysia) (49.75%) CP Aqua (India) (31.70%) Arbor (49.98%) Ross (49.99%) CP Cambodia (100.00%) Philippines (99.99%) Nava84 (25.00%) CP Meiji (59.99%) Malaysia (99.99%) BHJ Kalino Food AB (15.08%) China (Aqua) (100.00%) CTEI (50.43%) Group of CPP s Associate Companies & Joint Ventures Laos (99.99%) Note: % represent percent holding by CPF both direct and indirect * Based on total issued shares UK (57.52%) Belgium (Tops Food) Sri Lanka (Norfolk Foods) (84.08%) (80.00%)
 Feedmilling Breeding Farming Processing Adding Value Feed Breeder Live Animal Fresh Meat Food & Ready Meal Farm Food &")
6 Vertically Integrated Business Model 5 Integrated operating platform for safety & quality control Livestock (Broiler, Layer, Swine, Duck) and aquaculture (Shrimp & Fish) Feedmilling Breeding Farming Processing Adding Value Feed Breeder Live Animal Fresh Meat Food & Ready Meal Farm Food & Retail Outlets

7 Operations and investment in 14 countries catered to > 3 billion population Export to more than 30 countries across 5 continents with 17 representative offices Tanzania : Pilot Project CPF Leading Footprints 6 UK Food processing plant Food Kiosks Turkey Chicken integrated business Belgium Food processing plant India Chicken integrated business Aquatic feed China - CPP Russia Livestock feed Swine farming Chicken integrated business Livestock and aquaculture feed Aquaculture farming Food processing plant Thailand Livestock and aquaculture integrated businesses Sri Lanka Food processing plant Malaysia Livestock and aquaculture integrated business Livestock integrated business Vietnam - CPP Livestock and aquaculture integrated businesses Cambodia Taiwan Laos Livestock integrated business Philippines Livestock and aquaculture feed and farming Livestock integrated business
8 9M16 Summary 7 Challenges Turnaround in shrimp business Global and Thailand economic uncertainties The impact of natural disasters (i.e. drought, climate changes, floods) Latest Activities Finance Issuance of THB 16,000 m debenture by CPF Thailand on Jan, 2016 (@ Avg. 3.65%) Issuance of THB 9,060 m debenture on Apr, 2016 (@ Avg. 3.25%) Issuance of THB 13,000 m debenture by CPF Thailand on July, 2016 (@ Avg. 3.34%) Issuance of 0.5% exchangeable bonds ( EB ) on Sep 22, 2016 (USD 300 m, EB due 2021) Acquisition Acquired 100% in Hubei Chai Tai Co., Ltd on May 11, 2016 (approx. THB 561 m) Announcing the acquisition of 30% in Banner Infant Dairy Products on June 29, 2016 (approx. THB 3,080 m) Acquired 12% in Qingdao Yi Bang on July 2016 (approx. THB 1,405 m) Acquired 80% in Norfolk Foods in Sri Lanka on July 14, 2016 (approx. THB 141 m) Acquired 60% in Foodfellas in UK on October 15, 2016 (approx. THB 538 m) Acquired 70% in Fujian Sumpo on October 21, 2016 (approx. THB 1,688 m)
9 9M16 Results Highlights 8 Revenue increased 11% y-o-y to THB 344,839m in 9M16 Gross Profit increased 33% y-o-y to THB 57,021m in 9M16, Gross profit margin increased from 13.8% in 9M15 to 16.5% in 9M16. EBITDA increased 85% y-o-y from THB 19,189m in 9M15 to THB 35,489m in 9M16. (EBITDA margin increased from 6.1% in 9M15 to 10.3% in 9M16) Net profit increased 36% y-o-y from THB 9,510m to THB 12,965m in 9M16. (Net profit margin increased from 3.0% in 9M15 to 3.8% in 9M16)
10 9M16: Sales & Gross Profit Margin by Business 9 In THB, m 9M15 9M16 311, % 344, % +5% 159, , , , % +0% 19,043 24,236 29,322 29,426 Thai-Livestock Thai-Aqua Overseas-Livestock Overseas-Aqua TOTAL GPM 12.4% 16.3% 4.9% 13.8% 15.8% 17.8% 13.7% 11.9% 13.8% 16.5% OPM 3.4% 7.4% -8.1% 5.6% 5.6% 9.0% 4.7% 4.9% 4.2% 7.9%
11 9M16: Consolidated Sales Structure by Business 10 Sales Breakdown Livestock Aqualculture Total 9M15 9M16 %Change 9M15 9M16 %Change 9M15 9M16 %Change Thailand 103, ,815 5% 19,043 24,237 27% 122, ,052 8% Domestic 88,893 91,931 3% 15,566 20,812 34% 104, ,743 8% Export 14,772 16,884 14% 3,477 3,425-1% 18,249 20,309 11% China 71,336 69,308-3% 8,599 7,625-11% 79,935 76,933-4% Vietnam 44,403 51,957 17% 6,832 6,575-4% 51,235 58,532 14% Others 44,010 61,096 39% 13,891 15,226 10% 57,901 76,322 32% Total 263, ,176 11% 48,365 53,662 11% 311, ,839 11% % of Total Sales 84% 84% 16% 16% 100% 100%
12 9M16: Consolidated Sales by Products 11 Sales Breakdown by Products Feed Farm Food Total 9M15 9M16 %Change 9M15 9M16 %Change 9M15 9M16 %Change 9M15 9M16 %Change Thailand 38,171 36,539-4% 54,198 65,113 20% 30,339 31,401 4% 122, ,053 8% Domestic 37,979 36,433-4% 50,074 59,893 20% 16,406 16,418 0% 104, ,744 8% Export % 4,124 5,220 27% 13,933 14,983 8% 18,249 20,309 11% China 79,935 74,744-6% 0 0 0% 0 2, % 79,935 76,933-4% Vietnam 21,449 22,873 7% 28,209 34,270 21% 1,577 1,389-12% 51,235 58,532 14% Others 25,083 29,409 17% 28,469 42,067 48% 4,349 4,845 11% 57,901 76,321 32% Total 164, ,565-1% 110, ,450 28% 36,265 39,824 10% 311, ,839 11% Feed, 27% Food, 24% Farm, 49% Food, 3% Feed, 97% Feed, 39% Food, 2% Farm, 59% Feed, 39% Food, 6% 9M16 Thailand 9M16 China 9M16 Vietnam 9M16 Others Farm, 55% Feed, 47% Food, 12% 9M16 Total Farm, 41%
13 9M16: Consolidated Income Statement Highlight 12 Quarter 1 Quarter 2 Quarter 3 9 Months %Chg %Chg %Chg %Chg. Net sales 96, ,513 10% 103, ,776 13% 111, ,549 10% 311, ,839 11% Gross Profit Margin (%) 12.6% 15.6% 13.5% 17.4% 15.0% 16.5% 13.8% 16.5% EBITDA 5,029 10, % 5,542 13, % 8,618 12,308 43% 19,189 35,489 85% EBITDA Margin 5.2% 9.5% 5.3% 11.2% 7.7% 10.0% 6.2% 10.3% EBIT 2,467 6, % 2,772 9, % 5,667 8,985 59% 10,906 25, % EBIT Margin 2.6% 6.6% 2.7% 8.3% 5.1% 7.3% 3.5% 7.4% Share in Profit of Associates 1,267 1,553 23% 1,230 1,665 35% 1,238 1,689 36% 3,735 4,907 31% Financial Costs (2,174) (2,600) 20% (2,364) (2,587) 9% (2,836) (2,558) -10% (7,375) (7,745) 5% Income Taxes Expense (612) (1,695) 177% (757) (3,120) 312% (1,216) (1,728) 42% (2,585) (6,543) 153% NET PROFIT 2,956 3,764 27% 2,983 4,016 35% 3,571 5,184 45% 9,510 12,965 36% (2) EPS (THB) (1) # of capital shares 7,388 7,388 7,388 7,388 7,388 7,388 7,388 7,388 Paid-Up Capital 7,743 7,743 7,743 7,743 7,743 7,743 7,743 7,743 Dividend (THB/Share) Note: (1) # of capital shares = No. of the Weighted-avg. shares (2) Including adjustment from the change in tax calculation of of THB 1,245 m. Please see more detail in Note 17 to Financial statements of 9M 2016

14 Financial Status 13 Interest Bearing Debt : THB 263,928 m Net Debt to Equity S/T Loan, 27% Current Portion, 6% Bond, 44% Total Equity Net Debt Net Debt to Equity ,377 Unit : THB, M , ,049 L/T Loan, 23% 163, , , M16 Cost of Debts M % 4.14% 4.12% Remark : Net Debt = Interest Bearing Debt - Cash and Cash Equivalents Bond Rating A+ with Stable Outlook by Tris Rating Co., Ltd
 Investment 5Yr Capex of THB 50,000 million (excluding CPP) ; cautiously investment for growth Thailand : add value to existing businesses")
15 Y2016 Key Highlights 14 Target Growth Sales Within a range of +10% to +15% Key Drivers Improvement of shrimp business Improvement of meat price Slightly lower raw material costs Expansion of existing international operations Mergers and Acquisitions (M&A) Investment 5Yr Capex of THB 50,000 million (excluding CPP) ; cautiously investment for growth Thailand : add value to existing businesses International : diversification & market expansion
16 Appendix A: Highlights : 3Yr Historical Results
17 Consolidated Income Statement Highlight 16 Full Year % Change 2015 % Change Net sales 389, ,039 9% 421,355-1% Gross Profit Margin (%) 10.0% 13.4% 13.8% Gain on fair value adjustment EBITDA 13,039 27, % 26,433-4% EBIT 4,495 17, % 14,926-15% Share in Profit of Associates 4,947 4,869-2% 5,221 7% Financial Costs (7,937) (8,903) 12% (9,614) 8% Income Taxes Expense (133) (3,649) 2,644% (3,654) 0% Gain / (Loss) from FX (219) (356) 61% 1, % NET PROFIT 7,065 10,562 49% 11,059 5% EPS (THB) # of capital shares ** 7,388 7,388 7,388 Paid-Up Capital 7,743 7,743 7,743 Dividend (THB/Share) Note: ** # of capital shares = No. of the Weighted-avg. shares
18 Gross Profit Margin & Operating Profit Margin % Thai-Livestock GPM OPM 30.0% Thai-Aqua GPM OPM 18.0% 16.0% 14.0% 12.0% 10.0% 8.0% 6.0% 4.0% 2.0% 0.0% 16.4% 17.3% 16.5% 8.8% 9.4% 8.0% 13.4% 1.7% 10.8% 11.9% 3.7% 1.5% 16.8% 16.5% 15.6% 14.3% 13.5% 4.9% 2.2% 6.8% 7.7% 7.6% Q1'14 Q2'14 Q3'14 Q4'14 Q1'15 Q2'15 Q3'15 Q4'15 Q1'16 Q2'16 Q3' % 20.0% 15.0% 10.0% 5.0% 0.0% -5.0% -10.0% -15.0% -20.0% -7.5% -6.4% -16.3%-16.2% 2.4% -5.6% -3.0% -3.2% 3.0% -14.5%-14.5% -13.4% 12.6% 8.5% 0.6% -1.1% 2.3% 16.5% 11.9% 12.6% 10.0% 3.7% Q1'14 Q2'14 Q3'14 Q4'14 Q1'15 Q2'15 Q3'15 Q4'15 Q1'16 Q2'16 Q3' % Oversea-Livestock GPM OPM 20.0% Oversea-Aqua GPM OPM 20.0% 15.0% 10.0% 5.0% 17.0% 14.0% 14.9%15.9% 15.7% 15.8% 15.8% 15.3% 14.2% 4.6% 19.5% 16.9% 10.5% 8.7% 6.1% 6.7% 5.2% 5.9% 5.4% 5.6% 6.7% 7.7% 15.0% 10.0% 5.0% 0.0% 15.2% 14.2% 12.3% 12.6% 12.8% 11.4% 11.5% 9.8% 8.8% 8.0% 7.9% 6.9% 6.6% 5.9% 7.3% 4.1% 5.7% 4.2% 4.2% 0.0% Q1'14 Q2'14 Q3'14 Q4'14 Q1'15 Q2'15 Q3'15 Q4'15 Q1'16 Q2'16 Q3'16-5.0% -0.8% -1.8% -3.6% Q1'14 Q2'14 Q3'14 Q4'14 Q1'15 Q2'15 Q3'15 Q4'15 Q1'16 Q2'16 Q3'16
19 CAPEX & EBITDA 18 CAPEX EBITDA Unit: THB, M CPP CPF Unit: THB, M EBITDA Margin% 40, % 22,513 25,550 25,398 35,000 35, % 16.0% 30,000 8,215 10,561 9,446 14,403 25,000 27,513 26, % 14.0% 12.0% 20, % 5,493 15, % 6.3% 8.0% 14,298 14,989 15,952 10,000 13, % 6.0% 4.0% 8,910 5, % - 0.0% M M16
20 Before Tax Consolidated Net Profit & ROE & D/EBITDA 19 Net Profit D/EBITDA & ROE Unit: THB, M D/EBITDA Ratio (interest Bearing Debt) Gain on fair value adjustment on investment in associates Divestment and Dividend Equity (Share in Profit of Associates) EBIT CAGR +25% ,178 4, ,911 4, M16 * 8,249 4,947 4,869 17,548 5,221 14,926 25,631 ROE 5.5% 6.4% 6.4% 9.5% 4, M M16 * NP: 7,065 10,562 11,059 12,965 Note : 2015 Including gain on fair value adjustment of investments in associate : * Annualized basis
21 Consolidated Net Profit - Quarterly 20 Unit : THB, M 1Q 2Q 3Q 4Q 5,184 2,649 3,546 4,158 2,956 2,983 3,571 4,016 3,764 1,026 1,636 1,754 2, , * Q15 Gain on fair value adjustment of investments in associates = 236 MB : * Including restate of IFRS basis
22 EPS & Dividends per Share 21 Earnings Per Share Dividends Unit : THB Per Share Unit : THB Per Share CAGR +25% Dividend Policy Semi Annually, minimum of 50% of annual net profit (The Company Statement Only) CAGR +22% M M16
23 Appendix B: Product & Raw Materials Price Trend Kitchen of The World
24 Average Farm Prices Thailand 23 Thailand s Broiler price (Baht/kg) Average Price M % Chg -13% +2% Q14 2Q14 3Q14 4Q14 1Q15 2Q15 3Q15 4Q15 1Q16 2Q16 3Q16 Currrent Price Thailand s Pork price (Baht/kg) Average Price M % Chg -12% +5% Q14 2Q14 3Q14 4Q14 1Q15 2Q15 3Q15 4Q15 1Q16 2Q16 3Q16 Current Price Source: CPF
25 Average Farm Prices Thailand 24 Thailand s Fresh egg price (Baht/piece) Average Price M % Chg -12% +19% 1.0 1Q14 2Q14 3Q14 4Q14 1Q15 2Q15 3Q15 4Q15 1Q16 2Q16 3Q16 Currrent Price Thailand s White shrimp price (Size 70) Average Price M % Chg -21% +5% 0.0 1Q14 2Q14 3Q14 4Q14 1Q15 2Q15 3Q15 4Q15 1Q16 2Q16 3Q16 Currrent Price Source: CPF
 30.0 2014 2015 2016 25.0 20.0 20.9 21.5 20.8 20.3 19.4 18.4 17.2 17.")
26 Average Raw Material Prices Thailand 25 Thailand s Corn price (Baht/kg) Average Price M % Chg +3% -9% 0.0 1Q14 2Q14 3Q14 4Q14 1Q15 2Q15 3Q15 4Q15 1Q16 2Q16 3Q16 Currrent Price Thailand s Soybean Meal price (Baht/kg) Average Price M % Chg -14% -3% Q14 2Q14 3Q14 4Q14 1Q15 2Q15 3Q15 4Q15 1Q16 2Q16 3Q16 Currrent Price Source: CPF
27 Average Farm Prices Thailand Thailand s Fishmeal price (Baht/kg) Average Price M % Chg +12% -8% Q14 2Q14 3Q14 4Q14 1Q15 2Q15 3Q15 4Q15 1Q16 2Q16 3Q16 Currrent Price Source: CPF
28 Vietnam: Average Market Price and Major Feed Raw Materials 27 40,000 30,000 20,000 31,808 32,312 30,032 27,355 25,698 26,569 27,341 24,988 24,598 23,401 23,363 1Q14 2Q14 3Q14 4Q14 1Q15 2Q15 3Q15 4Q15 1Q16 2Q16 3Q16 Broiler (VND/kg) 60,000 50,000 40,000 30,000 10,000 8,000 6,000 4,000 2,000 49,471 51,618 49,309 50,930 45,624 45,475 46,734 46,909 44,431 45,730 47,370 1Q14 2Q14 3Q14 4Q14 1Q15 2Q15 3Q15 4Q15 1Q16 2Q16 3Q16 6,052 6,209 6,055 5,673 5,725 5,790 5,500 5,166 5,163 5,500 4,817 1Q14 2Q14 3Q14 4Q14 1Q15 2Q15 3Q15 4Q15 1Q16 2Q16 3Q16 Swine (VND/kg) Corn (VND/kg) 20,000 15,000 10,000 13,505 13,888 13,356 10,386 10,577 10,793 9,749 9,354 9,520 8,913 10,097 Soybean Meal (VND/kg) 5,000 1Q14 2Q14 3Q14 4Q14 1Q15 2Q15 3Q15 4Q15 1Q16 2Q16 3Q16 Source: CPF VND 1 = THB AVG. 2 month in 3Q16
29 Turkey: Average Market Price and Major Feed Raw Materials Broiler (TRY/kg) Q14 2Q14 3Q14 4Q14 1Q15 2Q15 3Q15 4Q15 1Q16 2Q16 3Q Corn (TRY/kg) Q14 2Q14 3Q14 4Q14 1Q15 2Q15 3Q15 4Q15 1Q16 2Q16 3Q Soybean Meal (TRY/kg) Q14 2Q14 3Q14 4Q14 1Q15 2Q15 3Q15 4Q15 1Q16 2Q16 3Q16 Source: CPF TRY 1 = THB AVG. 2 month in 3Q16
30 India: Average Market Price and Major Feed Raw Materials Q14 2Q14 3Q14 4Q14 1Q15 2Q15 3Q15 4Q15 1Q16 2Q16 3Q Q14 2Q14 3Q14 4Q14 1Q15 2Q15 3Q15 4Q15 1Q16 2Q16 3Q16 Broiler (Rs/kg) Shrimp(60 pieces) (Rs/kg) Q14 2Q14 3Q14 4Q14 1Q15 2Q15 3Q15 4Q15 1Q16 2Q16 3Q Corn (Rs/kg) Q14 2Q14 3Q14 4Q14 1Q15 2Q15 3Q15 4Q15 1Q16 2Q16 3Q16 Soybean Meal (Rs/kg) Source: CPF Rs 1 = THB 0.52 AVG. 2 month in 3Q16
31 Appendix C: Product Sample & Retail Outlet Format Kitchen of The World


32 Food Retail Products 31


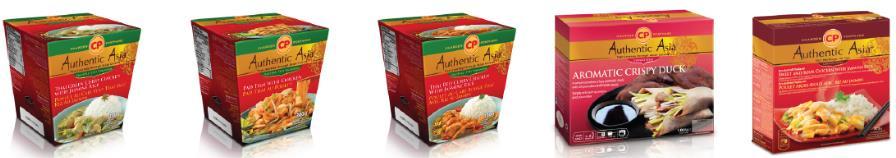

33 Food Retail Products 32


34 Food Service : Five Stars Chain 33 More Than 6,000 Outlets Five Star Chicken in Vietnam Five Star Chicken in India


35 Food Service : Chester s Outlets


36 Food Retail Outlets Stores 5 Stores


37 CP CHOZEN LIMITED Kiosks
38 Appendix D: Highlights: 3Q16 results
 Gross Profit (THB")


39 3Q16 Results Highlights 38 Consolidated Revenue (THB millions) Gross Profit (THB millions) Net Profit (THB millions) +10%Y-o-Y +20%Y-o-Y +45%Y-o-Y 111, ,549 16,827 20,217 3,571 5,184 3Q15 3Q16 3Q15 3Q16 3Q15 3Q16 Consolidated sales 13% Y-o-Y Gross profit margin Net profit margin 3Q % 3Q15 3.2% 3Q % 3Q16 4.2% 1.5% 1.0%

40 3Q16: Sales & Gross Profit Margin by Business 39 In THB, m 3Q15 3Q16 +14% 111, % 122,549 +5% 64,767 56,974 37,105 35,399 17% -1% 7,593 8,873 11,911 11,804 Thai-Livestock Thai-Aqua Overseas-Livestock Overseas-Aqua TOTAL GPM 14.3% 16.5% 12.6% 16.5% 15.8% 16.9% 15.2% 14.2% 15.0% 16.5% OPM 4.9% 7.6% 0.6% 10.0% 5.6% 7.7% 9.8% 7.3% 5.5% 7.8%
41 3Q16: Consolidated Sales Structure by Business 40 Livestock Sales Breakdown Aqualculture Total 3Q15 3Q16 %Change 3Q15 3Q16 %Change 3Q15 3Q16 %Change Thailand 35,399 37,105 5% 7,593 8,873 17% 42,992 45,978 7% Domestic 29,988 31,487 5% 6,457 7,653 19% 36,445 39,140 7% Export 5,411 5,618 4% 1,136 1,220 7% 6,547 6,838 4% China 24,842 25,937 4% 4,488 3,753-16% 29,330 29,690 1% Vietnam 15,489 18,693 21% 2,454 2,542 4% 17,943 21,235 18% Others 16,643 20,137 21% 4,969 5,509 11% 21,612 25,646 19% Total 92, ,872 10% 19,504 20,677 6% 111, ,549 10% % of Total Sales 83% 83% 17% 17% 100% 100%
42 3Q16: Consolidated Sales by Products 41 Sales Breakdown by Products Feed Farm Food Total 3Q15 3Q16 %Change 3Q15 3Q16 %Change 3Q15 3Q16 %Change 3Q15 3Q16 %Change Thailand 12,937 12,875 0% 19,537 22,489 15% 10,518 10,614 1% 42,992 45,978 7% Domestic 12,850 12,843 0% 18,127 20,777 15% 5,468 5,520 1% 36,445 39,140 7% Export % 1,410 1,712 21% 5,050 5,094 1% 6,547 6,838 4% China 29,330 28,137-4% 0 0 0% 0 1, % 29,330 29,690 1% Vietnam 7,645 8,379 10% 9,784 12,369 26% % 17,943 21,236 18% Others 9,541 10,261 8% 10,396 13,679 32% 1,675 1,704 2% 21,613 25,644 19% Total 59,453 59,652 0% 39,718 48,537 22% 12,706 14,360 13% 111, ,549 10%
43 Appendix E: Export Destination Kitchen of The World
44 9M16: Thailand Operations Export Destination 43 Asia 59% Asia 50% Others USA 3% 3% EU 35% Others USA 3% 4% EU 43% Asia EU USA Others Asia EU USA Others Farm THB 5,220 million +27% Food THB 14,983 million +8%
45 Appendix F: M&A in 2016
46 Acquisition of Hubei Chia Tai 45 Transaction Summary Announcement Date: Transaction Date: Buyer: Seller: Target: Nature of Business Transaction Rationale 11 May 2016 Chia Tai (China) Investment Co., Ltd, wholly owned subsidiary of CPP Chia Tai Food Investment Co, Ltd (CTFI) Hubei Chia Tai Co., Ltd. Feed, Farm and Processed Meat Products CPP to expand integrated business in China % Acquired 100% of equity stake Transaction Size Source of Fund THB 561 mm Internal Cash Flow of CPP Implied Valuation* P/B 1.0x (Mar 16) Shareholding Structure Pre Post CTFI 100.0% 0.0% CTI 0.0% 100.0% Key Balance Sheet Items (THB mm*) Mar 16 Total Asset 5,184 Total Liability 4,640 Total Equity 544 * P/B = 561/ THB/RMB
47 Subscription of newly issued Shares of Banner Infant Diary Products (Banner) 46 Transaction Summary Announcement Date: Transaction Date: Buyer: Issuer: 29 June 2016 Within 2016 Chia Tai (Beijing) Investment Management Co., Ltd., wholly own subsidiary of CPP Banner Infant Dairy Products Co., Ltd. # New shares: Subscribe to mm new shares Nature of Business Infant milk powder Sales 1, THB mm M 2016 Net Profit Transaction Rationale In line with CPP strategic investment % Acquired 30% of the total shares post capital increase Transaction Size THB 3,080 mm Source of Fund Internal Cash Flow of CPP Implied Valuation* P/B 2.0x (2015) Shareholding Structure Pre Post Individuals and juristic person (Total of 11) 100.0% 70.0% Chia Tai (Beijing) Investment Management 0% 30.0% % % Key Balance Sheet Items -0.2% M 2016 (THB mm*) Total Asset 442 7,944 12,737 Total Liability 295 3,548 7,672 Total Equity 147 4,396 5, % 400% 300% 200% 100% 0% -100% *P/B = (3,080/0.3)/5, THB/RMB
48 Subscription of newly issued Shares of Qingdao Yi Bang Bio-Engineering Co., Ltd. ( Qingdao Yi Bang ) 47 Transaction Summary Announcement Date: Transaction Date: Buyer: Issuer: 29 June 2016 Within June 2016 Chia Tai (China) Investment Co., Ltd. ( CTI ), wholly own subsidiary of CPP Qingdao Yi Bang Bio-Engineering Co., Ltd. # New Shares: Subscribe to 3.4 mm new shares Nature of Business Animal vaccine Sales 4,123 4,545 3, M 2016 Net Profit THB mm Transaction Rationale In line with CPP strategic investment % Acquired 12% of the total shares post capital increase Transaction Size THB 1,405 mm Source of Fund CPP s own internal resources Implied Valuation* P/E 9.6x (2015) P/B 4.2x (2015) Shareholding Structure Pre Post China Animal Health And Epidemiology Center 46.7% 41.0% Zhejiang Shenghua Biok Biology Co., Ltd. 38.0% 33.5% Individuals (10 people) 15.3% 13.5% CTI 0.0% 12.0% , % 24.5% Key Balance Sheet Items 1, % M 2016 (THB mm*) Total Asset 3,712 4,296 4,848 Total Liability 1,881 2,118 2,070 Total Equity 1,832 2,178 2,778 60% 50% 40% 30% 20% 10% *P/E = (1,405/0.12)/1,219 P/B = (1,405/0.12)/2, THB/RMB
49 Acquisition of Norfolk Foods (Private) Limited 48 Transaction Summary Announcement Date: Transaction Date: Buyer: Seller: Target: Nature of Business Transaction Rationale % Acquired Transaction Size Source of Fund Implied Valuation* 13 July 2016 Within Q CPF Investment Limited (CPFI) Expolanka Holdings PLC Mr. Habeeb Mohamed Ziauddin Mrs. Hamzathul Zareeha Ziauddin Norfolk Foods (Private) Limited Manufacture and sales of Ready-to-eat food products Enter into food business in Sri Lanka and expand production base for export 80% - 1 st tranche 20% - call/put option after 2 nd, 3 rd, 4 th year THB 141 mm (1 st tranche) 20% of 7.3x EV/EBITDA (2 nd tranche) Cash flow of CPFI P/E 14.7x (2015) P/B 1.7x (2015) Shareholding Structure Pre Post Expolanka Holdings PLC 50.0% 0.0% Key Balance Sheet Items* / / /16 6M % 9 3.9% Sales Net Profit THB mm (THB mm) 2013/ / /16 Total Asset Total Liability Total Equity % 2013/ / /16 6M % 7% 6% 5% 4% 3% 2% 1% 0% Mr. Habeeb Mohamed Ziauddin 35.6% 10.0% Mrs. Hamzathul Zareeha Ziauddin 14.4% 10.0% CPFI 0.0% 80.0% *Fiscal Year end March *P/E = (141/0.8)/12 P/B = (141/2.7528)/ THB/USD
50 Acquisition of FoodFellas Limited 49 Transaction Summary Announcement Date: Transaction Date: Buyer: Seller: Target: 15 Oct 2016 CP Foods UK Limited (CPF UK), 57.5% indirectly held by CPF 4 individuals The Foodfellas Limited (Foodfellas) Sales 2,060 1,710 1,403 THB mm M 2016 Nature of Business Transaction Rationale % Acquired 60% Transaction Size Source of Fund Implied Valuation* Food service business by importing and distribution of raw material and food products Enter into food service market in the UK and other European countries THB 538 mm P/E 8.1x (2015) P/B 3.7x (2015) Bank loans by CPF UK. Shareholding Structure Pre Post Mr. Mark Werter 27.7% 11.0% Mr. Anthony John Levy 27.7% 11.0% Mr. Jasby Ghosh 27.7% 11.0% Mr. Simon Anthony Bernstein 16.8% 7.0% CPF UK 0.0% 60.0% % % Key Balance Sheet Items* % M 2016 (THB mm) Total Asset Total Liability Total Equity *Fiscal Year end March Net Profit 8% 7% 6% 5% 4% 3% 2% 1% 0% *P/E = (538/0.6)/110 P/B = (12.275M/9,340)/ THB/GBP
51 Acquisition of Fujian Sumpo Foods Holding 50 Transaction Summary Announcement Date: Transaction Date: Buyer: 21 Oct 2016 Chia Tai (China) Investment Co., Ltd.(CTCI), subsidiary of CPP ,638 Sales 6,657 6,907 THB mm 3,125 Seller: Sumpo International Holdings Limited Longyan Huiren Investment Co., Ltd M 2016 Target: Nature of Business Transaction Rationale Fujian Sumpo Foods Holding Co., Ltd. % Acquired 70% of equity stake Transaction Size Source of Fund Feed, Chicken farming, Food Products from Chicken CPP to expand integrated business in China THB 1,688 mm Internal Cash Flow of CPP Net Profit % 0.6% % -2.3% M % 1% 0% -1% -1% -2% -2% -3% Implied Valuation* P/B 1.0x (2015) Shareholding Structure Pre Post Sumpo International Holdings Limited 94.8% 30.0% Longyan Huiren Investment Co., LTD 5.2% 0.0% CTCI 0% 70.0% Key Balance Sheet Items (THB mm) June 2016 Total Asset 4,425 4,370 4,478 Total Liability 1,962 2,083 2,174 Total Equity 2,463 2,287 2,304 *P/B = (1,688/0.7)/2, THB/RMB
 on this presentation.")
52 Disclaimer This presentation contains some information from other sources, that CPF does not make any representations regarding the use, validity, accuracy, or reliability of, or the results of the use of information, data but not limited to, all text, and images ( the Content ) on this presentation. Some content may contain forward-looking statements, that based on management s view upon the information currently available to us. These statement are subject to certain risks and uncertainties that could cause the actual results materially differed from what had been previously stated. The Content and the Forward-looking statements state within this presentation only as the date they made. The Company undertakes no responsibility on the change after that date stated herein. The material set forth herein is for informational purposes only. It should not be construed, as an offer of securities for sale. Investor Relations Office Charoen Pokphand Foods Public Company Limited 313 C.P.Tower Building, 26 th Floor, Silom Road, Bangrak, Bangkok 10500, Thailand Tel. Ms.Kobboon S. (662) / Mr.Warrawut T. (662) / Mr.Savin W. (662) Fax.(662) kobboon@cpf.co.th / warrawut@cpf.co.th / savin.won@cpf.co.th
53
Charoen Pokphand Foods Plc.
 Charoen Pokphand Foods Plc. 1Q14 RESULTS BRIEFING May 15, 2014 Content Business Overview Q12014 Results Briefing Financial Highlights Future Plan Appendix A: Product & Raw Materials Price Trend B: Product
Charoen Pokphand Foods Plc.
 Charoen Pokphand Foods Plc. 9M2014 : RESULTS BRIEFING November 10, 2014 Content Business Overview 9M2014 Results Briefing Financial Highlights Future Plan CPF Investment Highlights A leading global vertically
Charoen Pokphand Foods Plc.
 Charoen Pokphand Foods Plc. Content Quick Facts 9M13 Results September 30, 2013 Financial Status Appendix A: Product Sample & Retail Outlet Format B: Highlights: Q213 Results C: 3Yr Historical Results
Charoen Pokphand Foods PCL.
 Charoen Pokphand Foods PCL. 1H18 RESULTS Investor Presentation BRIEFING August 14, 2018 Contents Page 1 Kitchen of the World Business Overview 1H18 Financial Results Y2018 Outlook Appendix A: 3Yr Historical
Charoen Pokphand Foods Plc.
 Charoen Pokphand Foods Plc. DR Kurobuta Premium Pork W RLD 9M12: Results Briefing November 13, 2012 Content CPF in Brief 9M12 Results September 30, 2012 Financial Status Appendix A: Highlights: Q312 Results
Charoen Pokphand Foods Plc.
 Charoen Pokphand Foods Plc. Content Quick Facts 1H13 Results June 30, 2013 Financial Status Appendix A: The Acquisition of CP-Meiji and RBPI B: Product Sample & Retail Outlet Format C: Highlights: Q213
menus around The World Y2009 Results 19 February 2010
 Charoen Pokphand Foods Plc. Enjoy menus around The World Y2009 Results 19 February 2010 Content Company s Brief Overview Highlights: 2009 Results Highlights: 31 Dec 09 Financial Status Appendix A: Acquisition
The Company was listed on the Stock Exchange of Thailand on 21 December 1987.
 For the three-month and six-month periods ended 2016 (Unaudited) Note Contents 1 General information 2 Basis of preparation of the interim financial statements 3 Business combination by acquisition of
CHAROEN POKPHAND FOODS PLC
 CHAROEN POKPHAND FOODS PLC No. 21/2015 31 March 2015 Company Rating: A+ Issue Ratings: Senior unsecured A+ Outlook: Stable Company Rating History: Date Rating Outlook/Alert 20/06/14 AA- Negative 19/05/11
1 Executive Summary... 1
 Topics Page 1 Executive Summary... 1 2 Detail of the Connected Transactions 2.1 Practices and Sources of Information in the Preparation of the Opinion of the Independent Financial Advisor. 7 2.2 Overview
Charoen Pokphand Foods Public Company Limited and its Subsidiaries. Annual financial statements and Audit Report of Certified Public Accountant
 Annual financial statements and Audit Report of Certified Public Accountant For the years ended 31 December 2010 and 2009 Audit Report of Certified Public Accountant To the Shareholders of Charoen Pokphand
Charoen Pokphand Foods Public Company Limited and its Subsidiaries. Interim financial statements and Review Report of Certified Public Accountant
 Interim and Review Report of Certified Public Accountant For the three-month and nine-month periods ended 30 September 2011 Review Report of Certified Public Accountant To the Board of Directors of Charoen
The interim financial statements were authorised for issue by the executive directors on 9 November 2011.
 Note Contents 1 General information 2 Basis of preparation of the interim and new Thai Financial Reporting Standards 3 Changes in accounting policies 4 Related party transactions 5 Accounts receivable
Charoen Pokphand Foods Plc.
 Charoen Pokphand Foods Plc. Monthly Newsletter Listed on the Stock Exchange of Thailand Volume 13 Issue 4 April, 2013 CPF News : The Annual General Shareholders Meeting No.1/2013 Topics : C.P.Pokphand
Buy (from Sell) Charoen Pokphand Foods (CPF TB) Earnings Recovery To Kick In
 Charoen Pokphand Foods (CPF TB) Earnings Recovery To Kick In") May-12 Jul-12 Sep-12 Nov-12 Jan-13 Mar-13 Vol m Results Review, Charoen Pokphand Foods (CPF TB) Buy (from Sell) Consumer Non-cyclical - Food Target Price: THB38.0 Market Cap: USD7,900m Price: THB30.3 Earnings
May-12 Jul-12 Sep-12 Nov-12 Jan-13 Mar-13 Vol m Results Review, Charoen Pokphand Foods (CPF TB) Buy (from Sell) Consumer Non-cyclical - Food Target Price: THB38.0 Market Cap: USD7,900m Price: THB30.3 Earnings
IMPORTANT NOTICE NOT FOR DISTRIBUTION TO ANY ADDRESS IN THE U.S.
 IMPORTANT NOTICE NOT FOR DISTRIBUTION TO ANY ADDRESS IN THE U.S. IMPORTANT: You must read the following disclaimer before continuing. The following disclaimer applies to the offering circular (the Offering
INVESTOR PRESENTATION 9M PT Japfa Comfeed Indonesia Tbk
 INVESTOR PRESENTATION 9M 2015 PT Japfa Comfeed Indonesia Tbk Agenda Company Overview Key Investment Highlights Financial Highlights Appendix 2 Company Overview Introduction to Japfa Tbk Established vertically
Message from Executives
 Message from Executives Mr. Sooksunt Jiumjaiswanglerg Chief Executive Officer Agro Industrial Business and Co-President Mr. Dhanin Chearavanont Chairman of the Board of Directors Mr. Sukhawat Dansermsuk
Jakarta, April 5 th, Unofficial Translation
 Jakarta, April 5 th, 2017 Unofficial Translation Content Company Overview Operational Performance Financial Highlights Challenges & Strategies Appendix 2 An Introduction To Japfa Tbk Vertically integrated
Charoen Pokphand Food - CPF
 3QCY12 results seen down y-y and q-q Bloomberg Reuters CPF TB CPF.BK Report type: Company Preview Company Overview CPF is a Thailand-based company engaged in agro-industrial and integrated food businesses
BUY. Venky s India Ltd. A hen that will lay golden eggs. Venky s India Ltd Initiating Coverage. April
 Venky s India Ltd. A hen that will lay golden eggs Venky s is an integrated player in the poultry business. Venky s rears chicken which is sold as live birds to distributors and which are finally sold
The Company was listed on the Stock Exchange of Thailand on 21 December 1987.
 Note Contents 1 General information 2 Basis of preparation of the interim financial statements 3 Business combination by acquisition of shares 4 Related party transactions 5 Accounts receivable - trade
Interim Results 2019 March 2019
 Interim Results 2019 March 2019 Disclaimer This presentation may contain forward-looking statements and projections. There can be no certainty of outcome in relation to the matters to which the forward-looking
PEER GROUPS CMP MARKET CAP EPS P/E (X) P/BV(X) DIVIDEND Company Name (Rs.) Rs. in mn. (Rs.) Ratio Ratio (%)
 P/BV(X) DIVIDEND Company Name (Rs.) Rs. in mn. (Rs.) Ratio Ratio (%)") BUY CMP 469.40 Target Price 540.00 AVANTI FEEDS LIMITED Result Update (PARENT BASIS): Q2 FY16 DECEMBER 12 th 2015 ISIN: INE871C01012 Index Details Stock Data Sector Food products BSE Code 512573 Face Value
BUY CMP 469.40 Target Price 540.00 AVANTI FEEDS LIMITED Result Update (PARENT BASIS): Q2 FY16 DECEMBER 12 th 2015 ISIN: INE871C01012 Index Details Stock Data Sector Food products BSE Code 512573 Face Value
JBS S.A. August / September, 2013
 JBS S.A. August / September, 2013 Disclaimer This release contains forward-looking statements relating to the prospects of the business, estimates for operating and financial results, and those related
Thai Union Group Public Company Limited
 2Q17: Strict cost control aided operation Revenue 2Q17 sales grew by 1.2 YoY to THB 34,818mn. Soft sales growth was driven by weak market demand amid product repricing and the European currency depreciation.
Goodyear India ACCUMULATE. Performance Highlights. CMP Target Price `326 `374. 1QCY2012 Result Update Tyres. Key financials
 1QCY212 Result Update Tyres June 6, 212 Goodyear India Performance Highlights Y/E December (` cr) 1QCY212 1QCY211 % chg (yoy) 4QCY211 % chg (qoq) Net sales 331 336 (1.6) 395 (16.2) EBITDA 2 24 (18.6) 34
last YEAR. 190 / 100 kg % Placings Broiler. Jul. Jul. Jan. Jan. Oct. Oct. Oct. Apr. Apr 125%
 POULTRY MEAT Last update: EVOLUTION 185.18 last YEAR 19 / 1 kg 18 + 1.9% -.1% 175 /1 kg carcase weight 17 4. 1.1 3. 6 3 2 4 1 2 Main Producers Poultry meat production ( 1 Tonnes product weight) ( Forecasts
Disclosure of the Acquisition of Ordinary Shares of SuperDrob and a Joint Investment in a Newly Established Subsidiary
 Bor Mor Jor. Jor Por Or. 101/2016 30 December 2016 Re: Attn: Disclosure of the Acquisition of Ordinary Shares of SuperDrob and a Joint Investment in a Newly Established Subsidiary President The Stock Exchange
May Domestic Exports Imports. Volume Tonnes SW. MAT May-14 4, ,960 38, ,
 May 2014 Overview Table 1.1 Overview trends for Domestic, Export and Import trade Domestic Exports Imports Month Slaughter Pigmeat (Tonnes) Volume Tonnes SW Value $AUD (Million) Volume Tonnes SW Value
CMP Rs. 109 BSE Code NSE Symbol - AVANTI
 @hiddengemsindia May 27, 2013 Ashish Chugh s HIDDEN GEMS. in search of Market Beating Stocks Avanti Feeds Ltd. CMP Rs. 109 BSE Code 512573 NSE Symbol - AVANTI With Equity, Technical & Marketing support
Hester Biosciences Limited
 Pharmaceuticals September 24, 2012 CMP Rs. 123.5 BSE Code 524669 BSE ID HESTERBIO High/Low 1Y (Rs.) 142.5/100.0 Average Volume (3M) 2,954 Market Cap (Rs. Cr.) 70 Shareholding % Jun-12 Mar-12 Promoters
GOLDMAN SACHS 17 TH ANNUAL AGRIBUSINESS CONFERENCE. February 26, 2013
 GOLDMAN SACHS 17 TH ANNUAL AGRIBUSINESS CONFERENCE February 26, 2013 DENNIS LEATHERBY, CFO FORWARD-LOOKING STATEMENTS Certain information contained in this presentation may constitute forward-looking statements,
International Development & Investment Corporation I.D.I (HOSE- IDI)
") COMPANY UPDATE 22/12/2015 International Development & Investment Corporation I.D.I (HOSE- IDI) STRONG GROWTH THANKS TO SOARING EXPORTS TO CHINA One of Vietnam s leading Pangasius fillet processing companies,
COMPANY UPDATE 22/12/2015 International Development & Investment Corporation I.D.I (HOSE- IDI) STRONG GROWTH THANKS TO SOARING EXPORTS TO CHINA One of Vietnam s leading Pangasius fillet processing companies,
CCL Products BUY. Performance Update. CMP Target Price `278 `360. 3QFY2018 Result Update Coffee. Historical share price chart.
 Feb-15 May-15 Aug-15 Oct-15 Jan-16 Apr-16 Jul-16 Oct-16 Jan-17 Apr-17 Jul-17 Oct-17 Jan-18 3QFY2018 Result Update Coffee February 5, 2018 CCL Products Performance Update Y/E March (` cr) Q3FY18 Q3FY17
Lotte Confectionery (004990)
") Company Note May 9, 211 Lotte Confectionery (499) BUY (Maintain) TP: W2,, (Up) KOSPI (May 6) 2,147 Stock price (May 6) 1,67, Shares outstanding (mn) 1.4 Market cap (USD mn) 2,19 52-Week Low/High (won)
Company Note May 9, 211 Lotte Confectionery (499) BUY (Maintain) TP: W2,, (Up) KOSPI (May 6) 2,147 Stock price (May 6) 1,67, Shares outstanding (mn) 1.4 Market cap (USD mn) 2,19 52-Week Low/High (won)
Focused on Profitable, Consistent Growth
 Focused on Profitable, Consistent Growth Investor Presentation May 2014 FORWARD-LOOKING STATEMENTS Certain information contained in this presentation may constitute forward-looking statements, such as
Presentation for Institutional Investors (FY16 1 st Half)
") Nippon Paint Holdings Co., Ltd. Presentation for Institutional Investors (FY16 1 st Half) November 17, 2016 Nippon Paint Holdings Co., Ltd. Tetsushi Tado, President & CEO Table of Contents 1.Financial
Nippon Paint Holdings Co., Ltd. Presentation for Institutional Investors (FY16 1 st Half) November 17, 2016 Nippon Paint Holdings Co., Ltd. Tetsushi Tado, President & CEO Table of Contents 1.Financial
Q Results and Outlook
 Q3 2003 Results and Outlook Today s agenda EAC at a glance & Group strategy Highlights and events EAC s Four Strategic Businesses EAC Nutrition EAC Foods EAC Industrial Ingredients EAC Moving & Relocation
NIREUS AQUACULTURE S.A.
 Athens Greece 29 March 2013 12 Months 2012 Results Presentation NIREUS AQUACULTURE S.A. Main events 12M 2012 Total sales up +2.7% to 202.2 mi. Fish sales value up +5.5% to 163 mi., volume up +8.3% to 31.6
NIREUS AQUACULTURE S.A.
 Athens Greece 30 May 2013 3 Months 2013 Results Presentation NIREUS AQUACULTURE S.A. Main events 3M 2013 Total Group sales up +1% to 44.6 mi. Exports up +2% to 35.7 mi - 80% of total sales. Cash generation
Apex Frozen Foods Limited
 Investor Presentation Apex Frozen Foods Limited CIN: L15490AP2012PLC080067 Q1 FY19 Results Safe Harbor This presentation and the accompanying slides (the Presentation ), which have been prepared by Apex
First Quarter of the Fiscal Year Ending December 31, 2015 Unicharm Presentation Materials for Investor Meeting
 First Quarter of the Fiscal Year Ending December 31, 2015 Unicharm Presentation Materials for Investor Meeting May 8, 2015 Takahisa Takahara President and CEO Unicharm Corporation Projections stated herein
(iii) Broiler farm Growing day-old chicks to be reared into full-grown chicken for their meats (boiler).
 Broiler farm Growing day-old chicks to be reared into full-grown chicken for their meats (boiler).") THE POULTRY INDUSTRY IN MALAYSIA The poultry industry is an important source to supply meat protein to Malaysian. The total value of sales value for chicken eggs and chicken meat ex-farm are believed to
THE POULTRY INDUSTRY IN MALAYSIA The poultry industry is an important source to supply meat protein to Malaysian. The total value of sales value for chicken eggs and chicken meat ex-farm are believed to
The Siam Cement Public Company Limited Management s Discussion and Analysis (MD&A) Consolidated Financial Results: Q2/10 and H1/10
 Consolidated Financial Results: Q2/10 and H1/10") The Siam Cement Public Company Limited Management s Discussion and Analysis (MD&A) Consolidated Financial Results: Q2/10 and H1/10 Q2/10 Net Profit of 7,295 MB, up 6% q-o-q and 7% y-o-y. H1/10 Net Profit
The Siam Cement Public Company Limited Management s Discussion and Analysis (MD&A) Consolidated Financial Results: Q2/10 and H1/10 Q2/10 Net Profit of 7,295 MB, up 6% q-o-q and 7% y-o-y. H1/10 Net Profit
December Domestic Exports Imports. Volume Tonnes SW. MAT December-14 4, ,192 39, ,
 December 2014 Overview Table 1.1 Overview trends for Domestic, Export and Import trade Domestic Exports Imports Month Slaughter Pigmeat (Tonnes) Volume Tonnes SW Value $AUD (Million) Volume Tonnes SW Value
Charoen Pokphand Food - CPF Livestock and aquaculture businesses seen as key earnings drivers in CY14
 Livestock and aquaculture businesses seen as key earnings drivers in CY14 Bloomberg Reuters CPF TB CPF.BK Report type: Company Update Company Overview CPF is a Thailand-based company engaged in agroindustrial
Thai Union Group Public Company Limited
 2Q18: Recovering operations Revenue 2Q18 sales declined by 2.0% YoY to THB 34,137mn. This was driven mainly by Thai Baht appreciation against US Dollar (7.0% YoY). Excluding the impact of foreign exchange,
Quarterly Meeting # 2/2015
 Quarterly Meeting # 2/2015 1Q15 Performance & Outlook 18 May 2015 The views expressed here contain some information derived from publicly available sources that have not been independently verified. No
Fila Korea (081660) Widespread growth potential
 Widespread growth potential") Fila Korea (8166) BUY (Maintain), TP: W98, (Maintain) Stock price (Apr 26, KRW) 83,5 Yr to Sales OP EBT NP EPS % chg EBITDA P/E EV/EBITDA P/B ROE Market cap (USD mn) 697 Dec (W bn) (W bn) (W bn) (W bn)
Fila Korea (8166) BUY (Maintain), TP: W98, (Maintain) Stock price (Apr 26, KRW) 83,5 Yr to Sales OP EBT NP EPS % chg EBITDA P/E EV/EBITDA P/B ROE Market cap (USD mn) 697 Dec (W bn) (W bn) (W bn) (W bn)
March Domestic Exports Imports. Volume Tonnes SW. MAT Mar-16 4, ,322 32, , % Change 3.8% 5.2% 13.2% 8.0% 1.1% 1.
 March 2017 Overview Table 1.1 Overview trends for Domestic, Export and Import trade Domestic Exports Imports Month Slaughter Pigmeat (Tonnes) Volume Tonnes SW Value $AUD (Million) Volume Tonnes SW Value
EU Market Situation for Eggs. Committee for the Common Organisation of the Agricultural Markets 30 August 2018
 EU Market Situation for Eggs Committee for the Common Organisation of the Agricultural Markets 30 August 2018 F O R E C A S T EU production of eggs for consumption (expert forecast May 2018) Source : Experts
Investor Presentation. For 2016
 Investor Presentation For 216 Bangkok Bank 1. Operating Environment 2. Our Financial Results 216 3. Bangkok Bank s Position 4. Our Key Focus & Strategy 2 The Thai Economy: Steady Trend of Moderate Recovery
Annual General Meeting of Shareholders
 Amsterdam, 1. Opening 2. Report of the Supervisory Board and of its sub committees for the financial year 2009 3. Report of the Executive Board for the financial year 2009 Content 2009 full year financial
- SET Index closed at 1, points at the end of January, up 5.58 percent from the end of 2014.
 SET News 15/2015 Feb 9, 2015 Thai bourse market report for January 2015 Bangkok, February 9, 2015 The Stock Exchange of Thailand (SET) main index ended January at 1,581.25 points, up 5.58 percent from
CP ALL Public Company Limited. FY2013: Presentation Results
 CP ALL Public Company Limited FY2013: Presentation Results February 2014 Financial Highlights Units: MB Company Only 4Q12 4Q13 %Chg 2012 2013 %Chg Total Revenue 53,189 57,984 +9.0% 194,695 217,495 +11.7%
MRF BUY. Performance Highlights. CMP `9,407 Target Price `11,343. Company Update Automobile. Key financials
 Company Update Automobile February 22, 212 MRF Performance Highlights Y/E Sept. (` cr) 1QSY12 1QSY11 % chg (yoy) 4QSY11 % chg (qoq) Net sales 2,875 2,167 32.7 2,62 9.8 EBITDA 258 243 5.9 181 42.6 EBITDA
(the Company ) (incorporated in the Cayman Islands with limited liability) (Stock Code: 3999) RENEWAL OF VARIOUS CONTINUING CONNECTED TRANSACTIONS
 (incorporated in the Cayman Islands with limited liability) (Stock Code: 3999) RENEWAL OF VARIOUS CONTINUING CONNECTED TRANSACTIONS") Hong Kong Exchanges and Clearing Limited and The Stock Exchange of Hong Kong Limited take no responsibility for the contents of this announcement, make no representation as to its accuracy or completeness
Hong Kong Exchanges and Clearing Limited and The Stock Exchange of Hong Kong Limited take no responsibility for the contents of this announcement, make no representation as to its accuracy or completeness
CCL Products BUY. Brewing Steadily. CMP Target Price `300 `360. Initiating Coverage Coffee. January 4, year price chart
 5-Jan 5-Apr 5-Jul 5-Oct 5-Jan 5-Apr 5-Jul 5-Oct 5-Jan 5-Apr 5-Jul 5-Oct CCL Products Brewing Steadily CCL Products Limited (CCL) is the largest Indian manufacturer and exporter of instant coffee. With
FONTERRA INTERIM RESULTS 2014
 FONTERRA INTERIM RESULTS 2014 Market Briefing FONTERRA CO-OPERATIVE GROUP LIMITED Overview John Wilson Chairman 2 Working Area Safee Copy Frame. This denotes working area and must be deleted before final
Quick take. Ruchira Papers Ltd. BUY. Creating value through paper. Target Price. Investment Period 12 Months. 3 year daily price chart.
 Ltd. Creating value through paper Limited (RPL) manufactures writing paper, printing paper and Kraft paper. The company's white writing and printing paper is used in making notebooks and writing material,
Tegel Group Holdings Limited
 Tegel Group Holdings Limited FY17 Full Year Results Presentation 27 June 2017 1 TEGEL GROUP HOLDINGS FY17 RESULTS PRESENTATION Disclaimer This presentation contains summary information about Tegel Group
Total Security Printing and Services Solutions Opportunity Day : FY2016 March 27, 2017
 Total Security Printing and Services Solutions Opportunity Day : FY2016 March 27, 2017 Agenda Introduction Business Overview & Strategy Financial Information Anti-Corruption & CSR AGENDA Introduction Business
Thailand s economic resilience amid global uncertainties. March 2017
 Thailand s economic resilience amid global uncertainties March 217 Thailand s economic resilience amid global uncertainties I. Thailand s economic resilience II. Thai corporates target for sustainable
Analysts Meeting 3Q16 Results Presentation
 Analysts Meeting 3Q16 Results Presentation 8 November 2016 Page 1 Disclaimer The information contained in our presentation is intended solely for your personal reference only. In addition, such information
YG Entertainment (122870)
") Company Note August 29, 212 12M rating BUY (Maintain) 12M TP W69, from W69, Up/downside +11% Stock Data KOSPI (Aug 28, pt) 1,916 Stock price (Aug 28, KRW) 62,2 Market cap (USD mn) 561 Shares outstanding
Company Note August 29, 212 12M rating BUY (Maintain) 12M TP W69, from W69, Up/downside +11% Stock Data KOSPI (Aug 28, pt) 1,916 Stock price (Aug 28, KRW) 62,2 Market cap (USD mn) 561 Shares outstanding
Annual Results Presentation. for the year ended 30 September 2014
 Annual Results Presentation for the year ended 30 September 2014 AGENDA Business Overview Poultry Industry Trends Financial Overview Industry Matters Prospects Q & A 2 2 BUSINESS OVERVIEW 3 THE PERIOD
The interim financial statements were approved for issue by the executive directors on 9 May 2012.
 Note Contents 1 General information 2 Basis of preparation of the interim financial statements 3 Changes in accounting policy 4 Business combinations - buy shares 5 Related party transactions 6 Accounts
SET Senior Executive Vice President Pakorn Peetathawatchai stated the Thai stock market s highlights in 2017 were as follows:
 SET News 2/2018 January 5, 2018 SET market report for December 20 BANGKOK, January 5, 2018 - The Stock Exchange of Thailand (SET) Index ended 20 at 1,753.71 points the year s closing high, up 13.7 percent
- SET Index closed at 1, points at the end of February, up 0.4 percent from the end of January, or up 6 percent from the end of 2014.
 SET News 29/2015 Mar 12, 2015 Thai bourse market report for February 2015 Bangkok, March 12, 2015 The Stock Exchange of Thailand (SET) main index ended February at 1,587.01 points, up 0.4 percent from
Analysts Meeting. FY2016 Results Presentation. 21 February Page 1
 Analysts Meeting FY2016 Results Presentation 21 February 2017 Page 1 Disclaimer The information contained in our presentation is intended solely for your personal reference only. In addition, such information
Athens Greece May Months 2009 Results Presentation
 Athens Greece May 2009 3 Months 2009 Results Presentation NIREUS AQUACULTURE S.A. Nireus at a glance The leader in seabass and seabream fish farming - A fully integrated producer - Production facilities
FOCUSED ON PROFITABLE, CONSISTENT GROWTH
 FOCUSED ON PROFITABLE, CONSISTENT GROWTH Investor Presentation August 2013 FORWARD-LOOKING STATEMENTS Certain information contained in this presentation may constitute forward-looking statements, such
Catch of the Day N/A. Century Pacific Food, Inc: TUESDAY, 22 APRIL 2014 SHARE DATA. Jed Frederick Pilarca
 TUESDAY, 22 APRIL 2014 Century Pacific Food, Inc: Catch of the Day Largest canned food producer in the Philippines. CNPF is the largest producer of canned foods in the Philippines whose brands have established
KEI Industries BUY. Performance Update. CMP Target Price `433 `508. 4QFY2018 Result Update Cable. Historical share price chart.
 May- Aug- Oct-15 Jan-16 Apr-16 Jul-16 Oct-16 Jan-17 Apr-17 Jul-17 Oct-17 Jan-18 Apr-18 4QFY2018 Result Update Cable May 21, 2018 KEI Industries Performance Update Y/E March (` cr) 4QFY18 4QFY17 % yoy 3QFY18
Sri Trang Agro-Industry Public Company Limited
 Sri Trang Agro-Industry Public Company Limited Management Discussion and Analysis, Q3 2013 14 th November 2013 STA : A World Leading Natural Rubber Player Financial result overview Our strategic plan to
Company Update, 27 September 2013
 Sep-12 Nov-12 Jan-13 Apr-13 May-13 Aug-13 Vol m Company Update, Buy (from Neutral) Industrial - Engineering & Construction Target Price: SGD3.49 Market Cap: USD2,797m Price: SGD3.13 Acquires Singapore
For personal use only
 Tegel Group Holdings Limited FY18 Interim Results Presentation 6 December 2017 1 TEGEL GROUP HOLDINGS FY18 INTERIM RESULTS PRESENTATION Disclaimer This presentation contains summary information about Tegel
H AND FULL-YEAR OUTLOOK
 H1 2005 AND FULL-YEAR OUTLOOK Presentation by: CEO Mark Wilson EVP, Group CFO Iqbal Jumabhoy EVP Niels Henrik Jensen Copenhagen, 30 August 2005 1 TODAY S AGENDA EAC Group highlights H1 2005 H1 2005: the
For personal use only
 Click to edit Master text styles IDP Education FY16 Results Presentation Twelve months to 30 June 2016 11 February 2016 Important notice and disclaimer Click Disclaimer to edit Master text styles The material
GSK Consumer Healthcare Ltd
 GICS Industry : Food Products l Sub Industry : Packaged foods & meats l Website : www.gsk-ch.in GSK Consumer Healthcare Ltd Key Stock Indicators NSE Ticker : GSKCONS Bloomberg Ticker : SKB:IN Face value
Packaging Mergers & Acquisitions: Drivers, Deals & Outlook. Nicholas Mockett October 2017
 Packaging Mergers & Acquisitions: Drivers, Deals & Outlook Nicholas Mockett October 2017 Introduction Moorgate Capital is an independent Corporate Finance firm specialising in: Mergers, Acquisitions &
(Incorporated in Bermuda with limited liability) (Stock Code: 43) CONNECTED TRANSACTIONS IN RELATION TO THE SAP SYSTEM LICENSE AND IMPLEMENTATION
 (Stock Code: 43) CONNECTED TRANSACTIONS IN RELATION TO THE SAP SYSTEM LICENSE AND IMPLEMENTATION") Hong Kong Exchanges and Clearing Limited and The Stock Exchange of Hong Kong Limited take no responsibility for the contents of this announcement, make no representation as to its accuracy or completeness
Hong Kong Exchanges and Clearing Limited and The Stock Exchange of Hong Kong Limited take no responsibility for the contents of this announcement, make no representation as to its accuracy or completeness
Godrej Agrovet Limited
 IPO Note FMCG October 3, 2017 Godrej Agrovet Limited IPO Note Godrej Agrovet Limited (GAVL) is a leading Agri-business company operating across five different business verticals i.e. Animal Feed, Crop
Huhtamaki roadshow presentation. Investor Relations Q1 2009
 Huhtamaki roadshow presentation Investor Relations 2009 Huhtamaki in brief A leading manufacturer of consumer and specialty packaging with head office in Espoo, Finland Net sales EUR 2.3 billion in 65
BreadTalk Group Limited Financial Results Third Quarter 2016
 BreadTalk Group Limited Financial Results Third Quarter 2016 Bakery Food Atrium Restaurant 3Q 2016 FINANCIAL HIGHLIGHTS Income Statement Highlights S$ Million 3Q 2016 3Q 2015 Y/Y 9M 2016 9M 2015 Y/Y Revenue
Asia Key Economic and Financial Indicators 13-Jul-17
 Asia Key Economic and Financial Indicators -Jul-7 ASEAN Brunei (BN) Cambodia (KH) Indonesia () Laos (LA) Malaysia () Myanmar (MM) Philippines () Singapore () Thailand () Vietnam () East Asia China (CN)
2016 Outward Foreign Direct Investment of Thai Listed Firms
 Research Paper 1/2017 2016 Outward Foreign Direct Investment of Thai Listed Firms Research Department The Stock Exchange of Thailand May 2017 www.set.or.th/setresearch Contents Page Executive Summary 1
Almarai Company. Fiscal Year 2018 and Fourth Quarter 2018
 Fiscal Year 2018 and Fourth Quarter 2018 Disclaimer Information contained in this presentation is subject to change without further notice, its accuracy is not guaranteed and it may not contain all material
DKSH Holding Ltd. Presentation Half-year results 2018
 DKSH Holding Ltd. Presentation Half-year results 2018 Overview Half-Year 2018 Net sales grew by 7.4% Profit after tax increases 4.5% EBIT on last year s level Increased performance in Healthcare, Performance
PRELIMINARY RESULTS Investor Presentation Year ended 30 June 2017
 PRELIMINARY RESULTS Investor Presentation Year ended 30 June 2017 Disclaimer This presentation has been prepared by Genus ( Genus or the Company ) and has not been independently verified. Genus is solely
December Overview. Table 1.1 Overview trends for Domestic, Export and Import trade
 December 2016 Overview Table 1.1 Overview trends for Domestic, Export and Import trade Domestic Exports Imports Month Slaughter Pigmeat (Tonnes) Volume Tonnes SW Value $AUD (Million) Volume Tonnes SW Value
BUY. Serving up a high-protein diet. Japfa Ltd (JAP SP) Shaken, but not stirred; Initiate BUY. Consumer Staples. Leveraged to a growing middle class
 Shaken, but not stirred; Initiate BUY. Consumer Staples. Leveraged to a growing middle class") Consumer Staples Singapore.64 June 21, 218 Japfa Ltd (JAP SP) Serving up a high-protein diet BUY Share Price SGD.61 12m Price Target SGD.86 (+42%) Shaken, but not stirred; Initiate BUY After a forgettable
Consumer Staples Singapore.64 June 21, 218 Japfa Ltd (JAP SP) Serving up a high-protein diet BUY Share Price SGD.61 12m Price Target SGD.86 (+42%) Shaken, but not stirred; Initiate BUY After a forgettable
Athens Greece 31 March Annual 2017 Results Presentation NIREUS AQUACULTURE S.A.
 Athens Greece 31 March 2018 Annual 2017 Results Presentation NIREUS AQUACULTURE S.A. Table of Contents Pages I. Our Vision... 3 II. Profile..4-15 III. Sales by Business Sector....16 IV. Sales evolution...
Sri Trang Agro-Industry Public Company Limited
 Sri Trang Agro-Industry Public Company Limited Management Discussion and Analysis, Q1 2017 12 th May 2017 STA : The World s Leading Natural Rubber Player Financial result overview In Q1 2017, Natural rubber
Parag Milk Foods BUY. Performance Update CMP. `256 Target Price `330. 2QFY2019 Result Update Dairy Products. Investment Period 12 Months
 2QFY2019 Result Update Dairy Products November 6, 2018 Parag Milk Foods Performance Update Y/E March (` cr) Q2FY19 Q2FY18 % yoy Q1FY19 % qoq Net sales 573 505 13.7% 549 4.4% EBITDA 58 50 16.3% 60-2.7%
1Q18 Results Presentation 8 May Page 1
 1Q18 Results Presentation 8 May 2018 Page 1 Disclaimer The information contained in our presentation is intended solely for your personal reference only. In addition, such information contains projections
April Domestic Exports Imports. Volume Tonnes SW. MAT Apr-16 4, ,332 33, , % Change 2.8% 4.3% 12.6% 5.9% 2.9% 4.
 April 2017 Overview Table 1.1 Overview trends for Domestic, Export and Import trade Domestic Exports Imports Month Slaughter Pigmeat (Tonnes) Volume Tonnes SW Value $AUD (Million) Volume Tonnes SW Value
QL RESOURCES BERHAD (QL)
") QL RESOURCES BERHAD (QL) All figures in millions of Ringgit Malaysia except per share values and ratios Analysis Date: 14/06/2013 Financial Year: 2012 31/03/2012 Latest Quarter: 31/03/2012 Price: 3.17
QL RESOURCES BERHAD (QL) All figures in millions of Ringgit Malaysia except per share values and ratios Analysis Date: 14/06/2013 Financial Year: 2012 31/03/2012 Latest Quarter: 31/03/2012 Price: 3.17
Nielsen s FMCG Index & Fuel Index Jan 2014 = 100 Jan 2014 = 100. Service Index* & Net Tourist Spending Index Jan 2014 = 100
 1 = Nielsen s FMCG Index & Fuel Index = = 115 15 95 85 Durable and Semi-durable Indices Nielsen s FMCG Index sa, 3mma Fuel Index, sa Fuel Index sa, 3mma (RHS) Semi-durable Index sa,3mma Durable Index sa,