Charoen Pokphand Foods PCL.
|
|
|
- Preston Walton
- 5 years ago
- Views:
Transcription


1 Charoen Pokphand Foods PCL. 1H18 RESULTS Investor Presentation BRIEFING August 14, 2018


2 Contents Page 1 Kitchen of the World Business Overview 1H18 Financial Results Y2018 Outlook Appendix A: 3Yr Historical Results B: Products & Raw Materials Price Trend C: Highlights 2Q18 Results D: Group of CPP's Associate Companies & Joint Ventures E: Product Sample & Retail Outlet Format
3 Why Invest in CPF Page 2 Kitchen of the World One of the world s recognized leaders in animal feed manufacturing, swine production, and shrimp integrated business Diversified portfolio with operations and investment in 17 countries catered to over 4 billion population, and exports to more than 30 countries Multi-species animal proteins (mainly poultry, swine and shrimp) Member of SET 50 under Agro & Food Industry Sector (Ticker: CPF) Member of Dow Jones Sustainability Index (Emerging Markets) Member of FTSE4Good Index Series Ranked #191 on Forbes Global 2000: World s Best Employers 2017 Ranked Excellent for CGR Scoring by Thai Institute of Directors (IOD) *
4 Company Facts (as of June 30, 2018) Page 3 Vision : Kitchen of the World Portfolio 4 listed investments onboard (HKSE:00043, HKSE:3839, TWSE: 1215, SET:CPALL) 30 series of debentures listed on Thai Bond Market Association TBMA 1 exchangeable Bond EBs on Highlights FY17 Sales : THB501 billion or ~USD15.0 billion Market Cap Capital : THB217 billion or ~USD6.5 billion (as of August 10, 2018) : 8,611 million shares (paid-up) : 7,743 million shares (paid-up) par value of THB.1.00 per share Book Value : THB19.01* per share (as of Jun 30, 2018) Shareholders : Charoen Pokphand Group Ltd. 53.9% of Paid-Up Capital (as of Mar 13, 2018) (as of Jun 30, 2018) (as of Jun 30, 2017) Credit Rating : A+ with Stable Outlook (as of May 11, 2018) Livestock, 85% Aquaculture, 15% 2017 Sales Breakdown TH- Domestic, 30% TH- Export, 6% International, 64% By Business By Product By Operations Feed, 45% Food, 18% Farm, 37% Note: USD1 = THB (as of August 10, 2018) * Exclude Non-Controlling Interests (NCI)


5 Vertically Integrated Business Model in Thailand Page 4 Integrated operating platform for safety & quality control Livestock (Broiler, Layer, Swine, Duck) and aquaculture (Shrimp & Fish) Feedmilling Breeding Farming Processing Adding Value Feed Breeder Live Animal Fresh Meat Food & Ready Meal Farm Food & Retail Outlets


6 CPF Geographical Footprints Page 5 Operations and investment in 17 countries catered to > 4 billion population Export to more than 30 countries across 5 continents Russia Livestock feed Swine farming Chicken integrated business USA Ready to eat foods UK Chilled and Frozen food Food kiosks Food Services Belgium Ready to eat foods Brazil Shrimp farming & primary processing Turkey Chicken integrated business Poland Hatchery farm Food processing plants Taiwan Livestock integrated business Philippines Livestock and aquaculture feed and farming Laos Livestock integrated business Cambodia Livestock integrated business Sri Lanka Ready to eat foods India Chicken integrated business Aquatic feed China Livestock and aquaculture feed Aquaculture farming Ready to eat foods Thailand Livestock and aquaculture integrated businesses Malaysia Livestock and aquaculture integrated business Vietnam Livestock and aquaculture integrated businesses


7 Business Principle Page 6 From Feed, Farm to Food Innovation Food Safety with traceability Quality Control in every process Strategic Direction for Sustainable Growth 3 Strategies to be Kitchen of the World Sustainable Growth Aiming for Excellence Building Solid Foundation 3 Pillars to Sustainability
8 CPF Operational Structure (As of June 30, 2018) Page 7 1H18 : Sales: THB 256,869 m Net Profit: THB 8,943 m CPF Thailand 28% of Sales Domestic 5% of Sales Export 33% of Sales 67% of Sales % of sales China Belgium (Tops Food) Sri Lanka (Norfolk Foods) CPP- HKSE:43 (50.43%) 41% of sales (1) 14% of sales Vietnam 2 3 (84.08%) CPF Poland A.A.W Organizacji (66.67%) CPF International (80.00%) TW:1215 CPE Taiwan (32.68%) India (99.99%) USA (Bellisio) 26% of sales (100.00%) Turkey (100.00%) Russia (99.99%) RBPI (75.82%) S&W (79.99%) UK (57.52%) Food Fellas (34.51%) Westbridge (100.00%) CP Cambodia (100.00%) Philippines (99.99%) China (Aqua) (100.00%) CTEI (50.43%) Malaysia (99.99%) Associates & Joint Ventures SET: CP ALL (34.15%) CPH (Malaysia) (49.75%) CP Aqua (India) (31.70%) Arbor (49.98%) Ross (49.99%) Nava84 (25.00%) CP Meiji (59.99%) BHJ Kalino Food AB (15.08%) Siam Rivea (29.99%) SuperDrob (Poland) (49.45%) Camanor (Brazil) (40.00%) 17 Note: % represent percent holding by CPF both direct and indirect (1) Based on total issued shares (2) see Appendix C Laos (99.99%) 13 (2) Group of CPP s Associate Companies & Joint Ventures


9 Strategy for Growth Page 8 1. Fully integrated business model 2. Globalization by establishing a proper business model suitable for each strategic market 3. Value-added business by expanding portfolio towards innovative products and services to serve rising demands
10 1H18: Revenue increased by 5% mainly by international operation Page 9 Thailand s Revenue declined by 4% mainly due to declining swine and chicken price China s Revenue increased by 16% mainly from feed sales and farm businesses Vietnam s Revenue increased by 12% mainly due to increasing swine price Other international operation s revenue increased by 2% y-o-y mainly from newly acquired operations (Westbridge, Paulsen Foods) +5% 245,587-4% 3, % +12% +2% 9,543 4,000 1, ,869 1H2017 Thailand China Vietnam Others 1H2018
11 1H18 Summary Page 10 Profitability Gross profit decreased from THB 29,915m in 1H17 to THB 27,990m in 1H18, due to lower swine and chicken prices in Thailand. EBITDA decreased by 9% y-o-y to THB 15,378m in 1H18 Net Profit increased by 12% y-o-y to THB 8,943m in 1H18 Latest Activities Financing Activities THB 12,000 m Debenture (@ Approx. 3.39%) Exchange of Exchangeable Bonds EBs Cancellation of USD 131,600,000 EBs outstanding is USD 168,400,000 THB 15,000 m Debenture by CPF Thailand (@ Approx. 3.45%) Y2018 Jan 18 Apr 18 May 18


12 2018 Investments and M&A Activities Page 11 Camanor Produtos Marinhos Ltda. Shrimp farming & primary processing 40% THB 547 m CP HiLai Habour Co., Ltd. Restaurant 51% THB 66 m Y2018 Apr 18 Jul 18 Expected to open in October, 2018


13 1H18: Sales & Profit Margin by Business Page 12 In THB, m 1H17 1H18 245,587 +5% 256, % 136, ,776-3% 73,487 71,455-12% +8% 15,329 13,535 20,390 22,103 Thai-Livestock Thai-Aqua Overseas-Livestock Overseas-Aqua TOTAL GPM 12.7% 5.5% 10.7% 7.1% 10.8% 12.5% 20.9% 20.1% 12.2% 10.9% OPM 3.7% -3.3% 3.0% 0.4% 0.8% 5.3% 14.3% 13.7% 2.9% 3.4%
14 1H18: Consolidated Sales Structure by Business Page 13 Livestock Sales Breakdown Aquaculture Total 1H17 1H18 %Change 1H17 1H18 %Change 1H17 1H18 %Change Thailand 73,487 71,455-3% 15,359 13,535-12% 88,846 84,990-4% Domestic 61,993 60,616-2% 12,603 11,290-10% 74,596 71,906-4% Export 11,494 10,839-6% 2,756 2,245-19% 14,250 13,084-8% China 54,249 63,291 17% 3,985 4,485 13% 58,233 67,776 16% Vietnam 27,285 30,032 10% 5,300 6,552 24% 32,585 36,584 12% Others 54,847 56,453 3% 11,075 11,066 0% 65,922 67,519 2% Total 209, ,231 5% 35,719 35,638 0% 245, ,869 5% % of Total Sales 85% 86% 15% 14% 100% 100% Thailand China Vietnam 74% of Sale Revenue
15 1H18: Consolidated Sales by Products Page 14 Sales Breakdown by Products Feed Farm Food Total 1H17 1H18 %Change 1H17 1H18 %Change 1H17 1H18 %Change 1H17 1H18 %Change Thailand 25,082 24,644-2% 41,913 39,067-7% 21,821 21,279-2% 88,816 84,990-4% Domestic 24,954 24,617-1% 38,004 35,526-7% 11,638 11,763 1% 74,596 71,906-4% Export % 3,909 3,541-9% 10,183 9,516-7% 14,220 13,084-8% China 52,267 56,524 8% 3,910 8, % 2,056 2,702 31% 58,233 67,776 16% Vietnam 15,031 12,780-15% 16,622 22,800 37% 932 1,004 8% 32,584 36,584 12% Others 19,324 17,945-7% 29,798 32,893 10% 16,831 16,681-1% 65,954 67,519 2% Total 111, ,893 0% 92, ,310 12% 41,640 41,666 0% 245, ,869 5% Feed, 29% Food, 25% Farm, 46% Food, 4% Farm, 13% Feed, 83% Feed, 35% Food, 3% Farm, 62% Feed, 26% Food, 25% Thailand China Vietnam Others THB 84,990 m THB 67,776 m THB 36,584 m THB 67,519 m THB 256,869 m % to sales 33% 27% 14% 26% 100% Farm, 49% Feed, 44% Food, 16% Total Farm, 40% Note: China's revenue is recognized under Thai Accounting Standard (TAS18), which is different from IFRS15 adopted by CPP (HKSE:0043)
16 1H18: Consolidated Income Statement Highlight Page 15 Quarter 1 Quarter 2 6 Months % Chg % Chg % Chg. Net sales 119, ,516 1% 125, ,353 8% 245, ,869 5% Gross Profit Margin 12.7% 9.4% 11.7% 12.2% 12.2% 10.9% EBITDA 8,535 5,496-36% 8,446 9,882 17% 16,980 15,378-9% EBITDA Margin 7.1% 4.6% 6.7% 7.2% 6.9% 6.0% EBIT 3, % 3,195 4,353 36% 6,547 4,398-33% EBIT Margin 2.8% 0.04% 2.5% 3.2% 2.7% 1.7% Share in Profit of Associates 1,954 2,216 13% 1,861 1,943 4% 3,815 4,159 9% Financial Costs (3,071) (2,783) -9% (3,003) (2,835) -6% (6,074) (5,618) -8% Income Taxes Expense (67) (285) 325% (725) (1,315) 81% (792) (1,600) 102% NET PROFIT 3,955 3,049-23% 4,064 5,894 45% 8,020 8,943 12% EPS (THB) (1) # of capital shares 7,388 8,185 7,388 8,185 7,388 8,185 Paid-Up Capital 7,743 8,611 7,743 8,611 7,743 8,611 Dividend (THB/Share) Note: (1) # of capital shares = No. of the weighted-avg. shares
17 Financial Status (As of June 30, 2018) Page 16 Interest Bearing Debt: THB 315,260 m Net Debt to Equity & Net Debt to EBITDA (THB, m) 258, , , ,260 Net D/E 1.3x 1.4x 1.2x 1.2x H H18 S/T Loan, 34% Current Portion, 5% L/T Loan, 20% Bond, 41% Net D/EBITDA 7.0x 5.7x 8.2x 9.3x Cost of Debts H % 3.87% 3.84% 3.88% H18* Remark : Net Debt = Interest Bearing Debt - Cash and Cash Equivalents Bond Rating A+ with Stable Outlook by Tris Rating Co., Ltd * LTM EBITDA EBITDA = Revenue from Sales of Goods - Cost of Sales of Goods + Other Income - Selling Expense - Administrative Expense - Other Expense + Gain (Loss) from Foreign Exchange + Gain (Loss) on sales of property, plant & equipment + Depreciation & Amortization + Depreciation of biological asset
18 CPF s Investment in Listed Companies Page 17 Stock Price (Local Curr.) Market Cap. CPF Holding % Holding Value (THB mm) (THB mm) (As of June 30, 2018) CPALL THB , % 226,072 (SET:CPALL) CPP HKD , % 36,735 (HKSE:0043) TRUE THB , % 3,908 (SET:TRUE) CPE TWD , % 5,738 (TWSE:1215) CTEI HKD 2.4 2, % 1,226 (HKSE:3839) Total 273,680
19 Y2018 Outlook Page 18 Growth Target Expected sales growth of approximately 5-8 % Key Drivers & Focus Easing oversupply of swine in Vietnam Focusing on efficiency improvement Expanding of international operations Key Challenges Oversupply of swine in Vietnam and Thailand continuing from 2017 to 1Q18 Low chicken and swine prices in Thailand Rising raw material costs Foreign exchange volatility Increasing interest rates Investment Capex of approximately THB 25 billion (excluding M&A)
20 Appendix A: Highlights : 3Yr Historical Results
21 Gross Profit Margin & Operating Profit Margin Page % 15.0% 10.0% 5.0% 0.0% Thai-Livestock 15.6% 16.8% 16.5% 12.5% 12.2% 13.1% 12.4% 7.7% 7.6% 6.8% 3.4% 3.2% 4.1% 2.7% 7.9% GPM OPM 5.1% 5.5% -2.4% -3.3% -3.3% 25.0% 20.0% 15.0% 10.0% 5.0% 0.0% 11.9% 12.6% 2.3% 3.7% Thai-Aqua 16.5% 13.6% 10.0% 7.5% 8.2% 2.7% 3.2% 0.3% 12.5% 6.7% 7.0% 0.9% 10.7% 4.4% GPM OPM 7.1% 0.4% -5.0% Q1'16 Q2'16 Q3'16 Q4'16 Q1'17 Q2'17 Q3'17 Q4'17 Q1'18 Q2'18-5.0% Q1'16 Q2'16 Q3'16 Q4'16 Q1'17 Q2'17 Q3'17 Q4'17 Q1'18 Q2' % 20.0% 15.0% 10.0% 5.0% 0.0% 17.0% 8.7% Oversea-Livestock 19.5% 16.9% 10.5% 7.7% 14.4% 4.3% 12.4% 2.5% 9.2% -1.0% 13.6% 4.5% 10.2% 10.3% -0.1% 1.4% GPM OPM 12.5% 5.3% 25.0% 20.0% 15.0% 10.0% 5.0% 0.0% 7.9% -1.8% 11.5% Oversea-Aqua 14.2% 5.9% 7.3% 10.1% 1.4% 17.4% 9.0% 22.8% 20.1% 17.1% 14.8% 16.0% 8.8% GPM OPM 19.4% 20.1% 12.0% 13.7% -5.0% Q1'16 Q2'16 Q3'16 Q4'16 Q1'17 Q2'17 Q3'17 Q4'17 Q1'18 Q2'18-5.0% Q1'16 Q2'16 Q3'16 Q4'16 Q1'17 Q2'17 Q3'17 Q4'17 Q1'18 Q2'18
22 Thailand Operations Export Destination Page Y2017 1H18 Asia 61% Asia 64% Asia 65% Others USA 2%2% EU 35% Others USA 3% 6% EU 27% Others USA 5% 8% EU 22% Asia EU USA Others Farm THB 7,393 million +21% Asia EU USA Others Farm THB 8,531 million +15% Asia EU USA Others Farm THB 3,542 million -10% Asia 49% Asia 50% Asia 51% EU 43% EU 40% EU 41% Others USA 4% 4% Others 5% USA 5% Others USA 4% 4% Asia EU USA Others Food THB 21,179 million +5% Asia EU USA Others Food THB 21,796 million +3% Asia EU USA Others Food THB 9,516 million -7%
23 Consolidated Income Statement Highlight Page 22 Full Year % Change 2017 % Change Net sales 421, ,465 10% 501,507 8% Gross Profit Margin (%) 13.8% 15.6% 12.0% EBITDA 31,809 48,464 52% 32,420-33% EBIT 15,963 29,956 88% 11,172-63% Share in Profit of Associates 5,221 6,512 25% 7,983 23% Financial Costs (9,614) (10,601) 10% (11,743) 11% Income Taxes Expense (3,654) (7,212) 97% (251) -97% Gain / (Loss) from FX 1, % (21) -105% NET PROFIT 11,059 14,703 33% 15,259 4% EPS (THB) # of capital shares* 7,388 7,388 7,720 Paid-Up Capital 7,743 7,743 8,611 Dividend (THB/Share) Note: * # of capital shares = No. of the weighted-avg. shares
24 CAPEX & EBITDA Page 23 CAPEX EBITDA Unit: THB, m Unit: THB, m CPP EBITDA Margin% CPF 30,475 60, % 25,398 22,175 9,438 50,000 48, % 16.0% 9,446 7,279 13,674 40,000 30,000 31, % 32, % 12.0% 10.0% 21,037 2,881 20, % 6.5% 6.0% 8.0% 6.0% 15,952 14,896 10,793 10,000 15, % 2.0% - 0.0% H H18 EBITDA = Revenue from Sales of Goods - Cost of Sales of Goods + Other Income - Selling Expense - Administrative Expense - Other Expense + Gain (Loss) from Foreign Exchange + Gain (Loss) on sales of property, plant & equipment + Depreciation & Amortization + Depreciation of biological asset
25 Consolidated Net Profit, ROA, and ROE Page 24 Net Profit ROA & ROE Unit: THB, m Gain on fair value adjustment on investment in associates Divestment and Dividend Equity (Share in Profit of Associates) EBIT CAGR +17% ROA 3.6% 3.8% 3.0% 3.4% 2, H18 * Before Tax 236 7,197 5,221 6,512 10,525 ROA = Net Income (include Non-Controlling Interest )/Average Total Asset ROE 15,963 29,956 7,983 11,172 6,846 4, % 11.8% 10.1% 10.2% 4, H H18 * NP: 11,059 14,703 15,259 8,943 ROE = Net Income (Exclude Non-Controlling Interest)/Average Total Equity (Exclude Non-Controlling Interest) * Annualized basis


26 Consolidated Net Profit - Quarterly Page 25 Unit : THB, m 1Q 2Q 3Q 4Q 5,894 5,184 4,914 3,571 2,983 2,956 3,764 4,016 4,064 3,955 3,049 2,326 1,549 1, Q15 : Included gain on fair value adjustment of investments in associates = 236 MB
27 EPS & Dividends per Share Page 26 Earnings Per Share Dividends Unit : THB Per Share Unit : THB Per Share Dividend Policy Semi-annually, not less than 30% of consolidated annual net profit CAGR +13% CAGR +0% H H18
28 Appendix B: Products & Raw Materials Price Trend Kitchen of The World
 2017 2018 Average Price 2016 2017 2018 66.7 56.1 51.1 80.0 73.")
29 Average Farm Prices Thailand Page Thailand s Broiler price (THB/kg) Average Price % Chg +1% -17% Q16 2Q16 3Q16 4Q16 1Q17 2Q17 3Q17 4Q17 1Q18 2Q18 Current Price Thailand s Pork price (THB/kg) Average Price % Chg -16% -9% Q16 2Q16 3Q16 4Q16 1Q17 2Q17 3Q17 4Q17 1Q18 2Q18 Current Price Source: CPF


30 Average Farm Prices Thailand Page Thailand s Fresh Egg price (THB/piece) Average Price % Chg -19% +3% Q16 2Q16 3Q16 4Q16 1Q17 2Q17 3Q17 4Q17 1Q18 2Q18 Current Price Thailand s White Shrimp price (THB/Kg) Average Price % Chg +3% -14% Size 70 pieces/kg Q16 2Q16 3Q16 4Q16 1Q17 2Q17 3Q17 4Q17 1Q18 2Q18 Current Price Source: CPF
31 Average Raw Material Prices Thailand Page Thailand s Corn price (THB/kg) Average Price % Chg -5% +24% Q16 2Q16 3Q16 4Q16 1Q17 2Q17 3Q17 4Q17 1Q18 2Q18 Current Price Thailand s Soybean Meal price (THB/kg) Q16 2Q16 3Q16 4Q16 1Q17 2Q17 3Q17 4Q17 1Q18 2Q18 Current Price Q16 2Q16 3Q16 4Q16 1Q17 2Q17 3Q17 4Q17 1Q18 2Q18 Current Price Thailand s Fishmeal price (THB/kg) Average Price % Chg -8% +3% Average Price % Chg +1% +37% Source: CPF
32 Vietnam: Average Market Price and Major Feed Raw Materials Page 31 40,000 30,000 26,569 27,341 23,363 23,241 24,538 24,793 26,368 26,777 30,254 28,487 Broiler (VND/kg) 20,000 60,000 50,000 40,000 30,000 20,000 10,000 1Q16 2Q16 3Q16 4Q16 1Q17 2Q17 3Q17 4Q17 1Q18 2Q18 50,930 45,730 47,370 42,407 39,701 33,366 30,718 30,895 27,493 22,879 1Q16 2Q16 3Q16 4Q16 1Q17 2Q17 3Q17 4Q17 1Q18 2Q18 Swine (VND/kg) 8,000 6,000 4,000 5,163 4,817 5,500 5,224 5,106 4,884 4,748 4,839 5,037 5,475 Corn (VND/kg) 2,000 20,000 1Q16 2Q16 3Q16 4Q16 1Q17 2Q17 3Q17 4Q17 1Q18 2Q18 15,000 10,000 9,520 8,913 10,097 9,550 9,655 9,416 8,918 8,801 9,239 10,767 Soybean Meal (VND/kg) 5,000 1Q16 2Q16 3Q16 4Q16 1Q17 2Q17 3Q17 4Q17 1Q18 2Q18 Source: CPF VND 1 = THB
33 Turkey: Average Market Price and Major Feed Raw Materials Page Broiler (TRY/kg) Q16 2Q16 3Q16 4Q16 1Q17 2Q17 3Q17 4Q17 1Q18 2Q Corn (TRY/kg) Q16 2Q16 3Q16 4Q16 1Q17 2Q17 3Q17 4Q17 1Q18 2Q Soybean Meal (TRY/kg) Q16 2Q16 3Q16 4Q16 1Q17 2Q17 3Q17 4Q17 1Q18 2Q18 Source: CPF TRY 1 = THB 8.33
34 India: Average Market Price and Major Feed Raw Materials Page Broiler (INR/kg) 0.0 1Q16 2Q16 3Q16 4Q16 1Q17 2Q17 3Q17 4Q17 1Q18 2Q Shrimp(60 pieces) (INR/kg) Q16 2Q16 3Q16 4Q16 1Q17 2Q17 3Q17 4Q17 1Q18 2Q Corn (INR/kg) 0.0 1Q16 2Q16 3Q16 4Q16 1Q17 2Q17 3Q17 4Q17 1Q18 2Q Soybean Meal (INR/kg) Q16 2Q16 3Q16 4Q16 1Q17 2Q17 3Q17 4Q17 1Q18 2Q18 Source: CPF INR 1 = THB 0.49
35 Appendix C: Highlights: 2Q18 results

36 2Q18 Results Highlights Page 35 Consolidated Revenue (THB millions) Gross Profit (THB millions) Net Profit (THB millions) +8%Y-o-Y +13%Y-o-Y +45%Y-o-Y 125, ,353 14,735 16,638 4,064 5,894 2Q17 2Q18 2Q17 2Q18 2Q17 2Q18 Consolidated sales 8% Y-o-Y Gross profit margin Net profit margin 2Q % 2Q17 3.2% 2Q % 2Q18 4.3% 0.5% 1.1%


37 2Q18: Sales & Gross Profit Margin by Business Page 36 In THB, m 2Q17 2Q18 125,970 +8% 136, % -3% 66,861 78,679 37,520 36,501-15% +6% 8,331 7,114 13,258 14,059 Thai-Livestock Thai-Aqua Overseas-Livestock Overseas-Aqua TOTAL GPM 13.1% 5.9% 8.2% 3.9% 9.2% 14.4% 22.8% 20.4% 11.7% 12.2% OPM 4.1% -3.3% 3.2% -3.3% -1.0% 8.8% 17.1% 14.7% 2.7% 5.5%
38 2Q18: Consolidated Sales Structure by Business Page 37 Sales Breakdown Livestock Aquaculture Total 2Q17 2Q18 %Change 2Q17 2Q18 %Change 2Q17 2Q18 %Change Thailand 37,520 36,501-3% 8,331 7,114-15% 45,851 43,615-5% Domestic 31,405 31,012-1% 6,835 5,972-13% 38,240 36,984-3% Export 6,115 5,489-10% 1,496 1,142-24% 7,611 6,631-13% China 26,912 31,960 19% 3,184 3,467 9% 30,096 35,427 18% Vietnam 12,111 17,922 48% 3,349 3,988 19% 15,460 21,910 42% Others 27,838 28,797 3% 6,725 6,604-2% 34,563 35,401 2% Total 104, ,180 10% 21,589 21,173-2% 125, ,353 8% % of Total Sales 83% 84% 17% 16% 100% 100%
39 2Q18: Consolidated Sales by Products Page 38 Sales Breakdown by Products Feed Farm Food Total 2Q17 2Q18 %Change 2Q17 2Q18 %Change 2Q17 2Q18 %Change 2Q17 2Q18 %Change Thailand 13,010 12,607-3% 21,493 20,419-5% 11,348 10,589-7% 45,851 43,615-5% Domestic 12,946 12,591-3% 19,321 18,576-4% 5,973 5,817-3% 38,240 36,984-3% Export % 2,172 1,843-15% 5,375 4,772-11% 7,611 6,631-13% China 27,119 29,585 9% 1,891 4, % 1,086 1,345 24% 30,096 35,427 18% Vietnam 7,443 6,983-6% 7,557 14,424 91% % 15,460 21,910 42% Others 10,541 9,671-8% 15,569 17,301 11% 8,454 8,430 0% 34,563 35,401 2% Total 58,113 58,846 1% 46,509 56,640 22% 21,348 20,867-2% 125, ,353 8%
40 Appendix D: Group of CPP s Associate Companies & Joint Ventures Kitchen of The World
41 Group of CPP s Associate Companies & Joint Ventures Page 40 As of Decemb er 31, 2017 No. Associates Type of Business Direct and Indirect Interest (%) 1 Chia Tai (Cixi) Investment Mangement Ltd. Provision of Consulting service on economic and trade Conti Chia Tai International Ltd. Production and sale of animal feed Ningxia Xiao Ming Animal Husbandary Co., Ltd. Production and sale of commercial layer chicks Qingdao Yi Bang Bio-Engineering Co., Ltd. Production and sale of animal vaccines Zhan Jiang Deni Carburetor Co., Ltd. Motorcycle carburetor and auto parts production and distribution No. Joint Ventures Type of Business Direct and Indirect Interest (%) 1 Beijing Chia Tai Feedmill Co., Ltd. Production and sale of animal feed ECI Metro Investment Co., Ltd. Investment and trade of machinery and spare parts Handan Chia Tai Feed Co., Ltd. Production and sale of animal feed Henan East Chai Tai Co., Ltd. Production and sale of animal feed Jilin Chia Tai Enterprise Co., Ltd. Production and sale of animal feed 25.21
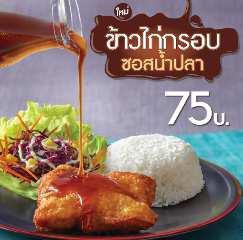
42 Appendix E: Product Samples & Retail Outlet Formats Kitchen of The World


43 Food Retail Products Page 42


44 Food Retail Products Page 43


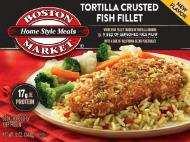
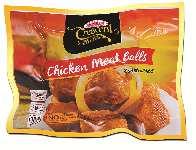

45 Food Retail Products Page 44


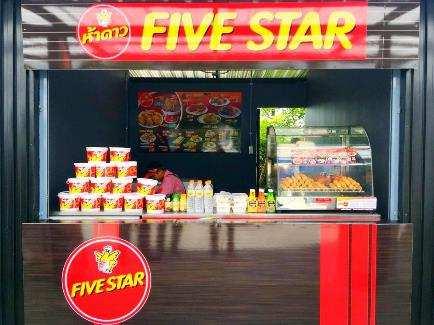
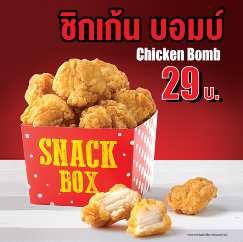
46 Food Service : Five Stars Chain Page 45 More Than 5,500 Outlets Five Star Chicken in Vietnam Five Star Chicken in India Five Star Chicken in Cambodia


47 Food Service : Chester s Page Outlets


48 Food Retail Outlets Page Stores 7 Stores


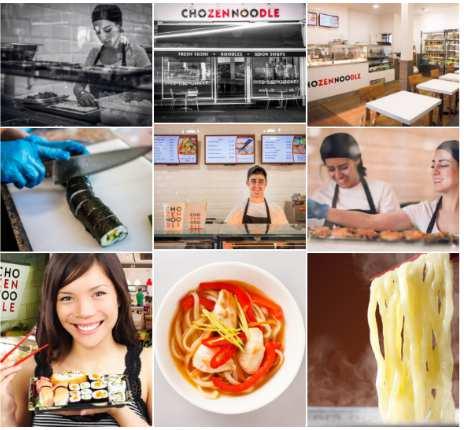
49 CP CHOZEN LIMITED Page Kiosks
50 Disclaimer This presentation contains some information from other sources that CPF does not make any representations regarding the use, validity, accuracy, or reliability of, or the results of the use of information, data but not limited to, all text, and images ( the Content ) on this presentation. Some contents may contain forward-looking statements that based on management s view upon the information currently available to us. These statements are subject to certain risks and uncertainties that could cause the actual results to be materially differed from what had been previously stated. The Content and the Forward-looking statements state within this presentation only as the date they made. The Company undertakes no responsibility on the change after that date stated herein. The material set forth herein is for informational purposes only. It should not be construed, as an offer of securities for sale. Investor Relations Office Charoen Pokphand Foods Public Company Limited 313 C.P.Tower Building, 26 th Floor, Silom Road, Bangrak, Bangkok 10500, Thailand Tel (662) / (662) Fax. (662) iroffice@cpf.co.th For Further Information: Annual Report : ncial-information/annual-report Annual Review: ncial-information/annual-review Sustainability Report:
51 Kitchen of The World
Charoen Pokphand Foods Plc.
 Charoen Pokphand Foods Plc. Content Quick Facts 9M13 Results September 30, 2013 Financial Status Appendix A: Product Sample & Retail Outlet Format B: Highlights: Q213 Results C: 3Yr Historical Results
Charoen Pokphand Foods Plc.
 Charoen Pokphand Foods Plc. 1Q14 RESULTS BRIEFING May 15, 2014 Content Business Overview Q12014 Results Briefing Financial Highlights Future Plan Appendix A: Product & Raw Materials Price Trend B: Product
Charoen Pokphand Foods Plc.
 Charoen Pokphand Foods Plc. 9M2014 : RESULTS BRIEFING November 10, 2014 Content Business Overview 9M2014 Results Briefing Financial Highlights Future Plan CPF Investment Highlights A leading global vertically
Charoen Pokphand Foods Plc.
 Charoen Pokphand Foods Plc. 9M16 Creating quality and delightful dishes for every customer RESULTS BRIEFING November 14, 2016 Contents 1 Kitchen of The World Business Overview 9M16 Results Briefing Financial
Charoen Pokphand Foods Plc.
 Charoen Pokphand Foods Plc. DR Kurobuta Premium Pork W RLD 9M12: Results Briefing November 13, 2012 Content CPF in Brief 9M12 Results September 30, 2012 Financial Status Appendix A: Highlights: Q312 Results
Charoen Pokphand Foods Plc.
 Charoen Pokphand Foods Plc. Content Quick Facts 1H13 Results June 30, 2013 Financial Status Appendix A: The Acquisition of CP-Meiji and RBPI B: Product Sample & Retail Outlet Format C: Highlights: Q213
menus around The World Y2009 Results 19 February 2010
 Charoen Pokphand Foods Plc. Enjoy menus around The World Y2009 Results 19 February 2010 Content Company s Brief Overview Highlights: 2009 Results Highlights: 31 Dec 09 Financial Status Appendix A: Acquisition
The Company was listed on the Stock Exchange of Thailand on 21 December 1987.
 For the three-month and six-month periods ended 2016 (Unaudited) Note Contents 1 General information 2 Basis of preparation of the interim financial statements 3 Business combination by acquisition of
CHAROEN POKPHAND FOODS PLC
 CHAROEN POKPHAND FOODS PLC No. 21/2015 31 March 2015 Company Rating: A+ Issue Ratings: Senior unsecured A+ Outlook: Stable Company Rating History: Date Rating Outlook/Alert 20/06/14 AA- Negative 19/05/11
Charoen Pokphand Foods Public Company Limited and its Subsidiaries. Annual financial statements and Audit Report of Certified Public Accountant
 Annual financial statements and Audit Report of Certified Public Accountant For the years ended 31 December 2010 and 2009 Audit Report of Certified Public Accountant To the Shareholders of Charoen Pokphand
Jakarta, April 5 th, Unofficial Translation
 Jakarta, April 5 th, 2017 Unofficial Translation Content Company Overview Operational Performance Financial Highlights Challenges & Strategies Appendix 2 An Introduction To Japfa Tbk Vertically integrated
The interim financial statements were authorised for issue by the executive directors on 9 November 2011.
 Note Contents 1 General information 2 Basis of preparation of the interim and new Thai Financial Reporting Standards 3 Changes in accounting policies 4 Related party transactions 5 Accounts receivable
Charoen Pokphand Foods Public Company Limited and its Subsidiaries. Interim financial statements and Review Report of Certified Public Accountant
 Interim and Review Report of Certified Public Accountant For the three-month and nine-month periods ended 30 September 2011 Review Report of Certified Public Accountant To the Board of Directors of Charoen
Thai Union Group Public Company Limited
 2Q17: Strict cost control aided operation Revenue 2Q17 sales grew by 1.2 YoY to THB 34,818mn. Soft sales growth was driven by weak market demand amid product repricing and the European currency depreciation.
Message from Executives
 Message from Executives Mr. Sooksunt Jiumjaiswanglerg Chief Executive Officer Agro Industrial Business and Co-President Mr. Dhanin Chearavanont Chairman of the Board of Directors Mr. Sukhawat Dansermsuk
Charoen Pokphand Foods Plc.
 Charoen Pokphand Foods Plc. Monthly Newsletter Listed on the Stock Exchange of Thailand Volume 13 Issue 4 April, 2013 CPF News : The Annual General Shareholders Meeting No.1/2013 Topics : C.P.Pokphand
Buy (from Sell) Charoen Pokphand Foods (CPF TB) Earnings Recovery To Kick In
 Charoen Pokphand Foods (CPF TB) Earnings Recovery To Kick In") May-12 Jul-12 Sep-12 Nov-12 Jan-13 Mar-13 Vol m Results Review, Charoen Pokphand Foods (CPF TB) Buy (from Sell) Consumer Non-cyclical - Food Target Price: THB38.0 Market Cap: USD7,900m Price: THB30.3 Earnings
May-12 Jul-12 Sep-12 Nov-12 Jan-13 Mar-13 Vol m Results Review, Charoen Pokphand Foods (CPF TB) Buy (from Sell) Consumer Non-cyclical - Food Target Price: THB38.0 Market Cap: USD7,900m Price: THB30.3 Earnings
1 Executive Summary... 1
 Topics Page 1 Executive Summary... 1 2 Detail of the Connected Transactions 2.1 Practices and Sources of Information in the Preparation of the Opinion of the Independent Financial Advisor. 7 2.2 Overview
IMPORTANT NOTICE NOT FOR DISTRIBUTION TO ANY ADDRESS IN THE U.S.
 IMPORTANT NOTICE NOT FOR DISTRIBUTION TO ANY ADDRESS IN THE U.S. IMPORTANT: You must read the following disclaimer before continuing. The following disclaimer applies to the offering circular (the Offering
INVESTOR PRESENTATION 9M PT Japfa Comfeed Indonesia Tbk
 INVESTOR PRESENTATION 9M 2015 PT Japfa Comfeed Indonesia Tbk Agenda Company Overview Key Investment Highlights Financial Highlights Appendix 2 Company Overview Introduction to Japfa Tbk Established vertically
Charoen Pokphand Food - CPF
 3QCY12 results seen down y-y and q-q Bloomberg Reuters CPF TB CPF.BK Report type: Company Preview Company Overview CPF is a Thailand-based company engaged in agro-industrial and integrated food businesses
last YEAR. 190 / 100 kg % Placings Broiler. Jul. Jul. Jan. Jan. Oct. Oct. Oct. Apr. Apr 125%
 POULTRY MEAT Last update: EVOLUTION 185.18 last YEAR 19 / 1 kg 18 + 1.9% -.1% 175 /1 kg carcase weight 17 4. 1.1 3. 6 3 2 4 1 2 Main Producers Poultry meat production ( 1 Tonnes product weight) ( Forecasts
First Quarter of the Fiscal Year Ending December 31, 2015 Unicharm Presentation Materials for Investor Meeting
 First Quarter of the Fiscal Year Ending December 31, 2015 Unicharm Presentation Materials for Investor Meeting May 8, 2015 Takahisa Takahara President and CEO Unicharm Corporation Projections stated herein
Thai Union Group Public Company Limited
 3Q18: Best quarterly net profits since 2015 Revenue 3Q18 sales declined by 1.9% YoY to THB 34,174mn, driven mainly by Thai Baht appreciation against US Dollar (1.2% YoY) and raw material price decline.
PEER GROUPS CMP MARKET CAP EPS P/E (X) P/BV(X) DIVIDEND Company Name (Rs.) Rs. in mn. (Rs.) Ratio Ratio (%)
 P/BV(X) DIVIDEND Company Name (Rs.) Rs. in mn. (Rs.) Ratio Ratio (%)") BUY CMP 469.40 Target Price 540.00 AVANTI FEEDS LIMITED Result Update (PARENT BASIS): Q2 FY16 DECEMBER 12 th 2015 ISIN: INE871C01012 Index Details Stock Data Sector Food products BSE Code 512573 Face Value
BUY CMP 469.40 Target Price 540.00 AVANTI FEEDS LIMITED Result Update (PARENT BASIS): Q2 FY16 DECEMBER 12 th 2015 ISIN: INE871C01012 Index Details Stock Data Sector Food products BSE Code 512573 Face Value
BUY. Venky s India Ltd. A hen that will lay golden eggs. Venky s India Ltd Initiating Coverage. April
 Venky s India Ltd. A hen that will lay golden eggs Venky s is an integrated player in the poultry business. Venky s rears chicken which is sold as live birds to distributors and which are finally sold
Disclosure of the Acquisition of Ordinary Shares of SuperDrob and a Joint Investment in a Newly Established Subsidiary
 Bor Mor Jor. Jor Por Or. 101/2016 30 December 2016 Re: Attn: Disclosure of the Acquisition of Ordinary Shares of SuperDrob and a Joint Investment in a Newly Established Subsidiary President The Stock Exchange
Thai Union Group Public Company Limited
 2Q18: Recovering operations Revenue 2Q18 sales declined by 2.0% YoY to THB 34,137mn. This was driven mainly by Thai Baht appreciation against US Dollar (7.0% YoY). Excluding the impact of foreign exchange,
The Company was listed on the Stock Exchange of Thailand on 21 December 1987.
 Note Contents 1 General information 2 Basis of preparation of the interim financial statements 3 Business combination by acquisition of shares 4 Related party transactions 5 Accounts receivable - trade
Analysts Meeting 3Q16 Results Presentation
 Analysts Meeting 3Q16 Results Presentation 8 November 2016 Page 1 Disclaimer The information contained in our presentation is intended solely for your personal reference only. In addition, such information
May Domestic Exports Imports. Volume Tonnes SW. MAT May-14 4, ,960 38, ,
 May 2014 Overview Table 1.1 Overview trends for Domestic, Export and Import trade Domestic Exports Imports Month Slaughter Pigmeat (Tonnes) Volume Tonnes SW Value $AUD (Million) Volume Tonnes SW Value
JBS S.A. August / September, 2013
 JBS S.A. August / September, 2013 Disclaimer This release contains forward-looking statements relating to the prospects of the business, estimates for operating and financial results, and those related
Annual Results Presentation. for the year ended 30 September 2014
 Annual Results Presentation for the year ended 30 September 2014 AGENDA Business Overview Poultry Industry Trends Financial Overview Industry Matters Prospects Q & A 2 2 BUSINESS OVERVIEW 3 THE PERIOD
Disclaimer. We define EBIT as EBITDA less amortizations.
 H1 2012 2 Disclaimer This document is purely informative and does not intend to be comprehensive. Financial information included in this presentation has been calculated in accordance with International
December Domestic Exports Imports. Volume Tonnes SW. MAT December-14 4, ,192 39, ,
 December 2014 Overview Table 1.1 Overview trends for Domestic, Export and Import trade Domestic Exports Imports Month Slaughter Pigmeat (Tonnes) Volume Tonnes SW Value $AUD (Million) Volume Tonnes SW Value
NIREUS AQUACULTURE S.A.
 Athens Greece 29 March 2013 12 Months 2012 Results Presentation NIREUS AQUACULTURE S.A. Main events 12M 2012 Total sales up +2.7% to 202.2 mi. Fish sales value up +5.5% to 163 mi., volume up +8.3% to 31.6
EU Market Situation for Eggs. Committee for the Common Organisation of the Agricultural Markets 30 August 2018
 EU Market Situation for Eggs Committee for the Common Organisation of the Agricultural Markets 30 August 2018 F O R E C A S T EU production of eggs for consumption (expert forecast May 2018) Source : Experts
Apex Frozen Foods Limited
 Investor Presentation Apex Frozen Foods Limited CIN: L15490AP2012PLC080067 Q1 FY19 Results Safe Harbor This presentation and the accompanying slides (the Presentation ), which have been prepared by Apex
CMP Rs. 109 BSE Code NSE Symbol - AVANTI
 @hiddengemsindia May 27, 2013 Ashish Chugh s HIDDEN GEMS. in search of Market Beating Stocks Avanti Feeds Ltd. CMP Rs. 109 BSE Code 512573 NSE Symbol - AVANTI With Equity, Technical & Marketing support
The interim financial statements were approved for issue by the executive directors on 9 May 2012.
 Note Contents 1 General information 2 Basis of preparation of the interim financial statements 3 Changes in accounting policy 4 Business combinations - buy shares 5 Related party transactions 6 Accounts
Presentation for Institutional Investors (FY16 1 st Half)
") Nippon Paint Holdings Co., Ltd. Presentation for Institutional Investors (FY16 1 st Half) November 17, 2016 Nippon Paint Holdings Co., Ltd. Tetsushi Tado, President & CEO Table of Contents 1.Financial
Nippon Paint Holdings Co., Ltd. Presentation for Institutional Investors (FY16 1 st Half) November 17, 2016 Nippon Paint Holdings Co., Ltd. Tetsushi Tado, President & CEO Table of Contents 1.Financial
2016 Outward Foreign Direct Investment of Thai Listed Firms
 Research Paper 1/2017 2016 Outward Foreign Direct Investment of Thai Listed Firms Research Department The Stock Exchange of Thailand May 2017 www.set.or.th/setresearch Contents Page Executive Summary 1
Charoen Pokphand Food - CPF Livestock and aquaculture businesses seen as key earnings drivers in CY14
 Livestock and aquaculture businesses seen as key earnings drivers in CY14 Bloomberg Reuters CPF TB CPF.BK Report type: Company Update Company Overview CPF is a Thailand-based company engaged in agroindustrial
Pilgrim s Pride Corporation (NASDAQ: PPC) Pilgrim s Acquires Moy Park September 11, 2017
 Pilgrim s Acquires Moy Park September 11, 2017") Pilgrim s Pride Corporation (NASDAQ: PPC) Pilgrim s Acquires Moy Park September 11, 2017 Cautionary Notes and Forward-Looking Statements Statements contained in this presentation that share our intentions,
Pilgrim s Pride Corporation (NASDAQ: PPC) Pilgrim s Acquires Moy Park September 11, 2017 Cautionary Notes and Forward-Looking Statements Statements contained in this presentation that share our intentions,
NIREUS AQUACULTURE S.A.
 Athens Greece 30 May 2013 3 Months 2013 Results Presentation NIREUS AQUACULTURE S.A. Main events 3M 2013 Total Group sales up +1% to 44.6 mi. Exports up +2% to 35.7 mi - 80% of total sales. Cash generation
Tegel Group Holdings Limited
 Tegel Group Holdings Limited FY17 Full Year Results Presentation 27 June 2017 1 TEGEL GROUP HOLDINGS FY17 RESULTS PRESENTATION Disclaimer This presentation contains summary information about Tegel Group
Financial Results for FY2016-Q2
 Financial Results for FY216-Q2 July, 216 OSG Corporation 216 OSG Corporation OSG at glance 1. Products Tools to cut threads Consumable cutting tools used in machine tools Tap World leader in market share
(iii) Broiler farm Growing day-old chicks to be reared into full-grown chicken for their meats (boiler).
 Broiler farm Growing day-old chicks to be reared into full-grown chicken for their meats (boiler).") THE POULTRY INDUSTRY IN MALAYSIA The poultry industry is an important source to supply meat protein to Malaysian. The total value of sales value for chicken eggs and chicken meat ex-farm are believed to
THE POULTRY INDUSTRY IN MALAYSIA The poultry industry is an important source to supply meat protein to Malaysian. The total value of sales value for chicken eggs and chicken meat ex-farm are believed to
Thailand s economic resilience amid global uncertainties. March 2017
 Thailand s economic resilience amid global uncertainties March 217 Thailand s economic resilience amid global uncertainties I. Thailand s economic resilience II. Thai corporates target for sustainable
- Translation - Minutes of the Annual General Shareholders Meeting in 2018 GFPT Public Company Limited
 - Translation - Minutes of the Annual General s Meeting in 2018 GFPT Public Company Limited Date Thursday 5 th April 2018 Venue Company Conference Room, M Floor GFPT Tower, 312, Rama 2 Road, Bangmod, Jomthong,
CP All CPALL TB / CPALL.BK Siam Makro MAKRO TB / MAKR.BK What happens if CPALL reduces its stake in MAKRO?
 COMPANY UPDATE CP All CPALL TB / CPALL.BK Siam Makro MAKRO TB / MAKR.BK What happens if CPALL reduces its stake in MAKRO? Sector: Consumer/Retail Neutral 17 June 1 Investment thesis MAKRO s recent share
GOLDMAN SACHS 17 TH ANNUAL AGRIBUSINESS CONFERENCE. February 26, 2013
 GOLDMAN SACHS 17 TH ANNUAL AGRIBUSINESS CONFERENCE February 26, 2013 DENNIS LEATHERBY, CFO FORWARD-LOOKING STATEMENTS Certain information contained in this presentation may constitute forward-looking statements,
March Domestic Exports Imports. Volume Tonnes SW. MAT Mar-16 4, ,322 32, , % Change 3.8% 5.2% 13.2% 8.0% 1.1% 1.
 March 2017 Overview Table 1.1 Overview trends for Domestic, Export and Import trade Domestic Exports Imports Month Slaughter Pigmeat (Tonnes) Volume Tonnes SW Value $AUD (Million) Volume Tonnes SW Value
Tegel Group Holdings Limited
 Tegel Group Holdings Limited FY17 Interim Results Presentation 15 December 2016 TEGEL GROUP HOLDINGS LIMITED FY17 INTERIM RESULTS 1 Disclaimer This presentation contains summary information about Tegel
Analysts Meeting. FY2016 Results Presentation. 21 February Page 1
 Analysts Meeting FY2016 Results Presentation 21 February 2017 Page 1 Disclaimer The information contained in our presentation is intended solely for your personal reference only. In addition, such information
For personal use only
 Tegel Group Holdings Limited FY18 Interim Results Presentation 6 December 2017 1 TEGEL GROUP HOLDINGS FY18 INTERIM RESULTS PRESENTATION Disclaimer This presentation contains summary information about Tegel
Athens Greece May Months 2009 Results Presentation
 Athens Greece May 2009 3 Months 2009 Results Presentation NIREUS AQUACULTURE S.A. Nireus at a glance The leader in seabass and seabream fish farming - A fully integrated producer - Production facilities
Third Quarter of Fiscal Year Ending December 31, 2017 Financial Performance Unicharm Investor Meeting Presentation Materials
 Third Quarter of Fiscal Year Ending December 31, 2017 Financial Performance Unicharm Investor Meeting Presentation Materials November 10, 2017 Takahisa Takahara President and CEO Unicharm Corporation Projections
CP ALL Public Company Limited. FY2013: Presentation Results
 CP ALL Public Company Limited FY2013: Presentation Results February 2014 Financial Highlights Units: MB Company Only 4Q12 4Q13 %Chg 2012 2013 %Chg Total Revenue 53,189 57,984 +9.0% 194,695 217,495 +11.7%
Focused on Profitable, Consistent Growth
 Focused on Profitable, Consistent Growth Investor Presentation May 2014 FORWARD-LOOKING STATEMENTS Certain information contained in this presentation may constitute forward-looking statements, such as
Interim Results 2019 March 2019
 Interim Results 2019 March 2019 Disclaimer This presentation may contain forward-looking statements and projections. There can be no certainty of outcome in relation to the matters to which the forward-looking
Third Quarter of the Fiscal Year Ending December 31, 2016 Unicharm Presentation Materials for Investor Meeting
 Third Quarter of the Fiscal Year Ending December 31, 2016 Unicharm Presentation Materials for Investor Meeting November 4, 2016 Takahisa Takahara President and CEO Unicharm Corporation Projections stated
Hester Biosciences Limited
 Pharmaceuticals September 24, 2012 CMP Rs. 123.5 BSE Code 524669 BSE ID HESTERBIO High/Low 1Y (Rs.) 142.5/100.0 Average Volume (3M) 2,954 Market Cap (Rs. Cr.) 70 Shareholding % Jun-12 Mar-12 Promoters
Financial Results for Third Quarter Ended Sep 30, Pilgrim s Pride Corporation (NASDAQ: PPC)
") Financial Results for Third Quarter Ended Sep 30, 2018 Pilgrim s Pride Corporation (NASDAQ: PPC) Cautionary Notes and Forward-Looking Statements Statements contained in this presentation that share our
Financial Results for Third Quarter Ended Sep 30, 2018 Pilgrim s Pride Corporation (NASDAQ: PPC) Cautionary Notes and Forward-Looking Statements Statements contained in this presentation that share our
Corporate Information
 Corporate Information DIRECTORS Mr Dhanin Chearavanont Mr Sumet Jiaravanon Mr Prasert Poongkumarn Mr Min Tieanworn Mr Thirayut Phitya-Isarakul Mr Thanakorn Seriburi Mr Veeravat Kanchanadul Mr Budiman Elkana
March, 2010 JBS S.A. In God We Trust, Nature We Respect
 March, 2010 JBS S.A. 0 In God We Trust, Nature We Respect Our Values Excellence Planning Determination Discipline Availability Openness Simplicity 1 Agenda Company Overview Market Overview 4Q09 Highlights
Polyplex (Thailand) Public Limited Company
 Public Limited Company") Polyplex (Thailand) Public Limited Company Presentation at the SET Opportunity Day Monday, 19 th March 2012 Website : www.polyplexthailand.com Contents BOPET Film Industry Polyplex group Polyplex Competitive
Polyplex (Thailand) Public Limited Company Presentation at the SET Opportunity Day Monday, 19 th March 2012 Website : www.polyplexthailand.com Contents BOPET Film Industry Polyplex group Polyplex Competitive
PROPOSED SPIN-OFF AND SEPARATE LISTING OF CHIA TAI ENTERPRISES INTERNATIONAL LIMITED ON THE MAIN BOARD OF THE STOCK EXCHANGE
 Hong Kong Exchanges and Clearing Limited and The Stock Exchange of Hong Kong Limited take no responsibility for the contents of this announcement, make no representation as to its accuracy or completeness
1Q18 Results Presentation 8 May Page 1
 1Q18 Results Presentation 8 May 2018 Page 1 Disclaimer The information contained in our presentation is intended solely for your personal reference only. In addition, such information contains projections
Conference Call Second Quarter 2013 Financial Results. Presentation3
 Conference Call Second Quarter 2013 Financial Results Presentation3 August 2, 2013 Agenda 1 Agenda 1 2 Opening Remarks 2Q13 Highlights 3 Operating and Financial Review 4 Closing Remarks 5 Q&A 2 1 Alicorp
Nielsen s FMCG Index & Fuel Index Jan 2014 = 100 Jan 2014 = 100. Service Index* & Net Tourist Spending Index Jan 2014 = 100
 1 = Nielsen s FMCG Index & Fuel Index = = 115 15 95 85 Durable and Semi-durable Indices Nielsen s FMCG Index sa, 3mma Fuel Index, sa Fuel Index sa, 3mma (RHS) Semi-durable Index sa,3mma Durable Index sa,
Financial Results for Fourth Quarter and Year Ended December 30, Pilgrim s Pride Corporation (NASDAQ: PPC)
") Financial Results for Fourth Quarter and Year December 30, 2018 Pilgrim s Pride Corporation (NASDAQ: PPC) Cautionary Notes and Forward-Looking Statements Statements contained in this presentation that
Financial Results for Fourth Quarter and Year December 30, 2018 Pilgrim s Pride Corporation (NASDAQ: PPC) Cautionary Notes and Forward-Looking Statements Statements contained in this presentation that
Thai Union Group Public Company Limited
 1Q18: Challenging quarter Revenue 1Q18 sales declined by 5.5% YoY to THB 29,703mn. This was driven mainly by two factors; product price adjustment to reflect falling lower tuna raw material prices as well
Economic outlook. Bangkok Bank position. Strategic priorities and targets
 20110721 1 Topics 1 2 3 Economic outlook Bangkok Bank position Strategic priorities and targets 2 GDP growth outlook remains strong 6 Baht trn 4 +2.5% 2.3% +7.8% +4 5% +3.2% +2.6% 2 0 2008 2009 2010 2011f
EU Market Situation for Poultry. Committee for the Common Organisation of the Agricultural Markets 24 August 2017
 EU Market Situation for Poultry Committee for the Common Organisation of the Agricultural Markets 24 August 217 -7.2% -7.7% -1.6% -1.7% -1.7% -2.1% -2.5% 4.1% 3.6% 3.5% 2.8% 1.9% 1.2%.8%.8%.6%.4%.2%.%.%.%.%
Executive Summary of Consolidated Financial Results for the year ended March 31,2018. Yakult Honsha Co., Ltd.
 Executive Summary of Consolidated Financial Results for the year ended March 31,2018 Yakult Honsha Co., Ltd. May 10 th 2018 General outline of Consolidated financial results Total Increase in sales and
CCL Products BUY. Brewing Steadily. CMP Target Price `300 `360. Initiating Coverage Coffee. January 4, year price chart
 5-Jan 5-Apr 5-Jul 5-Oct 5-Jan 5-Apr 5-Jul 5-Oct 5-Jan 5-Apr 5-Jul 5-Oct CCL Products Brewing Steadily CCL Products Limited (CCL) is the largest Indian manufacturer and exporter of instant coffee. With
International Development & Investment Corporation I.D.I (HOSE- IDI)
") COMPANY UPDATE 22/12/2015 International Development & Investment Corporation I.D.I (HOSE- IDI) STRONG GROWTH THANKS TO SOARING EXPORTS TO CHINA One of Vietnam s leading Pangasius fillet processing companies,
COMPANY UPDATE 22/12/2015 International Development & Investment Corporation I.D.I (HOSE- IDI) STRONG GROWTH THANKS TO SOARING EXPORTS TO CHINA One of Vietnam s leading Pangasius fillet processing companies,
NIREUS Aquaculture S.A.
 NIREUS Aquaculture S.A. Annual Ordinary Meeting of Shareholders 28 June 2013 Stratis Elissaios CFO Key Figures 2012 - Group values in mi. 12M 2012 12M 2011 Volumes of fish sold (thou.tons) 31,6 29,2 Operating
Athens Greece 31 March Annual 2017 Results Presentation NIREUS AQUACULTURE S.A.
 Athens Greece 31 March 2018 Annual 2017 Results Presentation NIREUS AQUACULTURE S.A. Table of Contents Pages I. Our Vision... 3 II. Profile..4-15 III. Sales by Business Sector....16 IV. Sales evolution...
CP ALL Public Company Limited
 CP ALL Public Company Limited 2Q18 Performance Highlights August 2018 Financial Highlights Unit : Million Baht 2Q17 2Q18 %Chg 1H17 1H18 %Chg Company Only Total Revenue 77,049 86,203 +11.9% 146,742 165,189
Monetary Policy: A Key Driver for Long Term Macroeconomic Stability
 Monetary Policy: A Key Driver for Long Term Macroeconomic Stability Julio Velarde Governor Central Bank of Peru March 2016 Agenda 1. Peru s growth is based on strong fundamentals 2. Recent economic developments
December Overview. Table 1.1 Overview trends for Domestic, Export and Import trade
 December 2016 Overview Table 1.1 Overview trends for Domestic, Export and Import trade Domestic Exports Imports Month Slaughter Pigmeat (Tonnes) Volume Tonnes SW Value $AUD (Million) Volume Tonnes SW Value
AUDITOR S REPORT ON REVIEW OF INTERIM FINANCIAL INFORMATION. To the Shareholders and the Board of Directors of Thai Union Group Public Company Limited
 AUDITOR S REPORT ON REVIEW OF INTERIM FINANCIAL INFORMATION To the Shareholders and the Board of Directors of Thai Union Group Public Limited I have reviewed the accompanying consolidated and company statements
Investor Presentation June Henry Demone, CEO Kelly Nelson, CFO
 Investor Presentation June 2013 Henry Demone, CEO Kelly Nelson, CFO Disclaimer Certain statements made in this presentation are forward-looking and are subject to important risks, uncertainties and assumptions
CP ALL Public Company Limited
 CP ALL Public Company Limited 3Q18 Performance Highlights November 2018 Financial Highlights Unit : Million Baht 3Q17 3Q18 %Chg 9M17 9M18 %Chg Company Only Total Revenue 77,826 84,013 +8.0% 224,569 249,202
Jul 2018 = 20.3 Bn USD Ex. Gold = 20.1 Bn USD. H1 H2 H1 Q1 Q2 Jun Jul
 1 Jun = 21.8 Bn USD Ex. Gold = 21.3 Bn USD %YoY Export Value Source: Compiled from Customs Department s data P = Preliminary data = 20.3 Bn USD Ex. Gold = 20.1 Bn USD P P Share P P H1 H2 H1 Q1 Q2 Jun %MoM
Nielsen s FMCG Index & Fuel Index Jan 2014 = 100 Jan 2014 = 100. Service Index* & Net Tourist Spending Index Jan 2014 = 100
 1 = Nielsen s FMCG Index & Fuel Index = = 115 105 95 85 Durable and Semi-durable Indices Nielsen s FMCG Index sa, 3mma Fuel Index, sa Fuel Index sa, 3mma (RHS) Semi-durable Index sa,3mma Durable Index
4Q16 and 2016 Results
 JBS S.A. (BVM&FBOVESPA: JBSS3; OTCQX: JBSAY) São Paulo, March 13 th, 2017 and 2016 Results JBS Ended With Net Income of R$693.9 million and a free cash generation of R$2.9 billion JBS ended with net revenues
Better poultry value chain development through microfinance in Vietnam
 Better poultry value chain development through microfinance in Vietnam 6th University Meets Microfinance Workshop on Savings and Rural Finance 17 & 18 June 2011 University of Groningen, Groningen. Netherlands
April Domestic Exports Imports. Volume Tonnes SW. MAT Apr-16 4, ,332 33, , % Change 2.8% 4.3% 12.6% 5.9% 2.9% 4.
 April 2017 Overview Table 1.1 Overview trends for Domestic, Export and Import trade Domestic Exports Imports Month Slaughter Pigmeat (Tonnes) Volume Tonnes SW Value $AUD (Million) Volume Tonnes SW Value
Jun 2018 = 21.8 Bn USD Ex. Gold = 21.3 Bn USD
 1 May = 22.3 Bn USD Ex. Gold = 21.9 Bn USD %YoY Source: Compiled from Customs Department s data P = Preliminary data Jun = 21.8 Bn USD Ex. Gold = 21.3 Bn USD P P Share P P H1 H2 H1 Q1 Q2 May Jun %MoM sa
ANNOUNCEMENT OF ANNUAL RESULTS FOR THE YEAR ENDED 31 DECEMBER 2015
 Hong Kong Exchanges and Clearing Limited and The Stock Exchange of Hong Kong Limited take no responsibility for the contents of this announcement, make no representation as to its accuracy or completeness
Agenda. Financial Review. Review of Operations. Future Plans and Strategies. Open Forum
 22 October 2009 1 Disclaimer The information contained in this presentation is intended solely for your personal reference. Such information is subject to change without notice, its accuracy is not guaranteed
BreadTalk Group Limited Financial Results Third Quarter 2016
 BreadTalk Group Limited Financial Results Third Quarter 2016 Bakery Food Atrium Restaurant 3Q 2016 FINANCIAL HIGHLIGHTS Income Statement Highlights S$ Million 3Q 2016 3Q 2015 Y/Y 9M 2016 9M 2015 Y/Y Revenue
Sri Trang Agro-Industry Public Company Limited
 Sri Trang Agro-Industry Public Company Limited Management Discussion and Analysis, Q3 2013 14 th November 2013 STA : A World Leading Natural Rubber Player Financial result overview Our strategic plan to
For personal use only
 Click to edit Master text styles IDP Education FY16 Results Presentation Twelve months to 30 June 2016 11 February 2016 Important notice and disclaimer Click Disclaimer to edit Master text styles The material
The Siam Cement Public Company Limited Management s Discussion and Analysis (MD&A) Consolidated Financial Results: Q2/10 and H1/10
 Consolidated Financial Results: Q2/10 and H1/10") The Siam Cement Public Company Limited Management s Discussion and Analysis (MD&A) Consolidated Financial Results: Q2/10 and H1/10 Q2/10 Net Profit of 7,295 MB, up 6% q-o-q and 7% y-o-y. H1/10 Net Profit
The Siam Cement Public Company Limited Management s Discussion and Analysis (MD&A) Consolidated Financial Results: Q2/10 and H1/10 Q2/10 Net Profit of 7,295 MB, up 6% q-o-q and 7% y-o-y. H1/10 Net Profit
QL RESOURCES BERHAD (QL)
") QL RESOURCES BERHAD (QL) All figures in millions of Ringgit Malaysia except per share values and ratios Analysis Date: 14/06/2013 Financial Year: 2012 31/03/2012 Latest Quarter: 31/03/2012 Price: 3.17
QL RESOURCES BERHAD (QL) All figures in millions of Ringgit Malaysia except per share values and ratios Analysis Date: 14/06/2013 Financial Year: 2012 31/03/2012 Latest Quarter: 31/03/2012 Price: 3.17
Asia Key Economic and Financial Indicators 13-Jul-17
 Asia Key Economic and Financial Indicators -Jul-7 ASEAN Brunei (BN) Cambodia (KH) Indonesia () Laos (LA) Malaysia () Myanmar (MM) Philippines () Singapore () Thailand () Vietnam () East Asia China (CN)