ALFA Reports 1Q18 EBITDA of US $629 million, a growth of 19% year-over-year
|
|
|
- Pamela Heath
- 5 years ago
- Views:
Transcription
1 ALFA, S.A.B. DE C.V. FIRST QUARTER 2018 FINANCIAL REPORT ALFA Reports 1Q18 EBITDA of US $629 million, a growth of 19% year-over-year Monterrey, N.L., Mexico, April 18, ALFA, S.A.B. de C.V. (ALFA), a leading Mexican industrial company, reported today its 1Q18 unaudited financial results. Total revenues were US $4,576 million, up 14% year-on-year due to higher sales achieved across all business units. EBITDA was US $629 million, up 19% vis-à-vis 1Q17. Commenting on the Company s results Mr. Alvaro Fernandez, ALFA s President, said: This was a good quarter for ALFA as all our businesses showed improvement during 1Q18. Importantly, we are seeing better performance across many regions and less volatility from commodities. Additionally, many of our portfolio companies had a significant event in the quarter as they executed on the long-term strategic plan. By company; Sigma s results were driven by a strong performance in Mexico; Alpek saw higher volumes and better margins in polyester, while Nemak benefited from solid volumes in the Americas and less negative metal lag. Axtel also continued to improve and completed the sale of the final tranche of transmission towers. Lastly, Newpek advanced its strategy to concentrate in Mexico with a selected acreage sale in the Eagle Ford Shale. Consolidated capital expenditures and acquisitions amounted to US $185 million during 1Q18. Net Debt at the quarter end of US $6,741 million was 6% higher when compared to the US $6,359 million in 1Q17. At the end of the quarter, financial ratios were: Net Debt to EBITDA: 3.2 times; Interest Coverage: 4.8 times. Majority Net Income was US $189 million in 1Q18, 23% higher than the US $154 million reported in 1Q17. This improvement is mainly explained by higher operating income that offset lower exchange gains than those recorded in 1Q17. Selected Financial Information (US $ million) 1Q18 4Q17 1Q17 Var. % vs. 4Q17 Var. % vs. 1Q17 Consolidated Revenues 4,576 4,297 3, Sigma 1,552 1,593 1,350 (3) 15 Alpek 1,532 1,321 1, Nemak 1,235 1,094 1, Axtel (12) 11 Newpek Consolidated EBITDA Sigma (17) 20 Alpek Nemak Axtel (4) 27 Newpek 16 3 (2) Majority Net Income 189 (31) Capital Expenditures & Acq (26) (38) Net Debt 6,741 6,300 6, Net Debt/LTM EBITDA * LTM Interest Coverage * * Times. LTM = Last 12 months 1 EBTIDA = Operating Income + depreciation and amortization of assets. CONTENT: SUMMARY OF GROUPS 2 ALFA FINANCIAL TABLES 6 ALFA GROUPS FINANCIAL INFORMATION 10
2 Summary of subsidiary performance during 1Q18 ALFA S FIRST QUARTER Sigma s revenues amounted to U.S. $1,552 million, up 15% from 1Q17, and all the regions had solid sales growth year-on-year. Mexico sales increased 14% and U.S. sales increased 4%, both mainly driven by higher volumes and average prices. European sales increased 22%, benefitting from the consolidation of the September 2017 Caroli acquisition. Latin America sales increased 14%, reflecting the acquisition of Supemsa completed at the end of 2Q17. Sigma reported 1Q18 EBITDA of U.S. $162 million, up 20% year-on-year; this increase was primarily due to a solid performance of Mexican operations, the consolidation of Supemsa and Caroli, and a more favorable currency environment in Europe and Mexico. During 1Q18, capital expenditures totaled U.S. $27 million. These funds were utilized for maintenance and minor projects across the company. At the end of 1Q18, Net Debt was U.S. $2,078 million, 13% higher than in 1Q17, mainly explained by the funds related to the Bureba facility and the acquisitions of Supemsa and Caroli. Financial ratios at the end of 1Q18 were: Net Debt to EBITDA, 3.0 times; Interest Coverage, 6.0 times. (See appendix A for more comprehensive analysis of Sigma s 1Q18 financial results) Alpek s revenues for 1Q18 totaled US $1.5 billion, up 19% year-on-year mainly due to higher sales volumes and average prices in both business segments. Average 1Q18 consolidated prices increased 15% when compared with 1Q17, reflecting higher oil and feedstock prices. 1Q18 consolidated volume was up 3% year-on-year, mainly supported by growth in polyester. 1Q18 EBITDA was US $181 million, including a US $16 million non-cash inventory gain and US $5 million in nonrecurring legal fees/expenses. Adjusting for these two items, Comparable Consolidated EBITDA was US $170 million and US $131 million in 1Q18 and 1Q17 respectively. Both business segments posted better-than-expected results supported by higher oil prices, sustained polyester margin recovery and normalized operations at M&G Mexico, among others. The restructuring process associated to M&G USA s Corpus Christi project advanced in 1Q18. Corpus Christi Polymers LLC (CC Polymers), a newly formed joint venture between Alpek, Indorama and Far Eastern, received court approval to acquire the Corpus Christi project and other related assets from M&G USA. The approved terms imply a total value of US $1.169 billion in cash and other capital contributions. Each JV partner will contribute up to US $390 million, subject to final adjustments. Alpek s portion will be reduced by a US $200 million non-cash contribution associated to its second lien on the Corpus Christi project. In accordance with IFRS, Alpek may recognize its non-cash contribution as a partial recovery of previous asset impairments upon closing of the transaction, which is subject to approval by governmental authorities. Alpek, Indorama and Far Eastern will each have the right to receive one-third of the PTA and PET produced at the Corpus Christi project upon completion. CC Polymers will obtain additional resources from the three JV partners to resume the plant s construction upon closing of the transaction. A cost estimation and timeline for the project will be announced in due course. The transaction with Petrobras received the required regulatory approval from the CADE Court in Brazil during 1Q18. Since then, Alpek has worked closely with Petrobras to ensure that all agreed upon conditions are fulfilled prior to closing, which is expected before the end of the second quarter.
3 ALFA S FIRST QUARTER The process to finalize the sale of Alpek s two cogeneration power plants in Mexico is moving forward as the 350 MW Altamira plant s construction is on track to be completed before year-end. However, issues in the implementation of regulatory changes in Mexican power tariffs have weighed on timing. 1Q18 Capex and acquisitions were US $56 million. Most of these funds were invested in the construction of the Altamira power cogeneration facility and the initial contribution to CC Polymers for the acquisition of the Corpus Christi project. Net Debt as of the end of the quarter was US $1,270 million, up 8% year-on-year, mainly driven by the investment in strategic projects, and the acquisition of a US $100 million credit related to M&G. At quarter end, financial ratios were as follows: Net Debt to EBITDA, 3.1 times; Interest Coverage, 4.8 times. Adjusting for the US $113 million M&G A/R provision recorded in 3Q17, Net Debt to EBITDA was 2.4 times and Interest Coverage was 6.1 times. Lastly, Alpek signed a 3-year, dollar-denominated, Senior Unsecured Credit Agreement of up to US $710 million. The loan has an 18-month availability period and can be prepaid at any time in whole or in part without premium or penalty. Net proceeds from the potential sale of the two power cogeneration plants in Mexico would be used to pay down the loan s balance at that time. This credit facility provides Alpek with additional financial flexibility to refinance existing short-term debt and temporarily finance the acquisition of PetroquímicaSuape, Citepe and the Corpus Christi project. (See appendix B for Alpek s 1Q18 financial report) Nemak s 1Q18 sales volume was 13.1 million equivalent units, 1% lower than 1Q17, as higher sales in North America (NA) was not enough to offset declines in Europe (EU). NA volumes were higher mainly reflecting the continued ramp-up of new programs for V6 engine applications. In EU, Nemak s volumes declined mainly due to lower diesel volumes which more than offset higher gasoline volumes during the period. Rest of World volumes were flat as a decrease in China was offset with gains in South America. Revenues were US $1,235 million, up 10% year-over-year, supported by higher aluminum prices and the appreciation of the euro against the U.S. dollar. In turn, 1Q18 EBITDA totaled US $197 million, up 4% year-on-year, benefitting from operational efficiencies and increased sales of higher value-added products, together with currency effects and a less adverse impact from metal price lag than in 1Q17. 1Q18 EBITDA per equivalent unit was US$15.0, up from US$14.4 in 1Q17. Capital expenditures in the quarter amounted to US $106 million to support new program launches and to drive operational efficiency across the company s regions. Net Debt at the end of 1Q18 totaled US $1,377 million, up 2% from 1Q17, reflecting the capital expenditures during the period. Financial ratios in 1Q18 were: Net Debt to EBITDA of 1.9 times, and Interest Coverage of 8.4 times. (See appendix C for Nemak s 1Q18 financial report) Axtel s revenues in the first quarter totaled US $200 million, up 11% year-on-year, mainly explained by growth in Managed Networks and IT services in the core Enterprise and Government segment. In the Mass Market segment growth in FTTx revenues was not enough to offset the decline of the legacy Wimax business. In peso terms, total revenues increased 2% in the quarter. Enterprise and Government segment represented 81% of revenues in the quarter. 1Q18 EBITDA was US $74 million, up 27% year-on-year, explained in part by a US $6 million benefit from the sale of the final tranche of transmission towers. Excluding this gain, EBITDA increased 16% from 1Q17, mainly due to a better performance from the Enterprise and Government segment and favorable FX. EBITDA in pesos terms, excluding tower sales, increased 8% y-o-y.
4 ALFA S FIRST QUARTER Capital expenditures totaled US $6 million in 1Q18 (US $29 million excluding tower sales), including investments to provide last-mile access to connect customers, to deploy IT infrastructure and to further increase data center capacity in Queretaro, Mexico. At the end of 1Q18, Net Debt was US $1,015 million, down 1% year-on-year. Financial ratios at the end of 1Q18 were: Net Debt to EBITDA of 3.3 times and Interest Coverage of 3.4 times. (See appendix D for Axtel s 1Q18 financial report) Newpek s revenues were US $33 million, up 26% from 1Q17, reflecting higher production and higher average oil prices. At the end of 1Q18 Newpek had 648 producing wells at the Eagle Ford Shale ( EFS ) in South Texas, compared to 628 wells in production at the end of 1Q17. Additionally, Newpek has 14 wells producing in the Wilcox formation, and 34 in the Edwards formation, both in South Texas, where Newpek has a 20% working interest. Production in the US averaged 5.7 thousand barrels of oil equivalent per day (MBOED) during 1Q18, up 13% from 1Q17. In Mexico, production averaged 3.7 MBOED during 1Q18, roughly the same as 1Q17. 1Q18 EBITDA was US $16 million, including a US $13 million extraordinary gain from the sale of selected acreage at EFS, which compares with an EBITDA loss of US $2 million in 1Q17. Capital expenditures were US $8 million excluding sale at EFS, while net debt was US $27 million at the end of the quarter. On March 27 th, Newpek announced it signed a purchase and sale agreement with Sundance Energy, Inc. to sell approximately 1,900 net acres of its Eagle Ford Shale acreage position for US $19 million. The acreage is located in Atascosa, LaSalle, Live Oak and McMullen Counties, Texas with current net production of approximately 200 barrels of oil equivalent per day. The transaction is being made jointly with Pioneer Natural Resources USA and Reliance Eagleford Upstream Holding LP. Upon closing, which is expected during the second quarter of 2018 and is subject to the satisfaction of customary closing conditions, Newpek s acreage position in the Eagle Ford Shale will be approximately 11,000 net acres, all of which is held by production. As previously announced, the remaining Eagle Ford Shale acreage position is also being divested and for such purposes a data room opened on March 29 th and is available for potential investors. (See appendix E for more comprehensive analysis of Newpek s 1Q18 financial results) Consolidated financial results 1Q18 consolidated revenues were US $4,576 million, up 14% from US $3,997 million reported in 1Q17. The increase is the result of higher sales across all business units and mainly reflects higher volumes and prices in Sigma and Alpek and higher aluminum prices in Nemak. During the quarter, foreign sales represented 68% of the total, up from 65% in 1Q17. 1Q18 Consolidated Operating Income totaled US $376 million, up 28% from US $293 million in 1Q17. Factors contributing to this growth include; higher volumes and better polyester margins in Alpek; for Sigma, better performance in Mexico and the contribution from the acquisitions of Supemsa and Caroli during the year; Nemak s improvement in the Americas, along with less negative metal lag effect; for Axtel, growth in IT services in the Enterprise and Government segment, as well as extraordinary income of US $6 million stemming from the sale of transmission towers. Newpek benefited from better oil prices and extraordinary income of US $13 million from the sale of selected acreage in the Eagle Ford Shale. 1Q18 EBITDA was US $629 million, up 19% year-on-year, reflecting the higher Operating Income explained above.
5 ALFA S FIRST QUARTER ALFA reported 1Q18 Comprehensive Financing Expense (CFE) of US $9 million, compared to Comprehensive Financing Income of US $118 million in 1Q17, mainly explained by lower foreign exchange gains during the quarter, as compared to those recorded in 1Q17. Majority Net Income was US $189 million in 1Q18, up 23% from US $154 million in 1Q17. This year-on-year improvement is mainly explained by higher Operating Income that offset the increase in Comprehensive Financing Expense ( CFE ) already explained. Capital expenditures and acquisitions; Net debt Consolidated capital expenditures and acquisitions totaled US $185 million in 1Q18. All subsidiaries continued to make progress on their investment plans as discussed in the initial section of this report. 1Q18 ALFA s Net Debt amounted to US $6,741 million, US $382 million higher than 1Q17. At the end of the quarter, financial ratios were: Net Debt to EBITDA, 3.2 times; Interest Coverage, 4.8 times. These ratios compare to 2.8 times and 6.1 times, respectively in 1Q17.
6 ALFA S FIRST QUARTER ALFA Table 1 Volume and Price Changes (%) 1Q18 vs. 4Q17 1Q17 Total Volume Domestic Volume (0.9) 6.2 Foreign Volume Avg. Ps. Prices 3.6 (1.3) Avg. US $ Prices Table 2 Revenues 1Q18 4Q17 1Q17 4Q17 1Q17 Total Revenues Ps. Millions 85,850 81,345 81, US $ Millions 4,576 4,297 3, Domestic Revenues Ps. Millions 27,902 27,590 28,344 1 (2) US $ Millions 1,487 1,457 1, Foreign Revenues Ps. Millions 57,948 53,755 53, US $ Millions 3,089 2,840 2, Foreign / Total (%) Table 3 Operating Income and EBITDA 1Q18 4Q17 1Q17 4Q17 1Q17 Operating Income Ps. Millions 7,046 5,447 5, US $ Millions EBITDA Ps. Millions 11,787 10,751 10, US $ Millions Table 4 Comprehensive Financing (Expense) / Income (CFI) (US $ millions) 1Q18 4Q17 1Q17 4Q17 1Q17 Financial Expenses (142) (140) (131) (2) (9) Financial Income (44) 67 Net Financial Expenses (127) (113) (122) (13) (4) Fx Gains (Losses) 113 (223) (52) Financial Asset Impairment Capitalized CFE (30) 63 CFE (9) (329) (108) Avg. Cost of Borrowed Funds (%)
7 ALFA S FIRST QUARTER ALFA Table 5 Majority Net Income (US $ millions) 1Q18 4Q17 1Q17 4Q17 1Q17 Consolidated Net Income (Loss) 263 (44) Minority Interest 73 (13) (4) Majority Net Income (Loss) 189 (31) Per Share (US Dollars) (0.01) (540) (2,608) Avg. Outstanding Shares (Millions) 5,055 5,067 5,112 Table 6 Cash Flow (US $ millions) 1Q18 4Q17 1Q17 4Q17 1Q17 EBITDA Net Working Capital & Others (479) 315 (265) (252) (81) Capital Expenditures & Acquisitions (185) (250) (297) Net Financial Expenses (136) (135) (124) (1) (10) Taxes (29) (57) (53) Dividends (ALFA, S.A.B.) (169) 0 (170) - 1 Other Sources / Uses (72) (196) (133) Decrease (Increase) in Net Debt (441) 245 (515) (280) 14 Table 7 Selected Balance Sheet Information & Financial Ratios (US $ millions) 1Q18 4Q17 1Q17 Assets 19,026 18,189 17,502 Liabilities 14,219 13,506 12,581 Stockholders Equity 4,806 4,683 4,921 Majority Equity 3,576 3,518 3,659 Net Debt 6,741 6,300 6,359 Net Debt/EBITDA* Interest Coverage* * Times: LTM = Last 12 months
8 ALFA S FIRST QUARTER ALFA Appendix A ALFA, S.A.B. de C.V. and Subsidiaries BALANCE SHEET Information in millions of Nominal Mexican Pesos (%) Mar 18 vs. Mar 18 Dec 17 Mar 17 Dec 17 Mar16 Assets CURRENT ASSETS: Cash and cash equivalents 32,784 32,813 20,286 (0) 62 Trade accounts receivable 29,958 27,621 28, Other accounts and notes receivable 6,040 7,286 5,271 (17) 15 Inventories 44,775 44,341 41, Other current assets 10,659 10,074 10,788 6 (1) Total current assets 124, , , INVESTMENTS IN ASSOCIATES AND JOINT VENTURES 2,146 1,455 2, PROPERTY, PLANT AND EQUIPMENT 145, , ,775 (5) 3 INTANGIBLE ASSETS 53,523 58,058 57,655 (8) (7) OTHER NON-CURRENT ASSETS 23,149 23,678 22,102 (2) 5 Total assets 349, , ,197 (3) 6 LIABILITIES AND STOCKHOLDER'S EQUITY CURRENT LIABILITIES: Current portion of long-term debt 2,609 2, Bank loans and notes payable 12,537 12,692 11,297 (1) 11 Suppliers 57,307 61,214 50,421 (6) 14 Other current liabilities 22,233 21,834 20, Total current liabilities 94,685 98,194 82,414 (4) 15 LONG-TERM LIABILITIES: Long-term debt 143, , ,861 (0) 12 Deferred income taxes 12,006 13,874 14,998 (13) (20) Other liabilities 5,626 5,677 6,980 (1) (19) Estimated liabilities for seniority premiums and pension plans 4,948 4,982 4,392 (1) 13 Total liabilities 260, , ,644 (2) 10 STOCKHOLDERS' EQUITY: Controlling interest: Capital stock (1) Contributed capital (1) Earned surplus 65,393 69,227 68,607 (6) (5) Total controlling interest 65,604 69,437 68,819 (6) (5) Total Non-controlling interest 22,566 22,989 23,734 (2) (5) Total stockholders' equity 88,170 92,427 92,553 (5) (5) Total liabilities and stockholders' equity 349, , ,197 (3) 6 Current ratio Debt to equity
9 ALFA S FIRST QUARTER ALFA Appendix B ALFA, S.A.B. DE C.V. and Subsidiaries STATEMENT OF COMPREHENSIVE INCOME Information in millions of Nominal Mexican Pesos 1Q18 VS. (%) 1Q18 4Q17 1Q17 YTD 18 YTD 17 4Q17 1Q17 Net sales 85,850 81,345 81,381 85,850 81, Domestic 27,902 27,590 28,344 27,902 28,344 1 (2) Export 57,948 53,755 53,037 57,948 53, Cost of sales (68,198) (64,817) (64,555) (68,198) (64,555) (5) (6) Gross profit 17,652 16,528 16,826 17,652 16, Operating expenses and others (10,606) (11,081) (10,849) (10,606) (10,849) 4 2 Operating income 7,046 5,447 5,977 7,046 5, Comprehensive financing expense, net (148) (6,222) 2,269 (148) 2, (107) Equity in income (loss) of associates Income before the following provision 6,986 (758) 8,292 6,986 8,292 1,022 (16) Provisions for: Income tax (2,048) (83) (3,639) (2,048) (3,639) (2,371) 44 Consolidated net income 4,938 (841) 4,652 4,938 4, Income (loss) corresponding to minority interest 1,384 (251) 1,546 1,384 1, (11) Net income (loss) corresponding to majority interest 3,554 (590) 3,106 3,554 3, EBITDA 11,787 10,751 10,748 11,787 10, Interest coverage* * LTM
10 ALFA S FIRST QUARTER Luis Ochoa +52 (81) lochoa@alfa.com.mx Juan Andrés Martín +52 (81) jamartin@alfa.com.mx APPENDIX: A SIGMA 11 B ALPEK 17 C NEMAK 30 D AXTEL 38 E NEWPEK 47 Eugenia Villarreal +52 (81) evillarreal@alfa.com.mx InspIR Group Susan Borinelli +1 (646) susan@inspirgroup.com This release may contain forward-looking information based on numerous variables and assumptions that are inherently uncertain. They involve judgments with respect to, among other things, future economic, competitive and financial market conditions and future business decisions, all of which are difficult or impossible to predict accurately. Accordingly, results could vary from those set forth in this release. The report presents unaudited financial information. Figures are presented in Mexican pesos or US Dollars, as indicated. Where applicable, peso amounts were translated into US Dollars using the average exchange rate of the months during which the operations were recorded. Financial ratios are calculated in US Dollars. Due to the rounding up of figures, small differences may occur when calculating percent changes from one period to the other.
11 ALFA S FIRST QUARTER Refrigerated food products 34% of ALFA s revenues and 26% of ALFA s EBITDA in 1Q18 Sigma is a leading multinational refrigerated food company that produces, markets and distributes quality branded foods, including packaged meats, cheese, yogurt and other refrigerated and frozen foods. Sigma has a diversified portfolio of leading brands and operates 70 plants in 18 countries across its four key regions: Mexico, Europe, the United States, and Latin America. Selected financial information Selected Financial Information (US $ million) 1Q18 4Q17 1Q17 Ch % vs. 4Q17 Ch % vs. 1Q17 Total Revenues 1,552 1,593 1,350 (3) 15 Europe (8) 22 Mexico USA Latam (5) 14 Total EBITDA (17) 20 Europe (44) 18 Mexico USA (13) (1) Latam (4) 10 Capex (61) (18) Net Debt 2,078 1,936 1, Net Debt / EBITDA LTM Interest Coverage Industry comments During 1Q18, consumer confidence was higher year-on-year across all of Sigma s main regions of operations. In Mexico, the average consumer confidence index reported by INEGI (Instituto Nacional de Estadística y Geografía National Institute for Statistics and Geography) grew 10% year-on-year but compared to the previous quarter decreased 7%; while same-store sales reported by the National Association of Supermarkets and Department Stores (ANTAD) increased 6% year-on-year in nominal pesos. In Europe, according to the European Commission, the average consumer confidence index for 1Q18 continued improving to 0.5, from negative 5.5 during 1Q17. In the U.S., the average consumer confidence index increased to 127 in 1Q18 from 117 during 1Q17 as reported by The Conference Board, the highest level since Food retail sales in the US increased 3% year-on-year and in Europe increased 1%, reported by the U.S. Census Bureau and Eurostat, respectively. Key raw material prices varied during the quarter. In the America s, pork prices increased 3% year-on-year. By contrast, turkey breast and turkey thighs were 3% and 8% lower, respectively, while chicken was 9% higher than the same period of the prior year. Compared to the previous quarter, pork ham decreased 7%, breast and turkey
12 ALFA S FIRST QUARTER thighs increased 1% and 21%, respectively, while chicken prices were stable. In Mexico, the appreciation of the peso vis-a-vis the U.S. dollar has eased the cost pressure of raw materials, as the industry participants import most of their meats from the US. In Europe, prices for ham and pork shoulder decreased on average 10% year-on-year. Financial results by region Europe During 1Q18, European sales and EBITDA in euros increased 6% and 2% year-on-year, respectively, benefiting from the consolidation of the acquisition of Caroli in Romania since September La Bureba plant continued production for the Spanish and European markets. By the end of the quarter, Sigma started showing margin improvements from this facility. These efficiencies were reinvested in additional marketing and R&D expenses. EBITDA margin improvements are expected during the second half of the year. México First quarter Mexican sales in pesos increased 5% year-on-year benefiting from an increase in volume and higher average prices. 1Q18 EBITDA increased 23% year-on-year supported mainly by higher margins when compared to 1Q17. Higher average prices and stable average raw material costs in pesos contributed to higher EBITDA margins. USA 1Q18 U.S. sales increased 4% driven by higher volume and higher average prices year-on-year. Revenue growth was driven by the Bar-S Brand and the Hispanic business. EBITDA decreased 1% year-on-year, due to slightly higher raw material prices and higher freight costs caused in part by new transportation regulations. The European Heritage business EBITDA was impacted by a one-time fixed asset write-off. Latam First quarter 2018 Latin America sales in USD increased 14% year-on-year and EBITDA increased 10% year-on-year, benefited from the acquisition of Supemsa at the end of 2Q17. Supemsa has been exceeding expectations and Sigma is in process of implementing synergies. Consolidated financial results During 1Q18, Sigma s revenues were U.S. $1,552 million, an increase of 15% versus 1Q17. Sigma sold approximately 427 thousand tons of food products, up 4% from 1Q17 with growth across all regions. In dollar terms, average prices increased 11% year-on-year, stemming from higher prices in the USA and Mexico and a stronger peso and euro against the US dollar. Sales in Mexico accounted for 41% of the quarter s total, while Europe represented 36%, the U.S. 15%, and Latin America 8%. Operating income and EBITDA were US $108 million and U.S. $162 million in 1Q18, up 27% and 20% year-on-year, respectively. This increase was primarily due to a solid performance of Mexican operations, the consolidation of Supemsa and Caroli, and a more favorable currency environment in Europe and Mexico.
13 Capital expenditures and acquisitions; net debt ALFA S FIRST QUARTER During 1Q18, capital expenditures were US $27 million. These funds were utilized for maintenance and minor projects across the company. At the end of 1Q18, Net Debt was US $2,078 million, up 13% from 1Q17, mainly explained by the outflows related to the Bureba facility and the acquisitions of Supemsa and Caroli. Financial ratios at the end of 1Q18 were: Net Debt to EBITDA, 3.0 times; Interest Coverage, 6.0 times. These ratios compare to 2.9 times and 4.2 times, respectively in 1Q17. Recent developments On March 22, 2018 Sigma issued a US $500 million bond. The notes have a coupon of 4.875% and a maturity period of 10 years. The proceeds were used to redeem 2022 notes issued by its European subsidiary Campofrío Food Group. With this transaction, the new average life of Sigma s debt was extended to 7.0 years. As part of its financial strategy, Sigma entered into cross currency swap transactions to change part of its U.S. dollar debt to pesos. In March 2018, Sigma swapped its U.S. $250 million 2019 bond and in April 2018, US $250 million of its 2026 bond. After these transactions, the debt currency mix is as follows: 48% U.S. dollars, 29% euros and 23% pesos.
14 ALFA S FIRST QUARTER SIGMA Table 1 Volume and price changes (%) 1Q18 vs. 4Q17 1Q17 Total Volume (2.3) 3.6 Avg. Ps. Prices (1.2) 2.3 Avg. US $ Prices (0.3) 11.0 Table 2 Revenues 1Q18 4Q17 1Q17 4Q17 1Q17 Total Revenues Ps. Millions 29,111 30,162 27,462 (3) 6 US $ Millions 1,552 1,593 1,350 (3) 15 Domestic Revenues Ps. Millions 11,929 12,042 11,370 (1) 5 US $ Millions Foreign Revenues Ps. Millions 17,182 18,120 16,092 (5) 7 US $ Millions (4) 16 Foreign / Total (%) Table 3 Operating income and EBITDA 1Q18 4Q17 1Q17 4Q17 1Q17 Operating Income Ps. Millions 2,025 2,495 1,709 (19) 19 US $ Millions (18) 27 EBITDA Ps. Millions 3,044 3,699 2,738 (18) 11 US $ Millions (17) 20 Table 4 Selected balance sheet information & financial ratios (US $ millions) 1Q18 4Q17 1Q17 Assets 5,864 5,350 4,951 Liabilities 4,915 4,423 4,161 Stockholders Equity Majority Equity Net Debt 2,078 1,936 1,838 Net Debt/EBITDA* Interest Coverage* * Times: LTM = Last 12 months
15 ALFA S FIRST QUARTER SIGMA Appendix A Sigma Alimentos, S.A. de C.V. and Subsidiaries BALANCE SHEET Information in millions of Nominal Mexican Pesos (%) Mar 18 vs. Mar 18 Dec 17 Mar 17 Dec 17 Mar16 ASSETS CURRENT ASSETS: Cash and cash equivalents 19,151 12,807 11, Restricted cash (7) (30) Customers, net 5,466 5,776 5,228 (5) 5 Income tax recoverable (51) (42) Inventories 14,751 14,687 14, Other current assets 2,744 2,627 2, Total current assets 42,596 36,802 34, NON-CURRENT ASSTES: Property, plant and equipment, net 33,714 35,268 31,113 (4) 8 Intangible assets, net 14,767 15,715 14,299 (6) 3 Goodwill 14,073 14,742 10,033 (5) 40 Deferred income tax 2,159 2,792 2,214 (23) (2) Investments in associates and joint ventures (3) (90) Other non-current assets (1) 57 Total non-current assets 64,976 68,785 58,646 (6) 11 Total assets 107, ,586 93, LIABILITIES AND STOCKHOLDER'S EQUITY CURRENT LIABILITIES: Current debt 2,255 2, (5) 347 Notes payables Suppliers 17,879 20,867 18,712 (14) (4) Income tax payable 1,974 1,784 1, Provisions (53) (13) Other current liabilities 5,161 5,184 4,491 (0) 15 Total current liabilities 27,498 30,608 25,257 (10) 9 NON-CURRENT LIABILITIES: Non-current debt 54,361 48,030 44, Notes payables (10) (10) Deferred income taxes 3,627 4,068 3,895 (11) (7) Employees benefits 1,346 1,339 1, Provisions (3) (54) Income tax payable 2,363 2,342 2, Other non-current liabilities Total non-current liabilities 62,665 56,689 53, Total liabilities 90,163 87,297 78, STOCKHOLDERS' EQUITY: Total controlling interest 16,748 17,597 14,291 (5) 17 Total Non-controlling interest (5) 16 Total stockholders' equity 17,409 18,289 14,860 (5) 17 Total liabilities and stockholders' equity 107, ,586 93,
16 ALFA S FIRST QUARTER SIGMA Appendix B Sigma Alimentos, S.A. de C.V. and Subsidiaries STATEMENT OF COMPREHENSIVE INCOME Information in millions of Nominal Mexican Pesos 1Q18 VS. (%) 1Q18 4Q17 1Q17 YTD 18 YTD 17 4Q17 1Q17 Revenue 29,111 30,162 27,462 29,111 30,162 (3) 6 Cost of sales (20,936) (21,941) (19,917) (20,936) (21,941) (5) 5 Gross profit 8,175 8,220 7,545 8,175 8,220 (1) 8 Selling expenses (4,847) (4,677) (4,477) (4,847) (4,677) 4 8 Administrative expenses (1,387) (1,072) (1,290) (1,387) (1,072) 29 7 Other income (expenses), net (69) (222) Operating profit 2,025 2,495 1,709 2,025 2,495 (19) 19 Comprehensive financing expense, net (716) (1,057) (258) (716) (1,057) (32) 178 Equity in income (loss) of associates (1) (0) 1 (1) (0) 39 (140) Profit before income tax 1,309 1,437 1,452 1,309 1,437 (9) (10) Provisions for: Income tax (1,033) 258 (1,522) (1,033) 258 (500) (32) Net consolidated profit 276 1,695 (70) 276 1,695 (84) (496) Non-controlling interest 1 22 (0) 1 22 (96) (2,371) Controlling interest 275 1,673 (70) 275 1,673 (84) (495)
 Se")
17 First Quarter 2018 (1Q18) Monterrey, Mexico. April 18, 2018 Alpek, S.A.B. de C.V. (BMV: ALPEK) Selected Financial Information (U.S. $ Millions) Alpek reports 1Q18 EBITDA of U.S. $181 million 1Q18 4Q17 1Q17 4Q17 1Q17 Total Volume (ktons) 1, Polyester Plastics & Chemicals Consolidated Revenues 1,532 1,321 1, Polyester 1, Plastics & Chemicals Consolidated EBITDA Polyester Plastics & Chemicals (2) Profit Attributable to Controlling Interest 82 (30) (5) CAPEX and Acquisitions (26) Net Debt 1,270 1,262 1, Net Debt/LTM EBITDA (1) Interest Coverage (1) (1) Times: Last 12 months Operating & Financial Highlights (1Q18) Alpek 1Q18 Consolidated EBITDA of U.S. $181 million, including a U.S. $16 million non-cash inventory gain and U.S. $5 million non-recurring legal fees/expenses Process to finalize cogeneration power plant sale in Mexico is ongoing Signed 3-year credit of up to U.S. $710 million with 18-month availability period Polyester JV among Alpek, Indorama and Far Eastern to acquire Corpus Christi project from M&G USA Normalized M&G Mexico operations in 1Q18 Engaged in the confirmation of final conditions required to close PetroquímicaSuape and Citepe acquisition Plastics & Chemicals (P&C) 1Q18 P&C EBITDA of U.S. $69 million, including a U.S. $1 million non-cash inventory gain P&C results benefited from a spike in polypropylene (PP) reference prices amid tight supply caused mainly by U.S. propylene plant outages and startup delays This release contains forward looking information based on numerous variables and assumptions that are inherently uncertain. They involve judgments with respect to, among other things, future economic, competitive and financial market conditions and future business decisions, all of which are difficult or impossible to predict accurately. Accordingly, results could vary from those set forth in this release. The report presents unaudited financial information based on International Financial Reporting Standards (IFRS). Figures are stated in nominal Mexican pesos ($) and in current U.S. Dollars (U.S. $), as indicated. Where applicable, peso amounts were translated into U.S. Dollars using the average exchange rate of the months during which operations were recorded. Financial ratios are calculated in U.S. Dollars. Due to the rounding up of figures, small differences may occur when calculating percent changes from one period to the other.
18 First Quarter 2018 (1Q18) Message from the CEO Alpek s first quarter 2018 consolidated EBITDA was up 15% versus 1Q17 and 29% higher than 4Q17 driven mainly by Polyester segment performance. Results reflect a better-than-expected start this year for several relevant underlying external variables, including higher oil prices, global polyester margin recovery and higher M&G Polímeros México, S.A. de C.V. (M&G Mexico) PET operating rates, among others. The average price of Brent crude oil was U.S. $67 per barrel in 1Q18, up 9% versus 4Q17 and U.S. $10 per barrel higher than Alpek s 2018 Guidance. Similarly, the average U.S. paraxylene and propylene contract prices increased 8% quarter-on-quarter. Higher feedstock prices resulted in a U.S. $16 million non-cash inventory gain during the first quarter. 1Q18 Polyester segment EBITDA was U.S. $111 million, including a U.S. $15 million non-cash inventory gain and U.S. $5 million in non-recurring legal fees/expenses. Adjusting for these two items, Comparable Polyester EBITDA was U.S. $102 million, up 48% and 54% when compared with 1Q17 and 4Q17, respectively. Normalized M&G Mexico PET operations and polyester margin recovery amid a rising feedstock price environment contributed to EBITDA growth. M&G Mexico reached normalized PET production levels supported by Alpek through secured financing while a definitive restructuring plan is presented. Alpek s priorities in M&G Mexico s restructuring process are: i) maximizing the recovery of its claims and ii) maintaining its PTA supply to the restructured entity. The restructuring process associated to M&G USA s Corpus Christi project advanced in 1Q18. Corpus Christi Polymers LLC (CC Polymers), a newly formed joint venture between Alpek, Indorama and Far Eastern, received court approval to acquire the Corpus Christi project and other related assets from M&G USA. The approved terms imply a total value of U.S. $1.169 billion in cash and other capital contributions. Each JV partner will contribute up to U.S. $390 million, subject to final adjustments. Alpek s portion will be reduced by a U.S. $200 million non-cash contribution associated to its second lien on the Corpus Christi project. In accordance with IFRS, Alpek may recognize its non-cash contribution as a partial recovery of previous asset impairments upon closing of the transaction, which is subject to approval by governmental authorities. Alpek, Indorama and Far Eastern will each have the right to receive one-third of the PTA and PET produced at the Corpus Christi project upon completion. CC Polymers will obtain additional resources from the three JV partners to resume the plant s construction upon closing of the transaction. A cost estimation and timeline for the project will be announced in due course. Other relevant events include: i) the acquisition in Brazil of Companhia Petroquímica de Pernambuco (PetroquímicaSuape) and Companhia Integrada Têxtil de Pernambuco (Citepe) from Petrobras, ii) the sale of our two cogeneration power plants, and iii) the PET antidumping cases in the United States and Canada. The transaction with Petrobras received the required regulatory approval from the CADE Court in Brazil during 1Q18. Since then, Alpek has worked closely with Petrobras to ensure that all agreed upon conditions are fulfilled prior to closing, which is expected before the end of the second quarter. The process to finalize the sale of our two cogeneration power plants in Mexico is moving forward as the 350 MW Altamira plant s construction is on track to be completed before year-end. However, issues in the implementation of regulatory changes in Mexican power tariffs have weighed on timing. ir@alpek.com 2
19 First Quarter 2018 (1Q18) Regarding the PET antidumping cases, the United States Department of Commerce (USDOC) is conducting its investigations on PET imports from Brazil, Indonesia, Korea, Pakistan and Taiwan. The USDOC is expected to issue its preliminary determinations and, if applicable, impose provisional duties in 2Q18. Conversely, the Canadian International Trade Tribunal ruled that PET resin imports from China, India, Oman and Pakistan have not caused injury and are not threatening to cause injury to the sole Canadian producer. This ruling has been appealed. 1Q18 Capex was U.S. $56 million as progress continued on the investment front. The initial contribution to CC Polymers for the acquisition of the Corpus Christi project, plus the investment in the Altamira power cogeneration facility accounted for 70% of Alpek s first quarter Capex. Alpek maintains a solid financial position supported by a strong balance sheet and liquidity. At the close of 1Q18, Net Debt totaled U.S. $1.270 billion and Net Debt to EBITDA was 3.1 times or 2.4 times when adjusted for the U.S. -$113 million M&G A/R provision that affected EBITDA in 3Q17. The balance of Cash and Cash Equivalents was U.S. $440 million in 1Q18. Moreover, Alpek signed a 3-year, dollar-denominated, Senior Unsecured Credit Agreement of up to U.S. $710 million with The Bank of Tokyo-Mitsubishi UFJ, Ltd., Citigroup Global Markets Inc., HSBC México, S.A., Institución de Banca Múltiple, Grupo Financiero HSBC and JPMorgan Chase Bank, N.A. The loan has an 18-month availability period and can be prepaid at any time in whole or in part without premium or penalty. Net proceeds from the potential sale of the two power cogeneration plants in Mexico would be used to pay down the loan s balance at that time. This provides Alpek with additional financial flexibility to refinance existing short-term debt and temporarily finance the acquisition of PetroquímicaSuape, Citepe and the Corpus Christi project. The optimistic outlook we anticipated for the year was reaffirmed by a strong start in 1Q18. First quarter results are supportive for 2018 EBITDA to be higher than our U.S. $ 569 million Guidance. This will be taken into consideration when updating our 2018 Guidance in 2Q18 to include pending non-recurrent transactions such as the acquisition in Brazil and the potential sale of the two power cogeneration plants in Mexico. ir@alpek.com 3
20 First Quarter 2018 (1Q18) Results by Business Segment Polyester (Purified Terephthalic Acid (PTA), Polyethylene Terephthalate (PET), Polyester fibers 72% of Alpek s Net Sales) Alpek s first quarter 2018 Polyester revenues were up 21% year-on-year and 19% quarter-on-quarter, driven by a combination of higher volume and average prices. Average 1Q18 Polyester prices increased 17% and 14% when compared with 1Q17 and 4Q17, respectively, reflecting the rise in feedstock prices such as paraxylene (Px) and monoethylene glycol (MEG). The average U.S. contract Px price reached its highest level since 2Q15. 1Q18 Polyester volume was up 4% and 5% when compared with 1Q17 and 4Q17, respectively. Normalized operations at M&G Mexico and robust demand amid a rising feedstock price environment contributed to Polyester volume growth. First quarter 2018 segment EBITDA was U.S. $111 million, including a U.S. $15 million non-cash inventory gain and U.S. $5 million in non-recurring legal fees/expenses. Adjusting for these two items, Comparable 1Q18 Polyester EBITDA was U.S. $102 million, up 48% and 54% when compared to 1Q17 and 4Q17, respectively. Global polyester margins continued to recover in 1Q18 from multi-year lows. The reference PTA and PET margins in Asia reached their highest level since Plastics & Chemicals (P&C) (Polypropylene (PP), Expandable Polystyrene (EPS), Caprolactam (CPL), Other products 28% of Alpek s Net Sales) 1Q18 P&C revenue increased 12% year-on-year and 9% quarter-on-quarter mainly due to higher average prices. Average first quarter 2018 P&C prices were up 11% and 6% when compared with 1Q17 and 4Q17, respectively. Propylene and styrene prices posted a monthly spike in 1Q18. First quarter 2018 P&C volume was up 1% versus 1Q17 as growth in EPS was partially offset by other P&C products. When compared to 4Q17, P&C volume increased 3% mainly driven by PP. Segment EBITDA was U.S. $69 million in 1Q18, including a U.S. $1 million non-cash inventory gain. Adjusting for the inventory gain, Comparable 1Q18 P&C EBITDA was up 9% and 17% when compared with 1Q17 and 4Q17, respectively, supported by higher PP margins. PP benefited from a temporary spike in prices amid tight supply caused mainly by U.S. propylene plant outages and startup delays. ir@alpek.com 4
21 First Quarter 2018 (1Q18) Consolidated Financial Results Net Sales: Net Sales for the first quarter totaled U.S. $1.532 billion, up 19% year-on-year and 16% quarter-onquarter, mainly due to higher average consolidated prices in both business segments. Average 1Q18 consolidated prices increased 15% and 11% when compared with 1Q17 and 4Q17, respectively, reflecting the rise in oil and feedstock prices. 1Q18 consolidated volume was up 3% and 4% year-on-year and quarter-on-quarter, respectively, supported by growth in Polyester and P&C. EBITDA: 1Q18 EBITDA was U.S. $181 million, including a U.S. $16 million non-cash inventory gain and U.S. $5 million in non-recurring legal fees/expenses. Adjusting for these two items, Comparable Consolidated EBITDA was U.S. $170 million, U.S. $124 million and U.S. $131 million in 1Q18, 4Q17 and 1Q17 respectively. Both business segments posted better-than-expected performance supported by higher oil prices, sustained polyester margin recovery and normalized operations at M&G Mexico, among others. Profit (Loss) Attributable to Controlling Interest: Profit Attributable to Controlling Interest for the first quarter of 2018 was U.S. $82 million, compared to U.S. $87 million and U.S. -$30 million in 1Q17 and 4Q17, respectively. 1Q18 Profit Attributable to Controlling Interest was 5% lower than 1Q17 which benefited from a higher non-cash Fx gain. Capital Expenditures and Acquisitions (Capex): 1Q18 Capex was U.S. $56 million, compared to U.S. $76 million and U.S. $30 million in 1Q17 and 4Q17 respectively. The majority of these funds were invested in the construction of the Altamira power cogeneration facility and the initial contribution to CC Polymers for the acquisition of the Corpus Christi project. Net Debt: Consolidated Net Debt as of March 31, 2018 was U.S. $1.270 billion, up 8% and 1% versus 1Q17 and 4Q17, respectively. On an absolute basis, Net Debt increased U.S. $7 million year-to-date. As of March 31, 2018, Gross Debt was U.S. $1.709 billion and Cash totaled U.S. $440 million. Financial ratios at the close of 1Q18 were: Net Debt to EBITDA of 3.1 times and Interest Coverage of 4.8 times. Adjusting for the U.S. -$113 million M&G A/R provision in 3Q17, Net Debt to EBITDA was 2.4 times and Interest Coverage was 6.1 times. ir@alpek.com 5
22 First Quarter 2018 (1Q18) Appendix A - Tables TABLE 1 VOLUME (KTONS) 1Q18 4Q17 1Q17 4Q17 1Q17 Total Volume 1, Polyester Plastics and Chemicals TABLE 2 PRICE CHANGES (%) Polyester 4Q17 1Q17 Avg. Ps. Prices 13 8 Avg. U.S. $ Prices Plastics and Chemicals Avg. Ps. Prices 5 3 Avg. U.S. $ Prices 6 11 Total Avg. Ps. Prices 10 6 Avg. U.S. $ Prices TABLE 3 INCOME STATEMENT (U.S. $ Millions) 1Q18 4Q17 1Q17 4Q17 1Q17 Total Revenues 1,532 1,321 1, Gross Profit Operating expenses and others (59) (52) (48) (13) (23) Operating income Financial result, net (5) (68) (129) Equity in income of assoc. and JV Income Tax (35) (62) (34) 43 (5) Consolidated net income 103 (20) (3) Controlling Interest 82 (30) (5) ir@alpek.com 6
23 First Quarter 2018 (1Q18) TABLE 4 REVENUES 1Q18 4Q17 1Q17 4Q17 1Q17 Total Revenues Ps. Millions 28,746 25,010 26, U.S. $ Millions 1,532 1,321 1, Domestic Revenues Ps. Millions 9,061 8,166 9, (6) U.S. $ Millions Foreign Revenues Ps. Millions 19,685 16,844 16, U.S. $ Millions 1, Foreign / Total (%) TABLE 5 OPERATING INCOME AND EBITDA Operating Income 1Q18 4Q17 1Q17 4Q17 1Q17 Ps. Millions 2,695 2,084 2, U.S. $ Millions EBITDA Ps. Millions 3,391 2,660 3, U.S. $ Millions TABLE 6 COMPARABLE EBITDA 1Q18 4Q17 1Q17 4Q17 1Q17 EBITDA Ps. Millions 3,391 2,660 3, U.S. $ Millions Adjustments* Ps. Millions (196) (309) (550) U.S. $ Millions (10) (16) (26) Comparable EBITDA Ps. Millions 3,195 2,350 2, U.S. $ Millions *Adjustments: Inventory and non-operating, one-time (gains) losses ir@alpek.com 7
24 First Quarter 2018 (1Q18) TABLE 7 FINANCIAL RESULT, NET (U.S. $ Millions) 1Q18 4Q17 1Q17 4Q17 1Q17 Financial Expenses (23) (23) (18) - (31) Financial Income Financial Expenses, Net (17) (21) (14) 18 (24) Fx Gains (Losses) 13 (47) (59) Financial Result, Net (5) (68) (129) TABLE 8 NET INCOME (U.S. $ Millions) 1Q18 4Q17 1Q17 4Q17 1Q17 Consolidated Net Income 103 (20) (3) Non-Controlling Interest Controlling Interest 82 (30) (5) Earnings per Share (U.S. Dollars) 0.04 (0.01) (5) Avg. Outstanding Shares (Millions)* 2,117 2,117 2,117 * The same number of equivalent shares are considered in the periods presented TABLE 9 CASH FLOW (U.S. $ Millions) 1Q18 4Q17 1Q17 4Q17 1Q17 EBITDA Net Working Capital & Others (85) (37) (64) (127) (31) Capital Expenditures & Acq. (56) (30) (76) (87) 26 Financial Expenses (22) (22) (16) (1) (39) Income tax (7) (9) (27) Dividends - (7) (88) Payment affiliated companies Other Sources / Uses (18) (105) (20) Decrease (Increase) in Net Debt (7) (70) (134) ir@alpek.com 8
25 First Quarter 2018 (1Q18) TABLE 10 STATEMENT OF FINANCIAL POSITION & FINANCIAL RATIOS (U.S. $ Millions) 1Q18 4Q17 1Q17 4Q17 1Q17 Assets Cash and cash equivalents (9) 250 Trade accounts receivable Inventories Other current assets (2) 1 Total current assets 2,302 2,138 1, Investment in associates and others Property, plant and equipment, net 2,108 2,105 2,028-4 Goodwill and intangible assets, net (2) (64) Other non-current assets Total assets 4,989 4,752 4, Liabilities & stockholders' equity Debt (4) 30 Suppliers Other current liabilities Total current liabilities 1,570 1,420 1, Debt (include debt issuance cost) 1,343 1,366 1,017 (2) 32 Employees benefits (10) Other long term liabilities (3) (20) Total liabilities 3,264 3,147 2, Total stockholders' equity 1,725 1,604 2,050 7 (16) Total liabilities & stockholders' equity 4,989 4,752 4, Net Debt 1,270 1,262 1, Net Debt/EBITDA* Interest Coverage* * Times: last 12 months ir@alpek.com 9
26 First Quarter 2018 (1Q18) Polyester TABLE 11 REVENUES 1Q18 4Q17 1Q17 4Q17 1Q17 Total Revenues Ps. Millions 20,811 17,668 18, U.S. $ Millions 1, Domestic Revenues Ps. Millions 4,223 3,679 5, (16) U.S. $ Millions (8) Foreign Revenues Ps. Millions 16,588 13,989 13, U.S. $ Millions Foreign / Total (%) TABLE 12 OPERATING INCOME AND EBITDA 1Q18 4Q17 1Q17 4Q17 1Q17 Operating Income Ps. Millions 1,538 1,022 1, U.S. $ Millions EBITDA Ps. Millions 2,091 1,467 1, U.S. $ Millions TABLE 13 COMPARABLE EBITDA EBITDA 1Q18 4Q17 1Q17 4Q17 1Q17 Ps. Millions 2,091 1,467 1, U.S. $ Millions Adjustments* Ps. Millions (185) (215) (395) U.S. $ Millions (10) (11) (19) Comparable EBITDA Ps. Millions 1,905 1,252 1, U.S. $ Millions *Adjustments: Inventory and non-operating, one-time (gains) losses ir@alpek.com 10
27 First Quarter 2018 (1Q18) Plastics & Chemicals TABLE 14 REVENUES 1Q18 4Q17 1Q17 4Q17 1Q17 Total Revenues Ps. Millions 7,934 7,342 7, U.S. $ Millions Domestic Revenues Ps. Millions 4,838 4,487 4, U.S. $ Millions Foreign Revenues Ps. Millions 3,096 2,855 3, U.S. $ Millions Foreign / Total (%) TABLE 15 OPERATING INCOME AND EBITDA 1Q18 4Q17 1Q17 4Q17 1Q17 Operating Income Ps. Millions 1,158 1,071 1,282 8 (10) U.S. $ Millions (1) EBITDA Ps. Millions 1,302 1,203 1,447 8 (10) U.S. $ Millions (2) TABLE 16 COMPARABLE EBITDA EBITDA 1Q18 4Q17 1Q17 4Q17 1Q17 Ps. Millions 1,302 1,203 1,447 8 (10) U.S. $ Millions (2) Adjustments* Ps. Millions (11) (94) (154) U.S. $ Millions (1) (5) (8) Comparable EBITDA Ps. Millions 1,291 1,108 1, U.S. $ Millions *Adjustments: Inventory and non-operating, one-time (gains) losses ir@alpek.com 11
28 First Quarter 2018 (1Q18) Appendix B Financial Statements ALPEK, S.A.B. DE C.V. and Subsidiaries STATEMENT OF FINANCIAL POSITION Information in Millions of Mexican Pesos (%) Mar 18 vs. Mar 18 Dec 17 Mar 17 Dec 17 Mar 17 ASSETS CURRENT ASSETS: Cash and cash equivalents 7,354 8,795 2,362 (16) 211 Restricted cash (7) 33,662 Trade accounts receivable 12,740 10,739 10, Other accounts and notes receivable 3,798 4,152 3,503 (9) 8 Inventories 16,374 16,364 15, Other current assets 1,247 1,379 1,597 (10) (22) Total current assets 42,223 42,192 33, Investment in associates and others 1, Property, plant and equipment, net 38,670 41,535 38,136 (7) 1 Goodwill and intangible assets,net 3,719 4,065 10,738 (9) (65) Other non-current assets 5,639 5,336 4, Total assets 91,514 93,778 87,280 (2) 5 LIABILITIES AND STOCKHOLDER'S EQUITY CURRENT LIABILITIES: Debt 6,621 7,408 5,228 (11) 27 Suppliers 17,961 17,255 13, Other current liabilities 4,212 3,356 3, Total current liabilities 28,794 28,019 21, NON-CURRENT LIABILITIES: Debt (include debt issuance cost) 24,639 26,958 19,134 (9) 29 Deferred income taxes 4,142 4,403 5,410 (6) (23) Other non-current liabilities 1,310 1,673 1,592 (22) (18) Employee benefits 992 1,061 1,127 (7) (12) Total liabilities 59,877 62,114 48,716 (4) 23 STOCKHOLDERS EQUITY: Controlling interest: Capital stock 6,050 6,048 6, Share premium 9,071 9,071 9, Contributed capital 15,121 15,119 15, Earned surplus 11,719 11,797 19,155 (1) (39) Total controlling interest 26,840 26,916 34,274 (0) (22) Non-controlling interest 4,797 4,748 4, Total stockholders equity 31,637 31,664 38,564 (0) (18) Total liabilities and stockholders equity 91,514 93,778 87,280 (2) 5 ir@alpek.com 12
29 First Quarter 2018 (1Q18) ALPEK, S.A.B. DE C.V. y Subsidiarias ESTADO DE RESULTADOS Información en Millones de Pesos mexicanos 1T18 vs.(%) 1T18 4T17 1T17 4T17 1T17 Ingresos 28,746 25,010 26, Nacionales 9,061 8,166 9, (6) Exportación 19,685 16,844 16, Costo de ventas (24,943) (21,941) (22,826) (14) (9) Utilidad bruta 3,803 3,069 3, Gastos de operación y otros (1,108) (985) (978) (12) (13) Utilidad de operación 2,695 2,084 2, Resultado Financiero, neto (84) (1,296) (126) Participación en resultados de asociadas y negocios conjuntos (9) - (2) (3,924) (250) Utilidad (pérdida) antes de impuestos 2, , (9) Impuestos a la utilidad (664) (1,173) (693) 43 4 Utilidad neta consolidada 1,938 (385) 2, (10) Utilidad atribuible a Participación controladora 1,550 (577) 1, (12) Utilidad atribuible a Participación no controladora ir@alpek.com 13

30 } Nemak reports 1Q18 results - Quarterly revenues and EBITDA of US$1.2 billion and US$197 million, respectively - New contracts awarded to Nemak for US$110 million in annual revenues Monterrey, Mexico. April 18, Nemak, S.A.B. de C.V. ( Nemak ) (BMV: NEMAK), a leading provider of innovative lightweighting solutions for the global automotive industry, announced today its operational and financial results for the first quarter of 2018 ("1Q18"). What follows is an overview of the quarter s main highlights: Key Figures For 1Q18, volumes were 13.1 million equivalent units ("MEU"), 0.8% lower than the 1Q17 figure. North America ("NA") reported growth, while Europe ("EU") showed less volumes year-on-year ("yo-y"), and Rest of World ("RoW") remained flat. These figures notwithstanding, revenues were US$1,235 million, up 10.0% y-o-y due to the appreciation of the euro against the US dollar and higher average aluminum prices. 1Q18 EBITDA was US$197 million, a 3.7% y-o-y increase. Results benefited from operational efficiencies and increased sales of higher value-added products, together with a less adverse impact from "metal price lag" (effect associated with the delay in passing on aluminum price changes to customers, as stipulated in the company s contracts) than in 1Q17 and currency effects. 1Q18 capex was US$106 million as Nemak continued investing to meet increased future demand related to recently awarded contracts across its main product lines. Message from the CEO We delivered improved results this quarter, thanks to the implementation of cost-reduction initiatives and increased sales of higher value-added products, among other factors. In particular, our North America operation made a positive contribution, as benefits associated with the continued ramp-up of new, high-volume powertrain programs outweighed the impact of lower overall customer demand in the region. I am also pleased to share that we won new business in structural and electric vehicle components (SC/EV) worth US$50 million in annual revenues, bringing our total order book in this segment to April 18,
 first contract with a leading Asian battery manufacturer for SC/EV; 2) first contract for a mass-market German EV")
31 approximately US$370 million in annual revenues. These contracts represented several milestones for the company, including: 1) first contract with a leading Asian battery manufacturer for SC/EV; 2) first contract for a mass-market German EV platform; and 3) first program to supply pure electric applications in North America. With the support of a dedicated global organization and top talent, I am confident that we are well positioned to continue growing and reinforcing our competitive position in SC/EV into the future. Automotive Industry In the quarter, SAAR for U.S. vehicle sales was basically flat compared to 1Q17, as higher sales of light trucks including CUVs, SUVs, and pickups compensated for lower passenger car sales. Meanwhile, North America vehicle production and Nemak customers vehicle production decreased 2.6% and 1.7%, respectively, as OEMs continued to reduce inventories. In Europe, 1Q18 vehicle sales (SAAR) increased 3.6% y-o-y supported by more favorable economic conditions, particularly in Eastern Europe. Vehicle production figures saw little change y-o-y, as OEMS reduced their exports to other regions. Recent Developments During the quarter, new contract wins totaled US$110 million in annual revenues. This full amount represented incremental revenues, with US$50 million coming in from SC/EV. Nemak began working with a new Chinese OEM on the development of structural components for pure-electric vehicles. April 18,

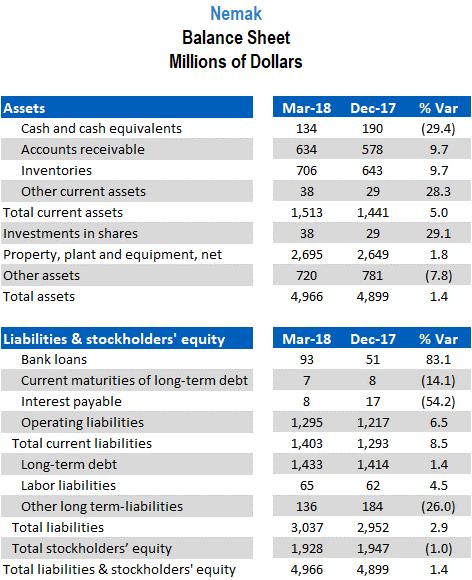
32 Financial Results Summary What follows is an explanation of the results shown in the table above: 1Q18 total volume decreased by 0.8% y-o-y, as higher sales in NA were not enough to offset declines in EU. NA volumes went up reflecting mainly the continued ramp-up of new programs for V6 engine applications. In EU, Nemak s volumes declined mainly due to lower sales to diesel vehicles which more than offset higher sales to gasoline vehicles during the period. And, 1Q18 RoW volumes were flat as a decrease in China was offset with gains in South America. Turning to revenues, the appreciation of the euro against the US dollar and higher aluminum prices drove Nemak s 1Q18 consolidated revenues up 10.0% y-o-y. Meanwhile, 1Q18 operating income decreased 4.4% y-o-y as a result of several contrasting effects: on the one hand, Nemak benefited from operational efficiencies, increased sales of higher value-added products, a less adverse impact from metal price lag than in 1Q17, and currency effects. On the other hand, higher depreciation and amortization and a slight increase in launching expenses more than offset the above-mentioned benefits. Lower operating income translated into an operating margin of 8.7% in 1Q18, 130 basis points below 1Q17. Despite the above-mentioned decrease in operating income, 1Q18 EBITDA was 3.7% higher y-o-y due mainly to the positive effects described above. 1Q18 EBITDA per equivalent unit was US$15.0, up from US$14.4 in 1Q17. 1Q18 net income increased 3.0% compared to 1Q17 as the effect of items mentioned above together with extraordinary expenses related to new debt issuance were more than offset by lower deferred taxes. Capital expenditures totaled US$106 million during 1Q18. As explained, investments were made to support new program launches and to drive operational efficiency across the company s regions. As of March 31, 2018, Nemak reported Net Debt in the amount of US$1.4 billion. Financial ratios were: Debt, net of Cash, to EBITDA, 1.9 times; and Interest Coverage, 8.4 times. These ratios were slightly higher and lower than those reported at the end of March 2017, respectively. April 18,
33 Regional Results North America In 1Q18, revenues increased 7.5% y-o-y due to a combination of higher aluminum prices and higher volumes. In turn, EBITDA increased 4.3%, due mainly to increased sales of higher value-added products, operational efficiencies, and a less adverse impact from metal price lag. Europe In 1Q18, revenues increased 13.6% y-o-y driven by currency effects and higher aluminum prices. Meanwhile, 1Q18 EBITDA increased 9.4 % y-o-y, as operational efficiencies and FX gains more than offset the negative impact of lower volumes. Rest of the World (RoW) In 1Q18, revenues in RoW increased by 10.0% y-o-y mainly due to higher aluminum prices. However, EBITDA for the period was down US$4 million due mainly to a combination of lower customer production in China and higher launching expenses in South America April 18,
34 Methodology for presentation of results The report presents unaudited financial information. Figures are in Mexican pesos or US dollars, as indicated. For income statements, peso amounts were translated into dollars using the average exchange rate of the months during which the operations were recorded. For balance sheets, peso amounts were translated into dollars using the end-of-period exchange rate. Financial ratios were calculated in dollars. Due to rounding, small differences may occur when calculating percent changes from one period to another. Conference call information Nemak s First Quarter 2018 Conference Call will be held on Thursday, April 19, 2018, 11:30 a.m. Eastern Time (10:30 a.m. Mexico City Time). To participate in the conference call, please dial: Domestic U.S.: (877) ; International: ; Mexico Toll Free: The conference call will be webcast live through streaming audio. If you are unable to participate, the conference call audio and script will be available on Nemak s website. For more information, please visit investors.nemak.com Forward-looking statements This report may contain certain forward-looking statements concerning Nemak s future performance that should be considered as good faith estimates made by the Company. These forward-looking statements reflect management s expectations and are based upon currently available data and analysis. Actual results are subject to future events and uncertainties, which could materially impact Nemak s actual performance and results. About Nemak Nemak is a leading provider of innovative lightweighting solutions for the global automotive industry, specializing in the development and manufacturing of aluminum components for powertrain and body structure applications. The company employs more than 22,000 people at 38 facilities worldwide. In 2017, it generated revenues of US$4.5 billion. For more information about Nemak, visit Three pages of tables to follow April 18,

35 April 18,

36 April 18,
37 April 18,
, a Mexican Information and Communications Technology company, announced today its unaudited first quarter results ended March 31, 2018 (1).")
38 1st Quarter 2018 San Pedro Garza Garcia, Mexico, April 18, Axtel, S.A.B. de C.V. ( Axtel or the Company ), a Mexican Information and Communications Technology company, announced today its unaudited first quarter results ended March 31, 2018 (1). The complete unaudited first quarter results of Axtel have been filed with the Mexican Stock Exchange and are also available at the Company s website, axtelcorp.mx. YTD 1Q18 4Q17 1Q17 YTD'18 YTD'17 In millions 4Q17 1Q17 D% Revenues (Ps.) 3,753 4,286 3,683-12% 2% 3,753 3,683 2% In USD % 11% % EBITDA (Ps.) (5) 1,379 1,450 1,177-5% 17% 1,379 1,177 17% In USD % 27% % Net (loss) Income (Ps.) ,020 n.a. -6% 960 1,020-6% In USD n.a. -2% % Capital Expenditures (Ps.) % -36% % In USD % -30% % Net Debt (In USD) 1, ,021 4% -1% Net Debt / EBITDA (6) 3.3x 3.4x 4.4x Highlights: Results for the first quarter reflect the positive performance that Axtel has maintained since Core businesses, including enterprise and government segments, and the FTTx mass-market business, recorded a 5% year-over-year growth in revenues in the quarter contributing to a 17% growth in EBITDA, in pesos. To reduce the Company s risk exposure, Axtel entered into certain forward and hedging transactions to fix the exchange rate for a portion of its dollardenominated 2018 Capex, and also to reduce the volatility of its cash flow and the impact on its intrinsic value derived from foreign exchange risk. Furthermore, the Company started preliminary negotiations to refinance its dollar-denominated long-term loan in pesos. The Company will continue monitoring financial markets, and potentially take further actions, to reduce the impact in its cash flow and shareholder value, primarily from foreign exchange risks. During the quarter, Axtel executed the last phase of the tower sale agreement with American Towers Corporation, receiving Ps. 108 million in net proceeds. Axtel continues analyzing alternatives to maximize value for its shareholders including divesting non-core businesses or excess assets. Media Relations: Julio Salinas contacto@axtel.com.mx +52(81) Investor Relations: Nancy Llovera IR@axtel.com.mx +52(81) Patricio Jiménez IR@axtel.com.mx +52(81) Restricted Internal Use
ALFA, S.A.B. DE C.V. SECOND QUARTER 2018 FINANCIAL REPORT ALFA reports record EBITDA of US $676 million in 2Q18, up 30% year-over-year
 ALFA, S.A.B. DE C.V. SECOND QUARTER 2018 FINANCIAL REPORT ALFA reports record EBITDA of US $676 million in 2Q18, up 30% year-over-year Monterrey, N.L., Mexico, July 18, 2018.- ALFA, S.A.B. de C.V. (ALFA),
FOURTH QUARTER 2017 FINANCIAL REPORT ALFA REPORTS 4Q17 EBITDA OF US $568 MILLION
 ALFA, S.A.B. DE C.V. FOURTH QUARTER 2017 FINANCIAL REPORT ALFA REPORTS 4Q17 EBITDA OF US $568 MILLION Monterrey, N.L., Mexico, February 12, 2018.- ALFA, S.A.B. de C.V. (ALFA), a leading Mexican industrial
SECOND QUARTER 2017 FINANCIAL REPORT ALFA REPORTS 2Q17 EBITDA OF U.S. $522 MILLION
 ALFA, S.A.B. DE C.V. SECOND QUARTER 2017 FINANCIAL REPORT ALFA REPORTS 2Q17 EBITDA OF U.S. $522 MILLION Monterrey, N.L., Mexico, July 26, 2017.- ALFA, S.A.B. de C.V. (ALFA), a leading Mexican industrial
THIRD QUARTER 2017 FINANCIAL REPORT ALFA REPORTS 3Q17 EBITDA OF U.S. $400 MILLION
 ALFA, S.A.B. DE C.V. THIRD QUARTER 2017 FINANCIAL REPORT ALFA REPORTS 3Q17 EBITDA OF U.S. $400 MILLION Monterrey, N.L., Mexico, October 16, 2017.- ALFA, S.A.B. de C.V. (ALFA), a leading Mexican industrial
Third Quarter 2018 (3Q18)
") Monterrey, Mexico. October 15, 2018 Alpek, S.A.B. de C.V. (BMV: ALPEK) Selected Financial Information (U.S. $ Millions) Alpek reports 3Q18 EBITDA of U.S. $274 million Total Volume (ktons) 1,174 1,151 1,012
Monterrey, Mexico. October 15, 2018 Alpek, S.A.B. de C.V. (BMV: ALPEK) Selected Financial Information (U.S. $ Millions) Alpek reports 3Q18 EBITDA of U.S. $274 million Total Volume (ktons) 1,174 1,151 1,012
Second Quarter 2017 (2Q17)
") Monterrey, Mexico. July 26, 2017 Alpek, S.A.B. de C.V. (BMV: ALPEK) Selected Financial Information (U.S. $ Millions) Alpek reports 2Q17 EBITDA of U.S. $82 million Total Volume (ktons) 1,038 986 981 5 6
Monterrey, Mexico. July 26, 2017 Alpek, S.A.B. de C.V. (BMV: ALPEK) Selected Financial Information (U.S. $ Millions) Alpek reports 2Q17 EBITDA of U.S. $82 million Total Volume (ktons) 1,038 986 981 5 6
Selected financial information
 FIRST QUARTER 2018 REPORT Sigma is a leading multinational refrigerated food company that produces, markets and distributes quality branded foods, including packaged meats, cheese, yogurt and other refrigerated
Third Quarter 2017 (3Q17)
") Monterrey, Mexico. October 16, 2017 Alpek, S.A.B. de C.V. (BMV: ALPEK) Alpek reports 3Q17 EBITDA of U.S. $3 million, including a U.S. -$113 million provision covering the full amount of M&G accounts receivable
Monterrey, Mexico. October 16, 2017 Alpek, S.A.B. de C.V. (BMV: ALPEK) Alpek reports 3Q17 EBITDA of U.S. $3 million, including a U.S. -$113 million provision covering the full amount of M&G accounts receivable
First Quarter 2017 (1Q17)
") Monterrey, Mexico. April 24, 2017 Alpek, S.A.B. de C.V. (BMV: ALPEK) Selected Financial Information (U.S. $ Millions) (1) Times: Last 12 months Alpek reports 1Q17 EBITDA of U.S. $158 million Operating
Monterrey, Mexico. April 24, 2017 Alpek, S.A.B. de C.V. (BMV: ALPEK) Selected Financial Information (U.S. $ Millions) (1) Times: Last 12 months Alpek reports 1Q17 EBITDA of U.S. $158 million Operating
FOURTH QUARTER 2017 REPORT
 FOURTH QUARTER 2017 REPORT Sigma is a leading global company in the refrigerated food industry, focused on the production, marketing and distribution of packaged meats, cheese, yogurt and other refrigerated
OUTLOOK 2018 May, 2018
 May, 2018 This presentation contains forward-looking information based on numerous variables and assumptions that are inherently uncertain. They involve judgments with respect to, among other things, future
Selected financial information
 SECOND QUARTER 2018 REPORT Sigma is a leading multinational refrigerated food company that produces, markets and distributes quality branded foods, including packaged meats, cheese, yogurt and other refrigerated
Key figures (US $ million)
") THIRD QUARTER 218 REPORT Sigma is a leading multinational food company that produces, markets and distributes quality branded foods, including packaged meats, cheese, yogurt and other refrigerated and
THIRD QUARTER 218 REPORT Sigma is a leading multinational food company that produces, markets and distributes quality branded foods, including packaged meats, cheese, yogurt and other refrigerated and
First Quarter 2015 (1Q15)
") Monterrey, Mexico. April 23, 2015 Alpek, S.A.B. de C.V. (BMV: ALPEK) Selected Financial Information (U.S. $ Millions) Total Volume (ktons) (1) Times: Last 12 months Alpek reports 1Q15 EBITDA of U.S. $137
Monterrey, Mexico. April 23, 2015 Alpek, S.A.B. de C.V. (BMV: ALPEK) Selected Financial Information (U.S. $ Millions) Total Volume (ktons) (1) Times: Last 12 months Alpek reports 1Q15 EBITDA of U.S. $137
THIRD QUARTER 2017 REPORT
 THIRD QUARTER 2017 REPORT Sigma is a leading global company in the refrigerated food industry, focused on the production, marketing and distribution of packaged meats, cheese, yogurt and other refrigerated
REVENUES AND EBITDA INCREASED 5% AND 14% VIS- A- VIS 1Q14
 ALFA, S.A.B. de C.V. FIRST QUARTER 2015 FINANCIAL REPORT REVENUES AND EBITDA INCREASED 5% AND 14% VIS- A- VIS 1Q14 Monterrey, N.L., Mexico. April 23, 2015.- ALFA, S.A.B. de C.V. ( ALFA ) announced today
Fourth Quarter 2012 (4Q12)
") Monterrey, México. February 12, 2013 Alpek, S.A.B. de C.V. (BMV: ALPEK) Alpek reports 4% volume growth despite soft export markets Selected Financial Information (U.S. $ Millions) Contents Pg. Total Volume
Monterrey, México. February 12, 2013 Alpek, S.A.B. de C.V. (BMV: ALPEK) Alpek reports 4% volume growth despite soft export markets Selected Financial Information (U.S. $ Millions) Contents Pg. Total Volume
2Q12. ALFA reports a 10% EBITDA increase yearon year. ALFA, S.A.B. DE C.V.
 2Q12 ALFA, S.A.B. DE C.V. ALFA reports a 10% EBITDA increase yearon year. Monterrey, N.L., Mexico. July 16, 2012. ALFA, S.A.B. de C.V. (ALFA) one of Mexico s leading industrial companies, announced today
Outlook 2016 June, 2016
 Outlook 2016 June, 2016 This presentation contains forward-looking information based on numerous variables and assumptions that are inherently uncertain. They involve judgments with respect to, among other
Note 2 - Acquisitions and other relevant events:
 Note 2 - Acquisitions and other relevant events: 2016 a) Acquisition Axtel On December 3, 2015, ALFA, Axtel, S. A. B. de C. V. ( Axtel ) and Onexa, S. A. de C. V. ( Onexa ) subsidiary of ALFA, and a group
Alpek Polyester (PET). Pearl River, USA. Petrochemicals
. Pearl River, USA. Petrochemicals") Alpek Polyester (PET). Pearl River, USA Petrochemicals Contents Overview Recent Developments Strategy Outlook Overview Alpek Polyester (PTA, PET). Columbia, USA Alpek at a glance LTM 3Q18 US $6.6 Billion
Alpek Polyester (PET). Pearl River, USA Petrochemicals Contents Overview Recent Developments Strategy Outlook Overview Alpek Polyester (PTA, PET). Columbia, USA Alpek at a glance LTM 3Q18 US $6.6 Billion
Nemak reports 1Q18 results
 } Nemak reports 1Q18 results - Quarterly revenues and EBITDA of US$1.2 billion and US$197 million, respectively - New contracts awarded to Nemak for US$110 million in annual revenues Monterrey, Mexico.
Nemak reports 3Q17 results
 Nemak reports 3Q17 results - Quarterly revenues and EBITDA of US$1.1 billion and US$153 million - Won new contracts worth US$570 million in annual revenues Monterrey, Mexico. October 16, 2017. - Nemak,
Report of action Bolsa Mexicana de Valores Ticker Symbol: MEXCHEM*
 Report of action Bolsa Mexicana de Valores Ticker Symbol: MEXCHEM* Contact in Investor Relations: Juan Francisco Sanchez Kramer www.mexichem.com jsanchezk@mexichem.com, phone: (52) 555279 8319 Mexichem
Nemak reports 4Q17 results
 Nemak reports 4Q17 results - Quarterly revenues and EBITDA of US$1.1 billion and US$166 million, respectively - New contracts awarded to Nemak for US$130 million in annual revenues Monterrey, Mexico. February
Vitro Reports Second Quarter 2018 Results
 Vitro Reports Second Quarter 2018 Results 1.1% Year over Year increase in Sales; EBITDA Impacted by Carlisle s Float temporary shutdown San Pedro Garza García, Nuevo León, Mexico, 27 of July -, 2018 Vitro,
Nemak posts 19% EBITDA 1 growth in 3Q15
 Nemak posts 19% EBITDA 1 growth in 3Q15 Monterrey, Mexico. October 20, 2015. - Nemak, S.A.B. de C.V. ( Nemak ) (BMV: NEMAK), a leading provider of innovative light-weighting solutions for the global automotive
Nemak posts 1Q17 EBITDA 1 of US$190 million
 Nemak posts 1Q17 EBITDA 1 of US$190 million Monterrey, Mexico. April 24, 2017. - Nemak, S.A.B. de C.V. ( Nemak ) (BMV: NEMAK), a leading provider of innovative lightweighting solutions for the global automotive
Monterrey, Mexico. July 26, 2012 Grupo Famsa, S.A.B. de C.V. (BMV: GFAMSA)
") Second Quarter 2012 BMV: GFAMSA Monterrey, Mexico. July 26, 2012 Grupo Famsa, S.A.B. de C.V. (BMV: GFAMSA) Report from the Chief Executive Officer on Grupo Famsa, S.A.B. de C.V. s second quarter 2012 (2Q12)
Second Quarter 2012 BMV: GFAMSA Monterrey, Mexico. July 26, 2012 Grupo Famsa, S.A.B. de C.V. (BMV: GFAMSA) Report from the Chief Executive Officer on Grupo Famsa, S.A.B. de C.V. s second quarter 2012 (2Q12)
GRUPO CEMENTOS DE CHIHUAHUA, S.A.B. DE C.V. (BMV: GCC *) Second quarter 2017 earnings report
 Second quarter 2017 earnings report") GRUPO CEMENTOS DE CHIHUAHUA, S.A.B. DE C.V. (BMV: GCC *) Second quarter 2017 earnings report GCC REPORTS SECOND QUARTER 2017 RESULTS Chihuahua, Chihuahua, Mexico, July 25, 2017 Grupo Cementos de Chihuahua,
GRUPO CEMENTOS DE CHIHUAHUA, S.A.B. DE C.V. (BMV: GCC *) Second quarter 2017 earnings report GCC REPORTS SECOND QUARTER 2017 RESULTS Chihuahua, Chihuahua, Mexico, July 25, 2017 Grupo Cementos de Chihuahua,
EARNINGS RELEASE 3Q17
 LOGISTICS INVESTMENT PLATFORM EARNINGS RELEASE 3Q17 1 Quarterly Results 3Q17 TRAXION S REVENUE AND EBITDA INCREASE 70% AND 56% DURING 3Q17 BOOSTED BY ACQUISITIONS CONSOLIDATION YTD 2017 REVENUE AND EBITDA
1Q18 EARNINGS RELEASE. Earnings Release 1Q18 1 / 15
 EARNINGS RELEASE 1Q18 1 / 15 Monterrey, Mexico April 27 th, 2018. Grupo Famsa, S.A.B. de C.V. (BMV: GFAMSA), a leading Mexican commercial conglomerate in the retail, consumer and savings sector, announced
Financial liabilities (excluding accounts payable to suppliers) 71 Ps 1,280 Other current liabilities ,620. Euros Pesos
 71 Ps 1,280 Other current liabilities ,620. Euros Pesos") 2013 a) Nemak debt refinancing In December 2013, Nemak concluded the refinancing of its bank debt, which was authorized by the Board of Directors. This process included the bank debt of the main current
2013 a) Nemak debt refinancing In December 2013, Nemak concluded the refinancing of its bank debt, which was authorized by the Board of Directors. This process included the bank debt of the main current
Nemak posts 13% EBITDA 1 growth in 4Q16
 Nemak posts 13% EBITDA 1 growth in 4Q16 Monterrey, Mexico. February 14, 2017. - Nemak, S.A.B. de C.V. ( Nemak ) (BMV: NEMAK), a leading provider of innovative lightweighting solutions for the global automotive
Earnings Release 4Q16
 Monterrey, Mexico, May 4th, 2017 Grupo Famsa, S.A.B. de C.V. (BMV: GFAMSA), a leading Mexican commercial conglomerate in the retail, consumer credit and savings sectors, announced today its earnings results
3Q18 EARNINGS RELEASE. Earnings Release 3Q18 1 / 16
 EARNINGS RELEASE 3Q18 1 / 16 Monterrey, Mexico, October 25 th, 2018. Grupo Famsa, S.A.B. de C.V. (BMV: GFAMSA), a leading Mexican commercial conglomerate in the retail, consumer and savings sector, announced
SG&A % EBIT (2) % Total Net Debt (427) (507) -15.8% * Million US$ Nominal
 % Total Net Debt (427) (507) -15.8% * Million US$ Nominal") Vitro Reports 7.9% YoY Increase in Sales and 16.2% in EBITDA in Mexican Pesos San Pedro Garza García, Nuevo León, Mexico, October 27 th, 2016 Vitro, S.A.B. de C.V. (BMV: VITROA), hereinafter Vitro or the
Vitro Reports 7.9% YoY Increase in Sales and 16.2% in EBITDA in Mexican Pesos San Pedro Garza García, Nuevo León, Mexico, October 27 th, 2016 Vitro, S.A.B. de C.V. (BMV: VITROA), hereinafter Vitro or the
Vitro Reports 3Q 17 Results
 Vitro Reports 3Q 17 Results San Pedro Garza García, Nuevo León, Mexico, October 16, 2017 Vitro, S.A.B. de C.V. (BMV: VITROA), hereinafter Vitro or the Company, a leading glass producer in North America,
Vitro Reports First Quarter 2018 Results 29.4% and 8.2% Year over Year increase in Sales and EBITDA respectively
 Vitro Reports First Quarter 2018 Results 29.4% and 8.2% Year over Year increase in Sales and EBITDA respectively San Pedro Garza García, Nuevo León, Mexico, April 27, 2018 Vitro, S.A.B. de C.V. (BMV: VITROA),
First Quarter 2018 May 3, 2018
 First Quarter 2018 May 3, 2018 Safe Harbor Please note that in this presentation, we may discuss events or results that have not yet occurred or been realized, commonly referred to as forward-looking statements.
4Q17 EARNINGS RELEASE. Earnings Release 4Q17 1 / 19
 EARNINGS RELEASE 4Q17 1 / 19 Monterrey, Mexico May 4 th, 2018. Grupo Famsa, S.A.B. de C.V. (BMV: GFAMSA), a leading Mexican commercial conglomerate in the retail, consumer and savings sector, announced
Vitro Reports 87.1% and 60.3% YoY US dollars Increase in Sales and EBITDA respectively
 Vitro Reports 87.1% and 60.3% YoY US dollars Increase in Sales and EBITDA respectively San Pedro Garza García, Nuevo León, Mexico, April 25, 2017 Vitro, S.A.B. de C.V. (BMV: VITROA), hereinafter Vitro
Vitro Reports 2Q17 YoY Increases of 146% and 95% in Sales and EBITDA respectively in US Dollars
 Vitro Reports 2Q17 YoY Increases of 146% and 95% in Sales and EBITDA respectively in US Dollars San Pedro Garza García, Nuevo León, Mexico, July 26, 2017 Vitro, S.A.B. de C.V. (BMV: VITROA), hereinafter
4Q17 EARNINGS RELEASE. Earnings Release 4Q17 1 / 16
 EARNINGS RELEASE 4Q17 1 / 16 Monterrey, Mexico February 26 th, 2018. Grupo Famsa, S.A.B. de C.V. (BMV: GFAMSA), a leading Mexican commercial conglomerate in the retail, consumer and savings sector, announced
Third Quarter 2017 Results MAXCOM TELECOMUNICACIONES, S.A.B. DE C.V.
 MAXCOM TELECOMUNICACIONES, S.A.B. DE C.V. 1 MAXCOM REPORTS RESULTS FOR THE THIRD QUARTER OF 2017 Mexico City, October 18, 2017. Maxcom Telecomunicaciones, S.A.B. de C.V. (OTCQX: MXMTY, BMV: MAXCOM A) (
Genomma Lab FOURTH QUARTER AND FULL YEAR 2015 RESULTS
 Mexico City, Mexico, April 27, 2016 Genomma Lab Internacional, S.A.B. de C.V. (BMV: LAB.B) ( Genomma Lab or the Company ), today announced its results for the first quarter ended March 31, 2016. All figures
Monterrey, Mexico. October 25, 2012 Grupo Famsa, S.A.B. de C.V. (BMV: GFAMSA)
") Third Quarter 2012 BMV: GFAMSA Monterrey, Mexico. October 25, 2012 Grupo Famsa, S.A.B. de C.V. (BMV: GFAMSA) Report from the Chief Executive Officer on Grupo Famsa, S.A.B. de C.V. s third quarter 2012
Third Quarter 2012 BMV: GFAMSA Monterrey, Mexico. October 25, 2012 Grupo Famsa, S.A.B. de C.V. (BMV: GFAMSA) Report from the Chief Executive Officer on Grupo Famsa, S.A.B. de C.V. s third quarter 2012
GRUMA REPORTS FIRST QUARTER 2018 RESULTS
 Investor Relations ir@gruma.com Tel: 52 (81) 8399-3349 www.gruma.com San Pedro Garza García, N.L., Mexico; April 25, 2018 HIGHLIGHTS GRUMA REPORTS FIRST QUARTER 2018 RESULTS GRUMA s performance showed
GRUPO BIMBO REPORTS 2017 RESULTS
 GRUPO BIMBO REPORTS 2017 RESULTS MEXICO CITY, FEBRUARY 22, 2018 Grupo Bimbo, S.A.B. de C.V. ( Grupo Bimbo or the Company ) (BMV: BIMBO) today reported its results for the twelve months ended December 31,
GRUMA REPORTS FOURTH QUARTER 2017 RESULTS
 Investor Relations ir@gruma.com Tel: 52 (81) 8399-3349 www.gruma.com San Pedro Garza García, N.L., Mexico; February 21, 2018 GRUMA REPORTS FOURTH QUARTER 2017 RESULTS HIGHLIGHTS GRUMA s performance in
GRUMA REPORTS FIRST QUARTER 2017 RESULTS
 HIGHLIGHTS GRUMA REPORTS FIRST QUARTER 2017 RESULTS During the first quarter, GRUMA showed continued growth at its operations with volume increases at all its subsidiaries other than Gruma Centroamérica.
GRUPO CEMENTOS DE CHIHUAHUA, S.A.B. DE C.V. (BMV: GCC *) Fourth quarter 2016 earnings results
 Fourth quarter 2016 earnings results") GRUPO CEMENTOS DE CHIHUAHUA, S.A.B. DE C.V. (BMV: GCC *) Fourth quarter 2016 earnings results GCC REPORTS FOURTH QUARTER 2016 RESULTS Chihuahua, Chihuahua, Mexico, April 27, 2017 Grupo Cementos de Chihuahua,
GRUPO CEMENTOS DE CHIHUAHUA, S.A.B. DE C.V. (BMV: GCC *) Fourth quarter 2016 earnings results GCC REPORTS FOURTH QUARTER 2016 RESULTS Chihuahua, Chihuahua, Mexico, April 27, 2017 Grupo Cementos de Chihuahua,
MAXCOM TELECOMUNICACIONES, S.A.B. DE C.V.
 MAXCOM TELECOMUNICACIONES, S.A.B. DE C.V. 1 MAXCOM REPORTS RESULTS FOR THE FIRST QUARTER OF 2016 Mexico City, April 21, 2016. Maxcom Telecomunicaciones, S.A.B. de C.V. (OTCQX: MXMTY, BMV: MAXCOM CPO) (
GISSA Reports 3Q17 Results Boosted by Acquisition Strategy
 Media Contact Tel: +52 (844) 411-1095 pr@gis.com.mx www.gis.com.mx Investor Relations Contact Tel: +52 (844) 411-1050 ir@gis.com.mx http://ri.gis.investorcloud.net/ GISSA Reports 3Q17 Results Boosted by
Maxcom Telecomunicaciones, S.A.B de C.V.
 Maxcom Telecomunicaciones, S.A.B de C.V. Third Quarter Results 2018 Content Earnings Results Summary and Relevant Events Commercial Business Unit Wholesale Business Unit Residential Business Unit Consolidated
GCC REPORTS FIRST QUARTER 2018 RESULTS
 GCC REPORTS FIRST QUARTER 2018 RESULTS Chihuahua, Chihuahua, Mexico, April 24, 2018 Grupo Cementos de Chihuahua, S.A.B. de C.V. (BMV: GCC *), a leading producer of cement and ready-mix concrete in the
Corporate Presentation
 Corporate Presentation 1Q18 This presentation contains, or may be deemed to contain, forwardlooking statements. By their nature, forward looking statements involve risks and uncertainties because they
Earnings Conference Call 1Q17
 Earnings Conference Call Investor Relations São Paulo, May 15th, 2017 DISCLAIMER ON FORWARD-LOOKING STATEMENTS This presentation includes forward-looking statements. These forward-looking statements are
SECOND QUARTER 2015 RESULTS
 B SECOND QUARTER 2015 RESULTS MEXICO CITY, JULY 21, 2015 Grupo Bimbo S.A.B. de C.V. ( Grupo Bimbo or the Company ) (BMV: BIMBO) today reported results for the three months ended June 30, 2015.* HIGHLIGHTS
Fourth Quarter 2014 BMV: GFAMSA
 Monterrey, Mexico, April 27, 2015. Grupo Famsa, S.A.B. de C.V. (BMV: GFAMSA) Report of the Chief Executive Officer of Grupo Famsa, S.A.B. de C.V. on the results of the fourth quarter of 2014 (4Q14), with
GRUPO BIMBO REPORTS FIRST HALF 2016 RESULTS
 GRUPO BIMBO REPORTS FIRST HALF 2016 RESULTS MEXICO CITY, JULY 26, 2016 Grupo Bimbo S.A.B. de C.V. ( Grupo Bimbo or the Company ) (BMV: BIMBO) today reported its results for the six months ended June 30,
VERTICALLY INTEGRATED TEXTILE COMPANY EARNINGS RELEASE 3Q17 EARNINGS RELEASE 3Q17
 VERTICALLY INTEGRATED TEXTILE COMPANY EARNINGS RELEASE 3Q17 EARNINGS RELEASE 3Q17 0 MESSAGE FROM THE CEO Dear Investor, During the third quarter of 2017, revenues remained stable and costs had a small
INEOS STYROLUTION. Q1/ 2018 Investor Earnings Call
 INEOS STYROLUTION Q1/ 2018 Investor Earnings Call Disclaimer The following presentation includes forward-looking statements, within the meaning of the US securities laws, based on our current expectations
Third Quarter 2011 BMV: GFAMSA
 Third Quarter 2011 BMV: GFAMSA Monterrey, Mexico. October 27, 2011 Grupo Famsa, S.A.B. de C.V. (BMV: GFAMSA) Report from the Chief Executive Officer on Grupo Famsa, S.A.B. de C.V. s third quarter 2011
1Q05 Results Were Strong Overall and Better than Expected; Some Flags in Sigma
 Latin American Equity Research Mexico, April 21, 2005. Earnings Comment Mexico Conglomerates ALFA (US$4.71) (ALFAA) STRONG BUY TARGET PRICE: US$6.15 1Q05 Results Were Strong Overall and Better than Expected;
EARNINGS RELEASE 3Q18 VERTICALLY INTEGRATED TEXTILE COMPANY EARNINGS RELEASE
 VERTICALLY INTEGRATED TEXTILE COMPANY EARNINGS RELEASE 3Q18 0 MESSAGE FROM THE CEO Dear Investor, The third quarter of 2018 posted an increase of 12.5% in sales, compared to the third quarter of 2017,
3 rd Quarter 2018 Financial Results
 3 rd Quarter 2018 Financial Results Milestone Revenues and Earnings, Structural Improvements, Enhanced Portfolio and Geographic Reach November 8, 2018 Disclaimer This presentation contains forward-looking
Earnings Release 4Q15
 Monterrey, Mexico, May 27, 2016. Grupo Famsa, S.A.B. de C.V. (BMV: GFAMSA), a leading Mexican commercial conglomerate in the retail, consumer credit and savings sectors, announced today its earnings results
Second Quarter 2016 Results MAXCOM TELECOMUNICACIONES, S.A.B. DE C.V.
 MAXCOM TELECOMUNICACIONES, S.A.B. DE C.V. 1 MAXCOM REPORTS RESULTS FOR THE SECOND QUARTER OF 2016 Mexico City, July 21, 2016. Maxcom Telecomunicaciones, S.A.B. de C.V. (OTCQX: MXMTY, BMV: MAXCOM CPO) (
Stock Symbol: TSX CCL.A and CCL.B. CCL Industries Reports a 25% Increase in Third Quarter 2012 Net Earnings and Declares Dividend Results Summary
 CCL Industries Inc. 105 Gordon Baker Road, Suite 500, Toronto, Ontario M2H 3P8 Telephone: (416) 756-8500 Fax: (416) 756-8555 News Release Stock Symbol: TSX CCL.A and CCL.B For Immediate Release Tuesday,
GRUPO CEMENTOS DE CHIHUAHUA, S.A.B. DE C.V. (BMV: GCC *) Second quarter 2015 earnings results
 Second quarter 2015 earnings results") GRUPO CEMENTOS DE CHIHUAHUA, S.A.B. DE C.V. (BMV: GCC *) Second quarter 2015 earnings results GCC REPORTS SECOND QUARTER 2015 RESULTS Chihuahua, Chihuahua, Mexico, July 28, 2015 Grupo Cementos de Chihuahua,
GRUPO CEMENTOS DE CHIHUAHUA, S.A.B. DE C.V. (BMV: GCC *) Second quarter 2015 earnings results GCC REPORTS SECOND QUARTER 2015 RESULTS Chihuahua, Chihuahua, Mexico, July 28, 2015 Grupo Cementos de Chihuahua,
GRUPO CEMENTOS DE CHIHUAHUA, S.A.B. DE C.V. (BMV: GCC *) Fourth quarter 2014 earnings results
 Fourth quarter 2014 earnings results") GRUPO CEMENTOS DE CHIHUAHUA, S.A.B. DE C.V. (BMV: GCC *) Fourth quarter 2014 earnings results GCC REPORTS FOURTH QUARTER 2014 RESULTS Chihuahua, Chihuahua., Mexico, April 30, 2015 Grupo Cementos de Chihuahua,
GRUPO CEMENTOS DE CHIHUAHUA, S.A.B. DE C.V. (BMV: GCC *) Fourth quarter 2014 earnings results GCC REPORTS FOURTH QUARTER 2014 RESULTS Chihuahua, Chihuahua., Mexico, April 30, 2015 Grupo Cementos de Chihuahua,
GCC REPORTS THIRD QUARTER 2018 RESULTS
 GCC REPORTS THIRD QUARTER 2018 RESULTS Chihuahua, Chihuahua, Mexico, October 23, 2018 Grupo Cementos de Chihuahua, S.A.B. de C.V. (BMV: GCC *), a leading producer of cement and ready-mix concrete in the
EARNINGS RELEASE 2Q18 VERTICALLY INTEGRATED TEXTILE COMPANY EARNINGS RELEASE 2Q18
 VERTICALLY INTEGRATED TEXTILE COMPANY EARNINGS RELEASE 2Q18 0 MESSAGE FROM THE CEO Dear Investor, The second quarter of 2018 posted sales for MXN4,711, the highest quarterly sales since the fourth quarter
Third Quarter 2016 Earnings October 27, 2016
 Third Quarter 2016 Earnings October 27, 2016 Forward-Looking Statements Certain statements in these slides and made during this presentation may be considered forward-looking statements. These statements
Nemak reports 3Q18 results
 } Nemak reports 3Q18 results - Quarterly revenues and EBITDA both grew 5% y-o-y to US$1.2 billion and US$160 million, respectively. Monterrey, Mexico. October 15, 2018. - Nemak, S.A.B. de C.V. ( Nemak
Maxcom Telecomunicaciones, S.A.B de C.V.
 Maxcom Telecomunicaciones, S.A.B de C.V. Fourth Quarter Results 2018 Content Earnings Results Summary and Relevant Events Commercial Business Unit Wholesale Business Unit Residential Business Unit Consolidated
GRUPO BIMBO REPORTS THIRD QUARTER 2018 RESULTS MEXICO CITY, OCTOBER 24, 2018
 GRUPO BIMBO REPORTS THIRD QUARTER 2018 RESULTS MEXICO CITY, OCTOBER 24, 2018 We delivered strong third quarter results. We continue to transform our Company to be highly competitive, productive and sustainable
Nemak reports 4Q18 EBITDA of US$171 million
 } Nemak reports 4Q18 EBITDA of US$171 million - Full-year revenues and EBITDA grew 5.0% and 2.7% vs 2017 to US$4.7 billion and US$734 million, respectively. Monterrey, Mexico. February 13, 2019. - Nemak,
Platform Specialty Products Corporation Announces 2017 Fourth Quarter and Full Year Financial Results
 February 27, 2018 Platform Specialty Products Corporation Announces 2017 Fourth Quarter and Full Year Financial Results 2017 net sales of $3.8 billion, an increase of 5%; record net sales of $1.1 billion
1999 Fourth Quarter Results
 Carlos Jacks Investor Relations 52 (8) 328-3393 cjacks@cemex.com CEMEX homepage: http://www.cemex.com Marcelo Benitez Analyst Relations (212) 317-6008 mbenitez@cemex.com 1999 Fourth Quarter Results EBITDA
EARNINGS RELEASE 1Q18 VERTICALLY INTEGRATED TEXTILE COMPANY EARNINGS RELEASE 1Q18
 VERTICALLY INTEGRATED TEXTILE COMPANY EARNINGS RELEASE 1Q18 0 MESSAGE FROM THE CEO Dear Investor, The first quarter of 2018 posted an EBITDA of MXN252, an increase of 61.8% compared to MXN155 generated
Corporate Presentation 3Q16
 Corporate Presentation 3Q16 v 10.4 This presentation contains, or may be deemed to contain, forwardlooking statements. By their nature, forward looking statements involve risks and uncertainties because
Corporate Presentation 3Q17
 Corporate Presentation 3Q17 This presentation contains, or may be deemed to contain, forwardlooking statements. By their nature, forward looking statements involve risks and uncertainties because they
ALFA, S.A.B. de C.V. THIRD QUARTER 2015 FINANCIAL REPORT
 ALFA, S.A.B. de C.V. THIRD QUARTER 2015 FINANCIAL REPORT ALFA REPORTS 3Q15 EBITDA UP 8 YEAR- ON- YEAR Monterrey, N.L., Mexico. October 20, 2015.- ALFA, S.A.B. de C.V. (ALFA) reported today 3Q15 unaudited
Let s give our soul, heart and being in everything we do. R.I.P. Don Lorenzo Servitje, founder of Grupo Bimbo
 GRUPO BIMBO REPORTS 2016 RESULTS MEXICO CITY, FEBRUARY 23, 2017 Grupo Bimbo, S.A.B. de C.V. ( Grupo Bimbo or the Company ) (BMV: BIMBO) today reported its results for the twelve months ended December 31,
9M 2018 Earnings Results. November 13,
 9M 2018 Earnings Results November 13, 2018 www.grupocodere.com 1 Table of Contents Financial and Operating Overview... 3 Consolidated Income Statement... 4 Revenue and Adjusted EBITDA... 6 Earnings per
Bank of America Merrill Lynch 2018 Asia Pacific Resources Conference. Hong Kong December 4-5, 2018
 Bank of America Merrill Lynch 2018 Asia Pacific Resources Conference Hong Kong December 4-5, 2018 Disclaimer This presentation contains forward-looking statements of Indorama Ventures Public Company Limited
State of the Chemical and Petrochemical Industry Is India the next driver?
 State of the Chemical and Petrochemical Industry Is India the next driver? Presentation to IOC Conclave 29 July 217 Dave Witte Senior Vice President, IHS Markit GM - Oil Markets, Midstream, Downstream
controladora mabe, s.a. de c.v. Q4, 2015 Results CONTROLADORA MABE, S.A. DE C.V.
 Q4, 2015 Q4, 2015 Results CONTROLADORA MABE, S.A. DE C.V. During the fourth quarter of 2015, Mabe delivered a very solid top line performance despite FX volatility, compensated by smart pricing. Sales
First Quarter 2016 Earnings April 27, 2016
 First Quarter 2016 Earnings April 27, 2016 Forward-Looking Statements Certain statements in these slides and made during this presentation may be considered forward-looking statements. These statements
A N N U A L R E P O R T
 2017 ANNUAL REPORT ALFA is a holding company that manages a portfolio of diversified subsidiaries: Sigma, a leading multinational refrigerated food company, focused on the production, marketing and distribution
Q2 FY17 Results April 26, 2017
 Q2 FY17 Results April 26, 2017 Steve Voorhees Chief Executive Officer Ward Dickson Chief Financial Officer Jim Porter President, Business Development and Latin America Jeff Chalovich President, Corrugated
4Q16 and 2016 Results
 JBS S.A. (BVM&FBOVESPA: JBSS3; OTCQX: JBSAY) São Paulo, March 13 th, 2017 and 2016 Results JBS Ended With Net Income of R$693.9 million and a free cash generation of R$2.9 billion JBS ended with net revenues
FEMSA Announces Third Quarter 2018 Results
 FEMSA Announces Third Quarter 2018 Results Monterrey, Mexico, October 26, 2018 Fomento Económico Mexicano, S.A.B. de C.V. ( FEMSA ) (NYSE: FMX; BMV: FEMSAUBD) announced today its operational and financial
Momentive Performance Materials Inc. 22 Corporate Woods Blvd. Albany, NY 12211
 Momentive Performance Materials Inc. 22 Corporate Woods Blvd. Albany, NY 12211 NEWS RELEASE FOR IMMEDIATE RELEASE Momentive Performance Materials Inc. Reports Fourth Quarter and Fiscal Year 2010 Results
GRUPO BIMBO REPORTS FIRST QUARTER 2018 RESULTS
 GRUPO BIMBO REPORTS FIRST QUARTER 2018 RESULTS MEXICO CITY, APRIL 26, 2018 Grupo Bimbo S.A.B. de C.V. ( Grupo Bimbo or the Company ) (BMV: BIMBO) today reported its results for the three months ended March
Change % Net sales 101, , Net income 7, , Net income attributable to stockholders of the Company
 INVESTOR RELATIONS 2/21/2019 4:30 PM FOR IMMEDIATE RELEASE e Full Year 2018 Highlights Consolidated Net Sales and Operating Segment Income grew 8.2 and 8.5, respectively Advertising sales grew 2.1 during
GIS Reports First Quarter 2018 Results Launches Draxton to Consolidate Auto Parts Segment
 Media Contact Tel: +52 (844) 411-1095 pr@gis.com.mx www.gis.com.mx Investor Relations Contact Tel: +52 (844) 411-1050 ir@gis.com.mx http://ri.gis.investorcloud.net/ GIS Reports First Quarter 2018 Results
Q4 and Full Year 2015 Financial Results March 3, 2016
 Q4 and Full Year 2015 Financial Results March 3, 2016 Trademark of Trinseo S.A. or its affiliates Introductions & Disclosure Rules Introductions Chris Pappas, President & CEO David Stasse, Vice President,