SECOND QUARTER 2017 FINANCIAL REPORT ALFA REPORTS 2Q17 EBITDA OF U.S. $522 MILLION
|
|
|
- Christina Marsh
- 6 years ago
- Views:
Transcription
1 ALFA, S.A.B. DE C.V. SECOND QUARTER 2017 FINANCIAL REPORT ALFA REPORTS 2Q17 EBITDA OF U.S. $522 MILLION Monterrey, N.L., Mexico, July 26, ALFA, S.A.B. de C.V. (ALFA), a leading Mexican industrial company, reported today its 2Q17 unaudited financial results. Total revenues were U.S. $4,232 million, up 5% year-on-year due to higher sales achieved at all major business units. EBITDA was U.S. $522 million, down 19% vis-à-vis 2Q16, mainly explained by lower margins and inventory devaluation at Alpek, along with lower volumes and adverse metal lag impact in Nemak. Alvaro Fernandez, ALFA s President, commented on the Company s results: During the quarter, the Alfa companies delivered a mixed performance. We saw strong performance at Sigma mainly driven by its Mexican and European operations. In addition, solid results and the first phase of tower sales at Axtel also contributed positively to overall results. However, lower volumes in North America and adverse metal lag impacted Nemak s results, while the effect of lower oil prices and lower Polyester margins affected Alpek s performance. Consolidated capital expenditures and acquisitions amounted to U.S. $227 million during 2Q17. Net Debt at the quarter end of U.S. $6,401 million was 6% higher when compared to the U.S. $6,032 million in 2Q16. At the end of the quarter, financial ratios were: Net Debt to EBITDA: 3.0 times; Interest Coverage: 5.7 times. Majority Net Income was U.S. $76 million in 2Q17, compared to U.S. $46 million in 2Q16. This increase is mainly the result of lower operating results, which were offset by lower Comprehensive Financing Expense ( CFE ) due to lower foreign exchange losses during the quarter, compared to 2Q16. SELECTED FINANCIAL INFORMATION (U.S. $MILLION) 2Q17 1Q17 2Q16 CH. % VS. 1Q17 CH. % VS. 2Q16 YTD. 17 YTD. 16 YTD Chg. % CONSOLIDATED REVENUES 4,232 3,997 4, ,230 7,860 5 Sigma 1,503 1,350 1, ,853 2,799 2 Alpek 1,306 1,293 1, ,598 2,419 7 Nemak 1,165 1,123 1, ,288 2,198 4 Axtel Newpek CONSOLIDATED EBITDA (1) (19) 1,050 1,222 (14) Sigma (1) (9) Alpek (48) (61) (37) Nemak (7) (8) Axtel Newpek 1 (2) (2) (1) (3) 60 MAJORITY NET INCOME (51) CAPITAL EXPENDITURES & ACQ (24) (34) (21) NET DEBT 6,401 6,359 6, ,401 6,032 6 Net Debt/LTM EBITDA* LTM Interest Coverage* * Times. UDM = Last 12 months 1 EBITDA = Operating Income + depreciation and amortization + impairment of assets. CONTENTS: Summary of Groups 2 Alfa Financial Tables 5 ALFA Groups Financial Information 9 This release may contain forward looking information based on numerous variables and assumptions that are inherently uncertain. They involve judgments with respect to, among other things, future economic, competitive and financial market conditions and future business decisions, all of which are difficult or impossible to predict accurately. Accordingly, results could vary from those set forth in this release. The report presents unaudited financial information. Figures are presented in Mexican pesos or U.S. Dollars, as indicated. Where applicable, peso amounts were translated into U.S. Dollars using the average exchange rate of the months during which the operations were recorded. Financial ratios are calculated in U.S. Dollars. Due to the rounding up of figures, small differences may occur when calculating percent changes from one period to the other.
2 ALFA S SECOND QUARTER SUMMARY OF GROUPS PERFORMANCE DURING 2Q17 Sigma s revenues amounted to U.S. $1,503 million, an increase of 4% versus 2Q16. By region, sales in Mexico increased 10% y-o-y in peso terms, reflecting higher volume and price adjustments to absorb the effect of a higher exchange rate on raw material costs. European sales continued to improve, increasing 3% in euro terms, while U.S. and Latin America increased 3% and 2% in dollar terms, respectively. In line with full year guidance, Sigma reported 2Q17 EBITDA of U.S. $167 million, down 1% year-on-year, mainly explained by a solid performance of Mexican operations which benefited benefitted from a more favorable currency environment, and strong results in Europe, which offset the start-up costs at new plant in Spain. In the U.S., results were impacted by a lag between price adjustments and recent cost increases on raw materials. On June 28, Sigma announced the acquisition of Sociedad Suizo Peruana de Embutidos, S.A. (SUPEMSA), a Peruvian company engaged in the production and sale of packaged meats and dairy products. In 2016, the company generated sales of U.S. $54.2 million. The acquisition was effective July 1 st, During 2Q17, capital expenditures totaled U.S. $50 million, funds were utilized for the new plant in Burgos, Spain, other fixed assets and minor projects across the company. At the end of 2Q17, Net Debt was U.S. $1,940 million, similar to 2Q16. Financial ratios at the end of 2Q17 were: Net Debt to EBITDA, 3.1 times; Interest Coverage, 4.4 times. (See appendix A for more comprehensive analysis of Sigma s 2Q17 financial results) Alpek s revenues for the second quarter totaled U.S. $1.3 billion, up 6% year-on-year, as lower average prices were more than offset by volume growth. 2Q17 consolidated volume was up 6%, while average 2Q17 consolidated prices were flat year-on-year, mainly due to lower feedstock prices. 2Q17 EBITDA was U.S. $82 million, down 61% from 2Q16. This quarter s EBITDA includes a U.S. $29 million non-cash inventory loss charge and a U.S. $12.5 million one-time gain from the acquisition of a controlling interest in Selenis Canada Inc. in Adjusting for the inventory loss and one-time gain, comparable EBITDA was U.S. $99 million and U.S. $190 million in 2Q17 and 2Q16, respectively. Comparable 2Q17 EBITDA was lower than expected as Polyester segment EBITDA was affected by higher costs associated with planned and unplanned outages, feedstock cost carryover and tight supply of secondary feedstock prices (IPA and CHDM) that had an estimated impact of U.S. $21 million. Accumulated EBITDA as of June 30, 2017 was U.S. $240 million. 2Q17 Capex was U.S. $65 million, compared to U.S. $110 million in 2Q16. The majority of these funds were invested in the 350 MW power cogeneration plant in Altamira, Mexico which is advancing as planned together with other projects such as the EPS plant expansion. An important milestone this quarter was the on-schedule startup of the company s propylene storage spheres in Altamira, Mexico. The acquisition of PetroquimicaSuape and Citepe from Petrobras for U.S. $385 million is advancing as planned. Alpek made an initial deposit of U.S. $39 million in escrow, and the Administrative Council for Economic Defense (CADE) in Brazil has begun evaluating the transaction. Closing is subject to CADE s approval, among other conditions. Net Debt as of the end of the quarter was U.S. $1,058 million, up 16% year-on-year, driven by the aforementioned investment in strategic projects. At quarter end, financial ratios were as follows: Net Debt to EBITDA, 2.0 times; Interest Coverage, 8.0 times. (See appendix B for Alpek s 2Q17 financial report) Nemak s 2Q17 sales volume was 12.8 million equivalent units, 2% lower than 2Q16. Sales volume declined in North America mainly due to lower demand from Ford and FCA, which reduced and discontinued production of certain vehicle
3 ALFA S SECOND QUARTER lines, respectively. Volumes in Europe remained flat during the quarter. By contrast, Rest-of-World volumes reported strong growth year-on-year, mainly due to the continued ramp-up of new programs in China. Higher aluminum prices supported revenues, which showed a 4% year-over-year increase. 2Q17 EBITDA totaled U.S. $206 million, down 7% year-on-year, mainly as a result of lower sales volumes in North America, negative metal price lag, and increased expenses associated with new programs. Additionally, the company recognized a non-recurring gain in the amount of U.S. $18 million derived from the reversal of a provision related to a disputed tax on revenues. EBITDA per unit was U.S. $16.10 in 2Q17, down from U.S. $16.90 in the same period last year. Capital expenditures in the quarter amounted to U.S. $88 million as the company continued to move ahead with strategic projects. Investments were made to increase production capacity to meet new demand coming from recently won contracts. Likewise, resources were dedicated to the plant under construction in Slovakia, which will produce structural and electric vehicle ( EV ) components starting in 2H17. Net Debt at the end of 2Q17 totaled U.S. $1,397 million, up 4% from 2Q16, reflecting the capital expenditures during the period. Financial ratios in 2Q17 were: Net Debt to EBITDA of 1.8 times, and Interest Coverage of 11.1 times. (See appendix C for Nemak s 2Q17 financial report) Axtel s revenues in the second quarter totaled U.S. $203 million, up 5% year-on-year, largely attributable to the Company s sales to Enterprise and Government segments as some legacy businesses are a drag on overall sales. Axtel has cycled the 2016 acquisition and results are now on a comparable basis. In peso terms, total revenues increased 9% in the quarter, reflecting 8% and 42% growth in enterprise and government segments, respectively, and flat mass-market segment results. Enterprise and government segment represented 80% of revenues in the quarter. 2Q17 EBITDA was U.S. $81 million, up 29% year-on-year, explained in part by a U.S. $17 million benefit from the first tranche of the tower sale. Excluding this effect, EBITDA increased 2% from 2Q16. In peso terms, EBITDA increased 32% year-on-year. In an effort to reduce FX volatility, Axtel entered into a second par-forward transaction that fixed the exchange rate for the interest and principal obligations denominated in dollars at pesos per dollar from April to July Capital expenditures totaled U.S. $16 million in 2Q17 (U.S. $35 million, excluding tower sales), including investments to provide last-mile access to connect customers, to deploy IT infrastructure and to further increase data center capacity in Queretaro, Mexico. At the end of 2Q17, Net Debt was U.S. $1,027 million, up U.S. $20 million year-on-year. Financial ratios at the end of 2Q17 were: Net Debt to EBITDA of 4.1 times and Interest Coverage of 8.6 times. (See appendix D for Axtel s 2Q17 financial report) Newpek s revenues were slightly higher than 2Q16, as higher average oil and gas prices offset a decline in production. West Texas Intermediate (WTI) oil price was up 6% from 2Q16, averaging approximately U.S. $48 per barrel, and Henry Hub natural gas price increased 44% to an average of U.S. $3.1 per million BTU. Newpek connected to sales four new wells at the Eagle Ford Shale ( EFS ) in South Texas. This brought wells in production at EFS to 632 by the quarter s end, compared to the 628 wells in production at the end of 2Q16. Production in the U.S. averaged 4.2 million barrels of oil equivalent per day (MBOED) during 2Q17, down 46% from 2Q16 reflecting less drilling and normal decline rate. In line with the 2017 operating plan, strategic drilling and completion activities continued at EFS during the quarter. As a result, nine new wells are expected to be put into production during 3Q17 and seven during 4Q17, for a total of 20 new producing wells during the year. In Mexico, production averaged 3.7 MBOED during 2Q17, up 12% from 2Q16.
4 ALFA S SECOND QUARTER Q17 revenues totaled U.S. $29 million, up 16% year-on-year, while EBITDA was U.S. $1 million, an improvement from the negative U.S. $2 million reported in 2Q16. Capital expenditures in the quarter amounted to U.S. $7 million. (See appendix E for more comprehensive analysis of Newpek s 2Q17 financial results) CONSOLIDATED FINANCIAL RESULTS 2Q17 consolidated revenues were U.S. $4,232 million, up 5% from U.S. $4,050 million reported in 2Q16. The increase is the result of higher sales across all business units and mainly reflects higher sales volume in Alpek, higher aluminum prices which offset lower volumes in Nemak, along with higher volumes and prices in Sigma. During the quarter, foreign sales represented 64% of the total, in line with 2Q16. Year-to-date revenues were U.S. $8,230, up 5% from 2016, primarily for the same reasons. 2Q17 Consolidated Operating Income totaled U.S. $278 million, down 33% from 2Q16, primarily due to weaker results at Alpek, as oil-related feedstocks resulted in a U.S. $29 million inventory devaluation during the quarter, compared to a U.S. $19 million inventory revaluation in 2Q16. In addition to lower results in the Polyester business mostly due to rising comonomer prices and further PET margin erosion; lower margins at Nemak stemming mainly from lower sales volume in North America and a reversal of metal lag effect also contributed to the decline. These items were partially offset by a nonrecurring gain of U.S. $18 million from the reversal of a provision related to a disputed tax on revenues. In turn, Axtel s operating income benefitted by extraordinary income of U.S. $17 million stemming from the sale of transmission towers, while Sigma was flat from 2Q16. Accumulated Operating Income was U.S. $571 million, down 28% from Q17 EBITDA was U.S. $522 million, down 19% year-on-year, reflecting the lower Operating Income explained above. Yearto-date EBITDA was U.S. $1,050 million, down 14% from ALFA reported 2Q17 Comprehensive Financing Expense (CFE) of U.S. $113 million, compared to U.S. $321 million in 2Q16, mainly explained by lower foreign exchange losses during the quarter than those reported in 2Q16. Majority Net Income was U.S. $76 million in 2Q17, compared to U.S. $46 million in 2Q16. This year-on-year increase is mainly explained by lower operating results offset by lower CFE already explained. Year-to-date Majority Net Income was U.S. $230 million, up 22% from the same period in CAPITAL EXPENDITURES AND ACQUISITIONS; NET DEBT Consolidated capital expenditures and acquisitions totaled U.S. $227 million in 2Q17. All subsidiaries continued to make progress on their investment plans as discussed in the initial section of this report. At quarter-end 2Q17, ALFA s Net Debt amounted to U.S. $6,401 million, U.S. $369 million higher than 2Q16. At the end of the quarter, financial ratios were: Net Debt to EBITDA, 3.0 times; Interest Coverage, 5.7 times. These ratios compare to 2.5 times and 7.1 times, respectively in 2Q16.
5 ALFA S SECOND QUARTER ALFA TABLE 1 VOLUME AND PRICE CHANGES (%) 2Q17 vs. YTD. 17 VS 1Q17 2Q16 YTD. 16 Total Volume Domestic Volume Foreign Volume Avg. Ps. Prices (6.7) Avg. U.S. $ Prices 2.2 (2.2) (2.8) TABLE 2 REVENUES (%) 2Q17 VS. 2Q17 1Q17 2Q16 1Q17 2Q16 YTD. 17 YTD. 16 Ch.% TOTAL REVENUES Ps. Millions 78,665 81,381 73,119 (3) 8 160, , U.S. $ Millions 4,232 3,997 4, ,230 7,860 5 DOMESTIC REVENUES Ps. Millions 27,962 28,344 25,653 (1) 9 56,306 49, U.S. $ Millions 1,504 1,393 1, ,897 2,748 5 FOREIGN REVENUES Ps. Millions 50,704 53,037 47,466 (4) 7 103,741 92, U.S. $ Millions 2,728 2,604 2, ,333 5,112 4 Foreign / Total (%) TABLE 3 OPERATING INCOME AND EBITDA (%) 2Q17 VS. 2Q17 1Q17 2Q16 1Q17 2Q16 YTD. 17 YTD. 16 Ch.% OPERATING INCOME Ps. Millions 5,137 5,977 7,444 (14) (31) 11,114 14,204 (22) U.S. $ Millions (5) (33) (28) EBITDA Ps. Millions 9,679 10,748 11,599 (10) (17) 20,427 22,043 (7) U.S. $ Millions (1) (19) 1,050 1,222 (14) TABLE 4 COMPREHENSIVE FINANCING (EXPENSE) / INCOME (CFI) (U.S. $ MILLIONS) (%) 2Q17 VS. 2Q17 1Q17 2Q16 1Q17 2Q16 YTD. 17 YTD. 16 Ch.% Financial Expenses (108) (131) (103) 18 (5) (239) (212) (13) Financial Income (2) Net Financial Expenses (99) (122) (96) 19 (3) (221) (196) (13) Fx Gains (Losses) (18) 237 (218) (108) (191) 214 PRE valuation 0 0 (7) (41) 100 Capitalized CFE CFE (113) 118 (321) (196) 65 4 (428) 101 Avg. Cost of Borrowed Funds (%)
6 ALFA S SECOND QUARTER ALFA TABLE 5 MAJORITY NET INCOME (U.S. $ MILLIONS) (%) 2Q17 VS. 2Q17 1Q17 2Q16 1Q17 2Q16 YTD. 17 YTD. 16 Ch.% Consolidated Net Income (Loss) (48) Minority Interest (42) Majority Net Income (Loss) (51) Per Share (U.S. Dollars) (50) Avg. Outstanding Shares (Millions) 5,086 5,112 5,121 5,099 5,121 TABLE 6 CASH FLOW (U.S. $ MILLIONS) (%) 2Q17 VS. 2Q17 1Q17 2Q16 1Q17 2Q16 YTD. 17 YTD. 16 Ch.% EBITDA (1) (19) 1,050 1,222 (14) Net Working Capital & Others (9) (265) (147) (274) (368) 26 Capital Expenditures & Acquisitions (227) (298) (344) (525) (665) 21 Net Financial Expenses (103) (124) (106) 17 3 (227) (217) (5) Taxes (88) (53) (63) (66) (40) (141) (185) 24 Dividends (ALFA, S.A.B.) 0 (170) (170) (172) 1 Other Sources / Uses (137) (133) (36) (3) (281) (270) (862) 69 Decrease (Increase) in Net Debt (42) (515) (137) (557) (1,247) 55 TABLE 7 SELECTED BALANCE SHEET INFORMATION & FINANCIAL RATIOS (U.S. $ MILLIONS) 2Q17 1Q17 2Q16 YTD. 17 YTD. 16 Assets 18,126 17,502 16,619 18,126 16,619 Liabilities 12,928 12,581 11,888 12,928 11,888 Stockholders Equity 5,198 4,921 4,731 5,198 4,731 Majority Equity 3,883 3,659 3,591 3,883 3,591 Net Debt 6,401 6,359 6,032 6,401 6,032 Net Debt/EBITDA* Interest Coverage*
7 Appendix A ALFA, S.A.B. de C.V. and Subsidiaries BALANCE SHEET Information in millions of Nominal Mexican Pesos (%) Jun 17 vs. Jun-17 Mar-17 Jun-16 Mar 17 Jun 16 ASSETS CURRENT ASSETS: Cash and cash equivalents 19,598 20,286 21,097 (3) (7) Trade accounts receivable 26,766 28,059 31,612 (5) (15) Other accounts and notes receivable 6,279 5,271 6, Inventories 39,714 41,186 38,174 (4) 4 Other current assets 12,580 10,788 9, Total current assets 104, , ,580 (1) (2) INVESTMENTS IN ASSOCIATES AND JOINT VENTURES 2,072 2,075 2,448 (0) (15) PROPERTY, PLANT AND EQUIPMENT 139, , ,155 (2) 6 INTANGIBLE ASSETS 56,420 57,655 52,143 (2) 8 OTHER NON-CURRENT ASSETS 21,415 22,102 20,967 (3) 2 Total assets 324, , ,293 (1) 3 LIABILITIES AND STOCKHOLDER'S EQUITY CURRENT LIABILITIES: Current portion of long-term debt 1, , (26) Bank loans and notes payable 9,889 11,297 5,693 (12) 74 Suppliers 50,675 50,421 43, Other current liabilities 20,493 20,217 22,034 1 (7) Total current liabilities 82,171 82,414 72,411 (0) 13 LONG-TERM LIABILITIES: Long-term debt 124, , ,808 (3) (3) Deferred income taxes 14,194 14,998 13,493 (5) 5 Other liabilities 6,568 6,980 6,994 (6) (6) Estimated liabilities for seniority premiums and pension plans 4,433 4,392 4, Total liabilities 231, , ,824 (2) 3 STOCKHOLDERS' EQUITY: Controlling interest: Capital stock (1) Contributed capital (1) Earned surplus 69,281 68,607 67, Total controlling interest 69,493 68,819 67, Total Non-controlling interest 23,544 23,734 21,554 (1) 9 Total stockholders' equity 93,037 92,553 89, Total liabilities and stockholders' equity 324, , ,293 (1) 3 Current ratio Debt to equity
8 Appendix B ALFA, S.A.B. DE C.V. and Subsidiaries STATEMENT OF COMPREHENSIVE INCOME Information in millions of Nominal Mexican Pesos 2Q17 vs. (%) 2Q17 1Q17 2Q16 YTD '17 YTD '16 1Q17 vs. (%) 2Q16 Net sales 78,665 81,381 73, , ,746 (3) 8 Domestic 27,962 28,344 25,653 56,306 49,525 (1) 9 Export 50,704 53,037 47, ,741 92,221 (4) 7 Cost of sales (63,543) (64,555) (55,228) (128,098) (107,812) 2 (15) Gross profit 15,122 16,826 17,891 31,949 33,935 (10) (15) Operating expenses and others (9,985) (10,849) (10,448) (20,834) (19,730) 8 4 Operating income 5,137 5,977 7,444 11,114 14,204 (14) (31) Comprehensive financing expense, net (2,137) 2,269 (5,834) 133 (7,780) (194) 63 Equity in income (loss) of associates (44) 11 Income before the following provision 3,026 8,292 1,632 11,317 6,435 (64) 85 Provisions for: Income tax (839) (3,639) (429) (4,479) (1,447) 77 (96) Consolidated net income 2,187 4,652 1,203 6,839 4,988 (53) 82 Income (loss) corresponding to minority interest 816 1, ,362 1,633 (47) 111 Net income (loss) corresponding to majority interest 1,371 3, ,477 3,355 (56) 68 EBITDA 9,679 10,748 11,599 20,428 22,043 (10) (17) Interest coverage* * LTM
9 ALFA S SECOND QUARTER LUIS OCHOA +52 (81) lochoa@alfa.com.mx JUAN ANDRÉS MARTÍN +52 (81) jamartin@alfa.com.mx APPENDIX: A SIGMA 10 B ALPEK 13 C NEMAK 25 D AXTEL 33 E NEWPEK 43 MARCELA ELIZONDO +52 (81) melizondo@alfa.com.mx MBS VALUE PARTNERS SUSAN BORINELLI +1 (646) susan.borinelli@mbsvalue.com
10 ALFA S SECOND QUARTER SIGMA REFRIGERATED FOOD PRODUCTS 36% AND 31% OF ALFA S REVENUES AND EBITDA IN 2Q17 Sigma is a leading multinational refrigerated food company that produces, markets and distributes quality branded foods, including packaged meats, cheese, yogurt and other refrigerated and frozen foods. Sigma has a diversified portfolio of leading brands and operates 68 plants in 17 countries across its four key regions: Mexico, Europe, the United States, and Latin America. INDUSTRY COMMENTS During 2Q17, the consumer markets were mixed across Sigma s main regions of operations. In Mexico, the average consumer confidence index reported by INEGI (Instituto Nacional de Estadística y Geografía National Institute for Statistics and Geography) was down 6% year-on-year, but up 15% from 1Q17. In turn, 2Q17 same-store sales reported by the National Association of Supermarkets and Department Stores (ANTAD) increased 5.7% year-on-year in nominal pesos. In Europe, according to the European Commission, the average consumer confidence index for 2Q17 improved to negative 2.7, reaching a 10-year high. In the U.S., the index increased to in 2Q17 as reported by The Conference Board, the highest since Food retail sales reported by the U.S. Census Bureau increased 2% year-on-year, below the 3% year-onyear growth in 1Q17. Key raw material prices were mixed during the quarter and varied by region. In the Americas, the price of Sigma s raw materials increased when compared to 2Q16 levels. Turkey thigh and milk prices were up 14% and 11%, respectively, although they were still below the record-high levels observed in 2013 and Conversely, turkey breast was 34% lower, while pork hams were slightly lower than last year. In Europe, pork prices have increased since the second half of 2016 which resulted in 2Q17 prices 26% above the same year-ago period. In Mexico, the recent appreciation of the Peso vis-a-vis the U.S. Dollar has eased the pressure in the cost of raw materials, as the industry participants import most of its meats from the U.S. OPERATIONS During 2Q17, Sigma sold approximately 436 thousand tons of food products, up 2% from 2Q16, supported by growth in Mexico and USA. In dollar terms, average prices increased 2% year-on-year mainly due to higher prices in Mexico and Europe. FINANCIAL RESULTS 2Q17 Revenues totaled U.S. $1,503 million, 4% higher than 2Q16, driven by higher sales volume and prices. In Mexico, sales in pesos were 10% higher year-on-year, reflecting higher sales volumes and price adjustments to absorb higher raw material costs. In Europe, sales in euros were 3% above 2Q16 driven by higher prices. In the U.S., sales increased 3% yearon-year. Sales in Mexico accounted for 42% of the quarter s total, while Europe represented 34%, the U.S. 17%, and Latin America 7%. During the first half of 2017, revenues were U.S. $2,853 million, up 2% when compared to the same period of In line with full year guidance, Operating Income and EBITDA were U.S. $116 million and U.S. $167 million in 2Q17, down 3% and 1% year-on-year, respectively. This was primarily due to a strong performance from Mexican operations which benefitted from a more favorable currency environment, and positive results in Europe, which partially offset the start-up
11 ALFA S SECOND QUARTER costs of the new Burgos plant in Spain. In the U.S., results were affected by a lag between price adjustments and the recent cost increases on raw materials. CAPITAL EXPENDITURES AND ACQUISITIONS; NET DEBT During 2Q17, capital expenditures totaled U.S. $50 million, funds were utilized for the new plant in Burgos, Spain, other fixed assets and minor projects across the company. On June 28, 2017 Sigma announced the acquisition of Sociedad Suizo Peruana de Embutidos, S.A. (SUPEMSA), a Peruvian company engaged in the production and sale of packaged meats and dairy products. With 2016 revenue of U.S. $54 million, SUPEMSA is a leader in the production of premium packaged meats, with more than 25 years of successfully marketing its products under highly recognized local brands such as Otto Kunz and La Segoviana. The acquisition was effective July 1st, Sigma s consistent cash flow generation enables the company to finance capital expenditures and to maintain a solid financial position. At the end of 2Q17, Net Debt was U.S. $1,940 million, similar to 2Q16. Financial ratios at the end of 2Q17 were: Net Debt to EBITDA, 3.1 times; Interest Coverage, 4.4 times. These ratios compare with those reported in 2Q16, of 2.3 times and 7.8 times, respectively, which includes insurance income in EBITDA from the Bureba Fire.
12 ALFA S SECOND QUARTER SIGMA TABLE 1 VOLUME AND PRICE CHANGES (%) 2Q17 vs. YTD. 17 VS 1Q17 2Q16 YTD. 16 Total Volume Avg. Ps. Prices (3.3) Avg. U.S. $ Prices (0.6) TABLE 2 REVENUES (%) 2Q17 VS. 2Q17 1Q17 2Q16 1Q17 2Q16 YTD.17 YTD. 16 Ch.% TOTAL REVENUES Ps. Millions 27,940 27,462 26, ,402 50, U.S. $ Millions 1,503 1,350 1, ,853 2,799 2 DOMESTIC REVENUES Ps. Millions 11,766 11,370 10, ,135 20, U.S. $ Millions ,192 1,157 3 FOREIGN REVENUES Ps. Millions 16,175 16,092 15, ,267 29,621 9 U.S. $ Millions ,661 1,642 1 Foreign / Total (%) TABLE 3 OPERATING INCOME AND EBITDA (%) 2Q17 VS. 2Q17 1Q17 2Q16 1Q17 2Q16 YTD. 17 YTD. 16 Ch.% OPERATING INCOME Ps. Millions 2,159 1,709 2, ,867 4,286 (10) U.S. $ Millions (3) (15) EBITDA Ps. Millions 3,097 2,738 3, ,834 5,973 (2) U.S. $ Millions (1) (9) TABLE 4 SELECTED BALANCE SHEET INFORMATION & FINANCIAL RATIOS (U.S. $ MILLIONS) 2Q17 1Q17 2Q16 YTD. 17 YTD. 16 Assets 5,207 4,951 4,794 5,207 4,794 Liabilities 4,328 4,161 3,971 4,328 3,971 Stockholders Equity Majority Equity Net Debt 1,940 1,838 1,935 1,940 1,935 Net Debt/EBITDA* Interest Coverage* * Times: LTM = Last 12 months

13 Second Quarter 2017 (2Q17) Monterrey, Mexico. July 26, 2017 Alpek, S.A.B. de C.V. (BMV: ALPEK) Selected Financial Information (U.S. $ Millions) Alpek reports 2Q17 EBITDA of U.S. $82 million (%) 2Q17 vs. 2Q17 1Q17 2Q16 1Q17 2Q16 YTD17 YTD16 Ch.% Total Volume (ktons) 1, ,024 1,970 3 Polyester ,566 1,497 5 Plastics & Chemicals (3) (3) Consolidated Revenues 1,306 1,293 1, ,598 2,419 7 Polyester ,846 1,708 8 Plastics & Chemicals Consolidated EBITDA (48) (61) (37) Polyester (62) (70) (35) Plastics & Chemicals (30) (50) (39) Profit Attributable to Controlling Interest (72) (49) (7) CAPEX and Acquisitions (14) (40) Net Debt 1,058 1, (10) 16 Net Debt/LTM EBITDA (1) Interest Coverage (1) (1) Times: Last 12 months Operating & Financial Highlights (2Q17) Alpek Polyester 2Q17 Consolidated EBITDA of U.S. $82 million, including a U.S. $29 million non-cash inventory loss and a U.S. $12 million one-time gain from the Selenis Canada acquisition (2016) The decline in oil and feedstock prices also had an estimated impact of U.S. $10 million on 2Q17 Comparable Consolidated EBITDA Net Debt down U.S. $118 million versus 1Q17 driven by positive Net Working Capital cash flow 2Q17 Polyester EBITDA of U.S. $33 million, including a U.S. $25 million non-cash inventory loss and a U.S. $12 million one-time gain from the Selenis Canada acquisition (2016) Resilient demand; 2Q17 Polyester volume up 9% and 6% versus 2Q16 and 1Q17 respectively Initial deposit of U.S. $39 million in escrow to acquire PetroquimicaSuape and Citepe; Brazilian authority (CADE) started transaction evaluation process Plastics & Chemicals (P&C) 2Q17 P&C EBITDA of U.S. $49 million, including an U.S. $5 million non-cash inventory loss Better-than-expected polypropylene volume and margins despite high feedstock price volatility 2Q17 caprolactam reference margins decreased to expected level after 1Q17 spike This release contains forward looking information based on numerous variables and assumptions that are inherently uncertain. They involve judgments with respect to, among other things, future economic, competitive and financial market conditions and future business decisions, all of which are difficult or impossible to predict accurately. Accordingly, results could vary from those set forth in this release. The report presents unaudited financial information based on International Financial Reporting Standards (IFRS). Figures are stated in nominal Mexican pesos ($) and in current U.S. Dollars (U.S. $), as indicated. Where applicable, peso amounts were translated into U.S. Dollars using the average exchange rate of the months during which operations were recorded. Financial ratios are calculated in U.S. Dollars. Due to the rounding up of figures, small differences may occur when calculating percent changes from one period to the other.
14 Second Quarter 2017 (2Q17) Message from the CEO Alpek s second quarter 2017 EBITDA reflects lower than expected Polyester segment EBITDA amid a weak oil and feedstock price environment. In contrast with the favorable trends observed in 2Q16 and 1Q17, the average price per barrel of Brent crude posted its lowest level year-to-date at the end of 2Q17. Reference U.S. contract prices for paraxylene (Px) and propylene dropped 10% and 26% respectively, from March to June, driven by lower oil prices as well as normalized propylene supply. This quarter s abrupt feedstock price movements had a U.S. $39 million impact on Alpek s 2Q17 consolidated EBITDA, comprised of a U.S. $29 million non-cash inventory loss and an estimated U.S. $10 million from feedstock cost carryover in both business segments. The oil-related impact on Alpek s 2Q17 consolidated EBITDA was partially offset by a U.S. $12 million onetime gain associated to the acquisition of a controlling interest in Selenis Canada Inc., in Adjusting for the U.S. $29 million non-cash inventory loss and the U.S. $12 million one-time gain from the Canadian acquisition, Alpek s 2Q17 Comparable EBITDA was U.S. $99 million; below guidance as a result of subpar Polyester segment performance. Polyester segment EBITDA was U.S. $33 million in 2Q17. Adjusting for its U.S. $25 million non-cash inventory loss and the U.S. $12 million one-time gain, Comparable 2Q17 Polyester EBITDA was U.S. $45 million. This quarter s higher costs associated to planned and unplanned outages, feedstock cost carryover and tight supply of secondary feedstocks (IPA and CHDM) had an estimated impact of U.S. $21 million in Comparable Polyester EBITDA. 2Q17 Plastics & Chemicals (P&C) EBITDA was U.S. $49 million and Comparable segment EBITDA was U.S. $54 million; above Alpek s 2017 guidance driven by our polypropylene (PP) business. Year-to-date, PP margins have been better than expected despite high propylene price volatility. Capex totaled U.S. $65 million in 2Q17 as progress is ongoing in the development of strategic projects. An important milestone this quarter was the on-schedule startup of our propylene storage spheres in Altamira, Mexico. We invested a total of U.S. $23 million in two storage spheres with an aggregate capacity of 5,000 tons that will enhance the efficiency of our domestic propylene logistics chain and provide greater import flexibility. The acquisition of PetroquimicaSuape and Citepe from Petrobras for U.S. $385 million is advancing as planned. Alpek made an initial deposit of U.S. $39 million in escrow, and the Administrative Council for Economic Defense (CADE) in Brazil started evaluating the transaction. Closing is subject to CADE s approval, among other conditions. The formal process to monetize our power cogeneration assets is also underway. Alpek concluded the first phase of the sale process in 2Q17, and is engaged in a detailed due diligence with selected investors to reach a potential agreement. Alpek s Net Debt totaled U.S. $1.058 billion at the close of 2Q17, down 10% quarter-on-quarter as low EBITDA was more than offset by positive Net Working Capital cash flow. We expect Alpek s Consolidated EBITDA to return to guidance levels in 2H17 as a result of stable Polyester plant operations, secondary feedstock price transfer initiatives, and a normalized oil price environment. Year-to-date Comparable Consolidated EBITDA plus the one-time gain from the Canadian acquisition was U.S. $243 million, which compares with U.S. $246 million EBITDA for 1H17, implicit in Alpek s U.S. $502 million guidance. ir@alpek.com 2
15 Second Quarter 2017 (2Q17) Results by Business Segment Polyester (Purified Terephthalic Acid (PTA), Polyethylene Terephthalate (PET), Polyester fibers 71% of Alpek s Net Sales) Second quarter 2017 Polyester revenue was up 7% year-on-year and 2% quarter-on-quarter as lower average prices were more than offset by volume growth. Average 2Q17 Polyester prices decreased 2% when compared with 2Q16 and 4% versus 1Q17, mainly due to lower feedstock prices. The U.S. contract Px price posted its lowest level year-to-date in June. 2Q17 Polyester volume was up 9% and 6% versus 2Q16 and 1Q17 respectively. Year-to-date, Polyester volume is 5% higher than 2016 as growth associated to the integration of Selenis Canada Inc. (PET) was partially offset by lower than expected PET volume in Mexico and Argentina. Second quarter 2017 segment EBITDA was U.S. $33 million, including a U.S. $25 million non-cash inventory loss and a U.S. $12 million one-time gain from the acquisition of a controlling interest in Selenis Canada Inc. (in 2016). Adjusting for the inventory loss and one-time gain, Comparable 2Q17 Polyester EBITDA was U.S. $45 million, down 53% and 34% versus 2Q16 and 1Q17 respectively. Certain events had a negative impact on Polyester profitability. Market events include this quarter s decline in Px and monoethylene glycol (MEG) prices which causes a temporary mismatch between end-product sale prices and feedstock costs. In addition, tight supply of secondary feedstocks used to produce PET (IPA and CHDM) resulted in incremental costs. This increase has not been completely transferred to PET prices. Moreover, planned and unplanned plant outages resulted in higher than expected 2Q17 conversion and logistics costs. On aggregate, these events had an estimated impact of U.S. $21 million in Comparable 2Q17 Polyester EBITDA. Plastics & Chemicals (P&C) (Polypropylene (PP), Expandable Polystyrene (EPS), Caprolactam (CPL), Other products 29% of Alpek s Net Sales) 2Q17 P&C revenue was up 2% year-on-year and flat quarter-on-quarter as a result of mixed price and volume movements. Average second quarter 2017 P&C prices increased 6% when compared with 2Q16 driven mainly by higher styrene prices. In contrast, the 2% average P&C price decrease versus 1Q17 reflects lower propylene and styrene prices. Second quarter 2017 P&C volume was down 3% versus 2Q16 and up 2% when compared to 1Q17. P&C volume posted its highest level year-to-date in June as feedstock prices appear to have normalized after an extended period of consecutive monthly declines. Segment EBITDA was U.S. $49 million, including a U.S. $5 million non-cash inventory loss. Adjusting for the inventory loss, Comparable 2Q17 P&C EBITDA was U.S. $54 million, down 43% versus 2Q16 which benefited from higher PP margins. Yet, Comparable 2Q17 P&C EBITDA was above guidance, driven mainly by better than expected PP margins and volume amid a volatile feedstock price environment. ir@alpek.com 3
16 Second Quarter 2017 (2Q17) Consolidated Financial Results Net Sales: Net Sales for the second quarter totaled U.S. $1.3 billion, up 6% year-on-year and 1% quarter-onquarter, as lower average prices were more than offset by volume growth. 2Q17 consolidated volume was up 6% and 5% versus 2Q16 and 1Q17 respectively. Average 2Q17 consolidated prices were flat year-on-year and decreased 4% when compared with 1Q17, mainly due to lower feedstock prices. Accumulated net sales as of June 30, 2017 totaled U.S. $2.6 billion, 7% higher than the same period last year as a result of 5% and 3% increases in average prices and volume respectively. EBITDA: 2Q17 EBITDA was U.S. $82 million, down 61% and 48% when compared with 2Q16 and 1Q17 respectively. This quarter s Consolidated EBITDA includes a U.S. $29 million non-cash inventory loss and a U.S. $12 million onetime gain from the acquisition of a controlling interest in Selenis Canada Inc. (in 2016). Adjusting for the inventory loss and one-time gain, Comparable Consolidated EBITDA was U.S. $99 million, U.S. $131 million and U.S. $190 million in 2Q17, 1Q17 and 2Q16 respectively. Comparable 2Q17 Consolidated EBITDA was lower than expected as Polyester segment EBITDA was affected by a combination of internal and external events that had an estimated impact of U.S. $21 million. Accumulated EBITDA as of June 30, 2017 was U.S. $240 million and accumulated Comparable Consolidated EBITDA totaled U.S. $230 million. Year-to-date Comparable Consolidated EBITDA plus the one-time gain from the Canadian acquisition was U.S. $243 million, which compares with U.S. $246 million EBITDA for the first half of the year, implicit in Alpek s U.S. $502 million 2017 EBITDA guidance. Profit (Loss) Attributable to Controlling Interest: Profit Attributable to Controlling Interest for the second quarter of 2017 was U.S. $25 million, compared to U.S. $48 million and U.S. $87 million in 2Q16 and 1Q17 respectively. 2Q17 Profit Attributable to Controlling Interest decreased versus 2Q16 and 1Q17 as a result of a lower Operating Income. Accumulated Profit Attributable to Controlling Interest as of June 30, 2017 was U.S. $112 million, down 7% when compared to the same period in 2016 as this year s Fx gain and lower Income Tax were more than offset by the decrease in Operating Income. Capital Expenditures and Acquisitions (Capex): 2Q17 Capex was U.S. $65 million, compared to U.S. $110 million and U.S. $76 million in 2Q16 and 1Q17 respectively. Year-to-date, Capex of U.S. $142 million is flat vs the same period last year. The majority of these funds were invested in the 350 MW power cogeneration plant in Altamira, Mexico, which is advancing as planned together with other projects such as the EPS plant expansion. An important milestone this quarter was the on-schedule startup of our two propylene storage spheres in Altamira, Mexico. Net Debt: Consolidated Net Debt as of June 30, 2017 was U.S. $1.058 billion, up 16% year-on-year and down 10% quarter-on-quarter. On an absolute basis, Net Debt decreased U.S. $118 million during 2Q17 driven by positive Net Working Capital cash flow. Gross Debt as of June 30, 2017 was U.S. $1.246 billion, up 12% vs 2Q16 and down 4% when compared to 1Q17. 2Q17 Cash and Cash equivalents balance was U.S. $188 million. Financial ratios as of June 30, 2017 were: Net Debt to LTM EBITDA of 2.0 times and Interest Coverage of 8.0 times. ir@alpek.com 4
17 Second Quarter 2017 (2Q17) Appendix A - Tables TABLE 1 VOLUME (KTONS) (%) 2Q17 vs. 2Q17 1Q17 2Q16 1Q17 2Q16 YTD17 YTD16 Ch.% Total Volume 1, ,024 1,970 3 Polyester ,566 1,497 5 Plastics and Chemicals (3) (3) TABLE 2 PRICE CHANGES (%) Polyester (%) 2Q17 vs. YTD17 vs. 1Q17 2Q16 YTD16 Avg. Ps. Prices (13) 1 12 Avg. U.S. $ Prices (4) (2) 3 Plastics and Chemicals Avg. Ps. Prices (11) 9 18 Avg. U.S. $ Prices (2) 6 9 Total Avg. Ps. Prices (12) 3 13 Avg. U.S. $ Prices (4) - 5 TABLE 3 INCOME STATEMENT (U.S. $ Millions) (%) 2Q17 vs. 2Q17 1Q17 2Q16 1Q17 2Q16 YTD17 YTD16 Ch.% Total Revenues 1,306 1,293 1, ,598 2,419 7 Gross Profit (50) (62) (37) Operating expenses and others (36) (48) (49) (84) (96) 12 Operating income (60) (72) (45) Financial cost, net (6) 17 (54) (137) (70) 115 Share of losses of associates (16) (243) Income Tax (5) (34) (50) (39) (68) 43 Consolidated net income (64) (46) (18) Controlling Interest (72) (49) (7) ir@alpek.com 5
18 Second Quarter 2017 (2Q17) TABLE 4 REVENUES (%) 2Q17 vs. 2Q17 1Q17 2Q16 1Q17 2Q16 YTD17 YTD16 Ch.% Total Revenues Ps. Millions 24,275 26,339 22,341 (8) 9 50,614 43, U.S. $ Millions 1,306 1,293 1, ,598 2,419 7 Domestic Revenues Ps. Millions 9,098 9,632 8,484 (6) 7 18,730 16, U.S. $ Millions Foreign Revenues Ps. Millions 15,176 16,707 13,856 (9) 10 31,884 26, U.S. $ Millions ,636 1, Foreign / Total (%) TABLE 5 OPERATING INCOME AND EBITDA (%) 2Q17 vs. 2Q17 1Q17 2Q16 1Q17 2Q16 YTD17 YTD16 Ch.% Operating Income Ps. Millions 904 2,535 3,144 (64) (71) 3,439 5,628 (39) U.S. $ Millions (60) (72) (45) EBITDA Ps. Millions 1,524 3,241 3,751 (53) (59) 4,765 6,840 (30) U.S. $ Millions (48) (61) (37) TABLE 6 COMPARABLE EBITDA 2Q17 1Q17 2Q16 (%) 2Q17 vs. 1Q17 2Q16 YTD17 YTD16 Ch.% EBITDA Ps. Millions 1,524 3,241 3,751 (53) (59) 4,765 6,840 (30) U.S. $ Millions (48) (61) (37) Adjustments* Ps. Millions 318 (550) (338) (232) (207) (12) U.S. $ Millions 17 (26) (19) (10) (11) 16 Comparable EBITDA Ps. Millions 1,841 2,691 3,413 (32) (46) 4,532 6,633 (32) U.S. $ Millions (25) (48) (37) *Adjustments: Inventory and non-operating, one-time (gains) losses ir@alpek.com 6
19 Second Quarter 2017 (2Q17) TABLE 7 FINANCIAL COST, NET (U.S. $ Millions) (%) 2Q17 vs. 2Q17 1Q17 2Q16 1Q17 2Q16 YTD17 YTD16 Ch.% Financial Expenses (19) (18) (21) (5) 12 (36) (40) 9 Financial Income (18) (10) 7 8 (17) Net Financial Expenses (15) (14) (18) (10) 12 (29) (32) 7 Fx Gains (Losses) 9 31 (36) (70) (38) 206 Financial Cost, Net (6) 17 (54) (137) (70) 115 TABLE 8 NET INCOME (U.S. $ Millions) 2Q17 1Q17 2Q16 (%) 2Q17 vs. 1Q17 2Q16 YTD17 YTD16 Ch.% Consolidated Net Income (64) (46) (18) Non-Controlling Interest (31) (41) (41) Controlling Interest (72) (49) (7) Earnings per Share (U.S. Dollars) (72) (49) (7) Avg. Outstanding Shares (Millions)* 2,117 2,117 2,117 2,117 2,117 * The same number of equivalent shares are considered in the periods presented TABLE 9 CASH FLOW (U.S. $ Millions) (%) 2Q17 vs. 2Q17 1Q17 2Q16 1Q17 2Q16 YTD17 YTD16 Ch.% EBITDA (48) (61) (37) Net Working Capital & Others 156 (64) (22) (136) 167 Capital Expenditures & Acq. (65) (76) (110) (142) (142) - Financial Expenses (17) (16) (18) (4) 8 (33) (23) (42) Income tax (33) (27) (45) (23) 26 (60) (119) 50 Dividends (9) (88) (69) (97) (205) 53 Payment affiliated companies (99) 1 64 (99) Other Sources / Uses 3 (20) (3) (17) (7) (133) Decrease (Increase) in Net Debt 118 (134) (7) 188 1,836 (16) (189) 92 ir@alpek.com 7
20 Second Quarter 2017 (2Q17) TABLE 10 STATEMENT OF FINANCIAL POSITION & FINANCIAL RATIOS (U.S. $ Millions) (%) 2Q17 vs. 2Q17 1Q17 2Q16 1Q17 2Q16 Assets Cash and cash equivalents (8) Trade accounts receivable (1) 11 Inventories (9) 6 Other current assets Total current assets 1,773 1,786 1,674 (1) 6 Investment in associates and others Property, plant and equipment, net 2,088 2,028 1, Goodwill and intangible assets, net Other non-current assets Total assets 4,698 4,640 4, Liabilities & stockholders' equity Debt (15) 171 Suppliers Other current liabilities (4) Total current liabilities 1,184 1, Debt 1,004 1,017 1,021 (1) (2) Employees benefits (7) Other long term liabilities Total liabilities 2,620 2,590 2, Total stockholders' equity 2,079 2,050 1, Total liabilities & stockholders' equity 4,698 4,640 4, Net Debt 1,058 1, (10) 16 Net Debt/EBITDA* Interest Coverage* * Times: last 12 months ir@alpek.com 8
21 Second Quarter 2017 (2Q17) Polyester TABLE 11 REVENUES (%) 2Q17 vs. 2Q17 1Q17 2Q16 1Q17 2Q16 YTD17 YTD16 Ch.% Total Revenues Ps. Millions 17,303 18,670 15,733 (7) 10 35,972 30, U.S. $ Millions ,846 1,708 8 Domestic Revenues Ps. Millions 4,652 5,006 4,260 (7) 9 9,658 8, U.S. $ Millions Foreign Revenues Ps. Millions 12,651 13,663 11,472 (7) 10 26,315 22, U.S. $ Millions ,351 1,253 8 Foreign / Total (%) TABLE 12 OPERATING INCOME AND EBITDA (%) 2Q17 vs. 2Q17 1Q17 2Q16 1Q17 2Q16 YTD17 YTD16 Ch.% Operating Income Ps. Millions 118 1,253 1,510 (91) (92) 1,371 2,358 (42) U.S. $ Millions (89) (92) (48) EBITDA Ps. Millions 607 1,794 1,990 (66) (69) 2,402 3,312 (27) U.S. $ Millions (62) (70) (35) TABLE 13 COMPARABLE EBITDA EBITDA 2Q17 1Q17 2Q16 (%) 2Q17 vs. 1Q17 2Q16 YTD17 YTD16 Ch.% Ps. Millions 607 1,794 1,990 (66) (69) 2,402 3,312 (27) U.S. $ Millions (62) (70) (35) Adjustments* Ps. Millions 234 (395) (267) (162) (68) 136 U.S. $ Millions 12 (19) (15) (7) (4) 75 Comparable EBITDA Ps. Millions 841 1,399 1,723 (40) (51) 2,240 3,243 (31) U.S. $ Millions (34) (53) (37) *Adjustments: Inventory and non-operating, one-time (gains) losses ir@alpek.com 9
22 Second Quarter 2017 (2Q17) Plastics & Chemicals TABLE 14 REVENUES (%) 2Q17 vs. 2Q17 1Q17 2Q16 1Q17 2Q16 YTD17 YTD16 Ch.% Total Revenues Ps. Millions 6,972 7,670 6,608 (9) 6 14,642 12, U.S. $ Millions Domestic Revenues Ps. Millions 4,447 4,626 4,224 (4) 5 9,073 8,526 6 U.S. $ Millions (1) Foreign Revenues Ps. Millions 2,525 3,044 2,384 (17) 6 5,569 4, U.S. $ Millions (9) Foreign / Total (%) TABLE 15 OPERATING INCOME AND EBITDA (%) 2Q17 vs. 2Q17 1Q17 2Q16 1Q17 2Q16 YTD17 YTD16 Ch.% Operating Income Ps. Millions 780 1,282 1,628 (39) (52) 2,062 3,281 (37) U.S. $ Millions (33) (54) (43) EBITDA Ps. Millions 910 1,447 1,756 (37) (48) 2,357 3,540 (33) U.S. $ Millions (30) (50) (39) TABLE 16 COMPARABLE EBITDA EBITDA 2Q17 1Q17 2Q16 (%)2Q17 vs. 1Q17 2Q16 YTD17 YTD16 Ch.% Ps. Millions 910 1,447 1,756 (37) (48) 2,357 3,540 (33) U.S. $ Millions (30) (50) (39) Adjustments* Ps. Millions 84 (154) (71) (71) (139) 49 U.S. $ Millions 5 (8) (4) (3) (8) 61 Comparable EBITDA Ps. Millions 994 1,293 1,684 (23) (41) 2,286 3,401 (33) U.S. $ Millions (15) (43) (38) *Adjustments: Inventory and non-operating, one-time (gains) losses ir@alpek.com 10
23 Second Quarter 2017 (2Q17) Appendix B Financial Statements ALPEK, S.A.B. DE C.V. and Subsidiaries STATEMENT OF FINANCIAL POSITION Information in Millions of Mexican Pesos (%) Jun 17 vs. Jun 17 Mar 17 Jun 16 Mar 17 Jun 16 ASSETS CURRENT ASSETS: Cash and cash equivalents 2,675 2,362 3, (31) Trade accounts receivable 10,325 10,939 9,850 (6) 5 Other accounts and notes receivable 3,703 3,503 2, Inventories 13,105 15,187 13,089 (14) 0 Other current assets 1,922 1,599 2, (7) Total current assets 31,730 33,590 31,656 (6) 0 Investment in associates and others (4) 5 Property, plant and equipment, net 37,375 38,136 34,418 (2) 9 Goodwill and intangible assets,net 10,276 10,738 10,833 (4) (5) Other non-current assets 4,181 4,269 2,334 (2) 79 Total assets 84,086 87,280 79,742 (4) 5 LIABILITIES AND STOCKHOLDER'S EQUITY CURRENT LIABILITIES: Debt 4,218 5,228 1,646 (19) 156 Suppliers 13,651 13,009 10, Other current liabilities 3,323 3,216 3,651 3 (9) Total current liabilities 21,192 21,453 15,388 (1) 38 NON-CURRENT LIABILITIES: Debt (include debt issuance cost) 17,973 19,134 19,309 (6) (7) Deferred income taxes 5,022 5,410 5,143 (7) (2) Other liabilities 1,609 1,592 1, Employees benefits 1,089 1,127 1,243 (3) (12) Total liabilities 46,885 48,716 42,421 (4) 11 STOCKHOLDERS EQUITY: Controlling interest: Capital stock 6,048 6,048 6,051 - (0) Share premium 9,071 9,071 9,071 - (0) Contributed capital 15,119 15,119 15,122 - (0) Earned surplus 17,916 19,155 17,980 (6) (0) Total controlling interest 33,035 34,274 33,102 (4) (0) Non-controlling interest 4,166 4,290 4,219 (3) (1) Total stockholders equity 37,201 38,564 37,321 (4) (0) Total liabilities and stockholders equity 84,086 87,280 79,742 (4) 5 ir@alpek.com 11
 2Q17 1Q17 2Q16 1Q17 2Q16 YTD17 YTD16 YTD16 Revenues 24,275 26,339 22,341 (8) 9 50,614 43,633 16 Domestic 9,098 9,632 8,484 (6) 7 18,730 16,726 12 Export 15,177 16,707 13,857 (9) 10 31,884 26,907")
24 Second Quarter 2017 (2Q17) ALPEK, S.A.B. DE C.V. and Subsidiaries STATEMENT OF INCOME Information in Millions of Mexican Pesos 2Q17 vs.(%) YTD17 vs. (%) 2Q17 1Q17 2Q16 1Q17 2Q16 YTD17 YTD16 YTD16 Revenues 24,275 26,339 22,341 (8) 9 50,614 43, Domestic 9,098 9,632 8,484 (6) 7 18,730 16, Export 15,177 16,707 13,857 (9) 10 31,884 26, Cost of sales (22,698) (22,826) (18,321) 1 (24) (45,524) (36,278) (25) Gross profit 1,577 3,513 4,020 (55) (61) 5,090 7,355 (31) Operating expenses and others (673) (978) (876) (1,651) (1,727) 4 Operating income 904 2,535 3,144 (64) (71) 3,439 5,628 (39) Financial cost, net (119) 317 (974) (137) (1,264) 116 Share of losses of associates (3) (2) - (5) (269) (5) (5) (4) Profit (loss) before income tax 782 2,850 2,170 (73) (64) 3,632 4,359 (17) Income tax (89) (693) (904) (782) (1,221) 36 Consolidated net income 693 2,157 1,266 (68) (45) 2,850 3,138 (9) Profit attributable to Controlling interest 452 1, (75) (48) 2,221 2,149 3 Profit attributable to Non-controlling interest (38) (40) (36) ir@alpek.com 12
 (BMV: NEMAK), a leading provider of innovative lightweighting solutions for the global automotive industry, announced today its operational and financial results for the second quarter of")
25 Nemak posts 2Q17 EBITDA 1 of US$206 million Monterrey, Mexico. July 26, Nemak, S.A.B. de C.V. ( Nemak ) (BMV: NEMAK), a leading provider of innovative lightweighting solutions for the global automotive industry, announced today its operational and financial results for the second quarter of 2017 ("2Q17"). What follows is an overview of the quarter s main highlights: Key Figures For 2Q17, volumes decreased 2.3% year-over-year ("y-o-y") as a decline in North America ("NA") more than offset higher volumes in the Rest of World ("RoW") region and stable volumes in Europe ("EU"). Meanwhile, revenues were up 3.8% y-o-y, as higher average aluminum prices passed on to customers more than compensated for lower volumes. For 1H17, volume increased slightly, while revenues were 4.1% higher y-o-y mainly due to increased aluminum prices. 2Q17 EBITDA was US$206 million, a 6.8% y-o-y decrease. In addition to a difficult comparison visà-vis the same period in 2016, when Nemak reported a positive effect related to the time it takes to fully pass through changes in aluminum prices to customers ("metal price lag"), Nemak saw three main negative effects this quarter: lower volumes in NA; negative metal price lag; and increased expenses associated with new programs. On the positive side, RoW reported a strong result, driven mainly by the Chinese operations. Furthermore, Nemak recognized a non-recurring gain in the amount of US$18 million for the reversal of a provision related to a disputed tax on revenues. On a cumulative basis, 1H17 EBITDA was US$396 million, 7.9% lower than 1H16 primarily due to the same reasons already explained. 2Q17 capex was US$88 million as the company continued with investments to increase and adapt production capacity to meet new demand coming from recently won contracts. Likewise, resources were dedicated to the plant under construction in Slovakia, which will produce structural and electric vehicles ( EV ) components starting in 2H17. For 1H17, capex amounted to US$231 million. Message from the CEO This quarter, we continued to make progress in our growth strategy while at the same time weathering external headwinds including lower demand from FCA and Ford in North America and 1 EBITDA = Operating Income + Depreciation, Amortization & other Non-Cash Charges April 24,

26 negative metal price lag due to rising aluminum prices that weighed on our results. Higher expenses related to new program launches also hindered our financial performance, particularly in Europe. Meanwhile, our China operation remained on an upward trend, driving our RoW results higher in the quarter. I want to emphasize our positive outlook on our business in China, where our results have gotten progressively better in recent years on the back of improved scale, product mix, and performance. Moreover, given our backlog of new programs and open bids, we expect RoW to remain our fastestgrowing region through Turning to strategic projects, I am pleased to share that we continued the scale-up of our structural and electric vehicle components businesses. This included successfully launching a new program for Alfa Romeo out of our plant in Poland and transferring production of a program for Audi s new Q5 SUV from Poland to Mexico. Additionally, we announced the creation of a global organization dedicated to structural and electric vehicle components, whose leader reports directly to me. We expect that this organization will help us drive growth in these promising new business lines across our regions. Automotive Industry In the quarter, SAAR for U.S. vehicle sales was down 3% compared to 2Q16, as a stable retail market was not enough to offset lower fleet sales. Meanwhile, North America vehicle production and Nemak customers vehicle production decreased 2.7% and 2.0%, respectively, mainly due to lower production of passenger cars as their demand softened. In Europe, vehicle sales SAAR in 2Q17 remained flat y-o-y, as a slight increase in sales in Eastern Europe offset lower sales in Western Europe. However, vehicle production and Nemak customers production decreased 3.0% and 4.1%, respectively, as some OEMs adjusted their production schedules for inventory management reasons. Recent Developments Nemak successfully transferred a new program to produce structural components for the Audi Q5 from Poland to Mexico. This is Nemak s first program in NA in this business line. Nemak started development of E-drive housings in Europe and North America using proprietary casting processes. July 26,

27 Nemak began working with an Asian customer on the development of battery tray prototypes for a new electric vehicle model slated for the North American market. Financial Results What follows is an explanation of the results shown in the table above: 2Q17 total volume decreased by 2.3% y-o-y to 12.8 million equivalent units, with FCA s 2016 discontinuation of its small- and- medium-size sedan lines in NA explaining the majority of the decrease and creating a difficult y-o-y comparison. Other Nemak customers, Ford in particular, also reduced demand due to lower sales of passenger cars. Regarding Europe, 2Q17 volume was flat y-o-y. Meanwhile, in RoW, volumes reported a strong y-o-y increase mainly due to the continued ramp-up of new programs in China. Despite the decrease in NA, 1H17 volume was slightly higher than 1H16 thanks to growth in Europe and RoW. Turning to revenues, the effect of higher aluminum prices more than compensated for declining volumes, causing Nemak s 2Q17 consolidated revenues to increase 3.8% y-o-y. Similarly, rising aluminum prices brought revenues 4.1% higher during 1H17. 2Q17 operating income decreased 12.7% y-o-y, mainly as a result of lower sales volumes, negative metal price lag, and increased expenses related to new programs. These factors were partially offset by the non-recurring gain already mentioned. The comparison vis-a-vis 2Q16 was even more difficult taking into account that the metal price lag effect had been positive that quarter. Lower operating income translated into an operating margin of 10.6%, 210 basis points below 2Q16. On a cumulative basis, 1H17 operating income was 14.1% lower than 1H16, for the reasons already explained. The above-mentioned decrease in operating income resulted in a 6.8% y-o-y reduction in EBITDA. 2Q17 EBITDA margin was 17.7%, down from the 19.7% reported in 2Q16. 2Q17 EBITDA per equivalent unit was US$16.10, down from US$16.90 in 2Q16. On a cumulative basis, the lower 1H17 operating income affected 1H17 EBITDA, which was 7.9% lower than 1H16 for the reason already mentioned. 1H17 EBITDA margin and EBITDA per equivalent unit were 17.3% and US$15.20, respectively, which compared to 19.6% and US$16.60 in 1H16. July 26,
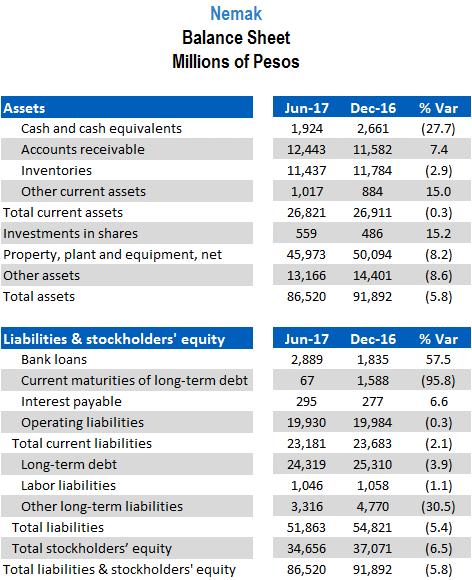
28 2Q17 net income increased 1.3% compared to 2Q16 as foreign exchange effects reduced deferred tax provisions. 1H17 net income was 16.7% lower than 1H16, mainly due to lower operating results. Capital expenditures totaled US$88 million during 2Q17. As explained, investments were made to expand capacity in various regions, and to facilitate operational efficiency. For 1H17, capital expenditures amounted to US$231 million. As of June 30, 2017, Nemak reported Net Debt in the amount of US$1.4 billion, including Cash and Marketable Securities worth US$108 million. Financial ratios were: Debt, net of Cash, to EBITDA, 1.8 times; Interest Coverage, 11.1 times. These ratios are slightly above those reported at the end of 2Q16. Regional Results North America In 2Q17, revenues increased 0.8% y-o-y benefiting from higher aluminum prices, which more than compensated for the impact of lower volumes in the region. Turning to EBITDA, lower volumes and the adverse impact of metal price lag were the main causes of the 2.8% decrease y-o-y. This result includes the non-recurring revenue gain in the amount of US$18 million derived from the reversal of a provision related to a longstanding dispute on tax on revenues in Brazil. The gain was recorded at the holding company level, which for presentation purposes has been considered a part of North America. Europe In 2Q17, revenues in Europe increased 1.3% y-o-y mainly due to higher aluminum prices. Meanwhile, 2Q17 EBITDA decreased 21.1% y-o-y, mainly due to the effects of negative metal price lag and increased expenses related to new programs brought on stream in the quarter, and to a lesser extent, foreign exchange effects. Rest of the World (RoW) In 2Q17, revenues in RoW increased by 41.6% y-o-y reflecting a solid performance in China, with sales volumes growing 30.0%. 2Q17 EBITDA in RoW increased US$5 million in 2Q17 compared to 2Q16 due to higher profitability in Asia July 26,
29 Methodology for presentation of results The report presents unaudited financial information. Figures are in Mexican pesos or U.S. dollars, as indicated. For income statements, peso amounts were translated into dollars using the average exchange rate of the months during which the operations were recorded. For balance sheets, peso amounts were translated into dollars using the end-of-period exchange rate. Financial ratios were calculated in dollars. Due to rounding, small differences may occur when calculating percent changes from one period to another. Conference call information Nemak s Second Quarter 2017 Conference Call will be held on Thursday, July 27, 2017, 11:30 a.m. Eastern Time (10:30 a.m. Mexico City Time). To participate in the conference call, please dial: Domestic U.S.: (877) ; International: ; Mexico Toll Free: The conference call will be webcast live through streaming audio. If you are unable to connect, the conference call audio and script will be available on Nemak s website. For more information, please visit investors.nemak.com Forward-looking statements This report may contain certain forward-looking statements concerning Nemak s future performance that should be considered as good faith estimates made by the Company. These forward-looking statements reflect management s expectations and are based upon currently available data and analysis. Actual results are subject to future events and uncertainties, which could materially impact Nemak s actual performance and results. About Nemak Nemak is a leading provider of innovative lightweighting solutions for the global automotive industry, specializing in the development and manufacturing of aluminum components for powertrain and body structure applications. The company employs more than 23,000 people at 38 facilities worldwide, generating annual revenues of US$4.3 billion in For more information about Nemak, visit Three pages of tables to follow July 26,

30 July 26,

31 July 26,

32 July 26,
, a Mexican Information and Communications Technology company, announced today its unaudited second quarter results ended June 30, 2017 (1).")
 2Q17 vs.")
 (5) 1,507 1,177 1,139 28% 32% 2,684 2,002 34% In USD 81 58 63 40% 29% 139 111 26% Net (loss) Income (Ps.) 598 1,020-952 -41% n.a. 1,618-777 n.a. In USD 33 52-53 -36% n.a. 85-42 n.a. Capital Expenditures (Ps.")

33 2nd Quarter 2017 San Pedro Garza Garcia, Mexico, July 26, Axtel, S.A.B. de C.V. ( Axtel or the Company ), a Mexican Information and Communications Technology company, announced today its unaudited second quarter results ended June 30, 2017 (1). Results presented on this report reflect figures consolidated under Alfa S.A.B. de C.V. The complete unaudited second quarter results of Axtel have been filed with the Mexican Stock Exchange and are also available at the Company s website, axtelcorp.mx. (%) 2Q17 vs. YTD 2Q17 1Q17 2Q16 YTD'17 YTD'16 In millions 1Q17 2Q16 Δ% Revenues (Ps.) 3,780 3,683 3,478 3% 9% 7,463 6,124 22% In USD % 5% % EBITDA (Ps.) (5) 1,507 1,177 1,139 28% 32% 2,684 2,002 34% In USD % 29% % Net (loss) Income (Ps.) 598 1, % n.a. 1, n.a. In USD % n.a n.a. Capital Expenditures (Ps.) % -18% 1,499 2,088-28% In USD % -21% % Net Debt (In USD) 1,027 1,021 1,007 1% 2% Net Debt / EBITDA (6) 4.1x 4.4x 3.9x Note: Financial information presented throughout this report includes unaudited consolidated results for Alestra S. de R.L. de C.V. and its subsidiaries ( Alestra ) up to February 14th, 2016, and for Axtel and its subsidiaries, including Alestra, from February 15th, 2016, and thereafter. Highlights: v Performance during the quarter reflects Axtel s strategy to provide world-class IT and Telecom solutions to the enterprise and government segments. Revenues from these two segments increased 8% and 42%, respectively, driving the 9% growth in total revenues. v During the quarter, Axtel closed an agreement with American Tower Corporation to sell 142 towers for US$56 million. On June 30th, the Company executed the first tranche of the transaction generating a benefit net of costs and expenses of Ps. 313 million in the quarter. The closing of this non-strategic asset sale should contribute to improve the Company s capital structure. v To further strengthen the Company s IT capabilities, in April, Axtel inaugurated the first 600 m 2 hall of its second Data Center in Querétaro with a final capacity of 3,600 m 2. v On May 1st, legal entity Alestra merged into Axtel consolidating operating processes and bookkeeping, among others, to increase its efficiency for the benefit of customers and shareholders. Media Relations: Julio Salinas contacto@axtel.com.mx +52(81) Investor Relations: Adrian de los Santos IR@axtel.com.mx +52(81) Nancy Llovera IR@axtel.com.mx +52(81)
Second Quarter 2017 (2Q17)
") Monterrey, Mexico. July 26, 2017 Alpek, S.A.B. de C.V. (BMV: ALPEK) Selected Financial Information (U.S. $ Millions) Alpek reports 2Q17 EBITDA of U.S. $82 million Total Volume (ktons) 1,038 986 981 5 6
Monterrey, Mexico. July 26, 2017 Alpek, S.A.B. de C.V. (BMV: ALPEK) Selected Financial Information (U.S. $ Millions) Alpek reports 2Q17 EBITDA of U.S. $82 million Total Volume (ktons) 1,038 986 981 5 6
THIRD QUARTER 2017 FINANCIAL REPORT ALFA REPORTS 3Q17 EBITDA OF U.S. $400 MILLION
 ALFA, S.A.B. DE C.V. THIRD QUARTER 2017 FINANCIAL REPORT ALFA REPORTS 3Q17 EBITDA OF U.S. $400 MILLION Monterrey, N.L., Mexico, October 16, 2017.- ALFA, S.A.B. de C.V. (ALFA), a leading Mexican industrial
First Quarter 2017 (1Q17)
") Monterrey, Mexico. April 24, 2017 Alpek, S.A.B. de C.V. (BMV: ALPEK) Selected Financial Information (U.S. $ Millions) (1) Times: Last 12 months Alpek reports 1Q17 EBITDA of U.S. $158 million Operating
Monterrey, Mexico. April 24, 2017 Alpek, S.A.B. de C.V. (BMV: ALPEK) Selected Financial Information (U.S. $ Millions) (1) Times: Last 12 months Alpek reports 1Q17 EBITDA of U.S. $158 million Operating
FOURTH QUARTER 2017 FINANCIAL REPORT ALFA REPORTS 4Q17 EBITDA OF US $568 MILLION
 ALFA, S.A.B. DE C.V. FOURTH QUARTER 2017 FINANCIAL REPORT ALFA REPORTS 4Q17 EBITDA OF US $568 MILLION Monterrey, N.L., Mexico, February 12, 2018.- ALFA, S.A.B. de C.V. (ALFA), a leading Mexican industrial
ALFA, S.A.B. DE C.V. SECOND QUARTER 2018 FINANCIAL REPORT ALFA reports record EBITDA of US $676 million in 2Q18, up 30% year-over-year
 ALFA, S.A.B. DE C.V. SECOND QUARTER 2018 FINANCIAL REPORT ALFA reports record EBITDA of US $676 million in 2Q18, up 30% year-over-year Monterrey, N.L., Mexico, July 18, 2018.- ALFA, S.A.B. de C.V. (ALFA),
ALFA Reports 1Q18 EBITDA of US $629 million, a growth of 19% year-over-year
 ALFA, S.A.B. DE C.V. FIRST QUARTER 2018 FINANCIAL REPORT ALFA Reports 1Q18 EBITDA of US $629 million, a growth of 19% year-over-year Monterrey, N.L., Mexico, April 18, 2018.- ALFA, S.A.B. de C.V. (ALFA),
Third Quarter 2017 (3Q17)
") Monterrey, Mexico. October 16, 2017 Alpek, S.A.B. de C.V. (BMV: ALPEK) Alpek reports 3Q17 EBITDA of U.S. $3 million, including a U.S. -$113 million provision covering the full amount of M&G accounts receivable
Monterrey, Mexico. October 16, 2017 Alpek, S.A.B. de C.V. (BMV: ALPEK) Alpek reports 3Q17 EBITDA of U.S. $3 million, including a U.S. -$113 million provision covering the full amount of M&G accounts receivable
Third Quarter 2018 (3Q18)
") Monterrey, Mexico. October 15, 2018 Alpek, S.A.B. de C.V. (BMV: ALPEK) Selected Financial Information (U.S. $ Millions) Alpek reports 3Q18 EBITDA of U.S. $274 million Total Volume (ktons) 1,174 1,151 1,012
Monterrey, Mexico. October 15, 2018 Alpek, S.A.B. de C.V. (BMV: ALPEK) Selected Financial Information (U.S. $ Millions) Alpek reports 3Q18 EBITDA of U.S. $274 million Total Volume (ktons) 1,174 1,151 1,012
First Quarter 2015 (1Q15)
") Monterrey, Mexico. April 23, 2015 Alpek, S.A.B. de C.V. (BMV: ALPEK) Selected Financial Information (U.S. $ Millions) Total Volume (ktons) (1) Times: Last 12 months Alpek reports 1Q15 EBITDA of U.S. $137
Monterrey, Mexico. April 23, 2015 Alpek, S.A.B. de C.V. (BMV: ALPEK) Selected Financial Information (U.S. $ Millions) Total Volume (ktons) (1) Times: Last 12 months Alpek reports 1Q15 EBITDA of U.S. $137
FOURTH QUARTER 2017 REPORT
 FOURTH QUARTER 2017 REPORT Sigma is a leading global company in the refrigerated food industry, focused on the production, marketing and distribution of packaged meats, cheese, yogurt and other refrigerated
THIRD QUARTER 2017 REPORT
 THIRD QUARTER 2017 REPORT Sigma is a leading global company in the refrigerated food industry, focused on the production, marketing and distribution of packaged meats, cheese, yogurt and other refrigerated
REVENUES AND EBITDA INCREASED 5% AND 14% VIS- A- VIS 1Q14
 ALFA, S.A.B. de C.V. FIRST QUARTER 2015 FINANCIAL REPORT REVENUES AND EBITDA INCREASED 5% AND 14% VIS- A- VIS 1Q14 Monterrey, N.L., Mexico. April 23, 2015.- ALFA, S.A.B. de C.V. ( ALFA ) announced today
Key figures (US $ million)
") THIRD QUARTER 218 REPORT Sigma is a leading multinational food company that produces, markets and distributes quality branded foods, including packaged meats, cheese, yogurt and other refrigerated and
THIRD QUARTER 218 REPORT Sigma is a leading multinational food company that produces, markets and distributes quality branded foods, including packaged meats, cheese, yogurt and other refrigerated and
Fourth Quarter 2012 (4Q12)
") Monterrey, México. February 12, 2013 Alpek, S.A.B. de C.V. (BMV: ALPEK) Alpek reports 4% volume growth despite soft export markets Selected Financial Information (U.S. $ Millions) Contents Pg. Total Volume
Monterrey, México. February 12, 2013 Alpek, S.A.B. de C.V. (BMV: ALPEK) Alpek reports 4% volume growth despite soft export markets Selected Financial Information (U.S. $ Millions) Contents Pg. Total Volume
Selected financial information
 FIRST QUARTER 2018 REPORT Sigma is a leading multinational refrigerated food company that produces, markets and distributes quality branded foods, including packaged meats, cheese, yogurt and other refrigerated
Selected financial information
 SECOND QUARTER 2018 REPORT Sigma is a leading multinational refrigerated food company that produces, markets and distributes quality branded foods, including packaged meats, cheese, yogurt and other refrigerated
2Q12. ALFA reports a 10% EBITDA increase yearon year. ALFA, S.A.B. DE C.V.
 2Q12 ALFA, S.A.B. DE C.V. ALFA reports a 10% EBITDA increase yearon year. Monterrey, N.L., Mexico. July 16, 2012. ALFA, S.A.B. de C.V. (ALFA) one of Mexico s leading industrial companies, announced today
OUTLOOK 2018 May, 2018
 May, 2018 This presentation contains forward-looking information based on numerous variables and assumptions that are inherently uncertain. They involve judgments with respect to, among other things, future
Outlook 2016 June, 2016
 Outlook 2016 June, 2016 This presentation contains forward-looking information based on numerous variables and assumptions that are inherently uncertain. They involve judgments with respect to, among other
Note 2 - Acquisitions and other relevant events:
 Note 2 - Acquisitions and other relevant events: 2016 a) Acquisition Axtel On December 3, 2015, ALFA, Axtel, S. A. B. de C. V. ( Axtel ) and Onexa, S. A. de C. V. ( Onexa ) subsidiary of ALFA, and a group
Nemak reports 1Q18 results
 } Nemak reports 1Q18 results - Quarterly revenues and EBITDA of US$1.2 billion and US$197 million, respectively - New contracts awarded to Nemak for US$110 million in annual revenues Monterrey, Mexico.
Nemak reports 3Q17 results
 Nemak reports 3Q17 results - Quarterly revenues and EBITDA of US$1.1 billion and US$153 million - Won new contracts worth US$570 million in annual revenues Monterrey, Mexico. October 16, 2017. - Nemak,
Nemak posts 13% EBITDA 1 growth in 4Q16
 Nemak posts 13% EBITDA 1 growth in 4Q16 Monterrey, Mexico. February 14, 2017. - Nemak, S.A.B. de C.V. ( Nemak ) (BMV: NEMAK), a leading provider of innovative lightweighting solutions for the global automotive
Nemak posts 1Q17 EBITDA 1 of US$190 million
 Nemak posts 1Q17 EBITDA 1 of US$190 million Monterrey, Mexico. April 24, 2017. - Nemak, S.A.B. de C.V. ( Nemak ) (BMV: NEMAK), a leading provider of innovative lightweighting solutions for the global automotive
Alpek Polyester (PET). Pearl River, USA. Petrochemicals
. Pearl River, USA. Petrochemicals") Alpek Polyester (PET). Pearl River, USA Petrochemicals Contents Overview Recent Developments Strategy Outlook Overview Alpek Polyester (PTA, PET). Columbia, USA Alpek at a glance LTM 3Q18 US $6.6 Billion
Alpek Polyester (PET). Pearl River, USA Petrochemicals Contents Overview Recent Developments Strategy Outlook Overview Alpek Polyester (PTA, PET). Columbia, USA Alpek at a glance LTM 3Q18 US $6.6 Billion
Nemak posts 19% EBITDA 1 growth in 3Q15
 Nemak posts 19% EBITDA 1 growth in 3Q15 Monterrey, Mexico. October 20, 2015. - Nemak, S.A.B. de C.V. ( Nemak ) (BMV: NEMAK), a leading provider of innovative light-weighting solutions for the global automotive
Nemak reports 4Q17 results
 Nemak reports 4Q17 results - Quarterly revenues and EBITDA of US$1.1 billion and US$166 million, respectively - New contracts awarded to Nemak for US$130 million in annual revenues Monterrey, Mexico. February
ALFA, S.A.B. de C.V. THIRD QUARTER 2015 FINANCIAL REPORT
 ALFA, S.A.B. de C.V. THIRD QUARTER 2015 FINANCIAL REPORT ALFA REPORTS 3Q15 EBITDA UP 8 YEAR- ON- YEAR Monterrey, N.L., Mexico. October 20, 2015.- ALFA, S.A.B. de C.V. (ALFA) reported today 3Q15 unaudited
Vitro Reports 2Q17 YoY Increases of 146% and 95% in Sales and EBITDA respectively in US Dollars
 Vitro Reports 2Q17 YoY Increases of 146% and 95% in Sales and EBITDA respectively in US Dollars San Pedro Garza García, Nuevo León, Mexico, July 26, 2017 Vitro, S.A.B. de C.V. (BMV: VITROA), hereinafter
1Q05 Results Were Strong Overall and Better than Expected; Some Flags in Sigma
 Latin American Equity Research Mexico, April 21, 2005. Earnings Comment Mexico Conglomerates ALFA (US$4.71) (ALFAA) STRONG BUY TARGET PRICE: US$6.15 1Q05 Results Were Strong Overall and Better than Expected;
Vitro Reports Second Quarter 2018 Results
 Vitro Reports Second Quarter 2018 Results 1.1% Year over Year increase in Sales; EBITDA Impacted by Carlisle s Float temporary shutdown San Pedro Garza García, Nuevo León, Mexico, 27 of July -, 2018 Vitro,
SECOND QUARTER 2015 RESULTS
 B SECOND QUARTER 2015 RESULTS MEXICO CITY, JULY 21, 2015 Grupo Bimbo S.A.B. de C.V. ( Grupo Bimbo or the Company ) (BMV: BIMBO) today reported results for the three months ended June 30, 2015.* HIGHLIGHTS
Vitro Reports 87.1% and 60.3% YoY US dollars Increase in Sales and EBITDA respectively
 Vitro Reports 87.1% and 60.3% YoY US dollars Increase in Sales and EBITDA respectively San Pedro Garza García, Nuevo León, Mexico, April 25, 2017 Vitro, S.A.B. de C.V. (BMV: VITROA), hereinafter Vitro
SG&A % EBIT (2) % Total Net Debt (427) (507) -15.8% * Million US$ Nominal
 % Total Net Debt (427) (507) -15.8% * Million US$ Nominal") Vitro Reports 7.9% YoY Increase in Sales and 16.2% in EBITDA in Mexican Pesos San Pedro Garza García, Nuevo León, Mexico, October 27 th, 2016 Vitro, S.A.B. de C.V. (BMV: VITROA), hereinafter Vitro or the
Vitro Reports 7.9% YoY Increase in Sales and 16.2% in EBITDA in Mexican Pesos San Pedro Garza García, Nuevo León, Mexico, October 27 th, 2016 Vitro, S.A.B. de C.V. (BMV: VITROA), hereinafter Vitro or the
EARNINGS RELEASE 3Q17
 LOGISTICS INVESTMENT PLATFORM EARNINGS RELEASE 3Q17 1 Quarterly Results 3Q17 TRAXION S REVENUE AND EBITDA INCREASE 70% AND 56% DURING 3Q17 BOOSTED BY ACQUISITIONS CONSOLIDATION YTD 2017 REVENUE AND EBITDA
Vitro Reports 3Q 17 Results
 Vitro Reports 3Q 17 Results San Pedro Garza García, Nuevo León, Mexico, October 16, 2017 Vitro, S.A.B. de C.V. (BMV: VITROA), hereinafter Vitro or the Company, a leading glass producer in North America,
Earnings Release 4Q16
 Monterrey, Mexico, May 4th, 2017 Grupo Famsa, S.A.B. de C.V. (BMV: GFAMSA), a leading Mexican commercial conglomerate in the retail, consumer credit and savings sectors, announced today its earnings results
GISSA Reports 3Q17 Results Boosted by Acquisition Strategy
 Media Contact Tel: +52 (844) 411-1095 pr@gis.com.mx www.gis.com.mx Investor Relations Contact Tel: +52 (844) 411-1050 ir@gis.com.mx http://ri.gis.investorcloud.net/ GISSA Reports 3Q17 Results Boosted by
GRUMA REPORTS FOURTH QUARTER 2017 RESULTS
 Investor Relations ir@gruma.com Tel: 52 (81) 8399-3349 www.gruma.com San Pedro Garza García, N.L., Mexico; February 21, 2018 GRUMA REPORTS FOURTH QUARTER 2017 RESULTS HIGHLIGHTS GRUMA s performance in
INEOS STYROLUTION. Q1/ 2018 Investor Earnings Call
 INEOS STYROLUTION Q1/ 2018 Investor Earnings Call Disclaimer The following presentation includes forward-looking statements, within the meaning of the US securities laws, based on our current expectations
Financial liabilities (excluding accounts payable to suppliers) 71 Ps 1,280 Other current liabilities ,620. Euros Pesos
 71 Ps 1,280 Other current liabilities ,620. Euros Pesos") 2013 a) Nemak debt refinancing In December 2013, Nemak concluded the refinancing of its bank debt, which was authorized by the Board of Directors. This process included the bank debt of the main current
2013 a) Nemak debt refinancing In December 2013, Nemak concluded the refinancing of its bank debt, which was authorized by the Board of Directors. This process included the bank debt of the main current
3Q18 EARNINGS RELEASE. Earnings Release 3Q18 1 / 16
 EARNINGS RELEASE 3Q18 1 / 16 Monterrey, Mexico, October 25 th, 2018. Grupo Famsa, S.A.B. de C.V. (BMV: GFAMSA), a leading Mexican commercial conglomerate in the retail, consumer and savings sector, announced
Third Quarter 2017 Results MAXCOM TELECOMUNICACIONES, S.A.B. DE C.V.
 MAXCOM TELECOMUNICACIONES, S.A.B. DE C.V. 1 MAXCOM REPORTS RESULTS FOR THE THIRD QUARTER OF 2017 Mexico City, October 18, 2017. Maxcom Telecomunicaciones, S.A.B. de C.V. (OTCQX: MXMTY, BMV: MAXCOM A) (
1Q18 EARNINGS RELEASE. Earnings Release 1Q18 1 / 15
 EARNINGS RELEASE 1Q18 1 / 15 Monterrey, Mexico April 27 th, 2018. Grupo Famsa, S.A.B. de C.V. (BMV: GFAMSA), a leading Mexican commercial conglomerate in the retail, consumer and savings sector, announced
VERTICALLY INTEGRATED TEXTILE COMPANY EARNINGS RELEASE 3Q17 EARNINGS RELEASE 3Q17
 VERTICALLY INTEGRATED TEXTILE COMPANY EARNINGS RELEASE 3Q17 EARNINGS RELEASE 3Q17 0 MESSAGE FROM THE CEO Dear Investor, During the third quarter of 2017, revenues remained stable and costs had a small
GRUPO CEMENTOS DE CHIHUAHUA, S.A.B. DE C.V. (BMV: GCC *) Fourth quarter 2016 earnings results
 Fourth quarter 2016 earnings results") GRUPO CEMENTOS DE CHIHUAHUA, S.A.B. DE C.V. (BMV: GCC *) Fourth quarter 2016 earnings results GCC REPORTS FOURTH QUARTER 2016 RESULTS Chihuahua, Chihuahua, Mexico, April 27, 2017 Grupo Cementos de Chihuahua,
GRUPO CEMENTOS DE CHIHUAHUA, S.A.B. DE C.V. (BMV: GCC *) Fourth quarter 2016 earnings results GCC REPORTS FOURTH QUARTER 2016 RESULTS Chihuahua, Chihuahua, Mexico, April 27, 2017 Grupo Cementos de Chihuahua,
Stock Symbol: TSX CCL.A and CCL.B. CCL Industries Reports a 25% Increase in Third Quarter 2012 Net Earnings and Declares Dividend Results Summary
 CCL Industries Inc. 105 Gordon Baker Road, Suite 500, Toronto, Ontario M2H 3P8 Telephone: (416) 756-8500 Fax: (416) 756-8555 News Release Stock Symbol: TSX CCL.A and CCL.B For Immediate Release Tuesday,
FEMSA Announces Third Quarter 2018 Results
 FEMSA Announces Third Quarter 2018 Results Monterrey, Mexico, October 26, 2018 Fomento Económico Mexicano, S.A.B. de C.V. ( FEMSA ) (NYSE: FMX; BMV: FEMSAUBD) announced today its operational and financial
GRUPO SENDA AUTOTRANSPORTE, S.A. DE C.V. ANNOUNCES THIRD QUARTER AND NINE MONTH RESULTS AS OF SEPTEMBER 30, 2008
 GRUPO SENDA AUTOTRANSPORTE, S.A. DE C.V. ANNOUNCES THIRD QUARTER AND NINE MONTH RESULTS AS OF SEPTEMBER 30, 2008 Monterrey, Nuevo Leon, Mexico October 23, 2008 Grupo Senda Autotransporte, S.A. de C.V.
Nemak reports 3Q18 results
 } Nemak reports 3Q18 results - Quarterly revenues and EBITDA both grew 5% y-o-y to US$1.2 billion and US$160 million, respectively. Monterrey, Mexico. October 15, 2018. - Nemak, S.A.B. de C.V. ( Nemak
Vitro Reports 3Q 14 Sales up 1.3% YoY and 5.1% Decline in EBITDA
 Vitro Reports 3Q 14 Sales up 1.3% YoY and 5.1% Decline in EBITDA San Pedro Garza García, Nuevo León, Mexico, October 28, 2014 Vitro, S.A.B. de C.V. (BMV: VITROA), hereinafter Vitro or the Company, the
GRUPO BIMBO REPORTS FIRST HALF 2016 RESULTS
 GRUPO BIMBO REPORTS FIRST HALF 2016 RESULTS MEXICO CITY, JULY 26, 2016 Grupo Bimbo S.A.B. de C.V. ( Grupo Bimbo or the Company ) (BMV: BIMBO) today reported its results for the six months ended June 30,
Vitro Reports First Quarter 2018 Results 29.4% and 8.2% Year over Year increase in Sales and EBITDA respectively
 Vitro Reports First Quarter 2018 Results 29.4% and 8.2% Year over Year increase in Sales and EBITDA respectively San Pedro Garza García, Nuevo León, Mexico, April 27, 2018 Vitro, S.A.B. de C.V. (BMV: VITROA),
Nemak reports 4Q18 EBITDA of US$171 million
 } Nemak reports 4Q18 EBITDA of US$171 million - Full-year revenues and EBITDA grew 5.0% and 2.7% vs 2017 to US$4.7 billion and US$734 million, respectively. Monterrey, Mexico. February 13, 2019. - Nemak,
A N N U A L R E P O R T
 2017 ANNUAL REPORT ALFA is a holding company that manages a portfolio of diversified subsidiaries: Sigma, a leading multinational refrigerated food company, focused on the production, marketing and distribution
GRUMA REPORTS FIRST QUARTER 2017 RESULTS
 HIGHLIGHTS GRUMA REPORTS FIRST QUARTER 2017 RESULTS During the first quarter, GRUMA showed continued growth at its operations with volume increases at all its subsidiaries other than Gruma Centroamérica.
Monterrey, Mexico. October 25, 2012 Grupo Famsa, S.A.B. de C.V. (BMV: GFAMSA)
") Third Quarter 2012 BMV: GFAMSA Monterrey, Mexico. October 25, 2012 Grupo Famsa, S.A.B. de C.V. (BMV: GFAMSA) Report from the Chief Executive Officer on Grupo Famsa, S.A.B. de C.V. s third quarter 2012
Third Quarter 2012 BMV: GFAMSA Monterrey, Mexico. October 25, 2012 Grupo Famsa, S.A.B. de C.V. (BMV: GFAMSA) Report from the Chief Executive Officer on Grupo Famsa, S.A.B. de C.V. s third quarter 2012
Earnings Conference Call 1Q17
 Earnings Conference Call Investor Relations São Paulo, May 15th, 2017 DISCLAIMER ON FORWARD-LOOKING STATEMENTS This presentation includes forward-looking statements. These forward-looking statements are
Earnings Release 4Q15
 Monterrey, Mexico, May 27, 2016. Grupo Famsa, S.A.B. de C.V. (BMV: GFAMSA), a leading Mexican commercial conglomerate in the retail, consumer credit and savings sectors, announced today its earnings results
GRUPO BIMBO REPORTS FOURTH QUARTER AND FULL YEAR 2014 RESULTS
 Highlights from the quarter: Consolidated net sales rose 10.8%, mainly driven by the Canada Bread acquisition Profit before other income and expenses increased 34.1% reflecting a strong margin expansion
FEMSA Announces Third Quarter 2016 Results
 FEMSA Announces Third Quarter 2016 Results Monterrey, Mexico, October 28, 2016 Fomento Económico Mexicano, S.A.B. de C.V. ( FEMSA ) (NYSE: FMX; BMV: FEMSAUBD) announced today its operational and financial
THIRD-QUARTER 2007 RESULTS (Peso amounts are stated in millions in constant terms as of September 30, 2007)
") Rogelio Sánchez rsanchezm@gruma.com (52) 81 8399-3312 Lilia Gómez lgomez@gruma.com (52) 81 8399-3324 Monterrey, N.L. Mexico; October 24, 2007 www.gruma.com THIRD-QUARTER 2007 RESULTS (Peso amounts are
Rogelio Sánchez rsanchezm@gruma.com (52) 81 8399-3312 Lilia Gómez lgomez@gruma.com (52) 81 8399-3324 Monterrey, N.L. Mexico; October 24, 2007 www.gruma.com THIRD-QUARTER 2007 RESULTS (Peso amounts are
FEMSA Announces Fourth Quarter and Full Year 2016 Results
 FEMSA Announces Fourth Quarter and Full Year 2016 Results Monterrey, Mexico, February 27, 2017 Fomento Económico Mexicano, S.A.B. de C.V. ( FEMSA ) (NYSE: FMX; BMV: FEMSAUBD) announced today its operational
2018 THIRD QUARTER AND FIRST NINE MONTHS RESULTS
 2018 THIRD QUARTER AND FIRST NINE MONTHS RESULTS Mexico City,, Coca-Cola FEMSA, S.A.B. de C.V. (BMV: KOFL, NYSE: KOF) ( Coca-Cola FEMSA, KOF or the Company ), the largest Coca-Cola franchise bottler in
Let s give our soul, heart and being in everything we do. R.I.P. Don Lorenzo Servitje, founder of Grupo Bimbo
 GRUPO BIMBO REPORTS 2016 RESULTS MEXICO CITY, FEBRUARY 23, 2017 Grupo Bimbo, S.A.B. de C.V. ( Grupo Bimbo or the Company ) (BMV: BIMBO) today reported its results for the twelve months ended December 31,
GRUMA REPORTS FIRST QUARTER 2018 RESULTS
 Investor Relations ir@gruma.com Tel: 52 (81) 8399-3349 www.gruma.com San Pedro Garza García, N.L., Mexico; April 25, 2018 HIGHLIGHTS GRUMA REPORTS FIRST QUARTER 2018 RESULTS GRUMA s performance showed
GRUPO SENDA AUTOTRANSPORTE, S.A. DE C.V. ANNOUNCES FOURTH QUARTER AND TWELVE MONTH RESULTS AS OF DECEMBER 31, 2008
 GRUPO SENDA AUTOTRANSPORTE, S.A. DE C.V. ANNOUNCES FOURTH QUARTER AND TWELVE MONTH RESULTS AS OF DECEMBER 31, 2008 Monterrey, Nuevo Leon, Mexico February 26, 2009 Grupo Senda Autotransporte, S.A. de C.V.
GRUPO POCHTECA REPORTS ITS RESULTS FOR THE SECOND QUARTER OF Q17 Highlights
 GRUPO POCHTECA REPORTS ITS RESULTS FOR THE SECOND QUARTER OF 2017 Mexico City, July 25, 2017 Grupo Pochteca, S.A.B. de C.V. ( Pochteca or the Company ) (BMV: POCHTEC) announced today its unaudited results
GRUPO CEMENTOS DE CHIHUAHUA, S.A.B. DE C.V. (BMV: GCC *) Second quarter 2017 earnings report
 Second quarter 2017 earnings report") GRUPO CEMENTOS DE CHIHUAHUA, S.A.B. DE C.V. (BMV: GCC *) Second quarter 2017 earnings report GCC REPORTS SECOND QUARTER 2017 RESULTS Chihuahua, Chihuahua, Mexico, July 25, 2017 Grupo Cementos de Chihuahua,
GRUPO CEMENTOS DE CHIHUAHUA, S.A.B. DE C.V. (BMV: GCC *) Second quarter 2017 earnings report GCC REPORTS SECOND QUARTER 2017 RESULTS Chihuahua, Chihuahua, Mexico, July 25, 2017 Grupo Cementos de Chihuahua,
Vitro Achieves Fifth Consecutive Year of EBITDA Growth; Reports Sales increase of 0.8% and EBITDA up 42.7% in 4Q 14
 Vitro Achieves Fifth Consecutive Year of EBITDA Growth; Reports Sales increase of 0.8% and EBITDA up 42.7% in 4Q 14 San Pedro Garza García, Nuevo León, Mexico, February 27, 2015 Vitro, S.A.B. de C.V. (BMV:
Maxcom Telecomunicaciones, S.A.B de C.V.
 Maxcom Telecomunicaciones, S.A.B de C.V. Third Quarter Results 2018 Content Earnings Results Summary and Relevant Events Commercial Business Unit Wholesale Business Unit Residential Business Unit Consolidated
4Q17 EARNINGS RELEASE. Earnings Release 4Q17 1 / 19
 EARNINGS RELEASE 4Q17 1 / 19 Monterrey, Mexico May 4 th, 2018. Grupo Famsa, S.A.B. de C.V. (BMV: GFAMSA), a leading Mexican commercial conglomerate in the retail, consumer and savings sector, announced
GRUMA REPORTS SECOND QUARTER 2013 RESULTS
 IR Contact Information: ir@gruma.com (52) 81 8399-3311 and 24 Monterrey, N.L. Mexico; July 24, 2013 www.gruma.com GRUMA REPORTS SECOND QUARTER 2013 RESULTS HIGHLIGHTS The positive performance of GRUMA
GRUPO BIMBO REPORTS FIRST NINE MONTHS 2017 RESULTS
 GRUPO BIMBO REPORTS FIRST NINE MONTHS 2017 RESULTS MEXICO CITY, OCTOBER 26, 2017 Grupo Bimbo, S.A.B. de C.V. ( Grupo Bimbo or the Company ) (BMV: BIMBO) today reported its results for the nine months ended
Third Quarter 2011 BMV: GFAMSA
 Third Quarter 2011 BMV: GFAMSA Monterrey, Mexico. October 27, 2011 Grupo Famsa, S.A.B. de C.V. (BMV: GFAMSA) Report from the Chief Executive Officer on Grupo Famsa, S.A.B. de C.V. s third quarter 2011
GRUMA REPORTS FOURTH QUARTER 2016 RESULTS
 GRUMA REPORTS FOURTH QUARTER 2016 RESULTS HIGHLIGHTS During the fourth quarter of 2016 GRUMA s performance continued its double-digit upward growth trend across its financial results. Sales volume growth
FEMSA Releases Audited Financial Results for the Fourth Quarter and Twelve Months ended December 31, 1998
 FOR IMMEDIATE RELEASE FOR FURTHER INFORMATION: Laura E. Solano/María Elena Gutiérrez Investor Relations 011-528-328-6150/011-528-328-6245 e-mail: lsolmar@femsa.com.mx megutsan@femsa.com.mx Friday February
4Q17 EARNINGS RELEASE. Earnings Release 4Q17 1 / 16
 EARNINGS RELEASE 4Q17 1 / 16 Monterrey, Mexico February 26 th, 2018. Grupo Famsa, S.A.B. de C.V. (BMV: GFAMSA), a leading Mexican commercial conglomerate in the retail, consumer and savings sector, announced
CELULOSA ARAUCO Y CONSTITUCIÓN S.A. Second Quarter 2018 Results August 21, 2018
 CELULOSA ARAUCO Y CONSTITUCIÓN S.A. Second Quarter 2018 Results August 21, 2018 1 HIGHLIGHTS REVENUES U.S.$ 1,559.3 MILLION Arauco s revenues reached U.S.$ 1,559.3 million during the second quarter of
VOTORANTIM INDUSTRIAL 3Q15 EARNINGS RELEASE
 São Paulo, November 23 rd, 2015. Votorantim Industrial S.A. (VID, Company), a company engaged in the basic building materials (cement, readymix concrete, aggregates and mortar), metals (aluminum, zinc
Corporate Presentation 3Q16
 Corporate Presentation 3Q16 v 10.4 This presentation contains, or may be deemed to contain, forwardlooking statements. By their nature, forward looking statements involve risks and uncertainties because
3 rd Quarter 2018 Financial Results
 3 rd Quarter 2018 Financial Results Milestone Revenues and Earnings, Structural Improvements, Enhanced Portfolio and Geographic Reach November 8, 2018 Disclaimer This presentation contains forward-looking
Monterrey, Mexico. July 26, 2012 Grupo Famsa, S.A.B. de C.V. (BMV: GFAMSA)
") Second Quarter 2012 BMV: GFAMSA Monterrey, Mexico. July 26, 2012 Grupo Famsa, S.A.B. de C.V. (BMV: GFAMSA) Report from the Chief Executive Officer on Grupo Famsa, S.A.B. de C.V. s second quarter 2012 (2Q12)
Second Quarter 2012 BMV: GFAMSA Monterrey, Mexico. July 26, 2012 Grupo Famsa, S.A.B. de C.V. (BMV: GFAMSA) Report from the Chief Executive Officer on Grupo Famsa, S.A.B. de C.V. s second quarter 2012 (2Q12)
Financial Report for the Year 2004
 Financial Report for the Year 2004 CYDSA, S.A. de C.V. (BMV: CYDSASA) Ave. Ricardo Margain Zozaya # 565 Parque Corporativo Santa Engracia, Edificio B, 66267 Garza Garcia, Nuevo Leon Mexico Website: www.cydsa.com
State of the Chemical and Petrochemical Industry Is India the next driver?
 State of the Chemical and Petrochemical Industry Is India the next driver? Presentation to IOC Conclave 29 July 217 Dave Witte Senior Vice President, IHS Markit GM - Oil Markets, Midstream, Downstream
Genomma Lab FOURTH QUARTER AND FULL YEAR 2015 RESULTS
 Mexico City, Mexico, April 27, 2016 Genomma Lab Internacional, S.A.B. de C.V. (BMV: LAB.B) ( Genomma Lab or the Company ), today announced its results for the first quarter ended March 31, 2016. All figures
Report of action Bolsa Mexicana de Valores Ticker Symbol: MEXCHEM*
 Report of action Bolsa Mexicana de Valores Ticker Symbol: MEXCHEM* Contact in Investor Relations: Juan Francisco Sanchez Kramer www.mexichem.com jsanchezk@mexichem.com, phone: (52) 555279 8319 Mexichem
Fourth Quarter 2014 BMV: GFAMSA
 Monterrey, Mexico, April 27, 2015. Grupo Famsa, S.A.B. de C.V. (BMV: GFAMSA) Report of the Chief Executive Officer of Grupo Famsa, S.A.B. de C.V. on the results of the fourth quarter of 2014 (4Q14), with
Earnings Conference Call 4Q15
 Earnings Conference Call 4Q15 Investor Relations São Paulo, February 19, 2016 Disclaimer on forward-looking statements This presentation includes forward-looking statements. These forward-looking statements
EARNINGS RELEASE 3Q18 VERTICALLY INTEGRATED TEXTILE COMPANY EARNINGS RELEASE
 VERTICALLY INTEGRATED TEXTILE COMPANY EARNINGS RELEASE 3Q18 0 MESSAGE FROM THE CEO Dear Investor, The third quarter of 2018 posted an increase of 12.5% in sales, compared to the third quarter of 2017,
EBITDA GREW 16.8% WITH NET INCOME UP 11.3% IN 1Q13
 EBITDA GREW 16.8% WITH NET INCOME UP 11.3% IN 1Q13 Monterrey, Mexico, April 26, 2013 Arca Continental, S.A.B. de C.V. (BMV: AC*), the secondlargest Coca-Cola bottler in Latin America and third largest
9M 2018 Earnings Results. November 13,
 9M 2018 Earnings Results November 13, 2018 www.grupocodere.com 1 Table of Contents Financial and Operating Overview... 3 Consolidated Income Statement... 4 Revenue and Adjusted EBITDA... 6 Earnings per
the power to conduct and manage the relevant activities of all assets and liabilities of the business with the purpose of
 a. Basis for preparation International Financial Reporting Standards (IFRS) issued by the International Accounting Standards Board (IASB). IFRS include all International Accounting Standards ( IAS ) in
Currency Country (1) functional
 functional") The accompanying consolidated financial statements and notes were authorized for issuance on January 29, 2014, by officials with the legal power to sign the basic financial statements and accompanying
The accompanying consolidated financial statements and notes were authorized for issuance on January 29, 2014, by officials with the legal power to sign the basic financial statements and accompanying
GRUMA REPORTS SECOND QUARTER 2018 RESULTS
 Investor Relations ir@gruma.com Tel: 52 (81) 8399-3349 www.gruma.com San Pedro Garza García, N.L., Mexico; July 25, 2018 GRUMA REPORTS SECOND QUARTER 2018 RESULTS HIGHLIGHTS GRUMA s performance in the
ARCA CONTINENTAL REPORTS EBITDA GROWTH OF 5.3% WITH NET INCOME UP 23.3% OR 140 BPS IN 4Q14
 ARCA CONTINENTAL REPORTS EBITDA GROWTH OF 5.3% WITH NET INCOME UP 23.3% OR 140 BPS IN 4Q14 Monterrey, Mexico, February 18, 2015 Arca Continental, S.A.B. de C.V. (BMV: AC*) ( Arca Continental or AC ), the
TRINIDAD DRILLING 2011 SECOND QUARTER REPORT
 TRINIDAD DRILLING 2011 SECOND QUARTER REPORT FOR THE THREE AND SIX MONTHS ENDING JUNE 30, 2011 TRINIDAD SECOND QUARTER REPORT 2011 + 1 TRINIDAD DRILLING LTD. REPORTS SOLID SECOND QUARTER AND YEAR TO DATE
The Siam Cement Public Company Limited Management s Discussion and Analysis (MD&A) Consolidated Financial Results: Q2/10 and H1/10
 Consolidated Financial Results: Q2/10 and H1/10") The Siam Cement Public Company Limited Management s Discussion and Analysis (MD&A) Consolidated Financial Results: Q2/10 and H1/10 Q2/10 Net Profit of 7,295 MB, up 6% q-o-q and 7% y-o-y. H1/10 Net Profit
The Siam Cement Public Company Limited Management s Discussion and Analysis (MD&A) Consolidated Financial Results: Q2/10 and H1/10 Q2/10 Net Profit of 7,295 MB, up 6% q-o-q and 7% y-o-y. H1/10 Net Profit
GCC REPORTS THIRD QUARTER 2018 RESULTS
 GCC REPORTS THIRD QUARTER 2018 RESULTS Chihuahua, Chihuahua, Mexico, October 23, 2018 Grupo Cementos de Chihuahua, S.A.B. de C.V. (BMV: GCC *), a leading producer of cement and ready-mix concrete in the
SECOND QUARTER AND FIRST HALF 2018 CONSOLIDATED RESULTS
 SECOND QUARTER AND FIRST HALF 2018 CONSOLIDATED RESULTS Santiago, Chile, August 31, 2018 - Viña Concha y Toro S.A. ( The Company or Concha y Toro ) (NYSE: VCO, IPSA: Conchatoro), global leading winery