Our investment philosophy Buy Right: Sit Tight
|
|
|
- Amie Harris
- 5 years ago
- Views:
Transcription

1 1

2 Product Labeling 2
3 Our investment philosophy Buy Right: Sit Tight A philosophy distilled from over 25 years of wealth creation expertise of Motilal Oswal Securities Ltd ( Our Sponsors) Buy Right Stock Characteristics QGLP Q uality : Quality of business and management G rowth : Growth in earnings and sustained RoE L ongevity : Longevity of the competitive advantage /economic moat of the business P rice : Buying a good business for a fair price rather than buying a fair business for a good price. Sit Tight Approach Buy and Hold: We are strictly buy and hold investors and believe that picking the right business needs skill and holding onto these business to enable our investors to benefit from the entire growth cycle, needs even more skill. Focus: Our portfolios are high conviction portfolios with 20 to 25 stocks being our ideal number. We believe in adequate diversification but over-diversification results in diluting returns for our investors and adding market risk. 3
4
5 Jan-99 May-99 Oct-99 Mar-00 Aug-00 Jan-01 Jun-01 Nov-01 Apr-02 Sep-02 Feb-03 Jul-03 Dec-03 May-04 Oct-04 Feb-05 Jul-05 Dec-05 May-06 Oct-06 Mar-07 Aug-07 Jan-08 Jun-08 Nov-08 Apr-09 Sep-09 Feb-10 Jul-10 Nov-10 Apr-11 Sep-11 Feb-12 Jul-12 Dec-12 May-13 Oct-13 Mar-14 Aug-14 Jan-15 Jun-15 Nov-15 Apr-16 About Motilal Oswal Value Index in BUY Zone Sell Zone NIFTY MOVI Value (LHS) NIFTY MOVI 90DMA (LHS) Nifty 50 (RHS) Buy Zone 10,000 9,000 8,000 7,000 6,000 5,000 4,000 3,000 2,000 1, Source: India Index Services and Products Ltd (IISL), MOAMC Internal Analysis. Data as on 30 th April Inception date of MOVI is 1 st January, Allocation matrix is based on the 90 Day Moving Average of NIFTY MOVI. Past Performance may or may not be sustained in future. 5
6 Historical Returns (%) MOVI Return Matrix Historical analysis from 1st January, 1999 shows that if an investor invests in equities when NIFTY MOVI levels are low, his or her investments is most likely to post good returns. Please refer to the table below. Return/Time Period Matrix MOVI Value Range <70 70<80 80<90 90< < < < < 6M 45.0% 13.9% 9.2% 10.5% 3.0% 2.3% 8.4% -23.3% 12 M 56.3% 34.6% 18.6% 24.2% 11.1% 7.7% 1.7% -43.7% 24 M 39.3% 32.7% 25.4% 20.1% 12.6% 0.3% -5.0% -1.8% Let s consider two scenarios Scenario 1 Let s assume the MOVI value is at 75 which means it falls in the range of 70 < 80. This should have encouraged you to increase your equity allocation as it would have returned 13.9%, 34.6% and 32.7% over the following 6, 12 and 24 months. Scenario 2 - Let s suppose the MOVI value is at 140. This should have encouraged you to decrease your equity allocation as your investments would have posted negative returns over the following 6, 12 and 24 months. Source: IISL, MOAMC Internal Analysis. Data as on 30 th April Inception date of MOVI is 1st January, Please note that returns are gross of fees and expenses and are based on 90 Day Moving Average of NIFTY MOVI. The above illustration is meant to help the investors have an understanding of the NIFTY MOVI. The above illustration contained herein may include statement of future expectations and other forward looking statements that are based on certain calculations and assumptions and involve known and unknown risks and uncertainties that could cause actual results, performance or event to differ materially from those expressed or implied in such table. Past Performance may or may not be sustained in future. NIFTY MOVI is calculated and maintained by India Index Services and Products Ltd (IISL). 6
7 MOVI Return Matrix MOVI Levels Equity Debt % 0% % 10% % 20% % 30% % 45% % 60% % 75% % 100% Equity and Debt allocations based on 90 Day Moving Average of NIFTY MOVI to eliminate anomalies. Equity & Debt allocations arrived at by using historical data. Allocation matrix to be reviewed on a half-yearly basis. Source: MOAMC Internal Analysis. Data as on 30 th April 2016 Any change in methodology of MOVI would only be carried out by obtaining prior consent of the Board of Directors of Motilal Oswal Trustee Company Limited (MOTC), the Trustee to Motilal Oswal Mutual Fund (MOMF). 7
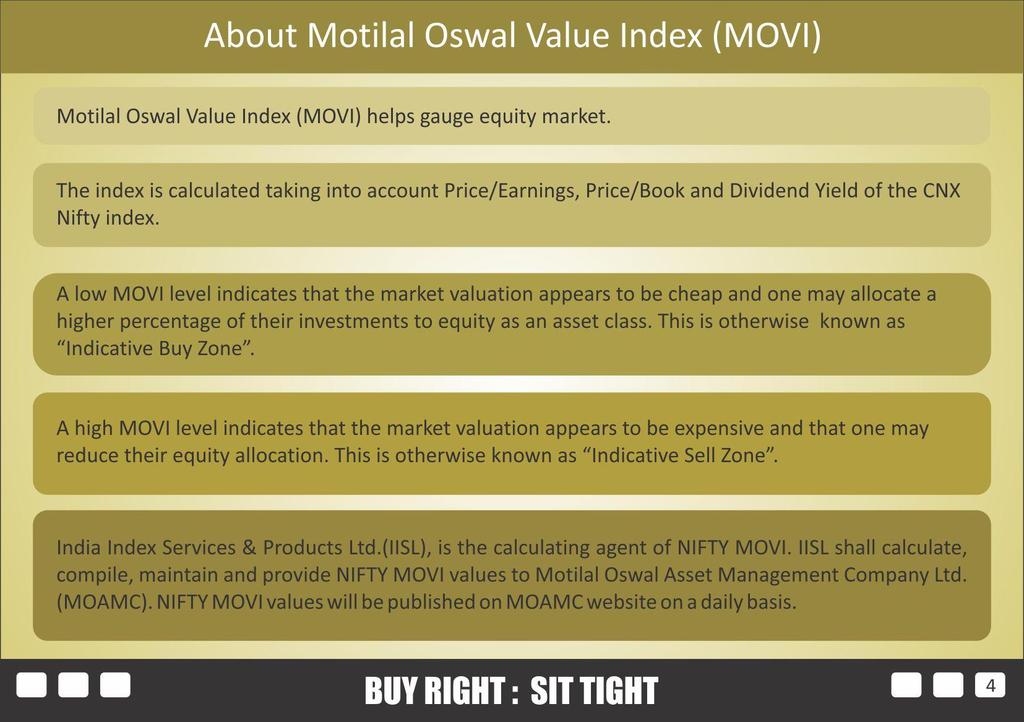
8 WHY MOVI? Most Market indices are price indices that provide market levels. As time elapses, fundamentals of the market change. Therefore, even when markets may be at a certain measured level, they may have become cheap or expensive. MOVI helps investors gauge the investment attractiveness of the markets. In essence, MOVI helps investors in understanding if the markets are cheap or expensive 8
9 Price-To-Book Ratio - P/B Ratio A ratio used to compare a stock's market value to its book value. It is calculated by dividing the current closing price of the stock by the latest quarter's book value per share. Why P/B ratio is not used as an indicator alone? P/B cannot be used as a indicator alone as the ratio is only useful when you are looking at capital - intensive businesses or financial businesses with plenty of assets on the books E.g. Banks are best valued by using P/B on the other hand service industry which has more intangible assets cannot be valued best by P/B ratio 9
10 Price-Earnings Ratio - P/E Ratio A valuation ratio of a company's current share price compared to its per-share earnings. Why P/E ratio is not used as an indicator alone? It is usually more useful to compare the P/E ratios of one company to other companies in the same industry, or to the market in general or against the company's own historical P/E. E.g. Two different sector growing at different growth rates cannot be compared alone by P/E, It would not be useful for investors using the P/E ratio as a basis for their investment to compare the P/E of a technology company (high P/E) to a utility company (low P/E) as each industry has much different growth prospects. 10
11 Dividend Yield A financial ratio that shows how much a company pays out in dividends each year relative to its share price. In the absence of any capital gains, the dividend yield is the return on investment for a stock. Why Dividend Yield is not used as an indicator alone? If you're an income investor, a stock's dividend yield might well be the only valuation measurement that matters to you. On the other hand, if you're in the growth stocks camp, dividend yield (or the lack of one) would be meaningless. E.g.Cyclical stocks may be valued fairly by dividend yields of steady, mature businesses, such as utilities and banks, are generally good dividend payers. 11
12 Scenario Analysis BUY In April 2003, When MOVI was around the 67 levels and Nifty 50 Index was at 984, if one had invested entirely in equity using MOVI as an indicator, the investment a year later would have returned approx 85% SELL In December 2007, when MOVI breached 130 and Nifty 50 Index was close to 5800 if one had reduced or exited their equity investment using MOVI again as an indicator, their investment a year later would have been insulated from a more than 50% fall Source: IISL, MOAMC Internal Analysis. Data as on 30 th April Inception date of MOVI is 1st January, Allocation matrix is based on the 90 Day Moving Average of MOVI. The above illustration is meant to help the investors have an understanding of MOVI. The above scenario contained herein that are based on certain calculations and assumptions and involve known and unknown risks and uncertainties that could cause actual results, performance or event to differ materially from those expressed or implied in such statement. Past Performance may or may not be sustained in future. MOVI is calculated and maintained by India Index Services and Products Ltd (IISL). 12

13

14
15 Dec-07 Mar-08 Jun-08 Aug-08 Nov-08 Feb-09 Apr-09 Jul-09 Oct-09 Dec-09 Mar-10 May-10 Aug-10 Nov-10 Jan-11 Apr-11 Jul-11 Sep-11 Dec-11 Feb-12 May-12 Aug-12 Oct-12 Jan-13 Apr-13 Jun-13 Sep-13 Nov-13 Feb-14 May-14 Jul-14 Oct-14 Jan-15 Mar-15 Jun-15 Aug-15 Nov-15 Feb-16 Apr-16 NIFTY MOVI Strategy in recent Crest and Trough NIFTY MOVI allocation remained 0 (zero ) in equity during this period Nifty 50 Nifty MOVI 0 Data as on 30 th April 2016 Data rebased to 100 on December 2007; Source: IISL, MOAMC Internal Analysis. Inception date of MOVI is 1 st January, Past Performance may or may not be sustained in future. 15
16 Dec-07 Jan-08 Feb-08 Mar-08 Apr-08 May-08 Jun-08 Jul-08 Aug-08 Sep-08 Oct-08 Nov-08 Dec-08 Jan-09 Feb-09 Mar-09 NIFTY MOVI v/s Nifty 50 from peak to bottom The Nifty MOVI 90 DMA level was above 130. As per Allocation Matrix we were 100% in cash with zero exposure in equity market Nifty 50 Nifty MOVI Data as on 31 st March 2015; Data rebased to 100 on December 2007; Source: IISL, MOAMC Internal Analysis. Inception date of MOVI is 1 st January, Past Performance may or may not be sustained in future. 16
17 Mar-09 Apr-09 Jun-09 Aug-09 Sep-09 Nov-09 Jan-10 Mar-10 Apr-10 Jun-10 Aug-10 Sep-10 Nov-10 Jan-11 Feb-11 Apr-11 Jun-11 Aug-11 Sep-11 Nov-11 Jan-12 Feb-12 Apr-12 Jun-12 Aug-12 Sep-12 Nov-12 Jan-13 Feb-13 Apr-13 Jun-13 Jul-13 Sep-13 Nov-13 Jan-14 Feb-14 Apr-14 Jun-14 Jul-14 Sep-14 Nov-14 Jan-15 Feb-15 Apr-15 Jun-15 Jul-15 Sep-15 Nov-15 Jan-16 Feb-16 Apr-16 NIFTY MOVI v/s Nifty 50 from March 2009 to April Nifty 50 Nifty MOVI 0 Data as on 30 th April Data rebased to 100 on December 2007; Source: IISL, MOAMC Internal Analysis. Inception date of MOVI is 1 st January, Past Performance may or may not be sustained in future. 17
18 NIFTY MOVI with Nifty 50 Returns Nifty MOVI Nifty 50 1 Month 1.11% 1.44% 3 Months 4.41% 3.78% 6 Months 1.34% -2.68% 1 Year 1.74% -4.05% 2 Years 9.44% 8.26% 3 Years 9.98% 9.79% 4 Years 10.42% 10.58% 5 Years 8.14% 6.42% Since Dec 31, % 2.99% Returns shown above one year are annualized; Data as on 30 th April 2016; Source: IISL, MOAMC Internal Analysis. Past Performance may or may not be sustained in future 18
19
20 DISCLAIMER This presentation has been prepared and issued on the basis of internal data, publicly available information and other sources believed to be reliable. The information contained in this document is for general purposes only and not a complete disclosure of every material fact and terms and conditions and features of Motilal Oswal MOSt Ultra Short Term Bond Fund, Motilal Oswal MOSt 10 Year Gilt Fund, Motilal Oswal MOSt Focused 25 Fund, Motilal Oswal MOSt Focused Midcap 30 Fund and Motilal Oswal MOSt Focused Multicap 35 Fund. The information / data herein alone is not sufficient and shouldn t be used for the development or implementation of an investment strategy. It should not be construed as investment advice to any party. All opinions, figures, charts/graphs, estimates and data included in this presentation are as on date and are subject to change without notice. While utmost care has been exercised while preparing this document, Motilal Oswal Asset Management Company Limited does not warrant the completeness or accuracy of the information and disclaims all liabilities, losses and damages arising out of the use of this information. The statements contained herein may include statements of future expectations and other forward-looking statements that are based on our current views and assumptions and involve known and unknown risks and uncertainties that could cause actual results, performance or events to differ materially from those expressed or implied in such statements. Readers shall be fully responsible/liable for any decision taken on the basis of this presentation. No part of this document may be duplicated in whole or in part in any form and/or redistributed without prior written consent of Motilal Oswal Mutual Fund/Motilal Oswal Asset Management Company Limited. Readers should before investing in the Scheme make their own investigation and seek appropriate professional advice. For details on taxation, please refer to the Section on 'Taxation on investing in Mutual Funds' in SAI. IISL Disclaimer: Motilal Oswal Value Index (MOVI) is not sponsored, endorsed, sold or promoted by India Index Services & Products Limited (IISL). MOVI has been developed by MOAMC and IISL has calculated and maintained as per the specifications and requirements of MOAMC. IISL does not make any representation or warranty, express or implied regarding the advisability of investing in the products linked to MOVI and availing the services generally or particularly or the ability of MOVI to track general stock market performance in India. Please read the full Disclaimers in relation to the MOVI in the Scheme Information Document. Statutory Details: Constitution: Motilal Oswal Mutual Fund has been set up as a trust under the Indian Trust Act, Trustee: Motilal Oswal Trustee Company Limited. Investment Manager: Motilal Oswal Asset Management Company Ltd. Sponsor: Motilal Oswal Securities Ltd. Past performance of the Sponsor/ AMC/ Mutual Fund and its affiliates does not indicate the future performance of the scheme and may not provide a basis of comparison with other investments. Mutual fund investments are subject to market risks, read all scheme related documents carefully. 20
Our investment philosophy Buy Right: Sit Tight
 1 Product Labeling 2 Our investment philosophy Buy Right: Sit Tight A philosophy distilled from over 25 years of wealth creation expertise of Motilal Oswal Securities Ltd ( Our Sponsors) Buy Right Stock
Power & Protection NFO. Motilal Oswal MOSt Focused Dynamic Equity Fund (An open ended equity scheme) NO LOAD FUND
 NO LOAD FUND") Power & Protection A fund that changes its action based on market conditions Motilal Oswal MOSt Focused Dynamic Equity Fund (An open ended equity scheme) NO LOAD FUND NFO th Opens: 6 Sep, 2016 th Closes:
Power & Protection A fund that changes its action based on market conditions Motilal Oswal MOSt Focused Dynamic Equity Fund (An open ended equity scheme) NO LOAD FUND NFO th Opens: 6 Sep, 2016 th Closes:
Motilal Oswal Dynamic Fund (An open ended dynamic asset allocation fund)
") Motilal Oswal Dynamic Fund (An open ended dynamic asset allocation fund) Product Labeling *Investors should consult their financial advisers if in doubt about whether the product is suitable for them Need
Motilal Oswal Dynamic Fund (An open ended dynamic asset allocation fund) Product Labeling *Investors should consult their financial advisers if in doubt about whether the product is suitable for them Need
Motilal Oswal Dynamic Fund (MOFDYNAMIC) (An open ended dynamic asset allocation fund)
 (An open ended dynamic asset allocation fund)") Motilal Oswal Dynamic Fund (MOFDYNAMIC) (An open ended dynamic asset allocation fund) Product Labeling *Investors should consult their financial advisers if in doubt about whether the product is suitable
Motilal Oswal Dynamic Fund (MOFDYNAMIC) (An open ended dynamic asset allocation fund) Product Labeling *Investors should consult their financial advisers if in doubt about whether the product is suitable
Long Term Equity Fund (MOFLTE) ( An open-ended equity linked saving scheme with a statutory lock in of 3 years and tax benefit)
 ( An open-ended equity linked saving scheme with a statutory lock in of 3 years and tax benefit)") Long Term Equity Fund (MOFLTE) ( An open-ended equity linked saving scheme with a statutory lock in of 3 years and tax benefit) Product Labeling 2 Investments for Tax Saving It's a well known fact that
Long Term Equity Fund (MOFLTE) ( An open-ended equity linked saving scheme with a statutory lock in of 3 years and tax benefit) Product Labeling 2 Investments for Tax Saving It's a well known fact that
Contents. Why India? Why Motilal Oswal PMS? Why Value?
 June 2016 Contents Why India? India s Next trillion Dollar Era New Cycle of earnings growth Current Valuations below decadal average Why Motilal Oswal PMS? Why Value? India s Next Trillion Dollar Era It
This product is suitable for investors who are seeking*
 Product Labeling Name of the Scheme This product is suitable for investors who are seeking* Motilal Oswal MOSt Focused 25 Fund (MOSt Focused 25) An Open Ended Equity Scheme Return by investing in upto
July March 2017
 July 2015 March 2017 January 2017 1 Contents India s Next Trillion Dollar Opportunity (NTDOP) Small and Mid Cap (SMID) Market Opportunity Why Motilal Oswal PMS? NTDOP Strategy details 2 FY51 FY60 FY70
Long Term Equity Fund ( An open-ended equity linked saving scheme with a statutory lock in of 3 years and tax benefit)
") Long Term Equity Fund ( An open-ended equity linked saving scheme with a statutory lock in of 3 years and tax benefit) Product Labeling 2 Investments for Tax Saving It's a well known fact that the Government
Long Term Equity Fund ( An open-ended equity linked saving scheme with a statutory lock in of 3 years and tax benefit) Product Labeling 2 Investments for Tax Saving It's a well known fact that the Government
Tax Saving and the essence of 'Buy Right : Sit Tight', now in one product
 Tax Saving and the essence of 'Buy Right : Sit Tight', now in one product Motilal Oswal MOSt Focused Long Term Fund (An open ended equity linked saving scheme with a 3 year lock-in) Product Labeling Name
Motilal Oswal Multicap 35 Fund (MOF35) (Multi Cap Fund An open ended equity scheme investing across large cap, mid cap, small cap stocks) Invests in
 (Multi Cap Fund An open ended equity scheme investing across large cap, mid cap, small cap stocks) Invests in") Motilal Oswal Multicap 35 Fund (MOF35) (Multi Cap Fund An open ended equity scheme investing across large cap, mid cap, small cap stocks) Invests in emerging and enduring wealth creators Product Labeling
Motilal Oswal Multicap 35 Fund (MOF35) (Multi Cap Fund An open ended equity scheme investing across large cap, mid cap, small cap stocks) Invests in emerging and enduring wealth creators Product Labeling
Contents. India s Next trillion Dollar Era New Cycle of Earnings Growth Current Valuations below Decadal Average. Why India? Why MOAMC- PMS?
 March 2015 Contents Why India? India s Next trillion Dollar Era New Cycle of Earnings Growth Current Valuations below Decadal Average Why MOAMC- PMS? Why Value? It took almost 60 years for the first US$
Motilal Oswal Multicap 35 Fund (MOF35) (Multi Cap Fund An open ended equity scheme investing across large cap, mid cap, small cap stocks) Invests in
 (Multi Cap Fund An open ended equity scheme investing across large cap, mid cap, small cap stocks) Invests in") Motilal Oswal Multicap 35 Fund (MOF35) (Multi Cap Fund An open ended equity scheme investing across large cap, mid cap, small cap stocks) Invests in emerging and enduring wealth creators Product Labeling
Motilal Oswal Multicap 35 Fund (MOF35) (Multi Cap Fund An open ended equity scheme investing across large cap, mid cap, small cap stocks) Invests in emerging and enduring wealth creators Product Labeling
MOTILAL OSWAL NASDAQ 100 FUND OF FUND
 MOTILAL OSWAL NASDAQ 100 FUND OF FUND NFO th Opens: 09 Nov, 2018 nd Closes: 22 Nov, 2018 Contact your financial advisor or 1800-200-6626 www.mo laloswalmf.com Motilal Oswal Nasdaq 100 Fund of Fund 2 Motilal
Motilal Oswal Multicap 35 Fund (MOF35) (Multi Cap Fund An open ended equity scheme investing across large cap, mid cap, small cap stocks) Invests in
 (Multi Cap Fund An open ended equity scheme investing across large cap, mid cap, small cap stocks) Invests in") Motilal Oswal Multicap 35 Fund (MOF35) (Multi Cap Fund An open ended equity scheme investing across large cap, mid cap, small cap stocks) Invests in emerging and enduring wealth creators Product Labeling
Motilal Oswal Multicap 35 Fund (MOF35) (Multi Cap Fund An open ended equity scheme investing across large cap, mid cap, small cap stocks) Invests in emerging and enduring wealth creators Product Labeling
Contents. India s Next Trillion Dollar Opportunity (NTDOP) Small and Mid Cap Market Opportunity. Why Motilal Oswal PMS? NTDOP Strategy details
 Small and Mid Cap Market Opportunity. Why Motilal Oswal PMS? NTDOP Strategy details") Contents India s Next Trillion Dollar Opportunity (NTDOP) Small and Mid Cap Market Opportunity Why Motilal Oswal PMS? NTDOP Strategy details FY51 FY60 FY70 FY80 FY90 FY00 FY01 FY02 FY03 FY04 FY05 FY06
Contents India s Next Trillion Dollar Opportunity (NTDOP) Small and Mid Cap Market Opportunity Why Motilal Oswal PMS? NTDOP Strategy details FY51 FY60 FY70 FY80 FY90 FY00 FY01 FY02 FY03 FY04 FY05 FY06
BUY RIGHT : SIT TIGHT. Buying quality companies and riding their growth cycle
 RST RSTBRST STBRST BUY RIGHT : SIT TIGHT Buying quality companies and riding their growth cycle RST RSTBRST RSTBRS Buy Right : Sit Tight (BRST) At Motilal Oswal Asset Management Company (MOAMC), our investment
This product is suitable for investors who are seeking*
 Product Labeling Name of the Scheme This product is suitable for investors who are seeking* Motilal Oswal MOSt Focused Multicap 35 Fund (MOSt Focused Multicap 35) An Open Ended Diversified Equity Scheme
Motilal Oswal Multicap 35 Fund (Multi Cap Fund An open ended equity scheme investing across large cap, mid cap, small cap stocks) Invests in emerging
 Invests in emerging") Motilal Oswal Multicap 35 Fund (Multi Cap Fund An open ended equity scheme investing across large cap, mid cap, small cap stocks) Invests in emerging and enduring wealth creators Product Labeling Mar-79
Motilal Oswal Multicap 35 Fund (Multi Cap Fund An open ended equity scheme investing across large cap, mid cap, small cap stocks) Invests in emerging and enduring wealth creators Product Labeling Mar-79
Contents. Why Equities? Why Large caps? Why Value Strategy? Why Motilal Oswal PMS?
 Contents Why Equities? Why Large caps? Why Value Strategy? Portfolio and Sectors Performance Risk Analysis Qualitative Valuations Strategy Structure Why Motilal Oswal PMS? BUY RIGHT : SIT TIGHT Our Investment
Contents. Why Equities? Why Large caps? Why Value Strategy? Why Motilal Oswal PMS?
 August 2017 Contents Why Equities? Why Large caps? Why Value Strategy? Portfolio and Sectors Performance Risk Analysis Qualitative Valuations Strategy Structure Why Motilal Oswal PMS? BUY RIGHT : SIT TIGHT
Long Term Equity Fund ( An open-ended equity linked saving scheme with a statutory lock in of 3 years and tax benefit)
") Long Term Equity Fund ( An open-ended equity linked saving scheme with a statutory lock in of 3 years and tax benefit) Product Labeling 2 Investments for Tax Saving It's a well known fact that the Government
Long Term Equity Fund ( An open-ended equity linked saving scheme with a statutory lock in of 3 years and tax benefit) Product Labeling 2 Investments for Tax Saving It's a well known fact that the Government
Contents. Why Equities? Why Large caps? Why Value Strategy? Why Motilal Oswal PMS?
 March 2018 Contents Why Equities? Why Large caps? Why Value Strategy? Portfolio and Sectors Performance Risk Analysis Qualitative Valuations Strategy Structure Why Motilal Oswal PMS? BUY RIGHT : SIT TIGHT
Your key to N XT. India s Next Trillion Dollar of GDP Growth. MOSt. May Trillion Dollar Opportunity Strategy. Years
 RST Your key to India s Next Trillion Dollar of GDP Growth RSTBRST RSTBRST 10 Celebrating Years MOSt E N XT Trillion Dollar Opportunity Strategy May 2018 Contents India s Next Trillion Dollar Opportunity
IIFL INDIA GROWTH FUND. (An open ended equity Scheme)
") IIFL INDIA GROWTH FUND (An open ended equity Scheme) IIFL INDIA GROWTH FUND (An open ended equity Scheme) This product is suitable for investors who are seeking* capital appreciation over long term; Investment
IIFL INDIA GROWTH FUND (An open ended equity Scheme) IIFL INDIA GROWTH FUND (An open ended equity Scheme) This product is suitable for investors who are seeking* capital appreciation over long term; Investment
(MOF30) (Mid Cap Fund An open-ended equity scheme predominantly investing in mid cap stocks)
 (Mid Cap Fund An open-ended equity scheme predominantly investing in mid cap stocks)") (MOF30) (Mid Cap Fund An open-ended equity scheme predominantly investing in mid cap stocks) Product Labeling Our Investment Philosophy At Motilal Oswal Asset Management Company (MOAMC), our investment
(MOF30) (Mid Cap Fund An open-ended equity scheme predominantly investing in mid cap stocks) Product Labeling Our Investment Philosophy At Motilal Oswal Asset Management Company (MOAMC), our investment
Contents. India s Next Trillion Dollar Opportunity (NTDOP) Small and Mid Cap (SMID) Market Opportunity. Why MOAMC- PMS?
 Small and Mid Cap (SMID) Market Opportunity. Why MOAMC- PMS?") March 2015 Contents India s Next Trillion Dollar Opportunity (NTDOP) Small and Mid Cap (SMID) Market Opportunity Why MOAMC- PMS? Strategy Details The Next Trillion Dollar Opportunity (NTDOP) Trillion Dollar
March 2015 Contents India s Next Trillion Dollar Opportunity (NTDOP) Small and Mid Cap (SMID) Market Opportunity Why MOAMC- PMS? Strategy Details The Next Trillion Dollar Opportunity (NTDOP) Trillion Dollar
Why India and India s scope for long term growth
 January 2018 September June May 2018 2015 2015 Why India and India s scope for long term growth Why Small and Midcap portfolio Opportunity in Mid and Smallcap segment Outperformance in Upcycles Themes
IIFL INDIA GROWTH FUND. (An open ended equity Scheme)
") IIFL INDIA GROWTH FUND (An open ended equity Scheme) IIFL INDIA GROWTH FUND (An open ended equity Scheme) This product is suitable for investors who are seeking* capital appreciation over long term; Investment
IIFL INDIA GROWTH FUND (An open ended equity Scheme) IIFL INDIA GROWTH FUND (An open ended equity Scheme) This product is suitable for investors who are seeking* capital appreciation over long term; Investment
Why India 5.7. India is one of best performing EM currency in Currency appreciation vis-à-vis USD in Malayasia. Indonesia. India.
 September Jan May 2019 2015 2015 Why India FY00 FY01 FY02 FY03 FY04 FY05 FY06 FY07 FY08 FY09 FY10 FY11 FY12 FY13 FY14 FY15 FY16 FY17 FY18E FY00-1.0 Russia FY01-0.6 FY02 0.7 India FY03 1.2 FY04 2.3 Thailand
Introducing a fund that Invests in emerging wealth creators
 Introducing a fund that Invests in emerging wealth creators Product Labeling Name of the scheme This product is suitable for investors who are seeking* Motilal Oswal MOSt Focused Midcap 30 Fund (MOSt Focused
Motilal Oswal MidCap 100 ETF
 Motilal Oswal MidCap 100 ETF Product labeling This product is suitable for investors who are seeking* Return that corresponds generally to the performance of the NIFTY Midcap 100 index, subject to tracking
The Zen of Investing. May 2018
 RST The Zen of Investing RSTBRST RSTBRST 14 May 2018 Contents Why Equities? Why Large caps? Why Value Strategy? Portfolio and Sectors Performance Risk Analysis Qualitative Valuations Strategy Structure
With the power of focus, you can see constellations where others only see stars. Motilal Oswal MOSt Focused 25 Fund. (An open ended Equity Scheme)
") The Power of FOCUS With the power of focus, you can see constellations where others only see stars Motilal Oswal MOSt Focused 25 Fund (An open ended Equity Scheme) NO LOAD FUND Call: 1800-200-6626 SMS:
The Power of FOCUS With the power of focus, you can see constellations where others only see stars Motilal Oswal MOSt Focused 25 Fund (An open ended Equity Scheme) NO LOAD FUND Call: 1800-200-6626 SMS:
Why India 5.7. India is one of best performing EM currency in Currency appreciation vis-à-vis USD in Malayasia. Indonesia. India.
 September July May 2018 2015 2015 Why India FY00 FY01 FY02 FY03 FY04 FY05 FY06 FY07 FY08 FY09 FY10 FY11 FY12 FY13 FY14 FY15 FY16 FY17 FY18E FY00-1.0 Russia FY01-0.6 FY02 0.7 India FY03 1.2 FY04 2.3 Thailand
Axis Dynamic Equity Fund. (An Open - ended Equity Scheme)
") Axis Dynamic Equity Fund (An Open - ended Equity Scheme) 1 Typically, what influences investors to invest? Media Noise Everybody else is investing Idle money lying in bank Free advice from a friend/family
Axis Dynamic Equity Fund (An Open - ended Equity Scheme) 1 Typically, what influences investors to invest? Media Noise Everybody else is investing Idle money lying in bank Free advice from a friend/family
NFO Period: 20 th July to 3 rd August 2015
 NFO Period: 20 th July to 3 rd August 2015 The Product is suitable for investors who are seeking* Riskometrer Long term wealth creation solution Why Invest in Small Cap Stocks Our Frame Work of Recommendation:
Why India and India s scope for long term growth
 January 2018 September Jan May 2019 2015 2015 Why India and India s scope for long term growth Why Small and Midcap portfolio Opportunity in Mid and Smallcap segment Outperformance in Upcycles Themes of
Spheria Australian Smaller Companies Fund
 29-Jun-18 $ 2.7686 $ 2.7603 $ 2.7520 28-Jun-18 $ 2.7764 $ 2.7681 $ 2.7598 27-Jun-18 $ 2.7804 $ 2.7721 $ 2.7638 26-Jun-18 $ 2.7857 $ 2.7774 $ 2.7690 25-Jun-18 $ 2.7931 $ 2.7848 $ 2.7764 22-Jun-18 $ 2.7771
Historical Pricing PJM COMED, Around the Clock. Cal '15 Cal '16 Cal '17 Cal '18 Cal '19 Cal '20 Cal '21 Cal '22
 $50 Historical Pricing PJM COMED, Around the Clock $48 $46 $44 $42 $40 $38 $36 $34 $32 $30 $28 $26 Cal '15 Cal '16 Cal '17 Cal '18 Cal '19 Cal '20 Cal '21 Cal '22 The information presented above was gathered
Contents. The India Opportunity. Why Motilal Oswal PMS? Strategy Details
 September May May 2017 2015 2015 Contents The India Opportunity Why Motilal Oswal PMS? Strategy Details India : Fast growing emerging economy CPI inflation has dropped below 6% Falling Interest rates Increasing
2018 The year of promise
 2018 The year of promise January 2018 Tushar Pradhan, Chief Investment Officer We have come a long way in 2017 Source: Kotak Institutional Equities Dec 2017 Key events and performance of the Indian market
Axis Dynamic Equity Fund. (An open ended dynamic asset allocation fund)
") Axis Dynamic Equity Fund (An open ended dynamic asset allocation fund) Net equity inflow --> Nifty 50 Index Emotions and Impact Manual market timing Emotions have impacted investment decisions 20.7% Value
Axis Dynamic Equity Fund (An open ended dynamic asset allocation fund) Net equity inflow --> Nifty 50 Index Emotions and Impact Manual market timing Emotions have impacted investment decisions 20.7% Value
Axis Dynamic Equity Fund. (An Open - Ended Dynamic Asset Allocation Fund)
") Axis Dynamic Equity Fund (An Open - Ended Dynamic Asset Allocation Fund) Emotions and Impact Manual market timing Emotions have impacted investment decisions Investors ended up investing at market peak
Axis Dynamic Equity Fund (An Open - Ended Dynamic Asset Allocation Fund) Emotions and Impact Manual market timing Emotions have impacted investment decisions Investors ended up investing at market peak
Historical Pricing PJM PSEG, Around the Clock. Cal '15 Cal '16 Cal '17 Cal '18 Cal '19 Cal '20 Cal '21 Cal '22
 $70 Historical Pricing PJM PSEG, Around the Clock $65 $60 $55 $50 $45 $40 $35 $30 $25 Cal '15 Cal '16 Cal '17 Cal '18 Cal '19 Cal '20 Cal '21 Cal '22 The information presented above was gathered and compiled
Religare Invesco Mid N Small Cap Fund
 Religare Invesco Mid N Small Cap Fund An Open Ended Equity Scheme Suitable for investors who are seeking*: Capital appreciation over long term Investment predominantly in equity and equityrelated instruments
(Mid Cap Fund An open-ended equity scheme predominantly investing in mid cap stocks)
") (Mid Cap Fund An open-ended equity scheme predominantly investing in mid cap stocks) Product Labeling Our Investment Philosophy At Motilal Oswal Asset Management Company (MOAMC), our investment philosophy
(Mid Cap Fund An open-ended equity scheme predominantly investing in mid cap stocks) Product Labeling Our Investment Philosophy At Motilal Oswal Asset Management Company (MOAMC), our investment philosophy
SYSTEMATIC INVESTMENT PLAN (SIP) October 2017
 October 2017") SYSTEMATIC INVESTMENT PLAN (SIP) October 2017 DID YOU KNOW? If you currently have monthly expenses of Rs. 30,000, then after 5 years you will require close to Rs.40,000 per month to maintain the same lifestyle!
SYSTEMATIC INVESTMENT PLAN (SIP) October 2017 DID YOU KNOW? If you currently have monthly expenses of Rs. 30,000, then after 5 years you will require close to Rs.40,000 per month to maintain the same lifestyle!
Corporate Presentation. August
 Corporate Presentation August 2017 1 PARENTAGE Sundaram Finance Sundaram Business Services Limited Outsourcing services *Not an exhaustive list Fully Owned Subsidiaries* Sundaram Asset Management Mutual
Financial Data Report CIEL LTD (THE GROUP) for the period ending 31.Dec.2017
 for the period ending 31.Dec.2017") Financial Data Report CIEL LTD (THE GROUP) for the period ending 31.Dec.2017 Equity Statistics Particulars Units 29-Dec-17 Current Market Price MUR 7.14 52 week H/L* MUR 7.94 / 6.26 Market Capitalisation
Financial Data Report CIEL LTD (THE GROUP) for the period ending 31.Dec.2017 Equity Statistics Particulars Units 29-Dec-17 Current Market Price MUR 7.14 52 week H/L* MUR 7.94 / 6.26 Market Capitalisation
Contents. The India Opportunity. Why Motilal Oswal PMS? Strategy Details
 September July May 2017 2015 2015 Contents The India Opportunity Why Motilal Oswal PMS? Strategy Details India : Fast growing emerging economy CPI inflation has dropped below 6% Falling Interest rates
Financial Data Report LOTTOTECH LIMITED. for the period ending 31.Dec.2017
 Financial Data Report LOTTOTECH LIMITED for the period ending 31.Dec.2017 Equity Statistics Particulars Units 29-Dec-17 Current Market Price MUR 7.30 52 week H/L* MUR 9.12 / 5.28 Market Capitalisation
Financial Data Report LOTTOTECH LIMITED. for the period ending 30.Jun.2017
 Financial Data Report LOTTOTECH LIMITED for the period ending 30.Jun.2017 Equity Statistics Particulars Units 31-Jul-17 Current Market Price MUR 5.90 52 week H/L* MUR 6.50 / 4.02 Market Capitalisation
BSE 500 (Ex-Financials) - Median Sales Growth. Dec-07. Jun-09. Dec-08. Dec-06. Jun-07. Jun-08. YoY Sales Growth Average +2 SD +1 SD -1 SD -2 SD
 - Median Sales Growth. Dec-07. Jun-09. Dec-08. Dec-06. Jun-07. Jun-08. YoY Sales Growth Average +2 SD +1 SD -1 SD -2 SD") Date: 4 th July 2016 Dear Investors, Below is the performance of the Moats & Special Situations Portfolio (MSSP) as of 30 th June 2016. Portfolio Performance Equity Allocation as on 30.06.2016 Total Portfolio
Date: 4 th July 2016 Dear Investors, Below is the performance of the Moats & Special Situations Portfolio (MSSP) as of 30 th June 2016. Portfolio Performance Equity Allocation as on 30.06.2016 Total Portfolio
Financial Data Report LOTTOTECH LIMITED. for the period ending 30.Jun.2018
 Financial Data Report LOTTOTECH LIMITED for the period ending 30.Jun.2018 Equity Statistics Particulars Units 29-Jun-18 Current Market Price MUR 9.72 52 week H/L* MUR 9.88 / 5.66 Market Capitalisation
Motilal Oswal Nasdaq 100 ETF
 Motilal Oswal Nasdaq 100 ETF Product labeling This product is suitable for investors who are seeking* Return that corresponds generally to the performance of the NASDAQ 100 Index, subject to tracking error
Financial Data Report SUN LIMITED (THE GROUP) for the period ending 31.Mar.2017
 for the period ending 31.Mar.2017") Financial Data Report SUN LIMITED (THE GROUP) for the period ending 31.Mar.2017 Equity Statistics Particulars Units 31-Mar-17 Current Market Price MUR 40.00 52 week H/L* MUR 40.00 / 32.80 Market Capitalisation
Financial Data Report SUN LIMITED (THE GROUP) for the period ending 31.Mar.2017 Equity Statistics Particulars Units 31-Mar-17 Current Market Price MUR 40.00 52 week H/L* MUR 40.00 / 32.80 Market Capitalisation
Monthly Communiqué August 2014
 Monthly Communiqué August 2014 Dear Investors and my dear advisor friends, July, August, September and October typically tend to mark the months which for our industry may be called as conference season.
CANARA ROBECO MEDIUM TERM OPPORTUNITIES FUND FEBRUARY 2018
 CANARA ROBECO MEDIUM TERM OPPORTUNITIES FUND FEBRUARY 2018 This product is suitable for investors who are seeking* Income/Capital appreciation over medium to long-term Investment in Debt and Money Market
Financial Data Report CIEL LTD (THE GROUP) for the period ending 31.Dec.2016
 for the period ending 31.Dec.2016") Financial Data Report CIEL LTD (THE GROUP) for the period ending 31.Dec.2016 Equity Statistics Particulars Units 30-Dec-16 Current Market Price MUR 6.30 52 week H/L* MUR 6.60 / 5.86 Market Capitalisation
Financial Data Report CIEL LTD (THE GROUP) for the period ending 31.Dec.2016 Equity Statistics Particulars Units 30-Dec-16 Current Market Price MUR 6.30 52 week H/L* MUR 6.60 / 5.86 Market Capitalisation
Good year for the fund despite volatile market scenario
 Good year for the fund despite volatile market scenario The fund completed 1 year recently 12,000.00 11,500.00 11,000.00 10,500.00 10,000.00 9,500.00 Axis Multicap Fund - Reg - Growth Nifty 500 Index NAV/Index
IIFL CAPITAL ENHANCER FUND - SERIES 1. An Annual Interval Scheme investing in Equity and Equity Related Securities
 IIFL CAPITAL ENHANCER FUND - SERIES 1 An Annual Interval Scheme investing in Equity and Equity Related Securities CURRENT ASSET ALLOCATION: INDIAN SCENARIO The current asset allocation* of Indian investors
Copyright 2010, The NASDAQ OMX Group, Inc. All rights reserved. Motilal Oswal MOSt Shares NASDAQ-100 ETF
 Copyright 2010, The NASDAQ OMX Group, Inc. All rights reserved. Motilal Oswal MOSt Shares NASDAQ-100 ETF Product Labeling This product is suitable for investors who are seeking* Return that corresponds
(MOF30) (Mid Cap Fund An open-ended equity scheme predominantly investing in mid cap stocks)
 (Mid Cap Fund An open-ended equity scheme predominantly investing in mid cap stocks)") (MOF30) (Mid Cap Fund An open-ended equity scheme predominantly investing in mid cap stocks) Product Labeling Our Investment Philosophy At Motilal Oswal Asset Management Company (MOAMC), our investment
(MOF30) (Mid Cap Fund An open-ended equity scheme predominantly investing in mid cap stocks) Product Labeling Our Investment Philosophy At Motilal Oswal Asset Management Company (MOAMC), our investment
Financial Data Report Cim Financial Services Limited (THE GROUP) for the period ending 31.Dec.2017
 for the period ending 31.Dec.2017") Financial Data Report Cim Financial Services Limited (THE GROUP) for the period ending 31.Dec.2017 Equity Statistics Particulars Units 29-Dec-17 Current Market Price MUR 10.05 52 week H/L* MUR 10.50 /
Financial Data Report Cim Financial Services Limited (THE GROUP) for the period ending 31.Dec.2017 Equity Statistics Particulars Units 29-Dec-17 Current Market Price MUR 10.05 52 week H/L* MUR 10.50 /
Financial Data Report ROGERS AND COMPANY LIMITED (THE GROUP) for the period ending 31.Dec.2017
 for the period ending 31.Dec.2017") Financial Data Report ROGERS AND COMPANY LIMITED (THE GROUP) for the period ending 31.Dec.2017 Equity Statistics Particulars Units 29-Dec-17 Current Market Price MUR 31.30 52 week H/L* MUR 33.00 / 27.00
Financial Data Report ROGERS AND COMPANY LIMITED (THE GROUP) for the period ending 31.Dec.2017 Equity Statistics Particulars Units 29-Dec-17 Current Market Price MUR 31.30 52 week H/L* MUR 33.00 / 27.00
Financial Data Report IBL Limited (THE GROUP) for the period ending 31.Mar.2017
 for the period ending 31.Mar.2017") Financial Data Report IBL Limited (THE GROUP) for the period ending 31.Mar.2017 Equity Statistics Particulars Units 31-Mar-17 Current Market Price MUR 39.65 52 week H/L* MUR 125.00 / 27.20 Market Capitalisation
Financial Data Report IBL Limited (THE GROUP) for the period ending 31.Mar.2017 Equity Statistics Particulars Units 31-Mar-17 Current Market Price MUR 39.65 52 week H/L* MUR 125.00 / 27.20 Market Capitalisation
Financial Data Report LUX ISLAND RESORTS LIMITED (THE GROUP) for the period ending 30.Jun.2015
 for the period ending 30.Jun.2015") Financial Data Report LUX ISLAND RESORTS LIMITED (THE GROUP) for the period ending 30.Jun.2015 Equity Statistics Particulars Units 15-Sep-15 Current Market Price MUR 62.50 52 week H/L* MUR 63.50 / 51.00
Financial Data Report LUX ISLAND RESORTS LIMITED (THE GROUP) for the period ending 30.Jun.2015 Equity Statistics Particulars Units 15-Sep-15 Current Market Price MUR 62.50 52 week H/L* MUR 63.50 / 51.00
Financial Data Report CAUDAN DEVELOPMENT LIMITED (THE GROUP) for the period ending 31.Mar.2016
 for the period ending 31.Mar.2016") Financial Data Report (THE GROUP) for the period ending 31.Mar.2016 INVESTMENTS Equity Statistics Particulars Units 31-Mar-16 Current Market Price MUR 1.22 52 week H/L* MUR 1.40 / 1.17 Market Capitalisation
Financial Data Report (THE GROUP) for the period ending 31.Mar.2016 INVESTMENTS Equity Statistics Particulars Units 31-Mar-16 Current Market Price MUR 1.22 52 week H/L* MUR 1.40 / 1.17 Market Capitalisation
Financial Data Report SBM HOLDINGS LIMITED (THE GROUP) for the period ending 31.Dec.2016
 for the period ending 31.Dec.2016") Financial Data Report SBM HOLDINGS LIMITED (THE GROUP) for the period ending 31.Dec.2016 Equity Statistics Particulars Units 30-Dec-16 Current Market Price MUR 6.64 52 week H/L* MUR 7.00 /.63 Market Capitalisation
Financial Data Report SBM HOLDINGS LIMITED (THE GROUP) for the period ending 31.Dec.2016 Equity Statistics Particulars Units 30-Dec-16 Current Market Price MUR 6.64 52 week H/L* MUR 7.00 /.63 Market Capitalisation
XML Publisher Balance Sheet Vision Operations (USA) Feb-02
 Feb-02") Page:1 Apr-01 May-01 Jun-01 Jul-01 ASSETS Current Assets Cash and Short Term Investments 15,862,304 51,998,607 9,198,226 Accounts Receivable - Net of Allowance 2,560,786
Page:1 Apr-01 May-01 Jun-01 Jul-01 ASSETS Current Assets Cash and Short Term Investments 15,862,304 51,998,607 9,198,226 Accounts Receivable - Net of Allowance 2,560,786
Product Labeling. Investment in equity securities of NIFTY Midcap 100 index
 Title slide Product Labeling This product is suitable for investors who are seeking* Return that corresponds generally to the performance of the NIFTY Midcap 100 index, subject to tracking error. Investment
Mirae Asset Emerging Bluechip Fund (MAEBF)
") Mirae Asset Emerging Bluechip Fund (MAEBF) (An Open Ended Equity Fund) Product Literature December 2014 MAEBF Our Goal Our endeavour has been to Spot the Potential of Emerging Companies and consistently
Mirae Asset Emerging Bluechip Fund (MAEBF) (An Open Ended Equity Fund) Product Literature December 2014 MAEBF Our Goal Our endeavour has been to Spot the Potential of Emerging Companies and consistently
Financial Data Report ROGERS AND COMPANY LIMITED (THE GROUP) for the period ending 31.Dec.2015
 for the period ending 31.Dec.2015") Financial Data Report (THE GROUP) for the period ending 31.Dec.2015 INVESTMENT Equity Statistics Particulars Units 31-Mar-16 Current Market Price MUR 27.75 52 week H/L* MUR 32.50 / 26.90 Market Capitalisation
Financial Data Report (THE GROUP) for the period ending 31.Dec.2015 INVESTMENT Equity Statistics Particulars Units 31-Mar-16 Current Market Price MUR 27.75 52 week H/L* MUR 32.50 / 26.90 Market Capitalisation
Financial Data Report MCB GROUP LIMITED (THE GROUP) for the period ending 31.Dec.2015
 for the period ending 31.Dec.2015") Financial Data Report MCB GROUP LIMITED (THE GROUP) for the period ending 31.Dec.2015 Equity Statistics Particulars Units 31-Mar-16 Current Market Price MUR 205.75 52 week H/L* MUR 225.00 / 197.75 Market
Financial Data Report MCB GROUP LIMITED (THE GROUP) for the period ending 31.Dec.2015 Equity Statistics Particulars Units 31-Mar-16 Current Market Price MUR 205.75 52 week H/L* MUR 225.00 / 197.75 Market
Timely financial obliga ons Vaca on Car Re rement Home Child s marriage Re rement Child s marriage Medical emergency. Systematic Investment Plan
 Child s marriage Re rement Child s educa on Medical emergency Child s educa on Timely financial obliga ons Child s educa on Timely financial obliga ons Vaca on Car Re rement Home Child s marriage Re rement
Review of Registered Charites Compliance Rates with Annual Reporting Requirements 2016
 Review of Registered Charites Compliance Rates with Annual Reporting Requirements 2016 October 2017 The Charities Regulator, in accordance with the provisions of section 14 of the Charities Act 2009, carried
Financial Data Report SBM HOLDINGS LIMITED (THE GROUP) for the period ending 30.Jun.2017
 for the period ending 30.Jun.2017") Financial Data Report SBM HOLDINGS LIMITED (THE GROUP) for the period ending 30.Jun.2017 Equity Statistics Particulars Units 31-Jul-17 Current Market Price MUR 7.66 52 week H/L* MUR 8.00 /.67 Market Capitalisation
Financial Data Report SBM HOLDINGS LIMITED (THE GROUP) for the period ending 30.Jun.2017 Equity Statistics Particulars Units 31-Jul-17 Current Market Price MUR 7.66 52 week H/L* MUR 8.00 /.67 Market Capitalisation
Financial Data Report MCB GROUP LIMITED (THE GROUP) for the period ending 31.Dec.2017
 for the period ending 31.Dec.2017") Financial Data Report MCB GROUP LIMITED (THE GROUP) for the period ending 31.Dec.2017 Equity Statistics Particulars Units 29-Dec-17 Current Market Price MUR 273.00 52 week H/L* MUR 289.00 / 213.25 Market
Financial Data Report MCB GROUP LIMITED (THE GROUP) for the period ending 31.Dec.2017 Equity Statistics Particulars Units 29-Dec-17 Current Market Price MUR 273.00 52 week H/L* MUR 289.00 / 213.25 Market
Corporate Presentation. December
 Corporate Presentation December 2017 1 PARENTAGE Sundaram Finance Sundaram Business Services Limited Outsourcing services *Not an exhaustive list Fully Owned Subsidiaries* Sundaram Asset Management Mutual
NJ PMS Monthly Updates February 29, 2016
 NJ PMS Monthly Updates February 29, 2016 Movement In Equities Is the Function Of Underlying Profitability Months Sensex Value Sensex Earnings Feb-91 1,220.41 60.03 Feb-16 23,002.00 1,360.26 CAGR 13.01%
Axis Corporate Debt Fund. (An open ended debt scheme predominantly investing in AA+ and above rated corporate bonds)
") Axis Corporate Debt Fund (An open ended debt scheme predominantly investing in AA+ and above rated corporate bonds) Macro economic indicators are showing signs of stability Indicator Current* Outlook Inflation
Axis Corporate Debt Fund (An open ended debt scheme predominantly investing in AA+ and above rated corporate bonds) Macro economic indicators are showing signs of stability Indicator Current* Outlook Inflation
Financial Data Report SBM HOLDINGS LIMITED (THE GROUP) for the period ending 31.Mar.2016
 for the period ending 31.Mar.2016") Financial Data Report SBM HOLDINGS LIMITED (THE GROUP) for the period ending 31.Mar.2016 Equity Statistics Particulars Units 31-Mar-16 Current Market Price MUR 0.68 52 week H/L* MUR 1.00 /.65 Market Capitalisation
Financial Data Report SBM HOLDINGS LIMITED (THE GROUP) for the period ending 31.Mar.2016 Equity Statistics Particulars Units 31-Mar-16 Current Market Price MUR 0.68 52 week H/L* MUR 1.00 /.65 Market Capitalisation
Equity Advised Portfolio Service (EAPS) External Circulation Permitted January Monthly Update
 External Circulation Permitted January Monthly Update") Equity Advised Portfolio Service (EAPS) External Circulation Permitted January 2018- Monthly Update Salient Features - EAPS What does the service cover? What is not covered? Process Eligibility Tariff
Equity Advised Portfolio Service (EAPS) External Circulation Permitted January 2018- Monthly Update Salient Features - EAPS What does the service cover? What is not covered? Process Eligibility Tariff
HUD NSP-1 Reporting Apr 2010 Grantee Report - New Mexico State Program
 HUD NSP-1 Reporting Apr 2010 Grantee Report - State Program State Program NSP-1 Grant Amount is $19,600,000 $9,355,381 (47.7%) has been committed $4,010,874 (20.5%) has been expended Grant Number HUD Region
Mirae Asset Emerging Bluechip Fund (MAEBF)
") Mirae Asset Emerging Bluechip Fund (MAEBF) (An Open Ended Equity Fund) Product Literature April 2015 MAEBF Our Goal Our endeavour has been to Spot the Potential of Emerging Companies and consistently outperform
Mirae Asset Emerging Bluechip Fund (MAEBF) (An Open Ended Equity Fund) Product Literature April 2015 MAEBF Our Goal Our endeavour has been to Spot the Potential of Emerging Companies and consistently outperform
Financial Data Report SBM HOLDINGS LIMITED (THE GROUP) for the period ending 31.Dec.2017
 for the period ending 31.Dec.2017") Financial Data Report SBM HOLDINGS LIMITED (THE GROUP) for the period ending 31.Dec.2017 Equity Statistics Particulars Units 29-Dec-17 Current Market Price MUR 7.50 52 week H/L* MUR 8.00 / 6.50 Market
Financial Data Report SBM HOLDINGS LIMITED (THE GROUP) for the period ending 31.Dec.2017 Equity Statistics Particulars Units 29-Dec-17 Current Market Price MUR 7.50 52 week H/L* MUR 8.00 / 6.50 Market
MANAGED BY RELIANCE NIPPON LIFE ASSET MANAGEMENT LIMITED (AN OPEN-ENDED INDEX EXCHANGE TRADED SCHEME) (RAJIV GANDHI EQUITY SAVINGS SCHEME (RGESS) $
 (RAJIV GANDHI EQUITY SAVINGS SCHEME (RGESS) $") MANAGED BY RELIANCE NIPPON LIFE ASSET MANAGEMENT LIMITED (AN OPEN-ENDED INDEX EXCHANGE TRADED SCHEME) (RAJIV GANDHI EQUITY SAVINGS SCHEME (RGESS) $ QUALIFIED SCHEME September 2017 2 Introduction to Exchange
MANAGED BY RELIANCE NIPPON LIFE ASSET MANAGEMENT LIMITED (AN OPEN-ENDED INDEX EXCHANGE TRADED SCHEME) (RAJIV GANDHI EQUITY SAVINGS SCHEME (RGESS) $ QUALIFIED SCHEME September 2017 2 Introduction to Exchange
Canara Robeco Short Term Fund Open Ended Debt Scheme
 Canara Robeco Short Term Fund Open Ended Debt Scheme December 2017 This product is suitable for investors who are seeking* Income / capital appreciation over short term Investing in short term to medium
Financial Data Report SBM HOLDINGS LIMITED (THE GROUP) for the period ending 31.Mar.2017
 for the period ending 31.Mar.2017") Financial Data Report SBM HOLDINGS LIMITED (THE GROUP) for the period ending 31.Mar.2017 Equity Statistics Particulars Units 31-Mar-17 Current Market Price MUR 7.10 52 week H/L* MUR 7.24 /.63 Market Capitalisation
Financial Data Report SBM HOLDINGS LIMITED (THE GROUP) for the period ending 31.Mar.2017 Equity Statistics Particulars Units 31-Mar-17 Current Market Price MUR 7.10 52 week H/L* MUR 7.24 /.63 Market Capitalisation
Investing Insights. Managing Downturns
 December 31, 2017 Managing Downturns 2 Number of Months 1902 1907 1910 1913 1918 1920 1923 1926 1929 1937 1945 1948 1953 1957 1960 1969 1973 1980 1981 1990 2001 2007 2017 Expansion vs. Recession in the
Aims to achieve the right blend of Growth and Tax Saving
 Aims to achieve the right blend of Growth and Tax Saving DATE OF ALLOTMENT March 31,1996 BENCHMARK S&P BSE Sensex FUND SIZE Rs.981.23 (Rs. in Cr.) MONTHLY AVERAGE AUM Rs.939.37 (Rs. in Cr.) EXIT LOAD Nil
Monthly Market Outlook December Equities Invest in Equities for the long-run Fixed Income The appeal remains intact
 Monthly Market Outlook December 2015 Equities Invest in Equities for the long-run Fixed Income The appeal remains intact Returns' (%) Source: MFI; Date ending on November 30, 2015 Global Performance Countries
PHOENIX ENERGY MARKETING CONSULTANTS INC. HISTORICAL NATURAL GAS & CRUDE OIL PRICES UPDATED TO July, 2018
 Jan-01 $12.9112 $10.4754 $9.7870 $1.5032 $29.2595 $275.39 $43.78 $159.32 $25.33 Feb-01 $10.4670 $7.8378 $6.9397 $1.5218 $29.6447 $279.78 $44.48 $165.68 $26.34 Mar-01 $7.6303 $7.3271 $5.0903 $1.5585 $27.2714
Financial Data Report CIEL LTD (THE GROUP) for the period ending 30.Jun.2015
 for the period ending 30.Jun.2015") Financial Data Report CIEL LTD (THE GROUP) for the period ending 30.Jun.2015 Equity Statistics Particulars Units 15-Sep-15 Current Market Price MUR 6.76 52 week H/L* MUR 7.80 / 6.70 Market Capitalisation
Financial Data Report CIEL LTD (THE GROUP) for the period ending 30.Jun.2015 Equity Statistics Particulars Units 15-Sep-15 Current Market Price MUR 6.76 52 week H/L* MUR 7.80 / 6.70 Market Capitalisation
Algo Trading System RTM
 Year Return 2016 15,17% 2015 29,57% 2014 18,57% 2013 15,64% 2012 13,97% 2011 55,41% 2010 50,98% 2009 48,29% Algo Trading System RTM 89000 79000 69000 59000 49000 39000 29000 19000 9000 2-Jan-09 2-Jan-10
History Has Shown The Advantage Of True Diversification
 History Has Shown The Advantage Of True Diversification Returns of asset classes Year Stocks Bonds Gold Average 1995-23% 3% 14% -2% 1996-1% 13% -3% 3% 1997 20% 24% -14% 10% 1998-18% 8% 8% 0% 1999 67% 16%
There is a high dispersion in long term stock performance
 There is a high dispersion in long term stock performance Variation in top and bottom stocks over the last 10 years % CAGR (CY 07-17) BSE 100 index 5.5 Top quartile 16.7 Bottom quartile (21.2) Weak companies
WHITE PAPER SERIES #08
 { WHITE PAPER SERIES #08 LargeMidcap 250 { Well-diversified portfolio of large and midcap stocks November 2017 Introduction Large cap stocks represent the top companies categorized based on full market
Axis Emerging Opportunities Fund Series 1 A Close-Ended Equity Fund (1400 days)
") 1 Axis Emerging Opportunities Fund Series 1 A Close-Ended Equity Fund (1400 days) Indian Policy Update Demonetisation & GST 2 1 Government policy changes Get ready for structurally higher tax to GDP Demonetisation
1 Axis Emerging Opportunities Fund Series 1 A Close-Ended Equity Fund (1400 days) Indian Policy Update Demonetisation & GST 2 1 Government policy changes Get ready for structurally higher tax to GDP Demonetisation