Group Presentation. May 2015
|
|
|
- Georgia Washington
- 6 years ago
- Views:
Transcription


1 Group Presentation May 2015
2 Recent Developments / 1 st Q 2015 Financial Highlights Group consolidated revenues increased by 29.2% to ml ( vs ml in 1Q 2014) mostly on the back of accelerated execution on construction backlog Group operating profit (EBIT) amounted to 16.1 ml includes a 12.4 ml impairment in mining assets available for sale EBIT adjusted for the above item amounted to 28.5 ml Results after tax and minorities were losses of 16.7 ml (vs profit of 1.7 ml in 1Q 2014) negatively impacted from the aforementioned impairment of financial assets available for sale Total debt decreased to 1,473.3 ml vs 1,550.7 as of 31/12/2014 Corporate related Net Debt as of 31/3/2015 increased to vs ml as of 31/12/2014 mostly because of increased working capital requirements and reduced cash at construction Total construction backlog stands at ~ 3.8 bn with another 485 ml of contracts pending signature ELTECH Anemos is constructing 93.5 MW of wind farms funded by the IPO proceeds ( 35 ml) and bank debt The on-going discussions on Greece s financing programme have increased uncertainty on the Greek macroeconomic environment led to increased working capital requirements for the Group in 1Q2015 continuation of the current uncertainty will negatively impact the Group s prospects for eld0029 2
3 Key Investment highlights Leading infrastructure player in Greece with an increasing international footprint Growth prospects in Waste Management and Renewable Energy Well-balanced diversified portfolio of activities Strong expected dividend stream from mature concessions (i.e. Attiki Odos) Unrivalled construction knowhow (backlog c. 3.8bn) 9eld0029 3
4 Table of contents 1. Group overview Pages 5~8 2. Undisputed leader in the Greek construction sector Pages 9~11 3. Leading player in Greek concessions Pages 12~15 4. Market leader in Waste Management Services Pages 16~18 5. Significant growth prospects in the Energy sector Pages 19~21 6. Real Estate & Other Investments Pages Group financials & Shareholder information Pages 23~30 9eld0029 4
5 Key milestones in the ELLAKTOR Group history ELTECH ANEMOS has been listed in the Main Market of the Athens Stock Exchange since 22/07/2014 Backlog 50% domestic-50% international Restructuring of Olympia Odos and Aegean Motorways European Goldfields ( EGU ) absorbed by Eldorado Gold ( ELD ) (21st February 2012) Sale of a 7.07% stake in EGU to Qatar Holding (Oct.2011) 2011 Final EIS (Environmental Impact Study) of HELLAS GOLD approved by the Ministry of Environment & Climate Change, on 26th of July 2011 HELECTOR SA - AKTOR SA - AKTOR CONCESSIONS SA has signed contract for the project Construction and Operation of the Household Waste Management System in Saint Petersburg 2008 Change of name from ELLINIKI TECHNODOMIKI TEB SA to ELLAKTOR SA Commencement of MOREAS, OLYMPIA ODOS and AEGEAN MOTORWAY concessions Swapped a 30% stake in HELLAS GOLD with a 20% stake in EUROREAN GOLDFIELDS 2007 Concession activities spun off as AKTOR CONCESSIONS Acquisition of PANTECHNIKI, leading to controlling stake in ATTIKI ODOS (59.2%) Participation in 3 out of 5 concession projects awarded in Greece s & 1960 s First international construction contracts awarded in Balkans and the Middle East Acquisition of a stake in HELLAS GOLD Entry in the Waste Management sector (HELECTOR) Merger of TEB, ELLINIKI TECHNODOMIKI and AKTOR Concession for ATTIKI ODOS and RION-ANTIRION Bridge signed Establishment of TEB, ELLINIKI TECHNODOMIKI and AKTOR 9eld0029 5


 (1) As of 29 th of May 2015 9eld0029 6")
6 Ellaktor Group organisational structure Construction Concessions Waste management Energy Real estate Other holdings 100% AKTOR SA 100% AKTOR CONCESSIONS 95% HELECTOR SA 64.50% ELLINIKI TECHNODOMIKI ANEMOS 21.95% ELPEDISON POWER & ENERGY 55.46% REDS 15.3% HELLENIC CASINO OF PARNITHA No 1 in Greece No 1 in Greece Leader in Greece & Cyprus Significant growth prospects 4,906 full time employees with activities in more than 20 countries Listed on the ASE with a market capitalization of ~ 300 ml (1) (1) As of 29 th of May eld Ellaktor is the leading, diversified, regional infrastructure player
")


7 Ellaktor Group key financials & 1 st Q2015 (Amounts in ml) Revenues Reported EBIT (1) M 14 3M 15 Reported Profit Before Tax Reported Net profit after Minorities Notes : 2013 figures adjusted for the implementation of IFRS11 Joint Arrangements 9eld (1) Operating Profit (EBIT) of: 1Q 2015 includes a 12.4 ml impairment of mining assets 2014 includes a 54.2 ml impairment of mining assets and a 11.5 ml non recurring other income from a concession project 2013 includes real estate valuation adjustments of 41.9 ml and provisions from the RES New Deal and the RES tax levy of 11.9 ml 2012 includes profit from the sale of Eldorado shares of 19 ml and provisions for doubtful receivables of 13 ml 2011 includes profit from the sale of a 7.07% stake in EGU to Qatar Holdings and from reclassifying the remaining participation in EGU and Hellas Gold as financial assets available for sale, provisions for doubtful receivables and adjustments for revised profitability of construction backlog
8 Ellaktor Group key financials & 1 st Q2015(continued) (Amounts in ml) Total assets Total equity /3/ /3/2015 Net debt Corporate net debt (1) /3/ /3/2015 Notes : figures adjusted for the implementation of IFRS11 Joint Arrangements (1) Excluding debt and cash / cash equivalents and liquid assets of non recourse BOT related projects 9eld0029 8
, is the undisputed market leader in Greece with unmatched technical")


9 Construction segment overview 60 years in construction AKTOR SA, (a 100% subsidiary), is the undisputed market leader in Greece with unmatched technical know-how Emphasis on building our international backlog also due to the current Greek sovereign debt crisis ~ 54% of backlog is international (mostly Middle East and Europe) Key priorities Stabilizing operating margins Accelerate backlog execution Construction on the restructured BOT concession projects is progressing with a view to complete them by end of 2015 / beginning of 2016 OTHER Revenues include all Groups activities 1 st Q2015 Construction revenues : ml FY2014 Construction revenues : 1,170.9 ml 9eld0029 9

10 Construction backlog at 3.8bn as of with another ~ 485ml of projects that remain to be signed Backlog Analysis by sector ( ml) Backlog by geography Infrastructure Projects Greece 109 Private Projects Greece International Projects Total Backlog , , Backlog Evolution ( ml) 4,245 3,882 3,172 3, , ,332 4, stQ2015 Backlog Blue City To be signed 9eld
11 Construction Backlog : Selective projects Key current Greek projects Key current International projects Project Participation Amount (%) ( ml) Project Participation Amount (%) ( ml) Thessaloniki's Metro-Extension to Kalamaria 100% 352 Railway line Micasasa-CoslariuSimeria,Sect Brasov-Simeria (RO) 51% 39 Infrastructure Projects Structure and Technical works in Chalikidi Mines 100% 74 Construction of Gold Minerals plant in Chalkidiki 100% 118 ERGOSE :Railway line Rododafni-Psathopyrgos,Panagopoula'sTunnel 66.09% 116 ERGOSE :Remaining Works - Railway line Tithorea Domokos 33.33% 95 ERGOSE Project: Lianokladi - Domokos 100% 2 Egnatia Highway: Koromilia -Krystalopigi (Kozani) 60% 32 HYDRO Metsovitiko 100% 21 Construction 2nd phase of Thriasio Complex 65% 18 Igoumentitsa s Port 100% 29 New Port in Patras 100% 8 EYDAP : Psittaleia STP: Operation and Maintenance 70% 78 Europe Design & Build of National Road 18 Baia (RO) 100% 28 Highway E80, LOT2 Road& Bridges at Stanicenje (SR) 100% 48 Highway E80 Section Crvena Reca-Ciflic (SR) 100% 5 Highway Ε80, LOT2 Bancarevo, Crvena Reca (SR) 50% 23 Integrated System of Municipal Waste Facilities for Sofia Municipality (BG) 40% 19 Hydroelectric projects in Albania (ALB) 100% 9 Highway LOT4 Struma (BG) 100% 17 Highway Demir Kapija Smokvica (FYROM) 100% 93 Waste processing plant in Saint Petersburg (RU) 30% 48 Distribution networks PPC 100% 1 Mostar wastewater Treatment Plant (BiH) 100% 7 Aposelemi Dam : Diversion works 100% 6 Wastewater Treatment Plant Bacau (RO) 100% 2 Building Projects BOT Hania Airport : Extension-Plants 100% 28 Chalkida General Hospital 75% 22 Gerakina Beach Hotel 100% 5 Lefkada General Hospital 75% 11 National Gallery 100% 16 Airport Expansion Building in Ioannina 100% 6 National Museum of modern art 100% 1 Korinthos -Tripoli - Kalamata (Moreas) 71.67% 41 Elefsina - Patra - Tsakona (Olympia) 17% 221 Maliakos - Kleidi (Aegean) 19.3% 65 Gulf Region & Other countries Design & Build of Highway Sebes Turda, LOT 2 (RO) 51% 63 Gold Line Underground in Doha (Qatar) 32% 1,227 Development of Internal Security Force Camp at Al Duhail (Qatar) Facility Management Services at New Doha International Airport (NDIA) (Qatar) 50% % 43 Back Up Approach and Training Centre at New Doha International Airport (Qatar) 40% 13 Kaliti Wastewater Treatment Plant-Civil & E/M Works - Design Supply & Build (Aith) 100% 28 9eld
 Participates in the three (Moreas, Olympia Odos and Aegean Motorway) out of the five major concession projects under construction in Greece.")

12 Concessions segment overview AKTOR CONCESSIONS S.A., a 100% subsidiary of ELLAKTOR, is the largest concession holder in Greece Holds mature assets (59.2% in Attiki Odos and 22.0% in Rion-Antirrion Bridge) Participates in the three (Moreas, Olympia Odos and Aegean Motorway) out of the five major concession projects under construction in Greece. The last two have been successfully restructured in December 2013, after more than two-years long discussions, following the reduction in traffic all over Greece due to the macroeconomic crisis of the country. The restructuring involved, among others, an increase in the State s contribution using EEC funds, a reduction in the scope of the project in the case of Olympia Odos and a resolution of all long pending matters. Moreas is concluding agreement with the Greek State for Additional Operating Subsidy of 330 million euros which will guarantee Debt Service payment. Participates in concessions of 4,940 parking spaces and in operation of another 1,230 spaces. Selectively pursuing new opportunities with strategic partners, integrating necessary skills and expertise for successful project delivery and carefully managing its investment exposure. Current tenders include: international concession projects: Romanian motorway BOTs in a consortium with Vinci & Strabag (Preferred Bidder in Comarnic-Brasov Motorway) Albania motorway BOT (Milot-Morine) in a consortium with Egis. Greek Privatization Program opportunities and the new Kasteli Airport PPP in partnership with Vinci Airports. Greek PPPs, primarily focusing on waste management together with HELECTOR (preferred bidder for the Western Macedonia waste PPP, prequalified for the Eastern Macedonia-Thrace waste PPP). 12
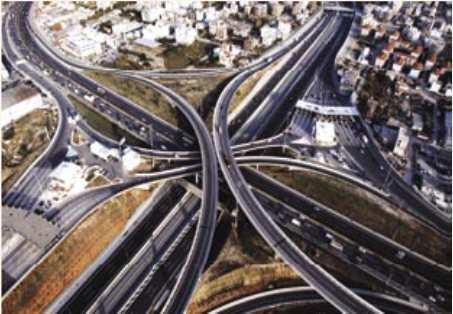
13 Overview of ELLAKTOR s Concession portfolio Ioannina Gefyra Igoumenitsa (Rion Antirrion Bridge) In operation since bn contract price 22% stake Olympia Odos (Athens Corinth - Patra Highway) Under construction (completed 61.3%) 1.34bn contract price after restructuring 17% stake Larissa Trikala Karditsa Lamia Aegio Patra Korinthos Tripoli Sparta Kalamata Athens Aegean Motorway (Maliakos Klidi Highway) Under construction (86.5% completed ) 1.01bn contract price 20% stake Attiki Odos (Athens Ring Road) In operation since bn contract price 59% stake Moreas (Korinthos Tripoli Kalamata Highway) Under construction (92.80% completed) 0.85bn contract price 72% stake 9eld

 2.7ml (provisional) 2004 GEFYRA LEITOURGIA: 23.1% Note: (1) 8.")
14 Operating Concessions assets Low risk mature assets with high expected dividend streams Type of concession AKTOR Concessions (%) Total length Commencement of operation End of concession Toll ring road in Athens 59.2% 65.2Km March 2001 September 2024 Toll bridge 22.0% 2.3Km (1) August 2004 December 2039 Total investment 1,310ml 839ml Average daily traffic (2014) 2014 revenue 2014 net profit First Net Profit Year Operator ~196,996 vehicles 159.7ml 38.9ml 2012 ATTIKES DIADROMES: 47.4% ~8,396 vehicles 32.3ml (provisional) 2.7ml (provisional) 2004 GEFYRA LEITOURGIA: 23.1% Note: (1) 8.2 Km total length, which includes access bridges, toll plaza and the connections with the national roads network 9eld
 Motorway Korinthos-Tripoli-Kalamata & Sparti-Lefktro 71.67% Motorway Maliakos - Kleidi 20.00% Motorway Elefsina -Korinthos-Patra (Pyrgos Tsakona) 17.")

15 Concessions under Construction The Aegean Motorway and the Olympia Odos projects have been restructured, with the new construction schedule extended up to the end of Type of concession AKTOR Concessions (%) Motorway Korinthos-Tripoli-Kalamata & Sparti-Lefktro 71.67% Motorway Maliakos - Kleidi 20.00% Motorway Elefsina -Korinthos-Patra (Pyrgos Tsakona) 17.00% Other Shareholdings 15.00% J&P-Avax 13.33% Intracom 35.00% Hochtief 13.75% Vinci 16.25% J&P-Avax 10.00% Aegek 5.00% Athina 29.90% Vinci 17.00% Hochtief 17.00% J&P-Avax 17.00% Gek Terna 2.10% Athina Total length 205 Km 230 Km 201 Km Commencement of operation March 2008 March 2008 August 2008 Restructured Dec Dec Duration of concession 30 Years 30 Years 30 Years Total investment 1.0bn 1.6bn 2.1bn Average daily traffic (2014) ~40,406 vehicles ~55,257 vehicles ~88,728 vehicles Operator The Concessionaire The Concessionaire OLYMPIA ODOS LEITOURGIA (shareholdings as in concession company) 9eld

16 Overview of Waste Management Services ( HELECTOR ) HELECTOR SA, a 94.4% subsidiary of the ELLAKTOR Group, is the market leader in Waste Management and Waste-to-Energy sectors in Greece and Cyprus while at the same time dynamically expanding abroad extensive know-how in designing, developing, operating and maintaining integrated waste management facilities, landfills, incinerators and sorting plants own worldwide patented technologies for Mechanical Biological Treatment (MBT) Operating the largest landfill biogas facility in Europe (25MW) Total HELECTOR backlog: Exceeding 189 ml Recurring operational revenue : ~ 62 m p.a. 9eld Significant prospects in Greece a number of Concession / PPP projects in Greece are in tender stage / expected to be tendered already announced Contractor for the W. Macedonia PPP project (1st Waste Management PPP project to be tendered) Significant prospects internationally executing a project in Bulgaria (one of the biggest projects in Europe at the moment - capacity 410kt / a), two projects in Croatia (WM plants & residual landfill), one in Slovenia (WM plant), one in Germany (anaerobic & aerobic digestion) and one in Jordan (landfill rehabilitation & biogas exploitation) while recently awarded a project in Romania more prospects expected in Cyprus (recently awarded a landfill biogas project in Limassol)
 % of BMW (1) land-filled in 2007 vs 1995 Promising potential in Greece from a move towards waste treatment (vs.")
17 Overview of the Waste Management market... the Greek market has better growth prospects compared to its EU peers 200.0% 175.0% 150.0% 125.0% 100.0% 75.0% 50.0% 25.0% 0.0% EU Municipal Waste Treatment, 2007 (% of total waste) % of BMW (1) land-filled in 2007 vs 1995 Promising potential in Greece from a move towards waste treatment (vs. landfill disposal) and power generation from biogas Concession / PPP pipeline WM projects in Greece includes W. Macedonia - 120k tons p.a. (Announced Contractor) Aitoloakarnania 110k tons p.a.(cd phase) Patras 150k tons p.a. (CD phase) E. Macedonia - Thrace 155k tons p.a. (CD completed) Thessaloniki 400k tons p.a. (Tender Pending) Attica Expecting new planning to be announced On a regional basis, market prospects are also promising given low market penetration in South Eastern Europe and the Balkans, where HELECTOR is already making inroads (Bulgaria, Slovenia, Croatia, Serbia, Skopje, Russia, Lithuania) while also targeting the Turkish market (1) Biodegradable Municipal Waste Source: Eurostat eld PQ Prequalification CD Competitive Dialogue PB = Preferred Bidder
18 Current Waste Management Portfolio Project type Landfill & Leachate Treatment plants Construction & Management Mechanical Biological Plants Description Location Country Capacity Ownership Status Comments Construction of Landfill Ano Liossia, Attica Greece 2,000 kt/y n/a Restoration - Construction of Landfill Fyli, Attica Greece 2,500 kt/y n/a Under construction - Construction of Landfill Tagarades, Salonica Greece 720 kt/y n/a Restoration - Construction of Landfill Mavrorachi, Salonica Greece 540 kt/y n/a Operation - Construction of Landfill Livadia Greece 50 kt/y n/a Under construction - Construction of Landfill Thiva Greece 70 kt/y n/a Under construction - Construction of Landfill Limnos Greece 40 kt/y n/a Operation - Management of Landfill Pafos Cyprus 70 kt/y 100% Operation 10-year concession since 2005 Management of Landfill Larnaka Cyprus 50 kt/y 100% Operation 10-year concession since 2010 Management of leachate treatment plant Fyli& A. Liossia Greece 750 m 3 /day 100% Operation 6 years operation contract Management of leachate treatment plant Pafos Cyprus 230 m 3 /day 100% Operation 6 years operation contract Herhof Recycling Osnabrueck Osnabrueck Germany 105 kt/y 100% Operation 17-year concession since 2006 Berlin MBT Berlin Germany 180 kt/y n/a Operation Turnkey for third party Trier MBT Trier Germany 180 kt/y n/a Operation Turnkey for third party Larnaka MBT Larnaka Cyprus 220 kt/y 100% Operation 10-year concession since 2010 A. Liossia Recycling & Compost Plant Attica Greece 300 kt/y 70% Contract signed 3+3 -year operation contract Anaerobic Digestion Plants Schloßvippach, Kessel, Ulzen, Dorpen Germany Total 89 kt/y n/a Operation Kassel& Ulzen under expansion Sofia MBT Sofia Bulgaria 410 kt/y n/a Under construction Turnkey for Sofia Municipality Croatia MBT Plants Mariscina & Kastijun Croatia Total 190 kt/y n/a Contract signed Turnkey for third party Hospital Waste Mgt Plants Recycling Plants Waste to Energy Plants Wind Energy Apotefrotiras (Hospital Waste Incinarator) Ano Liossia, Attica Greece 12 kt/y 70% (a) Operation 9-year concession since 2007 Fyli Recycling Plant Fyli, Attica Greece 100 kt/y n/a Operation Private Investment Koropi Recycling Plant Koropi, Attica Greece 75 kt/y n/a Operation Private Investment BEAL : Landfill biogas-fired plant (b) Ano Liossia, Attica Greece 23.5 MW 50%(c) Operation 20-year PPA since 2004 Tagarades : Landfill biogas-fired plant Tagarades, Salonica Greece 5.0 MW 100% Operation 20-year PPA since 2007 Fyli : Landfill biogas-fired plant Fyli, Attica Greece 10 MW 100% Production license Awarded in 2009 Jordan : Landfill biogas-fired plant Amman Jordan Up to 6 MW 100% Contract signed Turnkey for third party + 5y operation Aeiforiki Dodekanisou Rhodes, Kos, Patmos Greece 7.8 MW 99.5% Operation 20-year PPA since eld Note: (a) Remaining 20% controlled by Arsi SA; 10% by Polyeco (b) Largest in Europe (c) Remaining 50% controlled by EDL
 vs only 1.810 MW installed by end of 2013.")
19 Renewables segment ( ELTECH Anemos ) Regulatory framework RES must cover 20% of gross energy consumption & 40% of electricity by High growth perspectives indicated by 2020 target wind power capacity in (7.500 MW) vs only MW installed by end of PPA duration of 27 years for operating projects before 01/01/2014 and 20 years for all new projects thereafter. Favourable, stable tariffs for the entire PPA period ( /ΜWh, depending on magnitude and grid particularities). Significant improvement in liquidity issues of Market Operator (LAGIE) since the New Deal (Law 4254/14). Delays in payments reduced from 9 to 3 months, expected to be completely eliminated within ELLAKTOR entered the renewable energy sector in 2000 through its subsidiary ELTECH Anemos. ELTECH Anemos was listed in the Main Market of the Athens Stock Exchange on 22/07/2014. Target technology remains wind energy. Open to other RES technologies, depending on opportunities. Base market remains Greece. Total installed capacity of 171 MW, comprising: 12 Wind farms : 164 MW 1 PV : 2 MW 1 small hydro : 5 MW Current status of further Wind Farm deployment: Commissioned W/T erected Under construction : 20,7 MW : 16,1 MW : 56,7 MW Long term ( ) average wind farm capacity factors of 26.5% vs. 25.3% of Greek market (based on LAGIE/DEDDIE database). Average portfolio age of 4.5 yrs (as of 31/12/2014). In house development, design, management of construction & supervision of operation. Outsourcing of O&M to turbine manufacturers. 9eld
20 Eltech Anemos RES assets overview and key economics Wind Farm Key Economics RES projects by Geography CAPEX / MW ca m Equity 25 40% of capex Cash grants 20%-40% of capex Tariffs : Interconnected /MWh Non interconnected /ΜWh EBITDA margins ca. 70% (MW) Overview of ELTECH Anemos RES portfolio (1) 775 MW Pipeline Wind (Operating) Application Production licence Environmental terms Under Construction Operating Wind (Under Construction) Application months 12 months Production licence months Environmental Terms Approval Note (1): The 775MW Pipeline include 36MW non-wind projects. Construction months Operating RES (Pipeline) Small-hydro (operating) Solar PV (operating) 6.3 9eld

21 ELLAKTOR also has a ~ 22% stake in Elpedison Power & Elpedison Energy Ellaktor is present in the thermal electricity generation sector through Elpedison Power, the 2 nd largest electricity producer in Greece, as well as the supply of electricity to final consumers through Elpedison Energy. HE&D owns a 22.74% stake of Elpedison Power and Elpedison Energy, set up together with the Hellenic Petroleum/Edison Joint Venture (75.78%) and Halcor (1.48%) Elpedison Power, aims at enhancing its generation portfolio and remain a key player in the Greek electricity market: 1 gas-fired 390MW CCGT in operation in Thessaloniki 1 gas-fired 420MW CCGT in operation in Thisvi Enhancement of its portfolio through acquisition of electricity generation assets expected to be privatized Further power generation opportunities considered in Greece and the Balkans Elpedison Energy aims at continuing a healthy growth and maintaining its leading role in the alternative electricity suppliers market ELLAKTOR HE&D HE&D and Halcor jointly have the institutional minority rights INTRACOM 96.57% 3.43% 24.22% ELPEDISON POWER: Halcor HELLENIC PETROLEUM Elpedison 75.78% - Thessaloniki Power (390MW) - Thisvi Power (420MW) - Other Assets/Activities ELPEDISON ENERGY: - Electricity supply - Cross-border trading EDISON 50% 50% 9eld
22 Real Estate REDS ELLAKTOR holds a 55.46% stake in R.E.D.S. SA Listed on ASE with a market cap : 24 ml (29/5/2015) REDS enjoys a high quality Property portfolio (~ 118 ml, Book Value at 31/03/2015) Smart Park is operational as of 20/10/2011 Signed leases 100% of GLA with N.O.I. 5.5 ml (2014) 10 years term investment facility in place Kantza Mall Project : Town Planning file is being proceed by the Ministry of Town Planning & Environment after the ending of the public discussion procedure by the local Municipality. GBA 95,000m 2. Urban Planning Approval (PUZ) for Unirii Project in Bucharest, Romania is in place. GBA 32,000m 2. Claim damages appeal against Bucharest Municipality is running. Expropriation claim for 4.7 million has been provided by a final court decision against the Pallini Municipality and relevant payment is imminent. Other Investments ELLAKTOR holds 1.1% in ELDORADO GOLD ( ELD *) 95% owner of Hellas Gold 5% of HELLAS GOLD *ELD is listed on Toronto and NYSE, with ~4.3bn CAD$ (~3.2 bn ) market cap (29/5/2015) MONT PARNES CASINO ELLAKTOR holds an indirect 15.3% stake in Hellenic Casino Parnitha Non-core asset Initial investment : 33 ml Dividends received to date : 23.7ml Other shareholders - Regency Entertainment : 35.7% - Greek State: 49.0% Revamping of facilities is underway Tables: 61 (of which 11 in VIP area) slot machines: ~660 ELLAKTOR 30% GOLD ATHENS RESORT CASINO AE 51% REGENCY ENTERTAINMENT 70% 49% ATHENS MONT PARNES CASINO AE 2014 Key financials revenues: 93.3ml profit after tax: 2.5ml GREEK STATE 9eld
23 Consolidated P&L 1 st Q2015 (IFRS in ml) (Amounts in ml) 31/3/ /3/2015 Change (%) Revenues % EBITDA % EBITDA margin (%) 19.1% 11.2% EBIT % EBIT margin (%) 10.2% 4.3% Profits/ (Loss) from Associates Profit/ (Loss) before Tax Profit Before Tax margin (%) 4.5% -2.4% Revenues increased by 29.2 % to ml mainly due to increased revenues in Construction ( 82 ml) Operating profit (EBIT) amounted to 16.1 ml but includes a 12.4 ml impairment charge from mining assets classified as financial assets available for sale EBIT adjusted for the above item amounted to 28.5 ml After tax and minorities the group reported losses of 16.7 ml vs profit of 1.7 ml in 1Q 2014 negatively impacted by the valuation impairment Profit/ (Loss) after Tax before Minorities Net Profit/ (loss) after Minorities Earnings/ (Loss) per share (1) Notes : (1) Weighted average number of shares : 172,431,279 (1Q 2014 and 1Q 2015) 9eld
24 Consolidated Balance Sheet (IFRS in ml) (Amounts in ml) 31/12/ /3/2015 Change (%) Intangible assets 1, % Property, plant and equipment % Financial assets available for sale (1) % Financial assets held to maturity (1) % Receivables (2) 1, , % Other non-current assets % Other current assets % Cash (incl. restricted cash) % Total Assets 4, , % Total Debt 1, , % Other Short Term Liabilities % Other Long Term Liabilities % Total Liabilities 3, , % Shareholders Equity 1, , % Tangible assets increased from ml to ml mostly as a result of capex for construction equipment Financial assets held to maturity increased from 79.1 ml to ml (investment in high investment grade bonds) Financial Assets Available for Sale amounted to 88.3 ml and include, apart from mining assets, mutual funds of 9.5 ml Total receivables (short-term and long-term) excluding deposits over 3 months increased from 1,192.7 ml to 1,341.3 ml mostly because of increased trade receivables and work in progress receivables Cash (including restricted cash) reduced by 241 ml to ml as a result of increased working capital requirements and debt repayments Shareholders Equity (excluding minorities) % 9eld
25 Consolidated Cash Flows (IFRS in ml) (Amounts in ml) 31/3/ /3/2015 Cash Flows from Operating Activities Cash Flows from Investment Activities Cash Flows form Financing Activities Net increase / (decrease) in cash and cash equivalent Cash equivalents at start of period Cash equivalents at end of period (1) Operating cash outflows of 75.0 ml vs 21.8 ml (in 1Q 2014) mainly because of increased working capital requirements in construction Net Cash outflows from investment activities amounted to 73.6 ml and include: - capex of ~ 24 ml Construction: ~ 17 ml Concessions : ~ 5 ml (Moreas) Wind Farms: ~ 1 ml Environment: ~ 1 ml - outflow of ~ 60 ml for investments in bonds (held to maturity) and mutual funds (classified as financial assets available for sale) Cash outflows from financing activities amounted to outflows of 83.0 ml - mainly repayment of loans Notes : (1) Does not Include restricted cash (31/12/2014: 72.4 ml and 31/3/2015: 63.3 ml), time deposits over 3 months (31/12/2014 : 0.5 ml and 31/3/2015 : 0.5 ml), bonds held to maturity (31/12/2014: 79.1 ml and 31/3/2015 : ml) and Mutual Funds (31/12/2014 : 0 ml and 31/3/2015 : 9.5 ml) 9eld
26 Segmental analysis of 1 st Q 2015 Results (IFRS in ml) (Amounts in ml) Construction & Quarries Real Estate Concessions Environment Wind Farms Other Total Revenues EBITDA EBITDA margin (%) -1.9% 55.5% 61.9% 22.9% 77.1% nm 11.2% EBIT EBIT margin (%) -3.8% 35.8% 25.8% 18.7% 61.9% nm 4.3% Profit before Tax Profit before Tax margin (%) -4.8% -0.5% -1.7% 17.5% 44.8% nm -2.4% Net Profit (before minorities) Net Profit margin (before minorities) (%) -5.2% 2.6% -1.1% 12.8% 36.6% nm -3.3% Net Profit (after minorities) eld
27 Segmental analysis of 1 st Q 2014 Results (IFRS in ml) (Amounts in ml) Construction & Quarries Real Estate Concessions Environment Wind Farms Other Total Revenues EBITDA EBITDA margin (%) 4.5% 41.1% 70.1% 23.6% 65.8% nm 19.1% EBIT EBIT margin (%) 2.1% 22.1% 34.3% 19.1% 40.6% nm 10.2% Profit before Tax Profit before Tax margin (%) 1.2% -16.8% 16.6% 18.3% 15.3% nm 4.5% Net Profit (before minorities) Net Profit margin (before minorities) (%) 0.3% -16.8% 11.7% 13.3% 13.1% nm 2.5% Net Profit (after minorities) eld
28 Segmental analysis of FY2014 Results (IFRS in ml) (Amounts in ml) Construction & Quarries Real Estate Concessions Environment Wind Farms Other Total Revenues 1, ,544.5 EBITDA EBITDA margin (%) -0.8% 19.1% 65.9% 16.1% 64.5% nm 10.5% EBIT EBIT margin (%) -2.7% -0.3% 32.3% 12.1% 41.2% nm 3.7% Profit before Tax Profit before Tax margin (%) -3.4% -38.8% 15.5% 11.8% 16.8% nm -0.7% Net Profit (before minorities) Net Profit margin (before minorities) (%) -3.9% -22.7% 10.2% 7.9% 11.2% nm -2.2% Net Profit (after minorities) eld
 650.1 Non recourse related Cash & Liquid Assets 358.6 Corporate related Cash 291.")
 Includes Cash, Restricted Cash, Time deposits over 3 months, bonds held to maturity (2) Total equity + net debt Source: Company financial statements Notes : (1) Corporate related Net Debt =")
29 Ellaktor s debt profile ( ml, as of ) Ellaktor s key debt statistics Debt maturity profile + + = - = + - = Long-term debt: 1,205.3 Short-term debt: Total debt: 1,473.3 Non Recourse Debt Corporate related Debt Cash & Liquid Assets (1) Non recourse related Cash & Liquid Assets Corporate related Cash Corporate related Net Debt (1) / Gearing ratio (2) Corporate related Net debt : Shareholder s equity: 1,098.8 Total capital (2): 1,629.1 Capital leverage ratio: 32.6% (1) Includes Cash, Restricted Cash, Time deposits over 3 months, bonds held to maturity (2) Total equity + net debt Source: Company financial statements Notes : (1) Corporate related Net Debt = (Short and Long Term Debt excluding BOT related Debt) [Cash and Liquid Assets (i.e. Cash & Cash Equivalents, Restricted Cash, Time deposits over 3 months under receivables, bonds held to maturity, mutual funds) but excluding Cash and Liquid Assets of BOT related projects) (2) Gearing ratio = Corporate related Net Debt / (Equity + Corporate Related Net Debt) 9eld
 -70,00 Reuters ticker:")
30 Share price performance and shareholder structure Shareholder structure (May 2015) Share price performance LTM (30/5/2014 ~ 29/05/2015) Treasury 2,58% 50,00 Retail 29,19% Management Team 34,14% 30,00 10,00-10,00 CONSTRUCTION ATHEX ELLAKTOR Greek Institutional Investors 7,48% Foreign Institutional Investors 26,61% -30,00-50,00 ELLAKTOR share weighting on Indices (29/05/2015) -70,00 Reuters ticker: HELr.AT Bloomberg ticker: ELLAKTOR:GA 9eld
31 Contact details Anastassios Kallitsantsis Chairman of the Board of Directors Stergios Pitoskas Investor Relations Antony Hadjioannou Treasurer ELLAKTOR S.A. 25, Ermou St., GR Nea Kifissia, Greece Athens TEL.: FAX : info@ellaktor.com website: 9eld
Group Presentation. December 2014
 Group Presentation December 2014 Recent Developments / 9M2014 Financial Highlights Acceleration of construction backlog execution in the 3 rd Quarter 2014 resulted in increased Group revenues of 1,080.5
Group Presentation. December 2013
 Group Presentation December 2013 Recent Developments / 9M2013 Financial Highlights The agreements for the re-initiation of the suspended BOT projects of Argean Motorways and Olympia Odos have been submitted
Group Presentation. April 2014
 Group Presentation April 2014 Recent Developments / 2013 Financial Highlights The restructuring of the suspended BOT projects was successfully completed in December 2013 - the agreements were ratified
Group Presentation. April 2013
 Group Presentation April 2013 Recent Developments / FY2012 Financial Highlights 9eld0029 2 In the current difficult economic environment, group results are stabilising : Group revenues increased by 2.4%
Group Presentation. November 2012
 Group Presentation November 2012 Recent Developments / 9M2012 Financial Highlights 9M2012 financial highlights Group revenues in 9M 2012 reached 869.9 ml, decreased by 10.1% mainly as a result of lower
Group Presentation. September 2012
 Group Presentation September 2012 Recent Developments / 6M2012 Financial Highlights 6M2012 financial highlights Group revenues reached 596.5 ml, decreased by 14.1% mainly as a result of lower revenues
Group Presentation. August 2009
 Group Presentation August 2009 TABLE OF CONTENTS 1. Group overview 2. Undisputed leader in the Greek construction sector 3. Leading player in Greek concessions 4. Waste Management Services 5. Significant
Group Presentation. October 2007
 Group Presentation October 2007 DIVERSIFIED PORTFOLIO OF BUSINESSES, BALANCED MIX WITH MATURE CASH GENERATING BUSINESSES AND HIGH GROWTH, HIGH RETURN BUSINESSSES STRATEGIC INVESTMENTS FINANCIAL INVESTMENTS
1H 2015 Group Results 31/8/2015
 1H 2015 Group Results 31/8/2015 1H 2015 highlights Increased macroeconomic and political uncertainty negatively affected the group s 6M2015 results and are likely to affect its prospects for 2015 extended
6M2017 Group Results 14/9/2017
 6M2017 Group Results 14/9/2017 6M2017 highlights 6M2017 Highlights : in August 2017 construction at Olympia Odos and Maliakos was concluded, and the BOT projects are now fully operational in June 2017
ANNUAL FINANCIAL REPORT
 ANNUAL FINANCIAL REPORT for the financial year January 1 st to December 31 st 2009 (according to the article 4 of the L.3556/2007 and the article 2 of the decision 7/448/11.10.2007 of the Hellenic Capital
INTERIM FINANCIAL REPORT
 INTERIM FINANCIAL REPORT For the period from 1 January to 30 June 2012 (pursuant to article 5 of Law 3556/2007 and article 4 of Decision 7/448/11.10.2007 of the Capital Market Commission BoD) 25 ERMOU
HELECTOR GROUP. Annual Financial Statements in line with the International Financial Reporting Standards for the year ended 31 December 2013
 HELECTOR GROUP Annual Financial Statements in line with the International Financial Reporting Standards for the year ended 31 December 2013 ENERGY & ENVIRONMENTAL APPLICATIONS 25 ERMOU STR. - 145 64 KIFISSIA
INTERIM FINANCIAL REPORT
 INTERIM FINANCIAL REPORT For the period from 1 January to 30 June 2015 (pursuant to article 5 of Law 3556/2007 and article 4 of Decision 7/448/11.10.2007 of the Capital Market Commission BoD) ELLAKTOR
Annual Financial Statements in line with the International Financial Reporting Standards for the year ended 31 December 2012
 HELECTOR ΟΜΙΛΟΣ ΗΛΕΚΤΩΡ GROUP Annual Financial Statements in line with the International Financial Reporting HELECTOR S.A. ENERGY & ENVIRONMENTAL APPLICATIONS 25 ERMOU STR. - 145 64 KIFISSIA Tax ID No.:
ANNUAL FINANCIAL REPORT
 ANNUAL FINANCIAL REPORT For the fiscal year from 1 January to 31 December 2015 (pursuant to article 4 of Law 3556/2007 and article 2 of the Decision 7/448/11.10.2007 of the Capital Market Commission s
ANNUAL FINANCIAL REPORT for the financial year January 1 st to December 31 st 2008
 ANNUAL FINANCIAL REPORT for the financial year January 1 st to December 31 st 2008 (according to the article 4 of the L.3556/2007 and the article 2 of the decision 7/448/11.10.2007 of the Hellenic Capital
ΟΜΙΛΟΣ ΗΛΕΚΤΩΡ HELECTOR S.A.
 Board of Directors Annual Report & Statements prepared in accordance with the International Financial Reporting Standards, for the financial year ended 31 December 2016 HELECTOR S.A. ENERGY & ENVIRONMENTAL
ANNUAL FINANCIAL REPORT
 ANNUAL FINANCIAL REPORT For the year from 1 January to 31 December 2012 (pursuant to article 4 of Law 3556/2007 and article 2 of Decision 7/448/11.10.2007 of the Capital Market Commission BoD) ELLAKTOR
SIX-MONTH FINANCIAL REPORT
 SIX-MONTH FINANCIAL REPORT (pursuant to Article 5 of Law 3556/2007) 25 ERMOU ST - 145 64 KIFISSIA Tax Registration No.: 094004914-TAX OFFICE FOR SOCIÉTÉS ANONYMES SA Reg. No: 874/06/Β/86/16 100065 G.E.MI.
MANAGEMENT REPORT OF THE BOARD OF DIRECTORS OF AKTOR SA ON THE FINANCIAL STATEMENTS OF THE YEAR ENDED 31 DECEMBER 2014
 MANAGEMENT REPORT OF THE BOARD OF DIRECTORS OF AKTOR SA ON THE CONSOLIDATED AND SEPARATE FINANCIAL STATEMENTS FOR THE YEAR FROM 1 JANUARY TO 31 DECEMBER 2014 AKTOR SA CONSTRUCTION COMPANY 25 ERMOU STR.
AKTOR SA CONSTRUCTION COMPANY 25 ERMOU STR KIFISIA Tax ID No.: Tax Office: ATHENS FABE SA Reg. No. 8153/01ΑΤ/Β/86/355/05
 MANAGEMENT REPORT OF THE BOARD OF DIRECTORS OF AKTOR SA ON THE CONSOLIDATED AND SEPARATE FINANCIAL STATEMENTS FOR THE YEAR FROM 1 JANUARY TO 31 DECEMBER 2013 AKTOR SA CONSTRUCTION COMPANY 25 ERMOU STR.
GEK TERNA GROUP. Group presentation
 GEK TERNA GROUP Group presentation GEK TERNA Group: Business Divisions Business Divisions Energy Concessions Construction Real Estate Supplementary activities (Industrial Products, Quarries) 2 GEK TERNA
GEK TERNA GROUP. Group presentation
 GEK TERNA GROUP Group presentation GEK TERNA Group: Business Divisions Business Divisions Energy Concessions Construction Real Estate Supplementary activities (Industrial Products, Quarries) 2 GEK TERNA
GEK - TERNA GROUP. Group presentation
 GEK - TERNA GROUP Group presentation GEK - TERNA Group: Overview GEK and TERNA group holds one of the leading positions in Construction, Energy, Real Estate and Concessions, in Greece GEK is the parent
ΟΜΙΛΟΣ ΗΛΕΚΤΩΡ HELECTOR S.A.
 Board of Directors Annual Report & Statements prepared in accordance with the International Financial Reporting Standards, for the financial year ended 31 December 2017 HELECTOR S.A. ENERGY & ENVIRONMENTAL
GEK TERNA GROUP. Group presentation
 GEK TERNA GROUP Group presentation GEK TERNA Group: Business Divisions Business Divisions Energy Concessions Construction Industrial Real Estate 2 GEK TERNA Group: Overview GEK TERNA is the parent company
ANNUAL FINANCIAL REPORT
 ANNUAL FINANCIAL REPORT For the financial year from 1 January to 31 December 2017 (pursuant to article 4 of Law 3556/2007) 25 ERMOU ST - 145 64 KIFISIA Tax Registration No.: 094004914- TAX OFFICE FOR SOCIÉTÉS
Corporate Presentation
 Corporate Presentation Group Structure 100% 38/50/25% * 100% 100% 100% Construction Energy Production* Concessions Real Estate Mining * 38% participation in TE, 50% ownership in the first plant (HERON
Corporate Presentation
 Corporate Presentation Group Structure 100% 40/50/25% * 100% 100% 100% Construction Energy Production* Concessions Real Estate Mining * 40% participation in TE, 50% ownership in the first plant (HERON
FY 2015 Results. March 2016
 FY 215 Results March 216 FY 215 Calendar of Main Events January 15: Refinancing of 43,7 ml bond loan maturing in 217 with favorable terms, lower interest rate and extended to 222. Significant increase
Company presentation. October 2016
 Company presentation October 2016 Disclaimer This presentation contains forward-looking statements. The words "believe", "expect", "anticipate", "intend", "plan, target, aim, will, may, would, could and
2015-H1 Results. August 2015
 215-H1 Results August 215 215-H1 Calendar of Main Events January 15 : Refinancing of 43,7 ml bond loan maturing in 217 with favorable terms, lower interest rate and extended to 222. Significant increase
6m 2017 Results. September 2017
 6m 217 Results September 217 Calendar of main events Energy yield +2,8% increase in energy yield Overall performance 23,1% capacity factor 98,7% weighted average availability IPO (7/214) projects progress
9m 2017 Results. November 2017
 9m 217 Results November 217 Calendar of main events Energy yield +7,5% increase in energy yield Overall performance 24,2% capacity factor 98,8% weighted average availability Wind farm investments 39,6
9m 2018 Results. December 2018
 9m 218 Results December 218 Calendar of main events (1 9/218) Energy yield & performance +22,6% energy yield 26,9% capacity factor 98,7% weighted average availability New capacity 45,9 MW wind farms (17,1
Interim condensed financial information in accordance with International Accounting Standard 34 for the period from 1 January to 30 September 2018
 Interim condensed financial information in accordance with 25 ERMOU ST - 145 64 KIFISIA Tax Registration No: 094004914 ATHENS TAX OFFICE FOR SOCIÉTÉS ANONYMES Société Anonyme Registration No: 874/06/Β/86/16
3m 2018 Results. May 2018
 3m 218 Results May 218 Calendar of main events Energy yield + 3,6% energy yield Overall performance 35,% capacity factor 98,7% weighted average availability New capacity (May 218) 9,9 MW Pefkias W/F TOCs
HALF-YEAR FINANCIAL REPORT
 HALF-YEAR FINANCIAL REPORT For the period from 1 January to 30 June 2018 (In accordance with article 5 of Law 3556/2007) ELLAKTOR S.A. 25 ERMOU ST - 145 64 KIFISIA Tax ID No.: 094004914 - ATHENS TAX OFFICE
Fitter for the Future Strategic Update
 Fitter for the Future Strategic Update 2017-21 Chairman s remarks Global strategic overview Significant market opportunity Basarab Overpass in Bucharest, Romania Naples underground (Toledo Station), Italy
MOURGELAS GREEK LAW UPDATE
 MOURGELAS GREEK LAW UPDATE April 2012 Recently Issued Acts Company Law Modernization of legislation on general, limited and silent partnership companies & joint ventures A full set of provisions aiming
SEMI ANNUAL FINANCIAL REPORT
 SEMI ANNUAL FINANCIAL REPORT For the period January 1 st till June 30 2008 (According to article 5 of L. 3556/2007 and article 4 of the Decision 7/448/11.10.2007 of the BoD of the Capital Market Commission)
Terna Energy. Overweight Previous Rating: Overweight. Expanding RES Portfolio Drives Growth. Euroxx Research Renewable Energy. Company Update Report
 Euroxx Research Renewable Energy Overweight Previous Rating: Overweight Company Update Report Terna Energy Share Price: 2.65 (close of September 16) 12M Price Target: 3.60 Previous Target: 3.90 Expected
Strategic Review Financial Highlights. Business opportunities. Results by business
 March 2004 Strategic Review 2003 Financial Highlights Business opportunities Results by business Conclusions A Construction & Services Market Reference # 1 in Spanish Construction # 1 in Industrial Services
ELLINIKI TECHNODOMIKI TEB GROUP ANNUAL REPORT 2007
 ELLINIKI TECHNODOMIKI TEB GROUP ANNUAL REPORT 2007 Kifissia, June 2008 THIS PAGE IS BLANK ON PURPOSE (1) / (178) TABLE OF CONTENTS COMPANY OVERVIEW...7 1. INFORMATION ON THE COMPILATION OF THE ANNUAL REPORT
Southeast Europe is growing economically and the gas market is expected to grow by bcm by 2025 (60%-80% increase)
") PUBLIC GAS CORPORATION (DEPA) S.A. Business Opportunities with DEPA December er 2010 Harry Sachinis, Chairman & CEO, DEPA S.A. Business Opportunities with DEPA Southeast Europe is growing economically
PUBLIC GAS CORPORATION (DEPA) S.A. Business Opportunities with DEPA December er 2010 Harry Sachinis, Chairman & CEO, DEPA S.A. Business Opportunities with DEPA Southeast Europe is growing economically
EVN Presentation. 4 th HSBC Small/Mid Cap Conference Frankfurt, January 28, 2009
 EVN Presentation 4 th HSBC Small/Mid Cap Conference Frankfurt, January 28, 2009 Company profile fact sheet EVN Business areas Countries Employees Revenue EBITDA EBIT Net results Credit Rating EVN is a
ANNUAL FINANCIAL STATEMENTS. For the financial year from 1 January to 31 December 2017 (TRANSLATED FROM THE GREEK ORIGINAL)
") ANNUAL FINANCIAL STATEMENTS For the financial year from 1 January to 31 December 2017 (TRANSLATED FROM THE GREEK ORIGINAL) A. MANAGEMENT REPORT OF THE BOARD OF DIRECTORS ON THE SEPARATE AND CONSOLIDATED
ANNUAL FINANCIAL STATEMENTS For the financial year from 1 January to 31 December 2017 (TRANSLATED FROM THE GREEK ORIGINAL) A. MANAGEMENT REPORT OF THE BOARD OF DIRECTORS ON THE SEPARATE AND CONSOLIDATED
FY16 Results Presentation
 Muskrat Falls Hydro Plant, Canada FY16 Results Presentation March 14, 2017 Agenda Warsaw subway Line 2, Poland 2016 Highlights Q4 & FY16 results Appendix 2 Fit for the Future our Strategy Plan Sustainable
ATTIKI ODOS SA ATTIKI ODOS SA KM OF ATTIKI ODOS PEANIA Tax ID No.: Ο.Υ.: ATHENS FABE. SA Reg.No /04/B/96/43(02)
") Annual Financial Statements prepared according to the 41.9 KM OF ATTIKI ODOS 190 02 PEANIA Tax ID No.: 094421389.Ο.Υ.: ATHENS FABE SA Reg.No. 35711/04/B/96/43(02) Table of Contents INDEPENDENT CERTIFIED
Annual Financial Statements prepared according to the 41.9 KM OF ATTIKI ODOS 190 02 PEANIA Tax ID No.: 094421389.Ο.Υ.: ATHENS FABE SA Reg.No. 35711/04/B/96/43(02) Table of Contents INDEPENDENT CERTIFIED
EVN Presentation. EEI Conference London, March 16, 2009
 EVN Presentation EEI Conference London, March 16, 2009 EVN s strategy Growth perspectives Financial update and outlook Company profile fact sheet 2007/08 EVN Business areas Countries Employees Revenue
COMPANY PRESENTATION. December 2018
 COMPANY PRESENTATION December 2018 Table of Contents KRI KRI at a glance Strategic Choices Facilities, CapEx, Location Financials Share information 2 KRI KRI at a glance Basic Figures Turnover Kri Kri
J&P Avax. Hefty upside, but no catalysts. Greece, Construction. June 4, 2010
 Greece, Construction J&P Avax Hefty upside, but no catalysts June 4, 2010 Current price 1.45 Target price 5.40 From 6.50 Upside potential 272.4% Remains Outperform Key data Reuters code AVAr.AT Bloomberg
J&P Avax. No catalyst in sight remains cheap. Greece, Construction. April 8, 2010
 Greece, Construction J&P Avax No catalyst in sight remains cheap April 8, 2010 Current price 2.03 Target price 6.50 From 6.40 Upside potential 220.2% Remains Outperform Key data Reuters code AVAr.AT Bloomberg
J&P AVAX S.A. Interim Condensed Financial Reporting
 J&P AVAX S.A. Interim Condensed Financial Reporting From January 1 st, 2011 to June 30th, 2011 J&P AVAX S.A. Company Registry # 14303/06/Β/86/26 16 Amarousiou-Halandriou Street, 151 25, Marousi, Greece
Public Private Partnerships in Greece
 Public Private Partnerships in Greece Nikos Mantzoufas Special Secretary for PPPs 14 th Annual Investor Forum Building a New Greece Capital Link Forum Thursday, November 29, 2012 New York City Hellenic
Condensed interim financial statements in accordance with International Accounting Standard 34 for the period from 1 January to 31 March 2015
 Condensed interim financial statements in accordance with International Accounting Standard 34 for the period from 1 January to 31 March 2015 EL.TECH. ANEMOS SA 25 ERMOU STR. - 145 64 KIFISSIA Tax ID No.:
ANNUAL FINANCIAL REPORT. for the period
 TERNA SOCIETE ANONYME TOURISM TECHNICAL SHIPPING COMPANY 85 Mesogeion Ave., 115 26 Athens General Commerce Reg. No. 8554301000 S.A. Reg. No. 56330/01/Β/04/506(08) ANNUAL FINANCIAL REPORT for the period
J&P AVAX S.A. Interim Financial Report for the period from. January 01 to June 30, 2008
 J&P AVAX S.A. Interim Financial Report for the period from January 01 to June 30, 2008 J&P AVAX S.A. Company Registry # 14303/06/Β/86/26 16 Amarousiou-Halandriou Street, 151 25, Marousi, Greece INDEX OF
ADMIE HOLDING REPORTS 9 MONTH 2018 RESULTS FOR PERIOD January 1 st, 2018 to September 30 th, 2018
 ADMIE HOLDING REPORTS 9 MONTH 2018 RESULTS FOR PERIOD January 1 st, 2018 to September 30 th, 2018 ADMIE Holding: Net Profit 29.2 million, in line with forecast targets Interim dividend 0,0316 per share,
2013 3Q Results Presentation. Athens, 14 November 2013
 2013 3Q Results Presentation Athens, 14 November 2013 CONTENTS Executive Summary Industry Environment Group Results Overview Segmental Performance Financial Results Q&A 1 3Q 2013 GROUP KEY FINANCIALS FY
RESULTS PRESENTATION 1 ST QUARTER 2011
 RESULTS PRESENTATION 1 ST QUARTER 2011 HIGHLIGHTS STRUCTURE AND SEGMENT REPORTING MANAGEMENT ANALYSIS - ECONOMIC AND FINANCIAL ANALYSIS - ANALYSIS BY SEGMENT - CAPEX - NET DEBT APPENDICES HIGHLIGHTS HIGHLIGHTS
H results 2 August 2017
 H1 2017 results 2 August 2017 Delivering the Strategy Plan 2 Sustainable growth Operational discipline Financial strength Major operational milestones met on time Commercial growth continues Revenue geographic
ROADSHOW USA - June 2001
 ROADSHOW USA - June 2001 1 This presentation has been prepared by VINCI for information purposes only. It is based on sources we believe to be reliable but neither its accuracy nor completeness is guaranteed.
EVN Presentation HSBC, Austrian Companies Conference. London, June 16, 2009
 EVN Presentation HSBC, Austrian Companies Conference London, June 16, 2009 Agenda > EVN s strategy > Growth perspectives > Results for the 1 st half-year 2008/09 2 Company profile fact sheet 2007/08 EVN
Astaldi, the BoD approves the quarterly report at September 30, 2006
 Astaldi, the BoD approves the quarterly report at September 30, 2006 Total revenues of 766.6 million Group net profit for the first nine months of 2006 of 22.6 million Total orders backlog of over 8 billion
EVN - Annual Results 2008/09
 EVN - Annual Results 2008/09 Agenda > EVN s strategy > Growth perspectives > Results for 2008/09 2 Company profile fact sheet 2008/09 EVN Business areas Countries Employees Revenue EBITDA EBIT Net results
ATTIKI ODOS SA DIRECTORS REPORT OF THE COMPANY ATTIKI ODOS SA ON THE FINANCIAL STATEMENTS FOR 2009 ATTIKI ODOS SA 41.9 KM OF ATTIKI ODOS PEANIA
 ATTIKI ODOS SA DIRECTORS REPORT OF THE COMPANY ATTIKI ODOS SA ON THE FINANCIAL STATEMENTS FOR 2009 ATTIKI ODOS SA 41.9 KM OF ATTIKI ODOS 190 02 PEANIA Tax ID No.: 094421389 Tax Office: ATHENS FABE SA Reg.No.
Exane BNP Paribas 2005 European Seminar Paris, 9 June Antoine ZACHARIAS, CEO of VINCI Christian LABEYRIE, CFO of VINCI
 Exane BNP Paribas 2005 European Seminar Paris, 9 June 2005 Antoine ZACHARIAS, CEO of VINCI Christian LABEYRIE, CFO of VINCI 4 business lines operating in synergy CONSTRUCTION Project management Building
B U I L D I N G P A R T N E R S H I P S F O R E N E R G Y S E C U R I T Y
 "INOGATE Technical Secretariat & Integrated Programme in support of the Baku Initiative and the Eastern Partnership energy objectives" Project B U I L D I N G P A R T N E R S H I P S F O R E N E R G Y
ASTALDI, NET PROFIT INCREASED BY 16.7% TO EURO 10.2 MLN ORDER BACKLOG OUTREACHES EURO 8.5 BLN
 ASTALDI, NET PROFIT INCREASED BY 16.7% TO EURO 10.2 MLN ORDER BACKLOG OUTREACHES EURO 8.5 BLN Main consolidated data as at March 31, 2008 Total revenues scored Euro 334.1 million, +26.4% on an annual basis
1 Corporate Presentation Bank of Cyprus
 1 Corporate Presentation Bank of Cyprus Athens, 15.07.2009 Disclosure Statement This presentation may contain forward-looking statements about the business, financial condition and prospects of the Company.
SIGNIFICANT DEVELOPMENTS
 COMPANY PRESENTATION October 2006 2 CONTENTS 1. THE COMPANY at a glance 3 2. FINANCIAL HIGHLIGHTS 5 3. SIGNIFICANT DEVELOPMENTS 2004-2006 7 4. PROPERTIES 9 5. CORPORATE STRATEGY & GROWTH PROSPECTS 14 6.
February 10, Astaldi. 4Q 2004 and 2004 Preliminary Results
 Astaldi 4Q 2004 and 2004 Preliminary Results February 10, 2005 1 Main Highlights (Million of euro) 2004 yoy 2006 CAGR 03-06 2004 RESULTS ABOVE 2004-2006 STRATEGIC PLAN TARGETS Order backlog 5,011 13.7%
EVN energy company and environmental services provider. August 2017
 EVN energy company and environmental services provider August 2017 Agenda EVN at a glance Business development (FY 2015/16) Back-up information 2 Integrated business model as basis for our value chain
MARFIN INVESTMENT GROUP FINANCIAL RESULTS: Q1 2015
 MARFIN INVESTMENT GROUP FINANCIAL RESULTS: Q1 2015 Return to profitability at the level of consolidated EBITDA from business operations 1 for the 1st quarter of the year, despite seasonality: 18.6m profit
The world s leading infrastructure developer. April 2012
 The world s leading infrastructure developer Investors Presentation Company profile, strategy and key financials April 2012 Grupo ACS The world s leading infrastructure developer Engineering contractor
9M 2012 IFRS FINANCIAL RESULTS
 9M 2012 IFRS FINANCIAL RESULTS DISCLAIMER These preliminary materials and any accompanying oral presentation (together, the Materials ) have been prepared by Mytilineos Holdings SA (the Company ) and are
REDS Real Estate Development & Services
 ANNUAL FINANCIAL REPORT (pursuant to article 4 of Law 3556/2007 and article 2 of Decision 7/448/11.10.2007 of the Capital Market Commission BoD) REDS REAL ESTATE DEVELOPMENT& SERVICES 25 ERMOU STR. - 145
2012 LONDON STAR Conference. London, 2 3 October 2012
 2012 LONDON STAR Conference London, 2 3 October 2012 1 1 ASTALDI is the largest Contractor in Italy, operating only in large infrastructures at worldwide level Construction RoW 42% ( 4.2Bn) Construction
Group Presentation. May 2018
 Group Presentation May 2018 Disclaimer Some of the information in this presentation contains forward-looking statements within the meaning of securities laws. All forward-looking statements address matters
DIRECTORS REPORT OF THE COMPANY BIOSAR ENERGY SA ON THE FINANCIAL STATEMENTS FOR 2009
 DIRECTORS REPORT OF THE COMPANY BIOSAR ENERGY SA ON THE FINANCIAL STATEMENTS FOR 2009 Dear Shareholders, We hereby present the annual financial statements for the period 1.1.2009 31.12.2009. Breaking down
MARFIN INVESTMENT GROUP FINANCIAL RESULTS: 9M 2014
 MARFIN INVESTMENT GROUP FINANCIAL RESULTS: 9M 2014 86% increase in comparable operating profit (EBITDA) from business operations 1 : 73.9m profit vs. 39.7m in 9M 2013 Comparable consolidated 9M 2014 revenues
IFC - WESTERN BALKANS A PARTNER TO THE WBIF. December 2014
 IFC - WESTERN BALKANS A PARTNER TO THE WBIF December 2014 IFC: A MEMBER OF THE WORLD BANK GROUP IBRD IDA IFC MIGA ICSID International Bank for Reconstructio n and Development International Development
EVN energy company and environmental services provider. January 2018
 EVN energy company and environmental services provider January 2018 Agenda EVN at a glance Business development (FY 2016/17) Back-up information 2 Integrated business model as basis for our value chain
Annual Financial Statements in accordancewith International Financial Reporting Standards for the fiscal year that ended on 31 December 2011
 Annual Financial Statements in accordancewith International Financial Reporting Standards for the fiscal year that ended on 31 December 2011 Contents of Annual Financial Statements Statement of Financial
9M 2013 Results. November 11, 2013
 9M 2013 Results November 11, 2013 1 1 GOALS AND ACHIEVEMENTS FOR 2013 OUR GOALS OUR ACHIEVEMENTS Financial close and start-up of Turkish projects Financial support to domestic projects in order to deliver
ANNUAL ANALYST S PRESENTATION
 ANNUAL ANALYST S PRESENTATION Transforming the Enterprise Athens, May 3 2006 Public Power Corporation S.A. 1 AGENDA What is PPC attractive assets in advantaged market 2005 results year of transition Looking
Interim summary financial reporting in accordance with International Accounting Standard 34 for the period from 1 January to 30 September 2014
 Interim summary financial reporting in accordance with International Accounting Standard 34 for the period from 1 January to 30 September 2014 EL.TECH. ANEMOS SA 25 ERMOU STR. - 145 64 KIFISSIA Tax ID
ADMIE (IPTO) Holding S.A. London Roadshow November 2017
 Holding S.A. London Roadshow November 2017") ADMIE (IPTO) Holding S.A. London Roadshow November 2017 Disclaimer This document contains forward-looking statements that involve risks and uncertainties. These statements may generally, but not always,
ADMIE (IPTO) Holding S.A. London Roadshow November 2017 Disclaimer This document contains forward-looking statements that involve risks and uncertainties. These statements may generally, but not always,
Presentation of the Group
 The world s leading infrastructure developer Presentation of the Group Key figures & Global Strategy July 2012 Grupo ACS The world s leading infrastructure & concessions developer Engineering contractor
ASTALDI: NET PROFIT UP +20.1% AT 32 MILLION EUROS NET INDEBTEDNESS DOWN TO MILLION EUROS
 The Board of Directors has approved the Intermediate Report at 30 September 2008 ASTALDI: NET PROFIT UP +20.1% AT 32 MILLION EUROS NET INDEBTEDNESS DOWN TO 467.7 MILLION EUROS Main consolidated data at
KRI KRI Milk Industry. September 2017
 KRI KRI Milk Industry September 2017 Table of Contents 1 KRI KRI at a glance 2 Segments Strategic Choices 3 Facilities, CapEx, Location 4 Management 5 Financials 6 Share Information September 2017 2 KRI-KRI
1 st H 2006 IFRS FINANCIAL RESULTS. PRESENTED BY: CEO Mr. E. MYTILINEOS CFO Mr. I. DIMOU
 1 st H 2006 IFRS FINANCIAL RESULTS PRESENTED BY: CEO Mr. E. MYTILINEOS CFO Mr. I. DIMOU 03/08/2006 1 Agenda A. Group Financial & Operating Highlights B. Key Performance Indicators Appendices i. Group History
INTERIM FINANCIAL REPORT
 INTERIM FINANCIAL REPORT For the period from 1 January to 30 June 2017 (pursuant to Article 5 of Law 3556/2007) EL.TECH. ANEMOS SA 25 ERMOU ST - KIFISSIA 145 64 Tax ID No.: 094508956 Tax Office: ATHENS
JOINT SHAREHOLDERS MEETING. 11 September 2000
 JOINT SHAREHOLDERS MEETING 11 September 2000 1 Why an alliance VINCI-GTM Significant presence of both groups in non cyclical activities Combining local expertise with a global approach to service large
A Three-Way Partnership for Growth: Abengoa Algonquin Atlantica Yield Gonzalo Urquijo, Executive Chairman
 A Three-Way Partnership for Growth: Abengoa Algonquin Atlantica Yield Gonzalo Urquijo, Executive Chairman 2 nd November 2017 Forward Looking Statements This presentation contains forward-looking statements
Working with the European Bank for Reconstruction and Development in Cyprus
 Working with the European Bank for Reconstruction and Development in Cyprus September 2017 What is the EBRD? An international financial institution, with the mandate to promote transition to modern and
GREEK RENEWABLES SUPPORT SCHEME PROPOSALS
 BRIEFING GREEK RENEWABLES SUPPORT SCHEME PROPOSALS MARCH 2016 BRIEF OUTLINE OF THE SCHEME PHOTOVOLTAIC PROJECTS TRANSITIONAL PROVISIONS NON-INTERCONNECTED ISLANDS COMPETITIVE BIDDING PROCESS FROM 2017
SEMI-ANNUAL FINANCIAL REPORT
 Société Anonyme Commercial Technical Company 85 Mesogeion Ave., 5 26 Athens Reg.No. 38/06/Β/86/28 SEMI-ANNUAL FINANCIAL REPORT for the period from January st to June 30 th 20 According to article 5 of