Dabur India Limited. Investor Presentation June 2018
|
|
|
- Frank Anthony
- 6 years ago
- Views:
Transcription


1 Dabur India Limited Investor Presentation June
2 Contents 1. Dabur Overview 2. Business Structure 3. India Business 4. The Journey of our Gems 5. International Business 6. The next growth wave 7. Annexure 2


3 Dabur Overview Overview Awards Established in years of trust and excellence One of the world s largest in Ayurveda and natural healthcare Having one of the largest distribution network in India, covering 6.3 mn outlets Dabur Red Paste rated as 2nd most trusted brand by the consumers in the Oral Care category by the Brand Equity India s Most Trust Brand 2017 Dabur Vatika #BraveandBeautiful campaign wins 2 Effies 20 world class manufacturing facilities catering to needs of diverse markets Strong overseas presence with ~28% contribution to consolidated sales Market cap: US$ 10bn Dabur moves up 4 Places in Fortune India 500 List; ranked 163 in the list for 2015 Dabur ranked 25 in the list of Best Companies for CSR in India, according to the Economic Times Dabur India successfully held the firstever Guinness World Record attempt for the largest simultaneous Nasya Panchkarma Treatment session INR:USD F/X Rate:
4 Key milestones Established by Dr. S.K. Burman in Kolkata Acquired Balsara Foods business crossed INR 10.0 bn turnover mark Inducted professional management Acquired Hobi and Namaste Crossed the INR 10.0 bn turnover mark Crossed the USD 1 bn turnover mark Came out with first public issue Acquired Fem Pharma Crossed market cap of $10 bn 4


5 Dabur & Ayurveda Ayurveda = Dabur s Core Philosophy Synonymous with Ayurveda since 133 years Known for making Ayurveda accessible to every household in India Anchored by Heritage Stringent quality test of every ingredient and herb Strong R&D infrastructure including in-house Ayurvedic doctors & scientists Over 5,000 acres of cultivation of endangered herbs and plants Propelled by Science Governed by Trust 5


6 Manufacturing facilities 12 manufacturing locations in India 8 international manufacturing locations UAE Jammu Newai Alwar ` Baddi Sahibabad Pantnagar Tezpur Egypt Nigeria Katni South Africa Silvasa Nasik Pithampur Narendrapur Turkey Sri Lanka Bangladesh Nepal 6
7 Distribution Network Urban Rural Factory Factory C&F C&F GT Stockist MT Stockist Insti Stockist Super Stockist Wholesaler Sub Stockist Retailer Retailer Retailer Consumer Consumer Consumer Consumer Distribution reach of 6.3 mn retail outlets with direct reach of 1 mn 7
8 Strong Financial Profile Revenue from Operations CAGR : 11.9% FY09 FY10 FY11 FY12 FY13 FY14 FY15 FY16 FY17 FY18 Revenue has become ~3x over the last 10 years Last 3 years revenue looks optically static due to change in accounting standards, demonetization and implementation of GST Operating Profit 16.9% 4.7 Operating Profit Operating Margins (%) 20.9% 18.9% 19.5% 19.3% 19.6% 16.8% 16.0% 16.6% 16.7% In FY18, the operating margin of 20.9% was the highest ever in the history of the company FY09 FY10 FY11 FY12 FY13 FY14 FY15 FY16 FY17 FY18 PAT Profit After Tax (PAT) PAT Margins (%) 15.9% 16.6% 17.5% 13.8% 14.7% 13.9% 12.1% 12.4% 13.2% 13.5% FY09 FY10 FY11 FY12 FY13 FY14 FY15 FY16 FY17 FY18 PAT has grown at a CAGR of 15% over the last 10 years PAT margin is the highest ever in the history of the company Note: All figures are in INR bn FY09 to FY15 is basis IGAAP, FY16 and FY17 are as per IndAS and FY18 is as per IndAS and takes into account GST 8
9 Contents 1. Dabur Overview 2. Business Structure 3. India Business 4. The Journey of our Gems 5. International Business 6. The next growth wave 7. Annexure 9


")
")

10 Business structure Domestic (72%) International (28%) Domestic FMCG (68%) Others (4%) Organic (67%) Acquired (33%) Note: Figures in brackets are based on FY18 revenue 10
11 Contents 1. Dabur Overview 2. Business Structure 3. India Business 4. The Journey of our Gems 5. International Business 6. The next growth wave 7. Annexure 11
 Health Supplements 17% Foods (18%) Oral Care 17% OTC & Ethicals 9% Others 2 18% 1. Based on FY18 Revenue 2.")
12 Sales by Business Vertical Domestic FMCG Business Verticals 1 Key categories Domestic FMCG Category Revenue Contribution (FY18) Key Brands Hair Care 21% Healthcare (32%) Foods 18% HPC (50%) Health Supplements 17% Foods (18%) Oral Care 17% OTC & Ethicals 9% Others 2 18% 1. Based on FY18 Revenue 2. Others includes Digestives, Skin Care and Home Care 12
13 Market leader in 6 categories Leading position in key categories across verticals #Relative Competitive Position 1 #1 #1 #2 #2 #2 #3 #1 #2 #1 #1 #1 Honey Chyawanprash Baby Massage Oil Glucose Hair Oils Oral Care Skin Care - Bleaches Toilet Cleaners Air Fresheners Mosquito Repellant Creams Juices Healthcare Home and Personal Care Foods 1. Position basis Nielsen Market Share data MAT Mar 18 13


14 Building bigger brands 10 bn+ 1 bn+ 16 brands with turnover of INR 1bn+ with 3 brands which are INR 10bn+ 14


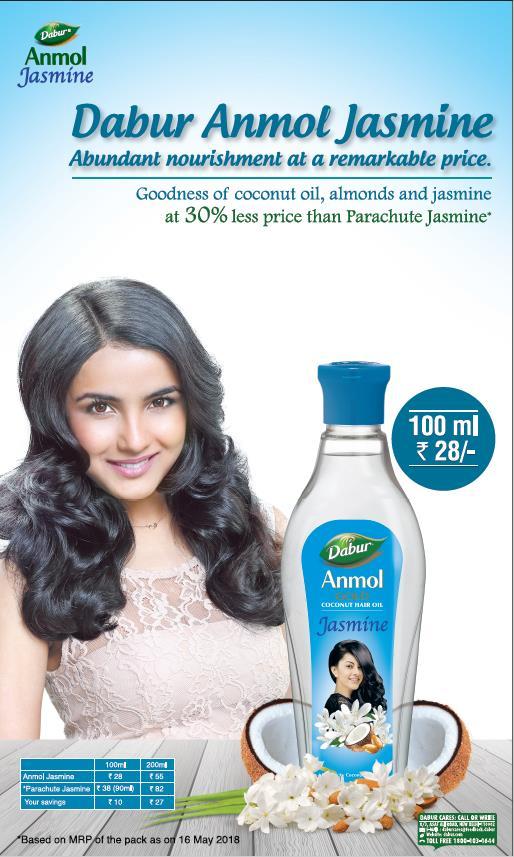
15 Recent Innovations Vatika Shampoo with Satt Poshan Vatika Enriched Coconut Hair Oil Anmol Jasmine Hair Oil GlycoDab Tablets (Ayurvedic Medicine) Odonil Zipper Real Koolerz 15
16 Business strategy Healthcare Home & Personal Care Foods Leadership in Ayurveda scientific evidence & research OTC portfolio to be scaled up through innovation & awareness creation Doctor advocacy through Medico Marketing channel Ayurvedic / Herbal focus Premiumization & Differentiation Strong innovation agenda Potential to expand in adjacencies within current categories Maintain leadership in Juices & Nectars category Leveraging the Fruit equity associated with the Real brand Focus on Healthy range of products 16
17 Contents 1. Dabur Overview 2. Business Structure 3. India Business 4. The Journey of our Gems 5. International Business 6. The next growth wave 7. Annexure 17


18 Odonil s Journey Led by constant innovation and evolving communication Revenue Trajectory Market Share % - MAT 2018 Odonil has become 9x in the last 12 years x CAGR: 20% 3.3x 9x and is the market leader in the air fresheners category ~50% ~14% FY06 FY12 FY18 Odonil Next biggest player FY06 FY11 FY13 FY15 FY18 Led by constant innovation and new launches in the space and Blocks Pluggy Gel 1 Touch Air Sanitizer Zipper Supported by evolving communication themes and advertisements Till FY07 Mal Odor Removal FY07 to FY11 Transformation(Mood) FY11 to FY16 Transformation(Space) Since FY16 Social Necessity 18


19 Dabur s journey to become the 3 rd largest toothpaste company in India Over the last 15 years, Dabur has grown from a tooth powder company to one of the top 3 players in the toothpaste category Entered the toothpaste category with the launch of Dabur Red Paste in 2004 Acquisition of Balsara in 2005 added Babool and Meswak brands to the herbal oral care portfolio Recently launched Dabur Red Gel to capture Ayurvedic segment among Gel users Growing at a rapid pace, Dabur has become the third largest toothpaste company in the country and has a strong innovation pipeline Consistent increase in market share of Dabur in the toothpaste category +350 bps +150 bps +160 bps Mar-06 Mar-08 Mar-11 Mar-18 19


20 Real continues on the journey of dominance in J&N category Real Fruit Power Real Activ Real Wellnezz Real Koolerz Real Mocktails Real Activ Coconut Water Real Fruit Juices were launched in 1998 to create the packaged fruit juice category in India First to launch variants like Litchi, Guava, Pomegranate, Cranberry, Supafruits, Mosambi and the Activ range of fruit and veggie blends More than 30 variants in the portfolio currently Continuing to be the market leader with >50% share Recently launched Real Koolerz to enter the drinks category Strong innovation pipeline to cater to consumers across the spectrum 20
21 Contents 1. Dabur Overview 2. Business Structure 3. India Business 4. The Journey of our Gems 5. International Business 6. The next growth wave 7. Annexure 21
22 International Business Financial Profile Sales (INR bn) CAGR: 14% International Business comprises the Organic and Acquired business Organic business (67% of international) is an extension of Indian portfolio with the same personal care brands operating internationally Acquired business (32% of international) comprises Hobi and 8.9 Namaste FY11 FY12 FY13 FY14 FY15 FY16 FY17 FY18 Region-wise Sales (FY18) FY17 and FY18 were impacted due to geopolitical headwinds and severe currency devaluation in our key markets Performance of Key Markets (FY18) Europe 10.8% Americas 14.0% Middle East 34.0% 31.8% Constant Currency Growth Rate FY % 16.9% 13.7% 10.7% 10.6% 10.0% Asia 22.4% Africa 18.8% Egypt GCC Saudi Arabia (15.8%) Nigeria Nepal Turkey Namaste SSA 22
23 Organic International Business FY06 FY18 Oral Care 2% Others 5% Skin Care 7% Oral Care 12% Others 10% Hair Oil 34% Hair Oil 93% Hamamzaith & Styling 9% Shampoo 17% Hair Cream 11% Organic International Business has evolved from being just a Hair Oil business to a diversified personal care entity 23


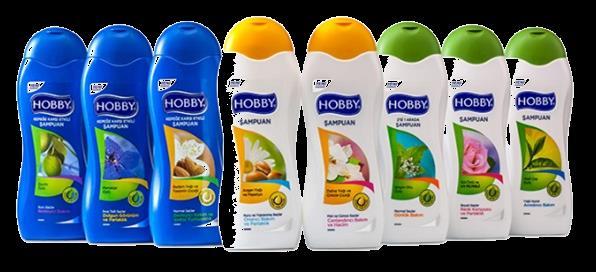


24 Acquired International Business Namaste Hobi Key Geographies USA Africa Key Categories Straighteners Styling Shampoo & Conditioners Key Geographies Turkey Key Categories Hair Styling Shampoo & Conditioners Liquid Soap Skin & Body Care 24


25 International Business Strategy Brands positioned on Herbal and Natural platform Product portfolio customized to local preferences Strong investments in brands and business Leveraging Digital platform to enhance consumer awareness and brand visibility Local supply chain & management offers strategic advantage 25
26 Contents 1. Dabur Overview 2. Business Structure 3. India Business 4. The Journey of our Gems 5. International Business 6. The next growth wave 7. Annexure 26


27 The next growth wave Build bigger brands More than 15 brands in the range of INR >0.1 to 1 bn which can grow to INR 1bn+ Continued Innovation NPD pipeline primed to deliver new products in key categories 4-5 new products every year Driving distribution expansion Direct reach of 1 mn +, increasing the no. of SKUs, rural potential, IT enablement, data analytics Consumer Health Strong core competence, low competitive intensity, strong profitability, low penetration Geographical expansion Expand into overseas focus markets where our brands are relevant MENA, Africa, SAARC 27
28 Contents 1. Dabur Overview 2. Business Structure 3. India Business 4. The Journey of our Gems 5. International Business 6. The next growth wave 7. Annexure 28
29 Shareholding, Market Cap and Dividends Shareholding pattern Market Cap (INR bn) FIIs 17.6% DIIs 8.6% Retail 5.7% Promoters 68.1% Dividend history Mar-16 Mar-17 Mar-18 May % 175% 200% 115% 130% 150% 175% 200% 225% 225% 1. Normal dividend of 250%, 2. Special Dividend of 500% to commemorate the 25 years of listing FY09 FY10 FY11 FY12 FY13 FY14 FY15 FY16 FY17 FY18 29

30 Select Advertisements May


31 Select Advertisements May
32 Consolidated Profit & Loss Q4 FY18 Q4 FY17 Y-o-Y (%) FY18 FY17 Y-o-Y (%) Revenue from operations 2, , % 7, , % Other Income % % Total Income 2, , % 8, , % Material Cost 1, % 3, , % % of Revenue 49.3% 51.0% 49.6% 49.9% Employee expense % % % of Revenue 8.9% 9.0% 10.2% 10.3% Advertisement and publicity % (6.1%) % of Revenue 6.2% 6.4% 7.8% 8.4% Other Expenses % (3.1%) % of Revenue 11.8% 11.7% 11.4% 11.9% Operating Profit % 1, , % % of Revenue 23.9% 21.8% 20.9% 19.6% EBITDA % 1, , % % of Revenue 27.5% 25.2% 24.8% 23.5% Finance Costs % (1.8%) Depreciation & Amortization % % Profit before exceptional items, tax and share of profit/(loss) from joint % 1, , % venture % of Revenue 24.7% 22.5% 22.0% 20.9% Share of profit / (loss) of joint venture (0.2) (0.1) n.m (5.6%) Exceptional item(s) n.a n.a. Tax Expenses % % Net profit after tax and after share of profit/(loss) from joint venture % 1, , % % of Revenue 19.5% 17.4% 17.5% 16.6% Non controlling interest % (0.7%) Net profit for the period/year % 1, , % % of Revenue 19.5% 17.4% 17.5% 16.6% Note: All figures are in INR crores, unless otherwise stated 32
33 Consolidated Balance Sheet (1 of 2) All figures are in INR crores, unless otherwise stated Particulars As at 31/03/2018 (Audited) As at 31/03/2017 (Audited) A Assets 1 Non-current assets (a) Property, plant and equipment 1,552 1,479 (b) Capital work-in-progress (c) Investment property (d) Goodwill (e) Other Intangible assets (f) Financial assets (i) Investments 3,092 2,499 (ii) Loans (ii) Others 4 4 (g) Other non-current assets 3 3 (h) Non-current tax assets (net) Total Non-current assets 5,262 4,615 2 Current assets (a) Inventories 1,256 1,107 (b) Financial assets (i) Investments (ii) Trade receivables (iii) Cash and cash equivalents (iv) Bank Balances other than (iii) above (v) Loans (vi) Others (c) Current Tax Asset(Net) 2 0 (d) Other current assets (e) Assets held for sale 2 0 Total current assets 3,440 3,117 Total Assets 8,702 7,732 33
34 Consolidated Balance Sheet (2 of 2) All figures are in INR crores, unless otherwise stated Particulars As at 31/03/2018 (Audited) As at 31/03/2017 (Audited) B Equity and Liabilities 1 Equity (a) Equity share capital (b) Other Equity 5,530 4,671 Equity attributable to shareholders of the Company 5,707 4,847 Non Controlling Interest Total equity 5,733 4,872 2 Non-current liabilities (a) Financial liabilities (i) Borrowings (ii) Other financial liabilities 4 4 (b) Provisions (c) Deferred tax liabilities (Net) Total Non-current liabilities Current liabilities (a) Financial liabilities (i) Borrowings (ii) Trade payables 1,410 1,309 (iii) Other financial liabilities (b) Other current liabilities (c) Provisions (d) Current tax Liabilities (Net) Total Current liabilities 2,434 2,224 Total Equity and Liabilities 8,702 7,732 34

35 For more information & updates, visit
Dabur India Limited Investor Presentation CLSA India Forum November 2018
 Dabur India Limited Investor Presentation CLSA India Forum November 2018 1 Agenda 1. Dabur Overview 2. Business Structure 3. India Business 4. International Business 5. The way forward 6. Annexure 2 Dabur
Dabur India Limited. Investor Presentation November December 2018
 Dabur India Limited Investor Presentation November December 2018 1 Agenda 1. Dabur Overview 2. Business Structure 3. India Business 4. International Business 5. The Way Forward 6. Our Value Creators 7.
Investor Presentation February 2016
 Dabur India Ltd Investor Presentation February 2016 FMCG Overview Fourth largest sector in the economy Current size of the Indian FMCG Market is around USD 45 bn Grown at an annual average of 11 per cent
Dabur India Limited Investor Communication
 Dabur India Limited Investor Communication Quarter and Year ended 31 st March 2018 Contents 1. Q4 FY18 and FY18 Overview 2. Category Highlights 3. Business Initiatives 4. FY18 - Product Launches 5. International
Investor Communication. Quarter and Half Year ended 30 th September, 2016
 Investor Communication Quarter and Half Year ended 30 th September, 2016 October 26, 2016 Demand Slowdown : Underlying Factors 10 Index of Industrial Production 0 4 Sources of income have been affected
Dabur India Limited. Investor Communication. Quarter ended 30 th June August 4, 2017
 1 Dabur India Limited Investor Communication Quarter ended 30 th June 2017 August 4, 2017 GST Transition 2 GST implemented w.e.f. 1 st July 2017 De stocking in trade channels and institutions led to impact
GODREJ CONSUMER PRODUCTS INVESTOR PRESENTATION
 1 GODREJ CONSUMER PRODUCTS INVESTOR PRESENTATION GODREJ CONSUMER PRODUCTS SNAPSHOT strong positions in core categories largest home grown HPC company US $1.3 billion in sales in FY 14 home care hair care
Dabur India Limited. Investor Communication. Quarter and Half Year ended September 30, 2014
 Dabur India Limited Investor Communication Quarter and Half Year ended September 30, 2014 November 3, 2014 Performance Overview : Q2 FY2014-15 Consolidated Sales Consolidated EBITDA EBITDA Margins Consolidated
GODREJ CONSUMER PRODUCTS INVESTOR PRESENTATION JUNE 2013
 GODREJ CONSUMER PRODUCTS INVESTOR PRESENTATION JUNE 2013 GODREJ CONSUMER PRODUCTS SNAPSHOT strong positions in core categories largest home grown HPC company US $1.2 billion in sales in FY 13 home care
Dabur India. Share gains power growth, Accumulate. Source: Company Data; PL Research
 Share gains power growth, Accumulate May 02, 2018 Amnish Aggarwal amnishaggarwal@plindia.com +91 22 66322233 Nishita Doshi nishitadoshi@plindia.com +91 22 66322381 Rating Accumulate Price Rs371 Target
Business snapshot. ~50% of revenues comes from international businesses. Leading market share in home care, hair care and personal care
 May 24, 2016 Business snapshot Emerging markets FMCG leader Excellent track record of value creation among FMCG companies in India Growing presence in Asia, Africa and Latin America $ Leading market share
Dabur India. Neutral. Rs93
 3QFY11 Results Update SECTOR: FMCG BSE SENSEX S&P CNX 18,022 5,417 Bloomberg DABUR IN Equity Shares (m) 1,738.0 52-Week Range (Rs) 112/79 1,6,12 Rel. Perf. (%) 5/-5/2 M.Cap. (Rs b) 160.8 M.Cap. (US$ b)
Business snapshot. ~50% of revenues comes from international businesses. Leading market share in home care, hair care and personal care
 February 3, 2016 Business snapshot Emerging markets FMCG leader Excellent track record of value creation among FMCG companies in India Growing presence in Asia, Africa and Latin America $ Leading market
PRESS RELEASE. Mumbai, January 27, 2016: Godrej Consumer Products Limited (GCPL), a leading
, a leading") PRESS RELEASE 3Q FY 2016 results GCPL delivers a net profit growth of 23% on an organic constant currency net sales growth of 9%. Mumbai, January 27, 2016: Godrej Consumer Products Limited (GCPL), a leading
PRESS RELEASE 3Q FY 2016 results GCPL delivers a net profit growth of 23% on an organic constant currency net sales growth of 9%. Mumbai, January 27, 2016: Godrej Consumer Products Limited (GCPL), a leading
DABUR INDIA LTD Result Update (CONSOLIDATED BASIS): Q3 FY19
: Q3 FY19") DABUR INDIA LTD Result Update (CONSOLIDATED BASIS): Q3 FY19 Index Details Stock Data Sector Personal Products BSE Code 500096 Face Value 1.00 52wk. High / Low (Rs.) 490.70/312.45 Volume (2wk. Avg.) 203000
DABUR INDIA LTD Result Update (CONSOLIDATED BASIS): Q3 FY19 Index Details Stock Data Sector Personal Products BSE Code 500096 Face Value 1.00 52wk. High / Low (Rs.) 490.70/312.45 Volume (2wk. Avg.) 203000
Pioneers of laminated tubes in India. Corporate Presentation
 Pioneers of laminated tubes in India Corporate Presentation M17617 Safe Harbour Certain statements in this presentation concerning our future growth prospects are forward-looking statements. The Company
KRBL LIMITED. Investor Communication
 KRBL LIMITED Investor Communication Quarter and Year ended 31 st March 2018 CONTENTS 1. Q4 & FY18 Consolidated Financial Overview 2. Business Overview 3. Category Highlights 4. Marketing Initiatives 5.
Dabur India. CMP: INR130 TP: INR135 Neutral
 BSE SENSEX S&P CNX 18,625 5,664 29 October 2012 2QFY13 Results Update Sector: Consumer Dabur India CMP: INR130 TP: INR135 Neutral Bloomberg DABUR IN Equity Shares (m) 1,740.7 52-Week Range (Rs) 139/92
Dabur. Bargain hunting BUY COMPANY UPDATE 12 DEC CMP (as on 12 Dec 2013) Rs 168 Target Price Rs 192
 Rs 168 Target Price Rs 192") INDUSTRY FMCG CMP (as on 12 Dec 2013) Rs 168 Target Price Rs 192 Nifty 6,237 Sensex 20,926 KEY STOCK DATA Bloomberg/Reuters DABUR IN/DABU.BO No. of Shares (mn) 1,744 MCap (Rs bn)/(us$ mn) 293/4,742 6m
INDUSTRY FMCG CMP (as on 12 Dec 2013) Rs 168 Target Price Rs 192 Nifty 6,237 Sensex 20,926 KEY STOCK DATA Bloomberg/Reuters DABUR IN/DABU.BO No. of Shares (mn) 1,744 MCap (Rs bn)/(us$ mn) 293/4,742 6m
Business snapshot. 48% of revenue comes from international businesses. Leading market share in home care, hair care and personal care
 May 26, 2017 Business snapshot Emerging markets FMCG leader Excellent track record of value creation among FMCG companies in India Growing presence in Asia, Africa and Latin America Leading market share
Dabur India. CMP: INR106 TP: INR94 Neutral
 28 July 2011 1QFY12 Results Update Sector: FMCG BSE SENSEX S&P CNX 18,210 5,488 Dabur India CMP: INR106 TP: INR94 Neutral Bloomberg DABUR IN Equity Shares (m) 1,740.0 52-Week Range (INR) 122/87 1,6,12
DABUR INDIA LIMITED RESEARCH
 RESULTS REVIEW Dabur India Limited Hold Share Data Market Cap Rs. 79.5 bn Price Rs. 91.95 BSE Sensex 14,577.87 Reuters Bloomberg Avg. Volume (52 Week) DABU.BO DABUR IN 0.3mn 52-Week High/Low Rs. 134 /
Performance Update - 4Q FY16 May 3, 2016
 Performance Update - 4Q FY16 May 3, 2016 PERFORMANCE UPDATE 1 Executive Summary - Key Highlights 2 Business Overview - India 3 Business Overview - International 2 I GCPL I Performance Update 4Q FY16 I
Dabur India (DABIND) 276
 276") Rating matrix Rating : Buy Target : 324 Target Period : 12 months Potential Upside : 17% What s changed? Target Changed from 338 to 324 EPS FY17E Changed from 7.6 to 7.2 EPS FY18E Changed from 8.3 to 7.9
Rating matrix Rating : Buy Target : 324 Target Period : 12 months Potential Upside : 17% What s changed? Target Changed from 338 to 324 EPS FY17E Changed from 7.6 to 7.2 EPS FY18E Changed from 8.3 to 7.9
GODREJ CONSUMER PRODUCTS LIMITED 1Q FY2016 PERFORMANCE UPDATE
 GODREJ CONSUMER PRODUCTS LIMITED 1Q FY2016 PERFORMANCE UPDATE July 29, 2015 PERFORMANCE UPDATE EXECUTIVE SUMMARY : MAJOR HIGHLIGHTS BUSINESS OVERVIEW : INDIA BUSINESS OVERVIEW : INTERNATIONAL OVERALL 1Q
PRESS RELEASE. Mumbai, May 3, 2016: Godrej Consumer Products Limited (GCPL), a leading emerging
, a leading emerging") PRESS RELEASE 4Q FY 2016 results GCPL delivers a net profit growth of 17% on an organic constant currency net sales growth of 12%. Mumbai, May 3, 2016: Godrej Consumer Products Limited (GCPL), a leading
PRESS RELEASE 4Q FY 2016 results GCPL delivers a net profit growth of 17% on an organic constant currency net sales growth of 12%. Mumbai, May 3, 2016: Godrej Consumer Products Limited (GCPL), a leading
Dabur India. Steady recovery in place; Accumulate. Source: Company Data; PL Research
 Steady recovery in place; Accumulate January 31, 2018 Amnish Aggarwal amnishaggarwal@plindia.com +91 22 66322233 Nishita Doshi nishitadoshi@plindia.com +91 22 66322381 Rating Accumulate Price Rs354 Target
INVESTOR PRESENTATION JANUARY Version -3
 INVESTOR PRESENTATION JANUARY - 2018 Version -3 FLOW BAJAJ PATHFINDER AND NEW VISION MISSION VALUES BUSINESS CONTEXT & INITIATIVES OF Q3 Q3 RESULTS SUMMARY WAY FORWARD DETAILED PERFORMANCE THE NAYA BAJAJ
Dabur India (DABIND) 287
 287") Rating matrix Rating : Hold Target : 305 Target Period : 12 months Potential Upside : 6% What s changed? Target Changed from 324 to 305 EPS FY18E Changed from 7.9 to 7.5 EPS FY19E Changed from 8.5 to 8.0
Rating matrix Rating : Hold Target : 305 Target Period : 12 months Potential Upside : 6% What s changed? Target Changed from 324 to 305 EPS FY18E Changed from 7.9 to 7.5 EPS FY19E Changed from 8.5 to 8.0
Performance Update - 4Q FY18 May 8, 2018
 Performance Update - 4Q FY18 May 8, 2018 PERFORMANCE UPDATE 1 Executive Summary - Key Highlights 2 Business Overview - India 3 Business Overview - International 2 I GCPL I Performance Update 4Q FY18 I
DABUR Going from strength to strength
 RESULT UPDATE DABUR Going from strength to strength India Equity Research Consumer Goods Dabur s Q1FY13 numbers were marginally ahead of our estimates, led by strong volume growth (domestic volume up 11.6%
Dabur India (DABIND) 290
 290") Rating matrix Rating : Buy Target : 338 Target Period : 12 months Potential Upside : 16% What s changed? Target Unchanged EPS FY17E Changed from 7.9 to 7.6 EPS FY18E Changed from 8.6 to 8.3 Rating Unchanged
Rating matrix Rating : Buy Target : 338 Target Period : 12 months Potential Upside : 16% What s changed? Target Unchanged EPS FY17E Changed from 7.9 to 7.6 EPS FY18E Changed from 8.6 to 8.3 Rating Unchanged
Dabur India. Institutional Equities. 1QFY19 Result Update
 1QFY19 Result Update Institutional Equities Dabur India 2 August 2018 Reuters: DABU.NS; Bloomberg: DABUR IN Consistency Is Key To The Game Dabur India s (DABUR) operating performance in 1QFY19 was better
Dabur India Ltd. Q3FY18 Result Update Strong Volume led Domestic growth; IBD remains weak. Sector: FMCG CMP: ` 356. Recommendation: BUY
 Dabur India Ltd. Q3FY18 Result Update Strong Volume led Domestic growth; IBD remains weak Sector: FMCG CMP: ` 356 Recommendation: BUY Market statistics Current stock price (`) 356 Shares O/S (cr.) 176.2
BUY. BAJAJ CORP LIMITED Result Update: Q1 FY14. CMP (Rs) Target Price (Rs) AUGUST 10 th, 2013 HIGHLIGHTS
 Target Price (Rs) AUGUST 10 th, 2013 HIGHLIGHTS") BUY CMP (Rs) 243.00 Target Price (Rs) 268.00 BAJAJ CORP LIMITED Result Update: Q1 FY14 AUGUST 10 th, 2013 ISIN: INE933K01021 Stock Data Sector FMCG BSE Code 533229 Face Value 1.00 52wk. High / Low (Rs.)
BUY CMP (Rs) 243.00 Target Price (Rs) 268.00 BAJAJ CORP LIMITED Result Update: Q1 FY14 AUGUST 10 th, 2013 ISIN: INE933K01021 Stock Data Sector FMCG BSE Code 533229 Face Value 1.00 52wk. High / Low (Rs.)
Performance Update - 2Q FY16 October 24, 2015
 Performance Update - 2Q FY16 October 24, 2015 PERFORMANCE UPDATE 1 Executive Summary - Key Highlights 2 Business Overview - India 3 Business Overview - International 2 I GCPL I Performance Update 2Q FY16
PRESS RELEASE. Mumbai, January 30, 2017: Godrej Consumer Products Limited (GCPL), a leading
, a leading") PRESS RELEASE 3Q FY2017 results GCPL delivers sales growth of 8% and EBITDA growth of 14% Mumbai, January 30, 2017: Godrej Consumer Products Limited (GCPL), a leading emerging markets FMCG company, today
PRESS RELEASE 3Q FY2017 results GCPL delivers sales growth of 8% and EBITDA growth of 14% Mumbai, January 30, 2017: Godrej Consumer Products Limited (GCPL), a leading emerging markets FMCG company, today
DABUR INDIA LIMITED Half Yearly Financial Report A Fresh Outlook
 DABUR INDIA LIMITED Half Yearly Financial Report 2007-08 A Fresh Outlook CONTENTS Board of Directors 03 Financial Statements 16 Management Discussion and Analysis 04 Consolidated Financials Statements
Dabur India (DABIND) 304
 304") Rating matrix Rating : Buy Target : 338 Target Period : 12 months Potential Upside : 11% What s changed? Target Changed from 304 to 338 EPS FY17E Changed from 7.9 to 8.0 EPS FY18E Changed from 8.6 to 9.4
Rating matrix Rating : Buy Target : 338 Target Period : 12 months Potential Upside : 11% What s changed? Target Changed from 304 to 338 EPS FY17E Changed from 7.9 to 8.0 EPS FY18E Changed from 8.6 to 9.4
Dabur India (DABIND) 275
 275") Rating matrix Rating : Buy Target : 304 Target Period : 12 months Potential Upside : 11% What s changed? Target Changed from 283 to 304 EPS FY17E Changed from 7.5 to 7.9 EPS FY18E Changed from 8.1 to 8.6
Rating matrix Rating : Buy Target : 304 Target Period : 12 months Potential Upside : 11% What s changed? Target Changed from 283 to 304 EPS FY17E Changed from 7.5 to 7.9 EPS FY18E Changed from 8.1 to 8.6
Dabur India. Source: Company Data; PL Research
 Deflation and poor demand impacts sales; Accumulate July 27, 2016 Amnish Aggarwal amnishaggarwal@plindia.com +91 22 66322233 Gaurav Jogani gauravjogani@plindia.com +91 22 66322238 Rating Accumulate Price
Dabur India. Worst is over; Accumulate. Source: Company Data; PL Research
 Worst is over; Accumulate October 31, 2017 Amnish Aggarwal amnishaggarwal@plindia.com +91 22 66322233 Gaurav Jogani gauravjogani@plindia.com +91 22 66322238 Rating Accumulate Price Rs333 Target Price Rs342
Uncommon sense. April 2009
 Uncommon sense April 2009 Disclaimer This investor presentation has been prepared by Marico Limited ( Marico ) and does not constitute a prospectus or placement memorandum or an offer to acquire any securities.
PRESS RELEASE. de-stocking; consolidated net profit without exceptional items is INR 230 crore
 PRESS RELEASE 1Q FY2018 results India business delivers 6% sales growth despite GST driven de-stocking; consolidated net profit without exceptional items is INR 230 crore Mumbai, July 31, 2017: Godrej
BUY. Big beneficiary of rural recovery; BUY DABUR INDIA. Target Price: Rs 395. Key drivers (%) FY18E FY19E FY20E
 FY18E FY19E FY20E") BUY Target Price: Rs 395 Big beneficiary of rural recovery; BUY We upgrade Dabur to BUY on likely faster recovery in rural economy (where Dabur has created an edge) on multiple tailwinds, with a realigned
BUY Target Price: Rs 395 Big beneficiary of rural recovery; BUY We upgrade Dabur to BUY on likely faster recovery in rural economy (where Dabur has created an edge) on multiple tailwinds, with a realigned
TCS Financial Results
 TCS Financial Results Quarter IV & Year Ended FY 2014-15 April 16, 2015 1 Copyright 2014 Tata Consultancy Services Limited Disclaimer Certain statements in this release concerning our future prospects
Dabur India. Result Update Q3 FY15. Dabur matched our expectations by recording modest 9.2% yoy revenue
 Change in Estimates Rating Target Dabur India Q3 FY15 Dabur matched our expectations by recording modest 9.2% yoy revenue growth at ~Rs21bn during Q3 FY15 Domestic FMCG business revenues increased by ~13%
BUY SIMPLEX INFRASTRUCTURES LTD SYNOPSIS. CMP Target Price FEBRUARY 28 th Result Update (PARENT BASIS): Q3 FY15
: Q3 FY15") BUY CMP 408.40 Target Price 460.00 SIMPLEX INFRASTRUCTURES LIMITED Result Update (PARENT BASIS): Q3 FY15 FEBRUARY 28 th 2015 ISIN: INE059B01024 Index Details Stock Data Sector Construction & Engineering
BUY CMP 408.40 Target Price 460.00 SIMPLEX INFRASTRUCTURES LIMITED Result Update (PARENT BASIS): Q3 FY15 FEBRUARY 28 th 2015 ISIN: INE059B01024 Index Details Stock Data Sector Construction & Engineering
Dabur India (DABIND) 355
 355") Rating matrix Rating : Buy Target : 390 Target Period : 12 months Potential Upside : 10% What s changed? Target Changed from 375 to 390 EPS FY19E Changed from 8.9 to 8.5 EPS FY20E Introduced at 9.7 Rating
Rating matrix Rating : Buy Target : 390 Target Period : 12 months Potential Upside : 10% What s changed? Target Changed from 375 to 390 EPS FY19E Changed from 8.9 to 8.5 EPS FY20E Introduced at 9.7 Rating
Deutsche Bank Conference. Paris June 11th, 2007
 Deutsche Bank Conference Paris June 11th, 2007 John P. Goodwin Treasurer The Procter & Gamble Company 1 Agenda 2 Business update Zoom on CEEMEA (Central & Eastern Europe, Middle East and Africa) Q&A 2
DABUR Healthy and juicy
 RESULT UPDATE DABUR Healthy and juicy India Equity Research Consumer Goods Dabur s Q2FY13 numbers were in line our estimates as domestic volume was up 9% YoY (as against 5.0%, 8.0%, 9.5% and 11.6% YoY
Recovery to be gradual; Maintain HOLD
 Dabur India Equity Research Consumers June 22, 2017 Company Update Refer to important disclosures at the end of this report Recovery to be gradual; Maintain HOLD Emkay Your success is our success CMP Target
TCS Financial Results
 TCS Financial Results Quarter IV & Year Ended FY 2015-16 April 18, 2016 1 Copyright 2014 Tata Consultancy Services Limited Disclaimer Certain statements in this release concerning our future prospects
Unilever - CAGE Conference. Paul Polman CEO Roger Seabrook VP Investor Relations London - 19 th March 2012
 Unilever - CAGE Conference Paul Polman CEO Roger Seabrook VP Investor Relations London - 19 th March 2012 Contents 1 2011 key takeaways 2 Our progress over the last 3 years 3 Your questions addressed 2011
Hindustan Unilever Limited. SQ 18 Results Presentation : 12 th October 2018
 Hindustan Unilever Limited SQ 18 Results Presentation : 12 th October 2018 Safe Harbor Statement This Release / Communication, except for the historical information, may contain statements, including the
Investor Presentation. December 2012
 Investor Presentation December 2012 Industry Overview The Indian FMCG industry at INR 1300 bn (around USD 30bn) accounts for 2.2% of the GDP In the last decade, the sector grew by 11% annually The FMCG
Q2FY18 Performance Review 25 th October 2017
 Q2FY18 Performance Review 25 th October 2017 Q2FY18 Snapshot Consolidated Revenues (including GST/VAT) grew by 14% during the quarter with volumes growing by 10%. Q2FY18 Business Wise Sales Split Reported
Performance Update - 3Q FY18 January 30, 2018
 Performance Update - 3Q FY18 January 30, 2018 PERFORMANCE UPDATE 1 Executive Summary - Key Highlights 2 Business Overview - India 3 Business Overview - International 2 I GCPL I Performance Update 3Q FY18
EARNINGS PRESENTATION 9M/Q3-FY2018
 EARNINGS PRESENTATION 9M/Q3-FY2018 Executive Summary OVERVIEW Ion Exchange (India) Ltd (Ion Exchange), formed in 1964, is a pioneer in water, waste water treatment & environment solutions and caters to
Colgate TEAM ID Recommendation: SELL Market Cap: Rs Cr. 5,166.64
 TEAM ID 1003 Colgate Recommendation: SELL Market Cap: Rs Cr. 5,166.64 Price: Rs. 379.90 12 Month Price Objective: Rs. 255.50 Estimates 2007E 2008E 2009E Net income (Rs. mn) 1,593.0 2,134.6 2,357.7 EPS
Accelerating our IPT strategy
 Accelerating our IPT strategy GlaxoSmithKline plc and Pfizer Inc to form new world-leading Consumer Healthcare Joint Venture Transaction lays foundation for separation of GSK to create two new UK-based
Dabur India. Institutional Equities. 4QFY18 Result Update. Growth Volatility Is Still Fairly High ACCUMULATE
 4QFY18 Result Update Institutional Equities Dabur India 3 May 2018 Reuters: DABU.NS; Bloomberg: DABUR IN Growth Volatility Is Still Fairly High Dabur India s (DABUR) consolidated top-line performance in
Aurobindo Pharma Limited Presentation to Investors
 Aurobindo Pharma Limited Presentation to Investors February 2013 Forward looking statement This presentation contains statements that constitute forward looking statements including and without limitation,
Sub: Disclosure under Regulation 30 of the SEBI (Listing Obligations & Disclosure Requirements) Regulations, 2015
 Regulations, 2015") February 12, 2019 To, The Manager, DCS CRD Corporate Relationship Department, BSE Limited Phiroze Jeejeebhoy Tower, Dalal Street, Mumbai 400 001. Security Cods: 539207 ISIN: INE122R01018 To, The Listing
February 12, 2019 To, The Manager, DCS CRD Corporate Relationship Department, BSE Limited Phiroze Jeejeebhoy Tower, Dalal Street, Mumbai 400 001. Security Cods: 539207 ISIN: INE122R01018 To, The Listing
COLGATE-PALMOLIVE (INDIA) LTD Result Update (PARENT BASIS): Q1 FY15
 LTD Result Update (PARENT BASIS): Q1 FY15") COLGATE-PALMOLIVE (INDIA) LTD Result Update (PARENT BASIS): Q1 FY15 ISIN: INE259A01022 OCTOBER 1 st, 2014 STOCK DETAILS Sector FMCG BSE Code 500830 Face Value 1.00 52wk. High / Low (Rs.) 1767.30/1219.00
COLGATE-PALMOLIVE (INDIA) LTD Result Update (PARENT BASIS): Q1 FY15 ISIN: INE259A01022 OCTOBER 1 st, 2014 STOCK DETAILS Sector FMCG BSE Code 500830 Face Value 1.00 52wk. High / Low (Rs.) 1767.30/1219.00
LUPIN LIMITED. Q2 FY17 Investor Presentation November 09, Aerial view of Lupin offices, Baltimore, US
 LUPIN LIMITED Q2 FY17 Investor Presentation November 09, 2016 Safe Harbor Statement This report contains forward-looking statements that involve known and unknown risks, uncertainties and other factors
Presentation at Citigroup Smith Barney India Corporate Day. London, June 2003
 Presentation at Citigroup Smith Barney India Corporate Day London, June 2003 HINDUSTAN LEVER LIMITED Contents Economy Overview Strategy FY 2002 MQ 2003 2003 & Beyond.. HINDUSTAN LEVER LIMITED Contents
Aurobindo Pharma Limited. Presentation to Investors
 Aurobindo Pharma Limited Presentation to Investors November 2013 Forward looking statement This presentation contains statements that constitute forward looking statements including and without limitation,
Greenply Industries Ltd. Results Presentation Q1 FY16
 Greenply Industries Ltd Results Presentation Q1 FY16 Disclaimer Certain statements in this communication may be forward looking statements within the meaning of applicable laws and regulations. These forward-looking
ANNUAL GENERAL MEETING
 ANNUAL GENERAL MEETING BRISBANE, 11 NOVEMBER 2015 TODAY S AGENDA Chairman s address Gary Smith Managing director s address Graham Turner Items of business Item 1: Re-election of director Robert Baker Item
MQ 2015 & FY Results Presentation May 8, 2015
 MQ 2015 & FY 2014-15 Results Presentation May 8, 2015 1 Safe Harbor Statement This Release / Communication, except for the historical information, may contain statements, including the words or phrases
BUY. KDDL LTD Result Update (PARENT BASIS): Q1 FY16 SYNOPSIS. CMP Target Price AUGUST 22 nd 2015 ISIN: INE291D01011
: Q1 FY16 SYNOPSIS. CMP Target Price AUGUST 22 nd 2015 ISIN: INE291D01011") BUY CMP 280.10 Target Price 322.00 KDDL LTD Result Update (PARENT BASIS): Q1 FY16 AUGUST 22 nd 2015 ISIN: INE291D01011 Index Details Stock Data Sector Other Apparels & Accessories BSE Code 532054 Face
BUY CMP 280.10 Target Price 322.00 KDDL LTD Result Update (PARENT BASIS): Q1 FY16 AUGUST 22 nd 2015 ISIN: INE291D01011 Index Details Stock Data Sector Other Apparels & Accessories BSE Code 532054 Face
CHANGE IN STANCE DABUR IN EQUITY June 13, 2017
 BUY CHANGE IN STANCE DABUR IN EQUITY June 13, 2017 Turning healthier Dabur was the worst performing FMCG stock YTD, up 2% vs 25% for FMCG. Our thesis that Dabur was worst hit by demonetisation given rural
RESULTS FOR THE QUARTER ENDING 31 st MARCH % COMPARABLE* DOMESTIC CONSUMER GROWTH, 11% UNDERLYING VOLUME GROWTH
 RESULTS FOR THE QUARTER ENDING 31 st MARCH 2018 16% COMPARABLE* DOMESTIC CONSUMER GROWTH, 11% UNDERLYING VOLUME GROWTH Mumbai, May 14 th, 2018: Hindustan Unilever Limited announced its results for the
Firstsource Solutions Limited Q4 and FY2018 Earnings Update
 Firstsource Solutions Limited Q4 and FY2018 Earnings Update May 07, 2018 Proprietary Notice: This document contains proprietary and confidential statement information of Firstsource. No part of this document
INVESTOR PRESENTATION APRIL
 INVESTOR PRESENTATION APRIL - 2018 BCL VISION Harness our heritage of 90 years and combine it with leading edge scientific knowledge to bring innovative high quality products for consumers across the world
Juice Market India September 2014
 Juice Market India September 2014 Executive Summary Market Drivers & Challenges Trends Juice industry is one of the growing sectors in India that has attracted a number of players Changing lifestyle of
William Blair 35 th Annual Growth Stock Conference. June 9, 2015 NYSE: Q. Copyright 2014 Quintiles
 William Blair 35 th Annual Growth Stock Conference June 9, 2015 Copyright 2014 Quintiles NYSE: Q Forward Looking Statements and Use of Non-GAAP Financial Measures This presentation contains forward-looking
Osotspa Public Company Limited
 Financial Highlights - Q4 18 Net profit* was at THB 789 million, +269.6% YoY. 2018 Net profit* was at THB 3,005 million, +6.1% YoY. 2018 Net profit* margin was at 12.0%, compared to 11.2% in 2017. - 2018
Hindustan Unilever Limited. MQ 18 & FY Results Presentation : 14 th May 2018
 Hindustan Unilever Limited MQ 18 & FY 17-18 Results Presentation : 14 th May 2018 Safe Harbor Statement This Release / Communication, except for the historical information, may contain statements, including
MANPASAND BEVERAGES LTD Result Update (PARENT BASIS): Q2 FY18
: Q2 FY18") MANPASAND BEVERAGES LTD Result Update (PARENT BASIS): Q2 FY18 Index Details Stock Data Sector Non-alcoholic Beverages BSE Code 539207 Face Value 10.00 52wk. High / Low (Rs.) 511.83/253.38 Volume (2wk.
MANPASAND BEVERAGES LTD Result Update (PARENT BASIS): Q2 FY18 Index Details Stock Data Sector Non-alcoholic Beverages BSE Code 539207 Face Value 10.00 52wk. High / Low (Rs.) 511.83/253.38 Volume (2wk.
Wipro Limited. April June Presentation to Investors 2015 WIPRO LTD
 Wipro Limited April June 2015 Presentation to Investors 1 Safe Harbor This presentation may contain certain forward looking statements, which involve a number of risks, uncertainties and other factors
Credit Suisse 6 th Annual Industrials Conference November 2018
 Credit Suisse 6 th Annual Industrials Conference November 2018 Safe Harbor This presentation includes forward-looking statements which are statements that are not historical facts, including statements
Investor Deck December 2018
 Investor Deck December 2018 Safe Harbor This presentation includes forward-looking statements which are statements that are not historical facts, including statements that relate to the mix of and demand
DABUR Volumes in revival mode; GST key monitorable
 RESULT UPDATE DABUR Volumes in revival mode; GST key monitorable India Equity Research Consumer Goods Dabur India s (Dabur) Q4FY17 revenue (down 4.8% YoY) came in line, while EBITDA and PAT (flattish YoY)
Bank of America Merrill Lynch The Future of Financials Conference. November 14, Citi Investor Relations
 Citi Investor Relations Bank of America Merrill Lynch The Future of Financials Conference November 14, 2017 Naveed Sultan Global Head of Treasury & Trade Solutions Agenda Strong Foundation for Growth Technology-Driven
GODREJ INDUSTRIES LIMITED Performance Update Q2& H1 FY I Godrej Industries Limited I Q2 & H1 FY Performance Update Nov 14,2017
 GODREJ INDUSTRIES LIMITED Performance Update Q2& H1 FY 2017-18 1 I Godrej Industries Limited I Q2 & H1 FY 2017-18 Performance Update Nov 14,2017 NOVEMBER 14, 2017 DISCLAIMER Some of the statements in this
DABUR INDIA LIMITED HALF YEARLY FINANCIAL REPORT
 DABUR INDIA LIMITED HALF YEARLY FINANCIAL REPORT 201314 Dabur India Limited //Half Yearly Financial Report 201314 Content Board of Directors 4 Management Discussion and Analysis 5 Auditors Report 7 Financial
Welcome to Colgate-Palmolive India COLGATE-PALMOLIVE (INDIA) LIMITED ANALYST MEET OCT
 LIMITED ANALYST MEET OCT") Welcome to Colgate-Palmolive India COLGATE-PALMOLIVE (INDIA) LIMITED ANALYST MEET OCT 2006 1 Agenda Business Update Roger Calmeyer Financial Review Moses Elias Questions & Answers COLGATE-PALMOLIVE (INDIA)
Welcome to Colgate-Palmolive India COLGATE-PALMOLIVE (INDIA) LIMITED ANALYST MEET OCT 2006 1 Agenda Business Update Roger Calmeyer Financial Review Moses Elias Questions & Answers COLGATE-PALMOLIVE (INDIA)
Investor Presentation. February 2012
 Investor Presentation February 2012 Industry Overview The Indian FMCG industry at INR 1300 bn (around USD 30bn) accounts for 2.2% of the GDP (growing g at robust 9%) In the last decade, the sector grew
Our Transformation Continues. March 21, 2018
 Our Transformation Continues March 21, 2018 Disclosure Regarding Forward-Looking Statements Forward-Looking Statements and Factors That May Affect Future Results: Throughout this presentation, we make
Hindustan Unilever Ltd.
 . RESULT UPDATE 18 th July 2017 Jul-16 Sep-16 Nov-16 Jan-17 Mar-17 May-17 Jul-17 125 105 India Equity Institutional Research II Result Update - FY18 II 18th July, 2017 CMP INR 1158 Target INR 1206 MARKET
PDF processed with CutePDF evaluation edition
 PDF processed with CutePDF evaluation edition www.cutepdf.com Serving India s Rural Supermarket RURAL MARKETS HAVE EMERGED AS AN IMPORTANT GROWTH ENGINE IN INDIA S CONSUMPTION STORY. Housing some 70%
November Rick Goings. Chairman & CEO
 November 2016 Rick Goings Chairman & CEO Forward looking statements We are making some forward looking statements today that use words like outlook or target or similar predictive words. Such forward looking
Godrej Consumer Products
 BSE SENSEX S&P CNX 17,602 5,337 Bloomberg GCPL IN Equity Shares (m) 340.3 52-Week Range (INR) 658/370 1,6,12 Rel. Perf. (%) 5/37/42 M.Cap. (INR b) 205.9 M.Cap. (USD b) 3.7 7 August 2012 1QFY13 Results
BUY ASIAN PAINTS LTD. Result Update (CONSOLIDATED BASIS): Q2 FY16. CMP Target Price OCTOBER 24 th 2015 SYNOPSIS
: Q2 FY16. CMP Target Price OCTOBER 24 th 2015 SYNOPSIS") BUY CMP 856.75 Target Price 945.00 ASIAN PAINTS LIMITED Result Update (CONSOLIDATED BASIS): Q2 FY16 OCTOBER 24 th 2015 ISIN: INE021A01026 Index Details Stock Data Sector Paints BSE Code 500820 Face Value
BUY CMP 856.75 Target Price 945.00 ASIAN PAINTS LIMITED Result Update (CONSOLIDATED BASIS): Q2 FY16 OCTOBER 24 th 2015 ISIN: INE021A01026 Index Details Stock Data Sector Paints BSE Code 500820 Face Value
Hathway Cable and Datacom Limited Investor Update Q2-FY18
 Hathway Cable and Datacom Limited Investor Update Q2-FY18 Safe Harbour The information contained in this presentation is only current as of its date. All actions and statements made herein or otherwise
India : Building scale and leadership. Pankaj Razdan Prudential Corporation Asia 1 December 2006
 India : Building scale and leadership Pankaj Razdan Prudential Corporation Asia 1 December 2006 India : Economic Overview Rising affluence Wealth generation is driven by strong economic and market capitalisation
S H Kelkar and Company Limited
 Crafting Sensorial Delight S H Kelkar and Company Limited Largest Indian-origin Fragrance & Flavour Company Q1 FY18 Earnings Presentation August 10, 2017 Disclaimer Certain statements and opinions with
CORPORATE INFORMATION
 Dabur India Limited 01 CORPORATE INFORMATION BOARD OF DIRECTORS Dr. Anand Burman Chairman Mr. P. D. Narang Director Dr. S. Narayan Director Mr. Amit Burman Vice Chairman Mr. Sunil Duggal Director Mr. Albert