Interim Results. 7 November 2006
|
|
|
- Willis Higgins
- 6 years ago
- Views:
Transcription
1 Interim Results 7 November 2006
2 Interim Results Lord Burns Chairman
3 Interim Results Stuart Rose Chief Executive
4 Interim Results Ian Dyson Group Finance Director
5 Group financial highlights Sales 3.9bn, +11% Operating profit* 447.4m, +22% Profit before tax* 405.1m, +32% Adjusted earnings per share* 16.6p, +31% Net cash outflow 33.5m *From continuing operations before asset disposals
6 Group profit before tax m /06 ACTUAL UK INTERNATIONAL M&S MONEY INTEREST 2006/07 ACTUAL
7 Sales General Merchandise Foods 12% 10% 11.7% 10.5% 10.0% 10.9% 9.2% 12% 10% 9.2% 10.9% 10.1% 8% 7.9% 8% 6% 6% 5.8% 4.7% 5.3% 4% 4% 2% 2% 0% 0% Q1 Q2 H1 Q1 Q2 H1 Total Like for like
8 Gross profit TY % LY % Var % Gross profit margin bps GM gross margin bps Foods gross margin bps Full year margin guidance in line with H1
9 Operating costs TY m LY m Var % Retail staffing costs Retail occupancy costs Distribution costs Marketing & related costs Support costs Total before bonus 1, , Bonus Total including bonus 1, , Full year operating costs guidance c.9%
10 International TY m LY m Var % Turnover Owned stores Franchised stores Operating profit Owned stores Franchised stores
11 Cash flow (94.4) 500 (301.3) (99.1) 100 (142.1) (33.5) -100 EBITDA Working capital & similar movements Capex and disposals Interest & Taxation Dividends and share issues Other movements Net Cash Flow
12 Store modernisations Sales and ROI metrics remain strong 4 trial stores continue to materially outperform 2005 openings have gained momentum in H openings performing strongly to date Cost per sq ft guidance remains 80-90
13 Store modernisations Modernised space 10% 35% c70% Work on 2007 stores to commence in January Development of a number of key stores Programme closely linked with property strategy
14 Full year capex m Previous guidance modernisation programme 120 Major store developments 50 Acquisition of Simply Foods 60 Updated guidance At least the same level anticipated for 2007/08
15 Capital structure 30 Sept 06 m 1 April 06 m 1 Oct 05 m Net debt 1, , ,025.5 Pension deficit* 1, Making progress on pension deficit No change to property position Dividend growth * IAS 19
16 Summary Positive sales momentum Further progress on margin Strong profit performance Store modernisation programme delivering Increased focus on investing in the future
17 Interim Results Stuart Rose Chief Executive
18 Same plan Focus/ Drive Product Service Environment Broaden: Stretching the brand e-commerce Overseas Driving our brand and broadening its reach remains our plan
19 Progress continues now driving conversion 2005/ /07 Q1 Q2 Q3 Q4 Q1 Q2 FOOTFALL CONVERSION TRANSACTIONS BASKET SIZE BASKET VALUE SOURCE: Footfall, Internal sales
20 Clothing progress in market share 2 Value Share 1 % pt change Q1 Q2 Q3 Q4 Q1 Q2 2005/ /07 SOURCE: FashionTrak
21 Share gain in all Business Units Value % Volume % Change % Change % Total Clothing & Footwear Womens Lingerie Mens Kids Food SOURCE: Clothing: TNS Worldpanel Fashion: 24 w/e 17 th Sept 2006; Food: Superpanel, Food & Drink: 24 w/e 8 th Oct 2006
22 Driven by Better product Better service Better environment
23 Product Values Architecture Better buying Newness Stock control Listening to our customers


24 Womens

25 Lingerie

26 Mens

27 Childrens
28 Childrens - starting to make progress Sales progress Sep 04 Nov 04 Dec 04 Jan 05 Mar 05 Apr 05 Jun 05 Jul 05 Aug 05 Oct 05 Nov 05 Dec 05 Feb 06 Mar 06 May 06 Jun 06 % on Year Jul 06 Sep M&S BRC ex M&S SOURCE: Internal Analysis - 2 year rolling 52 w/e


29 Home
30 Long term growth in Home continues Sep 04 Nov 04 Jan 05 Mar 05 May 05 Jul 05 Sep 05 Nov 05 Jan 06 Mar 06 May 06 Jul 06 % on Year Sep Sales progress M&S BRC ex M&S SOURCE: M&S and BRC 2 year rolling 52 w/e
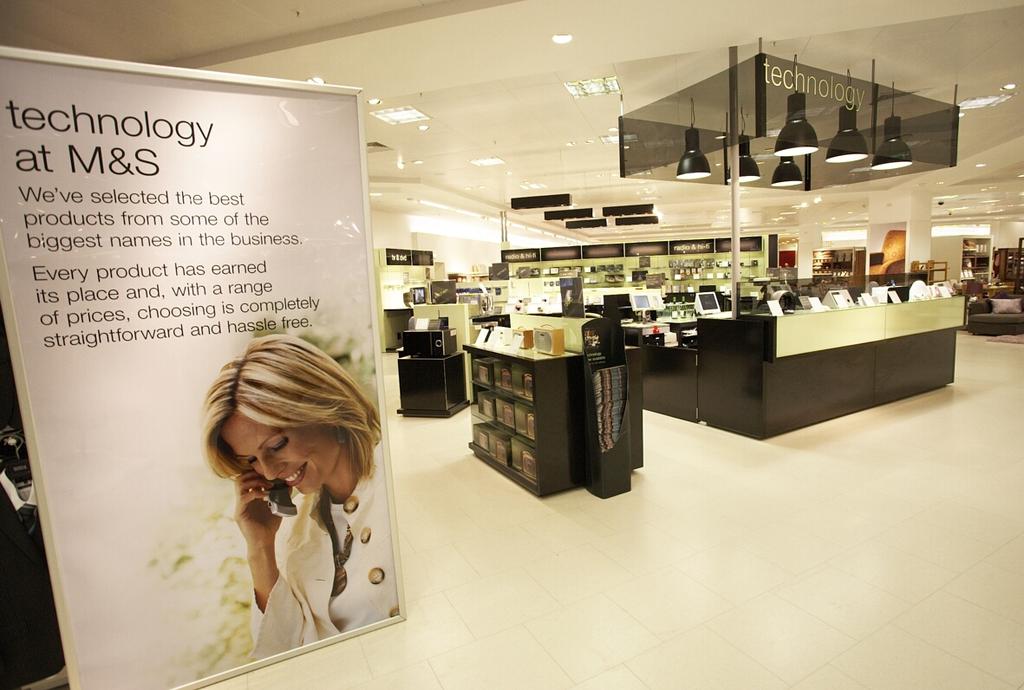
31 Technology


32 Food
33 Food continues to outperform Sales progress 10% 8% 6% 4% 2% 0% Sep 04 Nov 04 Dec 04 Jan 05 Mar 05 Apr 05 Jun 05 Jul 05 Aug 05 Oct 05 Nov 05 Dec 05 Feb 06 Mar 06 May 06 Jun 06 Jul 06 Sep 06 % on Yr M&S IGD SOURCE: Internal Analysis - 2 year rolling 52 w/e


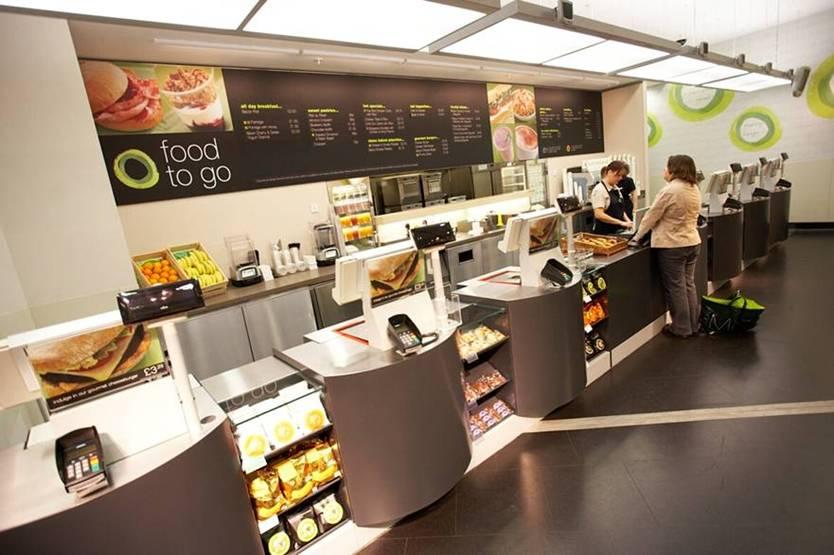
34 Food initiatives - revitalising existing space
35 Service Improving store standards Improving availability RFID Mystery shopping Special service areas: Footwear, technology, lingerie

36 Special service areas

37 Property strategy
38 Property strategy Enhance presence in major city centres Extend and add major out of town stores Build presence in retail parks Develop our high street portfolio Accelerate growth of Simply Foods

39 Enhance major city centres

40 Extend and add major Out of Town

41 Build retail park presence

42 Develop high streets

43 Develop Simply Foods

44 Moving ahead on BP
45 What will this mean Net space will grow over the next five years September 06 (million sq ft) 5 Years GM % Food 4.0* % Total % * Excludes BP, Compass & Moto


46 Environment store modernisation

47 e-commerce


48 International
49 Summary Good half year; current trading going well Lots more to do: Delivering better product Delivering better service Pushing ahead on modernisations Executing property strategy Stretching the brand Developing on-line Growing International
50 Interim Results 7 November 2006
51 Contacts Media enquiries: Marks & Spencer Corporate Press Office Clair Foster Olivia Ross Katy Pratt Clare Wilkes Vanessa Rhodes Claire Hoyle Helen Ruby Out of hours number Analyst enquiries: Amanda Mellor: Majda Rainer:
Income Statement + 3.5% + 6.7% + 7.1% EPS 187.1p 173.3p + 8.0% Ordinary interim dividend 53.0p 50.0p + 6.0% Full Price
 Income Statement m July 2015 July 2014 Total sales 1,907 1,856 Operating profit 362 339 Interest (15) (15) Profit before tax 347 324 Taxation (70) (66) Profit after tax 277 258 + 2.7% + 6.7% + 7.1% EPS
Interim Results 2008/09 26 weeks to 3 August September 2008
 Interim Results 2008/09 26 weeks to 3 August 2008 11 September 2008 Sir Ian Gibson Chairman Richard Pennycook Group Finance Director Financial summary 4 H1 m 08/09 07/08 ** Turnover 7,105 6,259 Operating
Financial & Business Highlights For the Year Ended June 30, 2017
 Financial & Business Highlights For the Year Ended June, 17 17 16 15 14 13 12 Profit and Loss Account Operating Revenue 858 590 648 415 172 174 Investment gains net 5 162 909 825 322 516 Other 262 146
Domino s Pizza UK & IRL plc. Interim Results for the 26 weeks ended 28 June 2009
 Domino s Pizza UK & IRL plc Interim Results for the 26 weeks ended 28 June 2009 m System sales momentum 210 System sales have doubled since 2005 196.4 190 170.2 170 150 130 110 97.1 114.8 142.5 +24.1%
ANNOUNCEMENT OF PRELIMINARY RESULTS
 The leading high service distributor to engineers worldwide ANNOUNCEMENT OF PRELIMINARY RESULTS YEAR ENDED 31 MARCH 2009 29 May 2009 Agenda Overview and current trading Ian Mason Financial performance
Looking to the medium term
 Looking to the medium term Issued: 4 September 2013 Legal notice This presentation has been prepared to inform investors and prospective investors in the secondary markets about the Group and does not
Spheria Australian Smaller Companies Fund
 29-Jun-18 $ 2.7686 $ 2.7603 $ 2.7520 28-Jun-18 $ 2.7764 $ 2.7681 $ 2.7598 27-Jun-18 $ 2.7804 $ 2.7721 $ 2.7638 26-Jun-18 $ 2.7857 $ 2.7774 $ 2.7690 25-Jun-18 $ 2.7931 $ 2.7848 $ 2.7764 22-Jun-18 $ 2.7771
ANALYST PRESENTATION FOR THE YEAR ENDED 31 MARCH 2012
 ANALYST PRESENTATION FOR THE YEAR ENDED 31 MARCH 2012 1 TFG ANALYST PRESENTATION MARCH 2012 AGENDA Overview of the economy and retail environment Review of the year Financial review Divisional review Financial
XML Publisher Balance Sheet Vision Operations (USA) Feb-02
 Feb-02") Page:1 Apr-01 May-01 Jun-01 Jul-01 ASSETS Current Assets Cash and Short Term Investments 15,862,304 51,998,607 9,198,226 Accounts Receivable - Net of Allowance 2,560,786
Page:1 Apr-01 May-01 Jun-01 Jul-01 ASSETS Current Assets Cash and Short Term Investments 15,862,304 51,998,607 9,198,226 Accounts Receivable - Net of Allowance 2,560,786
N BROWN GROUP PLC INTERIM RESULTS 16 OCTOBER
 N BROWN GROUP PLC INTERIM RESULTS 16 OCTOBER 2012 1 plc ALAN WHITE CHIEF EXECUTIVE 2 RESULTS SUMMARY 2012 m 2011 m % Revenue 379.3 363.7 +4.3 EBITDA 54.9 54.9 - Operating Profit 45.7 47.0-2.8 Trading Profit
The national monthly CPI (2008=100) increased from per cent in September, 2017 to per cent
 increased from per cent in September, 2017 to per cent") CONSUMER PRICE INDEX (CPI) October, 2017: PRESS RELEASE Released on Monday November 21, 2017 at 1:00 pm OCTOBER 2017 MONTHLY INFLATION RATE INCREASES SLIGHTLY The national monthly CPI (2008=100) increased
CONSUMER PRICE INDEX (CPI) October, 2017: PRESS RELEASE Released on Monday November 21, 2017 at 1:00 pm OCTOBER 2017 MONTHLY INFLATION RATE INCREASES SLIGHTLY The national monthly CPI (2008=100) increased
Consumer Price Index (Base year 2014) Consumer Price Index
 Consumer Price Index") Consumer Price Index December 2017 (Base year 2014) Consumer Price Index 1 Release Date: January 2018 Detailed by: Expenditure groups Household welfare levels Household type Regions Briefing This publication
Consumer Price Index December 2017 (Base year 2014) Consumer Price Index 1 Release Date: January 2018 Detailed by: Expenditure groups Household welfare levels Household type Regions Briefing This publication
October 3Q 2018/ 9M 2018 COMPANY AND FINANCIAL UPDATES 1
 October 2018 3Q 2018/ 9M 2018 COMPANY AND FINANCIAL UPDATES 1 TABLE OF CONTENT Indonesia Macro Overview 4 Q3 2018/ 9M 2018 Key Financial Highlights 6 Sales and DP/CV Mix 7 Same Store Sales Growth 8 Regional
Mortgage Trends Update
 Mortgage Trends Update UK Finance: Mortgage Trends Update December 218 of first-time reaches 12-year high in 218 Key data highlights: There were 37, new first-time buyer mortgages completed in 218, some
Consumer Price Index (Base year 2014) Consumer Price Index
 Consumer Price Index") Consumer Price Index December 2016 (Base year 2014) Consumer Price Index 1 Release Date: January 2017 Detailed by: Expenditure groups Household welfare levels Household type Regions Briefing This publication
Consumer Price Index December 2016 (Base year 2014) Consumer Price Index 1 Release Date: January 2017 Detailed by: Expenditure groups Household welfare levels Household type Regions Briefing This publication
Income Statement + 2.2% + 7.2% + 3.9% + 14% EPS 142.1p 118.5p + 20% Dividend per share 36.0p 31.0p + 16% Full Price
 July 2013 Income Statement m July 2013 July 2012* Revenue 1,677 1,640 Operating profit 285 266 Interest (13) (15) Profit before tax 272 251 Taxation (55) (60) Profit after tax 217 191 + 2.2% + 7.2% + 14%
[Insert Subheading] Click to edit Master text styles. Shop Direct Limited. Q1 FY18 Results. Three months ended 30 September 2017.
![[Insert Subheading] Click to edit Master text styles. Shop Direct Limited. Q1 FY18 Results. Three months ended 30 September 2017.](/thumbs/75/71763350.jpg "[Insert Subheading] Click to edit Master text styles. Shop Direct Limited. Q1 FY18 Results. Three months ended 30 September 2017.") [Insert Subheading] Click to edit Master text styles Shop Direct Limited Q1 FY18 Results Three months ended 30 September 2017 7 December 2017 1 Disclaimer This presentation (the Presentation ) has been
[Insert Subheading] Click to edit Master text styles Shop Direct Limited Q1 FY18 Results Three months ended 30 September 2017 7 December 2017 1 Disclaimer This presentation (the Presentation ) has been
QUESTION 2. QUESTION 3 Which one of the following is most indicative of a flexible short-term financial policy?
 QUESTION 1 Compute the cash cycle based on the following information: Average Collection Period = 47 Accounts Payable Period = 40 Average Age of Inventory = 55 QUESTION 2 Jan 41,700 July 39,182 Feb 18,921
Performance Report October 2018
 Structured Investments Indicative Report October 2018 This report illustrates the indicative performance of all Structured Investment Strategies from inception to 31 October 2018 Matured Investment Strategies
Consumer Price Index (Base year 2014) Consumer Price Index
 Consumer Price Index") Consumer Price Index July 207 (Base year 204) Consumer Price Index Release Date: Augest 207 Detailed by: Expenditure groups Household welfare levels Household type Regions Briefing This publication provides
Consumer Price Index July 207 (Base year 204) Consumer Price Index Release Date: Augest 207 Detailed by: Expenditure groups Household welfare levels Household type Regions Briefing This publication provides
4 December The Park Group Half Year Results & Strategy Update
 The Park Group Half Year Results & Strategy Update Introductions Ian O Doherty CEO Tim Clancy CFO Stephen Miller CIO Half Year Results & Strategy Update - context and objectives This is a changing business
FOR RELEASE: MONDAY, MARCH 21 AT 4 PM
 Interviews with 1,012 adult Americans conducted by telephone by Opinion Research Corporation on March 18-20, 2011. The margin of sampling error for results based on the total sample is plus or minus 3
Interim Results 2014
 Interim Results 2014 Ralph Findlay Chief Executive Officer Highlights 1. Good trading performance, in line with our expectations Growth in core profits in each trading segment Earnings per share up 10.8%
Availability, Reliability, Ease. 11 December 2018
 Availability, Reliability, Ease 11 December 2018 LEGAL NOTICE This presentation has been prepared to inform investors and prospective investors in the secondary markets about the Group and does not constitute
Mr Price Group Limited Interim Results September 2009
 Interim Results September 2009 Total consumer spending contracted sharply Decline in retail sales in real terms for seven consecutive months Household debt to disposable income at historically high levels
Release date: 12 July 2018
 Release date: 12 July 218 UK Finance: Mortgage Trends Update May 218 Mortgage market sees pre-summer boost as remortgaging continues strong upward trend Key data highlights: There were 32,2 new first-time
Common stock prices 1. New York Stock Exchange indexes (Dec. 31,1965=50)2. Transportation. Utility 3. Finance
2. Transportation. Utility 3. Finance") Digitized for FRASER http://fraser.stlouisfed.org/ Federal Reserve Bank of St. Louis 000 97 98 99 I90 9 9 9 9 9 9 97 98 99 970 97 97 ""..".'..'.."... 97 97 97 97 977 978 979 980 98 98 98 98 98 98 987 988
Digitized for FRASER http://fraser.stlouisfed.org/ Federal Reserve Bank of St. Louis 000 97 98 99 I90 9 9 9 9 9 9 97 98 99 970 97 97 ""..".'..'.."... 97 97 97 97 977 978 979 980 98 98 98 98 98 98 987 988
Investit Software Inc. INVESTOR PRO CANADA 20 UNIT CONDOMINIUM DEVELOPMENT EXAMPLE
 INVESTOR PRO CANADA 20 UNIT CONDOMINIUM DEVELOPMENT EXAMPLE INTRODUCTION This example uses the Development Condominium template. This practice example consists of two Sections; 1. The input information
Preliminary Results. 19 April 2011
 Preliminary Results 19 April 2011 Philip Clarke Group Chief Executive 2 3 Strong platform Business built around customers and staff High quality assets Multiple opportunities for growth 4 New management
WESTWOOD LUTHERAN CHURCH Summary Financial Statement YEAR TO DATE - February 28, Over(Under) Budget WECC Fund Actual Budget
 Budget WECC Fund Actual Budget") WESTWOOD LUTHERAN CHURCH Summary Financial Statement YEAR TO DATE - February 28, 2018 General Fund Actual A B C D E F WECC Fund Actual Revenue Revenue - Faith Giving 1 $ 213 $ 234 $ (22) - Tuition $ 226
WESTWOOD LUTHERAN CHURCH Summary Financial Statement YEAR TO DATE - February 28, 2018 General Fund Actual A B C D E F WECC Fund Actual Revenue Revenue - Faith Giving 1 $ 213 $ 234 $ (22) - Tuition $ 226
NOVEMBER 22, : MONTHLY INFLATION RATE INCREASES SIGNIFICANTLY
 CONSUMER PRICE INDEX (CPI) November, 2016: PRESS RELEASE Released on Thursday December 22, 2016 at 1:00 pm NOVEMBER 2016 MONTHLY INFLATION RATE INCREASES SIGNIFICANTLY The national monthly CPI (2008=100)
CPA Australia Plan Your Own Enterprise Competition
 Financial Plan Your financial plan should include: 1. A list of Start-Up Costs and how these will be paid for (eg from savings, bank loan or family loan) 2. A Breakeven Analysis, which includes: a list
Income Statement. -2.2% -1.2% -9.8% + 2m -9.5% -7.8% EPS (underlying) 176.9p 188.6p -6.2% Ordinary dividends per share 53.0p 53.0p.
 176.9p 188.6p -6.2% Ordinary dividends per share 53.0p 53.0p.") Income Statement m July 2017 July 2016 Total sales 1,914 1,957 Operating profit 325 360 Interest (16) (18) Profit before tax 309 342 Taxation (57) (69) Profit after tax 252 273-2.2% -1.2% -9.8% + 2m -9.5%
Income Statement m July 2017 July 2016 Total sales 1,914 1,957 Operating profit 325 360 Interest (16) (18) Profit before tax 309 342 Taxation (57) (69) Profit after tax 252 273-2.2% -1.2% -9.8% + 2m -9.5%
UK retail sales 137, ,967 26% International retail sales 214, ,954 39%
 2 3 000s Six months to 28 February 2013 Six months to 29 February 2012 Change Group revenues 1 359,731 269,926 33% Retail sales 352,263 262,921 34% UK retail sales 137,579 108,967 26% International retail
PRESS RELEASE. Securities issued by Hungarian residents and breakdown by holding sectors. January 2019
 7 March 2019 PRESS RELEASE Securities issued by Hungarian residents and breakdown by holding sectors January 2019 According to securities statistics, the amount outstanding of equity securities and debt
Institutional Presentation. March
 Institutional Presentation March 2013 Marisa at a glance Largest women fashion and lingerie retailer in Brazil 64 years of track record Focus on the middle class National footprint 2 Multiformat store
BT Group plc. Q2 2010/11 Results. 11 November 2010
 BT Group plc Q2 2010/11 Results 11 November 2010 BT Group plc Ian Livingston 2 Forward-looking statements caution Certain statements in these presentations are forward-looking and are made in reliance
Review of Registered Charites Compliance Rates with Annual Reporting Requirements 2016
 Review of Registered Charites Compliance Rates with Annual Reporting Requirements 2016 October 2017 The Charities Regulator, in accordance with the provisions of section 14 of the Charities Act 2009, carried
Q Earnings Call. 30 April 2018
 Q1 2018 Earnings Call 30 April 2018 1 Table of Content Indonesia Macro Overview 4 Q1 2018 Key Financial Highlights 6 Sales and DP/CV Mix 7 Same Store Sales Growth 8 Regional GDP, Sales and SSSG 9 Gross
Isle Of Wight half year business confidence report
 half year business confidence report half year report contents new company registrations closed companies (dissolved) net company growth uk company share director age director gender naming trends sic
Executive Summary. July 17, 2015
 Executive Summary July 17, 2015 The Revenue Estimating Conference adopted interest rates for use in the state budgeting process. The adopted interest rates take into consideration current benchmark rates
Release date: 14 August 2018
 Release date: 14 August 218 UK Finance: Mortgage Trends Update June 218 House purchase activity slows in June but remortgaging activity remains high Key data highlights: There were 34,9 new first-time
OTHER DEPOSITS FINANCIAL INSTITUTIONS DEPOSIT BARKAT SAVING ACCOUNT
 WEIGHTAGES JAN FEB MAR APR MAY JUN JUL AUG SEPT OCT NOV DEC ANNOUNCEMENT DATE 19.Dez.14 27.Jän.15 24.Feb.15 26.Mär.15 27.Apr.15 26.Mai.15 25.Jun.15 28.Jul.15 26.Aug.15 23.Sep.15 27.Okt.15 25.Nov.15 MUDARIB
PRESS RELEASE. Securities issued by Hungarian residents and breakdown by holding sectors. April 2016
 10 June 2016 PRESS RELEASE Securities issued by Hungarian residents and breakdown by holding sectors April 2016 According to securities statistics data, the amount outstanding of equity securities and
Release date: 16 May 2018
 Release date: 16 May 218 UK Finance: Mortgage Trends Update March 218 Remortgaging market softens in March after busy start to year Key data highlights: There was 51bn of new lending to first-time in the
Availability, Reliability, Ease. 11 September 2018
 Availability, Reliability, Ease 11 September 2018 LEGAL NOTICE This presentation has been prepared to inform investors and prospective investors in the secondary markets about the Group and does not constitute
Constructing a Cash Flow Forecast
 Constructing a Cash Flow Forecast Method and Worked Example A cash flow forecast shows the estimates of the timing and amounts of cash inflows and outflows over a period of time. The sections of a cash
REPUBLIC OF SOMALILAND
 REPUBLIC OF SOMALILAND Ministry of National Planning & Development Central Statistics Department OFFICIAL RELEASE Monthly Consumer Price Index October 2016 2016 Page 1 of 9 Consumer Price Index (CPI) October,
Please scroll to find the 2018 and 2019 global fund holiday calendars.
 Please scroll to find the 2018 and 2019 global fund holiday calendars. 2018 Exchange-Traded fund holiday Vanguard Ireland-domiciled ETFs Jan Feb Mar Apr May Jun 1 2 5 12 15 25 9 12 14 15 16 19 28 20 29
Review of Membership Developments
 RIPE Network Coordination Centre Review of Membership Developments 7 October 2009/ GM / Lisbon http://www.ripe.net 1 Applications development RIPE Network Coordination Centre 140 120 100 80 60 2007 2008
Consumer Price Index (Base year 2014) Consumer Price Index
 Consumer Price Index") Consumer Price Index Annual Report of 2016 (Base year 2014) Consumer Price Index 1 Release Date: March 2017 Detailed by: Expenditure groups Household welfare levels Household type Regions 1. Consumer Price
Consumer Price Index Annual Report of 2016 (Base year 2014) Consumer Price Index 1 Release Date: March 2017 Detailed by: Expenditure groups Household welfare levels Household type Regions 1. Consumer Price
Forecast Position. Detailed financial statements are included in the Appendix attached to this report. March 2018 $Ms Year to Date $Ms Full Year $Ms
 MEMO To: Board Members From: Eric Sinclair, GM Finance & Performance Date: 18 April 2018 Subject: Financial Report for February 2018 Status This report contains: For decision Update Regular report For
The national monthly CPI (2008=100) increased from per cent in November, 2017 to per cent
 increased from per cent in November, 2017 to per cent") CONSUMER PRICE INDEX (CPI) December, 2017: PRESS RELEASE Released on Monday January 17, 2017 at 1:00 pm DECEMBER 2017 MONTHLY INFLATION RATE INCREASES SIGHTLY The national monthly CPI (2008=100) increased
CONSUMER PRICE INDEX (CPI) December, 2017: PRESS RELEASE Released on Monday January 17, 2017 at 1:00 pm DECEMBER 2017 MONTHLY INFLATION RATE INCREASES SIGHTLY The national monthly CPI (2008=100) increased
PRESS RELEASE. Securities issued by Hungarian residents and breakdown by holding sectors. October 2018
 PRESS RELEASE 10 December 2018 Securities issued by Hungarian residents and breakdown by holding sectors October 2018 According to securities statistics, the amount outstanding of equity securities and
STAFF REPORT Corporate Services
 1 Corporate Services STAFF REPORT Corporate Services Title: Core Consumer Price Index Update Report Number: CORP2018-071 Author: Kim Reger & Brad Witzel Meeting Type: Finance & Strategic Planning Committee
Business & Financial Services December 2017
 Business & Financial Services December 217 Completed Procurement Transactions by Month 2 4 175 15 125 1 75 5 2 1 Business Days to Complete 25 Jan Feb Mar Apr May Jun Jul Aug Sep Oct Nov Dec 217 Procurement
Big Walnut Local School District
 Big Walnut Local School District Monthly Financial Report for the month ended September 30, 2013 Prepared By: Felicia Drummey Treasurer BIG WALNUT LOCAL SCHOOL DISTRICT SUMMARY OF YEAR TO DATE FINANCIAL
Results 2Q18. August 2, 2018
 Results August 2, 2018 Highlights Indicators Var. x 2Q17 Operating Income (R$ MM) 42.8 +92.7% Operating Margin 1.8% +0.8 p.p. Net operating revenues: R$2.4 billion (+9.0% vs. 2Q17) ASK (BN) 10.7 +2.2%
PRESS RELEASE. Securities issued by Hungarian residents and breakdown by holding sectors. October 2017
 11 December 2017 PRESS RELEASE Securities issued by Hungarian residents and breakdown by holding sectors October 2017 According to securities statistics, the amount outstanding of equity securities and
Platinum Interim Review. Johnson Matthey. 18th November abcd.
 Platinum 2003 Interim Review Johnson Matthey 18th November 2003 Platinum Demand edges up to 6.59 million oz Purchases for jewellery in China & Japan drop Diesel sales drive record autocatalyst demand Output
The Property Franchise Group. Half Year Results September 2016
 The Property Franchise Group Half Year Results September 2016 Agenda 2 Overview Ian Wilson, Chief Executive Officer Financial performance David Raggett, Chief Financial Officer Operational performance
1: Product Profitability Analysis - Exercise
 1: Product Profitability Analysis - Exercise PRODUCT TOTAL Filter Bolt Drum PRICE ( ) 12 6 15 COST ( ) 8 3 12 ANNUAL SALES ( ) 1,440k 1,800k 2,500k 5,740k AVERAGE STOCK ( ) 210k 850k 240k 1,300k 1 Typical
BEYOND THE EUPHORIA: Growing shareholder value despite challenging macros
 BEYOND THE EUPHORIA: Growing shareholder value despite challenging macros Alan Pullinger, CEO: FirstRand UBS conference, Cape Town 18 October 2018 Group strategic framework FirstRand aims to create long-term
Group gross transaction value (incl Magasin) +3.2% Like for like sales excl VAT 1.5%
 +3.2% Like for like sales excl VAT 1.5%") 1 Results Highlights Group gross transaction value (incl Magasin) +3.2% Like for like sales excl VAT 1.5% Like for like sales incl VAT Flat Group gross margin % increase Debenhams gross margin (excl Magasin)
1 Results Highlights Group gross transaction value (incl Magasin) +3.2% Like for like sales excl VAT 1.5% Like for like sales incl VAT Flat Group gross margin % increase Debenhams gross margin (excl Magasin)
TERMS OF REFERENCE FOR THE INVESTMENT COMMITTEE
 I. PURPOSE The purpose of the Investment Committee (the Committee ) is to recommend to the Board the investment policy, including the asset mix policy and the appropriate benchmark for both ICBC and any
Consumer Price Index (Base year 2014) Consumer Price Index
 Consumer Price Index") Consumer Price Index uary 2018 (Base year 2014) Consumer Price Index 1 Release Date: uary 2018 Detailed by: Expenditure groups Household welfare levels Household type Regions Briefing This publication
Consumer Price Index uary 2018 (Base year 2014) Consumer Price Index 1 Release Date: uary 2018 Detailed by: Expenditure groups Household welfare levels Household type Regions Briefing This publication
Britvic plc. Preliminary Results 2011
 Britvic plc Preliminary Results 2011 Gerald Corbett Chairman John Gibney Group Finance Director Agenda Financial performance John Gibney Britvic and the market review Paul Moody Group performance +14.6%
Analystsʼ Conference 2017
 Analystsʼ Conference 2017 Metzingen March 9, 2017 Mark Langer Ingo Wilts Bernd Hake Chief Executive Officer Chief Brand Officer Chief Sales Officer HUGO BOSS Analysts' Conference 2017 HUGO BOSS March 9,
Ashtead Group plc. Growth and diversification. Analyst and Investor meeting 21 April 2016
 Ashtead Group plc Growth and diversification Growing complexity of the business needs to be considered when looking at key metrics Factors to consider General Tool and Specialty mix Mature stores vs new
Historical Pricing PJM COMED, Around the Clock. Cal '15 Cal '16 Cal '17 Cal '18 Cal '19 Cal '20 Cal '21 Cal '22
 $50 Historical Pricing PJM COMED, Around the Clock $48 $46 $44 $42 $40 $38 $36 $34 $32 $30 $28 $26 Cal '15 Cal '16 Cal '17 Cal '18 Cal '19 Cal '20 Cal '21 Cal '22 The information presented above was gathered
For personal use only
 APPENDIX 4E Cash Converters International Limited ABN: 39 069 141 546 Financial year ended 30 June 2015 RESULTS FOR ANNOUNCEMENT TO THE MARKET 30 June 2015 30 June 2014 Revenues from operations Up 13.0%
Making it happen. 6 March 2018
 Making it happen 6 March 2018 LEGAL NOTICE This presentation has been prepared to inform investors and prospective investors in the secondary markets about the Group and does not constitute an offer of
27 July 2018 Interim Results
 27 July 2018 Interim Results for the half year ended 30 June 2018 Disclaimer This presentation may contain forward-looking statements, including forward-looking statements within the meaning of the United
Exam 1 Problem Solving Questions Review
 Exam 1 Problem Solving Questions Review SECTION 1 The following data were obtained from a recent quarterly report for Dell Computer (in millions): Net revenue $8,028 Cost of revenue $6,580 Inventories:
Cost Estimation of a Manufacturing Company
 Cost Estimation of a Manufacturing Company Name: Business: Date: Economics of One Unit: Manufacturing Company (Only complete if you are making a product, such as a bracelet or beauty product) Economics
Quarterly results and strategy review October 22, 2005
 Quarterly results and strategy review October 22, 25 Presentation structure Review of un-audited results for SQ 25 Review of core businesses Review of business strategy Results Q2, 25 2 Review of un-audited
Consumer Price Index (Base year 2014) Consumer Price Index
 Consumer Price Index") Consumer Price Index ruary 2018 (Base year 2014) Consumer Price Index 1 Release Date: March 2018 Detailed by: Expenditure groups Household welfare levels Household type Regions Briefing This publication
Consumer Price Index ruary 2018 (Base year 2014) Consumer Price Index 1 Release Date: March 2018 Detailed by: Expenditure groups Household welfare levels Household type Regions Briefing This publication
CONSUMER PRICE INDEX JULY 2018 PRESS RELEASE
 CONSUMER PRICE INDEX JULY 2018 PRESS RELEASE Released: 21 st August, 2018 @ 12: 00 noon Contact Persons: Abu Bakarr Turay Director, Economic Statistics Division Statistics Sierra Leone Mobile: +23276690948
Domino s Pizza UK & IRL plc Interim Results for the 26 weeks ended 2 July _interim_results
 Interim Results for the 26 weeks ended 2 July 2006 The Team Stephen Hemsley, Chief Executive Chris Moore, Chief Operating Officer Lee Ginsberg, Finance Director 2 Financial Highlights System sales up 18.3%
Fourth Quarter 2016 Performance Summary
 Fourth Quarter 2016 Performance Summary Operational and Financial Highlights - 2016 Net profit rises by +2.5% to Euros 545.5 million Recurring sales (excluding Raw Materials and Others) rise by +4.5% (+4.6%
A mixed performance during the quarter
 A mixed performance during the quarter For the second quarter 20/2016, RNB reported operating income of SEK 1 M, compared to SEK 17 M in the year-earlier period. The change in sales during the quarter
Earnings Results. Second Quarter 2015
 Earnings Results Second Quarter 2015 Forward Looking Statements This presentation contains, or may be deemed to contain, forward-looking statements. By their nature, forward-looking statements involve
Continued sales growth
 Continued sales growth Interim report for 1 January 30 June 2015 Second quarter Net sales increased by 8% to SEK 1,175.4 (1,091.0) million Including divested operations, net sales increased by 6% Operating
2015 INTERIM RESULTS
 2015 INTERIM RESULTS Welcome Robert Noel Chief Executive 2 London development improving portfolio and income quality 3 Retail transformation under themes of dominance, experience and convenience Trinity
Analyst Presentation. Annual Report 2014
 Analyst Presentation 1 1 2 Highlights Financials 2014 3 Outlook 2015 ADLER 2 Cornerstones and Highlights 2014 Cornerstones 2014 New Image Campaign Area-wide launch of RFID technology Store refurbishments
Historical Pricing PJM PSEG, Around the Clock. Cal '15 Cal '16 Cal '17 Cal '18 Cal '19 Cal '20 Cal '21 Cal '22
 $70 Historical Pricing PJM PSEG, Around the Clock $65 $60 $55 $50 $45 $40 $35 $30 $25 Cal '15 Cal '16 Cal '17 Cal '18 Cal '19 Cal '20 Cal '21 Cal '22 The information presented above was gathered and compiled
Date: 25 th Feb Securities Segment Note on Methodology for Imposition of Volatility Margin
 Date: 25 th Feb. 2006 Securities Segment Note on Methodology for Imposition of Volatility Margin 1. Background 1.1 CCIL settles trades in the Securities Settlement Segment for its members. Margins are
On-premise establishments: how the economic backdrop and new economic policies are affecting the trade of local premises.
 On-premise establishments: how the economic backdrop and new economic policies are affecting the trade of local premises. The UK pub sector: Survival of the Fittest David Thompson Chairman Marston s PLC
PHOENIX ENERGY MARKETING CONSULTANTS INC. HISTORICAL NATURAL GAS & CRUDE OIL PRICES UPDATED TO July, 2018
 Jan-01 $12.9112 $10.4754 $9.7870 $1.5032 $29.2595 $275.39 $43.78 $159.32 $25.33 Feb-01 $10.4670 $7.8378 $6.9397 $1.5218 $29.6447 $279.78 $44.48 $165.68 $26.34 Mar-01 $7.6303 $7.3271 $5.0903 $1.5585 $27.2714
Preliminary Results 2012/13
 Preliminary Results 2012/13 David Tyler Chairman John Rogers Chief Financial Officer Group performance Highlights Underlying results 2012/13 m 2011/12 m Change % Sales (inc VAT) 25,632 24,511 4.6 Sales
Friday 23 May 2014 Afternoon
 Friday 23 May 2014 Afternoon GCSE ECONOMICS A592/01 How the Economy Works *1095673855* Candidates answer on the Question Paper. OCR supplied materials: None Other materials required: Calculators may be
CONTENTS COMMENTARY CHARTS TABLES GLOSSARY. Section 1: Headline Inflation Section 2: Core Inflation
 COMMENTARY CONTENTS Section 1: Headline Inflation Section 2: Core Inflation CHARTS 1. National Rates of Inflation, January 2010 April 2013 2. Monthly Changes in the Cost-of-Living Index, January 2010 April
Electrocomponents 2017 half-year financial results. 18 November 2016
 Electrocomponents 2017 half-year financial results 18 November 2016 Agenda Overview of results Lindsley Ruth Financial results and performance update David Egan Performance Improvement Plan Lindsley Ruth
Forecast Position. Detailed financial statements are included in the Appendix attached to this report.
 MEMO To: Board Members From: Eric Sinclair, GM Finance & Performance Date: 17 January 2018 Subject: Financial Report for December 2017 Status This report contains: For decision Update Regular report For
Responsible investment in growth
 Responsible investment in growth Issued: 17 June 2014 Legal notice This presentation has been prepared to inform investors and prospective investors in the secondary markets about the Group and does not
ITV plc Final Results th March 2009
 ITV plc Final Results 2008 4th March 2009 1 Introduction Michael Grade Executive Chairman 2 Agenda Introduction and overview Financial review Current trading and strategic update Michael Grade Ian Griffiths
Preliminary Results. 22nd February 2018
 Preliminary Results 22nd February 2018 Mark Lewis Chief Executive Officer Matthew Price Chief Financial Officer Full year themes Diversified business delivering stable returns Doing a great job for our
Factor Leave Accruals. Accruing Vacation and Sick Leave
 Factor Leave Accruals Accruing Vacation and Sick Leave Factor Leave Accruals As part of the transition of non-exempt employees to biweekly pay, the UC Office of the President also requires standardization
FINAL RESULTS FOR THE YEAR ENDED 29 FEBRUARY April 2016
 FINAL RESULTS FOR THE YEAR ENDED 29 FEBRUARY 2016 26 April 2016 FY16 HIGHLIGHTS Sales up 40% year on year (42% CER) UK up 38%, rest of Europe 25% (35% CER), rest of world up 56% (63% CER) Adjusted EBITDA
Employment Data (establishment)
") Table 1: Major Indicators of Labor Market Activity for New Jersey Seasonally Adjusted (thousands) Benchmark Labor Force Data (resident) Current Month Previous Month One Year Ago Net Change Net Change May
Table 1: Major Indicators of Labor Market Activity for New Jersey Seasonally Adjusted (thousands) Benchmark Labor Force Data (resident) Current Month Previous Month One Year Ago Net Change Net Change May